Article

Evaluating the Species-Specific Cooling Potential of Urban Trees to Mitigate the Urban Heat Island Effect

1
Elazığ Directorate of Provincial Agriculture and Forestry, Ministry of Agriculture and Forestry, 23100 Elazığ, Türkiye
2
Faculty of Architecture and Design, Department of Landscape Architecture, Atatürk University, 25240 Erzurum, Türkiye
3
Department of Architectural Engineering, Kingdom University, Al-Riffa 31982, Bahrain
*
Authors to whom correspondence should be addressed.
Forests 2026, 17(5), 533; https://doi.org/10.3390/f17050533
Submission received: 18 March 2026 / Revised: 9 April 2026 / Accepted: 22 April 2026 / Published: 28 April 2026

Abstract

It is commonly accepted that vegetation plays an important role in climatic studies conducted at local, national, and international scales. The aim of this study is to examine the cooling effects of tree species in the cities and to reveal how they affect the microclimate in İzzetpaşa Neighborhood of Elazığ province of Turkiye. This study, which was conducted by purchasing ENVI-met 5.6.1 microclimate software, aimed to create the most appropriate microclimate scenarios in order to mitigate the urban heat island (UHI). Among the nine scenarios in which different tree species were used; the greatest cooling effect was obtained from the scenario where Acer platanoides L. was used. It was determined that the air temperature dropped by 0.8 °C compared to the base scenario and by 3.0 °C compared to the scenario in which a tree cover was not used. The lowest cooling effect was detected in the scenarios where Pinus sylvestris L. and Abies cilicica Carr. were used. In general, it was observed that there was no significant temperature decrease in the scenarios where coniferous trees were used. In scenarios where deciduous trees were used, more temperature decreases were detected compared to the coniferous trees. According to the winter simulation results of these scenarios, the daily average air temperature values vary between −0.6 and +0.1 °C compared to the base scenario. In the scenario where Acer platanoides L. was used, where the highest cooling effect was observed, the highest relative humidity rate and the lowest Tmrt value were determined. Evaluating the cooling effect of high vegetation on a species basis in reducing the UHI effect as a basis for planning in urban areas will constitute a key strategy in improving the UHI effect. It is envisaged that this study may provide a solution to help reduce the UHI in studies to be carried out in urban areas.

1. Introduction

It is well known that as cities grow in size, local climates change. As urban populations continue to grow, the challenges of living in densely populated cities also increase [1]. According to a United Nations (UN) report, two out of every three people are expected to live in city centers by 2050. The Department of Economic and Social Affairs (DESA) estimates that approximately 2.5 billion people could be settled in urban centers by the middle of this century due to both demographic changes and overall population growth [2].
One of the most distinctive environmental characteristics of urban centers is the urban heat island (UHI) [3]. UHI is a climate phenomenon defined by a higher occurrence of extreme temperatures in urban areas than in rural areas. Factors affecting UHI include a lack of greenery, the characteristics of urban materials, the geometry of the cities and anthropogenic heat in urban areas [4,5,6]. Construction in the cities continues to expand outwards with the continuous growth of urbanization, which causes the green areas to decrease and the impervious areas to increase [7,8]. Luke Howard, the first climatologist to assume that the climate of cities is determined by their interaction with their surroundings and changes in surface energy [9], noted in 1833 that urban areas are hotter in the summer, attributing this to the greater absorption of solar radiation by a city’s “confluence of vertical surfaces” and the lack of moisture available for evaporation [10].
Making cities more resilient in form and function and ensuring more efficient use of local resources is one of the most difficult missions of this century [11]. Measures taken against the heat island effect are generally aimed at changing the heat balance to mitigate the temperature in the urban area. In order to benefit fully from these measures, the selection of precautions should be made in accordance with the characteristics of the heat balance in the cities. To make appropriate mitigation choices, it is necessary to evaluate the regional features such as the utilization of land, geographical features, urban scale, etc., that affect the climate of that area [12,13,14,15]. High vegetation plays an important role in determining thermal comfort. Heat flows in urban landscapes vary over time and seasons [16,17,18].
The dual trend of global warming and the UHI effect has led to an increased focus on greening strategies to mitigate urban heat. In this context, green infrastructure refers to a broad network of natural and semi-natural systems, including parks, green roofs, and urban vegetation, that provide ecosystem services. Among these factors, vegetation—such as trees, shrubs, and grass surfaces—play a fundamental role in reducing urban temperatures and improving human thermal comfort [1,19,20,21]. While the overall extent and coverage of urban green spaces are vital for macro-scale temperature mitigation, microclimatic benefits depend heavily on the specific characteristics of individual vegetation. Interspecific differences, including morphological traits, canopy architecture, leaf area index, and foliage type (e.g., deciduous versus coniferous) dictate a tree’s capacity for shading and transpiration, ultimately determining the extent of temperature reduction. In recent years, significant studies have been conducted to examine how they can reduce the impact of UHI in urban areas. Ali-Toudert and Mayer (2007) examined the relationship between street design and thermal comfort [22] using high-resolution simulations and physiologically equivalent temperature (PET) during daytime conditions [23]. Their findings indicated that while design parameters had a limited effect on air temperature, they significantly influenced thermal sensation through human energy balance. Similarly, field measurements in Lisbon demonstrated that green areas are cooler than their surroundings, with more pronounced differences on hot days [24]. In addition, simulations conducted with ENVI-met in Phoenix revealed that shade-providing trees have a strong potential to mitigate the UHI effect by enhancing cooling [25]. A study was conducted on the use of high vegetation to reduce surface and air temperatures on the Greek island of Crete. In this research, the base scenario of no tree cover in urban gardens and two different scenarios with different tree covers were examined. The first scenario involves horticultural species, while the second scenario includes aromatic and medicinal species. The urban garden scenarios reduced surface temperature by 10.0 °C compared to the scenario without high vegetation. On high-temperature days, temperatures decreased by 5.0 °C compared to the current situation [26]. A study conducted in Mexico City, Mexico, found that while sixty-three adult trees (Eucalyptus camaldulensis) per hectare were required to mitigate air temperature by 1.0 °C, only twenty-four adult trees (Liquidambar styraciflua) were required to reduce air temperature by 2.0 °C [27]. Xiao et al. (2018) conducted a study to determine how high vegetation affects urban surface and air temperature in Suzhou city, Shanghai [28]. Three representative parks were chosen to examine the daily change in air temperature. It has been found that large green areas have a constant cooling and moisturizing effect during the summer months. The cooling effect of each green area is positively correlated with the canopy density and green area leaf area index (LAI). A study was conducted to determine the thermal effects of a total of fifteen tree species, including eleven deciduous and four coniferous species in the Erzurum province of Turkiye. The results showed that different tree species significantly changed the surface temperatures. However, it was found that leaf types did not have a significant effect on the surface temperature [29]. Despite these findings, a conceptual ambiguity remains in many urban microclimate studies, which often conflate the general cooling effects of green infrastructure with the specific, trait-driven mechanisms of distinct tree species. Understanding how specific canopy structures and foliage types influence shading and evapotranspiration is essential for optimizing urban street design.
A study conducted in Erzurum evaluated the effects of different landscape models on air pollution and thermal comfort. Tree-covered areas have been shown to be beneficial in reducing air pollution and increasing thermal comfort [7,30]. A study was conducted to determine the cooling effect of green spaces in Qingdao, East China. To study the cooling effect, six scenarios were created using different grasses and trees in two different areas through the ENVI-met program. Thermal comfort increased even more in areas close to the sea [31]. Ramdiana and Yola (2023) investigated the effects of green infrastructure and water bodies on microclimate and thermal comfort in a study conducted in Banteng City Park, Jakarta [32]. In this study using ENVI-Met software, they revealed that green infrastructure reduces air temperature and prevents concrete pavements from being exposed to solar radiation, while water bodies function for cooling purposes by increasing the relative humidity. Lai et al. (2023) conducted seventeen different scenarios with the Envi-Met model to determine the cooling effect of a green area on microclimate and thermal comfort on a typical summer day in Shanghai, China [33]. The shade provided by trees reduced the mean radiant temperature (Tmrt) and physiological equivalent temperature (PET) by 20.0 °C and 11.0 °C, respectively. The trees provided a significant reduction in short-wave solar radiation. The even distribution of trees on the field increased the shaded area ratio from 11% to 14.7%. Asmadi et al., (2024) used ENVI-met software to compare temperature differences in Pudu and Wangsa Maju districts of Kuala Lumpur [34]. Based on the premise that tree morphology dictates microclimatic regulation, this study hypothesizes that distinct species—specifically deciduous versus coniferous types—will exhibit markedly different capacities for mitigating the UHI effect. These differences in thermal comfort are expected to arise from their unique canopy architectures and shading profiles.
The aim of this study is to investigate the effect of different tree species in reducing the UHI impact and to see how they affect the microclimate in İzzetpaşa Neighborhood of Elazığ province of Turkiye. The study area was selected due to its status as a newly developing and urbanizing site. This area has the potential for the implementation of tree species that are suitable for local conditions. In this study, where ENVI-met microclimate software was used, the aim was to create the most suitable green infrastructure cover to reduce the UHI effect. Analyses were conducted in this densely inhabited residential area, which is frequently used by the local community, to determine the most suitable street design for thermal comfort in both summer and winter. In this study, different tree species were considered, with particular attention given to assessing the impact of deciduous and coniferous trees on thermal comfort parameters when planted along a street oriented parallel to the prevailing wind direction.

2. Materials and Methods

2.1. Location of the Case Study

Elazığ province is located between 38°30′ and 40°0′21″ E longitudes and 38°0′17″ and 39°0′11″ N latitudes. Elazığ has an average altitude of 1078 m above sea level. The slope of the research area increased towards the north and south and decreased towards the center. There is not much slope in the east–west direction. In the Köppen climate classification, Elazığ is in the “BSk” semi-arid steppe climate (cold) and “Csa” mild winter, very hot and dry summer climate (Mediterranean climate) categories [35]. A Continental climate is observed in Elazığ province. Due to the Keban Dam being built in 1974 and that the Karakaya Dam opened for operation in 1987, a transition from a continental climate to a Mediterranean climate was observed. There is a warm and temperate climate in the city center.
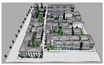
This research was carried out in the İzzetpaşa Neighborhood of Elazığ Province (Figure 1). This area, which covers a part of İzzetpaşa Neighborhood is located in the city center and has a size of 5.70 hectares. Of the designated analysis area, 59.6% consists of residential areas, 21.1% of impervious surfaces, 14.9% of green spaces, and 4.4% of open/vacant land. According to data from the official meteorological station, the prevailing wind direction in the city is north–south. The main purpose here is to determine the most suitable tree species that increase thermal comfort on the street used by people. For this reason, İzzetpaşa Neighborhood, located in the city center was selected as the research area due to the presence of a street aligned with the dominant wind direction. In addition, the dense residential fabric and the presence of active urban functions in the city center lead to higher levels of human use in this area. Within the neighborhood, a north–south oriented street suitable for tree planting was taken as the basis for the analysis. This street, which is also the widest in the neighborhood has an approximate width of 10 m. The east–west oriented streets, on the other hand are very narrow and therefore not suitable for the use of large trees. For this reason, ornamental Malus domestica Borkh. and Juglans regia L. shrubs with smaller crown diameters were preferred in the scenarios for these narrow streets.
The İzzetpaşa Neighborhood area is 5.70 hectares in size, consists of 59.6% residential areas, 21.1% impervious areas, 14.9% green areas, and 4.4% open areas (Table 1). A large part of the study area (80.7%) consists of residential areas and impervious areas. Pavements and asphalt roads are one of the main factors in the increase in urban heat islands [5,23]. The densely populated İzzetpaşa Neighborhood is characterized by insufficient green space. There are trees on the roadsides that do not provide sufficient shade.
The study consists of six stages. These are data collection, field measurements, preparation of landscape scenarios, microclimate simulations, accuracy analysis, and evaluation stages.

2.2. Field Measurements and Data Collection

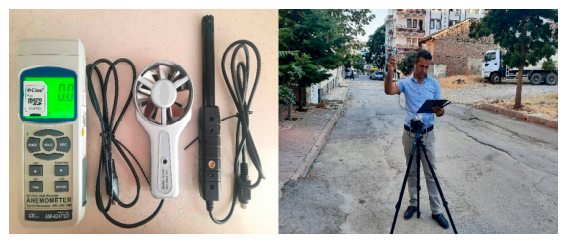
In the study area, on-site measurements were directly recorded by the researcher and subsequently used in the analyses. The instruments were installed in the field in a manner that did not pose any safety risks. A Lutron AM-4247SD weather station (Lutron Electronic Enterprise Co., Ltd., Taipei City, Taiwan) was used for measurements and data recording. This device is technically capable of long-term data logging, and the data were recorded at hourly intervals. Measurements were conducted on 10 August 2023 (summer period), when the temperatures were high, and on 6 January 2024 (winter period), when weather conditions were cold. Although longer-term hourly data were collected in the field, only a 24 h subset of this data was used in the analysis. In these measurements, five parameters used in the simulation software were recorded: air temperature, relative humidity, mean radiant temperature (Tmrt), physiologically equivalent temperature (PET), and wind speed (Figure 2).

2.3. Preparation of Landscape Scenarios

Simulations were conducted for summer and winter periods using ENVI-met 5.6.1 (One Click LCA, Germany) following the established measurement and modeling procedures described above. Plant species used in the scenarios were selected from those commonly employed in urban environments and well adapted to local conditions. In this context, the widely referenced work Flora of Turkey and the Aegean Islands, Vols. I–IX by Peter Hadland Davis was consulted, as it is extensively used in academic studies (Table 2).
Proper planning of landscape design in an area can be a good measure to control outdoor microclimate and increase thermal comfort [36]. Improper planting design and spacing may modify microclimatic parameters, especially temperature and wind dynamics, thereby influencing outdoor thermal comfort [37]. The first scenario (A) is designed to reveal the current structure of the study area. The second scenario (B) is of the study area without a tree cover. It was carried out to determine the benefit of existing vegetation in reducing urban temperature.
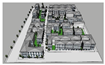
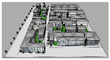
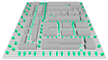
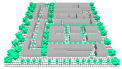
Since the east–west streets in the study area were narrow, Malus domestica Borkh. and Juglans regia L. with small crown structures were used in 7 scenarios (scenario C, D, E, F, G, H, I) implemented in these streets. The cooling effects on adjacent building blocks in greened urban areas may vary depending on the prevailing wind direction [38]. Since the north–south oriented streets are wide and the dominant wind direction is south–north, trees with different heights, widths, and crown structures that will affect the cooling level of the study area were used in these streets. For north–south streets, Pinus sylvestris L. was used in the third scenario (C), Abies cilicica Carr. in the fourth scenario (D), Catalpa bignonioides Walt. in the fifth scenario (E), Quercus infectoria G. Olivier in the sixth scenario (F), Betula pendula Roth in the seventh scenario (G), Acer platanoides L. in the eighth scenario (H), and Tilia tomentosa Moench in the ninth scenario (I) (Table 2). Due to the limited area and the lack of free space between the streets, a scenario for the use of grass areas could not be realized.
The trees used in the scenarios prepared in the study area were obtained from the Envi-met library. The characteristics of these trees are illustrated in Table 3.

2.4. Microclimate Simulations

ENVI_met 5.6.1 was used to perform microclimate simulations. The computational modules of the models cover a variety of scientific disciplines, from fluid dynamics to plant physiology [39]. Furthermore, 60 m × 60 m × 30 m modeling was used with spatial microclimate parameters (Table 4).

2.5. Accuracy Analysis

The validation of ENVI-met model results is vital to ensure reliable simulation outputs [5,40]. Verification of whether the data measured in an area and the data obtained as a result of the simulation are consistent with each other is provided by this method. Three statistical parameters were determined to affect the accuracy of the model.
R 2 = 1 i = 1 n ( X o b s , i X m o d e l , i ) 2 i = 1 n ( X o b s , i X o b s ) 2
R M S E = i = 1 n ( X o b s , i X m o d e l , i ) 2 n
M A E = i = 1 n | X o b s , i X m o d e l , i | n
Xobs = Measured value
Xmodel = Simulated value
n = Number of data analyzed values

2.6. Validation of Reliability of ENVI-Met Model

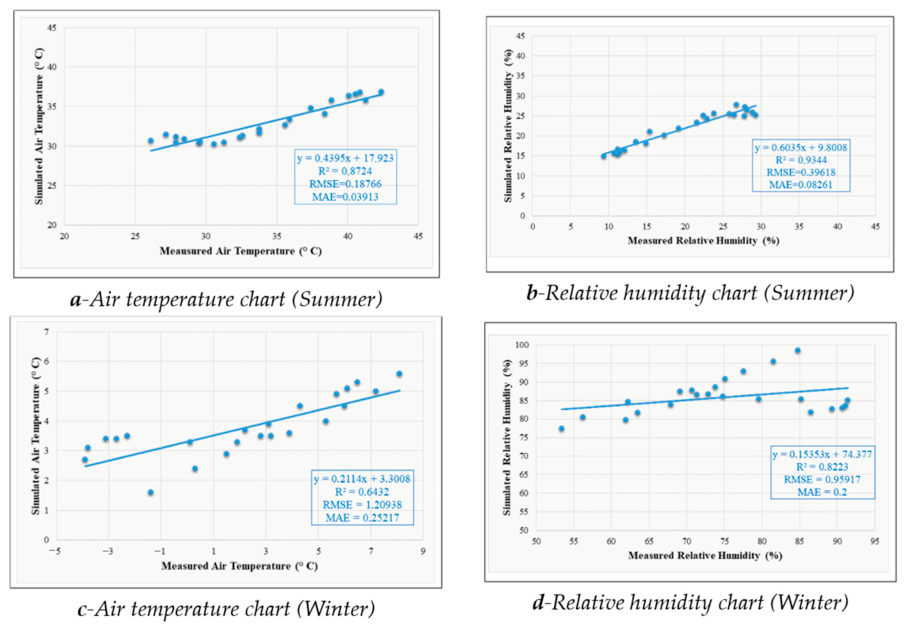
To verify the performance of the simulation, hourly measured and simulated relative humidity and air temperature data in the study area were compared, and the reliability of the model was tested (Figure 3). Correlation Coefficient (R2), Root Mean Squared Error (RMSE) and Mean Absolute Error (MAE) parameters were used to determine the accuracy of the model. Air temperature and relative humidity are important factors used to verify the performance of the model.
The R2 values in the study area vary between 0.6432 and 0.9344. The results show a strong correlation between the measured and simulated values. The RMSE values in the study area vary between 0.18766 and 1.20938. These values are within the acceptable range. The MAE values vary between 0.03913 and 0.25217 in the study area (Table 5). These obtained values are within the acceptable range. The results confirm that the ENVI-met is reliable and can be used to test the thermal environment.

3. Results and Discussion

3.1. Micro-Climate Data Measured for the Summer-Winter

The highest air temperature is 42.4 °C, the lowest air temperature is 26.1 °C, and the daily mean air temperature is 33.9 °C according to the measurement results taken during the summer period on 10 August 2023. The difference between the maximum and minimum temperatures is 15.2 °C. The highest daily relative humidity is 29.3%, the lowest relative humidity is 9.4%, and the mean relative humidity is 20.1%. Wind speed increases to 2.0 m/s during the day. The mean wind speed is 0.9 m/s.
The maximum air temperature is 8.1 ° C, the minimum air temperature is −3.9 ° C, and the daily mean air temperature is 2.0 ° C according to the measurement results made in the winter period on 6 January 2024. The difference between the maximum and minimum temperatures is 12.0 ° C. The maximum daily relative humidity is 91.4%, the minimum relative humidity is 53.4%, and the mean relative humidity is 75.7%. Wind speed increases to 1.3 m/s during the day. The mean wind speed is 1.0 m/s (Table 6).

3.2. ENVI-Met Analyzes of Prepared Landscape Design Scenarios for Summer and Winter

The 24 h climate data obtained using the measuring device was analyzed in the ENVI-met software. The current situation of these areas was revealed with simulations made in the summer and winter periods. According to the simulation results, the highest mean air temperature in the summer period was measured as 36.9 °C at 13:00 h, and the minimum temperature was measured as 30.3 °C at 23:00 h. The highest mean relative humidity was measured as 27.8% at 09:00 h, and the minimum relative humidity was measured as 14.9% at 16:00 h.
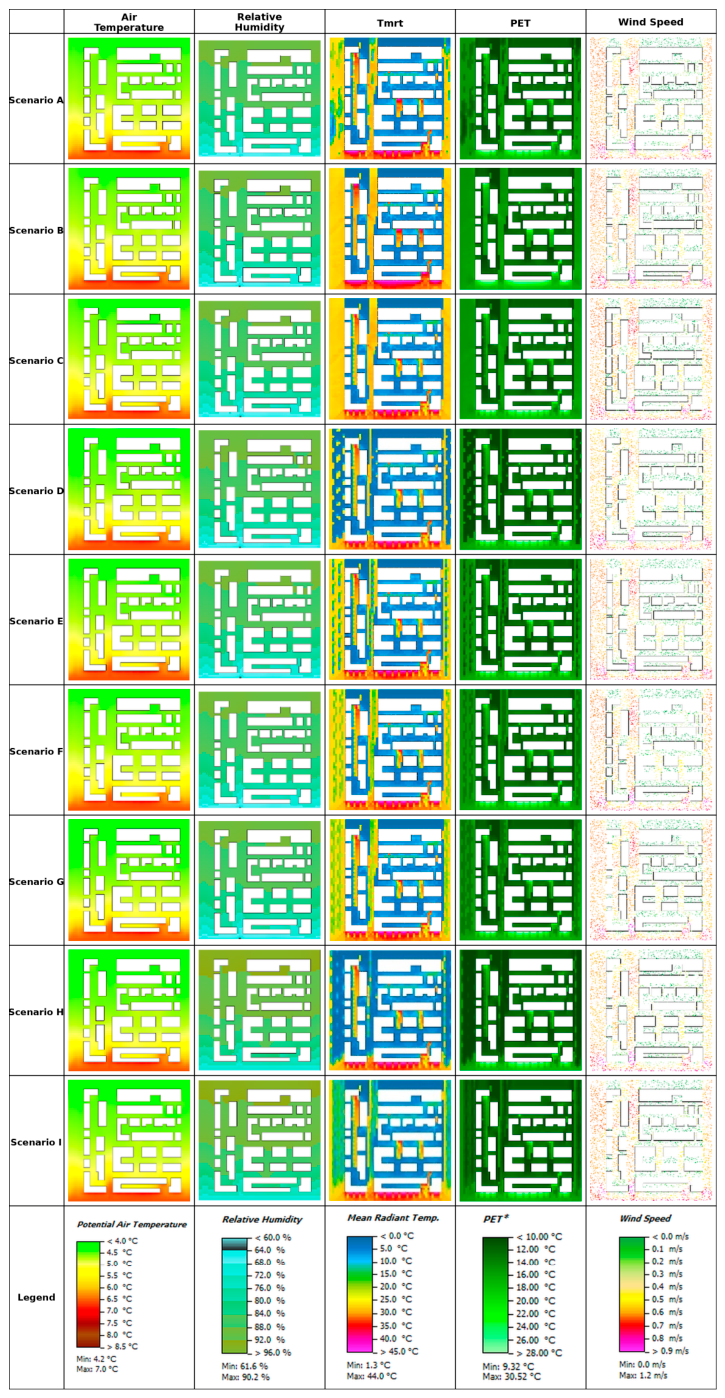
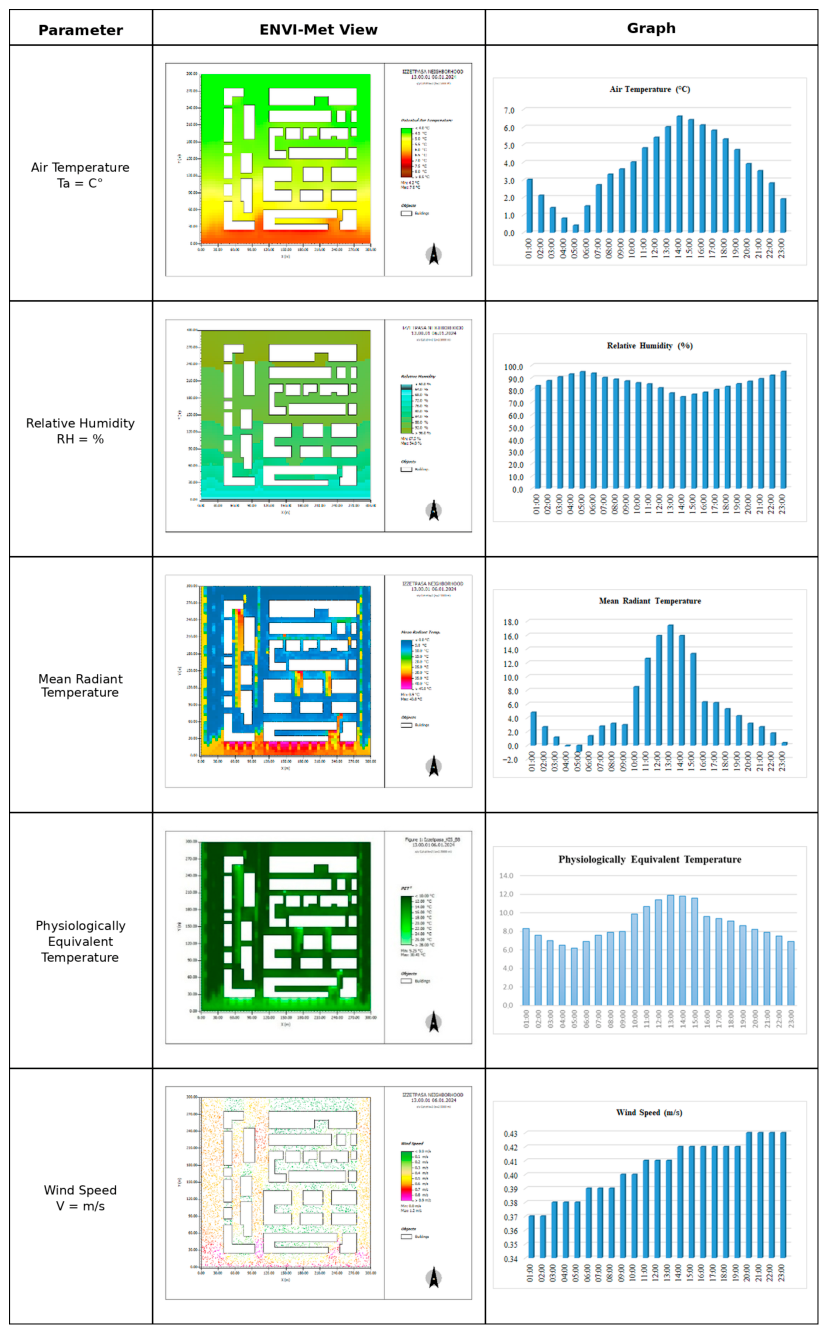
According to the simulation results, the mean highest air temperature in the winter period was measured as 5.6 °C at 14:00 h, and the lowest temperature was measured as 1.6 °C at 23:00 h. The average highest relative humidity was measured as 98.5% at 23:00 h, and the minimum relative humidity was measured as 77.5% at 14:00 h (Table 7). During the summer (Figure 4) and winter (Figure 5) periods simulation data results of the base structure of the study area are shown in Table 7.
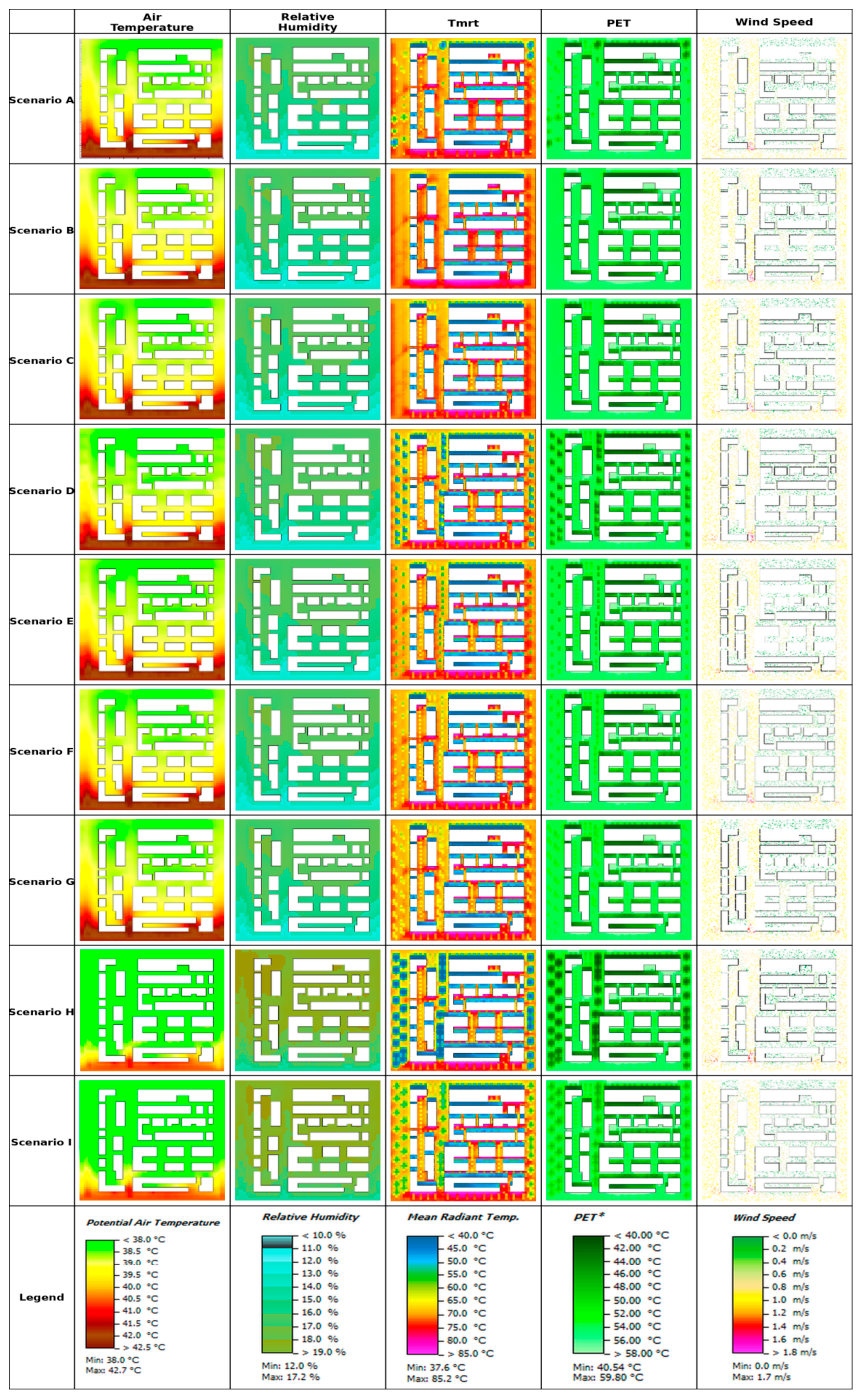
Nine scenarios prepared within the scope of the study were simulated in summer and winter periods. Eighteen simulations were made. The study area examined over five parameters: air temperature, relative humidity, average radiant temperature, PET, and wind speed according to the simulation results obtained (Figure 4 and Figure 5).
Green areas are one of the factors that improve outdoor microclimate characteristics in city centers [40,41,42]. Widespread adoption of reduction strategies could contribute to reducing urban warming in city centers, making the UHI effect projected to increase temperatures up to 5 °C more manageable for some cities [43].
A large part of the study area (80.7%) consists of residential and impervious areas. The İzzetpaşa Neighborhood has a dense population. It is characterized by insufficient green space. There are trees on the roadsides that do not provide sufficient shade. It is the most recommended strategy to reduce the UHI effect [44].
The amount of green space in the İzzetpaşa Neighborhood is limited. Therefore, it is critically important to maximize the cooling effect of the green area. One of the factors that alleviate urban thermal environmental problems is high vegetation. The cooling capacity of high vegetation in urban areas is one of the effective measures to reduce the UHI [45]. In areas where the urban open space is limited, appropriate tree characteristics should be selected to maximize the cooling effect of trees.

3.2.1. Air Temperature

Since the highest temperature during the day was measured at 13:00 h, images of the simulation results for this time have been added (Figure 5).
According to the simulation results obtained from the basic scenario (scenario A) showing the current situation of the study area, the mean daily air temperature in the summer period is 32.9 °C. According to scenario B showing the situation of the study area without tree cover, the mean daily air temperature in the summer period is 35.1 °C. The current tree cover has a cooling effect of 2.2 °C (Table 8). Meta-analyses show that urban green spaces can lower temperatures by up to 5 °C [6,46].
During the summer period, air temperature increased in scenarios C, D, F and G. In the third scenario where Pinus sylvestris L. species were used, air temperature increase of 0.8 °C was detected, in scenario D where Abies cilicica Carr. was used, air temperature increase of 0.9 °C, in scenario F where Quercus infectoria G. Olivier was used, an average air temperature increase of 0.4 °C, and in scenario G where Betula pendula Roth species were used, an average air temperature increase of 0.2 °C was detected. The cooling effect of the existing vegetation in the study area is greater than in these scenarios (Table 8).
In scenarios E, H and I, a decrease in air temperatures was observed. In scenario E, where Catalpa bignonioides Walt. was used, a decrease of 0.2 °C was detected compared to the base scenario, in scenario H, where Acer platanoides L. was used, a decrease of 0.8 °C was detected, and in scenario I, where Tilia tomentosa Moench was used, a decrease of 0.6 °C was detected (Table 8). The largest cooling effect among the nine scenarios was obtained from scenario H, where Acer platanoides L. was used. A significant temperature decreases of 0.8 °C occurred compared to the baseline scenario and 3.0 °C compared to the no-tree cover scenario. High vegetation plays an important role in reducing heat and temperatures during daylight hours [47]. The cooling effects of trees are much more pronounced than those of grass because trees provide more shade, which effectively reduces the heat radiating from them [48]. During the summer period, the 3.0 °C reduction in air temperature was found to occur in Acer platanoides L. a deciduous species characterized by a high shading capacity. Similarly, previous research based on leaf area index (LAI) analysis has identified Field Maple as one of the most effective deciduous tree species for cooling the ambient environment during summer. Instead of the evergreen trees along the street, a broad-leaved, deciduous plane tree species was selected to reduce temperatures, and it was recommended to plant them alternately with Acer campestre L. [49]. Previous studies on tree species have indicated that, during the summer period, plane trees and other species with similar leaf characteristics contribute significantly to improving thermal comfort. Accordingly, species with comparable morphological and shading properties have been recommended for urban environments [49,50].
According to the simulation results obtained from the basic scenario (scenario A) showing the current situation of the study area, the daily mean air temperature in the winter period is 3.8 °C. The daily mean air temperature is 3.9 °C in scenario B, 3.5 °C in scenario C, 3.2 °C in scenario D, and 3.8 °C in the E, F, G and H scenarios in the winter period. When the simulation results of these scenarios are examined, the daily average air temperature values in the winter period have changed between −0.6 and + 0.1 °C compared to the base scenario (Table 8). For the winter period, the lowest temperature values were observed in scenarios C and D, where coniferous species were used, with temperature reductions of 0.4–0.7 °C, respectively. This can be attributed to the characteristics of coniferous vegetation, which tends to restrict wind movement, maintain higher humidity levels, and allow limited solar radiation penetration during winter. These factors have been identified in previous studies as key contributors to localized cooling effects [51]. There were no significant temperature changes during the winter period. The lowest temperature was 3.2 °C in scenario D where Abies cilicica Carr. was used.

3.2.2. Relative Humidity

Relative humidity is the ratio of the actual water vapor content of air to the water vapor content of saturated air at the same temperature. It is usually expressed as a percentage [52]. According to the simulation results obtained from the base scenario (scenario A) showing the current situation of the study area, the average daily relative humidity value in the summer period is 21.8%. According to scenario B, showing the situation of the study area without tree cover, the average daily relative humidity value in the summer period is 19.1%. In the C-I scenarios, the average daily relative humidity value is 19.4%, 20.2%, 22.3%, 20.6%, 21.1%, 23.2% and 22.7%, respectively (Table 8).
The tree cover of an area has a significant effect on relative humidity [48]. The highest relative humidity rate (23.2%) was detected in scenario H, where the highest cooling effect was observed.
According to the winter period simulation results, the daily average relative humidity value obtained from the base scenario (scenario A) showing the current situation of the study area is 85.9%. According to scenario B showing the situation of the study area without tree cover, the daily average relative humidity value is 86.2%. In the C-I scenarios, the daily average relative humidity value is 86.3%, 86.5%, 85.4%, 85.3%, 85.5%, 85.9% and 85.6%, respectively (Table 8). It was determined that, during the summer period, scenarios involving deciduous vegetation exhibited higher relative humidity values, with an approximate difference of 4.5%. In contrast, during the winter period, scenarios with coniferous vegetation showed relatively higher humidity levels, with an approximate difference of 0.5%. In other words, while environments dominated by deciduous species tend to have higher relative humidity in summer, environments with coniferous species exhibit comparatively higher humidity levels in winter. Indeed, a study conducted in the Los Angeles metropolitan area reported that total tree transpiration in urban forests varies significantly among species due to differences in their morphological characteristics. Consistent with these findings, the present study indicates that transpiration-driven humidity effects are more pronounced in areas dominated by deciduous species during summer, whereas in winter, higher humidity levels are observed in areas with coniferous species [53].

3.2.3. Mean Radiant Temperature

The mean radiant temperature (Tmrt) that describes the interaction of shortwave and longwave radiation fluxes between a human body and the surrounding environment [54,55]. Tmrt is a parameter affected by the albedo of surfaces and shading by buildings and trees [56]. According to the simulation results obtained from the base scenario (Scenario A) showing the current situation of the study area, the daily average Tmrt in the summer period is 30.7 °C. According to scenario B, showing the situation of the study area without high vegetation, the daily average Tmrt in the summer period is 41.7 °C. The current tree cover reduces the daily average Tmrt value by 11.0 °C. The daily average Tmrt values in the C-I scenarios are 38.2 °C, 35.4 °C, 30.6 °C, 33.8 °C, 33.2 °C, 29.9 °C and 30.3 °C, respectively (Table 8). The lowest Tmrt value was observed in scenario H. The Tmrt value of this scenario is 0.8 °C lower than the base scenario and 11.8 °C lower than scenario B (no tree cover scenario).
According to the simulation results obtained from the base scenario (scenario A) showing the current situation of the study area, the daily average Tmrt in the winter period is 5.7 °C. According to scenario B showing the situation of the study area without high vegetation, the daily average Tmrt in the winter period is 6.5 °C. The current tree cover reduces the daily average Tmrt value by 0.8 °C. The daily average Tmrt values in the C-I scenarios are 5.1 °C, 4.8 °C, 5.9 °C, 6.2 °C, 6.1 °C and 5.7 °C (Table 8). When the differences in Tmrt values among the scenarios are examined for the summer period, it was determined that temperature reductions of approximately 8–12 °C occurred in scenarios with deciduous vegetation, with the lowest values observed in the scenario involving Acer platanoides L. In the winter period, the greatest differences were identified in scenarios with coniferous vegetation, with reductions ranging from 1.4 to 1.7 °C. The leaf area index (LAI) of trees has been identified as one of the most influential parameters affecting this value. Accordingly, species with higher leaf density tend to exhibit lower Tmrt values, whereas smaller and shorter trees are associated with higher Tmrt levels. The presence of trees generally reduces downward shortwave radiation due to their shading effect. It has been reported that trees can reduce shortwave radiation by more than 50%, with the highest reductions observed in Acacia confusa, Ficus microcarpa, and Peltophorum pterocarpum, owing to their large canopies and relatively short trunks. In contrast, the lowest reductions were observed in Livistona chinensis and Roystonea regia (12.5% and 5.2%, respectively). This is attributed to the smaller canopy sizes and taller structures of these species, which provide shading primarily at midday, thereby exposing underlying areas to greater levels of downward shortwave radiation [57].

3.2.4. Physiologically Equivalent Temperature (PET)

According to the simulation results obtained from the base scenario (scenario A), which shows the current state of the study area, the average daily PET value during the summer period is 40.5 °C. According to scenario B, which shows the area without high vegetation, the average daily PET value during the summer period is 41.0 °C. The existing tree cover reduces the average daily PET value by 0.5 °C. In scenarios C-I, the average daily PET values are lower than the PET value for the base scenario (Table 8). The lowest PET value was observed in scenario H. The PET value for this scenario is 38.4 °C, lower than in scenario A.
According to the simulation results obtained from the base scenario (scenario A), which shows the current state of the study area, the average daily PET value during the winter period is 8.8 °C. According to scenario B, which shows the vegetation-free state of the study area, the average daily PET value during the summer period is 9.0 °C. The existing tree cover reduces the average daily PET value by 0.2 °C. In scenarios C-I, the average daily PET values are lower than the PET value for the base scenario (Table 8). The lowest PET value was observed in scenario H. The PET value for this scenario is 8.7 °C, lower than in scenario A. According to a study, the maximum reduction in PET during the summer period reached 3.4 °C and 2.2 °C under dense and sparse deciduous trees, respectively, whereas in areas with more sparsely foliated trees, the reductions were 2.9 °C and 1.5 °C, respectively [51]. PET is an index that is widely used today and applicable to outdoor spaces [58]. For the summer period, the H scenario, which includes Acer platanoides L. with broad leaves, was found to be advantageous, whereas for the winter period, coniferous scenarios and the F scenario, which includes Quercus infectoria G. Olivier with very small leaves, were identified as favorable in terms of thermal comfort. Our results corroborate these studies’ findings [59,60,61] that tree canopy impacts thermal comfort differently; specifically, they improve it through a cooling effect, with coverage acting as a primary driver of thermal comfort.

3.2.5. Wind Speed

Trees can be used to protect buildings and areas from the wind. Slower winds make public spaces more comfortable in cold weather. Under hot conditions, low wind speed combined with high humidity can impair ventilation and increase discomfort [47,62,63]. According to the simulation results obtained from the base scenario (scenario A) showing the current situation of the study area, the mean daily wind speed in the summer period is 0.5 m/s. According to scenario B, showing the high vegetation-free situation of the study area, the mean daily wind speed in the summer period is 0.6 m/s. In other scenarios, the daily average wind speed value varies between 0.5 and 0.7 m/s (Table 8).
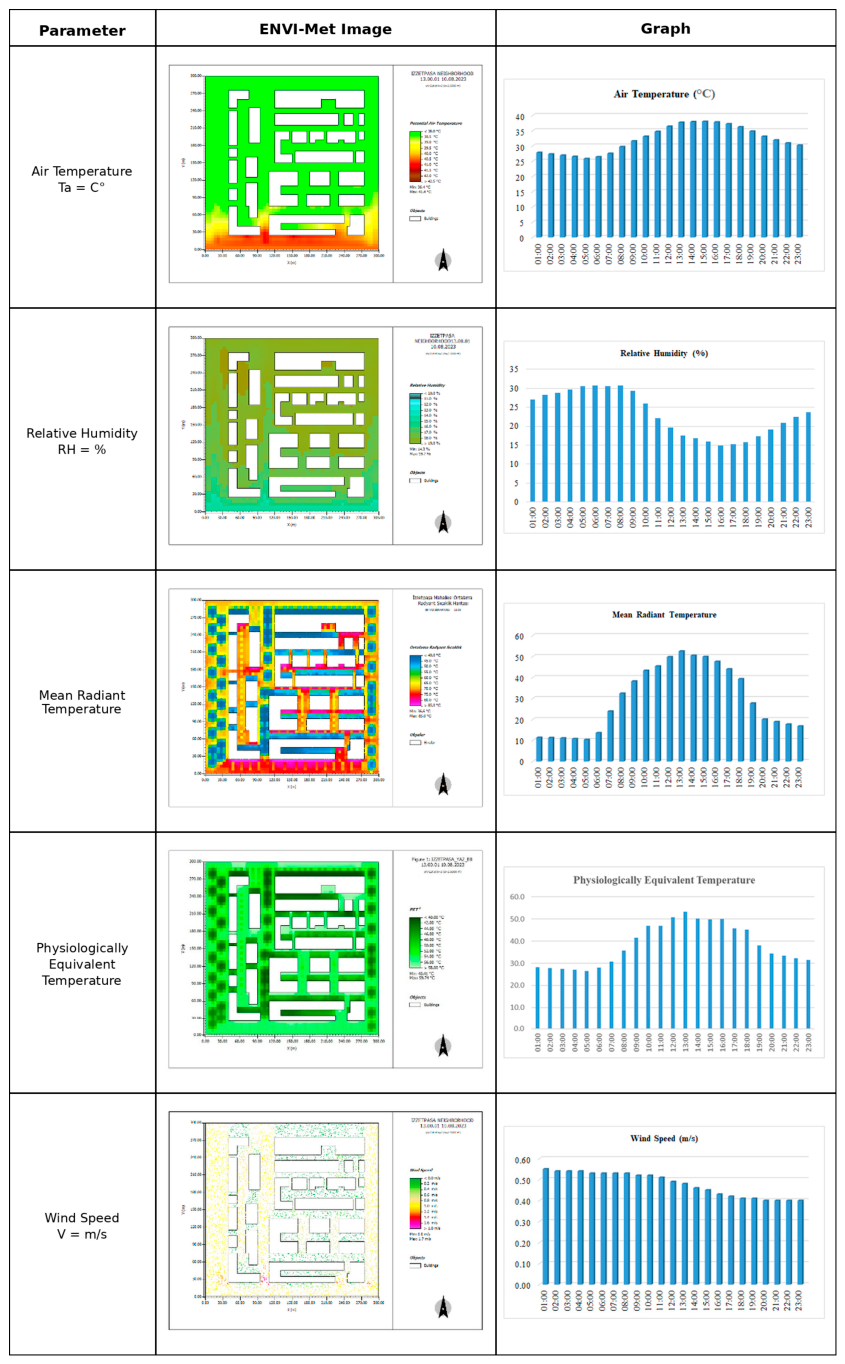
According to the simulation results obtained from the base scenario (A) showing the current situation of the study area, the mean daily wind speed in the winter period is 0.4 m/s. In other scenarios, the daily average wind speed is 0.4 m/s and there is no different value (Table 8). The best cooling effect among the nine scenarios was achieved in scenario H where Acer platanoides L. was used. ENVI-Met images and graphs of this scenario for summer and winter periods are shown in Figure 6 and Figure 7. In this scenario, the air temperature decreased by 0.8 °C compared to the base scenario in the summer period. Relative humidity increased from 21.8% to 23.2%, and the Mean Radiant Temperature decreased by 0.8 °C. There was no significant change in wind speed during the winter period (Figure 6 and Figure 7). Wind is already well recognized as a key parameter influencing thermal comfort. A previous study reported that the presence of four street trees in urban street canyons can reduce wind speed beneath the canopy by up to 51%. To mitigate the potential negative impacts of reduced ventilation on thermal comfort, the importance of selecting tree species with appropriate form and size in landscape design has been emphasized. While deciduous species are more effective during the summer period, coniferous species have been found to be more effective in winter conditions [64]. The findings of this study are compatible with the results of Ren’s study [65] on how trees affect wind speed. In another study [66], ENVI-met winter simulations showed that evergreen trees improve thermal comfort in wide urban canyons by reducing wind speed, while deciduous trees in narrow canyons do so by allowing solar radiation penetration. These results are consistent with our findings.
Although different climatic characteristics occur in different regions of the world, the climatic problems are universal [67]. Adaptation strategies to alleviate the effects of climate change are needed at different spatial scales, from national to local. Overcoming these challenges requires the participation of all segments of society [68].

3.3. Urban Green Scenario Analysis

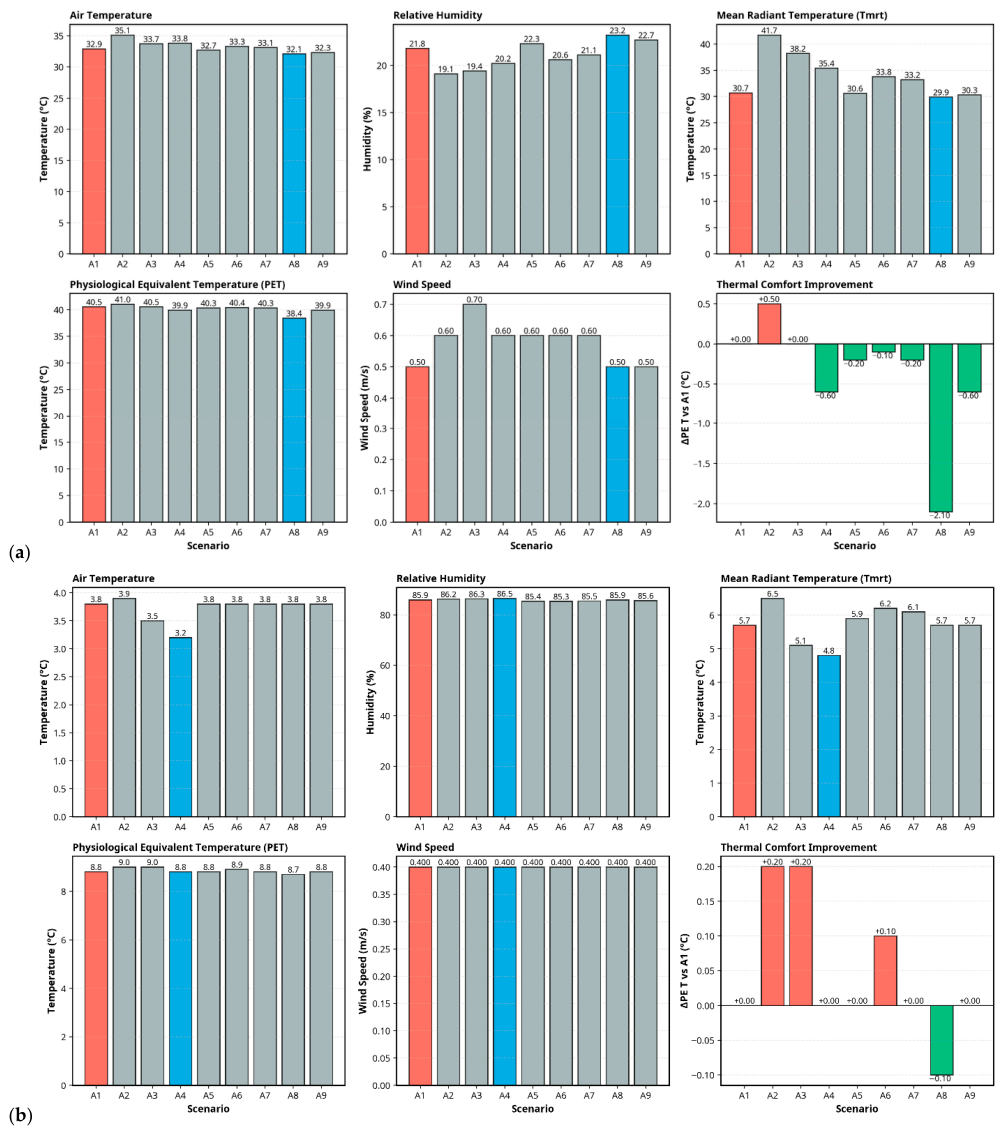
The analysis of the nine urban green scenarios reveals varying effectiveness in mitigating Urban Heat Islands (UHI) and Urban Cool Islands (UCI), as well as improving thermal comfort levels across both summer and winter seasons. As shown in Figure 8a,b, which present a comparative overview of scenario performance across multiple variables, scenario H emerges as the most effective strategy for enhancing thermal comfort.
In the summer, scenario H achieves a significant reduction in Physiological Equivalent Temperature (PET) of 2.1 °C compared to the baseline (A), primarily driven by a 0.8 °C reduction in both air and mean radiant temperatures. While other scenarios such as D, E, and G also demonstrate positive impacts—reducing PET by 0.6 °C and 0.2 °C respectively—scenario B leads to a degradation in comfort, increasing PET by 0.5 °C due to substantial rises in temperature.
In contrast, winter scenarios show minimal variation in thermal comfort, with a PET range of 8.7–9.0 °C compared to the much higher summer range of 38.4–41.0 °C. In this season, scenario H reduces PET by only 0.1 °C, while scenarios B, C, and F slightly worsen comfort levels, increasing PET from 0.1 °C to 0.2 °C. Notably, scenario H exhibits the smallest summer-winter temperature difference at 29.7 °C, whereas most other scenarios maintain a difference of 31–32 °C, and wind speeds remain constant at 0.4 m/s across all winter models. Ultimately, it can be concluded that green infrastructure strategies are considerably more effective under summer conditions, and scenario H is the most suitable intervention for mitigating UHI in the summer and UCI in the winter, making it the optimal choice for enhancing year-round thermal comfort.

3.4. Statistical Analysis

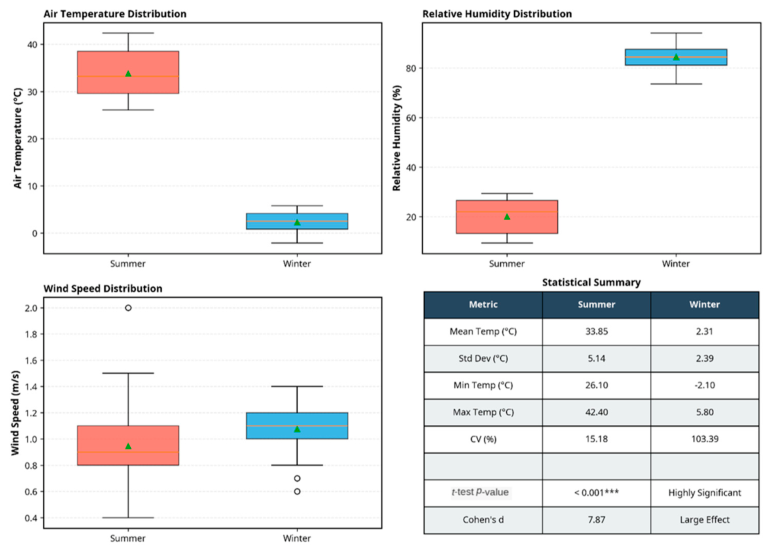
An independent samples t-test was conducted to compare key climatic variables—including air temperature, relative humidity, and wind speed—between the summer and winter seasons, as presented in Figure 9. The analysis reveals a stark contrast in climatic conditions between the two periods. The mean air temperature in summer (33.85 °C) is significantly higher than in winter (2.31 °C), representing a highly significant difference (p < 0.001). Summer temperatures exhibit high variability, ranging from a minimum of 26.10 °C to a maximum of 42.40 °C, whereas winter temperatures frequently drop below freezing, reaching a minimum of −2.10 °C. This massive seasonal shift is quantified by an exceptionally large effect size (Cohen’s d = 7.87), indicating that the means of the two groups are nearly eight standard deviations apart. Temperature variability is notably greater in the summer, evidenced by a larger standard deviation of 5.14. Furthermore, the seasons show an inverse relationship between temperature and moisture: summer is characterized by dry conditions (relative humidity between 10% and 30%), while winter is significantly more humid (between 75% and 90%). Regarding wind patterns, summer speeds typically center around 0.9 m/s with a notable outlier of 2.0 m/s; in contrast, winter is slightly windier on average (~1.1 m/s) but maintains a more compact and consistent distribution.

3.5. Correlation Matrix and Thermal Comfort Analysis

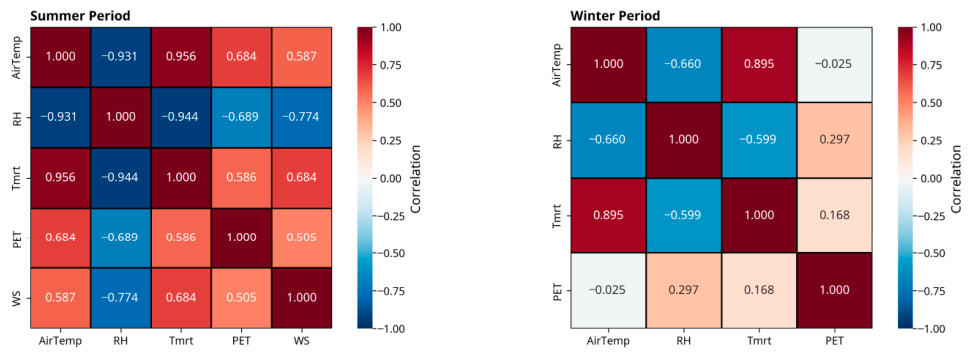
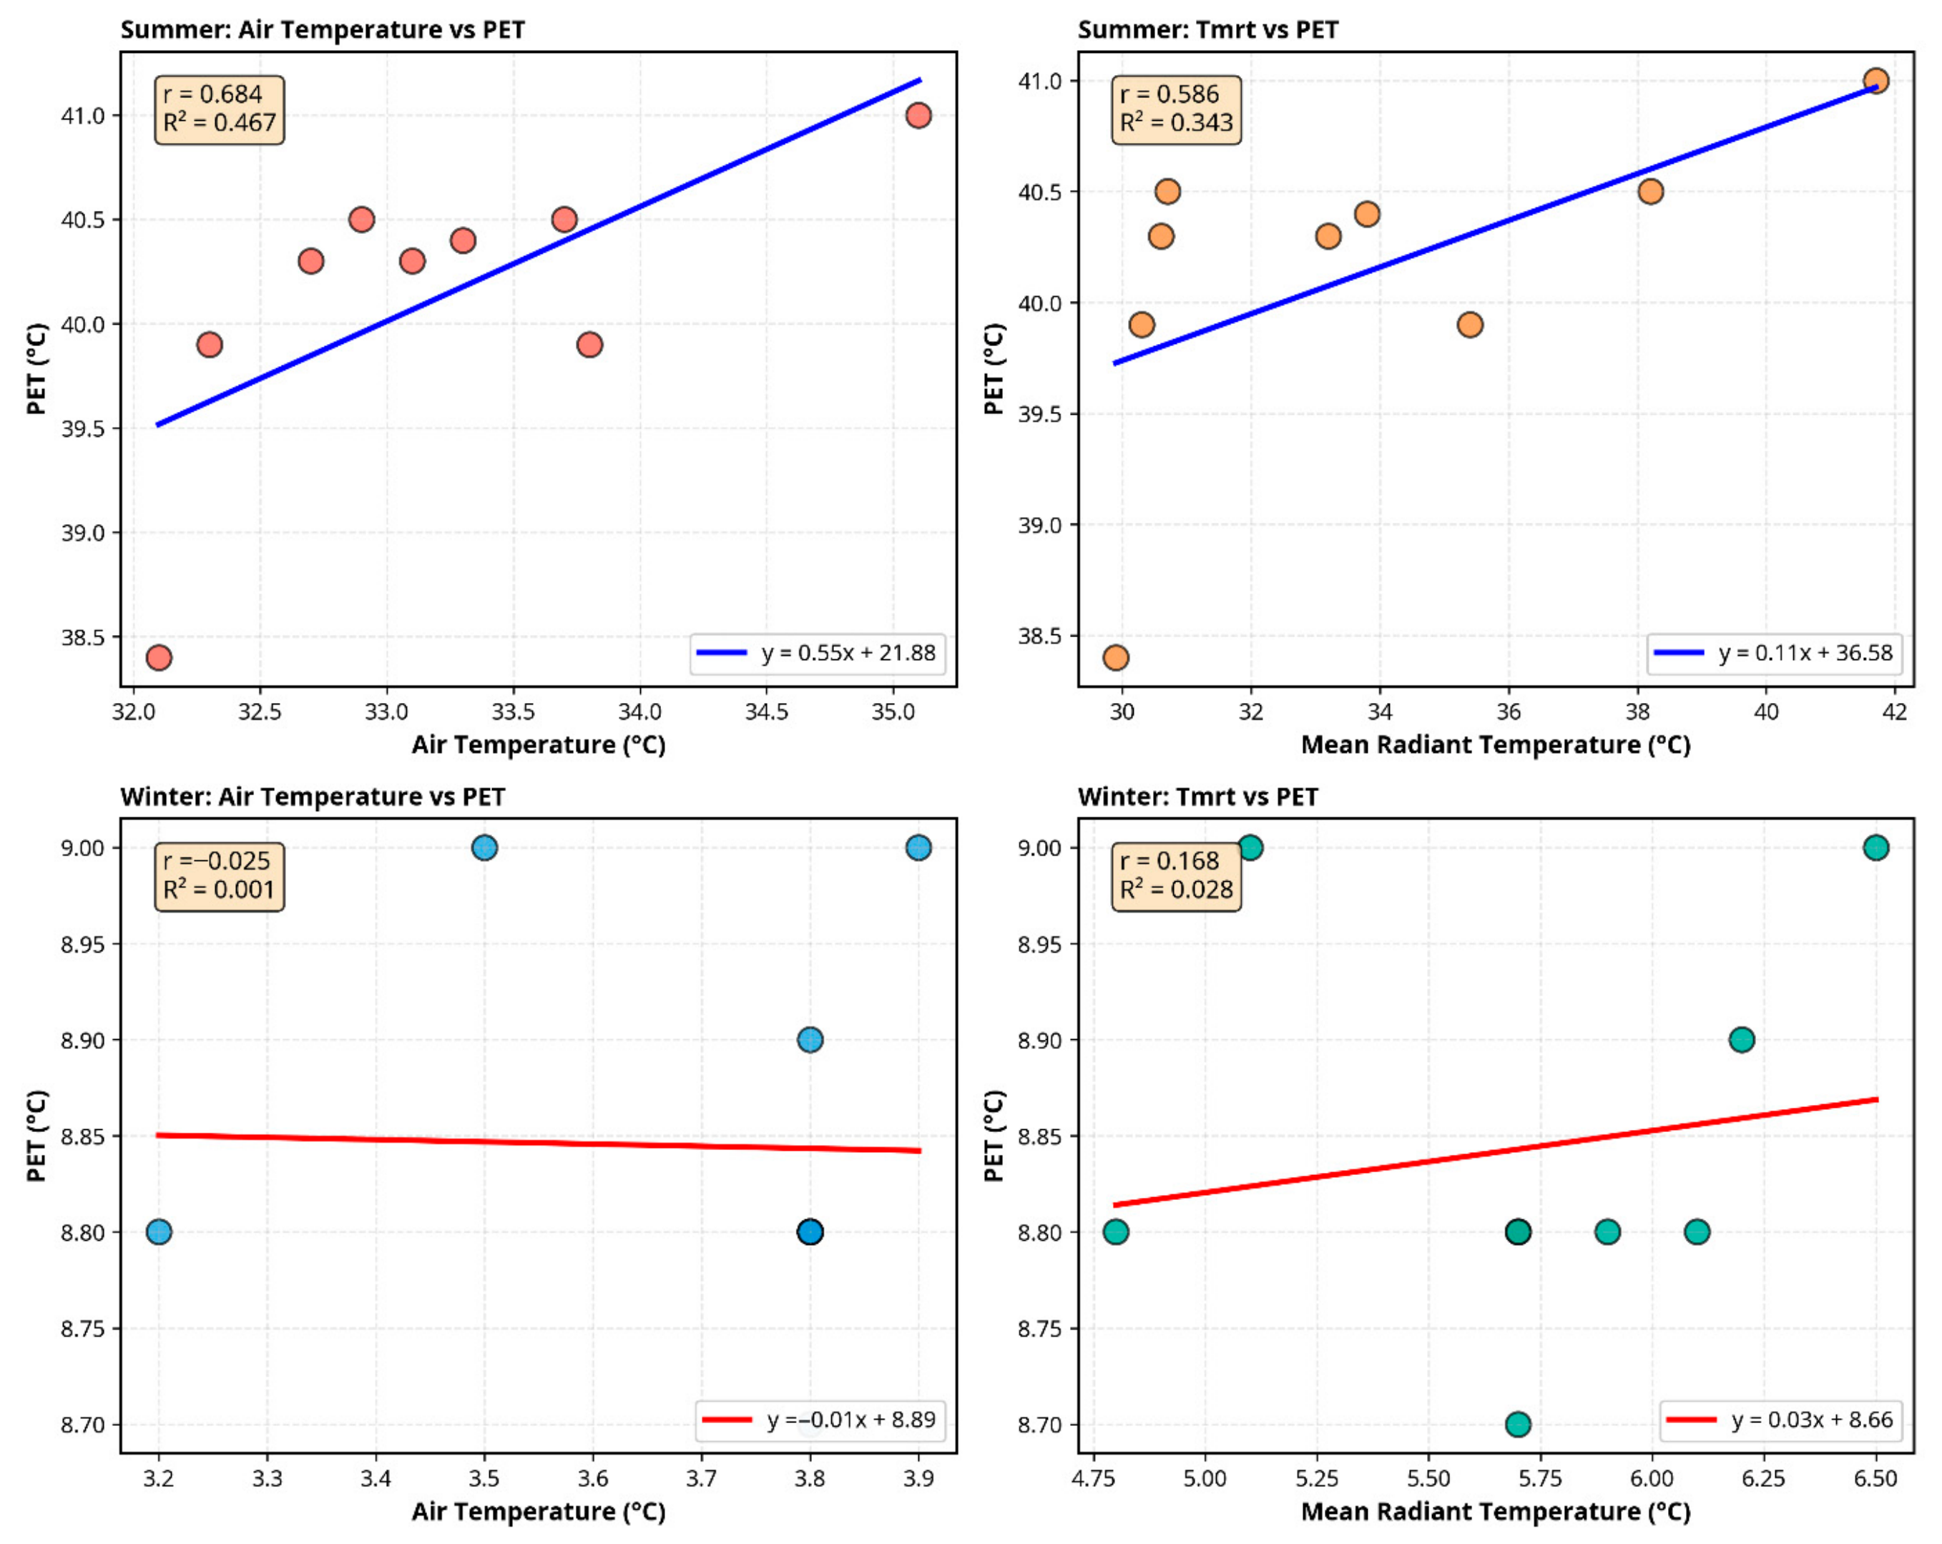
Figure 10 presents a correlation matrix analysis across all variables for the summer and winter seasons. The results reveal strong, significant relationships between microclimatic variables, characterized by both positive and negative correlations. Notably, air temperature (Ta) exerts a high degree of influence on both the Mean Radiant Temperature (Tmrt) and the Physiological Equivalent Temperature (PET) index. During the summer, Ta is strongly and positively correlated with Tmrt (r = 0.956) and negatively correlated with relative humidity (r = −0.931); this indicates that as temperatures rise, Tmrt increases while humidity decreases. In winter, these correlations persist but are less pronounced, with Ta maintaining a positive relationship with Tmrt (r = 0.895) and a negative relationship with humidity (r = −0.660). Furthermore, the summer relationship between Ta and PET is moderately strong and positive (r = 0.684). The analysis of the thermal comfort PET index, presented by the linear regression model in Figure 11, reveals that both air temperature and Tmrt are significant drivers of thermal comfort in the summer season indicating that for every 1 °C increase in Ta, PET increases by approximately 0.55 °C. While the relationship between Tmrt and PET is also positive (r = 0.586), these associations weaken significantly and lose statistical significance during the winter, suggesting that other factors may play a more dominant role in determining thermal comfort during colder periods.

Limitations

The ENVI-met model is a program used in the study that can simulate the effects of high vegetation in detail. In order to perform the simulation, the air temperature and relative humidity data of the areas to be studied are entered as 24 h. However, wind speed data cannot be entered into the system on an hourly basis. This is one of the factors limiting our study. It is entered as daily average wind speed data. According to the wind speed data obtained from the simulations conducted in the study area, no significant change was observed throughout the day. Entering the wind speed and wind direction data obtained hourly into the program on an hourly basis may change the results. Furthermore, the Envi-met model has limitations in simulating large, complex urban areas and performs better in smaller-scale microclimatic analyses such as this study [69].

4. Conclusions

The aim of this study is to investigate the cooling effect of tree species on urban space in Elazığ, Turkey and to reveal how they affect the microclimate. ENVI-met microclimate software was used, and the aim was to create the most suitable microclimate scenarios to reduce the UHI effect in this study. The greatest cooling effect among the nine scenarios was obtained from scenario H, where Acer platanoides L. was used.
Air temperature decreased by 0.8 °C compared to the base scenario, and by 3.0 °C compared to the no-plant scenario. In general, no significant temperature decrease was experienced in the scenarios where coniferous trees were used (C, D). In the scenarios where deciduous trees were used, a greater temperature decrease was observed compared to coniferous trees. According to the winter simulation results of these scenarios, the daily average air temperature varied between −0.6 and +0.1 °C compared to the base scenario. There were no significant temperature changes during the winter period. The highest cooling effect was observed in scenario H, where the highest relative humidity was determined. The lowest Tmrt value in the summer period was observed in scenario H. The summer Tmrt value of this scenario is 0.8 °C lower than the base scenario and 11.8 °C lower than the scenario without a tree cover. In all scenarios, there was no significant change in the daily mean wind speed in summer or winter.
This statistical analysis provides valuable insights into the effectiveness of various urban greening strategies. The nine scenarios evaluated demonstrate distinct impacts on urban thermal comfort, with scenario H yielding the most significant cooling effect and the greatest improvement in Physiological Equivalent Temperature (PET). Given that air temperature and mean radiant temperature are the primary drivers of thermal stress during the summer, strategies specifically designed to mitigate these two variables are likely to be the most impactful. Based on these findings, it is recommended that urban planners and designers prioritize green infrastructure configurations like scenario H to effectively mitigate urban heat and enhance the overall quality of life for the residents. Future research should focus on refining simulation models for winter conditions and conducting a comprehensive cost–benefit analysis of the most effective greening scenarios.
Evaluating the cooling effect of high vegetation on a species basis in urban spaces by reducing the UHI effect as a basis for urban planning constitutes an important strategy in improving local climate conditions. This study may provide a solution in reducing the UHI in studies to be carried out in urban spaces.

Author Contributions

Conceptualization, Y.M., S.Y. and A.Q.; methodology, Y.M. and S.Y.; software, Y.M., S.Y. and A.Q.; validation, Y.M., S.Y. and A.Q.; formal analysis, Y.M., S.Y. and A.Q.; investigation, Y.M., S.Y. and A.Q.; resources, Y.M., S.Y. and A.Q.; data curation, Y.M., S.Y. and A.Q.; writing—original draft preparation, Y.M., S.Y. and A.Q.; writing—review and editing, Y.M., S.Y. and A.Q.; visualization, Y.M., S.Y. and A.Q.; supervision, Y.M., S.Y. and A.Q.; project administration, Y.M., S.Y. and A.Q.; funding acquisition, S.Y. and A.Q. All authors have read and agreed to the published version of the manuscript.

Funding

This research work was partially financed by the Kingdom University, Bahrain, from the research grant number KU-2025/2026, Administration System of Scientific Research Project (BAP), Ataturk University of Turkiye (Grant No: FDK-2022-11528) and (Regional Universities Research, Development, and Collaboration Project No: ATABAP-BÖGEP-FBA-2026-16876). The authors expressed their sincere gratitude for a part of Yasar MENTES’s PhD thesis with Reference Number 10511002. Contains a section of Yaşar MENTEŞ’s PhD thesis with the YOK reference number 943560.

Data Availability Statement

The datasets used and analyzed in the current study are available from the corresponding author upon reasonable request.

Conflicts of Interest

The authors declare no conflicts of interest.

Abbreviations

The following abbreviations are used in this manuscript:
UHIUrban heat island
UCIUrban Cool Islands
UNUnited Nations
DESADepartment of Economic and Social Affairs
PETPhysiologically equivalent temperature
TmrtMean Radiant Temperature
R2Correlation Coefficient
RMSERoot mean square error
MAEMean absolute error

References

  1. Saaroni, H.; Amorim, J.H.; Hiemstra, J.A.; Pearlmutter, D. Urban Green Infrastructure as a tool for urban heat mitigation: Survey of research methodologies and findings across different climatic regions. Urban Clim. 2018, 24, 94–110. [Google Scholar] [CrossRef] [Scilit]
  2. UN. Around 2.5 Billion More People Will Be Living in Cities by 2050, Projects New UN Report. 2024. Available online: https://www.un.org/en/desa/around-25-billion-more-people-will-be-living-cities-2050-projects-new-un-report#:~:text (accessed on 20 April 2025).
  3. IPCC 2022. Available online: https://www.ipcc.ch/reports/ (accessed on 10 January 2025).
  4. Deilami, K.; Kamruzzaman, M.; Liu, Y. Urban heat island effect: A systematic review of spatio-temporal factors, data, methods, and mitigation measures. Int. J. Appl. Earth Obs. Geoinf. 2018, 67, 30–42. [Google Scholar] [CrossRef] [Scilit]
  5. Battista, G.; de Lieto Vollaro, E.; Evangelisti, L.; de Lieto Vollaro, R. Urban Overheating Mitigation Strategies Opportunities: A Case Study of a Square in Rome (Italy). Sustainability 2022, 14, 16939. [Google Scholar] [CrossRef] [Scilit]
  6. Zheng, Z.; Fong, C.S.; Aghamohammadi, N.; Law, Y.K. A Systematic Review of Urban Heat Island (UHI) Impacts and Mitigation: Health, Equity, and Policy. Systems 2026, 14, 82. [Google Scholar] [CrossRef] [Scilit]
  7. Yilmaz, S.; Sezen, I.; Irmak, M.A.; Külekçi, E.A. Analysis of outdoor thermal comfort and air pollution under the ınfluence of urban morphology in cold-climate cities: Erzurum/Turkey. Environ. Sci. Pollut. Res. 2021, 28, 64068–64083. [Google Scholar] [CrossRef] [Scilit] [PubMed]
  8. Bao, J.; Xu, L.; Shi, Y.; Ma, Q.; Lu, Z. The Influence of Street Morphology on Thermal Environment Based on ENVI-met Simulation: A Case Study of Hangzhou Core Area, China. ISPRS Int. J. Geo-Inf. 2023, 12, 303. [Google Scholar] [CrossRef] [Scilit]
  9. Gunawardena, K.R.; Wells, M.J.; Kershaw, T. Utilising green and bluespace to mitigate urban heat island intensity. Sci. Total Environ. 2017, 584–585, 1040–1055. [Google Scholar] [CrossRef] [Scilit]
  10. Gartland, L. Heat Islands: Understanding and Mitigating Heat in Urban Areas; Routledge: London, UK, 2008. [Google Scholar]
  11. Oke, T.R.; Mills, G.; Christen, A.; Voogt, J.A. Urban Climates; Cambridge University Press: Cambridge, UK, 2017. [Google Scholar]
  12. Sasaki, K.; Mochida, A.; Yoshino, H.; Watanabe, H.; Yoshida, T. A new method to select appropriate countermeasures against heat-island effects according to the regional characteristics of heat balance mechanism. J. Wind. Eng. Ind. Aerodyn. 2008, 96, 1629–1639. [Google Scholar] [CrossRef] [Scilit]
  13. Roy, T.B.; Middey, A.; Krupadam, R.J. Unveiling the microclimate: A comprehensive review of tools, techniques, and future directions for sustainable cities. Build. Environ. 2025, 274, 112726. [Google Scholar] [CrossRef] [Scilit]
  14. Li, Y.; Liu, X.; Cheshmehzangi, A.; Zahed, L.M.; He, B.J. Multidimensional factors affecting tree-induced cooling benefits: A comprehensive review. Build. Environ. 2025, 282, 113242. [Google Scholar] [CrossRef] [Scilit]
  15. Fellini, S.; Marro, M.; Del Ponte, A.V.; Barulli, M.; Soulhac, L.; Ridolfi, L.; Salizzoni, P. High resolution wind-tunnel investigation about the effect of street trees on pollutant concentration and street canyon ventilation. Build. Environ. 2022, 226, 109763. [Google Scholar] [CrossRef] [Scilit]
  16. Zheng, S.; Guldmann, J.M.; Liu, Z.; Zhao, L.; Wang, J.; Pan, X.; Zhao, D. Predicting the influence of subtropical trees on urban wind through wind tunnel tests and numerical simulations. Sustain. Cities Soc. 2020, 57, 102116. [Google Scholar] [CrossRef] [Scilit]
  17. Lin, C.; Yang, J.; Huang, J.; Zhong, R. Examining the Effects of Tree Canopy Coverage on Human Thermal Comfort and Heat Dynamics in Courtyards: A Case Study in Hot-Humid Regions. Atmosphere 2023, 14, 1389. [Google Scholar] [CrossRef] [Scilit]
  18. Yilmaz, S.; Menteş, Y.; Qaid, A.; Jamei, E.; Angin, S.N. Urban Form and Thermal Comfort: A Comparative Study of Scattered and Grid Settlement in Cold Climate. Land 2026, 15, 34. [Google Scholar] [CrossRef] [Scilit]
  19. Yilmaz, S.; Toy, S.; Demircioglu Yildiz, N.; Yilmaz, H. Human population growth and temperature increase along with the increase in urbanisation, motor vehicle numbers and green area amount in the sample of Erzurum city, Turkey. Environ. Monit. Assess. 2009, 148, 205–213. [Google Scholar] [CrossRef] [Scilit] [PubMed]
  20. Zhao, Y.; Li, H.; Bardhan, R.; Kubilay, A.; Li, Q.; Carmeliet, J. The time-evolving impact of tree size on nighttime street canyon microclimate: Wind tunnel modeling of aerodynamic effects and heat removal. Urban Clim. 2023, 49, 101528. [Google Scholar] [CrossRef] [Scilit]
  21. He, B.J. Towards the next generation of green building for urban heat island mitigation: Zero UHI impact building. Sustain. Cities Soc. 2019, 50, 101647. [Google Scholar] [CrossRef] [Scilit]
  22. Ali-Toudert, F.; Mayer, H. Effects of asymmetry, galleries, overhanging facades and vegetation on thermal comfort in urban street canyons. Sol. Energy 2007, 81, 742–754. [Google Scholar] [CrossRef] [Scilit]
  23. Yuca, N.; Alp, Ş.; Yilmaz, S.; Jamei, E.; Qaid, A. Designing for Cooler Street: Case Study of Van City. Land 2025, 14, 2313. [Google Scholar] [CrossRef] [Scilit]
  24. Oliveira, S.; Andrade, H.; Vaz, T. The cooling effect of green spaces as a contribution to the mitigation of urban heat: A case study in Lisbon. Build. Environ. 2011, 46, 2186–2194. [Google Scholar] [CrossRef] [Scilit]
  25. Chow, W.T.; Brazel, A.J. Assessing xeriscaping as a sustainable heat island mitigation approach for a desert city. Build. Environ. 2012, 47, 170–181. [Google Scholar] [CrossRef] [Scilit]
  26. Tsilini, V.; Papantoniou, S.; Kolokotsa, D.D.; Maria, E.A. Urban gardens as a solution to energy poverty and urban heat island. Sustain. Cities Soc. 2015, 14, 323–333. [Google Scholar] [CrossRef] [Scilit]
  27. Ballinas, M.; Barradas, V.L. The urban tree as a tool to mitigate the urban heat island in Mexico city: A simple phenomenological model. J. Environ. Qual. 2016, 45, 157–166. [Google Scholar] [CrossRef] [Scilit]
  28. Xiao, X.D.; Dong, L.; Yan, H.; Yang, N.; Xiong, Y. The influence of the spatial characteristics of urban green space on the urban heat island effect in Suzhou Industrial Park. Sustain. Cities Soc. 2018, 40, 428–439. [Google Scholar] [CrossRef] [Scilit]
  29. Irmak, M.A.; Yilmaz, S.; Mutlu, E.; Yilmaz, H. Analysis of different urban spaces on thermal comfort in cold regions: A case from Erzurum. Theor. Appl. Climatol. 2020, 141, 1593–1609. [Google Scholar] [CrossRef] [Scilit]
  30. de Abreu-Harbich, L.V.; Labaki, L.C.; Matzarakis, A. Effect of tree planting design and tree species on human thermal comfort in the tropics. Landsc. Urban Plan. 2015, 138, 99–109. [Google Scholar] [CrossRef] [Scilit]
  31. Zhang, Y.; Hu, X.; Liu, Z.; Zhou, C.; Liang, H. A Greening Strategy of Mitigation of the Thermal Environment for Coastal Sloping Urban Space. Sustainability 2023, 15, 295. [Google Scholar] [CrossRef] [Scilit]
  32. Ramdiana, D.N.; Yola, L. The Effect of Vegetation and Water Body on Thermal Comfort in Banteng City Park, Jakarta. Plan. Malays. 2023, 21, 262–273. [Google Scholar] [CrossRef] [Scilit]
  33. Lai, D.; Liu, Y.; Liao, M.; Yu, B. Effects of different tree layouts on outdoor thermal comfort of green space in summer Shanghai. Urban Clim. 2023, 47, 101398. [Google Scholar] [CrossRef] [Scilit]
  34. Asmadi, A.B.; Misni, A.; Brahimi, M. Evaluating urban microclimate temperature using Envi-Met Simulation Model: A case study conducted in two city areas, Pudu and Wangsa Maju. Geogr.-Malays. J. Soc. Space 2024, 20, 26–43. [Google Scholar] [CrossRef] [Scilit]
  35. Köppen, W.; Geiger, R. Klima der Erde (Climate of the Earth); Wall Map 1:16 Mill; Klett-Perthes: Gotha, Germany, 1954. [Google Scholar]
  36. Han, Y.; Jo, Y.; Kim, E.J. Influence of landscape interventions on thermal comfort under time-varying building shadow; new Gwanghwamun square case, Seoul, South Korea. Heliyon 2023, 9, e19436. [Google Scholar] [CrossRef] [Scilit]
  37. Yang, J.; Zhao, Y.; Zou, Y.; Xia, D.; Lou, S.; Liu, W.; Ji, K. Effects of Tree Species and Layout on the Outdoor Thermal Environment of Squares in Hot-humid Areas of China. Buildings 2022, 12, 1867. [Google Scholar] [CrossRef] [Scilit]
  38. Rahimi, A.; Nobar, Z. Investigating the role of cover plants (grass) in improving the physiological equivalent temperature and relative humidity (study area: Tabriz University Stadium). J. Agric. Sci. Sustain. Prod. 2024, 34, 187–204. [Google Scholar]
  39. Bruse, M. ENVI-Met 4.4: A Microscale Urban Climate Model. 2018. Available online: http://www.envi-met.info (accessed on 20 April 2025).
  40. Liu, Z.; Cheng, W.; Jim, C.Y.; Morakinyo, T.E.; Shi, Y.; Ng, E. Heat mitigation benefits of urban green and blue infrastructures: A systematic review of modeling techniques, validation and scenario simulation in ENVI-met V4. Build. Environ. 2021, 200, 107939. [Google Scholar] [CrossRef] [Scilit]
  41. Menteş, Y.; Yilmaz, S.; Qaid, A. The cooling effect of different scales of urban parks on land surface temperatures in cold regions. Energy Build. 2024, 308, 113954. [Google Scholar] [CrossRef] [Scilit]
  42. Shi, G.; Sun, L.; An, Q.; Tang, L.; Shi, J.; Chen, C.; Feng, L.; Ma, H. Quantifying Urban Park Cooling Effects and Tri-Factor Synergistic Mechanisms: A Case Study of Nanjing’s Central Districts. Systems 2026, 14, 130. [Google Scholar] [CrossRef] [Scilit]
  43. Sharifi, E.; Zawarus, P.; Lehmann, S. Morphology of buildings and cities in hot and humid regions. In Urban Heat Island (UHI) Mitigation: Hot and Humid Regions; Enteria, N., Santamouris, M., Eicker, U., Eds.; Springer International Publishing: Singapore, 2021; pp. 169–182. [Google Scholar]
  44. Simon, H. Modeling Urban Microclimate: Development, Implementation and Evaluation of New and Improved Calculation Methods for the Urban Microclimate Model ENVI-Met. Doctoral Dissertation, Universitat Mainz, Mainz, Germany, 2016. [Google Scholar]
  45. Wang, H.; Cai, Y.; Deng, W.; Li, C.; Dong, Y.; Zhou, L.; Sun, J.; Li, C.; Song, B.; Zhang, F.; et al. The Effects of Tree Canopy Structure and Tree Coverage Ratios on Urban Air Temperature Based on ENVI-Met. Forests 2023, 14, 80. [Google Scholar] [CrossRef] [Scilit]
  46. Soltanifard, H.; Amani-Beni, M. The cooling effect of urban green spaces as nature-based solutions for mitigating urban heat: Insights from a decade-long systematic review. Clim. Risk Manag. 2025, 49, 100731. [Google Scholar] [CrossRef] [Scilit]
  47. Chen, H.; Liu, R.; Zhang, Y. The Impact of Vegetation Canopy on the Outdoor Thermal Environment in Cold Winter and Spring. Sustainability 2023, 15, 12818. [Google Scholar] [CrossRef] [Scilit]
  48. Tamaskani Esfehankalateh, A.; Ngarambe, J.; Yun, G.Y. Influence of tree canopy coverage and leaf area density on urban heat island mitigation. Sustainability 2021, 13, 7496. [Google Scholar] [CrossRef] [Scilit]
  49. Guo, S.; Lin, Y.; Feng, M.; He, M.; Zhu, X. Optimization of Planting Trees Can Improve Thermal Comfort in Historic Districts. Forests 2026, 17, 260. [Google Scholar] [CrossRef] [Scilit]
  50. Sinsel, T.; Simon, H.; Ouyang, W.; dos Santos Gusson, C.; Shinzato, P.; Bruse, M. Implementation and evaluation of mean radiant temperature schemes in the microclimate model ENVI-met. Urban Clim. 2022, 45, 101279. [Google Scholar] [CrossRef] [Scilit]
  51. Kong, L.; Lau, K.K.L.; Yuan, C.; Chen, Y.; Xu, Y.; Ren, C.; Ng, E. Regulation of outdoor thermal comfort by trees in Hong Kong. Sustain. Cities Soc. 2017, 31, 12–25. [Google Scholar] [CrossRef] [Scilit]
  52. Ji, Y.; Zhan, W.; Wang, S.; Li, X.; Wang, C.; Du, H.; Gao, Y.; Li, J.; Wang, C. Global Urban Intra-Park Surface Cooling Gradients and Their Key Landscape Thresholds. Sustain. Cities Soc. 2026, 143, 107384. [Google Scholar] [CrossRef] [Scilit]
  53. Pataki, D.E.; McCarthy, H.R.; Litvak, E.; Pincetl, S. Transpiration of urban forests in the Los Angeles metropolitan area. Ecol. Appl. 2011, 21, 661–677. [Google Scholar] [CrossRef] [Scilit]
  54. Zhang, L.; Zhan, Q.; Lan, Y. Effects of the tree distribution and species on outdoor environment conditions in a hot summer and cold winter zone: A case study in Wuhan residential quarters. Build. Environ. 2018, 130, 27–39. [Google Scholar] [CrossRef] [Scilit]
  55. Gunawardhana, L.N.; Al-Rawas, G.A.; Kazama, S. An alternative method for predicting relative humidity for climate change studies. Meteorol. Appl. 2017, 24, 551–559. [Google Scholar] [CrossRef] [Scilit]
  56. Alves, F.M.; Gonçalves, A.; del Caz-Enjuto, M.R. The Use of Envi-Met for the Assessment of Nature-Based Solutions’ Potential Benefits in Industrial Parks—A Case Study of Argales Industrial Park (Valladolid, Spain). Infrastructures 2022, 7, 85. [Google Scholar] [CrossRef] [Scilit]
  57. Morakinyo, T.E.; Kong, L.; Lau, K.K.L.; Yuan, C.; Ng, E. A study on the impact of shadow-cast and tree species on in-canyon and neighborhood’s thermal comfort. Build. Environ. 2017, 115, 1–17. [Google Scholar] [CrossRef] [Scilit]
  58. Kántor, N.; Unger, J. The most problematic variable in the course of human-biometeorological comfort assessment—The mean radiant temperature. Cent. Eur. J. Geosci. 2011, 3, 90–100. [Google Scholar] [CrossRef] [Scilit]
  59. Ananyeva, O.; Emmanuel, R. Street trees and urban heat island in Glasgow: Mitigation through the ‘Avenues Programme’. Urban For. Urban Green. 2023, 86, 128041. [Google Scholar] [CrossRef] [Scilit]
  60. Zhang, X.; Ludwig, F. Towards “Right Tree, Right Place” in Urban Environments: A Systematic Review of Decision-Support Methods and Tools for Urban Tree Planting. Urban For. Urban Green. 2026, 118, 129335. [Google Scholar] [CrossRef] [Scilit]
  61. Yao, L.; Lau, K.; Zhang, X.; Liu, Z.; Xu, G.; Gao, K.; Rahman, M.A.; Ng, E. Beyond summer cooling: Evaluating winter thermal performance of urban trees in subtropical coastal region. Build. Environ. 2026, 296, 114471. [Google Scholar] [CrossRef] [Scilit]
  62. Aghamolaei, R.; Azizi, M.M.; Aminzadeh, B.; O’Donnell, J. A comprehensive review of outdoor thermal comfort in urban areas: Effective parameters and approaches. Energy Environ. 2023, 34, 2204–2227. [Google Scholar] [CrossRef] [Scilit]
  63. Jeong, D.I.; Park, K.H.; Song, B.G. A comparison between in-situ PET and ENVI-met PET for evaluating outdoor thermal comfort. KIEAE J. 2016, 16, 11–19. [Google Scholar] [CrossRef] [Scilit]
  64. Park, M.; Hagishima, A.; Tanimoto, J.; Narita, K.I. Effect of urban vegetation on outdoor thermal environment: Field measurement at a scale model site. Build. Environ. 2012, 56, 38–46. [Google Scholar] [CrossRef] [Scilit]
  65. Ren, Z.; Nikolopoulou, M.; Mills, G.; Pilla, F. Wind-sheltering effects of urban trees on the heating demand of building archetypes: A case study in Dublin. Build. Environ. 2026, 295, 114432. [Google Scholar] [CrossRef] [Scilit]
  66. Schöneberger, P.; Sinsel, T.; Ouyang, W.; Zheng, T.T.; Bruse, M.; Simon, H. Enhancing urban microclimate simulations: Validating ENVI-met’s accuracy in modeling multi-directional radiative fluxes and mean radiant temperature in subtropical Hong Kong. Build. Environ. 2025, 284, 113475. [Google Scholar] [CrossRef] [Scilit]
  67. Menteş, Y.; Yilmaz, S.; Qaid, A.; Yilmaz, H. Assessment of the impact of the different settlement patterns on the summer land surface temperature: Elazığ. Environ. Sci. Pollut. Res. 2023, 30, 30793–30818. [Google Scholar] [CrossRef] [Scilit]
  68. Eingrüber, N.; Korres, W.; Löhnert, U.; Schneider, K. Investigation of the ENVI-met model sensitivity to different wind direction forcing data in a heterogeneous urban environment. Adv. Sci. Res. 2023, 20, 65–71. [Google Scholar] [CrossRef] [Scilit]
  69. Yang, J.; Hu, X.; Feng, H.; Marvin, S. Verifying an ENVI-met simulation of the thermal environment of Yanzhong Square Park in Shanghai. Urban For. Urban Green. 2021, 66, 127384. [Google Scholar] [CrossRef] [Scilit]
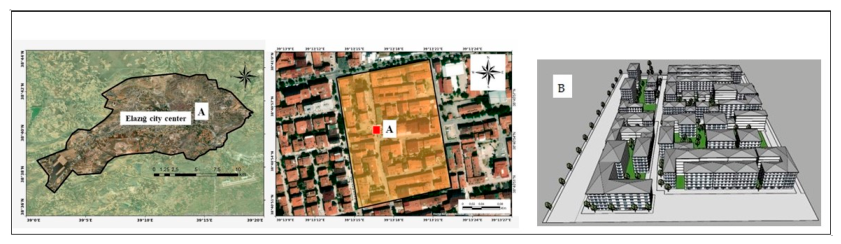
Figure 1. Elazig city center location map and study area (A)-ENVI-met 3D view (B).
Forests 17 00533 g001
Figure 2. Lutron AM-4247SD weather station device (left), a view of the measurements taken in the study area (right) the person in the Figure is the author of this article Yaşar Menteş.
Forests 17 00533 g002
Figure 3. Accuracy analysis in summer and winter.
Forests 17 00533 g003
Figure 4. ENVI-met analysis for the summer period.
Forests 17 00533 g004
Figure 5. ENVI-met analyzes for the winter period.
Forests 17 00533 g005
Figure 6. Simulation results for the best scenario (Acer platanoides L.) in the summer.
Forests 17 00533 g006
Figure 7. Simulation results for the best scenario (Acer platanoides L.) in the winter.
Forests 17 00533 g007
Figure 8. (a) summer performance of urban green scenarios A-I, and (b) winter performance of urban green scenarios A-I.
Forests 17 00533 g008
Figure 9. Seasonal comparation of the key climate variables distribution in the summer and winter. Note: *** indicates p < 0.001 (highly statistically significant, two-tailed independent-samples t-test).
Forests 17 00533 g009
Figure 10. Correlation Matrix of the key climate variables in the summer and winter.
Forests 17 00533 g010
Figure 11. Regression line correlation of PET, Ta and Tmrt in the summer and winter season.
Forests 17 00533 g011
Table 1. Information about the study area.
Land Use ClassificationArea (Ha)Percentage (%)
Residential areas3.4059.6
Impervious areas1.2021.1
Green areas0.8514.9
Open spaces0.254.4
Total area5.7100
Table 2. Landscape Scenarios Applied in the study area.
Scenario NameDescriptionENVI-Met (3D)SketchUp (3D)
First Scenario
(A)
Scenario of the base structure of the areaForests 17 00533 i001Forests 17 00533 i002
Second Scenario
(B)
Scenario of the vegetation-free structure of the areaForests 17 00533 i003Forests 17 00533 i004
Third
Scenario
(C)
Pinus sylvestris L. in north–south streets, Malus domestica Borkh. and Juglans regia L. in east–west streetsForests 17 00533 i005Forests 17 00533 i006
Fourth Scenario
(D)
Abies cilicica Carr. in north–south streets, Malus domestica Borkh. and Juglans regia L. in east–west streetsForests 17 00533 i007Forests 17 00533 i008
Fifth
Scenario
(E)
Catalpa bignonioides Walt. in north–south streets, Malus domestica Borkh. and Juglans regia L. in east–west streetsForests 17 00533 i009Forests 17 00533 i010
Sixth
Scenario
(F)
Quercus infectoria G. Olivier in north–south streets, Malus domestica Borkh. and Juglans regia L. in east–west streetsForests 17 00533 i011Forests 17 00533 i012
Seventh Scenario
(G)
Betula pendula Roth in north–south streets, Malus domestica Borkh. and Juglans regia L. in east–west streetsForests 17 00533 i013Forests 17 00533 i014
Eighth Scenario
(H)
Acer platanoides L. in north–south streets, Malus domestica Borkh. and Juglans regia L. in east–west streetsForests 17 00533 i015Forests 17 00533 i016
Ninth
Scenario
(I)
Tilia tomentosa Moench in north–south streets, Malus domestica Borkh. and Juglans regia L. in east–west streetsForests 17 00533 i017Forests 17 00533 i018
Table 3. Features of trees used in scenarios implemented in the study area.
Name of Tree GroupMalus
domestica Borkh.
Juglans
regia L.
Pinus sylvestris L.Abies
cilicica Carr.
Catalpa
bignonioides Walt.
Quercus
infectoria
G. Olivier
Betula
pendula Roth
Acer
platanoides L.
Tilia
tomentosa Moench
Type of TreeDeciduousDeciduousConiferousConiferousDeciduousDeciduousDeciduousDeciduousDeciduous
Scenario UsedA-IA-ICDEFGHI
Height (m)7.244.5519.55206.4811.3217.2120.1325.01
Width (m)5.46 × 5.922.12 ×
2.49
7.51 × 7.6295.57 × 4.986.69 × 8.2114.05 × 13.9614.51 × 14.5115.07 × 15.02
Leaf Area
Index
(January)
0.30.31.01.00.30.30.30.30.3
Leaf Area Index
(August)
1.01.01.01.01.01.01.01.01.0
Leaf Short Wave
Reflection
0.180.180.180.180.180.180.180.180.18
Leaf
Emissivity
0.960.960.960.960.960.960.960.960.96
Leaf Shortwave Transmittance0.300.300.300.300.300.300.300.300.30
Root Diameter (m)8.5021.5010.06.677.509.016.5018.016.50
Root Depth (m)2.505.05.01.05.05.02.505.05.0
Table 4. ENVI-met program summer-winter data.
Simulation TimeAugust and January
Total Simulation Time24 h for 1 alternative
Field Size (x, y, z)60 m × 60 m × 30 m
Grid Size (m) (x, y, z)5 × 5 × 5
Rotation (0° 360°) [0.0 N]0
Measurement Time10 August 20236 January 2024
Average Wind Speed (m/s)0.91.0
Wind directionfrom south to northfrom south to north
24 h Air Temperature33.92.0
24 h Average Relative Humidity20.175.7
Minimum Air Temperature (°C)/h26.1 °C/05.00−3.9 °C/05.00
Maximum Air Temperature (°C)/h42.4 °C/13.008.1 °C/14.00
Minimum Humidity (%)/h% 9.4/16.00%53.4/14.00
Maximum Humidity (%)/h% 29.3/05.00%91.4/05.00
Sky Visibility RatioOpenOpen
Table 5. Vertical grid sensitivity test results.
PeriodAir Temperature (°C)Relative Humidity (%)
R2RMSEMAER2RMSEMAE
Summer0.87240.187660.039130.93440.396180.08262
Winter0.64321.209380.252170.82230.959170.20000
Table 6. Measurement results in summer and winter periods.
TimeSummerWinter
Air
Temperature
(°C)
Relative Humidity Wind Speed (m/s)Air
Temperature
(°C)
Relative HumidityWind Speed (m/s)
00.0029.723.31.11.087.21.0
01.0029.523.80.8−0.290.11.2
02.0028.525.90.9−0.991.21.1
03.0027.926.50.8−1.493.21.3
04.0027.227.80.5−2.194.11.2
05.0026.129.30.4−1.793.91.2
06.0027.928.90.80.388.41.1
07.0029.628.20.81.187.11.0
08.0032.627.91.21.584.80.8
09.0033.826.81.52.482.60.6
10.0035.622.41.12.184.91.2
11.0038.415.42.03.879.80.7
12.0041.313.60.94.677.30.8
13.0042.411.21.05.873.51.0
14.0040.912.11.05.775.81.2
15.0040.610.71.25.077.81.4
16.0040.19.41.14.880.21.3
17.0038.911.21.04.681.41.1
18.0037.411.50.94.082.51.1
19.0035.914.91.23.982.91.2
20.0033.817.30.83.583.21.1
21.0032.419.20.43.283.91.2
22.0031.321.60.62.685.70.9
23.0030.622.90.71.986.31.1
Table 7. Summer and winter simulation data results.
SummerWinter
TimeAir
Temperature (°C)
Relative
Humidity
(%)
Tmrt
(°C)
PET
(°C)
Wind Speed (m/s)Air
Temperature
(°C)
Relative
Humidity
(%)
Tmrt
(°C)
PET
(°C)
Wind Speed (m/s)
MeanMeanMeanMeanMeanMeanMeanMeanMeanMean
01.0030.425.742.328.10.63.581.916.68.30.4
02.0030.925.545.027.70.63.482.820.67.50.4
03.0031.225.247.727.30.63.483.023.36.90.4
04.0031.525.048.426.90.63.183.722.46.40.4
05.0030.725.246.226.30.52.785.118.36.00.4
06.0030.525.944.328.00.53.385.414.26.80.4
07.0030.626.541.533.80.53.785.410.17.50.4
08.0031.327.338.342.20.53.586.10.97.80.4
09.0031.727.831.146.80.53.586.70.77.90.4
10.0032.725.122.450.00.53.687.70.710.00.4
11.0034.121.122.251.70.54.087.51.211.20.4
12.0035.818.623.053.70.54.584.61.212.70.4
13.0036.916.723.453.90.55.080.61.413.30.4
14.0036.816.423.454.00.55.677.51.812.70.4
15.0036.615.822.554.00.55.379.81.611.90.4
16.0036.414.921.753.80.55.181.71.49.60.4
17.0035.815.421.552.60.54.983.91.39.40.4
18.0034.816.020.748.80.54.586.50.69.00.4
19.0033.418.220.438.70.53.988.7−0.18.50.4
20.0032.220.219.534.90.53.390.8−1.18.00.4
21.0031.121.918.433.60.52.992.9−1.57.70.4
22.0030.523.427.533.60.52.495.5−227.30.4
23.0030.324.335.131.80.51.698.5−3.56.70.4
Mean32.921.830.740.50.53.885.95.68.80.4
Table 8. Summer and winter period simulation results (°C).
Simulation ResultsABCDEFGHI
Air Temperature (°C)Summer32.935.133.733.832.733.333.132.132.3
Winter3.83.93.53.23.83.83.83.83.8
Relative
Humidity (%)
Summer21.819.119.420.222.320.621.123.222.7
Winter85.986.286.386.585.485.385.585.985.6
Tmrt (°C)Summer30.741.738.235.430.633.833.229.930.3
Winter5.76.55.14.85.96.26.15.75.7
PET (°C)Summer40.541.040.539.940.340.440.338.439.9
Winter8.89.09.08.88.88.98.88.78.8
Wind Speed
(m/s)
Summer0.50.60.70.60.60.60.60.50.5
Winter0.40.40.40.40.40.40.40.40.4
Disclaimer/Publisher’s Note: The statements, opinions and data contained in all publications are solely those of the individual author(s) and contributor(s) and not of MDPI and/or the editor(s). MDPI and/or the editor(s) disclaim responsibility for any injury to people or property resulting from any ideas, methods, instructions or products referred to in the content.