Forest Fire Risk Early Warning Based on Dynamic Fuel Moisture Content

Abstract
1. Introduction
2. Materials
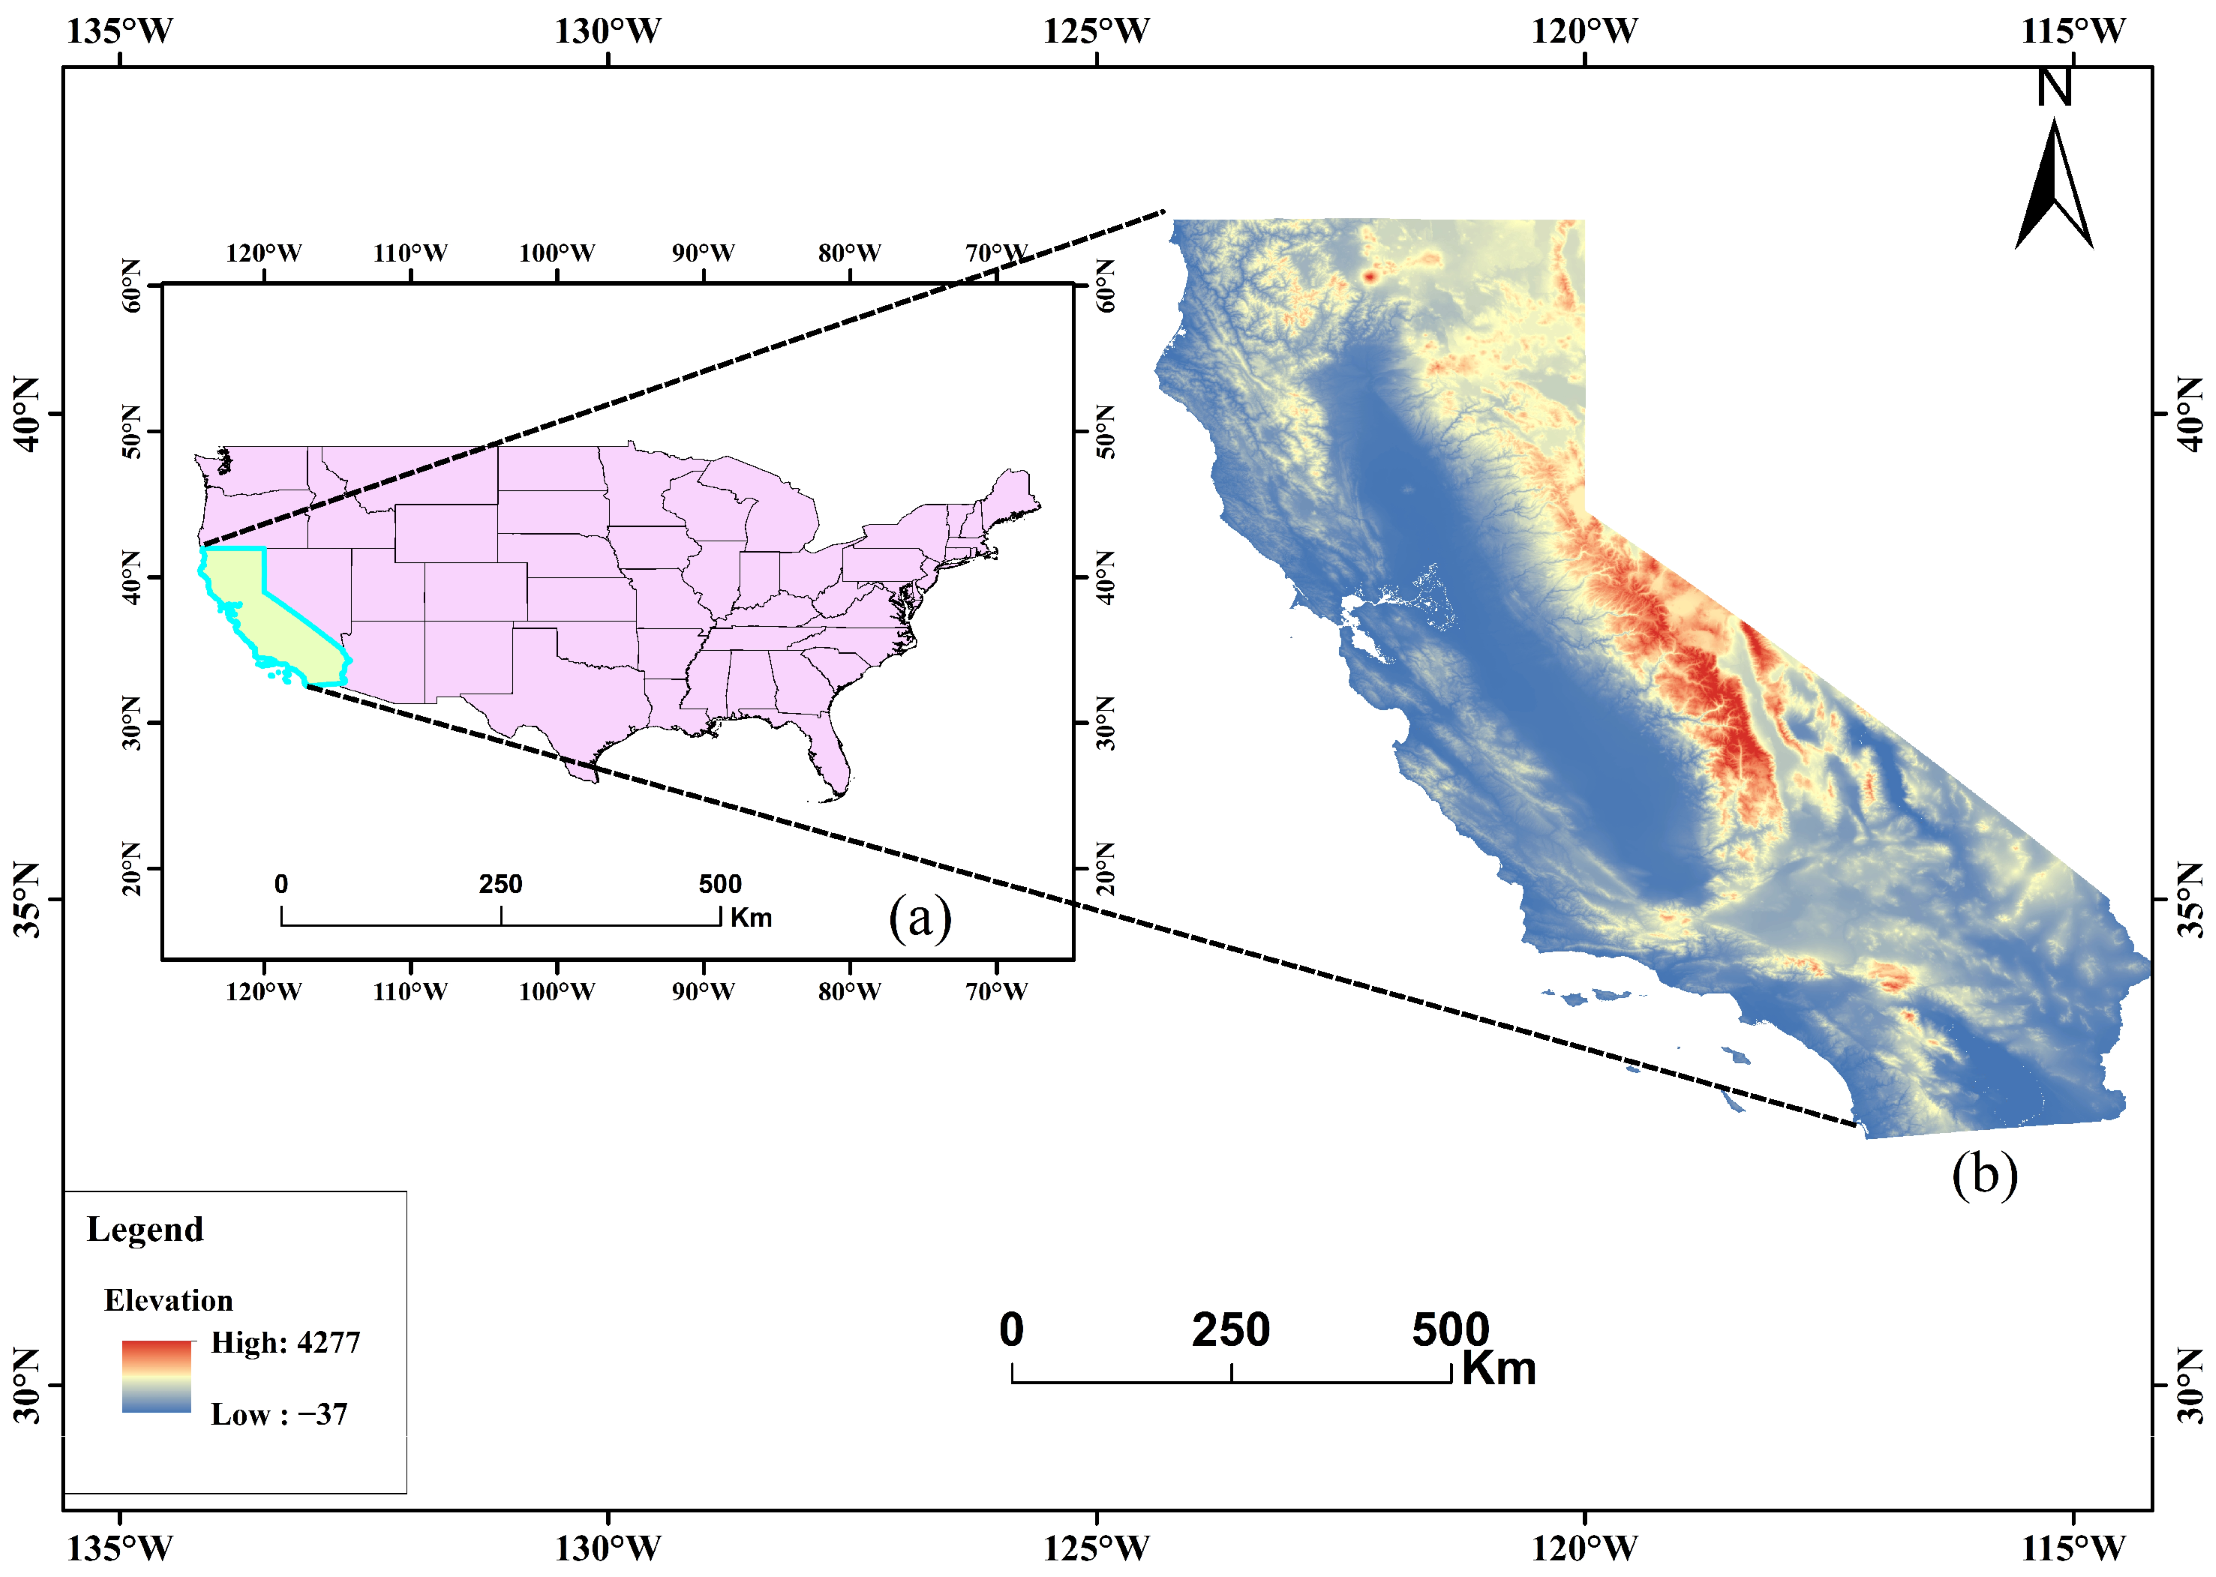
2.1. Test Site
2.2. Data
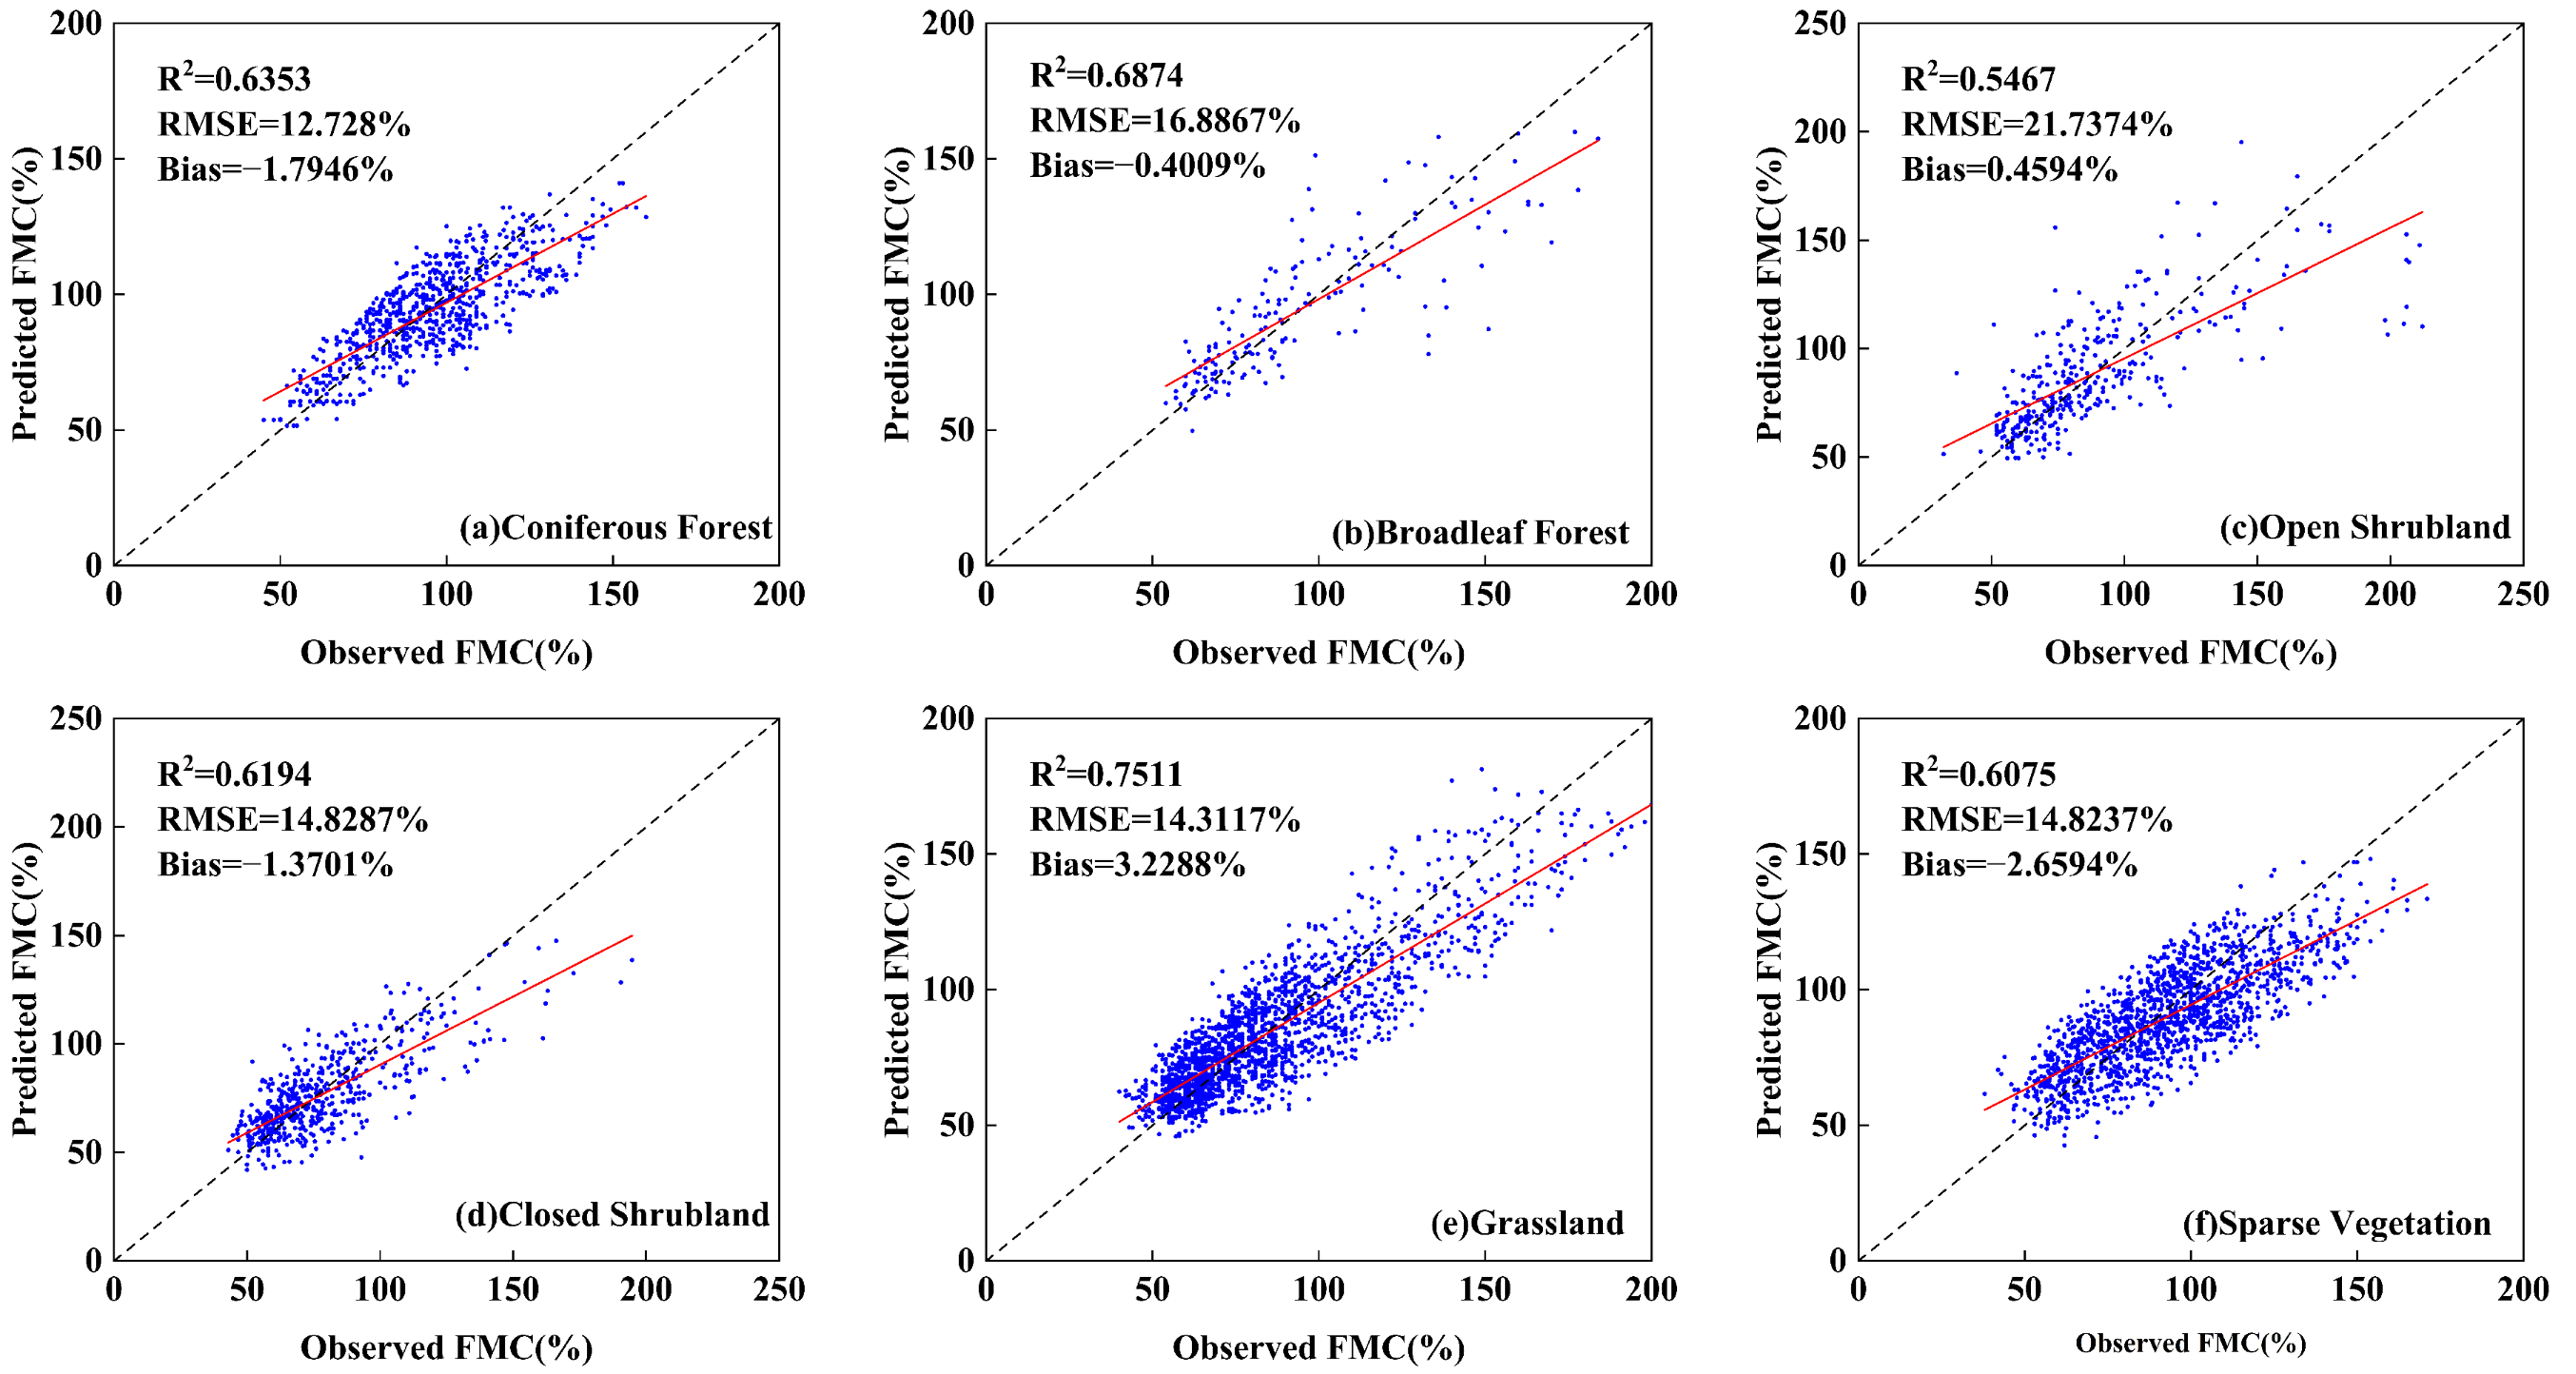
2.2.1. FMC Data
2.2.2. Vegetation Data
2.2.3. Meteorological and Topographic Data
2.2.4. Anthropogenic Factors Data
2.2.5. Fire Occurrence Data
3. Methodology
3.1. Random Forest Model
- (1)
- Spatial Stratified Sampling: The 33,092 distinct spatial locations within the training set were partitioned into five approximately equal subsets, with each subset containing roughly 6618 locations. A stratified sampling approach was employed to ensure that the proportion of positive and negative samples in each subset remained consistent with that of the original training set, thereby avoiding the influence of class imbalance on the validation results.
- (2)
- Iterative Validation Process: In each iteration, four subsets (approximately 26,474 locations) were chosen as the training set, while the remaining subset functioned as the validation data. This process was repeated five times, guaranteeing that each spatial location was utilized as the validation set precisely once.
- (3)
- Spatial Independence Assurance: Since the division unit is the spatial location rather than individual samples, all samples from the same location invariably belong to the same subset, ensuring complete spatial independence between the training and validation sets. In this dataset, each location has an average of merely 1.01 samples, leading to an extremely low risk of data leakage due to spatial autocorrelation. The implementation of a rigorous spatial block cross-validation strategy demonstrates methodological rigor.
3.2. Feature Importance Ranking Based on the SHAP Interpretation Framework
3.3. Performance Evaluation Metrics
4. Results
4.1. Analysis and Interpretation of Forest Fire Risk Factors
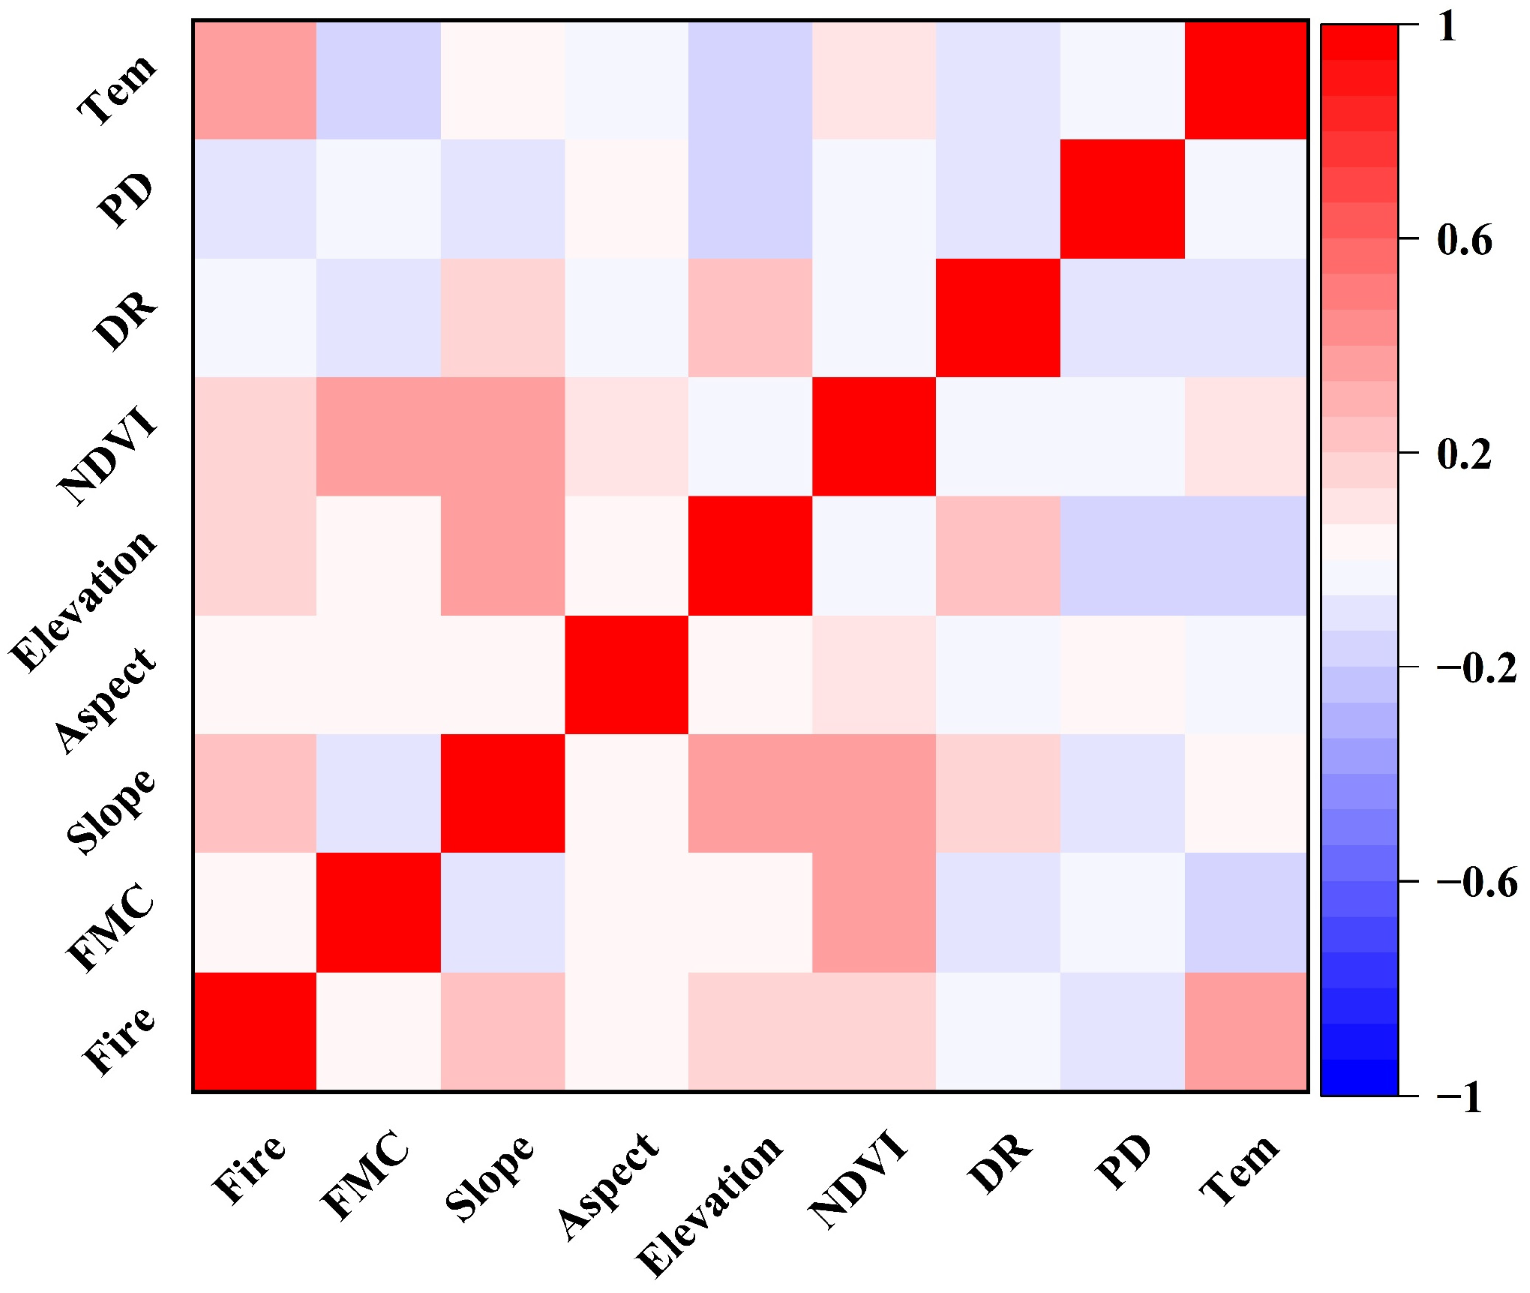
4.1.1. Correlation Analysis
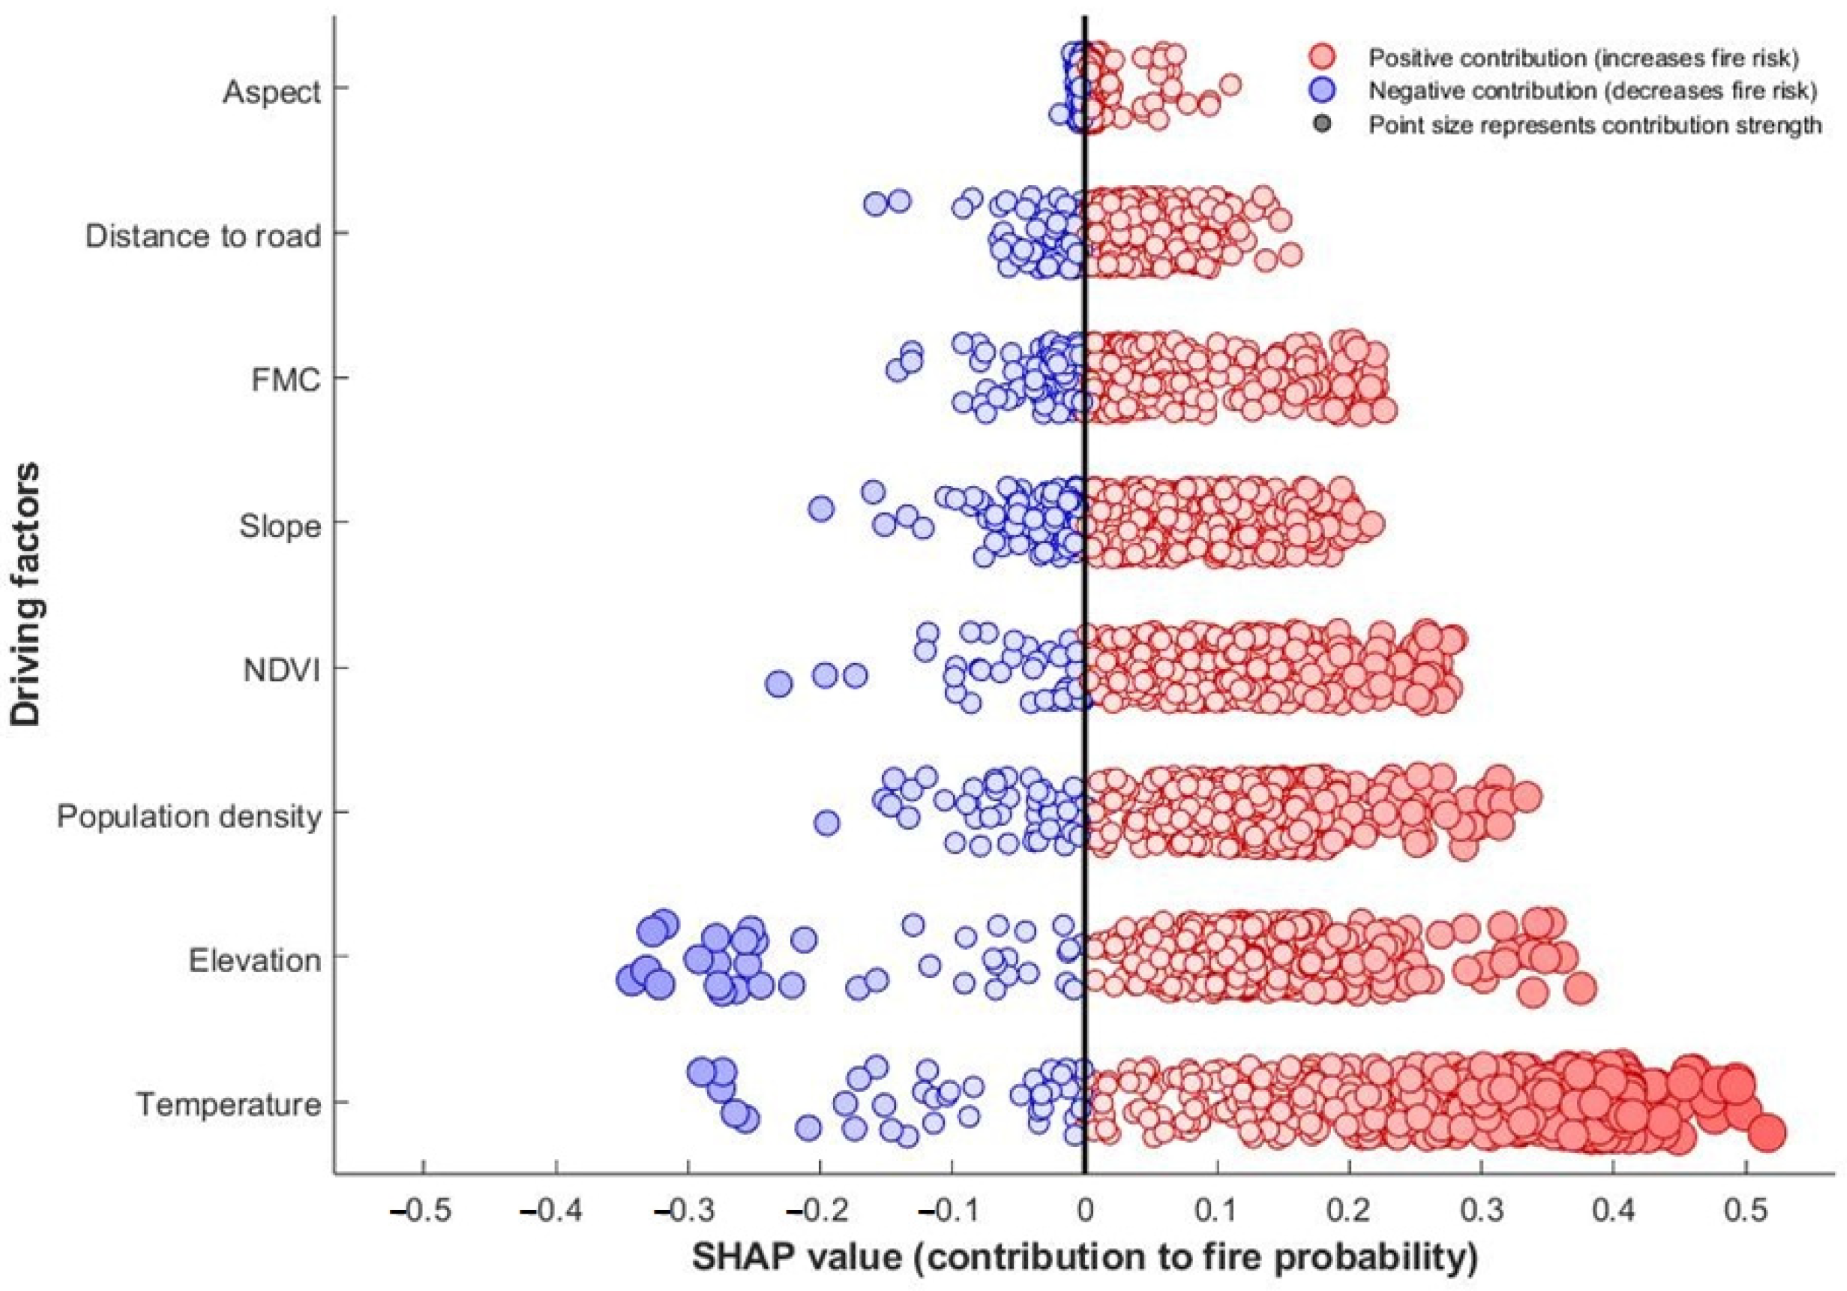
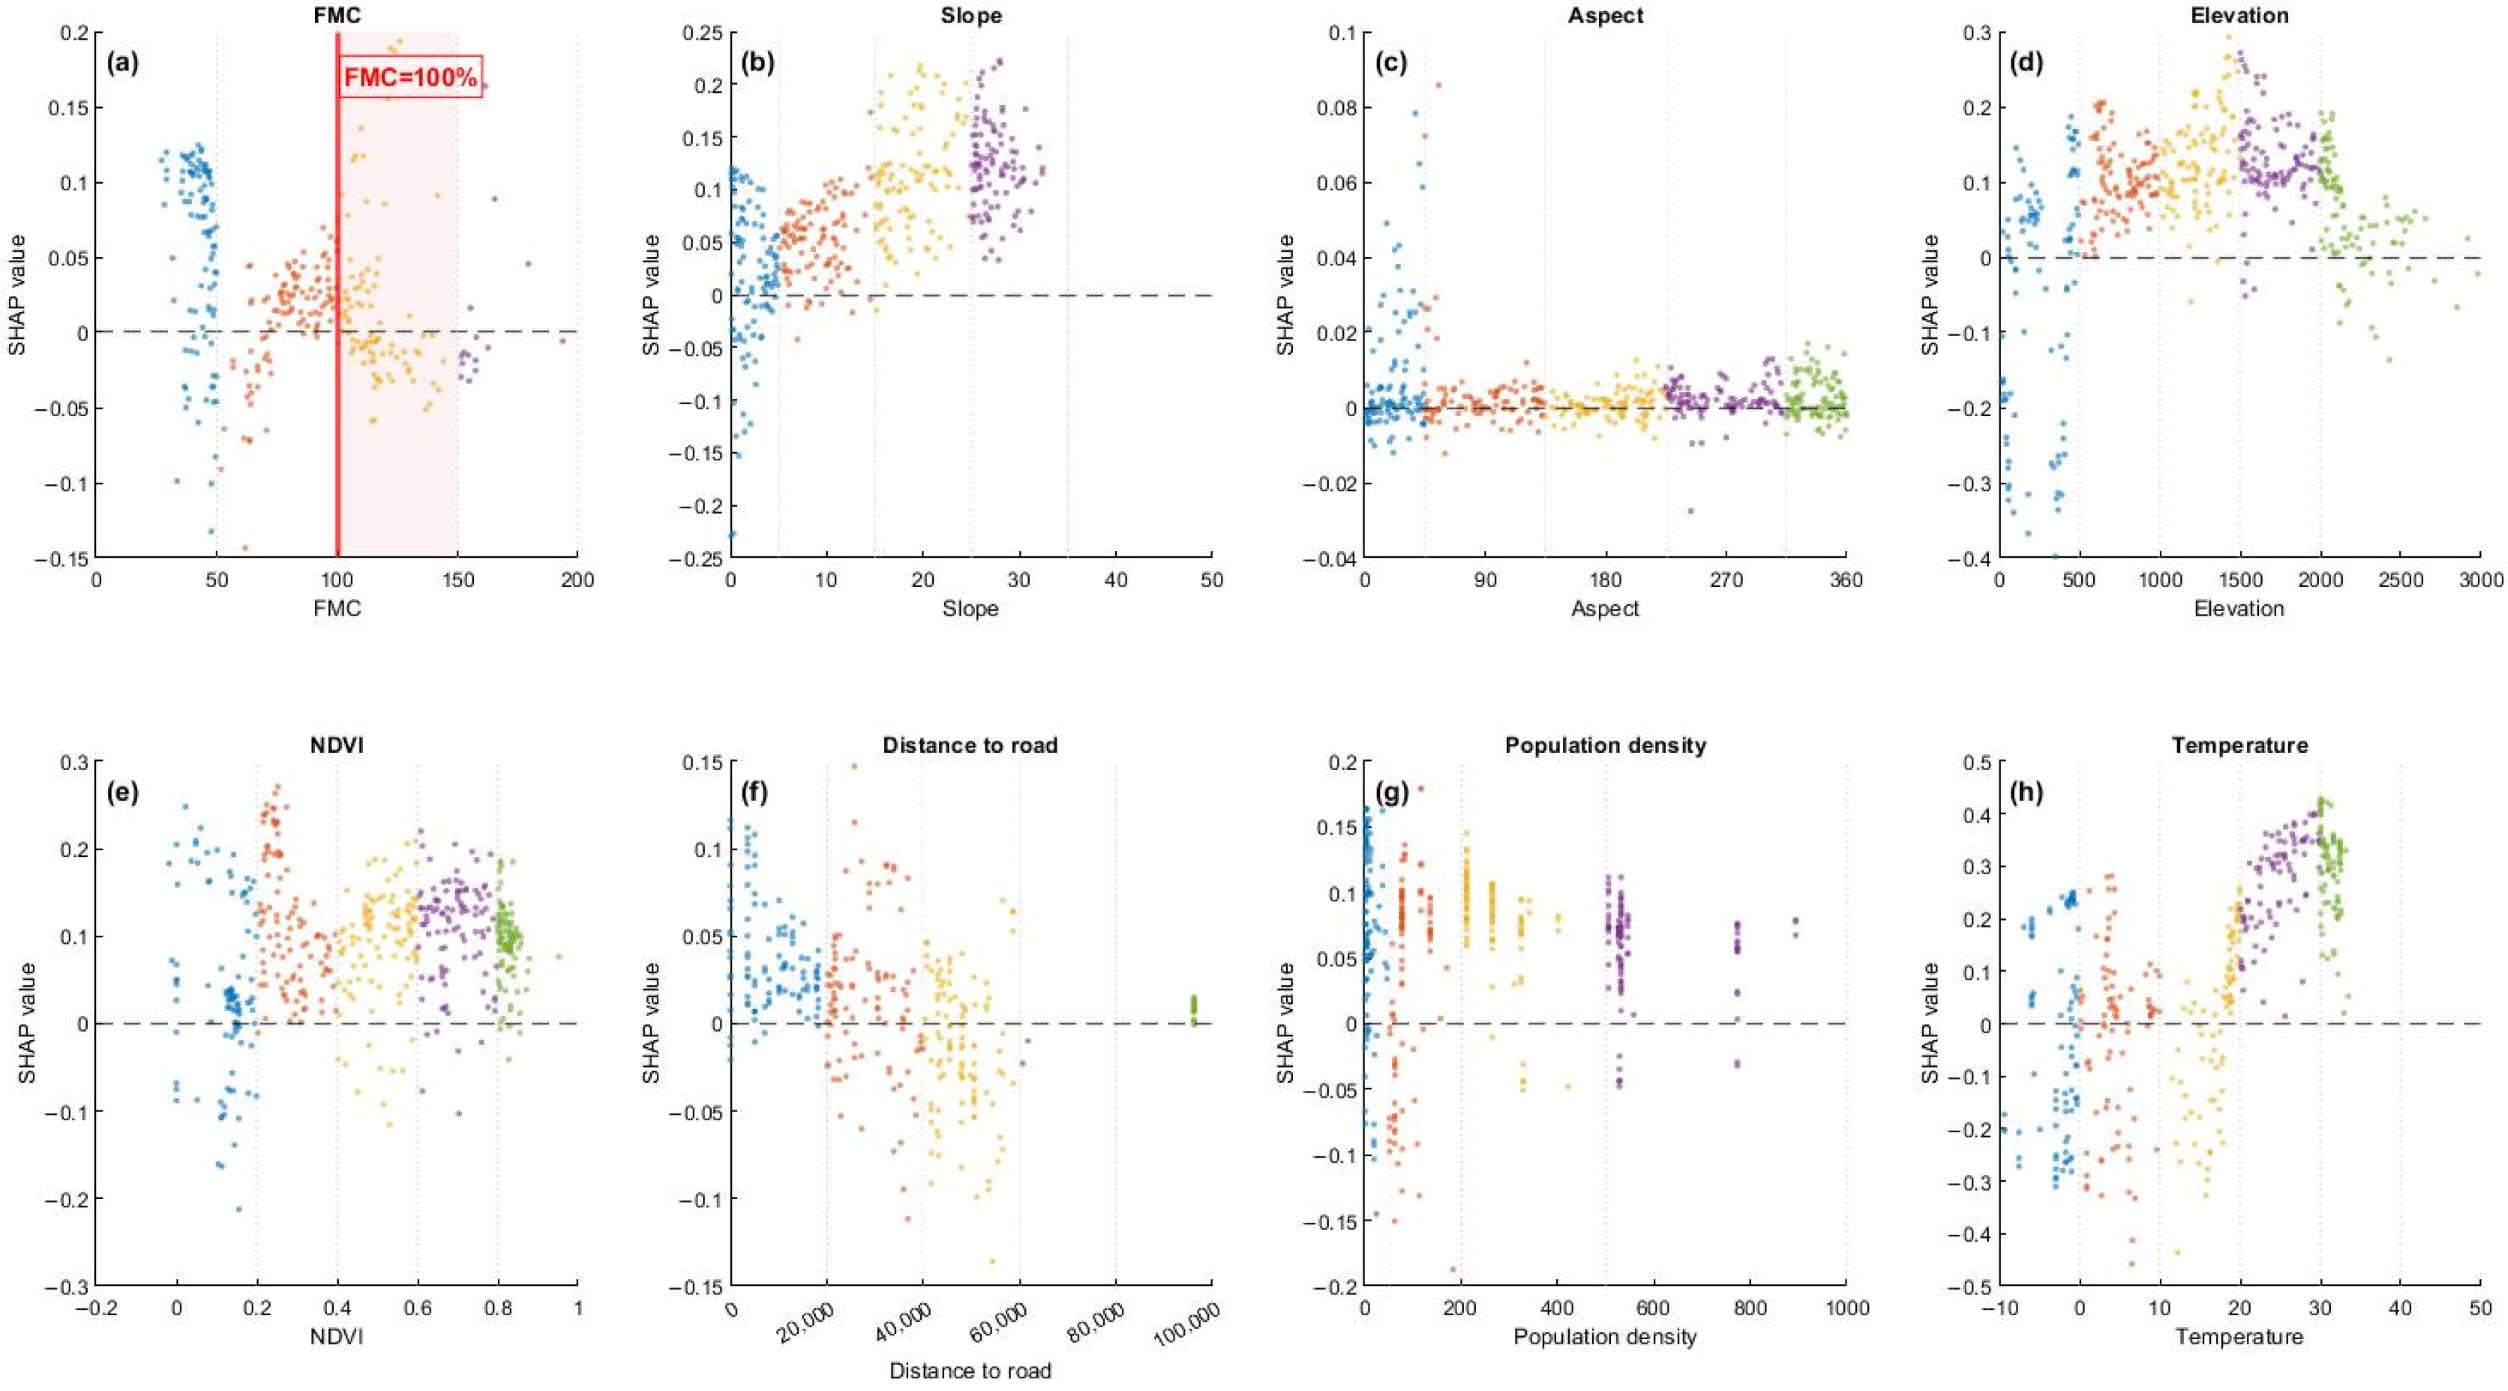
4.1.2. Feature Importance and Interpretation of Key Factors
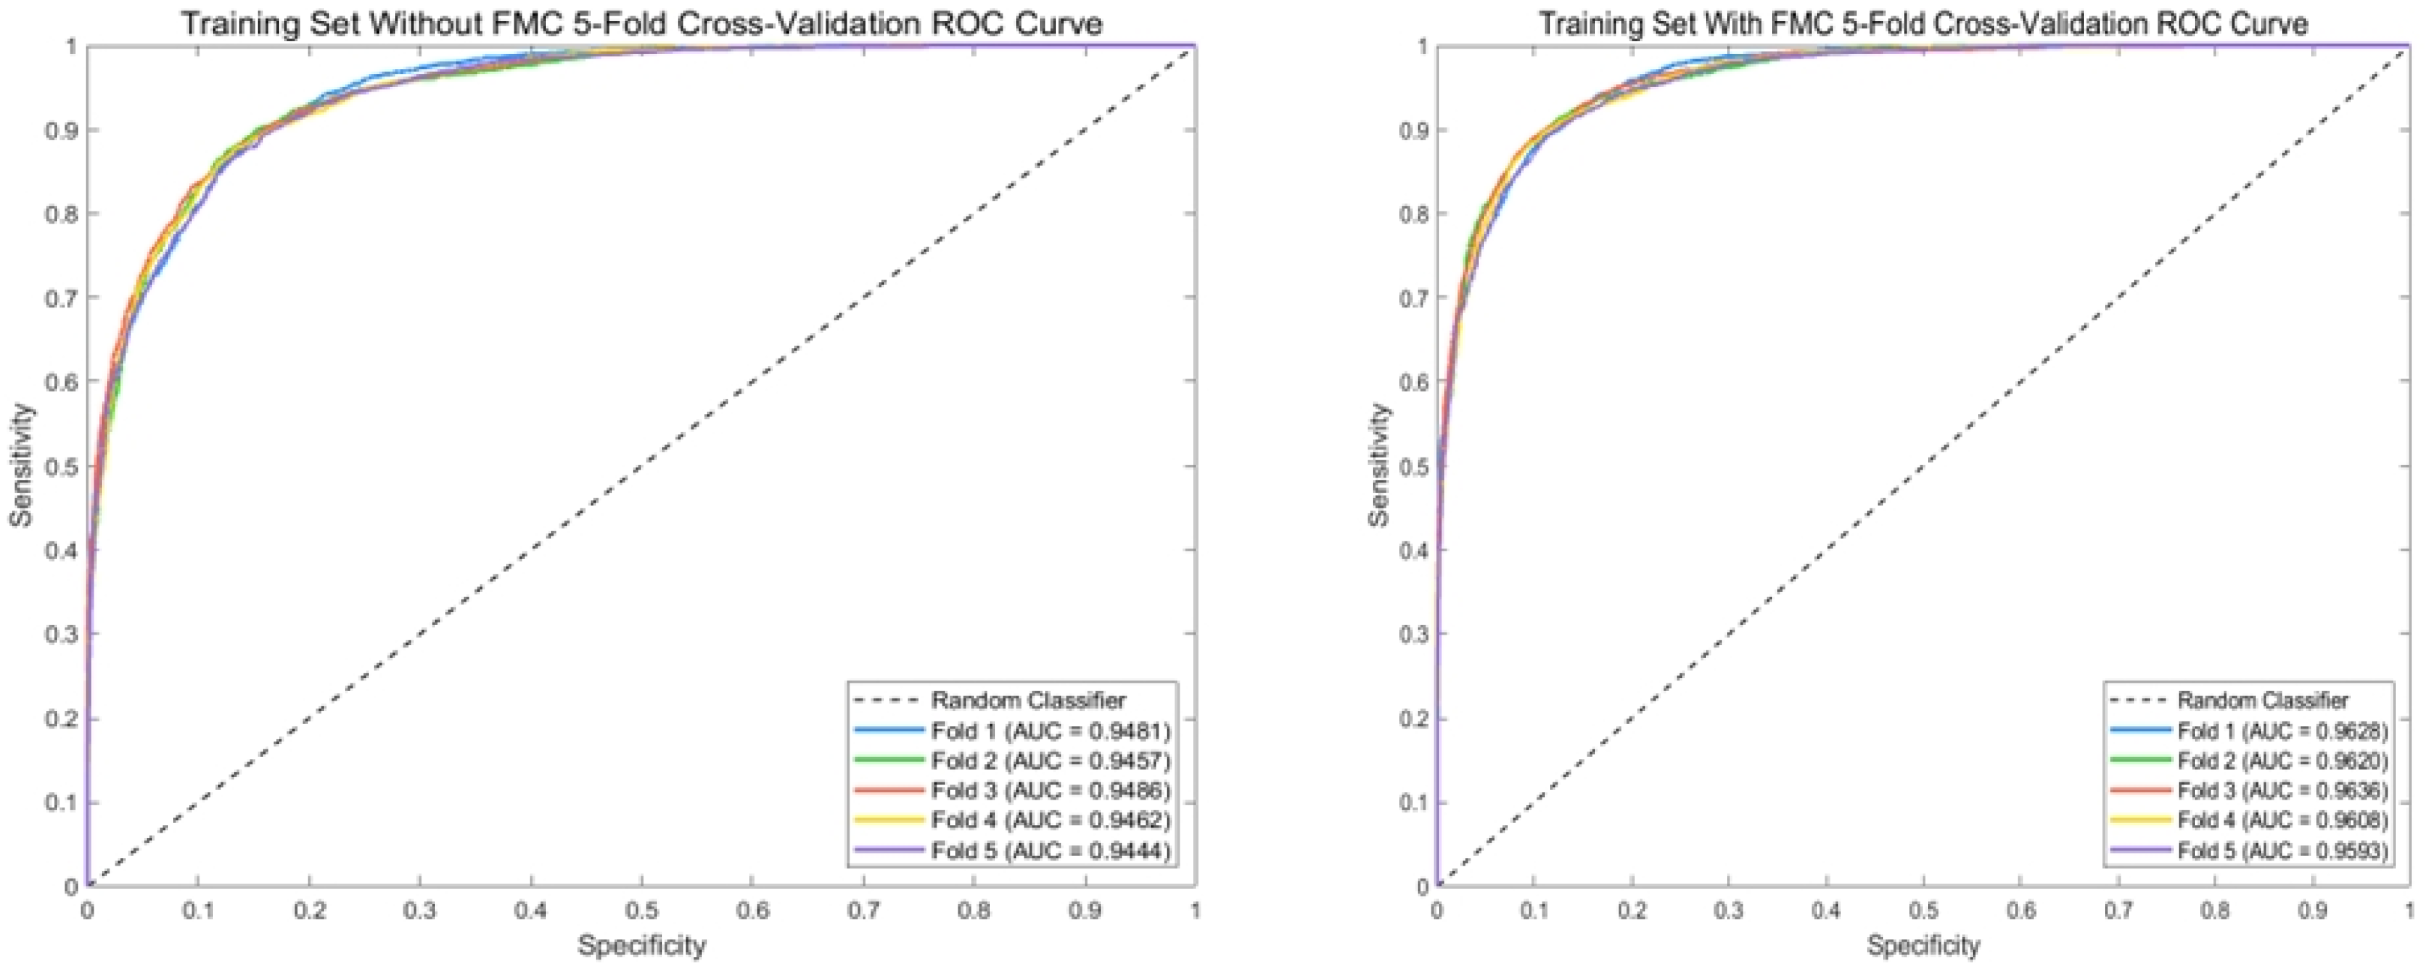
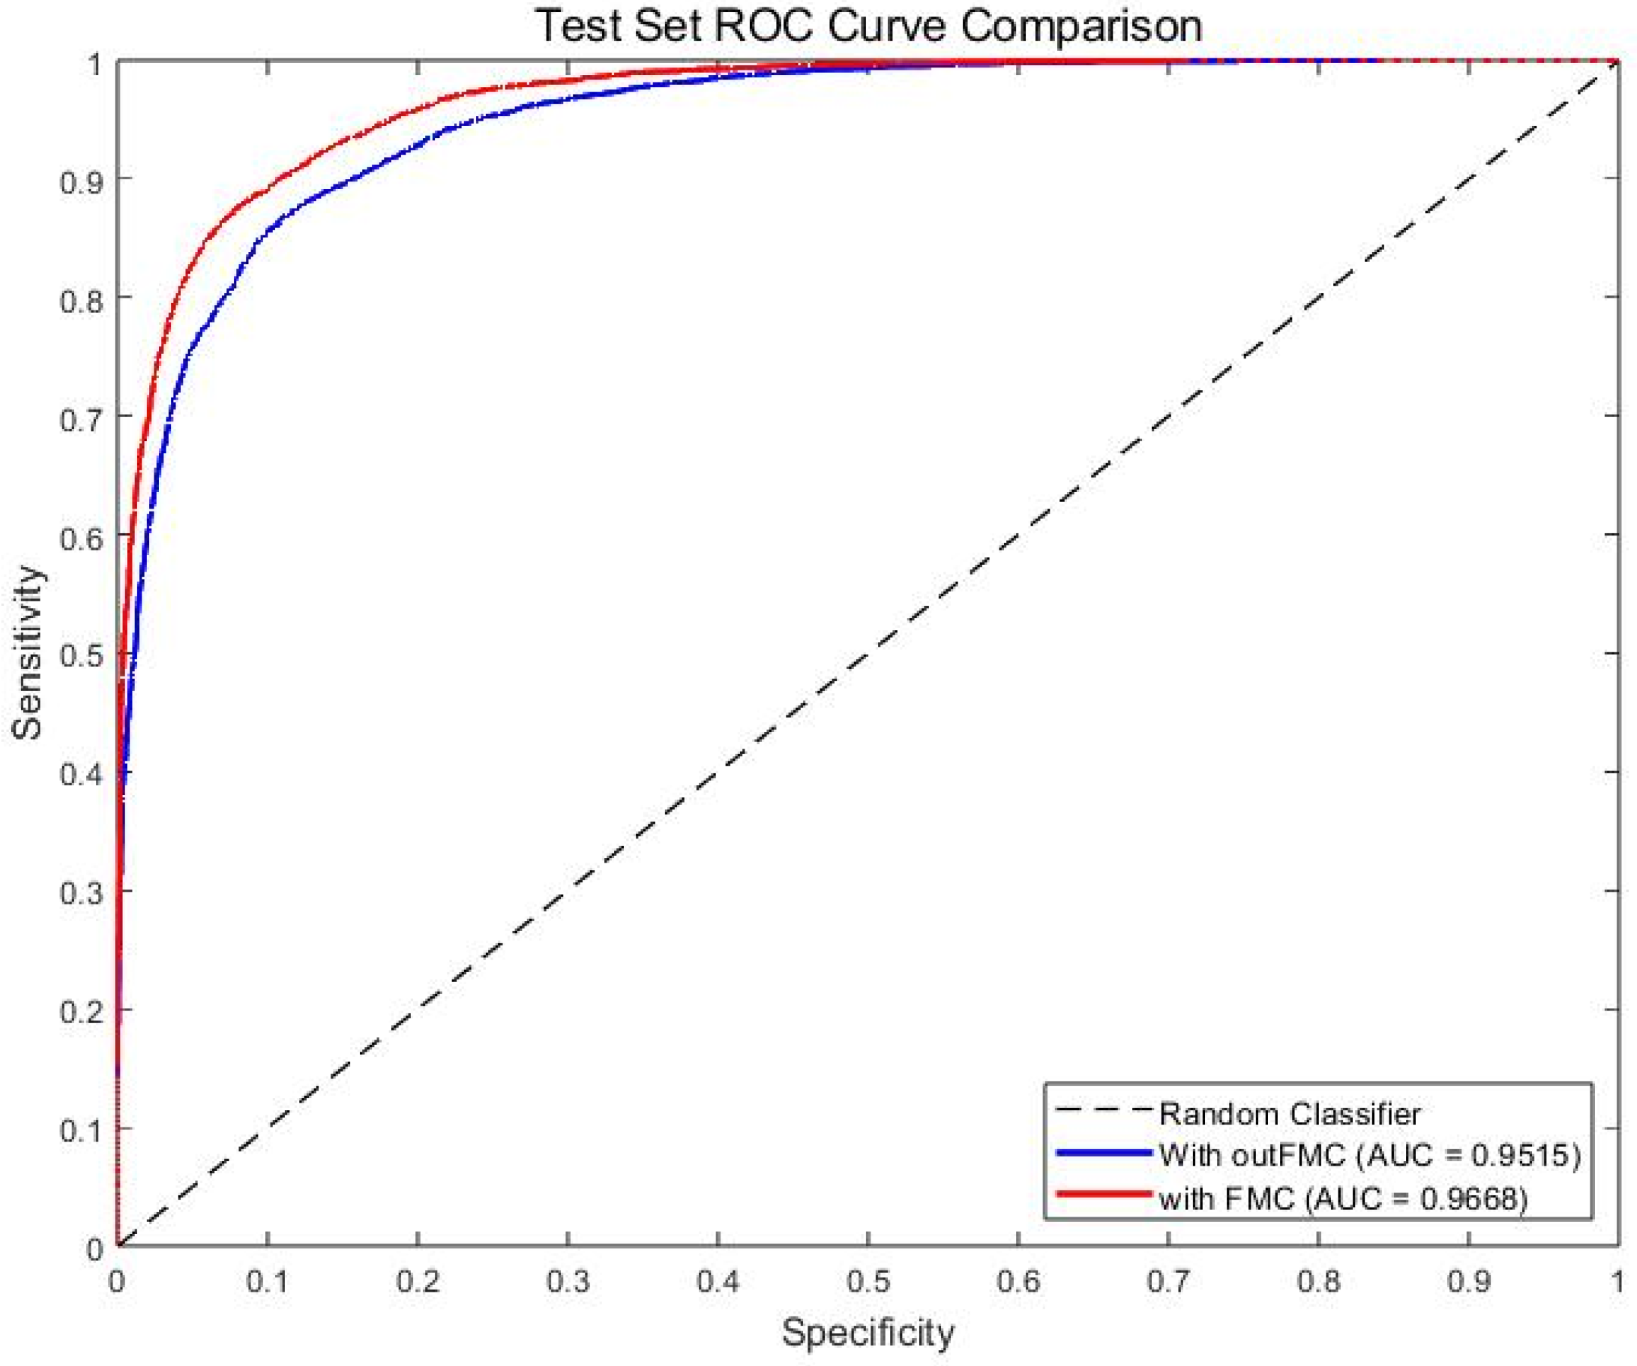
4.2. Modeling Results
4.3. Probability of Forest Fire Occurrence
5. Discussion
5.1. Physical Linkage Between FMC and Fire Occurrence: Empirical Evidence from Typical Fire Cases
5.2. Enhancement Effect of Dynamic FMC on Model Performance and Mechanistic Interpretation
5.3. Synergistic Effects and Regional Specificity of Wildfire Drivers
5.4. Limitations and Future Directions
6. Conclusions
- (1)
- Dynamic FMC significantly improves model performance. Compared with the baseline model without FMC, the incorporation of FMC increases accuracy, precision, recall, specificity, and F1 score by 2.21%, 3.93%, 0.37%, 3.60%, and 0.0223, respectively, indicating that dynamic FMC can effectively enhance the model’s ability to identify non-fire points. This is crucial for minimizing false positives.
- (2)
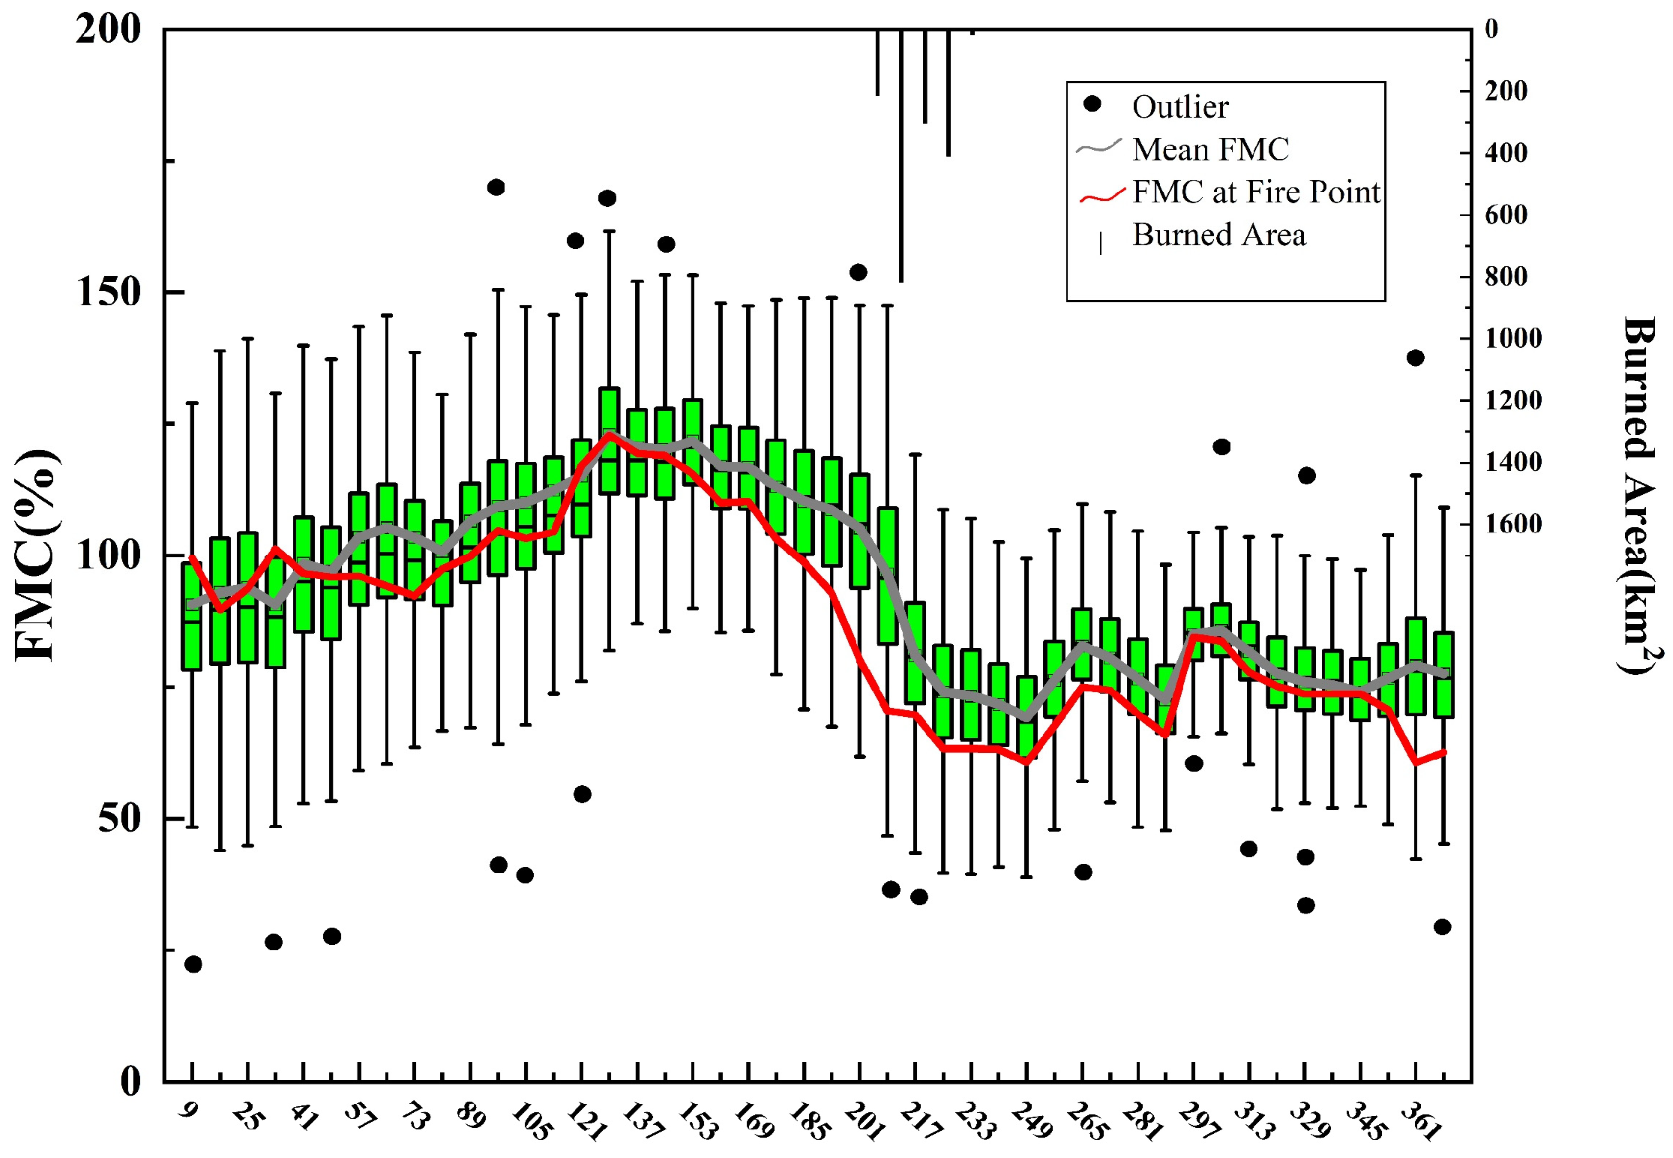
- FMC functions as a leading indicator of wildfire risk. Case analyses demonstrate that a sharp decrease in FMC precedes wildfire outbreaks by approximately 4–6 weeks. Its temporal pattern—pre-fire drought accumulation, consistently low levels during fire events, and delayed post-fire recovery—emphasizes its role as a key connection between meteorological conditions and fuel status. This dynamic behavior enables the model to capture not only the locations with high risk but also the times when the risk is likely to increase, reflecting the nonlinear amplification of the heat–dryness coupling mechanism.
- (3)
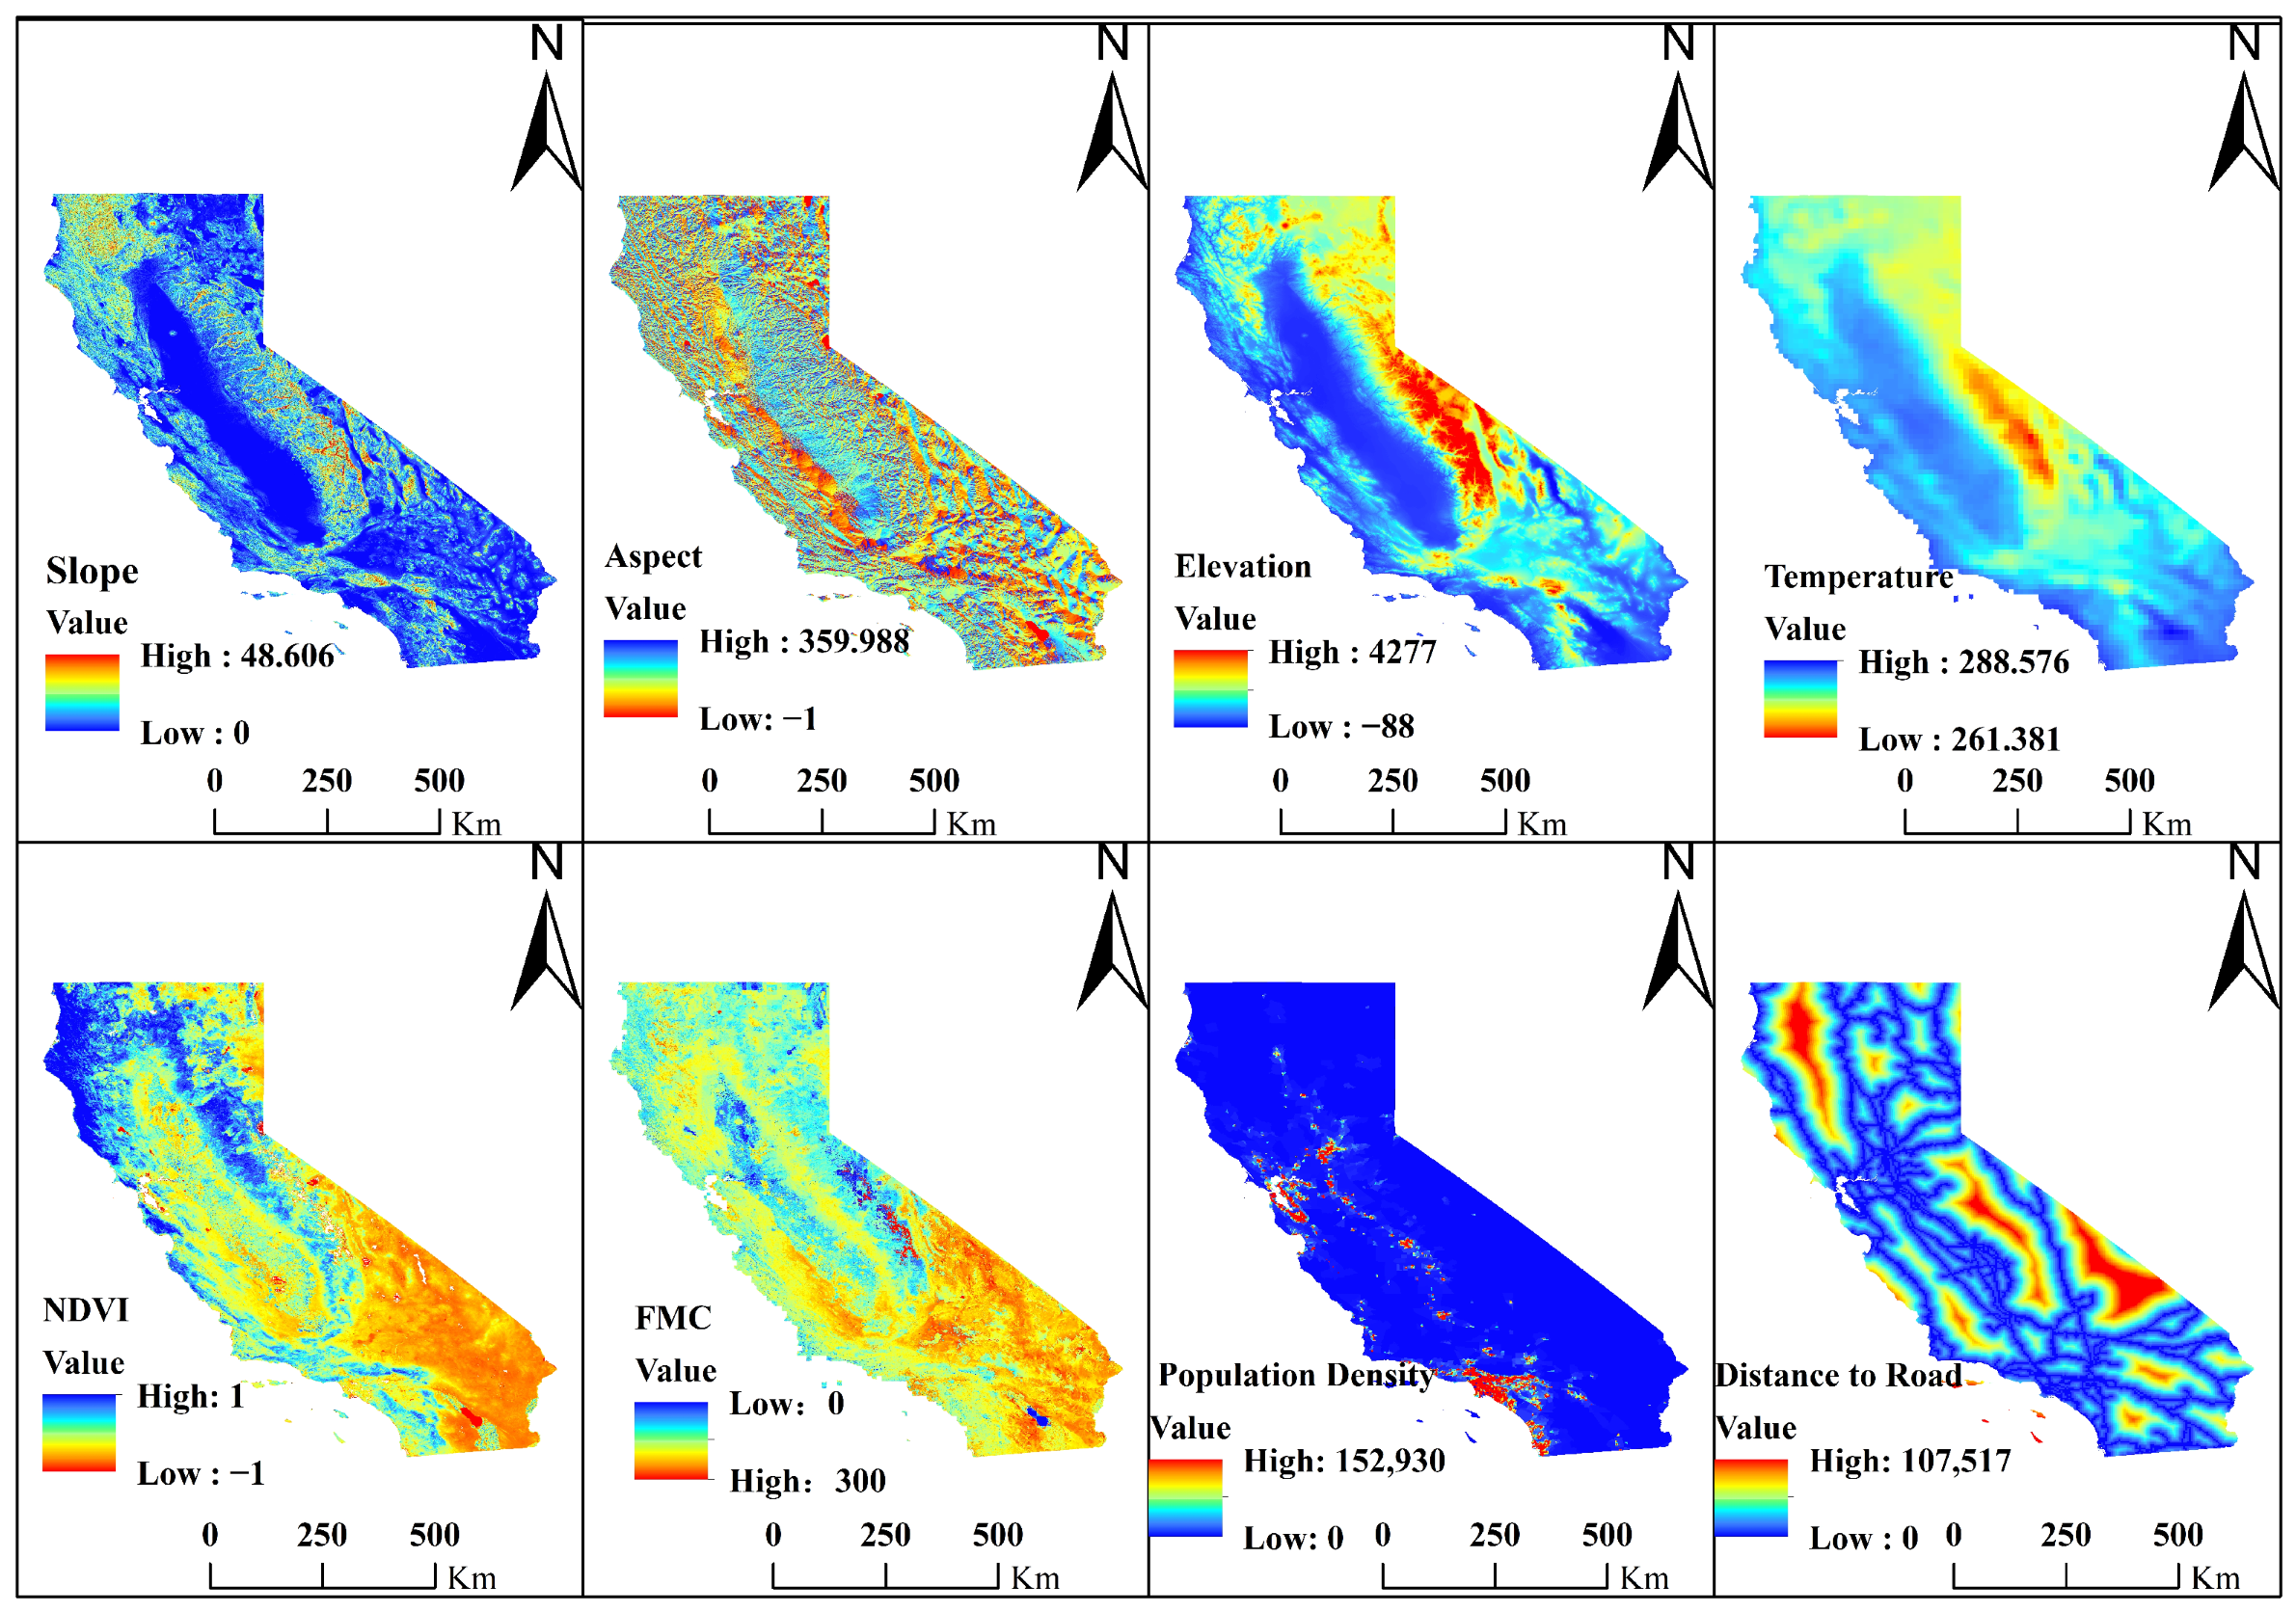
- The synergistic effects of factors contributing to wildfires are elucidated. Temperature is recognized as the predominant factor, directly promoting combustion and indirectly exacerbating vegetation water stress due to its inverse relationship with the FMC. Topographic factors, namely slope and elevation, determine the spatial distribution of high-risk areas by affecting vegetation and the microclimate. Population density reflects the dual influence of human activities, serving both as an ignition source and a regulator of fire risk. The low collinearity among variables (correlation coefficients < 0.4) guarantees that FMC can be effectively employed as an independent information source.
- (4)
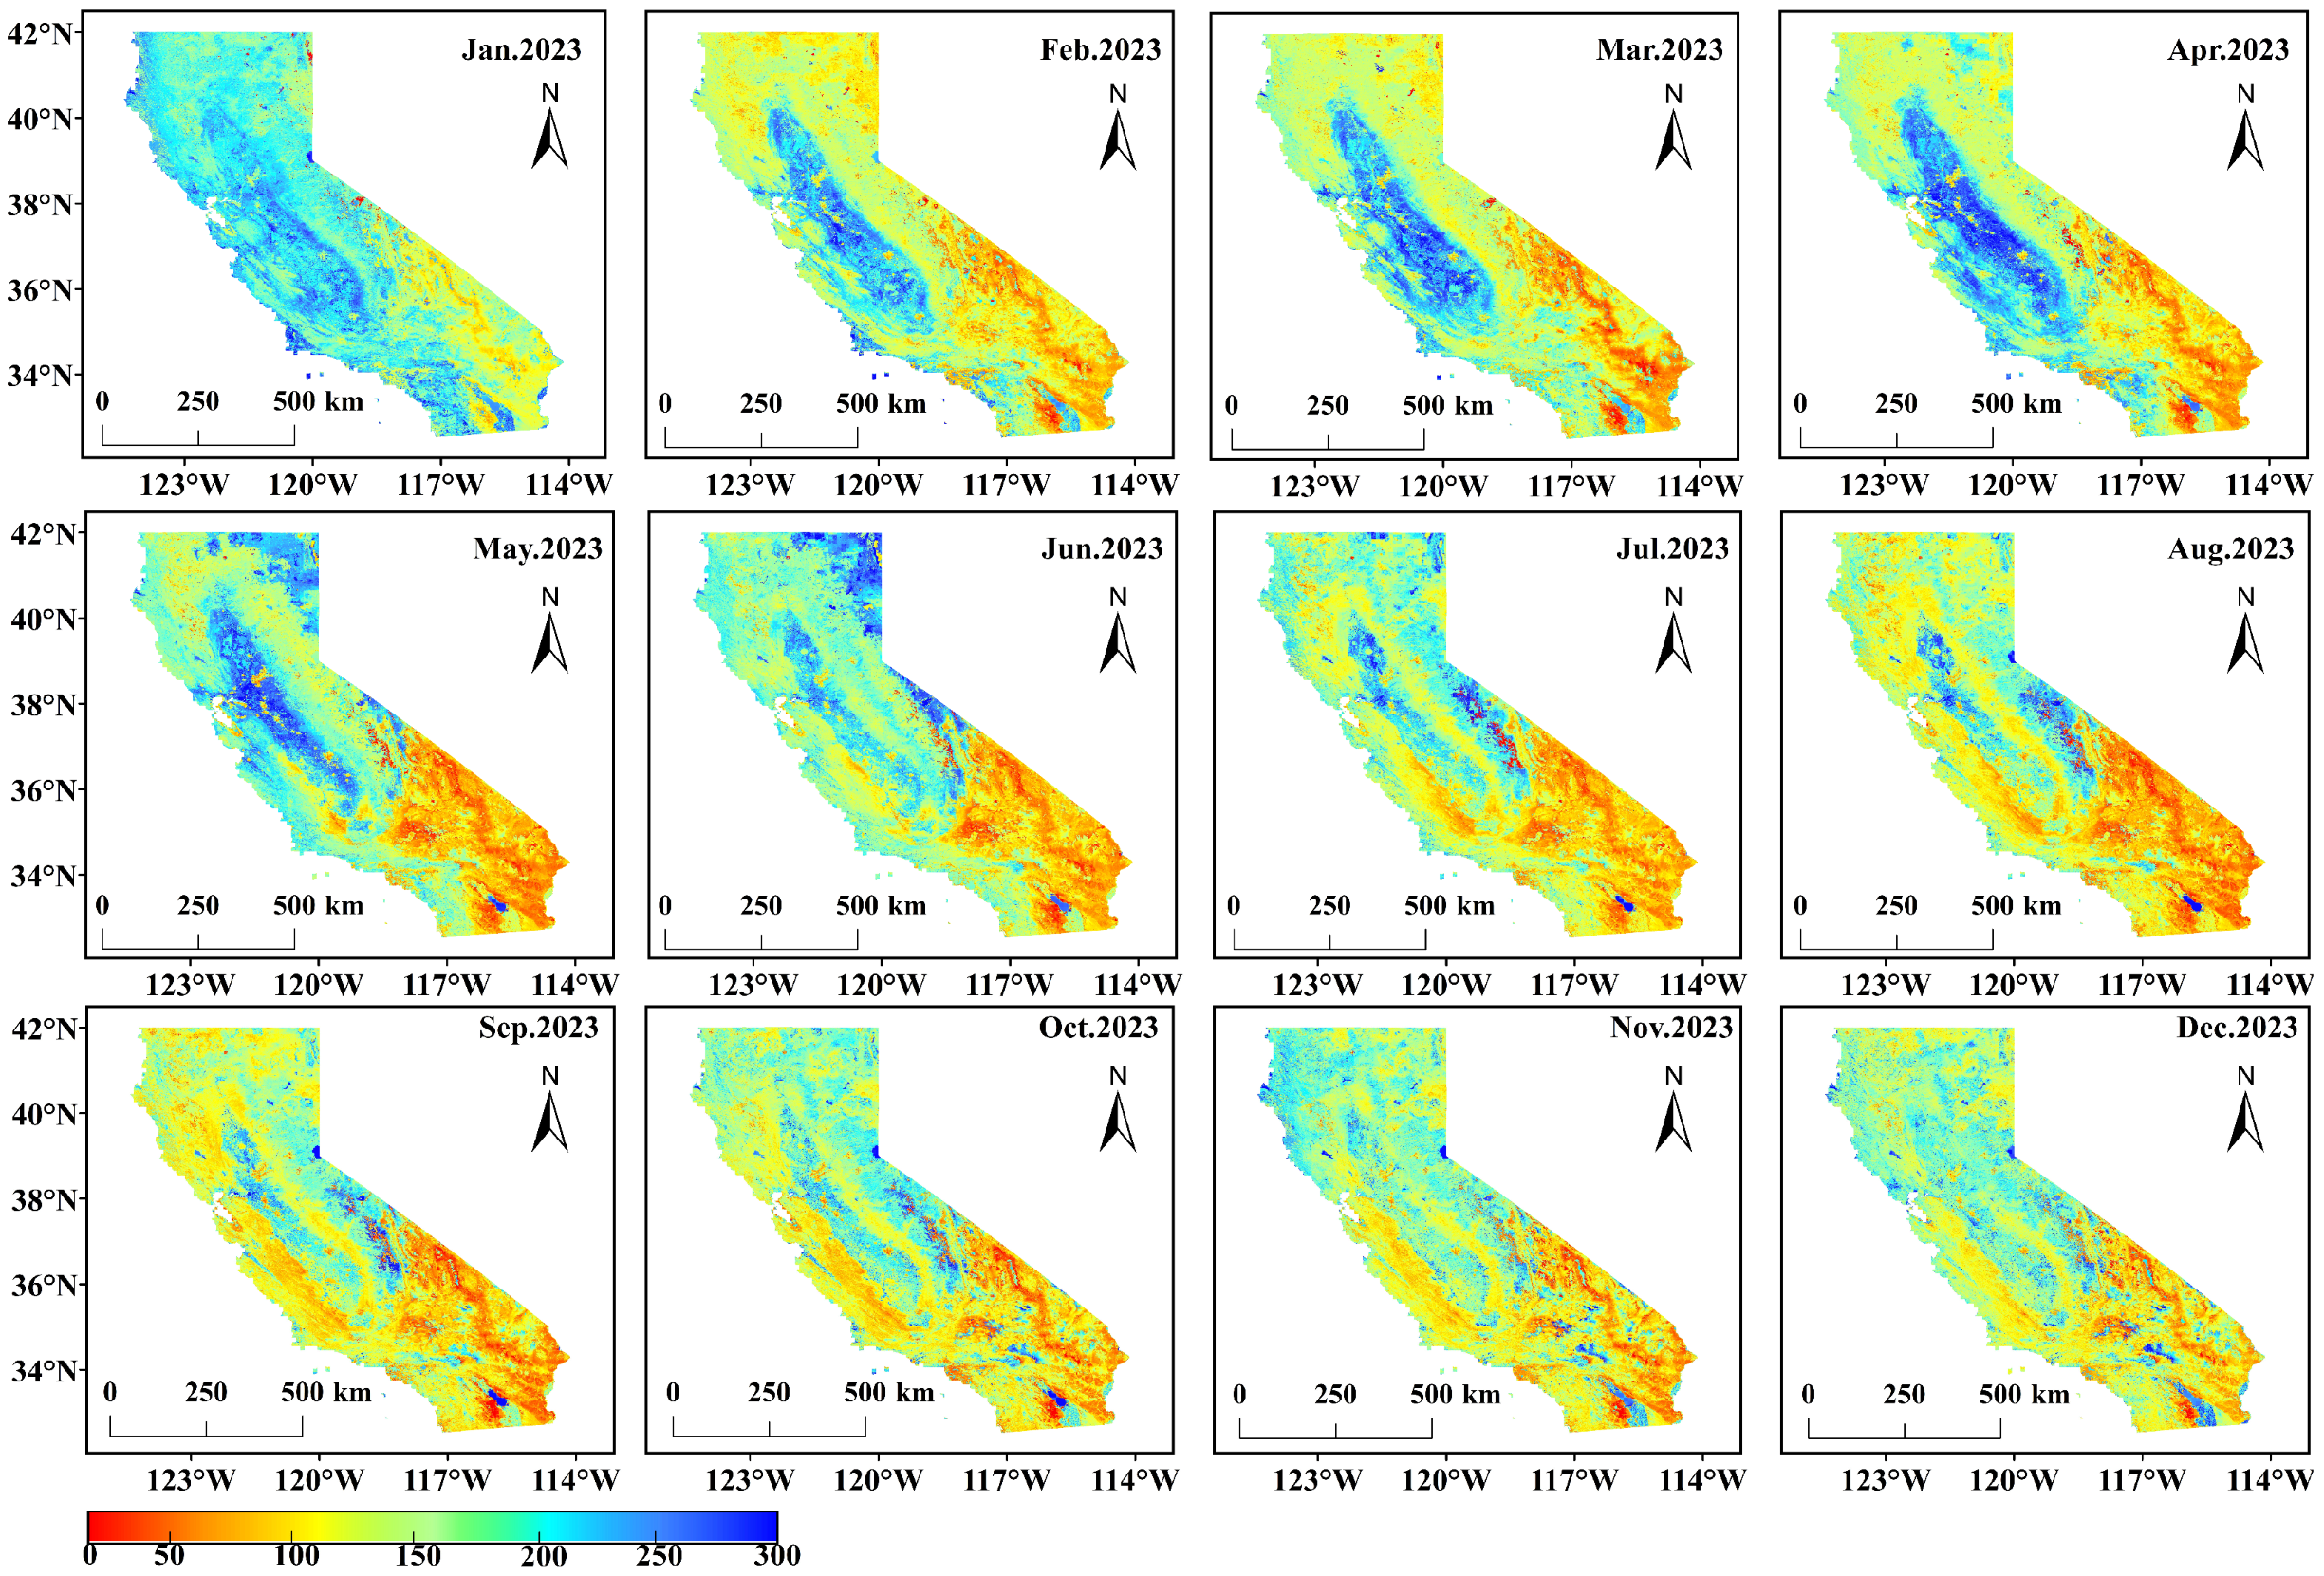
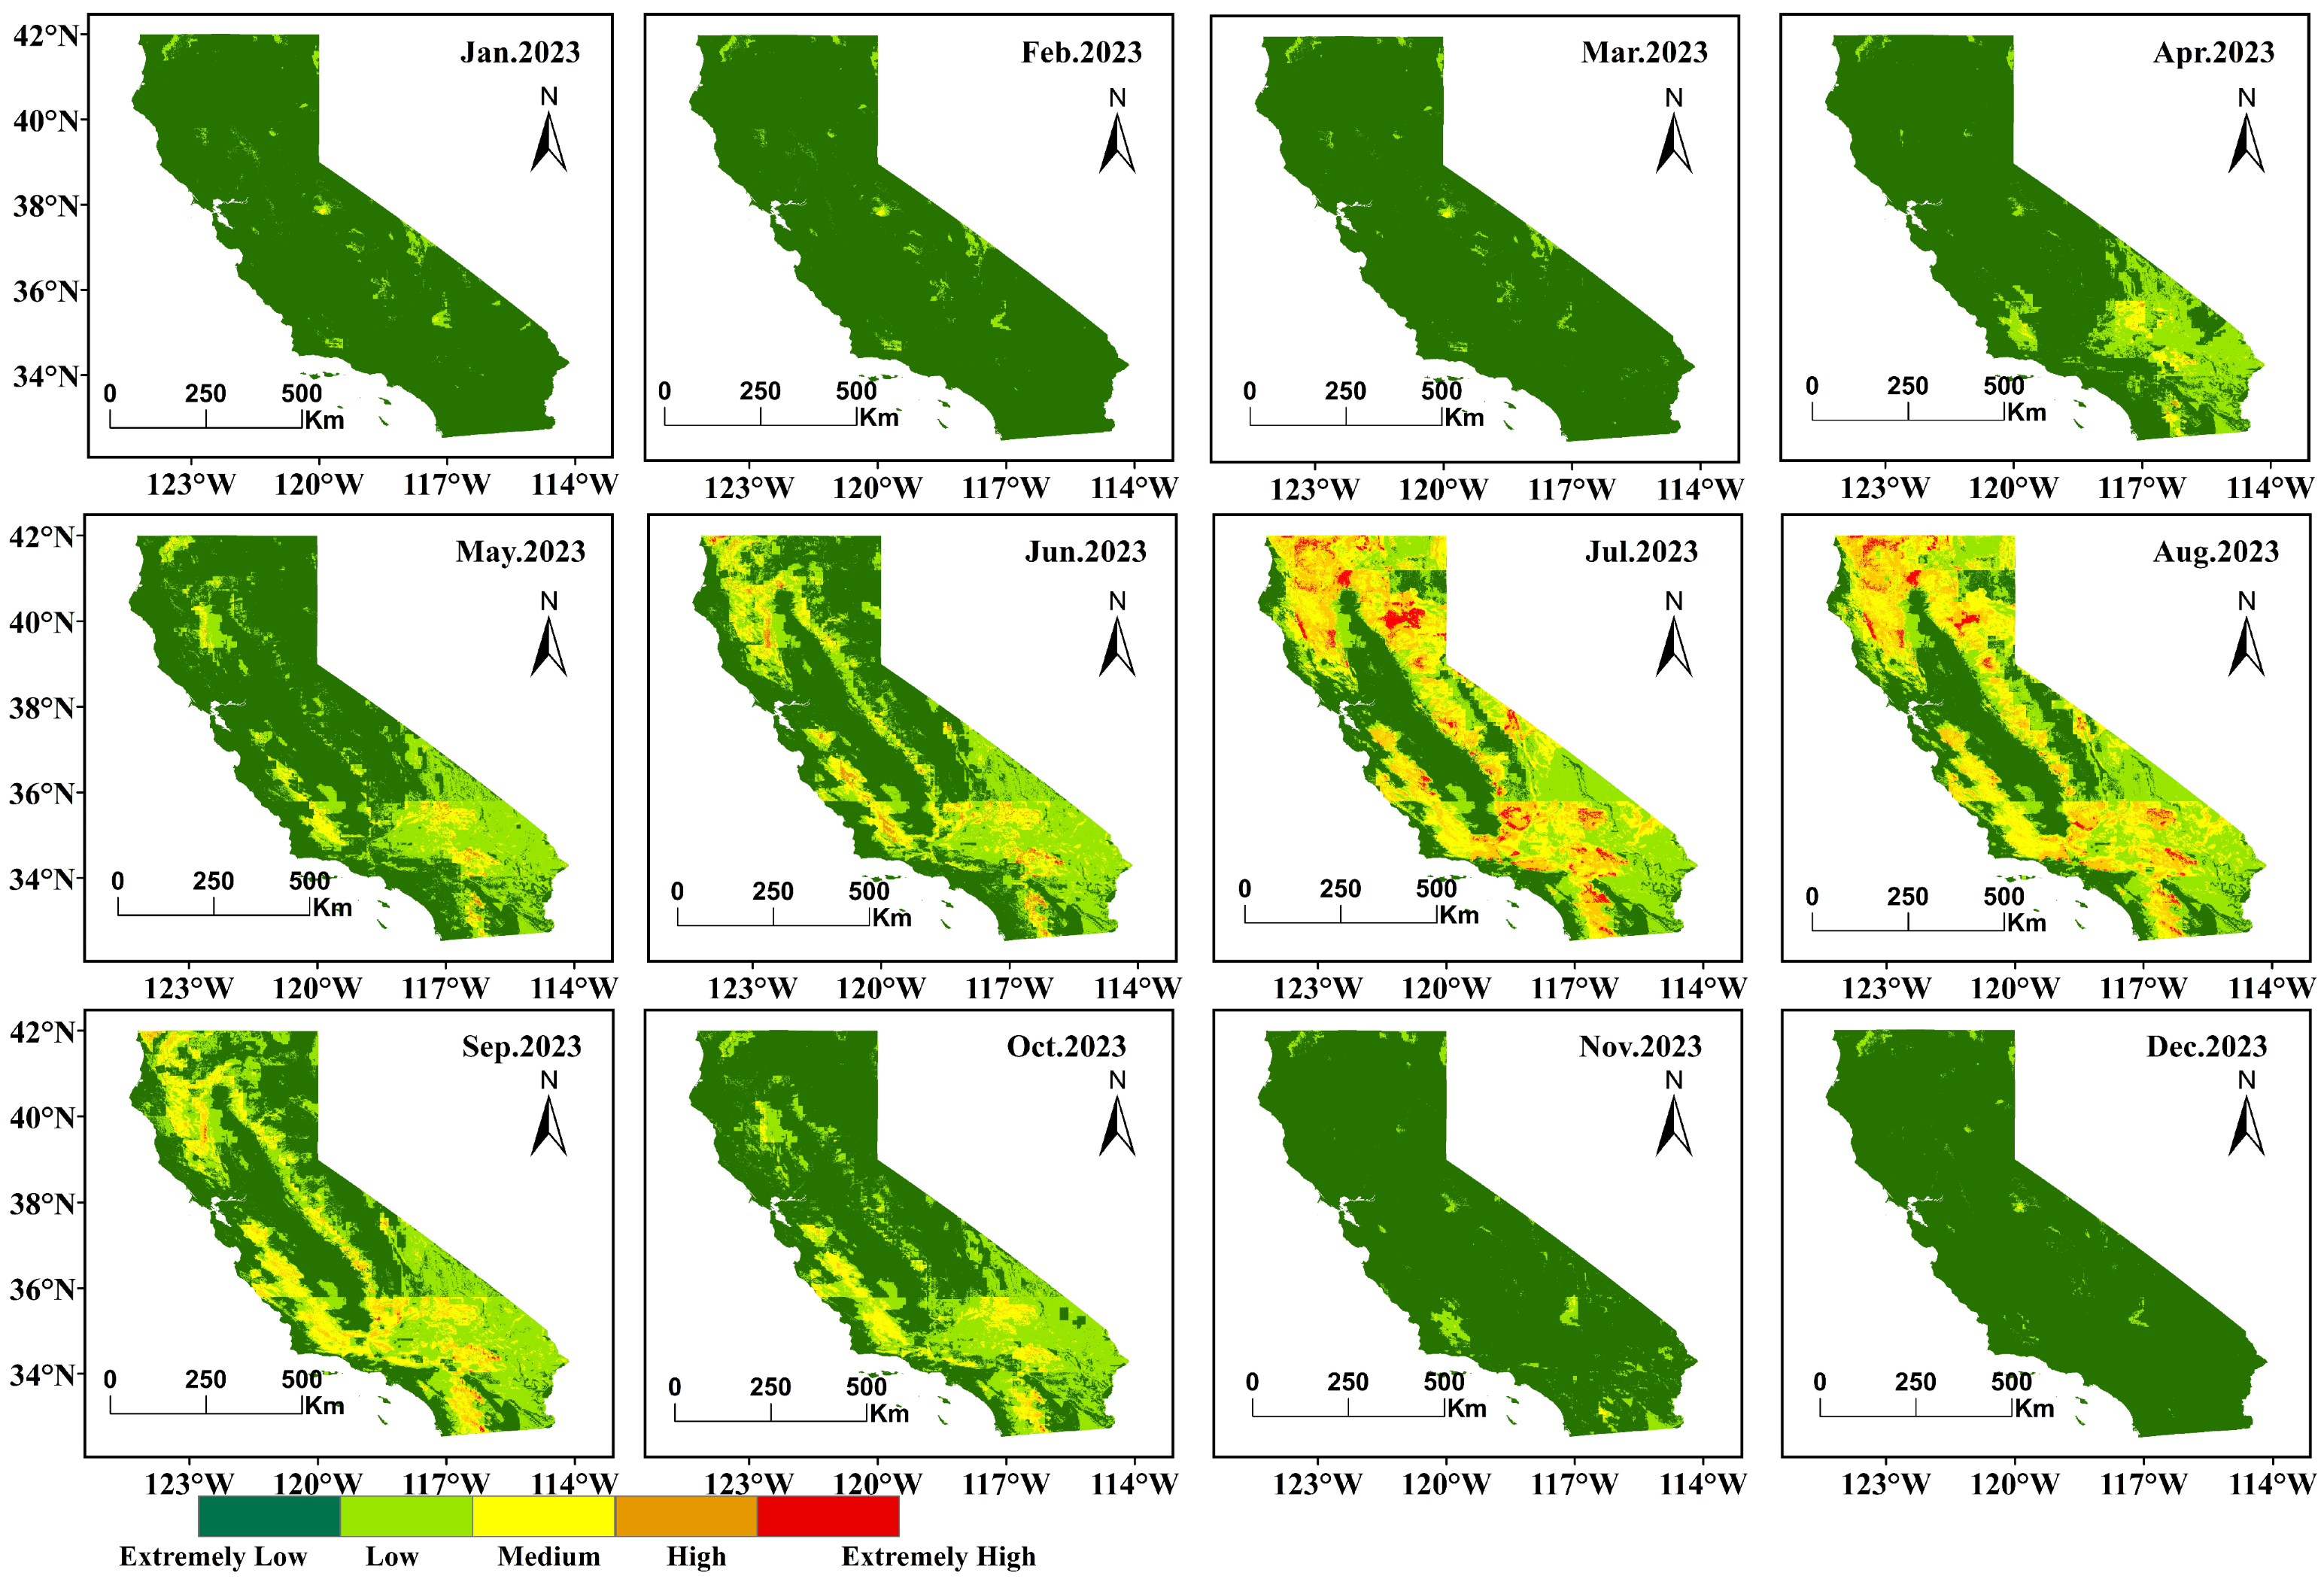
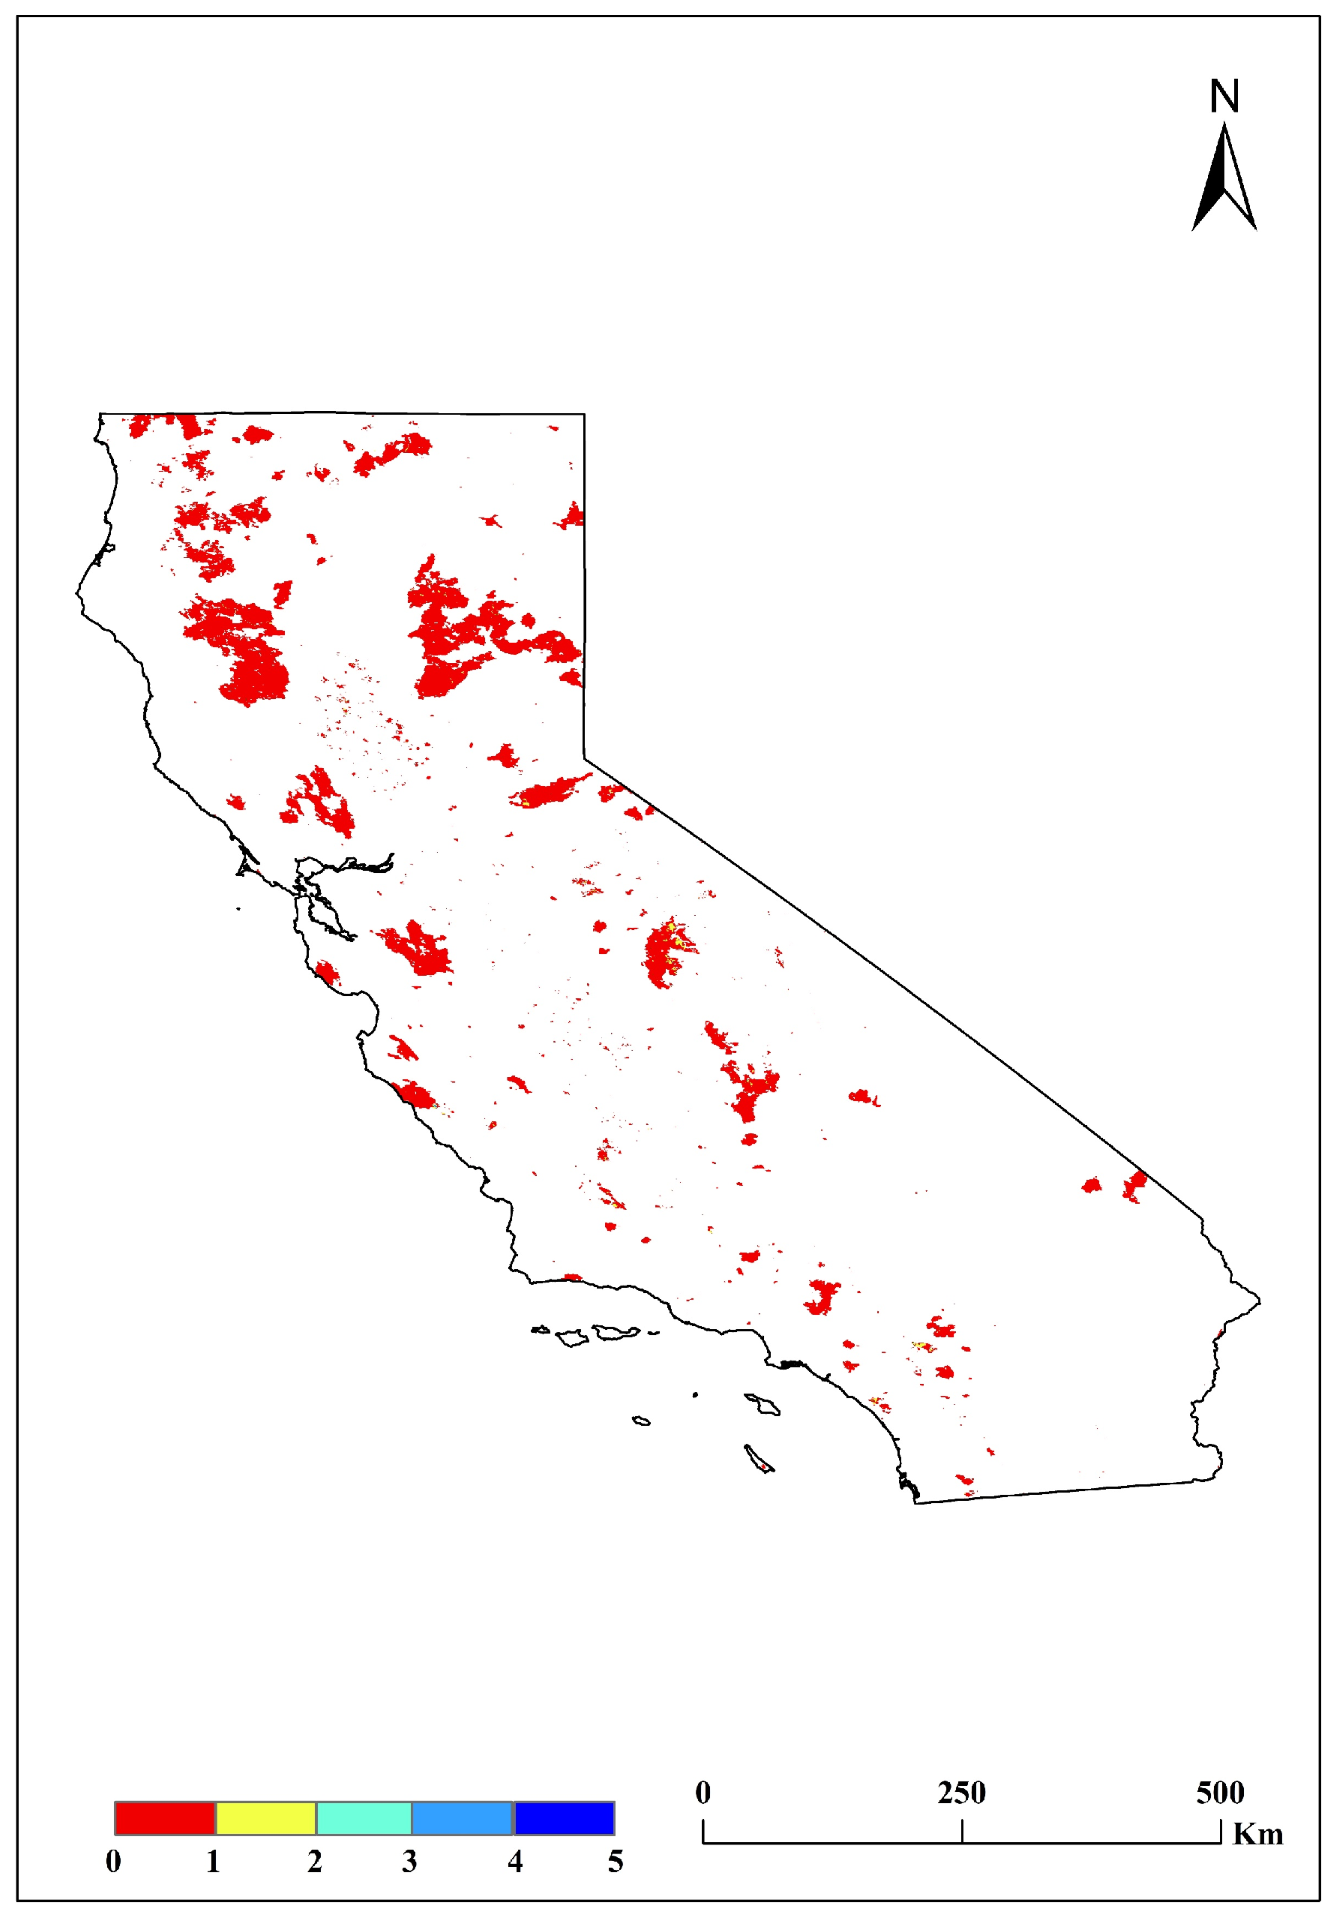
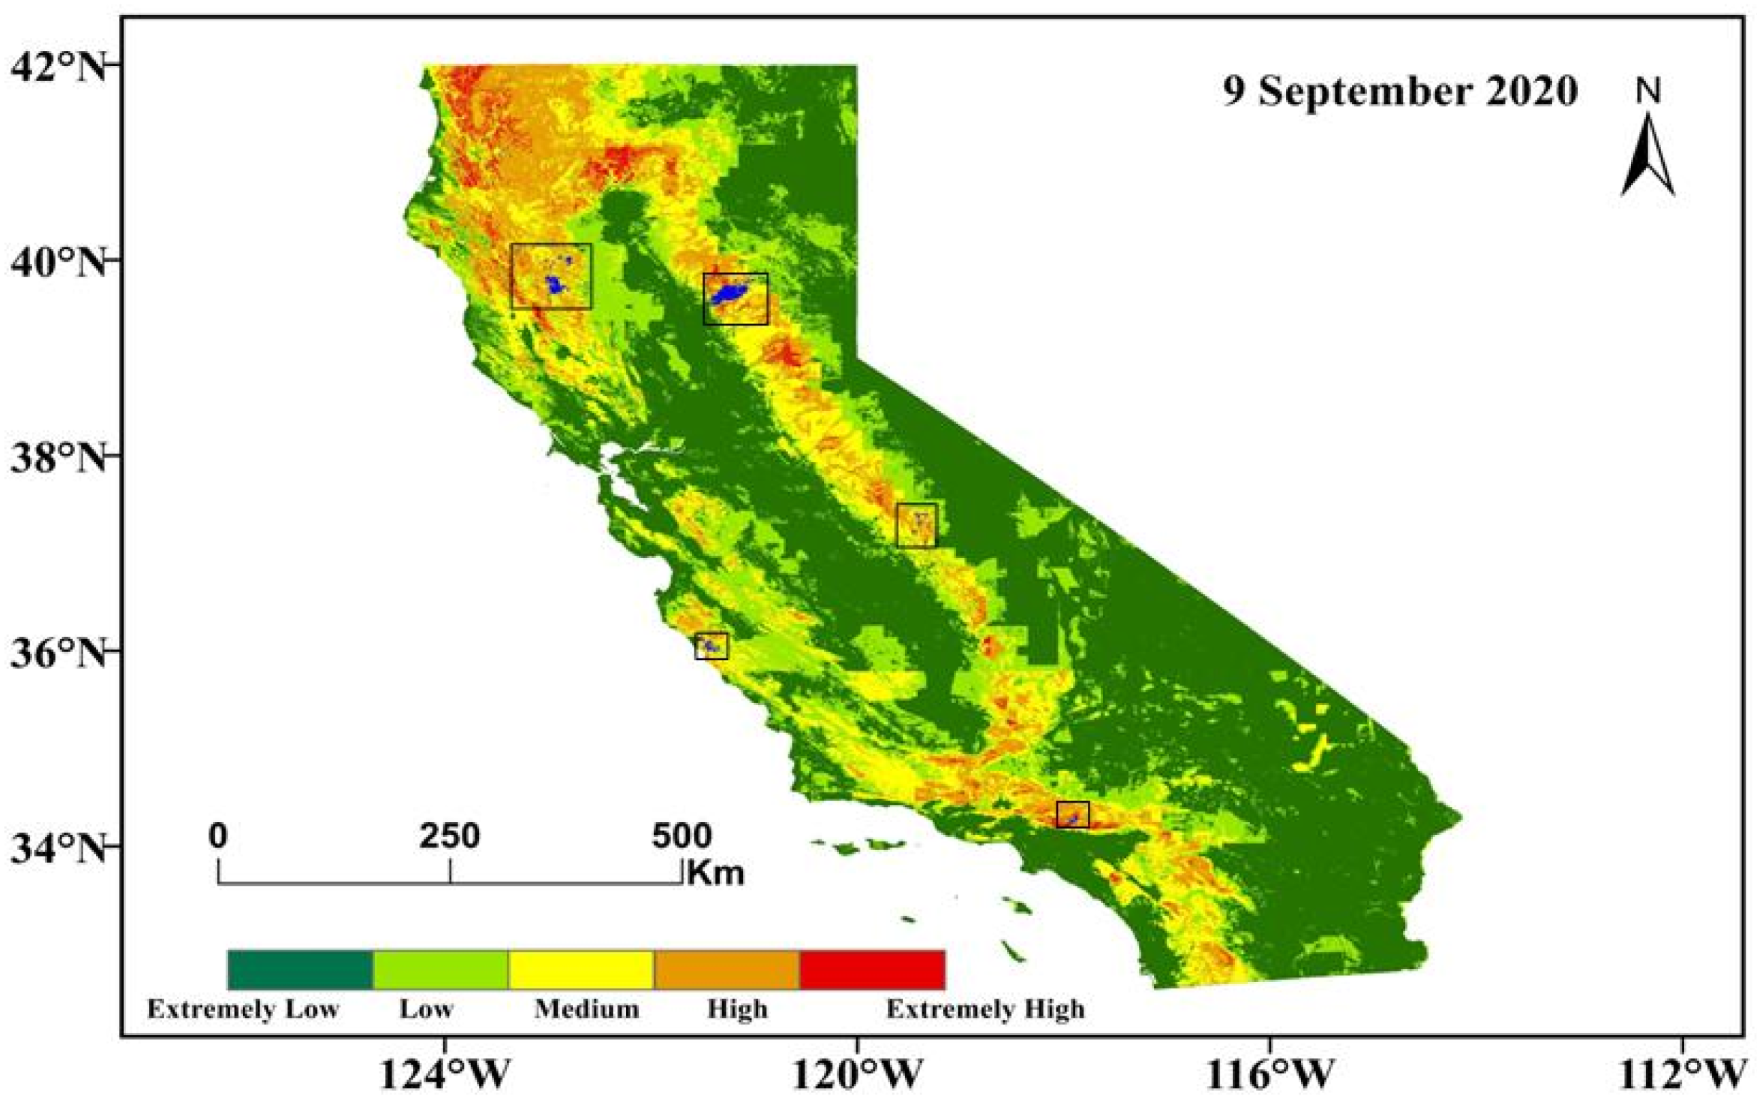
- The model exhibits a robust capacity for regional-scale dynamic risk mapping. The monthly wildfire risk maps for California in 2023 effectively capture the complete seasonal cycle of wildfire risk, from the spring build-up to the summer peak and the autumn decline. The spatial distribution of high-risk areas is highly consistent with historical fire occurrence patterns, indicating the model’s potential for accurate early warning and optimized fire management in regions with a Mediterranean climate.
Author Contributions
Funding
Data Availability Statement
Acknowledgments
Conflicts of Interest
References
- Agee, J.K.; Finney, M.; Gouvenain, R.D. Forest fire history of desolation peak, Washington. Can. J. For. Res. 1990, 20, 350–356. [Google Scholar] [CrossRef] [Scilit]
- Littell, J.S.; Peterson, D.L.; Riley, K.L.; Liu, Y.; Luce, C.H. A review of the relationships between drought and forest fire in the United States. Glob. Change Biol. 2016, 22, 2353–2369. [Google Scholar] [CrossRef] [Scilit]
- Bonazountas, M.; Kallidromitou, D.; Kassomenos, P.A.; Passas, N. Forest fire risk analysis. Hum. Ecol. Risk Assess. 2005, 11, 617–626. [Google Scholar] [CrossRef] [Scilit]
- Zhang, P.; Yan, P.; Liu, H. A Quantitative Analysis of Chinese and International Studies on Forest Fire Prediction from 2002 to 2019. J. Wildland Fire Sci. 2023, 41, 53–59. [Google Scholar]
- Pham, B.T.; Jaafari, A.; Avand, M.; Al-Ansari, N.; Dinh Du, T.; Yen, H.P.H.; Phong, T.V.; Nguyen, D.H.; Le, H.V.; Mafi-Gholami, D.; et al. Performance evaluation of machine learning methods for forest fire modeling and prediction. Symmetry 2020, 12, 1022. [Google Scholar] [CrossRef] [Scilit]
- Preisler, H.K.; Ager, A.A. Forest-Fire ModelsBased in part on the article “Forest fire models” by Haiganoush K. Preisler and David R. Weise, which appeared in the Encyclopedia of Environmetrics. Encycl. Environmetrics 2013. [Google Scholar] [CrossRef] [Scilit]
- Ning, J.; Liu, H.; Yu, W.; Deng, J.; Sun, L.; Yang, G.; Wang, M.; Yu, H. Comparison of different models to simulate forest fire spread: A case study. Forests 2024, 15, 563. [Google Scholar] [CrossRef] [Scilit]
- Zheng, S.; Gao, P.; Wang, W.; Zou, X. A highly accurate forest fire prediction model based on an improved dynamic convolutional neural network. Appl. Sci. 2022, 12, 6721. [Google Scholar] [CrossRef] [Scilit]
- Singh, K.R.; Neethu, K.; Madhurekaa, K.; Harita, A.; Mohan, P. Parallel SVM model for forest fire prediction. Soft Comput. Lett. 2021, 3, 100014. [Google Scholar] [CrossRef] [Scilit]
- Sun, X.; Li, N.; Chen, D.; Chen, G.; Sun, C.; Shi, M.; Gao, X.; Wang, K.; Hezam, I.M. A forest fire prediction model based on cellular automata and machine learning. IEEE Access 2024, 12, 55389–55403. [Google Scholar] [CrossRef] [Scilit]
- Fangrong, Z.; Yuning, G.; Guochao, Q.; Yi, M.; Guofang, W. Multi-factor coupled forest fire model based on cellular automata. J. Saf. Sci. Resil. 2024, 5, 413–421. [Google Scholar] [CrossRef] [Scilit]
- Feng, Z.; Zhao, Z.; Chen, S.; Zhang, H. Research on Multi-Factor Forest Fire Prediction Model Using Machine Learning Method in China. ResearchSquare 2020. [Google Scholar] [CrossRef]
- Jingjing, P.; Haoying, Z.; Shiyu, Y.; Mengyao, W.; Yun, L. Research on forest fire risk assessment and prevention and control Countermeasures: A case study of Qinyuan County, Shanxi Province, China. Ecol. Indic. 2025, 176, 113719. [Google Scholar] [CrossRef] [Scilit]
- Chang, L.; Zhi, Y.; Binbin, Z.; Sihang, Z. Wildfire risk assessment using multi-source remote sensing data and GIS. In 2024 IEEE 4th International Conference on Information Technology, Big Data and Artificial Intelligence (ICIBA); IEEE: New York, NY, USA, 2024. [Google Scholar]
- Bisquert, M.; Caselles, E.; Sánchez, J.M.; Caselles, V. Application of artificial neural networks and logistic regression to the prediction of forest fire danger in Galicia using MODIS data. Int. J. Wildland Fire 2012, 21, 1025–1029. [Google Scholar] [CrossRef] [Scilit]
- Jafari Goldarag, Y.; Mohammadzadeh, A.; Ardakani, A. Fire risk assessment using neural network and logistic regression. J. Indian Soc. Remote Sens. 2016, 44, 885–894. [Google Scholar] [CrossRef] [Scilit]
- Guo, F.; Zhang, L.; Jin, S.; Tigabu, M.; Su, Z.; Wang, W. Modeling anthropogenic fire occurrence in the boreal forest of China using logistic regression and random forests. Forests 2016, 7, 250. [Google Scholar] [CrossRef] [Scilit]
- Guo, F.; Wang, G.; Su, Z.; Liang, H.; Wang, W.; Lin, F.; Liu, A. What drives forest fire in Fujian, China? Evidence from logistic regression and Random Forests. Int. J. Wildland Fire 2016, 25, 505–519. [Google Scholar] [CrossRef] [Scilit]
- Milanović, S.; Marković, N.; Pamučar, D.; Gigović, L.; Kostić, P.; Milanović, S.D. Forest fire probability mapping in eastern Serbia: Logistic regression versus random forest method. Forests 2020, 12, 5. [Google Scholar] [CrossRef] [Scilit]
- Bian, R.; Chen, K.; Li, G.; Wang, Z.; Qiu, Y.; Bai, H.; Kong, W. Evaluation of three algorithms and forest fire risk prediction in zhejiang province of china. Forests 2024, 15, 2146. [Google Scholar] [CrossRef] [Scilit]
- Gao, C.; Lin, H.; Hu, H. Forest-fire-risk prediction based on random forest and backpropagation neural network of Heihe area in Heilongjiang province, China. Forests 2023, 14, 170. [Google Scholar] [CrossRef] [Scilit]
- Li, S.; Zhang, F.; Lin, H. Research on forest fire risk evaluation based on machine learning algorithm. J. Nanjing For. Univ. 2023, 47, 49–56. [Google Scholar]
- Lee, J.; Ahn, S.; Im, S. Spatial Prediction of Forest Fire Occurrence Integrating Human Proximity: A Machine Learning Approach for Korea’s Eastern Coast. Forests 2026, 17, 281. [Google Scholar] [CrossRef] [Scilit]
- He, H.S.; Shang, B.Z.; Crow, T.R.; Gustafson, E.J.; Shifley, S.R. Simulating forest fuel and fire risk dynamics across landscapes—LANDIS fuel module design. Ecol. Model. 2004, 180, 135–151. [Google Scholar] [CrossRef] [Scilit]
- Ager, A.A.; Vaillant, N.M.; Finney, M.A. Integrating fire behavior models and geospatial analysis for wildland fire risk assessment and fuel management planning. J. Combust. 2011, 2011, 572452. [Google Scholar] [CrossRef] [Scilit]
- Perello, N.; Trucchia, A.; D’andrea, M.; Meschi, G.; Ghasemiazma, F.; Degli Esposti, S.; Fiorucci, P.; Ferraris, L.; Gollini, A.; Negro, D. Fuel-aware forest fire danger rating system RISICO: A comparative study for Italy. Int. J. Wildland Fire 2025, 34, WF25023. [Google Scholar] [CrossRef] [Scilit]
- Danson, F.M.; Bowyer, P. Estimating live fuel moisture content from remotely sensed reflectance. Remote Sens. Environ. 2004, 92, 309–321. [Google Scholar] [CrossRef] [Scilit]
- Yebra, M.; Chuvieco, E.; Riano, D. Estimation of live fuel moisture content from MODIS images for fire risk assessment. Agric. For. Meteorol. 2008, 148, 523–536. [Google Scholar] [CrossRef] [Scilit]
- García, M.; Chuvieco, E.; Nieto, H.; Aguado, I. Combining AVHRR and meteorological data for estimating live fuel moisture content. Remote Sens. Environ. 2008, 112, 3618–3627. [Google Scholar] [CrossRef] [Scilit]
- Che, X.; Feng, M.; Sexton, J.O.; Channan, S.; Yang, Y.; Sun, Q. Assessment of MODIS BRDF/Albedo model parameters (MCD43A1 Collection 6) for directional reflectance retrieval. Remote Sens. 2017, 9, 1123. [Google Scholar] [CrossRef] [Scilit]
- Modis, T.A. MCD43 v006/v006, 1 User Guide Introduction; NASA Land Processes Distributed Active Archive Center: Sioux Falls, SD, USA, 2021. [Google Scholar] [CrossRef]
- Van Zyl, J.J. The Shuttle Radar Topography Mission (SRTM): A breakthrough in remote sensing of topography. Acta Astronaut. 2001, 48, 559–565. [Google Scholar] [CrossRef] [Scilit]
- Hersbach, H.; Bell, B.; Berrisford, P.; Hirahara, S.; Horányi, A.; Muñoz-Sabater, J.; Nicolas, J.; Peubey, C.; Radu, R.; Schepers, D.; et al. The ERA5 global reanalysis. Q. J. R. Meteorol. Soc. 2020, 146, 1999–2049. [Google Scholar] [CrossRef] [Scilit]
- Dobson, J.E.; Bright, E.A.; Coleman, P.R.; Durfee, R.C.; Worley, B.A. LandScan: A global population database for estimating populations at risk. Photogramm. Eng. Remote Sens. 2000, 66, 849–857. [Google Scholar]
- Lebakula, V.; Sims, K.; Reith, A.; Rose, A.; McKee, J.; Coleman, P.; Kaufman, J.; Urban, M.; Jochem, C.; Whitlock, C.; et al. LandScan global 30 arcsecond annual global gridded population datasets from 2000 to 2022. Sci. Data 2025, 12, 495. [Google Scholar] [CrossRef] [Scilit]
- Giglio, L.; Boschetti, L.; Roy, D.P.; Humber, M.L.; Justice, C.O. The Collection 6 MODIS burned area mapping algorithm and product. Remote Sens. Environ. 2018, 217, 72–85. [Google Scholar] [CrossRef] [Scilit] [PubMed]
- Shantal, M.; Othman, Z.; Bakar, A.A. A novel approach for data feature weighting using correlation coefficients and min–max normalization. Symmetry 2023, 15, 2185. [Google Scholar] [CrossRef] [Scilit]
- Rigatti, S.J. Random forest. J. Insur. Med. 2017, 47, 31–39. [Google Scholar] [CrossRef] [Scilit]
- Salman, H.A.; Kalakech, A.; Steiti, A. Random forest algorithm overview. Babylon. J. Mach. Learn. 2024, 2024, 69–79. [Google Scholar] [CrossRef] [Scilit] [PubMed]
- Parmar, A.; Katariya, R.; Patel, V. A review on random forest: An ensemble classifier. In International Conference on Intelligent Data Communication Technologies and Internet of Things; Springer: Berlin/Heidelberg, Germany, 2018. [Google Scholar]
- Zien, A.; Krämer, N.; Sonnenburg, S.; Rätsch, G. The feature importance ranking measure. In Joint European Conference on Machine Learning and Knowledge Discovery in Databases; Springer: Berlin/Heidelberg, Germany, 2009. [Google Scholar]
- Hooker, S.; Erhan, D.; Kindermans, P.J.; Kim, B. Evaluating feature importance estimates. arXiv 2018, arXiv:1806.10758. [Google Scholar]
- Wojtas, M.; Chen, K. Feature importance ranking for deep learning. Adv. Neural Inf. Process. Syst. 2020, 33, 5105–5114. [Google Scholar]
- Van den Broeck, G.; Lykov, A.; Schleich, M.; Suciu, D. On the tractability of SHAP explanations. J. Artif. Intell. Res. 2022, 74, 851–886. [Google Scholar] [CrossRef] [Scilit]
- Li, Z. Extracting spatial effects from machine learning model using local interpretation method: An example of SHAP and XGBoost. Comput. Environ. Urban Syst. 2022, 96, 101845. [Google Scholar] [CrossRef] [Scilit]
- Wang, H.; Liang, Q.; Hancock, J.T.; Khoshgoftaar, T.M. Feature selection strategies: A comparative analysis of SHAP-value and importance-based methods. J. Big Data 2024, 11, 44. [Google Scholar] [CrossRef] [Scilit]
- Naidu, G.; Zuva, T.; Sibanda, E.M. A review of evaluation metrics in machine learning algorithms. In Computer Science On-Line Conference; Springer: Berlin/Heidelberg, Germany, 2023. [Google Scholar]
- Vujović, Ž. Classification model evaluation metrics. Int. J. Adv. Comput. Sci. Appl. 2021, 12, 599–606. [Google Scholar] [CrossRef] [Scilit]
- Gogtay, N.J.; Thatte, U.M. Principles of correlation analysis. J. Assoc. Physicians India 2017, 65, 78–81. [Google Scholar]
- Franzese, M.; Iuliano, A. Correlation analysis. In Encyclopedia of Bioinformatics and Computational Biology: ABC of Bioinformatics; Elsevier: Amsterdam, The Netherlands, 2018; pp. 706–721. [Google Scholar]







| Vegetation Type | R2 | RMSE (%) | Bias |
|---|---|---|---|
| Coniferous forest | 0.6353 | 12.728 | −1.7946 |
| Broadleaf forest | 0.6874 | 16.8867 | −0.4009 |
| Open shrubland | 0.5467 | 21.7374 | 0.4594 |
| Closed shrubland | 0.6194 | 14.8287 | −1.3701 |
| Grassland | 0.7511 | 14.3117 | 3.2288 |
| Sparse vegetation | 0.6075 | 14.8237 | −2.6594 |
| Variable Name | Factor Name | Data Source |
|---|---|---|
| Topography | Slope | USGS, Reston, USA |
| Aspect | ||
| Elevation | ||
| Meteorology | Temperature | ECMWF (for ERA5), Reading, United Kingdom |
| Vegetation | NDVI | NASA (for MODIS), Washington, D.C., USA |
| FMC | ||
| Human Activity | Population Density | Oak Ridge National Laboratory (for LandScan), Oak Ridge, USA |
| Distance to Road | Esri (for World Roads), Redlands, USA |
| Variable | FMC | Slope | Aspect | Elevation | NDVI | Distance to Road | Population Density | Temperature |
|---|---|---|---|---|---|---|---|---|
| FMC | 1 | |||||||
| Slope | −0.111 | 1 | ||||||
| Aspect | 0.009 | 0.058 | 1 | |||||
| Elevation | 0.012 | 0.373 | 0.032 | 1 | ||||
| NDVI | 0.380 | 0.370 | 0.090 | −0.012 | 1 | |||
| Distance to Road | −0.120 | 0.170 | −0.018 | 0.203 | −0.035 | 1 | ||
| Population Density | −0.056 | −0.111 | 0.015 | −0.156 | −0.051 | −0.127 | 1 | |
| Temperature | −0.156 | 0.029 | −0.013 | −0.169 | 0.068 | −0.091 | −0.018 | 1 |
| Model | Fold | TP | TN | FP | FN |
|---|---|---|---|---|---|
| Without FMC | 1 | 2569 | 3284 | 494 | 325 |
| 2 | 2469 | 3318 | 516 | 351 | |
| 3 | 2431 | 3336 | 509 | 388 | |
| 4 | 2371 | 3376 | 535 | 381 | |
| 5 | 2531 | 3262 | 602 | 281 | |
| With FMC | 1 | 2545 | 3451 | 327 | 349 |
| 2 | 2532 | 3420 | 414 | 288 | |
| 3 | 2462 | 3443 | 402 | 357 | |
| 4 | 2448 | 3446 | 465 | 304 | |
| 5 | 2537 | 3424 | 440 | 275 |
| Model | Fold | AUC | Accuracy (%) | Precision (%) | Recall (%) | Specificity (%) | F1 Score |
|---|---|---|---|---|---|---|---|
| Without FMC | 1 | 0.9499 | 87.7248 | 83.8720 | 88.7699 | 86.9243 | 0.8625 |
| 2 | 0.9479 | 86.9702 | 82.7136 | 87.5532 | 86.5415 | 0.8506 | |
| 3 | 0.9400 | 86.5396 | 82.6871 | 86.2363 | 86.7620 | 0.8442 | |
| 4 | 0.9407 | 86.2524 | 81.5898 | 86.1555 | 86.3206 | 0.8381 | |
| 5 | 0.9469 | 86.7735 | 80.7852 | 90.0071 | 84.4203 | 0.8515 | |
| With FMC | 1 | 0.9656 | 89.8681 | 88.6142 | 87.9406 | 91.3446 | 0.8828 |
| 2 | 0.9631 | 89.1500 | 85.9470 | 89.7874 | 89.2019 | 0.8783 | |
| 3 | 0.9604 | 88.6104 | 85.9637 | 87.3359 | 89.5449 | 0.8664 | |
| 4 | 0.9675 | 88.4597 | 84.0371 | 88.9535 | 88.1105 | 0.8643 | |
| 5 | 0.9628 | 89.2900 | 85.2200 | 90.2205 | 88.6128 | 0.8765 |
| Metric | Without FMC | With FMC | Improvement |
|---|---|---|---|
| TP | 5456 | 5479 | 23 |
| TN | 7033 | 7326 | 293 |
| FP | 1112 | 819 | −293 |
| FN | 688 | 665 | −23 |
| AUC | 0.9515 | 0.9668 | 0.0153 |
| Accuracy (%) | 87.40 | 89.61 | 2.21 |
| Precision (%) | 83.07 | 87.00 | 3.93 |
| Recall (%) | 88.08 | 89.18 | 0.37 |
| Specificity (%) | 86.35 | 89.94 | 3.60 |
| F1 Score | 0.8584 | 0.8807 | 0.0223 |
Disclaimer/Publisher’s Note: The statements, opinions and data contained in all publications are solely those of the individual author(s) and contributor(s) and not of MDPI and/or the editor(s). MDPI and/or the editor(s) disclaim responsibility for any injury to people or property resulting from any ideas, methods, instructions or products referred to in the content. |
© 2026 by the authors. Licensee MDPI, Basel, Switzerland. This article is an open access article distributed under the terms and conditions of the Creative Commons Attribution (CC BY) license.
Share and Cite
Li, Y.; Zhou, C.; Zhang, J.; Wang, W.; Chen, Z.; Luo, Y. Forest Fire Risk Early Warning Based on Dynamic Fuel Moisture Content. Forests 2026, 17, 532. https://doi.org/10.3390/f17050532
Li Y, Zhou C, Zhang J, Wang W, Chen Z, Luo Y. Forest Fire Risk Early Warning Based on Dynamic Fuel Moisture Content. Forests. 2026; 17(5):532. https://doi.org/10.3390/f17050532
Chicago/Turabian StyleLi, Yuanzong, Cui Zhou, Junxiang Zhang, Wenjun Wang, Zhenyu Chen, and Yongfeng Luo. 2026. "Forest Fire Risk Early Warning Based on Dynamic Fuel Moisture Content" Forests 17, no. 5: 532. https://doi.org/10.3390/f17050532
APA StyleLi, Y., Zhou, C., Zhang, J., Wang, W., Chen, Z., & Luo, Y. (2026). Forest Fire Risk Early Warning Based on Dynamic Fuel Moisture Content. Forests, 17(5), 532. https://doi.org/10.3390/f17050532