Article

Spatial Distribution Patterns and Environmental Drivers of Bombax ceiba L.-Associated Plant Communities in Contrasting Habitats: A Case Study from a Tropical Rainforest and a Dry-Hot Valley

School of Soil and Water Conservation, Southwest Forestry University, Kunming 65022, China
*
Author to whom correspondence should be addressed.
Forests 2026, 17(5), 531; https://doi.org/10.3390/f17050531
Submission received: 13 April 2026 / Revised: 24 April 2026 / Accepted: 25 April 2026 / Published: 28 April 2026

Abstract

Understanding the spatial distribution patterns and environmental drivers of plant communities is fundamental for biodiversity conservation and ecosystem management. Bombax ceiba is a widely distributed tree species that occurs in both humid tropical rainforests and drought-prone dry-hot valleys, representing two strongly contrasting ecological environments. However, the spatial patterns and environmental drivers of plant communities associated with B. ceiba across these habitats remain poorly understood. In this study, we investigated B. ceiba-associated plant communities in two representative habitats in Yunnan Province, Southwest China: a tropical rainforest in Mengla and a dry-hot valley in Yuanjiang. The species composition, community structure, and spatial coordinates of associated plants were recorded in replicated 20 m × 20 m plots. Spatial distribution patterns were analyzed using the pair-correlation function g(r), while environmental drivers were examined using Pearson correlation analysis and redundancy analysis (RDA). Species richness was substantially higher in the tropical rainforest (41 species from 33 families) than in the dry-hot valley (19 species from 14 families). Both communities contained a substantial proportion of tropical Asian floristic elements. Most dominant species exhibited aggregated spatial distributions at small spatial scales (0–7 m), indicating strong dispersal limitation and microhabitat heterogeneity. Spatial associations varied across scales: in the dry-hot valley, species associations alternated between positive and negative correlations at small scales (0–5 m) and shifted toward positive correlations at larger distances, whereas in the tropical rainforest negative associations were more common at small scales and positive associations increased at larger spatial scales. Environmental drivers differed markedly between habitats. In the dry-hot valley, community attributes were positively associated with slope, precipitation, and soil ammonium nitrogen, suggesting that community assembly is influenced by interactions between topography and water availability. In contrast, tropical rainforest communities were more strongly associated with soil phosphorus availability and temperature-related variables. These findings highlight distinct community assembly mechanisms in contrasting habitats and provide ecological insights for vegetation restoration in dry-hot valleys and biodiversity conservation in tropical rainforests.

1. Introduction

Forest ecosystems represent one of the most important reservoirs of terrestrial biodiversity and play crucial roles in global carbon cycling and climate regulation [1]. The spatial structure and species composition of forest communities influence ecosystem stability, nutrient cycling, and ecosystem resilience under environmental change [2,3]. Plant community assembly is widely considered to be governed by the combined effects of deterministic processes, such as environmental filtering and species interactions, and stochastic processes including dispersal limitation and ecological drift [4,5]. Environmental heterogeneity can strongly influence species distributions and interactions, particularly across contrasting habitats where climatic and edaphic conditions differ substantially [6,7].
Tropical rainforests are globally recognized biodiversity hotspots characterized by high species richness and complex community structure [8]. Many tropical forest ecosystems are influenced by nutrient limitations, particularly phosphorus availability in highly weathered soils [9]. In contrast, dry-hot valleys represent ecologically fragile environments characterized by high temperatures, low precipitation [10], and strong seasonal drought stress [11]. These environmental conditions impose strong ecological filters that restrict species establishment and survival [12].
Yunnan Province in Southwest China contains both tropical rainforest ecosystems and dry-hot valley environments within relatively close geographic proximity [13]. Mengla County, located in southern Yunnan, experiences a tropical monsoon climate with high precipitation and humidity, supporting diverse tropical rainforest vegetation [14]. In contrast, Yuanjiang County in central Yunnan is characterized by a dry-hot valley climate with lower precipitation and higher temperatures, where vegetation is dominated by drought-adapted species [15].
Bombax ceiba is a deciduous tree species widely distributed in tropical and subtropical Asia [16]. The species exhibits strong ecological plasticity and can occur across a wide range of environmental conditions, including humid tropical forests and drought-prone valleys [17]. In dry-hot valley ecosystems, B. ceiba plays important roles in soil stabilization and ecological restoration. In tropical forests, the species contributes to canopy structure and provides habitat for various plant and animal species [18]. Despite its ecological importance, relatively little attention has been paid to the structure and spatial organization of plant communities associated with B. ceiba [19]. Understanding the spatial distribution patterns and environmental drivers of associated species may provide important insights into community assembly mechanisms and ecosystem management strategies. In this study, we investigated B. ceiba-associated plant communities in two contrasting habitats in Yunnan Province. Specifically, we aimed to: (1) characterize the species composition and community structure of B. ceiba-associated plant communities in tropical rainforest and dry-hot valley habitats; (2) analyze the spatial distribution patterns and interspecific associations of dominant associated species; and (3) identify key environmental factors influencing community structure and spatial patterns. We hypothesized that community assembly mechanisms differ between habitats, with water-related factors playing a dominant role in dry-hot valley ecosystems, while nutrient availability and temperature exert stronger influences in tropical rainforest environments.

2. Materials and Methods

2.1. Study Sites

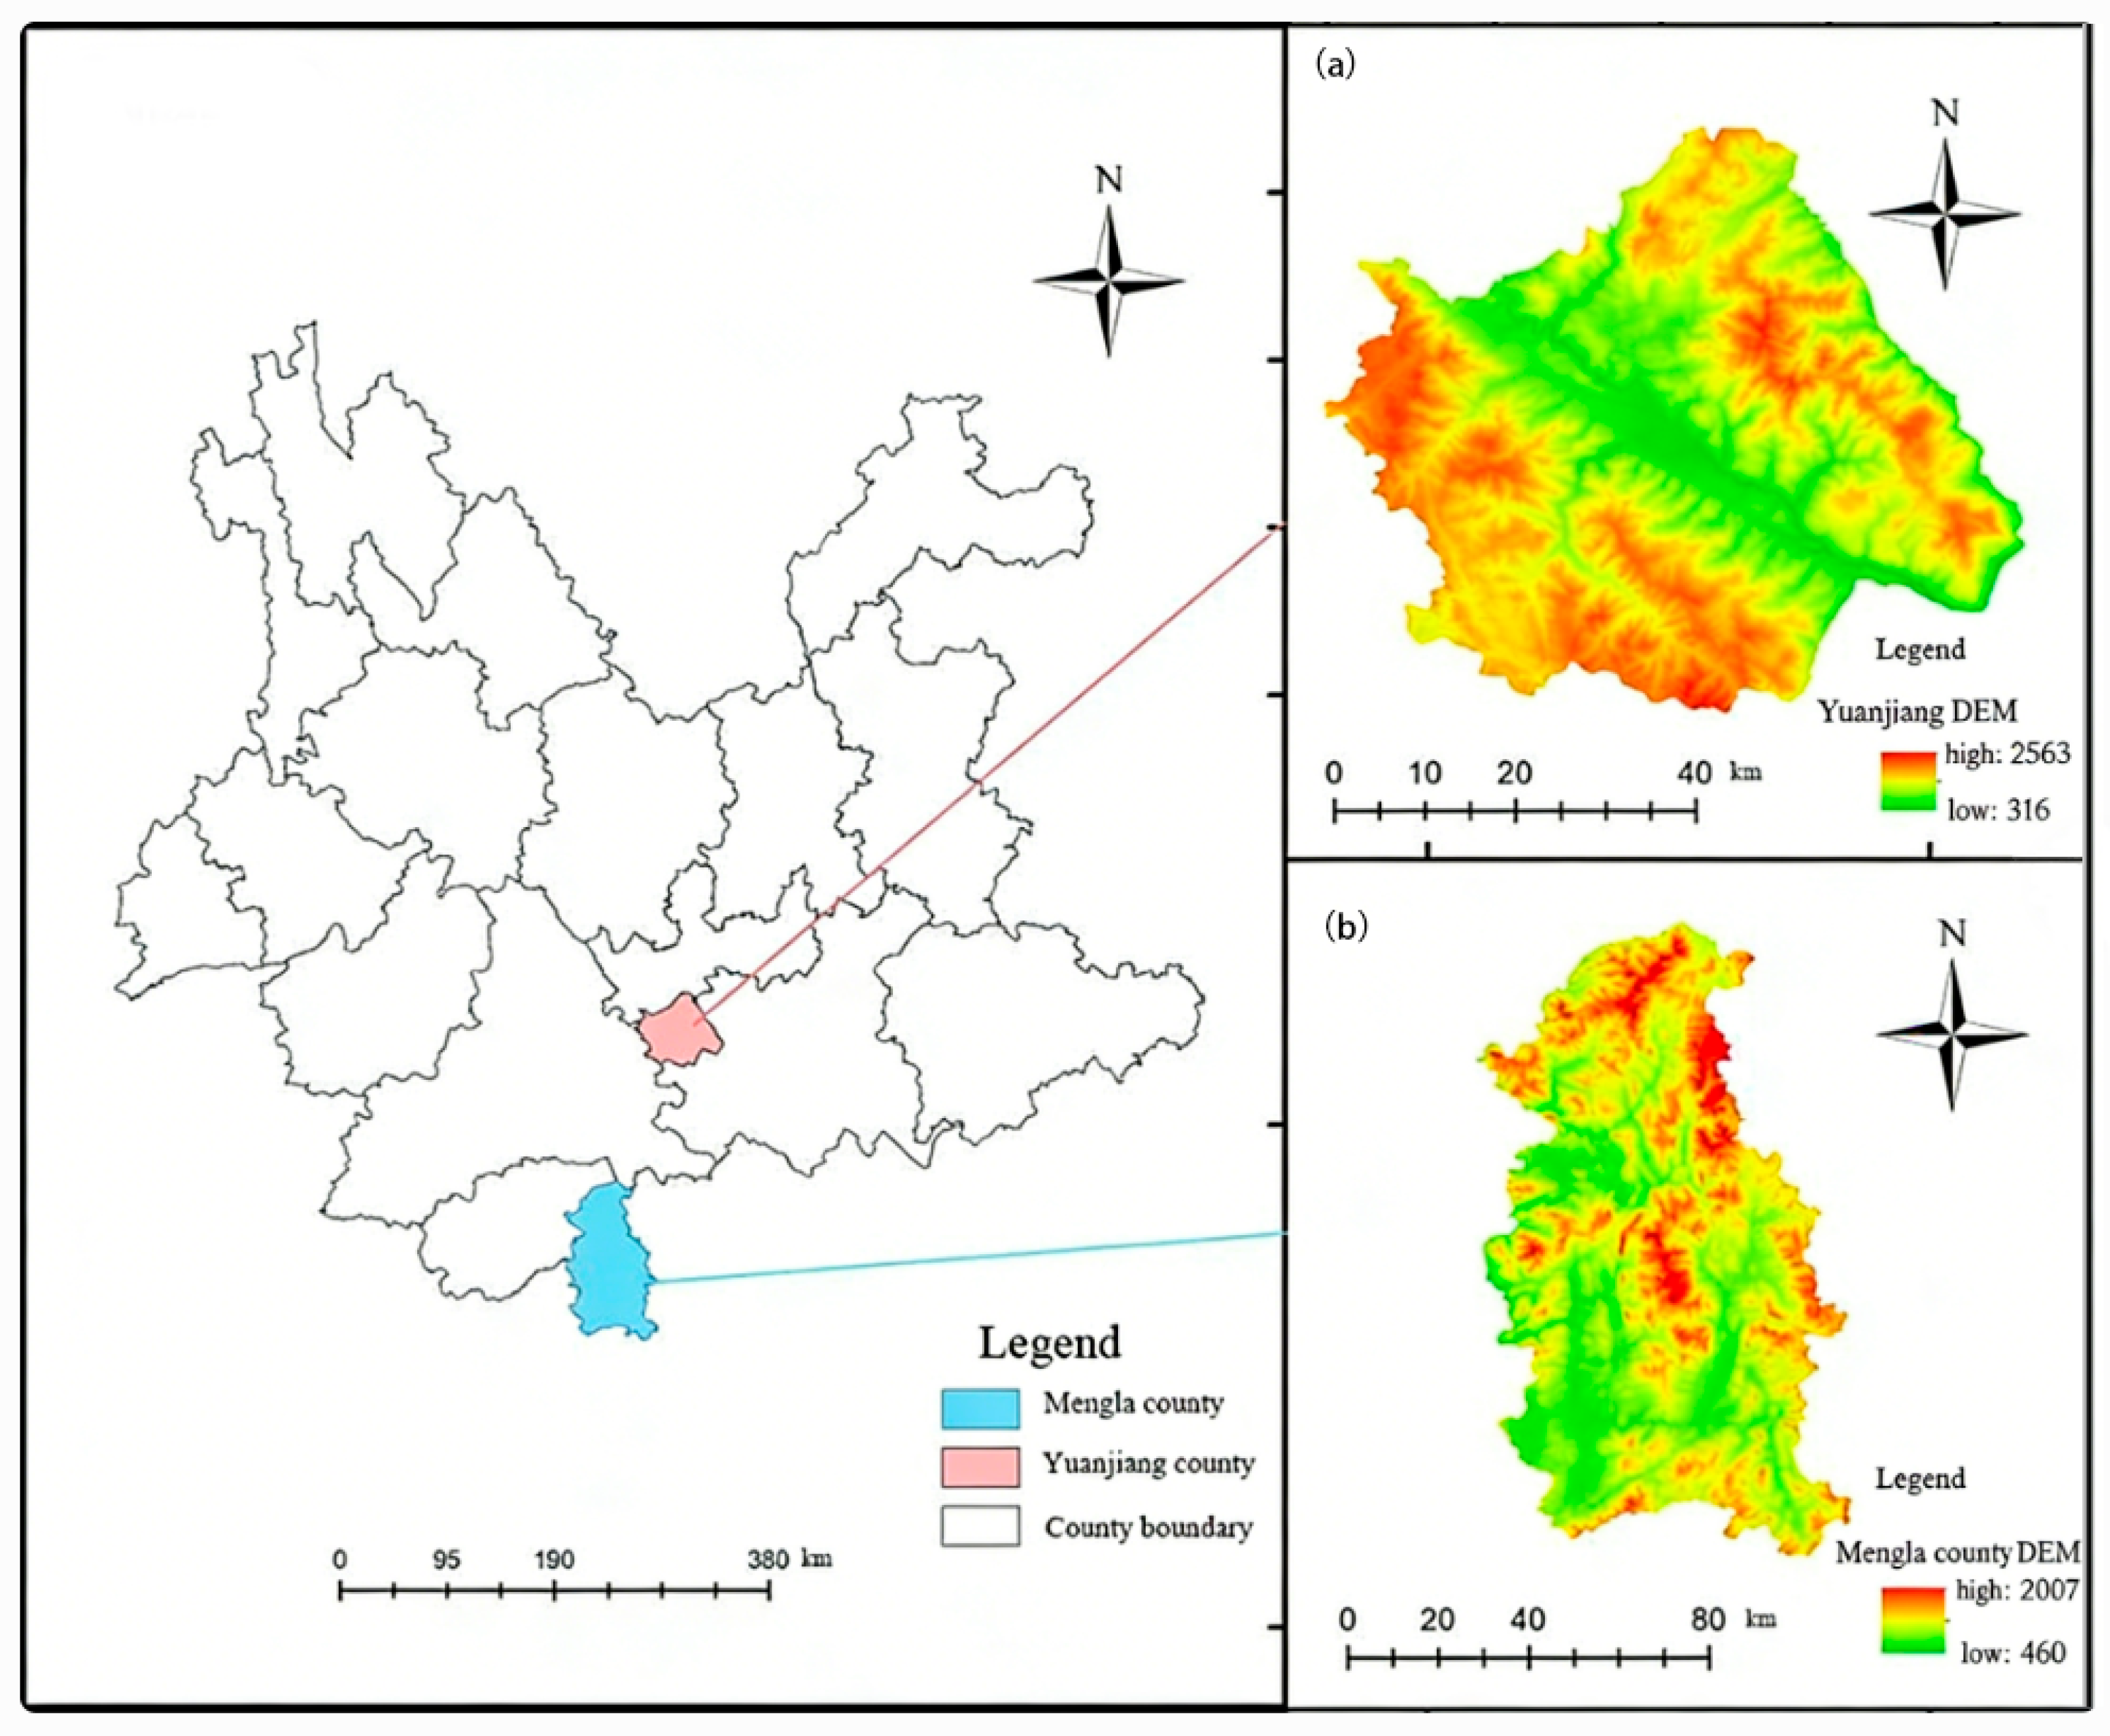
The study was conducted in two regions of Yunnan Province, Southwest China: Mengla tropical rainforest and Yuanjiang dry-hot valley (Figure 1).
Mengla tropical rainforest is located at 21°08′ N–22°25′ N, 100°50′ E–101°06′ E in southern Yunnan. It experiences a tropical monsoon climate with high annual precipitation and humidity. The vegetation is dominated by tropical rainforest species. According to the World Reference Base for Soil Resources (WRB), the soil type is Ferralsol, with a general soil depth of 40–80 cm, intense pedological weathering, and acidic soil conditions (pH 4.5–5.5).
Yuanjiang dry-hot valley is located at 23°19′ N–23°55′ N, 101°39′ E–102°22′ E in central Yunnan. It represents a typical dry-hot valley ecosystem characterized by high temperature, low precipitation, and strong seasonal drought. According to the World Reference Base for Soil Resources (WRB), its soil is classified as Cambisol, with a moderate soil depth of 30–60 cm and near-neutral to weakly alkaline conditions (pH 6.5–7.5), which sustains drought-tolerant plant communities.
Due to steep terrain, accessibility constraints, and conservation regulations within the study regions, only three representative plots (20 m × 20 m) were established in each habitat. Plots were selected based on three criteria: (1) the presence of mature B. ceiba individuals; (2) minimal anthropogenic disturbance; (3) representative vegetation conditions of the local habitat. Plots within each habitat were located in separate B. ceiba patches, with distances greater than 200 m between plots to reduce spatial autocorrelation and ensure independent sampling. Within each plot, the density of B. ceiba individuals ranged from 8 to 12 trees; tree heights were 15–25 m and diameter at breast height values were 30–70 cm, indicating mature stands in both habitats.

2.2. Field Survey and Data Collection

Each 20 m × 20 m plot was divided into 16 subplots of 5 m × 5 m. Within each subplot, we recorded all B. ceiba-associated plant species (defined as all co-occurring species excluding focal B. ceiba individuals), including species name, individual count, frequency, coverage, and two-dimensional spatial coordinates (x, y) relative to the subplot origin. Species were identified using Flora of China and published regional floristic manuals for Xishuangbanna and Honghe regions. Plant coverage was estimated visually.
Relative abundance (RD), relative frequency (RF), and relative dominance (RP) are commonly used ecological indices describing species abundance, occurrence frequency, and dominance within plant communities [20]. The importance value (IV) integrates these indices to evaluate the overall ecological importance of species:
R e l a t i v e   A b u n d a n c e   ( R D ) = Abundance   of   a   species Total   abundance   of   all   species × 100 %
R e l a t i v e   F r e q u e n c y   ( R F ) = F r e q u e n c y   of   a   species Total   Frequency   of   all   species × 100 %
R e l a t i v e   D o m i n a n c e ( R P ) = Dominance of   a   species Total   Dominance   of   all   species × 100 %
I m p o r t a n c e   V a l u e   ( I V ) = R D + R F + R D 3

2.3. Point Pattern Analysis

Based on two-dimensional spatial coordinates, we used the pair-correlation function g(r) to analyze the spatial distribution patterns of dominant associated species (top five by IV in Yuanjiang; top nine by IV in Mengla). Because species richness in Mengla was substantially higher than in Yuanjiang, the top nine species were selected to adequately represent dominant community components. The g(r) function is derived from Ripley’s K-function and eliminates cumulative effects to enable scale-specific analysis [21]:
K r = A n 2 i = 1 n j = 1 j 1 n w i j I r ( u i j )
g r = d K r d r / 2 π r
where A is the plot area, n is the number of plants, r is the distance scale, u i j is the distance between points i and j, I r ( u i j ) is the indicator function, and w i j is the edge correction weight.
Monte Carlo simulations (999 iterations) generated 99% confidence envelopes. For univariate analysis: g(r) above the upper envelope = aggregated; below = uniform; between = random. For bivariate analysis: g(r) above = positive association; below = negative association; between = spatially independent. All point pattern analyses were performed in Programita 2018 [22].

2.4. Environmental Factor Collection

Topographic factors: Elevation, slope, and aspect were measured at the plot level (20 m × 20 m) in the field.
Meteorological factors: Long-term (1957–2022) data from Mengla and Yuanjiang stations were obtained from the China National Meteorological Science Data Center, including extreme minimum temperature (EMinT), extreme maximum temperature (EMaxT), mean annual temperature (AT), mean minimum temperature (MMinT), mean maximum temperature (MMaxT), annual sunshine hours (ASH), mean annual precipitation (MAP), mean vapor pressure (MVP), and mean relative humidity (ARH).
Soil factors: Soil samples were collected from the 0–20 cm topsoil layer using a plum-blossom sampling method [23]. Five subsamples were collected per plot and combined into one composite sample. Samples were air-dried, ground, and passed through a 2 mm sieve before analysis. Available phosphorus (AP) was determined using the Olsen method [24]; ammonium nitrogen (AN) and nitrate nitrogen (NN) were measured using a continuous flow analyzer [25]; total nitrogen (TN) was determined using the Kjeldahl method [26]; total phosphorus (TP) was measured using molybdenum–antimony colorimetry on a continuous flow analyzer (AA3, SEAL Analytical, Norderstedt, Germany).

2.5. Data Analysis

We analyzed floristic characteristics, species composition (defined as the total number of species recorded within each plot), and diameter class structure of B. ceiba-associated communities. We then performed point pattern and spatial association analyses for dominant associated species. Pearson correlation analysis explored relationships between community characteristics (IV, RP, RD) and environmental factors [27]. Redundancy analysis (RDA) quantified the explanatory power of environmental factors on community composition. Prior to RDA, variance inflation factor (VIF) analysis was performed to reduce multicollinearity among environmental variables. Independent sample t-tests were used to compare environmental variables between habitats [28]. All statistical analyses were performed in Excel 2016, SPSS Statistics 22.0 [29], and Canoco 5.0 [22]. Graphs were drawn in Origin 2010.

3. Results

3.1. Species Composition and Community Structure of Bombax ceiba-Associated Communities

A total of 19 species (14 families, 19 genera) of B. ceiba-associated plants were recorded in Yuanjiang dry-hot valley plots, while 41 species (33 families, 41 genera) were recorded in Mengla tropical rainforest plots. Both communities contained a substantial proportion of tropical Asian floristic elements: in Yuanjiang, 75% of families and 65% of genera were tropical Asian distribution types; in Mengla, 39.39% of families and 36.59% of genera were tropical Asian distribution types. The invasive species Chromolaena odorata and Mikania micrantha were excluded when calculating dominant species importance values. Species richness was defined as the total number of species recorded within each plot.
In Yuanjiang, the top five species by importance value were Huberantha cerasoides (Roxb.) Chaowasku (syn. Polyalthia cerasoides (Roxb.) Bedd.) (0.18), Euphorbia royleana Boiss. (0.14), Leucaena leucocephala (Lam.) de Wit (0.12), Tsaiodendron dioicum Y.H.Tan & H.B.Ding (0.08), and Trigonostemon tuberculatus Dunn (0.08). In Mengla, the top five species by importance value were Pueraria montana (Lour.) Merr. var. lobata (Willd.) Maesen & S.M.Almeida (0.08), Broussonetia papyrifera (L.) L’Hér. ex Vent. (0.07), Cassia fistula L. (0.07), Passiflora foetida L. (0.07), and Commelina communis L. (0.05) (Table 1).

3.2. Spatial Distribution Patterns of Dominant Associated Species

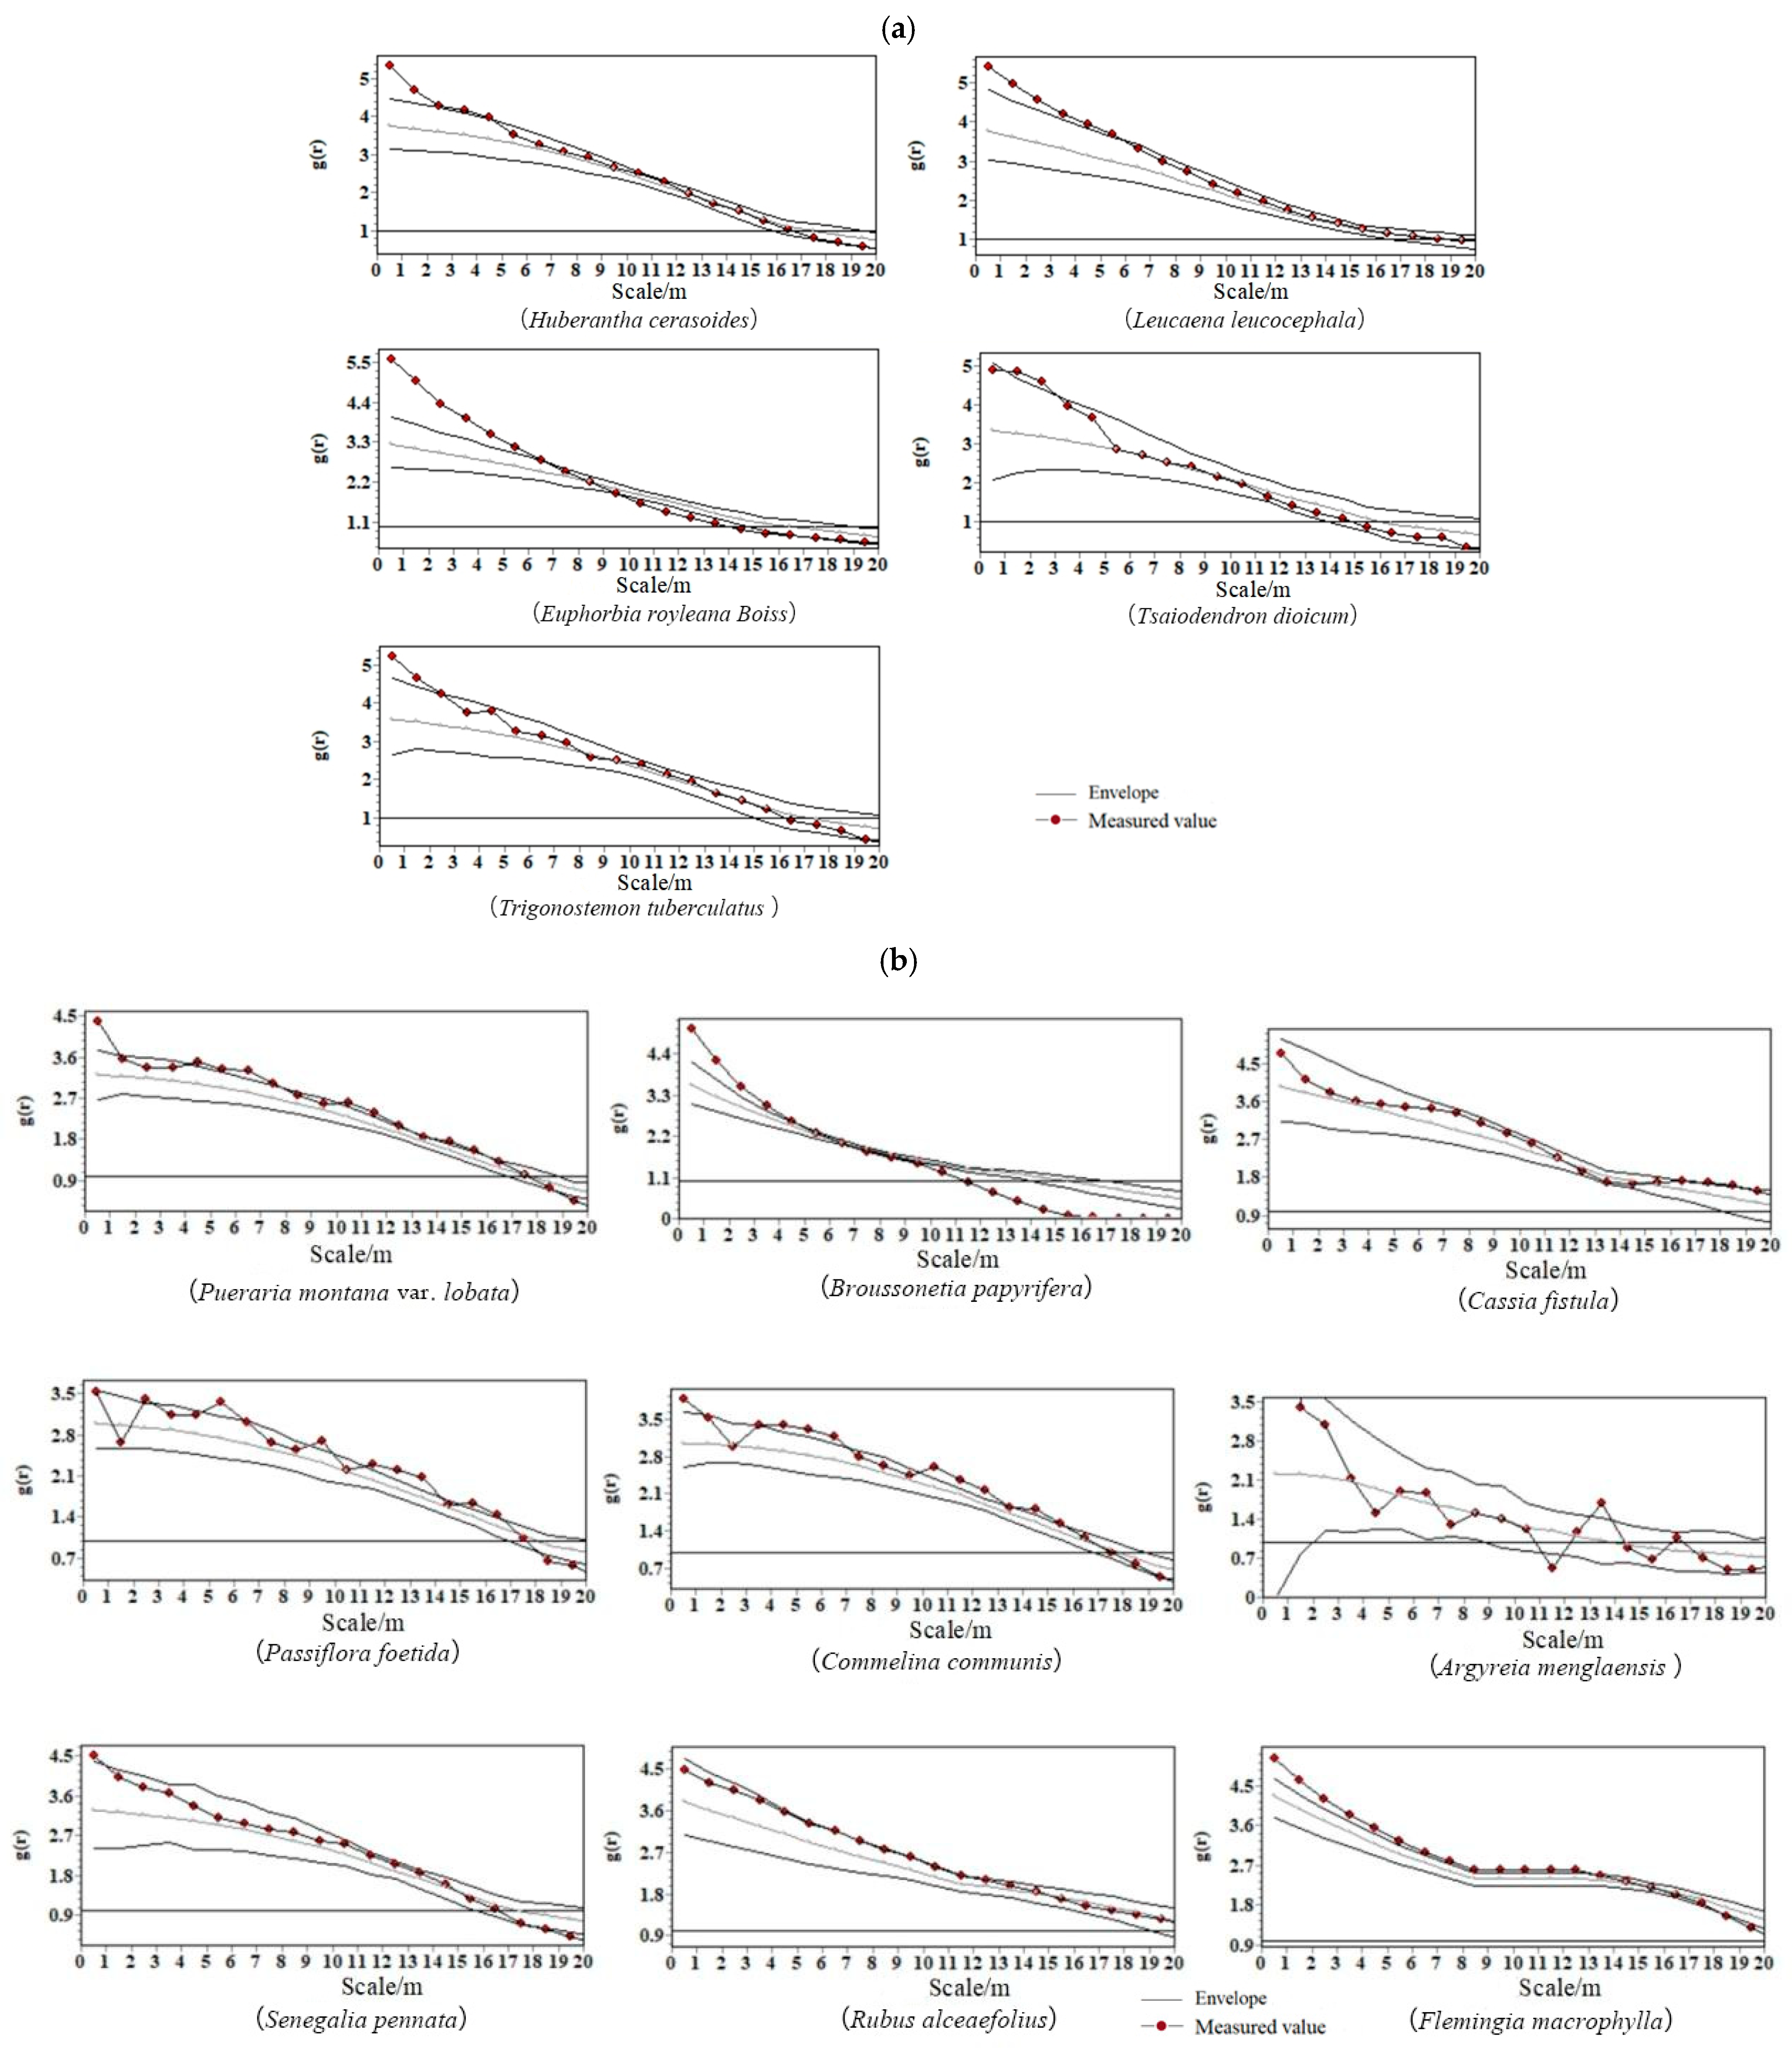
The spatial distributions of dominant B. ceiba-associated species were analyzed using point pattern analysis (Figure 2). Solid lines represent the observed pair-correlation function g(r), and shaded areas indicate the 99% confidence envelope generated by Monte Carlo simulations. In Yuanjiang, all five dominant woody species showed aggregated distributions at 0–7 m, and were randomly or uniformly distributed at larger scales.
In Mengla, nine dominant species were analyzed. Most species exhibited aggregated distributions at fine and medium scales, and became random or uniform at scales greater than 16 m. Overall, dominant species in both habitats were consistently aggregated at small spatial scales (0–7 m).

3.3. Differences in Environmental Conditions Between the Two Contrasting Habitats

Topographic, meteorological, and soil variables were measured at the two study sites (Table 2, Table 3 and Table 4). Independent sample t-tests revealed significant differences in all environmental variables between habitats (p ≤ 0.01). Environmental drivers of community assembly differed markedly between the two habitats, supporting our original hypothesis.

3.4. Environmental Interpretation of Community Distribution

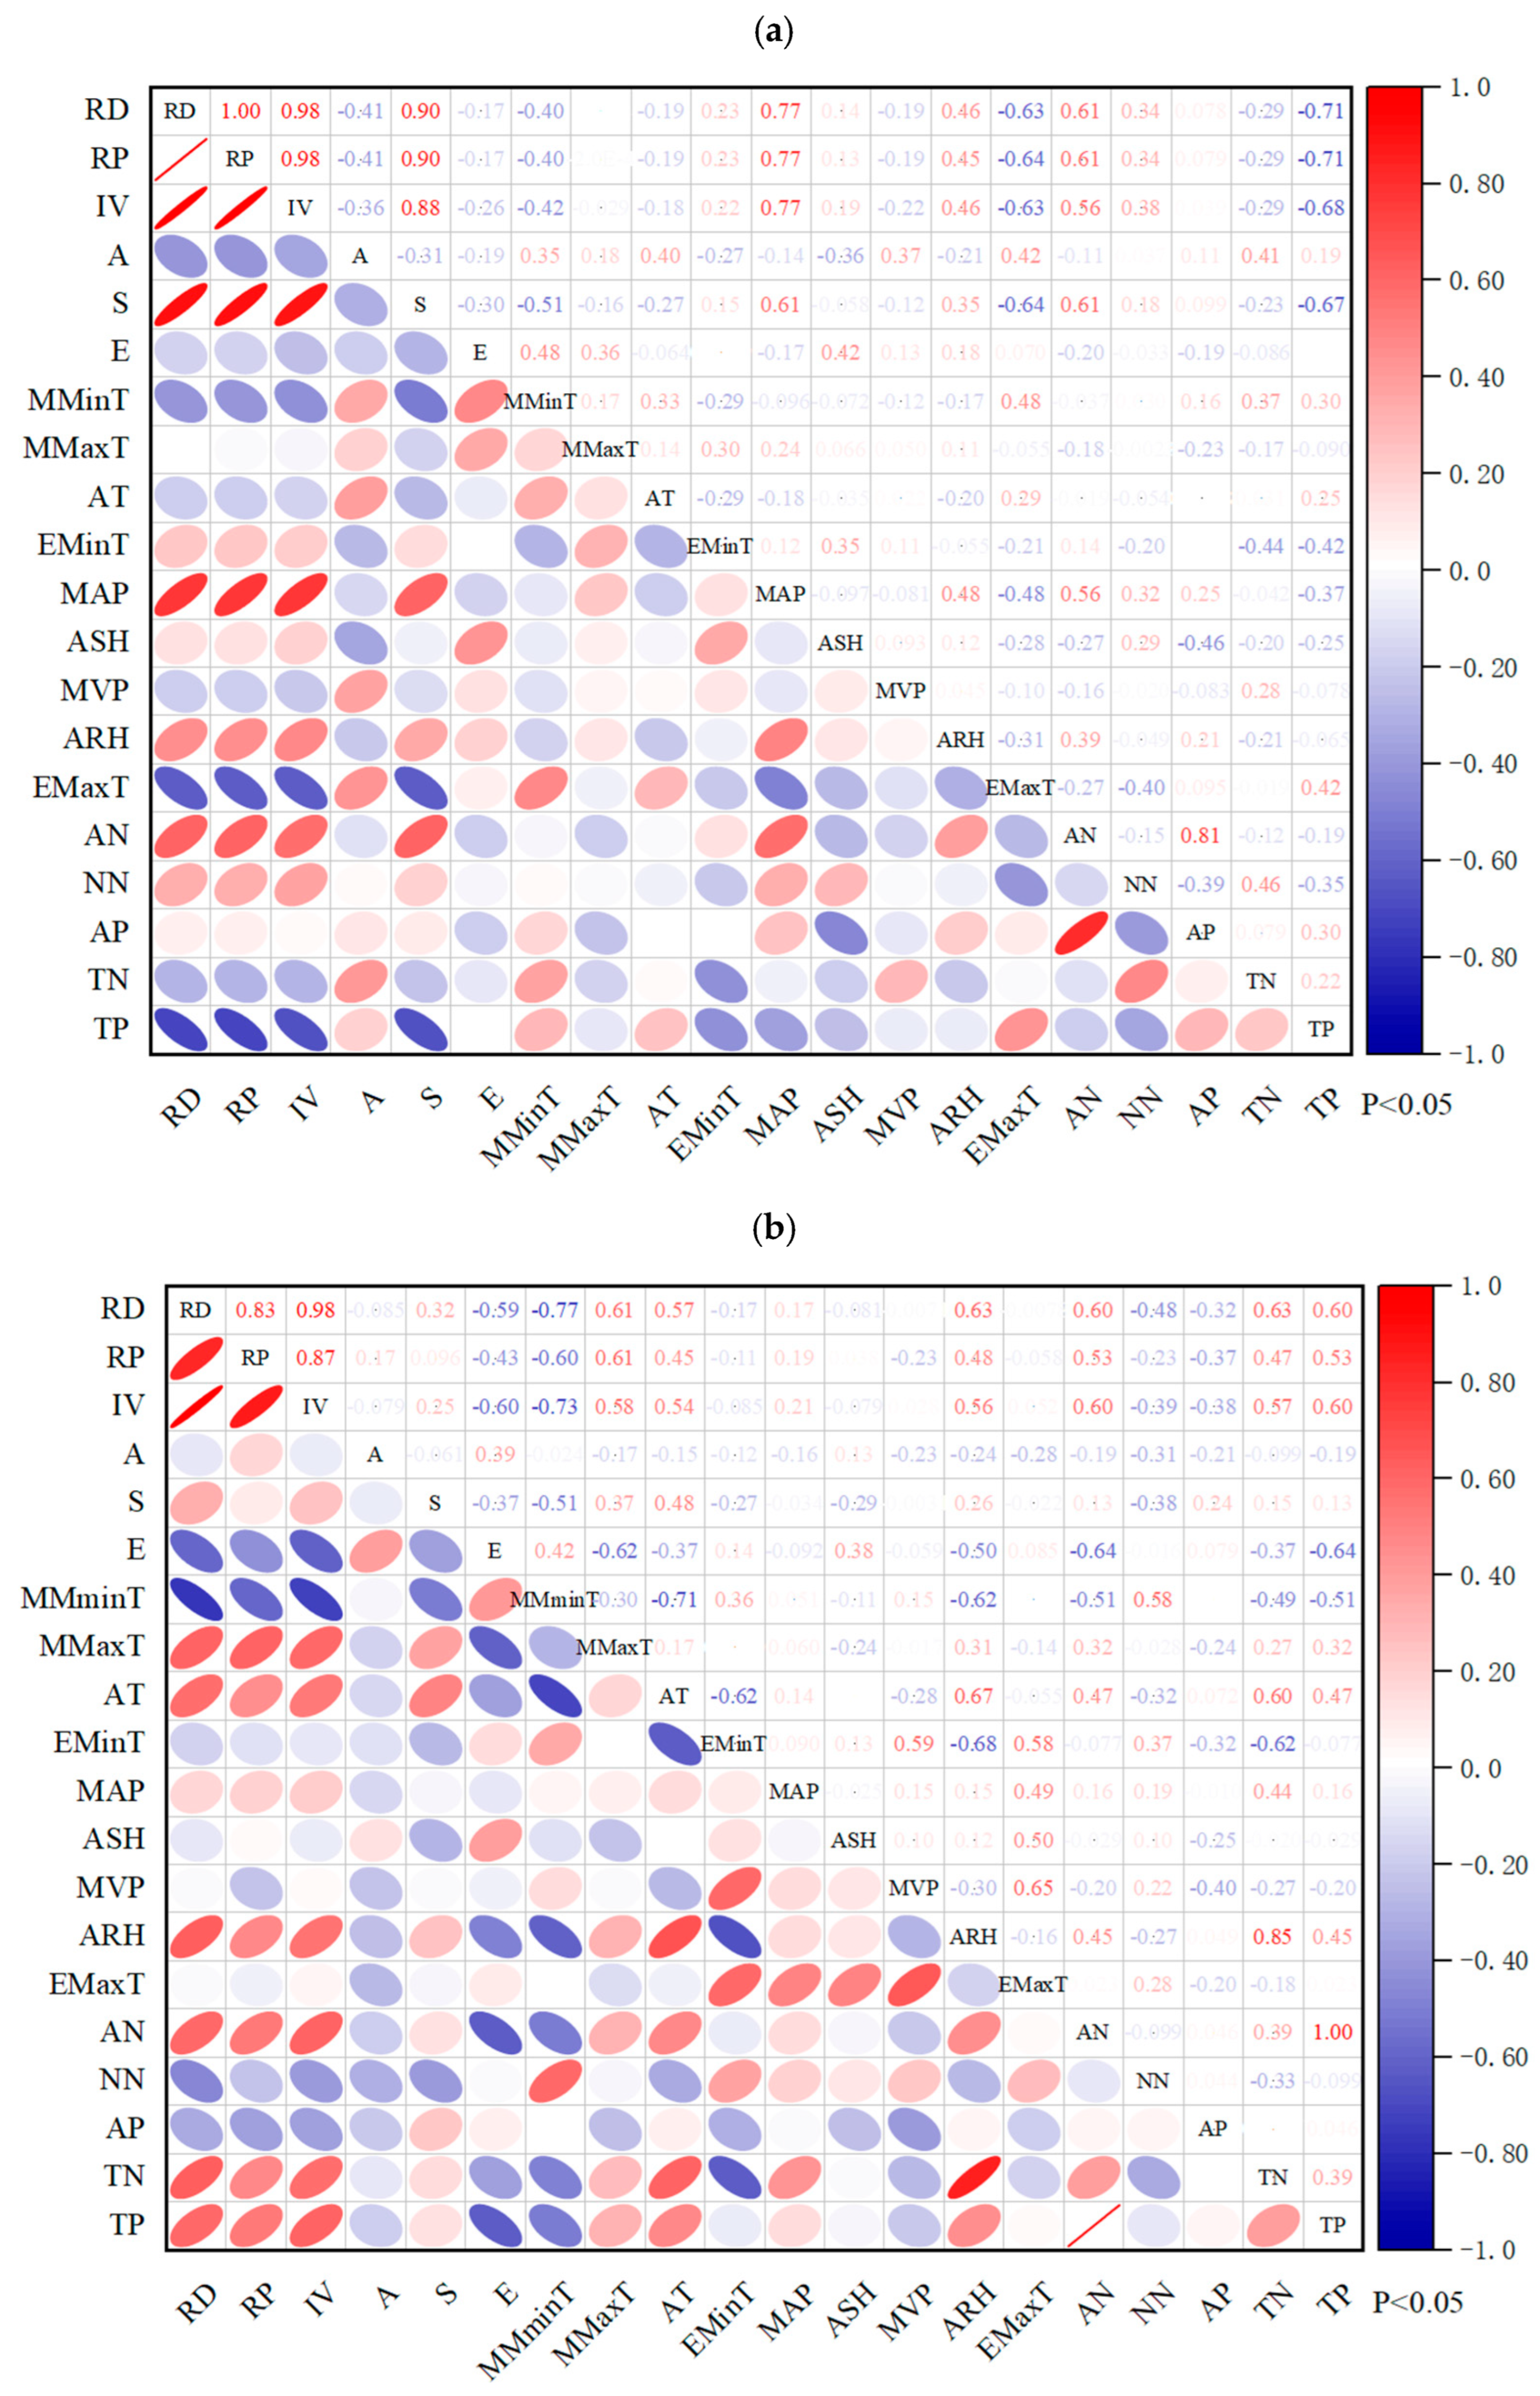
Pearson correlation analysis was performed to examine relationships between community attributes and environmental factors (Figure 3; Table 5). In Yuanjiang, community attributes (importance value, IV; relative frequency, RF; relative density, RD) were significantly positively correlated with slope, mean annual precipitation, and ammonium nitrogen, and significantly negatively correlated with total phosphorus and extreme maximum temperature. In Mengla, community attributes were significantly positively correlated with mean annual maximum temperature, mean annual temperature, mean relative humidity, ammonium nitrogen, total nitrogen, and total phosphorus, and significantly negatively correlated with aspect and mean annual minimum temperature.
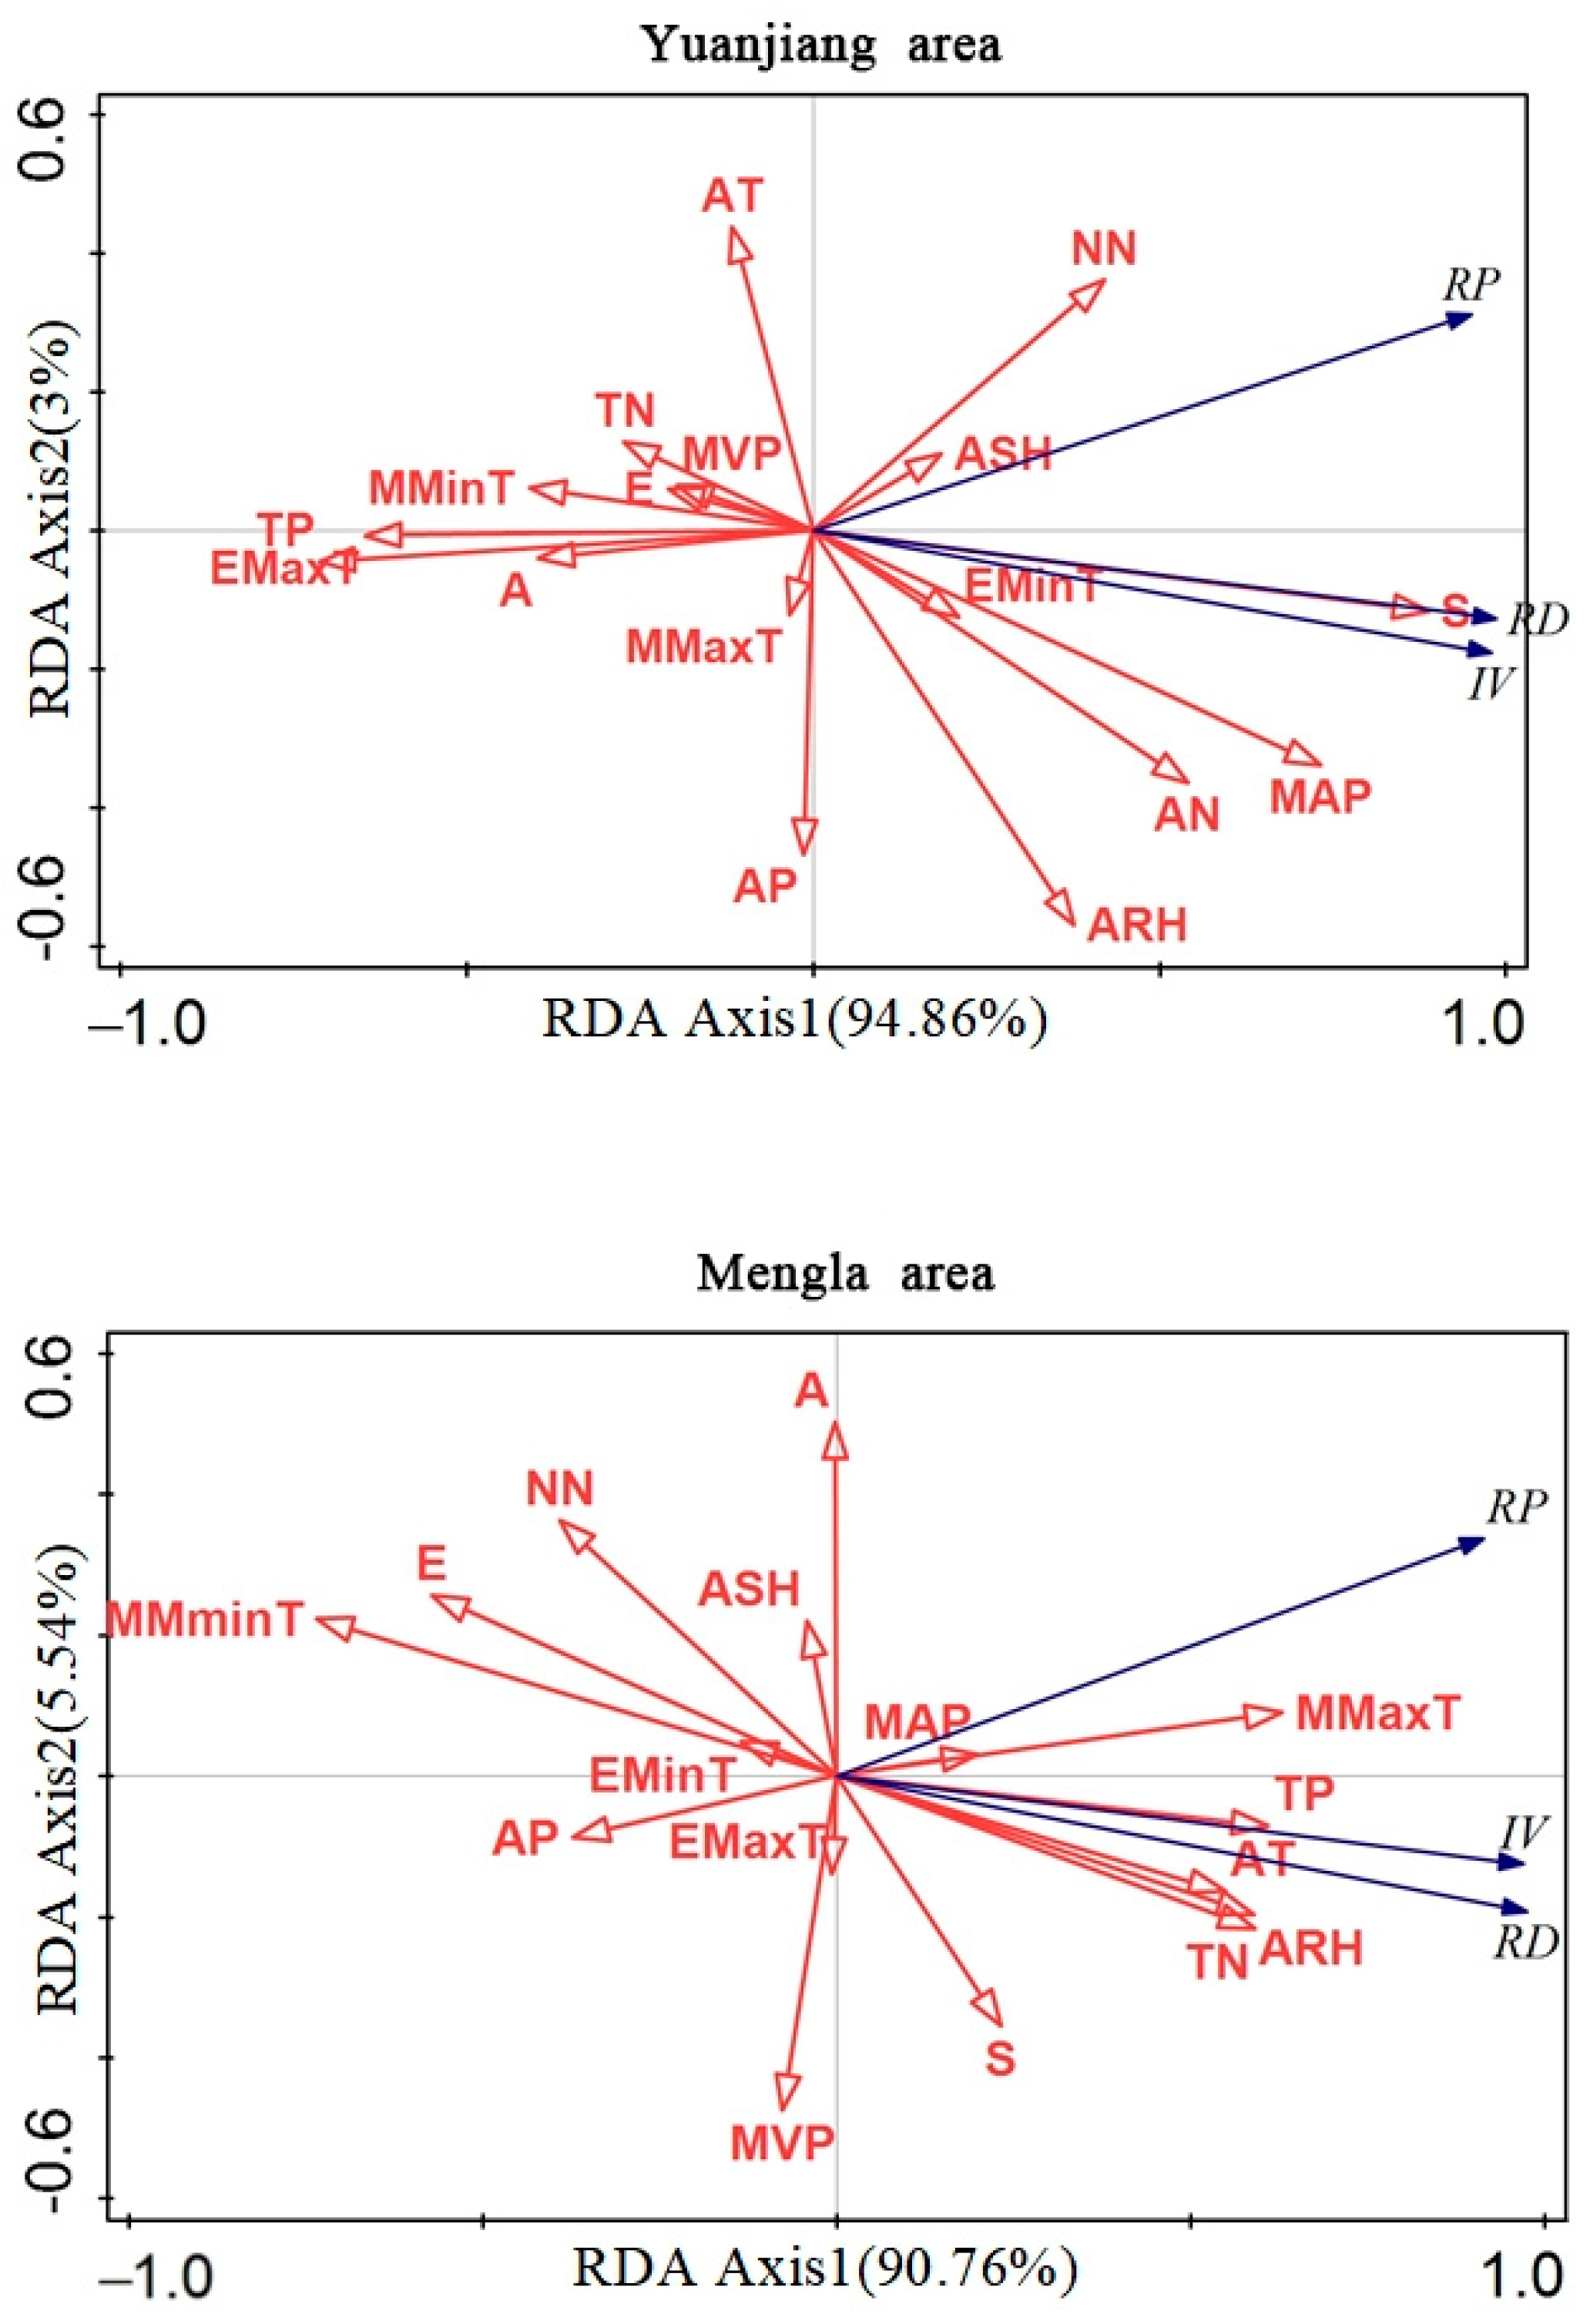
Redundancy analysis (RDA) showed that the cumulative explanatory power of the first two axes was 94.86% in Yuanjiang and 90.76% in Mengla (Figure 4). In Yuanjiang, the dominant environmental drivers were slope (74.7%), nitrate nitrogen (7.3%), total nitrogen (5.6%), and mean annual precipitation (3.8%), indicating water–topography coupling regulation. In Mengla, the primary drivers were mean annual minimum temperature (49.3%), mean annual maximum temperature (16.9%), slope (8.3%), and available phosphorus (2.7%), reflecting phosphorus limitation and thermal control of community assembly.

4. Discussion

4.1. Species Composition and Community Structure in Contrasting Habitats

Species richness differed significantly between habitats, with 41 species recorded in the Mengla tropical rainforest and only 19 species in the Yuanjiang dry-hot valley. This pattern reflects strong environmental filtering in extreme habitats. The hot and drought-stressed dry-hot valley filters out most species, leaving only drought-tolerant taxa such as Euphorbia royleana and Leucaena leucocephala, resulting in lower diversity. In contrast, the warm and humid tropical rainforest supports higher diversity and more complex community structure, with vines including Pueraria montana var. lobata occupying key ecological niches.
Both communities contained a substantial proportion of tropical Asian floristic elements, consistent with Yunnan’s biogeographic position at the transition between tropical and subtropical zones [30].

4.2. Spatial Distribution Patterns and Interspecific Associations

The spatial structure of Bombax ceiba-associated plant communities is influenced by the combined effects of environmental filtering and spatial ecological processes [31]. Environmental factors such as water availability, soil nutrients, and temperature create heterogeneous habitat conditions that select for species with specific ecological traits. At the same time, spatial processes such as dispersal limitation and localized seed recruitment contribute to the aggregated spatial patterns of many associated species. The interaction between these environmental and spatial mechanisms ultimately shapes community structure in both habitats.

4.3. Environmental Drivers of Community Assembly

The distinct environmental drivers underlying community assembly in the two habitats support our original hypothesis. In the dry-hot valley, community characteristics exhibited significant positive correlations with slope, mean annual precipitation (MAP), and ammonium nitrogen (AN), suggesting that community assembly is primarily regulated by the water–topography coupling effect. Slope modulates surface runoff and soil water redistribution [32], thereby generating fine-scale microhabitat heterogeneity. As the dominant available nitrogen source in dry soils, AN promotes spatial aggregation of pioneer species such as Huberantha cerasoides. The negative correlation with extreme maximum temperature (EMaxT) further indicates that extreme high temperatures suppress physiological activities of most associated species [33].
In the tropical rainforest, community characteristics showed significant positive correlations with total phosphorus (TP), available phosphorus (AP), and annual mean temperature (AT), reflecting phosphorus limitation and thermal control of community assembly [34]. The positive effect of phosphorus corresponds well with widespread phosphorus deficiency in highly weathered tropical soils, while the positive temperature effect demonstrates thermal adaptation of tropical plant taxa. The negative correlation with mean annual minimum temperature (MMinT) suggests that low temperature acts as a key limiting factor shaping community distribution in tropical rainforests [35].

4.4. Implications for Conservation and Restoration

Our results provide practical implications for vegetation restoration in dry-hot valleys and biodiversity conservation in tropical rainforests. In dry-hot valleys, restoration strategies should prioritize soil water conservation through terracing and landscape restructuring, combined with the use of native drought-tolerant species such as Huberantha cerasoides and Euphorbia royleana. In tropical rainforests, conservation efforts should focus on protecting soil phosphorus resources, maintaining thermal habitat stability, and strengthening invasive species control to sustain native plant diversity [36].
Although our plot number was limited by terrain and conservation restrictions, the selected sites represent typical Bombax ceiba communities across contrasting habitats. Future studies with expanded replication and broader spatial gradients will help further validate these patterns. The climatic variables used in this study represent regional conditions rather than plot-level microclimate, which introduces minor uncertainty that can be reduced in future work.
The scale-dependent shifts in species associations observed in this study suggest that ecological interactions vary across spatial distances and environmental gradients. At small spatial scales, negative associations are likely driven by resource competition among neighboring individuals. In contrast, positive associations observed at larger spatial scales may reflect habitat heterogeneity or facilitative interactions among species. These scale-dependent patterns indicate that both competitive and facilitative processes may coexist within plant communities, with their relative importance varying across environmental conditions and spatial scales [37].

5. Conclusions

(1) Species richness was significantly higher in the tropical rainforest (41 species from 33 families) than in the dry-hot valley (19 species from 14 families). Both habitats were enriched with tropical Asian floristic components.
(2) Dominant associated species in both habitats showed aggregated spatial distributions at the 0–7 m scale. Interspecific associations were scale-dependent: in the dry-hot valley, associations shifted between positive and negative at fine scales and became positively associated at broader scales; in the tropical rainforest, negative associations prevailed at fine scales while positive associations increased at larger scales.
(3) Community assembly was driven by distinct environmental mechanisms: the dry-hot valley was regulated by water–topography coupling, whereas the tropical rainforest was controlled by phosphorus limitation and thermal conditions.

Author Contributions

Conceptualization and software, M.Z.; writing—original draft preparation and visualization, M.B.; project administration, X.C. All authors have read and agreed to the published version of the manuscript.

Funding

This research received no external funding.

Data Availability Statement

The data presented in this study are available within the article. Further inquiries can be directed to the corresponding authors.

Conflicts of Interest

The authors declare no conflicts of interest.

References

  1. Liu, X.Q.; Feng, Y.H.; Hu, T.Y.; Luo, Y.; Zhao, X.; Wu, J.; Maeda, E.E.; Ju, W.; Liu, L.; Guo, Q.; et al. Enhancing ecosystem productivity and stability with increasing canopy structural complexity in global forests. Sci. Adv. 2024, 10, 14. [Google Scholar] [CrossRef]
  2. Mori, A.S.; Lertzman, K.P.; Gustafsson, L. Biodiversity and ecosystem services in forest ecosystems: A research agenda for applied forest ecology. J. Appl. Ecol. 2017, 54, 12–27. [Google Scholar] [CrossRef]
  3. Wang, G.G.; Lu, D.L.; Gao, T.; Zhang, J.; Sun, Y.; Teng, D.; Yu, F.; Zhu, J. Climate-smart forestry: An AI-enabled sustainable forest management solution for climate change adaptation and mitigation. J. For. Res. 2024, 36, 10. [Google Scholar] [CrossRef]
  4. Jiang, S.J.; Liu, Y.J.; Luo, J.J.; Qin, M.; Johnson, N.C.; Öpik, M.; Vasar, M.; Chai, Y.; Zhou, X.; Mao, L.; et al. Dynamics of arbuscular mycorrhizal fungal community structure and functioning along a nitrogen enrichment gradient in an alpine meadow ecosystem. New Phytol. 2018, 220, 1222–1235. [Google Scholar] [CrossRef] [PubMed]
  5. Trivedi, P.; Leach, J.E.; Tringe, S.G.; Sa, T.; Singh, B.K. Plant-microbiome interactions: From community assembly to plant health. Nat. Rev. Microbiol. 2020, 18, 607–621. [Google Scholar] [CrossRef] [PubMed]
  6. Uriarte, M.; Muscarella, R.; Zimmerman, J.K. Environmental heterogeneity and biotic interactions mediate climate impacts on tropical forest regeneration. Glob. Change Biol. 2018, 24, E692–E704. [Google Scholar] [CrossRef] [PubMed]
  7. Wang, W.J.; He, H.S.; Thompson, F.R.; Spetich, M.A.; Fraser, J.S. Effects of species biological traits and environmental heterogeneity on simulated tree species distribution shifts under climate change. Sci. Total Environ. 2018, 634, 1214–1221. [Google Scholar] [CrossRef]
  8. Raven, C.E.; Howe, A.G.; Rentz, D.C.F.; Mackintosh, E.J.; Marshall, A.R.; Nahrung, H.F. Precipitation and tree biomass correlate with the diversity and functional composition of tropical rainforest cricket assemblages across climate and disturbance gradients. Ecography 2026, 2026, 15. [Google Scholar] [CrossRef]
  9. Yu, Q.S.; Anthony, M.A.; Gessler, A.; Tan, X.; Zhu, J.; Ji, C.; Tang, Z.; Fang, J. Decadal nutrient addition reveals phosphorus limitation and its adaptive mechanisms in tropical rainforests. Soil. Biol. Biochem. 2025, 211, 9. [Google Scholar] [CrossRef]
  10. Luo, Y.; Shi, C.M.; Yang, S.T.; Liu, Y.; Zhao, S.; Zhang, C. Characteristics of Soil Calcium Content Distribution in Karst Dry-Hot Valley and Its Influencing Factors. Water 2023, 15, 13. [Google Scholar] [CrossRef]
  11. Guo, J.Q.; Xi, W.F.; Huang, G.C.; He, G.; Shi, L.; Yang, Z.; Ding, Z.; Wang, L.; Cao, R. Study on erosion deformation of dry-red soil in Yuanmou dry-hot valley with different elevation gradients based on SBAS-InSAR technology. Front. Earth Sci. 2024, 12, 18. [Google Scholar] [CrossRef]
  12. Yang, F.C.; He, Q.; Huang, H.P.; Cui, Y.; Gou, J.; Sarathchandra, C.; Prueksakorn, K.; Hashimoto, K.; Liu, L. Biodiversity and Abundance of Angiosperms and Environmental Resilience in the Tidal Range of Yuanjiang Dry-Hot Valley, Southwestern China. Diversity 2024, 16, 15. [Google Scholar] [CrossRef]
  13. Qian, L.S.; Chen, J.H.; Deng, T.; Sun, H. Plant diversity in Yunnan: Current status and future directions. Plant Divers. 2020, 42, 281–291. [Google Scholar] [CrossRef]
  14. Zhang, X.S.; Guo, J.J.; Yi, T.C.; Jin, D.-C. Two new species of the genus Onchodellus (Acari: Pachylaelapidae) from China. Zootaxa 2020, 4801, 450–460. [Google Scholar] [CrossRef]
  15. Zhu, H.; Tan, Y.H.; Yan, L.C.; Liu, F. Flora of the Savanna-like Vegetation in Hot Dry Valleys, Southwestern China with Implications to their Origin and Evolution. Bot. Rev. 2020, 86, 281–297. [Google Scholar] [CrossRef]
  16. Wang, Y.F.; Zhang, Y.P.; Mao, K.Z.; Li, W.; Cheng, X. Morphological responses of Bombax ceiba to habitat heterogeneity in Southwest China. Front. Ecol. Evol. 2023, 10, 8. [Google Scholar] [CrossRef]
  17. Hassan, M.O. Leaf litter of Bombax ceiba L. threatens plant cover and floristic diversity in a new urban ecosystem. Flora 2018, 242, 22–30. [Google Scholar] [CrossRef]
  18. Panwar, P.; Pal, S.; Chakravarty, S.; Alam, N.M. Soil quality and production of low land paddy under agrisilviculture systems in acid soil of West Bengal, India. Range Manag. Agrofor. 2013, 34, 51–57. [Google Scholar]
  19. Luo, J.H.; Hong, W.J.; Yang, J.D.; Jiang, K.; Tan, Z.; He, Q.; Zhang, H.; Cui, J. Bombax ceiba is a Good Native Tree Species for Performing Reforestation to Restore Highly Degraded Tropical Forests in Hainan Island, China. Front. Environ. Sci. 2021, 9, 8. [Google Scholar] [CrossRef]
  20. Martin, P.H.; Canham, C.D. Peaks in frequency, but not relative abundance, occur in the center of tree species distributions on climate gradients. Ecosphere 2020, 11, 3149. [Google Scholar] [CrossRef]
  21. Pottker, G.S.; De Oliveira, P.C.; Figueiredo, A.; Dalmaso, C.A. Spatial pattern of forest species: Case study with Ocotea odorifera (Vell.) Rohwer. Cienc. Florest. 2016, 26, 1097–1106. [Google Scholar] [CrossRef]
  22. Balpinar, N.; Kavgaci, A.; Bingöl, M.; Ketenoğlu, O. Diversity and gradients of vegetation of Sivrihisar Mountains (Eskisehir-Turkey). Acta Bot. Croat. 2018, 77, 18–27. [Google Scholar] [CrossRef]
  23. Wang, Z.Z.; Zhang, P.; He, K.; Zhu, S.-Y.; Pu, B. Diversity and distribution patterns of soil macroarthropod communities in the Nianchu River Basin, Tibet, China. Front. Ecol. Evol. 2024, 12, 1297609. [Google Scholar] [CrossRef]
  24. Sarkar, B.; Saha, N.; Mukherjee, S.; Basak, J.S.; Dutta, S.; Dey, D.; Dey, P. Selection of an Extraction Method Suitable for Estimating Potentially Available Phosphorus Under the Organic Production System of New Alluvial Zone of the Lower Gangetic Plain of India. J. Soil. Sci. Plant Nutr. 2023, 23, 2404–2417. [Google Scholar] [CrossRef]
  25. Siegenthaler, A.; Welch, B.; Pangala, S.R.; Peacock, M.; Gauci, V. Technical Note: Semi-rigid chambers for methane gas flux measurements on tree stems. Biogeosciences 2016, 13, 1197–1207. [Google Scholar] [CrossRef]
  26. Calazans, S.O.L.; Morais, V.A.; Scolforo, J.R.S.; Zinn, Y.L.; Mello, J.M.; Mancini, L.T.; Silva, C.A. Soil organic carbon as a key predictor of N in forest soils of Brazil. J. Soils Sediments 2018, 18, 1242–1251. [Google Scholar] [CrossRef]
  27. Quy, N.V.; Dien, P.V.; Manh, V.; Duy, D.B.; Hung, B.M.; Canh, N.M.; Long, N.T.; Van Cuong, L. Interspecific Relationships and Community Stability in the Evergreen and Semi-Deciduous Forests of Nui Cau-Dau Tieng, Southern Vietnam. Biol. Bull. 2026, 52, 384. [Google Scholar]
  28. Santos-Neves, P.S.; Neves, S.P.S.; Da Costa, G.M.; Villa, P.M.; Rossatto, D.R.; Funch, L.S. Leaf phenology and functional traits interplay along an aridity gradient in tropical dry forests. J. Arid Environ. 2026, 235, 105579. [Google Scholar] [CrossRef]
  29. Aricak, B.; Genç, Ç. Technical Efficiency Evaluation of Forest Roads with Respect to Topographical Factors and Soil Characteristics. Balt. For. 2018, 24, 123–130. [Google Scholar]
  30. Xie, B.; Jones, P.; Dwivedi, R.; Bao, L.; Liang, R. Evaluation, comparison, and unique features of ecological security in southwest China: A case study of Yunnan Province. Ecol. Indic. 2023, 153, 110453. [Google Scholar] [CrossRef]
  31. Carvalho, C.P.; Cardoso-Gustayson, P.; Rodrigues, E.; Braga, M.R.; Mercier, H.; Nievola, C.C. Low temperature acclimation and de-acclimation of the subtropical bromeliad Nidularium minutum: Implications of changes in the NO, sugar content and NR activity. Environ. Exp. Bot. 2019, 159, 34–43. [Google Scholar] [CrossRef]
  32. Fan, C.C.; Wang, H.Z. The behavior of wetting front on slopes with different slope morphologies during rainfall. J. Hydro-Environ. Res. 2019, 25, 48–60. [Google Scholar] [CrossRef]
  33. Naseef, A.; Javad, A.; Kausal, A.K.; Barua, D.; Ashtamoorthy, S.K. High heat tolerance and thermal safety margins in mangroves from the southwestern coast of India. Sci. Total Environ. 2024, 954, 176366. [Google Scholar] [CrossRef] [PubMed]
  34. Zou, X.; Krebs, L.; Richter, F.; Mo, Y.; Singh, A.K.; Chen, C.; Liu, W.; Buchmann, N. Tropical forest restoration promotes soil phosphorus bioavailability in SW China: Processes and predictors. Agric. Ecosyst. Environ. 2025, 381, 109459. [Google Scholar] [CrossRef]
  35. Thakur, D.; Altman, J.; Jandova, V.; Fibich, P.; Münzbergová, Z.; Doležal, J. Global warming alters Himalayan alpine shrub growth dynamics and climate sensitivity. Sci. Total Environ. 2024, 916, 170252. [Google Scholar] [CrossRef]
  36. Zhang, H.Q.; Zhang, T.; Zhou, Y.D.; Huang, C.; Qiu, X.; Feng, G.; Long, W.; Ding, Y. Litterfall production in tropical natural forests on Hainan Island: Variations across vegetation types and dependence on community properties. Ecol. Indic. 2025, 177, 113759. [Google Scholar] [CrossRef]
  37. Hou, Y.H.; Li, X.A.; Wang, S.P.; Simons, N.K.; Craven, D.; Wang, C. Land use conversion weakens the cascading effects of plant diversity on temporal stability of high trophic levels at multiple spatial scales in grasslands. Agric. Ecosyst. Environ. 2025, 392, 109742. [Google Scholar] [CrossRef]
Figure 1. Location of the two study sites in Yunnan Province, Southwest China, with digital elevation models (DEMs): (a) Yuanjiang dry-hot valley and (b) Mengla tropical rainforest.
Forests 17 00531 g001
Figure 2. Spatial pattern analysis of dominant Bombax ceiba-associated plants in the two habitats: (a) Yuanjiang dry-hot valley; (b) Mengla tropical rainforest.
Forests 17 00531 g002
Figure 3. Pearson correlation heat maps of community characteristics and environmental variables in the two habitats: (a) Yuanjiang dry-hot valley; (b) Mengla tropical rainforest.
Forests 17 00531 g003
Figure 4. Redundancy analysis (RDA) of environmental factors and Bombax ceiba-associated plant communities in the two habitats.
Forests 17 00531 g004
Table 1. Summary of species composition and importance values (IV) of major associated species in the two habitats: (a) Yuanjiang dry-hot valley; (b) Mengla tropical rainforest.
SpeciesSpecies
Richness (D)
Relative
Abundance (RD)
Relative
Frequency (RF)
Relative
Dominance (RP)
Importance
Value (IV)
(a)
Huberantha cerasoides
(syn. Polyalthia cerasoides)
3000.210.130.210.18
Euphorbia royleana1920.140.120.160.14
Leucaena leucocephala1890.130.060.150.12
Tsaiodendron dioicum1410.100.070.080.08
Trigonostemon tuberculatus1140.080.110.060.08
Breynia rostrata810.060.030.050.04
Murraya koenigii780.060.050.040.05
Vitex negundo750.050.060.020.05
Boehmeria penduliflora690.050.060.020.04
Lannea coromandelica360.030.080.040.05
Aloe vera330.020.050.020.03
Haldina cordifolia270.020.050.030.03
Alibzia mollis210.010.030.010.02
Barleria cristata120.010.010.000.01
Abrus pulchellus90.010.020.010.01
Garuga forrestii90.010.020.030.02
Tamarindus indica60.000.020.060.03
Woodfordia fruticosa60.000.020.000.01
Ficus microcarpa60.000.020.010.01
Total1404////
(b)
Pueraria montana var. lobata 4170.110.060.070.08
Broussonetia papyrifera990.030.020.170.07
Cassia fistula1020.030.020.210.07
Passiflora foetida2640.070.060.070.07
Commelina communis2160.060.050.040.05
Argyreia menglaensis1350.030.050.060.05
Dalbergia volubilis1380.040.040.050.04
Rubus alceaefolius1140.030.030.070.04
Flemingia macrophylla1470.040.030.060.04
Helicia velutina570.010.030.060.04
Cayratia japonica840.020.050.040.04
Ricinus communis1200.030.020.070.04
Sesbania cannabina1980.050.030.040.04
Pennisetum purpureum1980.050.030.030.04
Phyllanthus reticulatus990.030.020.070.04
Clerodendrum bungei990.030.030.060.04
Dillenia indica490.010.010.080.04
Litsea cubeba510.010.040.030.03
Clerodendrum philippinum210.010.030.040.03
Mallotus barbatus240.010.010.060.03
Albizia corniculata630.020.030.030.02
Ficus hispida240.010.010.060.02
Neolamarckia cadamba240.010.010.060.02
Pouzolzia zeylanica720.020.030.030.02
Cajanus crassus780.020.030.020.02
Thysanolaena latifolia360.010.030.020.02
Ficus auriculata180.000.010.040.02
Solanum torvum1020.030.010.020.02
Manihot esculenta390.010.020.010.01
Piper sarmentosum390.010.010.020.01
Spondias pinnata120.000.010.030.01
Tamarindus indica90.000.010.020.01
Desmodium gangeticum180.000.010.010.01
Buddleja officinalis210.010.020.000.01
Lagerstroemia indica180.000.010.000.01
Total3205////
Table 2. Topographic characteristics of Bombax ceiba habitats in Yuanjiang and Mengla.
Topographic FactorsMengla
(Mean ± SD)
Yuanjiang
(Mean ± SD)
p Value
Elevation (m)503.13 ± 7.90402.87 ± 85.22≤0.01
Slope (°)5.40 ± 1.7718.17 ± 13.48≤0.01
Aspect4.12 ± 1.715.29 ± 2.15≤0.01
Table 3. Meteorological variables in Yuanjiang and Mengla.
Meteorological FactorsMengla
(Mean ± SD)
Yuanjiang
(Mean ± SD)
Significance
Extreme minimum temperature (°C)6.83 ± 2.106.30 ± 2.23p ≤ 0.01
Extreme maximum temperature (°C)36.53 ± 1.4740.83 ± 1.21p > 0.05
Mean annual precipitation (mm)1518.82 ± 386.25791.40 ± 234.56p ≤ 0.01
Mean annual temperature (°C)21.97 ± 0.4024.10 ± 0.82p ≤ 0.01
Mean vapor pressure (hPa)21.53 ± 0.5820.03 ± 0.70p ≤ 0.05
Mean relative humidity (%)82.14 ± 2.2067.22 ± 4.11p ≤ 0.01
Mean annual minimum temperature (°C)18.00 ± 0.4019.52 ± 0.73p ≤ 0.01
Mean annual maximum temperature (°C)29.34 ± 0.7031.02 ± 0.93p ≤ 0.01
Annual sunshine hours (h)1930.15 ± 247.322288.07 ± 261.44p ≤ 0.01
Table 4. Soil physicochemical properties in Yuanjiang and Mengla.
Soil FactorsMengla
(Mean ± SD)
Yuanjiang
(Mean ± SD)
Significance
Available Phosphorus (mg·kg−1)4.23 ± 2.085.27 ± 3.27p ≤ 0.01
Ammonium Nitrogen (mg·kg−1)2.73 ± 1.217.83 ± 7.70p ≤ 0.01
Nitrate Nitrogen (mg·kg−1)27.71 ± 0.7322.76 ± 13.02p ≤ 0.01
Total Nitrogen (g·kg−1)1.76 ± 0.461.83 ± 0.75p ≤ 0.01
Total Phosphorus (g·kg−1)0.93 ± 0.100.79 ± 0.17p ≤ 0.01
Table 5. Explanatory rates of environmental factors for Bombax ceiba-associated community composition in Yuanjiang and Mengla.
Yuanjiang AreaMengla Area
Habitat FactorsExplained Variation%pHabitat FactorsExplained Variation%p
Slope (S)74.7%0.002Mean Annual Minimum Temperature (MMinT)49.3%0.002
Nitrate Nitrogen (NN)7.3%0.012Extreme Maximum Temperature (MMaxT)16.9%0.010
Total Nitrogen (TN)5.6%0.006Slope (S)8.3%0.022
Mean Annual Precipitation (MAP)3.8%0.016Mean Annual Precipitation (MAP)3.5%0.118
Mean Annual Temperature (AT)2.3%0.020Available Phosphorus (AP)2.7%0.190
Altitude (A)2%0.012Annual Sunshine Hours (ASH)2.6%0.210
Extreme Minimum Temperature (EMinT)0.8%0.128Mean Vapor Pressure (MVP)2%0.234
Mean Relative Humidity (ARH)0.8%0.108Total Nitrogen (TN)1.5%0.356
Extreme Maximum Temperature (EMaxT)0.5%0.190Annual Maximum Temperature (EMaxT)2.2%0.204
Mean Vapor Pressure (MVP)0.3%0.308Altitude (A)2.1%0.226
Annual Sunshine Hours (ASH)0.4%0.268Nitrate Nitrogen (NN)0.6%0.606
Aspect (E)0.5%0.128Total Phosphorus (TP)0.6%0.596
Total Phosphorus (TP)0.3%0.210Aspect (E)0.8%0.484
Available Phosphorus (AP)0.4%0.086Mean Relative Humidity (ARH)1.1%0.456
Annual Maximum Temperature (MMaxT)0.2%0.106Extreme Minimum Temperature (EMinT)0.5%0.728
Annual Minimum Temperature (MMinT)≤0.1%0.396Mean Annual Temperature (AT)2.2%0.388
Ammonium Nitrogen (AN)≤0.1%0.413Ammonium Nitrogen (AN)≤0.1%0.395
Disclaimer/Publisher’s Note: The statements, opinions and data contained in all publications are solely those of the individual author(s) and contributor(s) and not of MDPI and/or the editor(s). MDPI and/or the editor(s) disclaim responsibility for any injury to people or property resulting from any ideas, methods, instructions or products referred to in the content.