Article

Multi-Criteria Selection of Urban Trees Integrating Ecosystem Services, Ecological Adaptability, and Ornamental Value: A Case Study in Kaifeng, China

1
College of Art and Design, Henan Agricultural University, Zhengzhou 450002, China
2
College of Landscape Architecture, Henan Agricultural University, Zhengzhou 450002, China
3
State Key Laboratory of Plateau Ecology and Agriculture, Qinghai University, Xining 810016, China
4
College of Animal Science and Technology, Henan University of Science and Technology, Luoyang 471003, China
5
School of Communication, Zhengzhou Normal University, Zhengzhou 450044, China
6
Aerotropolis Institute China, Zhengzhou 461700, China
*
Authors to whom correspondence should be addressed.
Forests 2026, 17(5), 529; https://doi.org/10.3390/f17050529
Submission received: 18 March 2026 / Revised: 20 April 2026 / Accepted: 23 April 2026 / Published: 27 April 2026
(This article belongs to the Special Issue Growth, Maintenance, and Function of Urban Trees)

Abstract

This study developed a comprehensive framework integrating ecosystem services (ESs), ecological adaptability, and ornamental value to guide tree species selection in historic cities constrained by soil salinization and subsurface heritage conservation. Taking Kaifeng, Henan Province, as a case study, we employed field surveys, i-Tree Eco, the Analytic Hierarchy Process, and K-means clustering to evaluate trees across protective, park, attached, and square green spaces. Results showed that carbon-related services dominated Kaifeng’s urban ES profile, with carbon storage (CS) and sequestration (CSE) value densities of 9.09 ¥·m−2 and 0.84 ¥·m−2·y−1, respectively. Air pollutant removal (AR) (0.21 ¥·m−2·y−1) and P (0.009 ¥·m−2·y−1) values remained comparatively low. Camphora officinarum Nees ex Wall delivered the highest annual ES value per tree (33.24 ¥·y−1). Plaza greenery outperformed other space types in overall service provision, and deciduous broadleaf species generated greater ES value than evergreen conifers. Cluster analysis identified four functional groups: stress-tolerant pioneers, balanced adapters, high-efficiency carbon sinks, and ornamental specialists—each suited to specific green space contexts. This integrated framework offers a transferable approach for evidence-based tree selection in saline historic cities, supporting nature-based solutions in urban green space (UGS) planning.

1. Introduction

UGSs serve as the core component of urban ecosystems, enhancing urban livability through CSE, oxygen release, air purification, runoff regulation, and heat island mitigation. They represent a key tool for nature-based solutions [1]. As key elements of UGSs, urban trees play an irreplaceable role in providing ecosystem services. Research by Nowak et al. indicates that urban trees contribute over 97% to urban CSE [2], while effectively reducing energy consumption and air pollutant emissions through shading and lowering building cooling demands [3,4]. With the accelerating urbanization process, how to scientifically quantify the ecosystem service value of urban trees and establish comprehensive tree species evaluation criteria integrating ecological adaptability and ornamental value has become a core issue requiring urgent resolution in the refined management of UGSs.
In the quantification of ecosystem services, research on UGSs has shifted from qualitative description to quantitative assessment, covering single or synergistic effects such as cooling, air purification, and CSE. Methodologically, it includes both data-based statistical models and expert-corrected models, as well as process-driven models represented by i-Tree. Nowak et al. (2013) established the methodological foundation for quantitative assessment of urban tree ecological functions based on the i-Tree model [2]. Ren et al. (2025) conducted a quantitative evaluation of CSE potential and multi-criteria carbon sink capacity of landscape tree species in Zhengzhou, providing important references for UGS ecosystem service research in China [4]. In terms of tree species characteristics and ecological adaptability, the extent to which urban trees provide ecosystem services is closely related to their morphological features and physiological processes [2]. The harsh constraints of urban environments, including poor soil conditions, high temperature stress, limited water and nutrients under impervious surfaces, and air pollution [5], make ecological adaptive traits such as drought tolerance, waterlogging resistance, low nutrient tolerance, shade endurance, and harmful gas resistance fundamental prerequisites for trees to continuously deliver ecosystem services. For instance, Shanghai’s research system evaluated the adaptability of arbor species to climate change, covering climate-related tolerances such as cold resistance, heat resistance, and drought resistance, as well as non-climate-related tolerances including wind resistance and pest/disease resistance, providing important references for urban tree species adaptability assessment [6]. Regarding ornamental value evaluation, urban arbor species encompass landscape function dimensions such as flower viewing, foliage viewing, fruit viewing, form viewing, and fragrance, offering communities recreational opportunities and pleasant landscapes that deliver significant psychological and aesthetic benefits [7]. The landscape functional value of plants can be assessed through methods like the replacement value approach. Goodness et al. further pointed out that integrating tree species’ functional traits with ecosystem service and landscape benefits is an effective approach to enhance the comprehensive benefits of UGSs [8]. Regarding the functional requirements of different types of green spaces, there are significant differences in the demands for ecological functions, adaptability, and landscape effects of tree species among various UGS types such as protective, park, attached, and square green spaces [9]. Sjöman et al. (2016) emphasized that targeted differential configuration is a key prerequisite for maximizing the comprehensive benefits of UGSs [10]. In terms of multi-criteria decision-making methods, the Analytic Hierarchy Process has been widely applied in UGS evaluation due to its advantages in multi-dimensional indicator weight allocation. The study by Ren et al., (2025) in Zhengzhou Metropolitan Area validated the effectiveness of multi-criteria clustering analysis in functional grouping and allocation recommendation of urban tree species [4], providing direct methodological reference for the framework of this research.
However, in terms of comprehensive tree species evaluation dimensions, although ecological adaptability characteristics such as drought tolerance and waterlogging tolerance, as well as ornamental value dimensions like flowering and foliage aesthetics, have received attention within their respective research contexts—and Martin et al. (2016) also highlighted that integrating functional traits of tree species with ecosystem services and landscape benefits is an effective approach to enhance the comprehensive benefits [11] of UGSs—two systemic shortcomings persist in current research: First, the three dimensions of ES, ecological adaptability, and ornamental value are often treated in isolation. Unlike studies focusing on a single ES metric like carbon sequestration (e.g., Ren et al., 2025) [4], this work integrates four services—carbon storage, sequestration, rainwater interception, and air pollutant removal—into a unified framework. In reality, these dimensions are interdependent: species with inadequate adaptability cannot consistently deliver ecological services over time, while neglecting ornamental value diminishes the social acceptability of green spaces. Any single-dimensional tree species selection criterion falls short of supporting the refined configuration needs of UGSs. Second, existing research predominantly remains at the assessment level, with few studies translating quantitative results directly into differentiated tree species configuration guidelines tailored to various types of green spaces. Distinguishing from generalized evaluations, this study addresses the specific constraints of saline–alkali soils and “layered city” sites in Kaifeng, translating findings into practical guidelines. As a historic cultural city constrained by both saline–alkali soils and the preservation of “layered city” historical sites, Kaifeng stands as a typical representative among numerous plain-based historic cities in China and East Asia that face dual challenges of soil salinization and cultural heritage conservation. It provides a unique research window for constructing a comprehensive evaluation framework for UGS tree species that balances ecological constraints and cultural preservation [12].
To address the aforementioned research gaps, this study focuses on UGSs in the main urban area of Kaifeng City, aiming to establish a comprehensive evaluation and tree species recommendation system for UGS trees that integrate ecosystem services, ecological adaptability, and ornamental value. The main objectives of this study include: 1. Quantifying and comparing multi-dimensional ecosystem services provided by trees across four UGS types (protective, park, attached, and square green spaces) in Kaifeng. 2. Developing an integrated multi-criteria evaluation (MCE) framework that couples ecosystem service provision with ecological adaptability and ornamental value. 3. Providing site-specific tree selection guidelines based on functional species groups tailored to different UGS types. The objective is to provide a practical framework for tree species selection in historical cities with saline–alkali land and to support the integration of Nature-Based Solutions into UGS planning.

2. Materials and Methods

2.1. Research Area and Methods

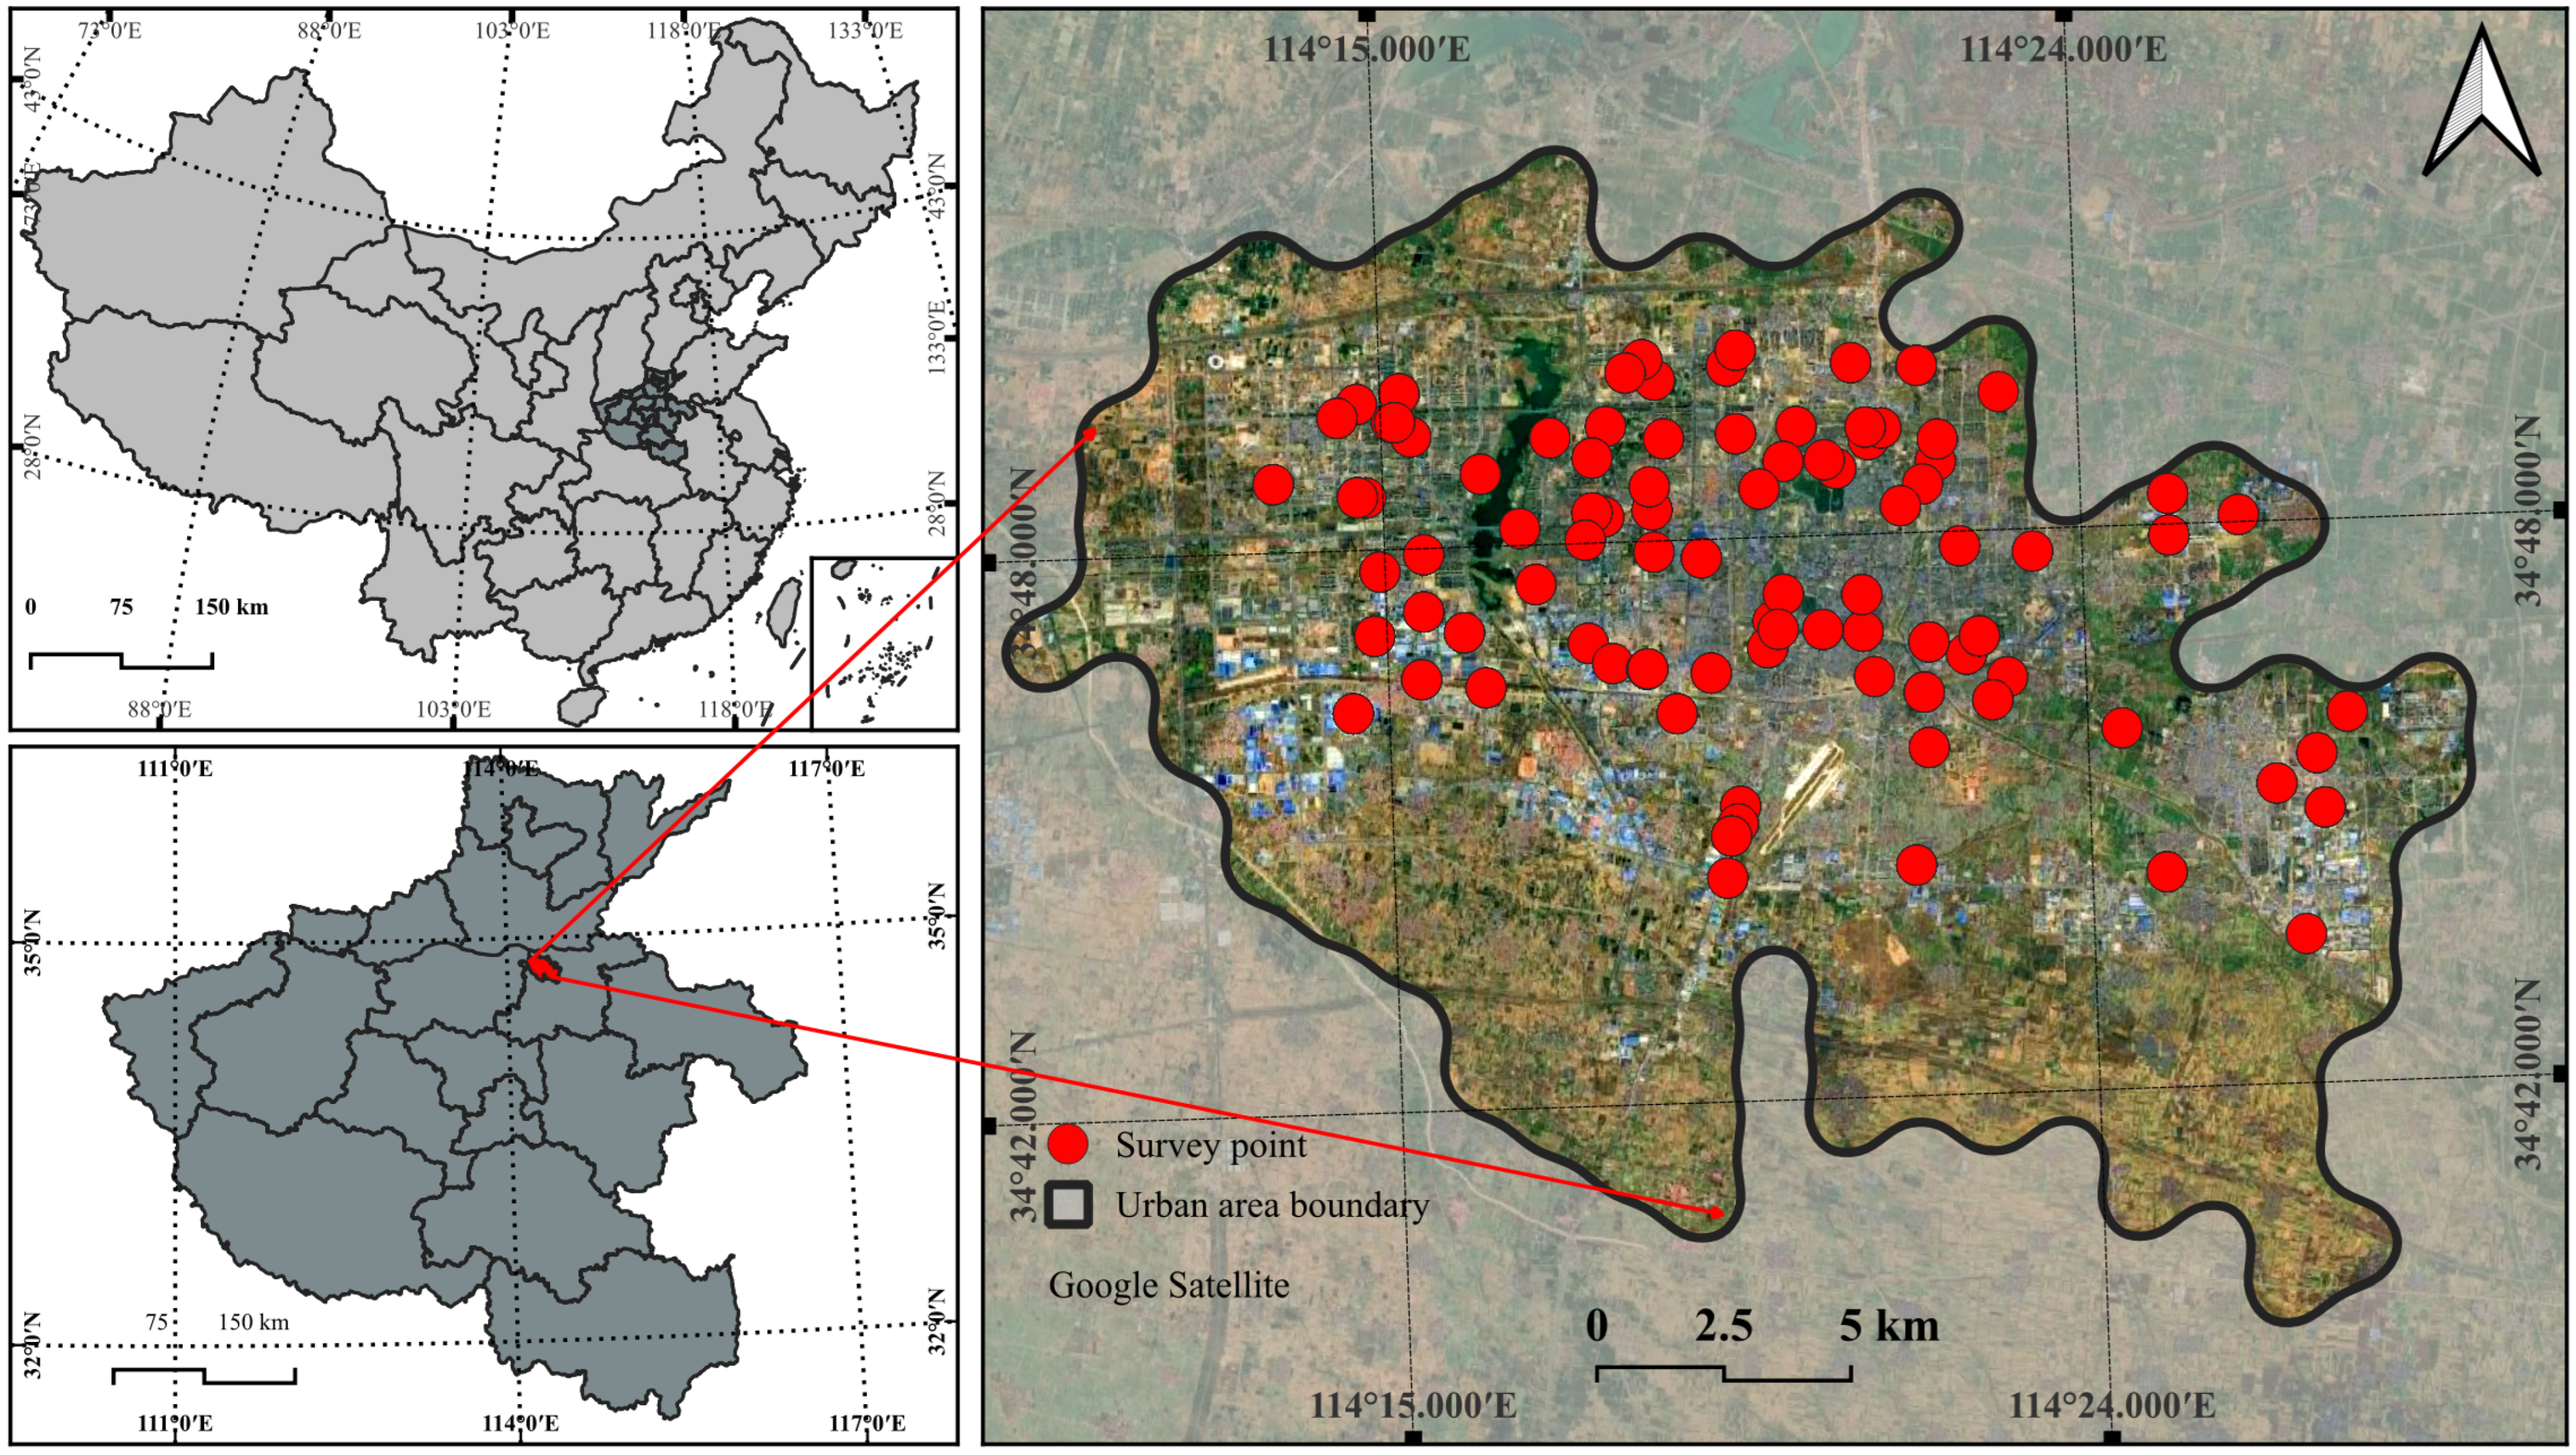
Kaifeng City is located in the central-eastern part of Henan Province, on the southern bank of the lower Yellow River, and is a typical plain city. Constrained by the elevated Yellow River to the north, as well as the military airport and Longhe Railway to the south, the urban space primarily expands along the east–west axis. This study focuses on four central urban districts—Longting District, Shunhe Hui District, Gulou District, and Yuwangtai District—as the research area (Figure 1). This region represents Kaifeng’s most concentrated historical and cultural core, boasting the most comprehensive urban functions. In recent years, the per capita park green space has reached 14.1 m2, but issues such as land scarcity in the old city and uneven green space development between old and new urban areas remain prominent. As one of the first batch of national historical and cultural cities, Kaifeng’s “city layered upon city” underground ruins impose strict limitations on the allocation of large-sized trees. Simultaneously, the significant issue of soil salinization poses continuous stress on urban tree growth [12], making it a typical case study area for comprehensive evaluation of tree species in UGSs within historical cities on saline–alkali land.

2.2. Research Methods

2.2.1. Field Survey Methods

Based on the GF-2 satellite imagery data acquired in September 2022 (with a spatial resolution of 0.8 m), the study area was divided into 1 km × 1 km grids using GIS technology. Preset sample plots were visually interpreted from four types of green spaces: protective green space (PRGS) refers to the green space that aims to protect the ecological environment, reduce environmental pollution and improve ecological stability, such as the green space along urban highways, railways and arterial roads. Park green space (PGS) refers to the open green space in the city or region, which is used for leisure, recreation, fitness, viewing and ecological protection, and mainly includes city parks. Attached green space (AGS) refers to the green areas attached to specific urban construction sites (such as residential areas, schools, hospitals, enterprises and institutions, etc.), which mainly serve the functional needs of the sites to which they are attached, and have the functions of ecological regulation, landscaping and recreation. And square green space (SGS) refers to an urban public open space with vegetation and amenities, for civic use and ecological balance. It features public access and green coverage, distinct from commercial or private courtyard green spaces. During the field survey phase (from September to October 2022, corresponding to the late growth stage when the leaf area index of trees is relatively stable), the locations and quantities of the sample plots were appropriately adjusted according to the following criteria: (1) accessibility for field measurement, (2) the presence of measurable individual trees within the plot, and (3) representativeness of the dominant vegetation structure within the corresponding grid cell, to ensure that the selected plots could represent the average level of UGS within the corresponding grids. A total of 93 sample plots were ultimately surveyed. The distribution of sample plot quantities by green space type is as follows: 21 park green spaces, 44 attached green spaces, 20 protective green spaces, and 10 square green spaces, with the proportion of each type being generally consistent with the composition of green space area in the study region. The total sample size of 93 plots is comparable to or exceeds those employed in similar i-Tree Eco-based urban forest assessments [13], and the allocation across strata was designed to be approximately proportional to the areal share of each green space type within the study area, thereby enhancing the representativeness of the sampling scheme. Using a 20 m × 20 m plot size, structural parameters of all trees within the plots were recorded, including species name, height (H), diameter at breast height (DBH), crown width (CW) in north–south and east–west directions, and height under branches. Additionally, tree growth environment information was documented, such as distance to buildings, spatial type of vegetation in the plot (isolated trees, street trees, group planting, etc.), and land cover type, in preparation for subsequent parameter input into the i-Tree Eco model.

2.2.2. Ecosystem Service Calculation

This study employed the i-Tree Eco model [13] developed by the USDA Forest Service to quantitatively assess four ecosystem services: CS, CSE, AR, and P, based on field-measured structural data of individual trees and local environmental parameters. Local meteorological data were obtained from the hourly observations in 2022 at the Kaifeng Meteorological Station, while air pollutant concentration data were sourced from the 2022 monitoring records of the Kaifeng Municipal Bureau of Ecology and Environment. It should be noted that the allometric equations in i-Tree Eco were primarily developed from North American species. For Chinese native species, genus-level surrogate matching was applied following the protocol recommended by Hirabayashi, S et al. [13]. Local hourly meteorological data and air pollutant concentrations were imported to replace default parameters, ensuring the model reflected the warm-temperate monsoon climate conditions of Kaifeng. All local data were formatted according to i-Tree Eco standards before being imported into the model. The calculation methods for each ecosystem service are as follows:
CS and CSE.
The i-Tree Eco model estimates biomass based on tree DBH and then converts it to CS using a conversion factor of 0.5. The calculation formula is as follows:
C S = 0.5 × B
B = a D B H b
In the formula, B represents the aboveground biomass of trees, DBH is the diameter at breast height, and a and b are parameters automatically matched by the model for different tree species.
The annual CSE is calculated by the i-Tree Eco model based on the annual diameter at DBH growth of tree species and the user-inputted tree growth environment. The formula is:
C S E = 0.5 B x + 1 B x
Here, B(x+1) represents the biomass one year younger that is being estimated based on the diameter at breast height, and Bx denotes the current biomass.
AR amount.
The removal amount of air pollutants (P) is calculated based on the Leaf Area Index (LAI) and the local air pollutant concentration uploaded by users:
P = k × L A I × D
Here, k is the dry deposition velocity of pollutants, LAI is the leaf area index, and D is the local air pollutant concentration uploaded by the user.
The removal of multiple air pollutants is calculated by summing up the results obtained for different pollutant categories separately.
P t o t a l = i P i
Among them, LAI is calculated based on the canopy area and the total leaf area of trees generated by i-Tree Eco according to the leaf density of tree species:
L A I = L A C A P
C A P = π C W 2 2
Here, LA represents the total leaf area of the tree, CAP denotes the crown projection area, and CW stands for the tree crown width.
Rainwater interception capacity.
In i-Tree Eco, the rainwater interception volume is calculated based on the user-uploaded local rainfall data and the interception coefficient of the canopy coverage area.
A R = d × R A × C A P
In the formula, d is the canopy interception coefficient determined by the model based on tree species, CW, and leaf area, and RA is the local rainfall data uploaded by the user.
Monetary conversion.
The monetary value of each ecosystem service is calculated using the following formula:
V R A M = Q × P U S D × r
In the equation, Q represents the quantity of a specific ecosystem service, PUSD denotes the unit value of that service in the model, and r is the exchange rate between the US dollar and the Chinese yuan.

2.2.3. Evaluation of Ecological Adaptability and Ornamental Value

To systematically quantify the ecological adaptability of arbor species, this study determined the scoring criteria for each tree species’ adaptive capacity through extensive review of domestic and foreign floras, landscape plant manuals, and relevant academic literature. Literature screening followed these principles: peer-reviewed academic publications were prioritized; authoritative floras such as Flora of China and Sylva Sinica were consulted as secondary references; for species with inconsistent records across the literature, consensus descriptions from three or more sources were adopted, and conservative values (i.e., lower scores) were assigned when discrepancies persisted. The adaptive capacities of each species across five dimensions—drought tolerance, waterlogging tolerance, barren soil tolerance, shade tolerance, and resistance to harmful gases—were quantified using a 3-level scoring system: strong (3 points), moderate (2 points), and weak (1 point). The ornamental value of trees is evaluated based on five key aesthetic traits: ornamental flowers, foliage, fruits, tree form, and fragrance. A binary scoring method is adopted: 1 point is assigned if the ornamental feature is present, and 0 if absent, with a maximum total score of 5 points [4].

2.2.4. Construction of Evaluation Systems for Different Green Space Plants

There are significant differences in the demand for ecosystem services, ecological adaptability, and ornamental value of trees among different types of UGSs. Generally, protective green spaces are consistently exposed to vehicle emissions and soil compaction, requiring higher capabilities in AR as well as drought and barren soil tolerance. Park green spaces primarily serve recreational functions, placing greater emphasis on CS, CSE, and ornamental value. Attached green spaces are mostly located within residential areas and are closely related to daily human life, necessitating stronger abilities in AR and shade tolerance. Square green spaces feature extensive hard paving, requiring both tolerance to barren soil and drought conditions, along with certain ornamental value. Based on the above, this study invited 15 experts (including 5 landscape planning and design experts, 5 urban ecology experts, and 5 landscape botany experts) to use the Analytic Hierarchy Process method to score the relative importance of indicators across three dimensions in different green space types. The Analytic Hierarchy Process is a multi-criteria decision-making analysis method proposed by American operations researcher Thomas L. Saaty in the early 1970s [14]. This method aims to break down complex decision-making problems into hierarchical structures and address difficult-to-quantify decision issues through a combination of qualitative and quantitative approaches. Experts scored using the 1–9 scale method to construct judgment matrices for each green space type. After consistency testing (CR < 0.1), the weights of each indicator were calculated. All CR values passed the consistency test, and the weight results are shown in Table 1. All panel members hold senior academic or professional titles (associate professor or above) with a minimum of 10 years of experience in urban green space planning, urban forestry, or landscape ecology. The three-subgroup composition was designed to ensure balanced representation across ecological function assessment, site adaptability evaluation, and ornamental landscape design, thereby mitigating single-discipline bias. Each expert independently scored pairwise comparisons using the standard Saaty 1–9 scale. Individual judgment matrices were aggregated using the geometric mean method [15], which preserves the reciprocal property of AHP matrices and is the recommended approach for synthesizing group judgments. All aggregated matrices satisfied the consistency requirement (CR < 0.1, Table 1). To assess the robustness of the resulting weights, a Monte Carlo sensitivity analysis was performed (see Section 4.3 and Figure S1 in Supplementary Materials).

2.2.5. Cluster Analysis and Statistical Validation

After obtaining the three-dimensional comprehensive scores of various tree species through the AHP hierarchical analysis method, this study employed the K-means clustering approach to group arbor species. K-means clustering is a classical unsupervised learning algorithm used to partition a dataset into K clusters, where data points within the same cluster exhibit high similarity while those between different clusters show low similarity [15]. K-means offers advantages such as high computational efficiency, ease of implementation, and strong interpretability, making it particularly suitable for cluster analysis of large-scale datasets. For the i-th arbor species, a three-dimensional feature vector was constructed:
T i = S i , E i , O i
Here, Si, Ei, and Oi represent the ecosystem service score, ecological adaptability score, and ornamental value score of the species, respectively.
To eliminate dimensional effects, the range standardization method was used to preprocess each indicator:
Z i j = x i j m i n x j m a x x j m i n x j
Here, xij represents the original score of the i-th species on the j-th indicator, max(xj) and min(xj) are the maximum and minimum values of this indicator among all species respectively, and zij is the standardized value.
The objective function of K-means clustering is to minimize the within-cluster sum of squared errors (SSEs):
J = k = 1 x i C k x i μ k 2
Here, Ck represents the sample set of the k-th cluster; μk denotes the center (mean vector) of the k-th cluster; and‖ ‖ is the Euclidean distance norm.
The optimal number of clusters (K) was determined using the Elbow Method, which evaluates the within-cluster sum of squared errors (SSEs) across a range of K values. The K value at which the rate of SSE decreases markedly slowed (i.e., the “elbow” point) was selected as the optimal solution, balancing clustering compactness with model parsimony. The Elbow Method curves for each green space type are presented in Figure S3. The initial K values identified were 7 (protective), 6 (attached), 7 (park), and 8 (square). Upon ecological inspection, several clusters contained only 1–2 species, which were insufficient to constitute meaningful functional groups for practical planting recommendations. These minor clusters were therefore merged with their nearest neighboring clusters based on Euclidean distance between cluster centroids, resulting in final cluster numbers of 6 (protective), 6 (attached), 9 (park), and 6 (square). This post hoc merging step is a common practice in applied ecological clustering to ensure that each functional group contains a sufficient number of species for practical applicability. To further verify the ecological distinctiveness of the final clusters, one-way ANOVA was performed to test whether the three evaluation dimensions differed significantly among clusters within each green space type. The resulting clusters can be categorized into dominant tree species groups suitable for different green space configurations—such as protective green spaces, attached green spaces, park green spaces, and square green spaces—based on their characteristic tendencies across three-dimensional indicators.
One-way analysis of variance (ANOVA) followed by Tukey’s multiple range test were employed to assess the significant differences in ecosystem service values among various green space types and plant clusters. Statistical significance was defined at p < 0.05. All statistical analyses were performed using SPSS 26.0.

3. Results

3.1. Characteristics of UGS Structure and Current Status of Ecosystem Service in Kaifeng City

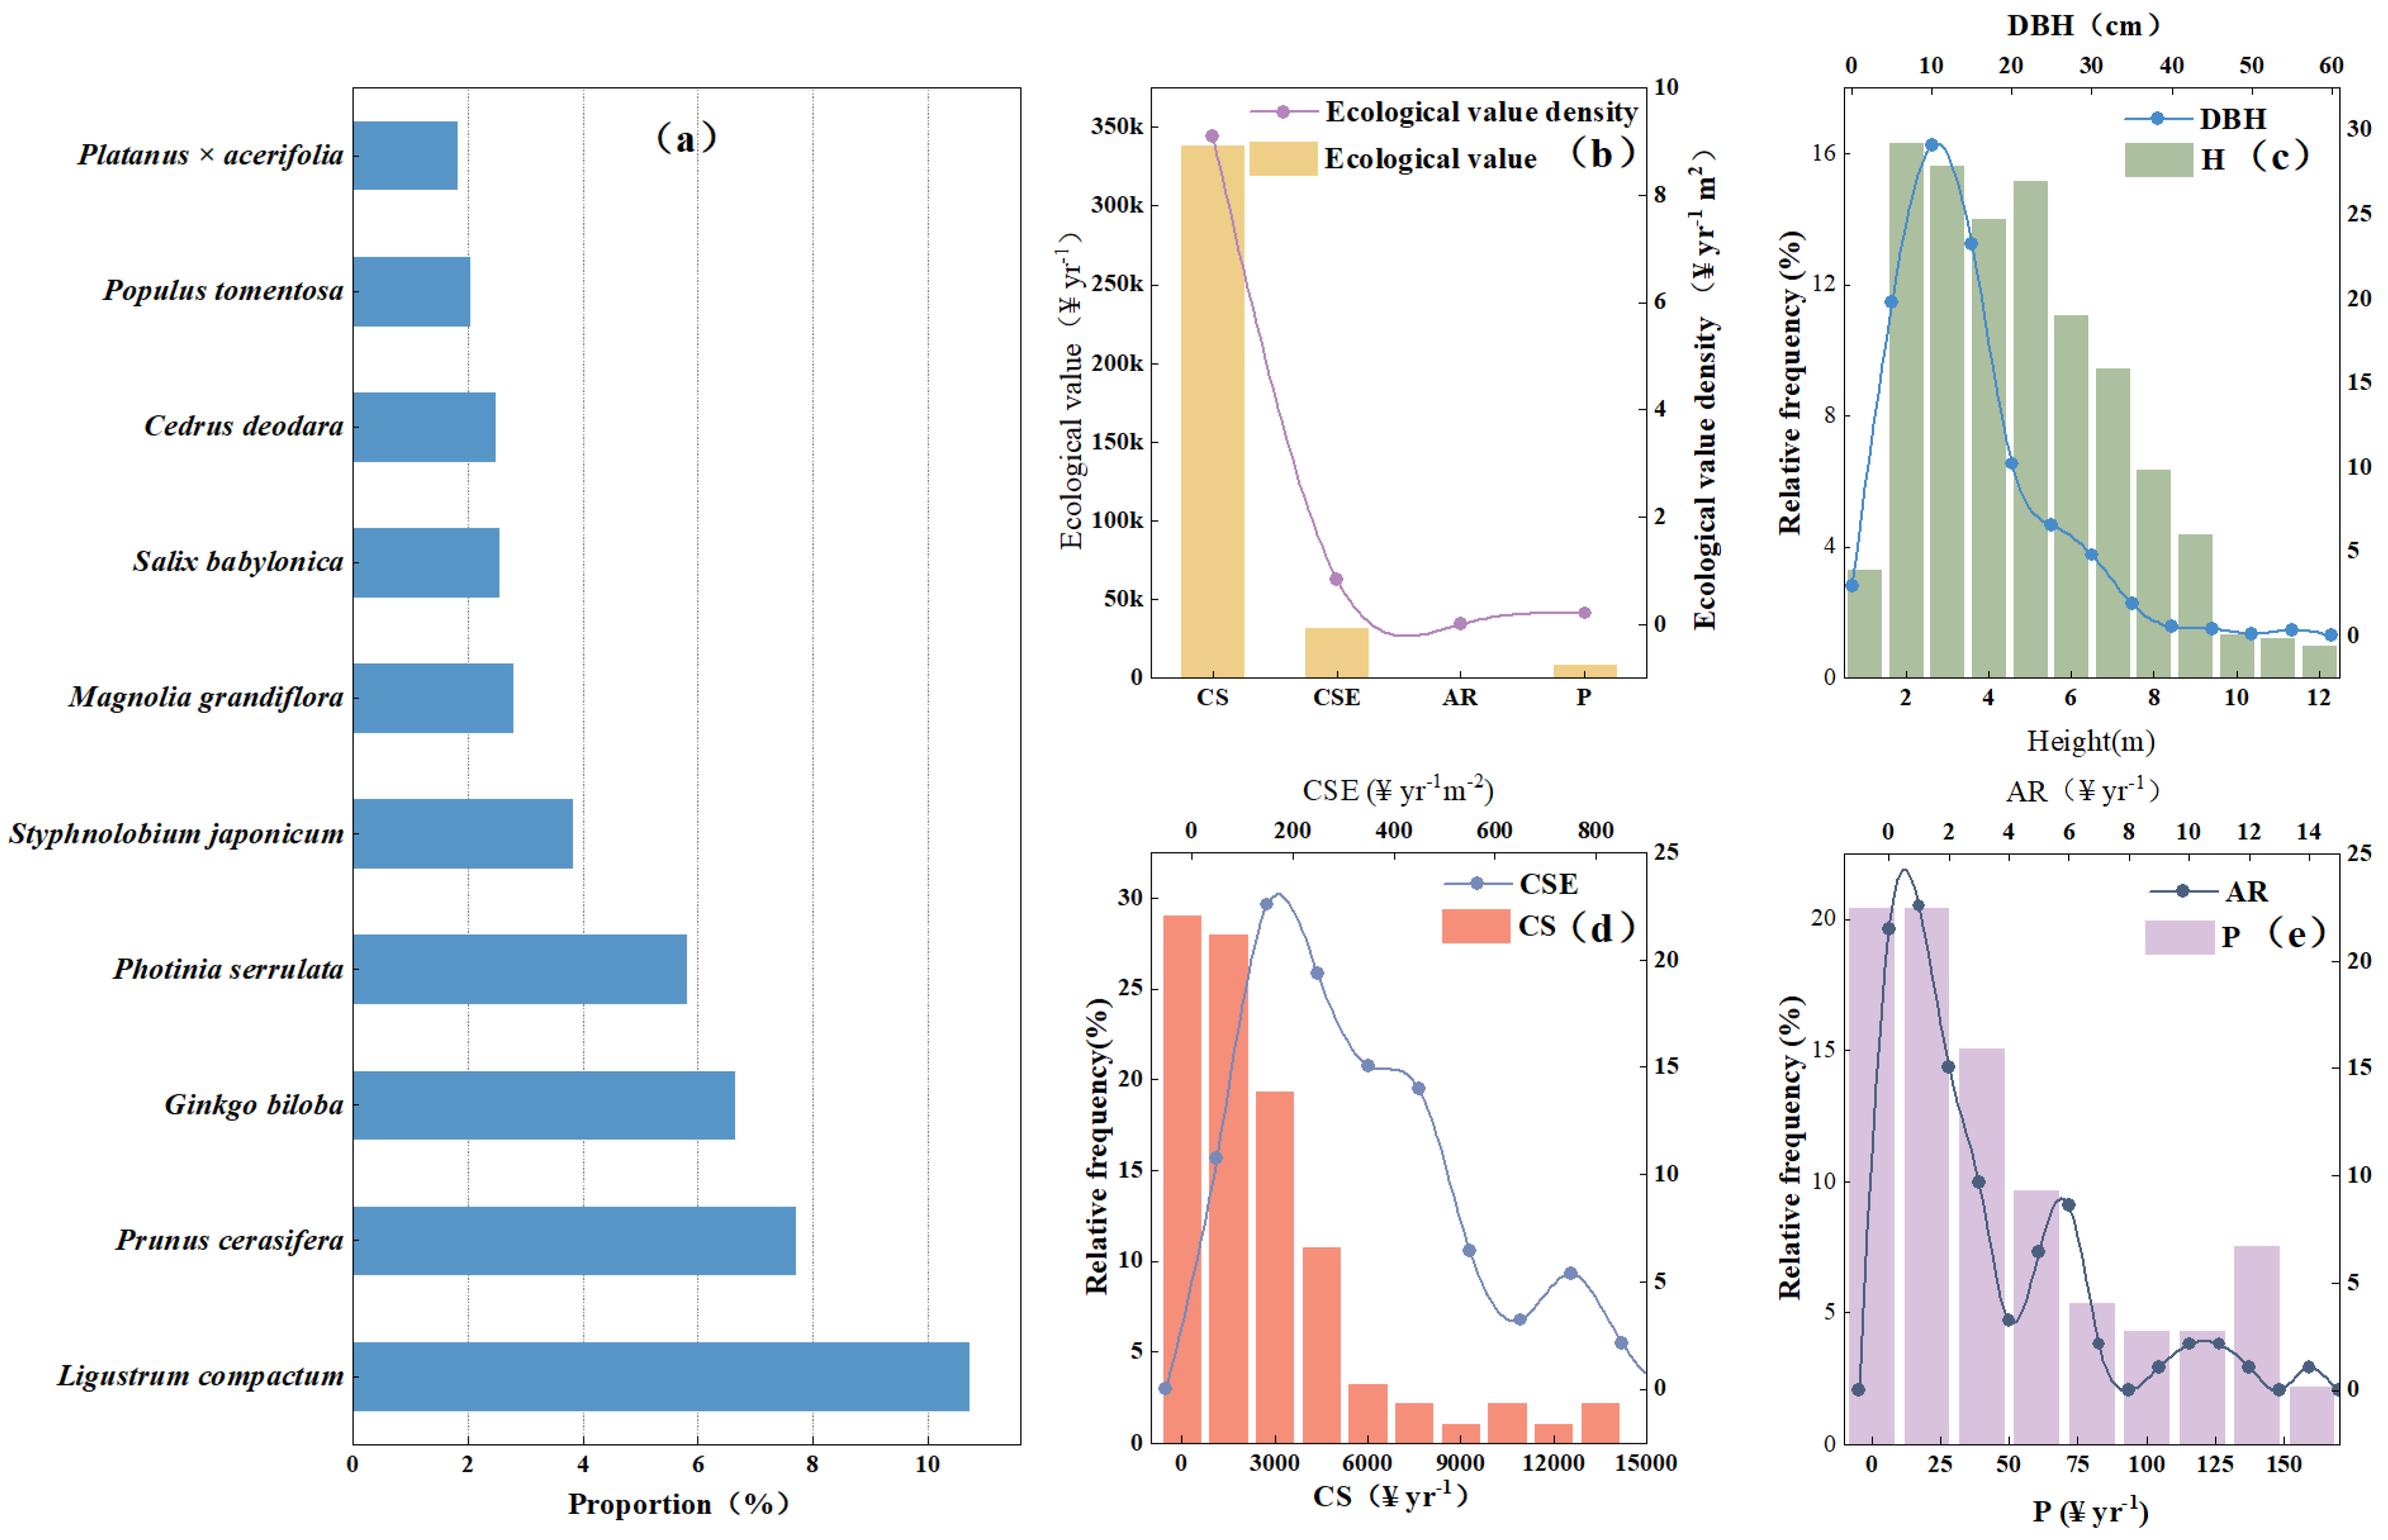
The UGSs in Kaifeng City are predominantly composed of deciduous broad-leaved tree species, with the dominant species being Ligustrum lucidum Ait., Ginkgo biloba L., and Photinia serratifolia (Desf.) Kalkman, in that order (Figure 2a). The DBHs of the trees are mainly concentrated in the range of 10–20 cm, and the tree heights are primarily between 2 and 6 m (Figure 2b).
The total values of the four ecosystem services differed by three orders of magnitude, with CS (338,200 yuan) being the highest and annual rainwater interception (300 ¥) being the lowest. The annual CSE and annual AR were 31,200 ¥·y−1 and 7900 ¥·y−1, respectively (Figure 2c). The value density of CS per unit area was 9.09 ¥ m−2, while the value densities of annual CSE, annual AR, and annual (P) were 0.84, 0.21, and 0.009 ¥ m−2·y−1, respectively.
All services exhibited right-skewed distributions across quadrats, with CS values concentrated in the range of 0–3000 ¥, annual CSE in 0–200 ¥·y−1, annual AR in 0–25 ¥·y−1, and annual rainwater retention in 0–4 ¥·y−1 (Figure 2d,e). Spatially, a pattern of “low values in old urban areas and high values in new districts” emerged. High-value quadrats were primarily clustered in park green spaces of new urban districts, while service value densities in old urban quadrats generally fell within the lower quartile range. The average CS value in new urban quadrats could reach 12 times that of old urban areas.

3.2. Differences in ESs of Different Types of Green Spaces and Tree Species Characteristics

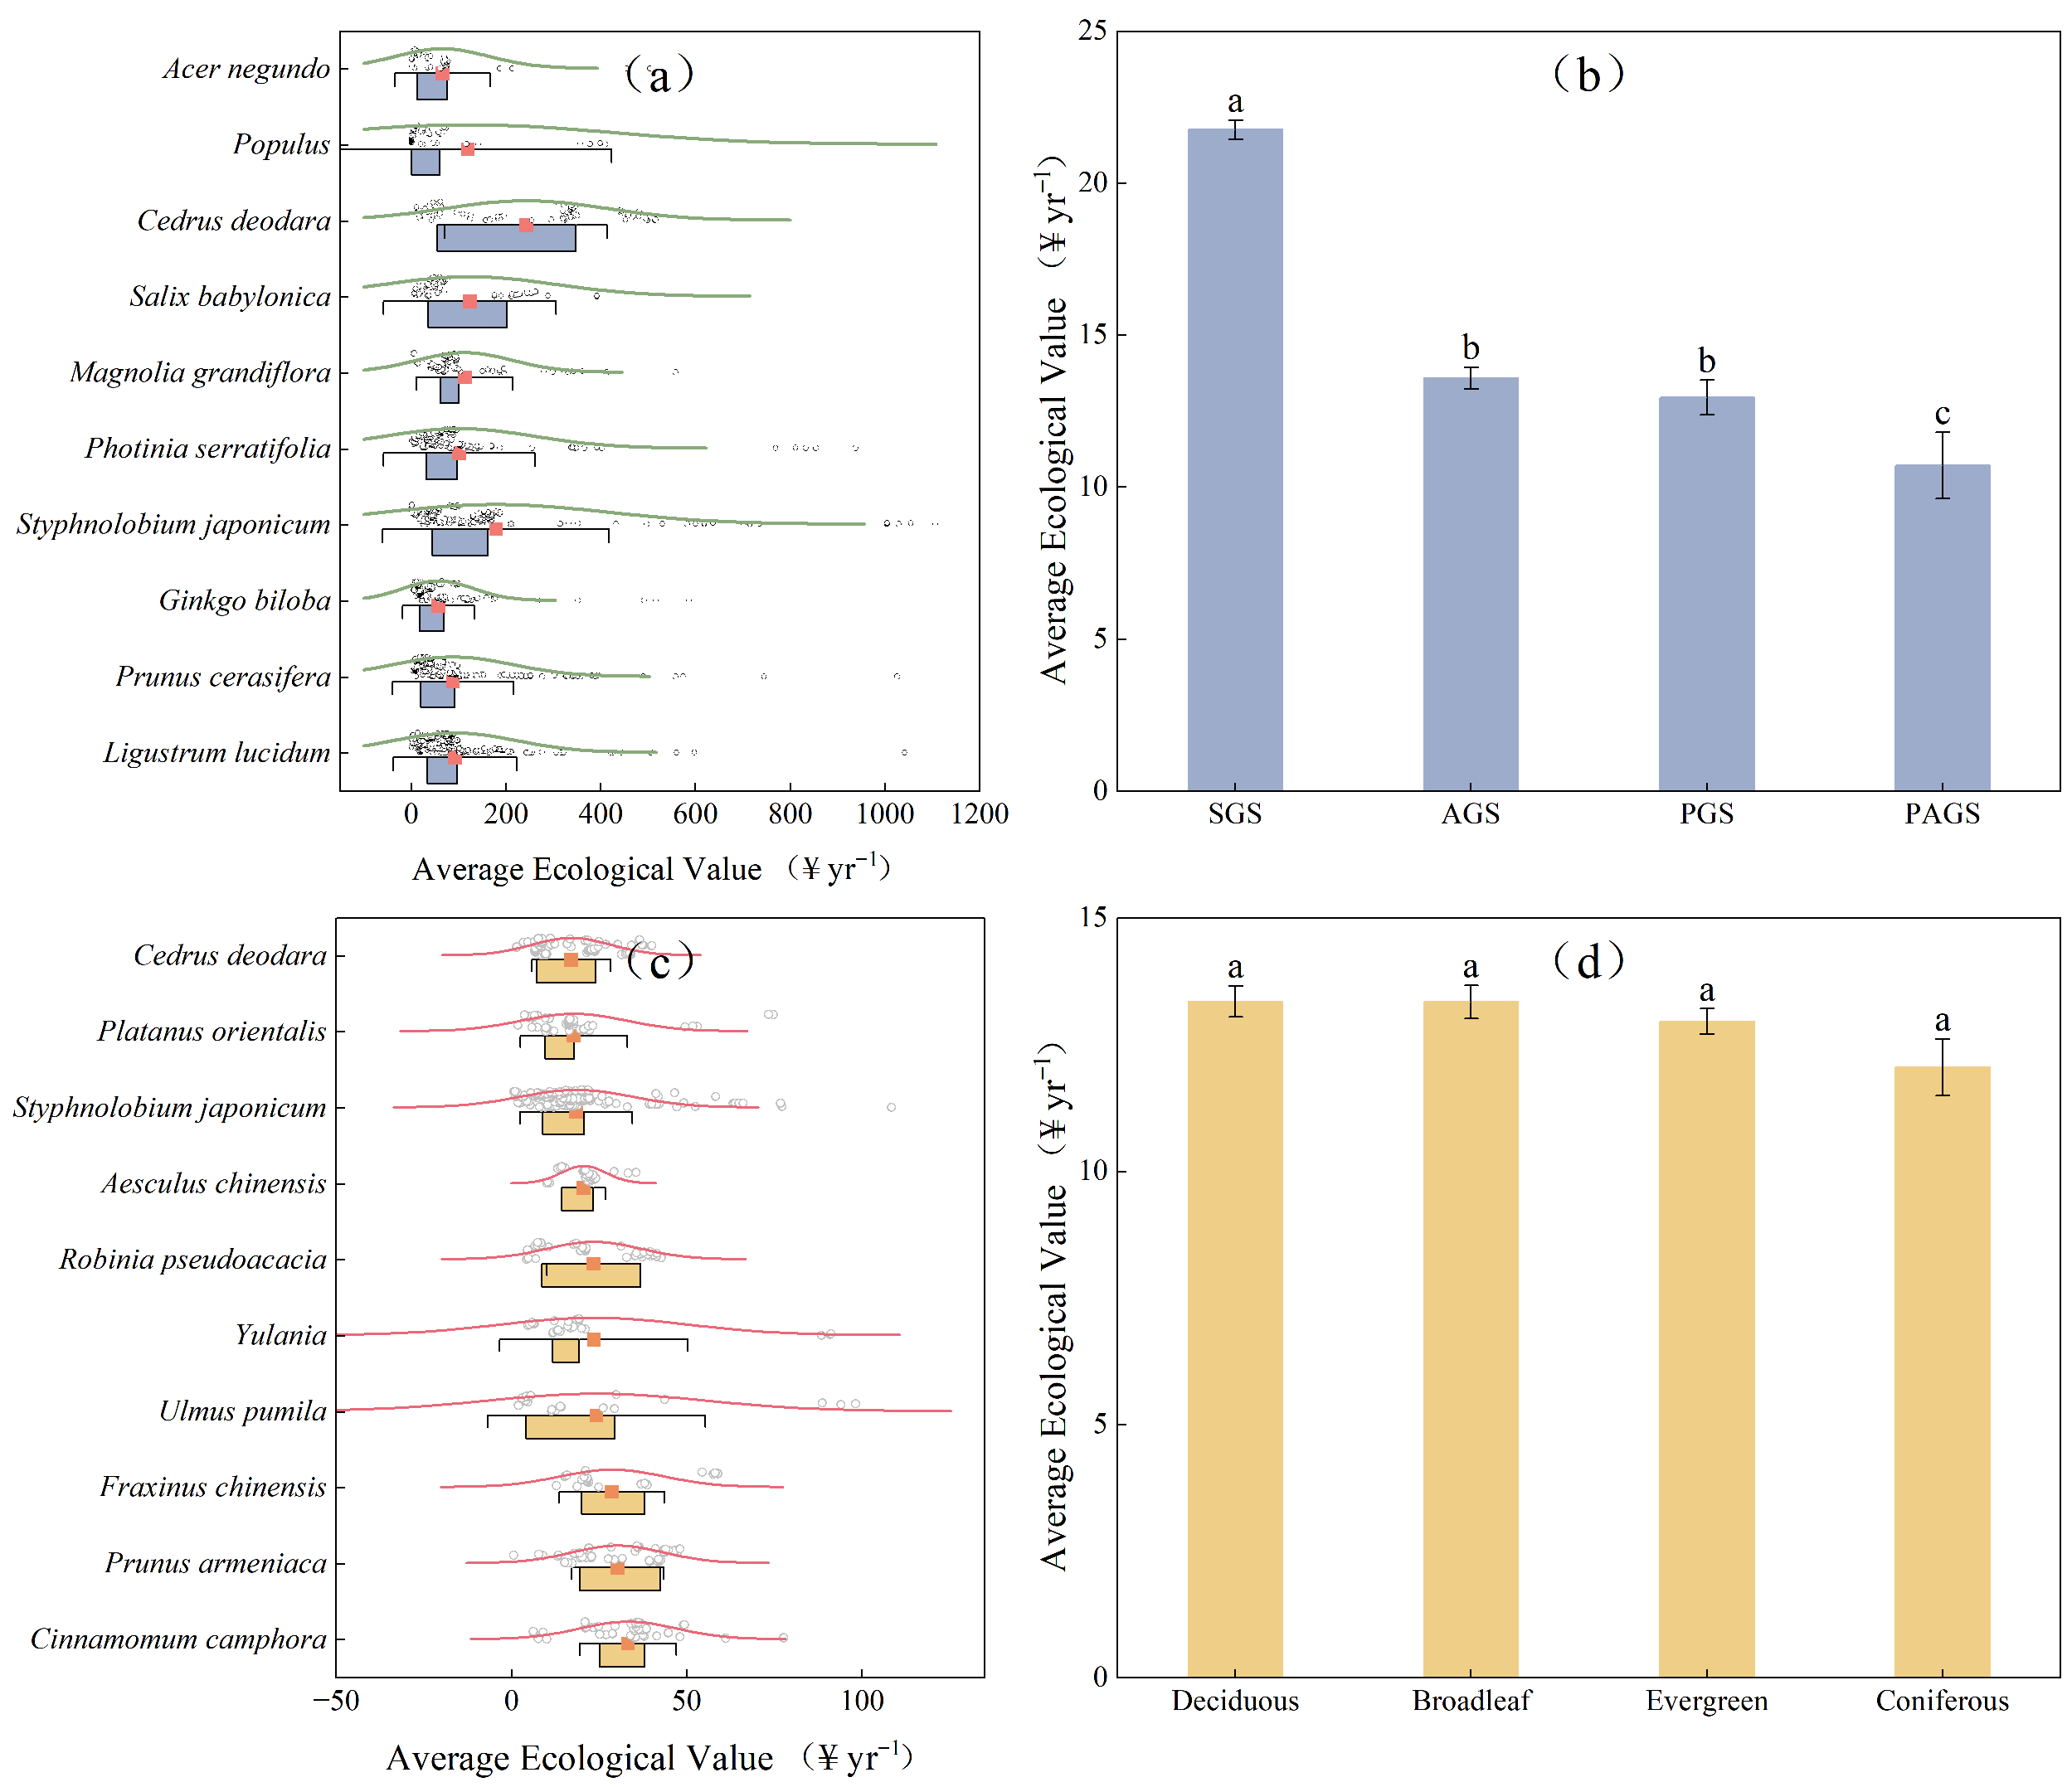
We represented the level of ES provided by different urban green space types, vegetation, and leaf types by summing four ESs. When evaluating plants with the highest ecosystem service value, we used the average ecosystem service value of samples exceeding twenty as the benchmark. Among the dominant tree species in Kaifeng’s UGSs, Cedrus deodara (Roxb. ex D. Don) G. Don exhibited the highest ecosystem service value at 17.02 ¥ y−1 (Figure 3a), while Cinnamomum camphora (L.) J. Presl showed the highest value at 33.24 ¥ y−1. and Prunus armeniaca L. 30.02 ¥ y−1 (Figure 3c). Among different types of UGSs, square green spaces exhibited the highest ecosystem service value, with CS and CSE values reaching 26.4 ¥ and 2.03 ¥ y−1 respectively, while rainwater interception and AR were valued at 0.01 ¥ y−1 and 0.41 ¥ y−1 respectively. The differences in ecosystem service values among other urban green space types were relatively small, with CS and CSE values ranging between 7.08 and 9.84 ¥ m−2 and 0.79–0.86 ¥ m−2 y−1 (Figure 3b), while rainwater interception and AR values ranged between 0.005 and 0.01 ¥ m−2 and 0.12–0.41 ¥ m−2 y−1. Among different plant leaf traits, deciduous broad-leaved plants exhibited higher ecosystem service values compared to evergreen coniferous plants. However, the differences between them were relatively small. The CS and CSE values ranged between 108.67 and 122.39 ¥ and 8.26–11.59 ¥ y−1, while P and AR ranged between 0.1 and 0.158 ¥ y−1 and 2.22–3.48 ¥ y−1, respectively (Figure 3d).

3.3. Difference in ESs of Different Types of Green Spaces and Tree Species Characteristics

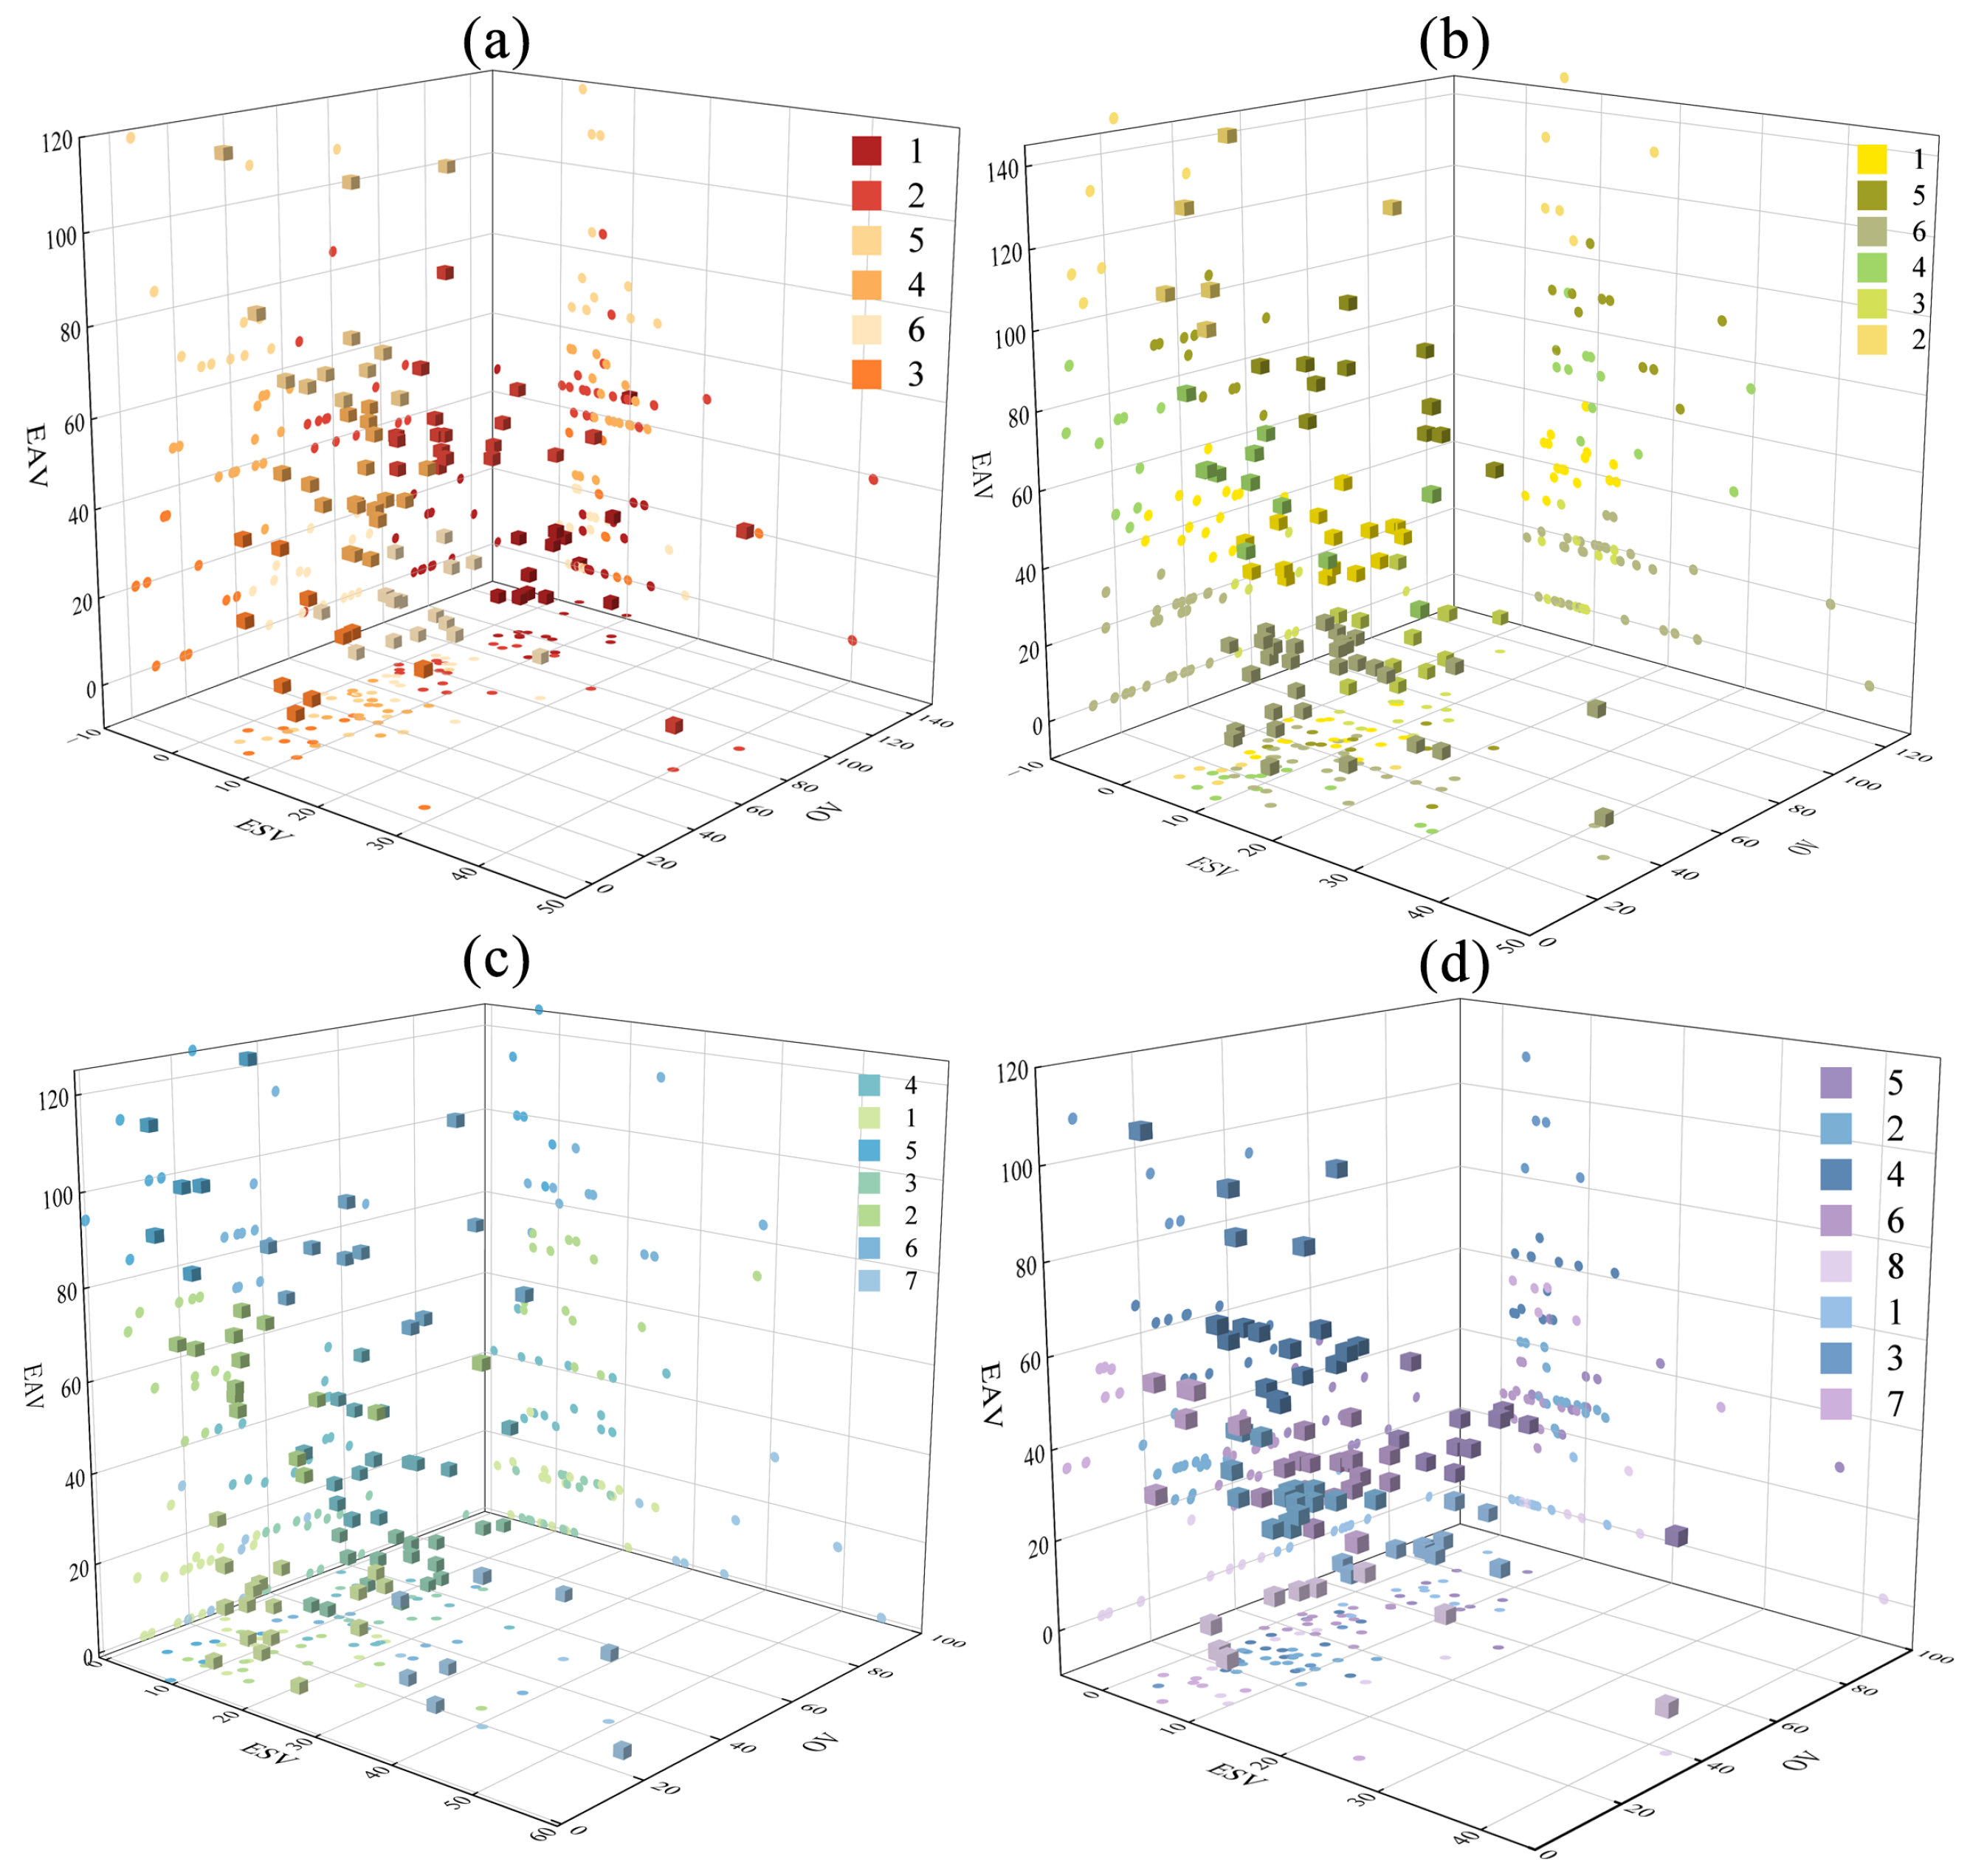
The Elbow Method was applied independently to each green space type to determine the optimal number of clusters (Figure S3). The SSE curves indicated initial optimal K values of 7 (protective), 6 (attached), 7 (park), and 8 (square). After merging minor clusters containing fewer than three species, the final cluster numbers were 6, 6, 9, and 6, respectively. One-way ANOVA confirmed that the three evaluation dimensions differed significantly among clusters for nearly all green space types (p < 0.001; Figure S2). The exception was ecosystem services in attached green spaces (F = 2.112, p = 0.072), where the difference was marginally non-significant, likely because the dominant deciduous broadleaf species in attached green spaces exhibit relatively similar biomass and canopy characteristics, resulting in comparable ecosystem service outputs from i-Tree Eco. The clustering of attached green spaces was thus primarily driven by ecological adaptability and ornamental value (both p < 0.001). The plant clustering results of the protective analysis comprise six categories (Figure 4a), with Cluster 2 and Cluster 6 being the most valuable (Figure 4a). Cluster 2 includes species such as Platanus acerifolia (Aiton) Willd., Populus alba L., Ginkgo biloba., Ulmus pumila L., and Bischofia polycarpa (Levl.) Airy Shaw. These plants exhibit the highest ecological adaptability, along with considerable ecosystem service value and ornamental value. Cluster 6 includes plants such as Melia azedarach L., Koelreuteria paniculata Laxm., Acer negundo L., Fraxinus chinensis Roxb., Pinus massoniana Lamb., and Pinus bungeana Zucc. ex-Endl. These plants exhibit relatively balanced performance across all three value dimensions. The attached green spaces comprise six clusters in total (Figure 4b), among which Cluster 5 contains plants of higher value (Figure 4b), including Euonymus maackii Rupr., Fraxinus chinensis., Robinia pseudoacacia L., Sophora japonica L., Cotinus coggygria Scop., Koelreuteria paniculata., etc. The park green spaces consist of seven clusters (Figure 4c), with available plant species mainly from Cluster 1, Cluster 2, and Cluster 9. Plants in Cluster 1 exhibit higher ornamental value along with balanced ecosystem service value and adaptability value (Figure 4c), including Magnolia grandiflora L., Malus hupehensis (Pamp.) Rehder, Chimonanthus praecox (L.) Link, Eriobotrya japonica (Thunb.) Lindl., etc. Cluster 2 includes plants such as Zelkova serrata (Thunb.) Makino., Pinus bungeana., Pterocarya stenoptera C. DC., Pinus massoniana., etc., which possess the highest ecosystem service value. The plants in Cluster 9 exhibit higher ecological adaptability and balanced ecosystem service value as well as ornamental value (Figure 4c), including Ligustrum compactum (Wall. ex G. Don) Hook.f. & Thomson ex Decne., Salix matsudana Koidz., Fraxinus chinensis., Euonymus maackii., and Platycladus orientalis (L.) Franco. In addition, although the plants in Cluster 2 of park green spaces have the highest ecosystem service value, their ecological adaptability and ornamental values are relatively low, including species such as Zelkova serrata., Pterocarya stenoptera., Malus spectabilis (Aiton) Borkh., and Pinus thunbergii Parl. There is a total of eight clusters in square green spaces, with Cluster 4 and Cluster 5 being the most recommended (Figure 4d). These plant species exhibit high levels in all three capabilities (Figure 4d), including Koelreuteria paniculata., Photinia serratifolia., Prunus persica ‘Duplex’, Robinia pseudoacacia., Viburnum odoratissimum Ker-Gawl., Ailanthus altissima (Mill.) Swingle., Sophora japonica., Chimonanthus praecox., etc. A one-way ANOVA was performed to validate the significant differences among these clusters, with detailed results provided in Figure S2.

4. Discussion

4.1. Magnitude and Comparison of the Ecosystem Service Value of UGSs

This study quantified the values of four ecosystem services provided by UGSs in Kaifeng. Horizontal comparisons revealed that the CS density per unit area in Kaifeng (9.09 kg m−2) was approximately 72% of that in Zhengzhou (12.6 kg m−2) [16], while the annual CSE density (0.84 kg m−2 y−1) was 158% higher than Zhengzhou’s (0.53 kg m−2 y−1) [17]. Both rainwater interception and air purification services were also below the regional average [18].
These gaps may be partially associated with the environmental constraint characteristic of Kaifeng. Previous studies have reported that soil salinization in Kaifeng (with surface salt content reaching 4.2 g kg−1) [19] can reduce stomatal conductance by 40%–60% [20] and decrease the leaf area index to 55%–70% of normal values [21], which may in turn constrain photosynthetic carbon fixation and pollutant deposition capacity [22]. Additionally, the preservation requirements for the “stacked-city” archeological site in the old urban area have been documented to impose spatial constraints on tree planting [12], which may further limit the deployment of large-sized trees and consequently reduce aggregate ES outputs. While our study did not directly measure soil salinity gradients or tree physiological responses, the observed lower ES values in Kaifeng are consistent with patterns reported in other saline-affected urban areas [19,20]. Comparative analysis reveals that Zhengzhou enhances CSE through optimized landscape spatial structure, reflecting the “ecological function priority” concept [16]. Luoyang leverages its “mountains-rivers sandwiching the city” topography to strengthen multiple ecosystem services, demonstrating the “landscape-culture dual emphasis” model [23]. Based on the above contextual evidence, Kaifeng may be characterized as exhibiting “constraint-adaptive” features, whereby urban greening strategies appear to involve functional trade-offs shaped by the co-occurrence of saline–alkali soil conditions and cultural heritage preservation requirements [24,25]. This characterization, however, remains a conceptual interpretation rather than a directly tested hypothesis in the present study. Despite relatively low CS, the comparatively high CSE indicates vigorous growth of existing trees [26], suggesting potential for further improvement through optimized allocation.
Spatial analysis revealed heterogeneous pattern differences in four services across various green space types [27]. The CS value density in square green spaces was 2.7–3.7 times that of attached green spaces, with significant differences in air purification (0.41 vs. 0.12–0.21 ¥ m−2 y−1), while the differences in rainwater interception were relatively minor. Additionally, the spatial distribution of ecosystem service values showed a characteristic pattern with high values concentrated in new urban areas and low values clustered in old urban districts. This pattern of “fragmented low-value old city versus concentrated high-value new district” may be related to Kaifeng’s east–west ribbon urban morphology, which has been shaped by the Yellow River dikes and railway lines according to previous urban planning studies [23]. The westward development of new districts is concentrated along Zheng-Kai Avenue, while green spaces in the old urban area showed fragmented distribution [23]. Zhengzhou studies demonstrated that functional trait combinations of tree species significantly influence the co-provision of multiple ecosystem service [4]. In Kaifeng, the predominance of salt-tolerant tree species—potentially selected in response to saline–alkali soil conditions—may contribute to relatively lower overall service outputs, which could exacerbate inter-service imbalances. This inference, however, warrants further investigation through controlled comparative studies.
Methodologically, i-Tree Eco is more suitable for highly heterogeneous urban areas compared to land-cover-based uniform valuation models like InVEST [28,29]. i-Tree Eco simulates physiological processes based on field-measured tree data (DBH, CW, health status) and local environmental parameters [30,31], enabling the identification of suboptimal tree health conditions under environmental stress and corresponding adjustment of valuation estimates. In Kaifeng, although scattered greening in the old urban area and multi-layered plant communities in the new district both fall under “UGS”, their service output differs by 3–5 times, a disparity that would be obscured by InVEST’s uniform valuation [32]. The applied research in Luohe City verified the applicability of i-Tree Eco in Central China’s plain cities, with its CSE rate (1.30 t C·ha−1 y−1) [33] being of the same order of magnitude as this study. Therefore, this study quantifies the “effective service provision considering environmental stressors and tree health conditions,” providing a reliable baseline for identifying service deficiencies and optimization pathways.

4.2. Multidimensional Trade-Offs in Tree Species Selection

The weighting results reveal functional priority differentiation among green space types. Protective green spaces exhibit characteristics of “survival compromise,” assigning extremely high weights to adaptability indicators (low nutrient tolerance 0.492, harmful gas resistance 0.487). This reflects a practical compromise with extensive management and environmental stress—protective green spaces often face soil compaction caused by hard paving and vehicle exhaust stress. Here, plant adaptability serves not only as a prerequisite for providing ecological services but also as the baseline for reducing high maintenance and replanting costs [34]. In contrast, the “performance expectations” for park green spaces exhibit significantly higher weights on indicators such as CS (0.250), CSE (0.250), and OV (0.409), while substantially reducing requirements for adaptive indicators like drought tolerance (0.124) [35]. As core patches with superior soil conditions and the highest maintenance investments, park green spaces bear public expectations for high-quality recreational experiences and climate regulation benefits. This weighting bias reflects the demand for “high ecological performance and high social welfare output” under substantial public financial investments. Therefore, the weighting system essentially constitutes a rational response to environmental constraints and investment expectations.
According to established ecological theory, inherent biological trade-offs exist among plant functional traits, suggesting that no single “all-purpose tree species” can be expected to excel across all functional dimensions. Our clustering results appear consistent with this theoretical framework, as no species in the dataset achieved top scores simultaneously across all three evaluation dimensions (ecosystem service values, ecological adaptability, and ornamental value). However, it should be noted that our scoring-based assessment does not constitute a direct empirical test of functional trait trade-off theory. The observed patterns are interpreted here within the context of this theoretical framework, rather than presented as independent evidence for trait trade-offs. Regarding the growth-resistance trade-off, fast-growing species (e.g., poplar, willow) exhibit high photosynthetic rates and CSE potential. However, according to plant resource allocation theory, acquisitive species that allocate excessive resources to rapid growth typically compromise wood density and resistance to pests/diseases or extreme climates [36]. Their structural vulnerability becomes evident during pest outbreaks, extreme droughts, or late frost events. Concerning the evergreen-water conservation trade-off, evergreen species (e.g., Ligustrum lucidum, cedar) provide year-round ecological services, but maintaining perennial leaf area entails sustained transpiration water costs. In cities like Kaifeng, where spring droughts are frequent and some areas face physiological water shortages due to salinization, blindly increasing the proportion of evergreen tree species may exacerbate water resource pressures, leading to a dilemma between “providing ecological services” and “consuming water resources”.
The comparison with traditional greening evaluation systems highlights the methodological innovation of this research framework. The conventional “Standard for Evaluation of Urban Landscaping” (CJJ/T 85-2017) [37] primarily conducts qualitative assessments based on morphological aesthetics (tree form, canopy density, seasonal coloration), proving inadequate in addressing urban climate crises. This study achieved two key breakthroughs: First, the visualization of implicit ecological processes—by integrating the i-Tree Eco model, it incorporated hidden ecological processes such as carbon cycling, hydrological processes, and atmospheric purification into tree selection decision-making, shifting the focus from superficial traits to functional unit optimization. Second, the internalization of long-term resilience costs—by assigning high weights to indicators like “barren tolerance” and “hazardous gas resistance,” it proactively factored “resilience costs” such as long-term maintenance needs and mortality replacement probabilities into decision considerations [38] driving a transition from “short-term morphological aesthetics” to “full life-cycle functional benefits.” Therefore, the AHP framework in this study serves not merely as a technical tool, but embodies a paradigm shift in planning philosophy from “idealized design” to “optimized decision-making under constraints”. It provides a replicable methodological framework for resilient greening construction in saline–alkali land cities [39].

4.3. Refined Configuration Strategy Based on Clustering Results

Based on the clustering results and the multi-criteria evaluation scoring framework established in Section 2.2.5, configuration recommendations are proposed by matching each cluster’s dominant functional traits to site-specific constraints. The matching follows three criteria: (1) the dominant functional trait of each cluster, such as ecosystem service value, ecological adaptability value, and ornamental value; (2) site-level environmental constraints including soil salinity, spatial limitations, and heritage protection requirements; (3) Kaifeng’s geological background as a “suspended river above ground” and its east–west belt-shaped expansion pattern. It should be noted that these recommendations are derived from statistical clustering of the current species dataset and would benefit from validation through field trials and long-term monitoring before implementation. In the narrow streets within historic urban districts, where cultural relic protection imposes strict root-depth and excavation constraints, species from protective road green space Cluster 2 are recommended as candidates for further site-specific evaluation. This cluster ranked highest in the multi-criteria evaluation comprehensive score, with its dominant traits—high stress tolerance and moderate root-spread adaptability—matching the shallow-soil and restricted-disturbance conditions of heritage zones. Representative species include Bischofia polycarpa, Populus alba, Platanus acerifolia, Ginkgo biloba, and Ulmus pumila, characterized as “stress-resistant pioneer species” [40]. In engineering practice, it is recommended to adopt underground structural cells or tree pit systems combined with permeable paving to ensure tree growth space without damaging the cultural relic layer [34]. For attached green spaces characterized by limited planting area and dual functional demands, Cluster 5 species (Euonymus maackii, Fraxinus chinensis., Robinia pseudoacacia, Sophora japonica, Cotinus coggygria., Koelreuteria paniculata) represent suitable candidates. This cluster scored highly on both adaptability and ornamental indicators in the multi-criteria evaluation, and can be characterized as a “balanced adaptive type” that accommodates confined spatial conditions while providing visual amenity. In the ecological corridors of the new urban district, where soil salinity is comparatively lower and planting space is less constrained, Park Green Space Cluster 7 species are prioritized. This cluster achieved the highest ecosystem service scores in the multi-criteria evaluation, reflecting superior carbon sequestration and pollutant removal capacity under favorable growing conditions, including Magnolia grandiflora, Malus hupehensis, Chimonanthus praecox, and Eriobotrya japonica. This cluster exhibits the highest ecosystem service value, balanced adaptability, and ornamental value, which can be categorized as a “high-efficiency carbon sink type”. It is well-suited for establishing large-scale CSE systems [41]. For cultural-tourism districts and exhibition plazas, tree species from Park Green Space Cluster 9—Ligustrum compactum, Salix matsudana, Fraxinus chinensis., Euonymus maackii, and Platycladus orientalis—should be selected. This cluster demonstrates outstanding ornamental value while balancing ecological services and adaptability, and can be categorized as “landscape-specialized”. The Sophora japonica (Chinese scholar tree) symbolizes wisdom and imperial examinations in traditional Chinese culture, aligning with Kaifeng’s historical heritage [8,42]. Functional squares may incorporate plant species from Clusters 4 and 5 of square green spaces, including Koelreuteria paniculata, Photinia serratifolia., Prunus persica, Robinia pseudoacacia, Viburnum odoratissimum, and Ailanthus altissima. These clusters demonstrate high performance across three key indicators: service provision, stress resistance, and ornamental value.
In practical applications, multi-layered community design should be constructed with clustered dominant trees as the framework. For protective green spaces, while maintaining necessary traffic visibility by controlling the height and density of the middle-layer vegetation, a framework of Ulmus pumila and Platanus acerifolia is recommended. Nitrogen-fixing shrubs such as Amorpha fruticosa L. should be arranged as the middle layer, and shade-tolerant ground covers like Ophiopogon japonicus (L.f.) Ker Gawl. should be selected for the lower layer, avoiding water-intensive lawns. Where park green spaces offer sufficient area and soil depth for complex planting design, a “skeleton + feature + background” configuration strategy may be adopted: the skeleton layer selects “high-efficiency CSE” tree species such as Pterocarya stenoptera. and Populus tomentosa Carrière; the feature layer is adorned with “landscape-specialized” tree species like Styphnolobium japonicum and Magnolia grandiflora.; and the background layer employs “balanced-service” tree species from Cluster 4, including Fraxinus chinensis., Liquidambar styraciflua L., Salix matsudana., and Osmanthus fragrans Lour. to fill the space. Shade-tolerant flowering shrubs are arranged under the tree canopy, and native grass species are used for the ground cover layer. The square green space employs Platycladus orientalis and Koelreuteria paniculata for an evergreen–deciduous framework, accentuated with Euonymus alatus (Thunb.) Siebold and Triadica sebifera (L.) Small to create seasonal landscape sequences. This stratified configuration based on clustering results enhances the vertical structural complexity of the green space. Therefore, the proposed configuration recommendations translate the quantitative outcomes of cluster analysis into scenario-specific species shortlists, providing a data-informed reference for tree species selection. These recommendations should be regarded as a preliminary framework requiring validation through field trials and integration with site-specific design expertise before implementation.
K-means clustering identified distinct functional combinations among different green space types, with this differentiation essentially reflecting the adaptive trade-offs of Kaifeng’s green spaces under saline–alkali soil and spatial constraints. From an ecological perspective, functional differentiation stems from plants’ trade-offs between resource acquisition and defense investment: The “stress-resistant pioneer” tree species in protective, green spaces sacrifice some CSE rates to enhance survival under vehicle exhaust and hard pavement stress, while the “high-efficiency carbon sink” tree species in park green spaces allocate more resources to growth in relatively favorable soil conditions. The “landscape-specialized ornamental” tree species in high-maintenance core areas prioritize decorative traits, whereas the “balanced-service” tree species maintain equilibrium among multiple functions [43]. This functional differentiation differs from similar studies in Zhengzhou, where evergreen species account for a higher proportion in high CSE categories of urban park green spaces. In contrast, the clustering results in Kaifeng are predominantly deciduous species. This pattern may be associated with the saline–alkali soil conditions in the region, which have been reported to impose greater physiological stress on evergreen species [4]. However, this interpretation requires further verification through comparative ecophysiological studies, as the observed dominance of deciduous species could also reflect historical planting preferences or other confounding factors. The advantage of cluster analysis over traditional empirical tree selection lies in its data-driven optimization for multidimensional objectives through integrating i-Tree Eco’s quantified service values with AHP weightings. However, its limitations must also be recognized: The determination of cluster numbers is primarily based on statistical indicators rather than ecological theory, the naming of functional types is subjective, and the clustering—being based solely on the current tree species database—cannot predict functional patterns for new species or under climate change scenarios [40]. Additionally, the multi-layered configuration recommendations are conceptual frameworks derived from the functional clustering results and general principles of urban planting design, rather than outputs of a formal expert consultation process. Their applicability to specific sites requires professional landscape architectural assessment accounting for local regulations, infrastructure constraints, and maintenance capacity.

5. Conclusions

This study takes Kaifeng City, constrained by both soil salinization and the preservation of “multi-layered city” ruins, as a typical case. It constructs an integrated evaluation and multi-criteria optimization framework for urban trees that incorporates ecosystem service, ecological adaptability, and ornamental value. The study quantified four regulating services of UGSs in Kaifeng using the i-Tree Eco model: CS, CSE, AR, and P. Results demonstrated that carbon-related services dominated (with value densities of 9.09 ¥ m−2 for CS and 0.84 ¥ m−2 y−1 for CSE), while air purification and P services were relatively lower. Camphor trees (Cinnamomum camphora) exhibited the highest annual ecosystem service value per individual tree (33.24 ¥ y−1). Among all green space types, square green spaces showed the strongest service provision capacity. Overall, deciduous broadleaf species outperformed evergreen coniferous species in terms of total service value. Through the AHP hierarchical analysis method and K-means clustering, this study examines four types of green spaces: protective green spaces, attached green spaces, park green spaces, and square green spaces. Based on the varying needs of different green spaces for ESs, ecological adaptability, and ornamental value, recommendations are provided for tree species selection. For protective green spaces, the most recommended tree species include Platanus acerifolia. and Populus alba. For attached green spaces, Euonymus maackii. and Fraxinus chinensis. are the top recommendations. Park green spaces offer richer options: for ornamental value, Magnolia grandiflora. and Malus hupehensis. are preferred choices; for ecosystem services, Zelkova serrata. and Pterocarya stenoptera. are recommended; while Ligustrum compactum. is suggested for optimal ecological adaptability. For square green spaces, the most recommended tree species are Koelreuteria paniculata. and Photinia serratifolia.
The innovation of this study lies in integrating the long-separated aspects of ecological service quantification, ecological adaptability assessment, and ornamental value evaluation into a unified analytical framework. This represents an attempt to bridge the gap between single-dimensional indicator assessment and multi-dimensional trade-off analysis, and to extend beyond current-state evaluation toward data-informed allocation recommendations. The research outcomes may provide a reference framework for tree species selection in Kaifeng City and potentially other plain cities facing similar constraints of saline–alkali soils and historical preservation, while also offering preliminary scientific support for the refined planning of UGSs. Future validation through field trials and long-term monitoring would strengthen the applicability of these recommendations. Future research could further incorporate long-term time-series monitoring data, multi-source cultural service assessment methods, and cross-scale spatial models to advance urban forestry from “case descriptions” toward “universal theories” and “intelligent decision-making”.

Supplementary Materials

The following supporting information can be downloaded at: https://www.mdpi.com/article/10.3390/f17050529/s1, Figure S1: Monte Carlo sensitivity analysis of the Analytic Hierarchy Process weighting scheme (±20% perturbation, 1000 iterations). Figure S2: Comparison of ecosystem services, ecological adaptability, and aesthetic value among cluster groups across four types of urban green spaces in Kaifeng. Figure S3: Elbow Method curves for determining the optimal number of clusters (K) in K-means analysis.

Author Contributions

Conceptualization, S.W. and Q.R.; methodology, S.W. and H.C.; software, S.W.; validation, S.W., S.G. and X.W.; formal analysis, S.W. and Q.R.; investigation, S.W., Q.R., M.Z., and R.W.; resources, S.W., R.W. and H.C.; data curation, S.W., Z.L. and, A.L. writing—original draft preparation, S.W. and Q.R.; writing—review and editing, S.G., M.Z., J.S., and X.W.; visualization, S.W. and Z.L.; supervision, M.Z., S.G., H.C. and A.L.; project administration, S.W. and M.Z.; funding acquisition, S.W., S.G., H.C. and M.Z. All authors have read and agreed to the published version of the manuscript.

Funding

This study was funded by the National Natural Science Foundation of China (grant no. 32460421), the Key Technology R&D Program of Henan Province (grant nos. 242102320320 and 242102320330), and the Key Scientific Research Project of Higher Education Institutions in Henan Province (grant no. 25A220003), the Soft Science Research Program Project of Henan Province (grant no. 262400410422), the General Project of Humanities and Social Sciences Research in Universities of Henan Province (grant no. 2025-ZZJH-369).

Data Availability Statement

We will provide data when needed.

Conflicts of Interest

All authors disclosed no relevant relationships.

Abbreviations

The following abbreviations are used in this manuscript:
UGSUrban green space
CS ValueCarbon stock ¥ m−2
CSE ValueCarbon sequestration ¥·m−2 y−1
APAir pollutant removal ¥·m−2·y−1
PRainfall interception ¥·m−2·y−1
ESVEcosystem service value
EAVEcological adaptability value
OVOrnamental value

References

  1. Ma, Y.; Yang, J. A Review of Methods for Quantifying Urban Ecosystem Services. Landsc. Urban Plan. 2025, 253, 105215. [Google Scholar] [CrossRef]
  2. Nowak, D.J.; Greenfield, E.J.; Hoehn, R.E.; Lapoint, E. Carbon Storage and Sequestration by Trees in Urban and Community Areas of the United States. Environ. Pollut. 2013, 178, 229–236. [Google Scholar] [CrossRef]
  3. Rötzer, T.; Rahman, M.A.; Moser-Reischl, A.; Pauleit, S.; Pretzsch, H. Process Based Simulation of Tree Growth and Ecosystem Services of Urban Trees under Present and Future Climate Conditions. Sci. Total Environ. 2019, 676, 651–664. [Google Scholar] [CrossRef]
  4. Ren, Q.; Zhang, L.; Yang, Z.; Zhang, M.; Wei, M.; Zhang, H.; Li, A.; Shi, R.; Song, P.; Ge, S. Multi-Criteria Plant Clustering for Carbon-Centric Urban Forestry: Enhancing Sequestration Potential Through Adaptive Species Selection in the Zhengzhou Metropolitan Area, China. Forests 2025, 16, 536. [Google Scholar] [CrossRef]
  5. Sousa-Silva, R.; Duflos, M.; Ordóñez Barona, C.; Paquette, A. Keys to Better Planning and Integrating Urban Tree Planting Initiatives. Landsc. Urban Plan. 2023, 231, 104649. [Google Scholar] [CrossRef]
  6. Liu, M.; Zhang, D.; Pietzarka, U.; Roloff, A. Assessing the Adaptability of Urban Tree Species to Climate Change Impacts: A Case Study in Shanghai. Urban For. Urban Green. 2021, 62, 127186. [Google Scholar] [CrossRef]
  7. Notaro, S.; De Salvo, M. Estimating the Economic Benefits of the Landscape Function of Ornamental Trees in a Sub-Mediterranean Area. Urban For. Urban Green. 2010, 9, 71–81. [Google Scholar] [CrossRef]
  8. Goodness, J.; Andersson, E.; Anderson, P.M.L.; Elmqvist, T. Exploring the Links between Functional Traits and Cultural Ecosystem Services to Enhance Urban Ecosystem Management. Ecol. Indic. 2016, 70, 597–605. [Google Scholar] [CrossRef]
  9. Núñez-Florez, R.; Pérez-Gómez, U.; Fernández-Méndez, F. Functional Diversity Criteria for Selecting Urban Trees. Urban For. Urban Green. 2019, 38, 251–266. [Google Scholar] [CrossRef]
  10. Sjöman, H.; Morgenroth, J.; Sjöman, J.D.; Sæbø, A.; Kowarik, I. Diversification of the Urban Forest—Can We Afford to Exclude Exotic Tree Species? Urban For. Urban Green. 2016, 18, 237–241. [Google Scholar] [CrossRef]
  11. Martin, M.P.; Simmons, C.; Ashton, M.S. Survival Is Not Enough: The Effects of Microclimate on the Growth and Health of Three Common Urban Tree Species in San Francisco, California. Urban For. Urban Green. 2016, 19, 1–6. [Google Scholar] [CrossRef]
  12. Wu, P.; Liu, D.; Ma, J.; Miao, C.; Chen, L.; Gu, L.; Tong, J. A Geoarchaeological Reading of the City-Overlap-City Phenomenon in the Lower Yellow River Floodplain: A Case Study of Kaifeng City, China. Sustainability 2019, 11, 1029. [Google Scholar] [CrossRef]
  13. Hirabayashi, S. I-Tree Streets/Design/Eco Rainfall Interception Model Comparisons; USDA Forest Service: Madison, WI, USA, 2013. [Google Scholar]
  14. Saaty, T.L. The Analytic Hierarchy Process: Planning, Priority Setting, Resource Allocation. In The Analytic Hierarchy Process, Planning, Piority Setting, Resource Allocation; McGraw-Hill Book Co.: New York, NY, USA, 1980. [Google Scholar]
  15. Macqueen, J. Some Methods for Classification and Analysis of Multivariate Observations. In 5th Berkeley Symposium on Mathematical Statistics and Probability; University of California Press: Berkeley, CA, USA, 1967; Volume 1. [Google Scholar]
  16. Du, C.; Ge, S.; Song, P.; Jombach, S.; Fekete, A.; Valánszki, I. Optimizing Urban Green Spaces for Vegetation-Based Carbon Sequestration: The Role of Landscape Spatial Structure in Zhengzhou Parks, China. Forests 2025, 16, 679. [Google Scholar] [CrossRef]
  17. Jin, S.; Zhang, E.; Guo, H.; Hu, C.; Zhang, Y.; Yan, D. Comprehensive Evaluation of Carbon Sequestration Potential of Landscape Tree Species and Its Influencing Factors Analysis: Implications for Urban Green Space Management. Carbon Balance Manag. 2023, 18, 17. [Google Scholar] [CrossRef]
  18. Xu, C.; Zhu, X.; Tan, X.; Zhang, R.; Liu, B.; Wang, K.; Xu, E.; Li, A.; Wan, H.Y.; Song, P.; et al. Urban-Scale Quantification of Rainfall Interception Drivers in Tree Communities: Implications for Sponge City Planning. Sustainability 2025, 17, 7793. [Google Scholar] [CrossRef]
  19. Li, J.; Pu, L.; Han, M.; Zhu, M.; Zhang, R.; Xiang, Y. Soil salinization research in China: Advances and prospects. J. Georgy. Sci. 2014, 24, 943–960. [Google Scholar] [CrossRef]
  20. Robinson, S.P.; Downton, W.J.; Millhouse, J.A. Photosynthesis and Ion Content of Leaves and Isolated Chloroplasts of Salt-Stressed Spinach. Plant Physiol. 1983, 73, 238–242. [Google Scholar] [CrossRef]
  21. Munns, R.; Tester, M. Mechanisms of Salinity Tolerance. Annu. Rev. Plant Biol. 2008, 59, 651–681. [Google Scholar] [CrossRef] [PubMed]
  22. Lin, J.; Wang, Y.; Sun, S.; Mu, C.; Yan, X. Effects of Arbuscular Mycorrhizal Fungi on the Growth, Photosynthesis and Photosynthetic Pigments of Leymus Chinensis Seedlings under Salt-Alkali Stress and Nitrogen Deposition. Sci. Total Environ. 2017, 576, 234–241. [Google Scholar] [CrossRef]
  23. Zhang, K.; Yun, G.; Song, P.; Wang, K.; Li, A.; Du, C.; Jia, X.; Feng, Y.; Wu, M.; Qu, K.; et al. Discover the Desirable Landscape Structure of Urban Parks for Mitigating Urban Heat: A High Spatial Resolution Study Using a Forest City, Luoyang, China as a Lens. Int. J. Environ. Res. Public. Health 2023, 20, 3155. [Google Scholar] [CrossRef] [PubMed]
  24. Chen, W.Y. The Role of Urban Green Infrastructure in Offsetting Carbon Emissions in 35 Major Chinese Cities: A Nationwide Estimate. Cities 2015, 44, 112–120. [Google Scholar] [CrossRef]
  25. Kendal, D.; Williams, N.S.G.; Williams, K.J.H. A Cultivated Environment: Exploring the Global Distribution of Plants in Gardens, Parks and Streetscapes. Urban Ecosyst. 2012, 15, 637–652. [Google Scholar] [CrossRef]
  26. Ma, F.; Zhang, W.; Yan, J.; Zhang, T.; Lu, N.; Yao, M.; Zhang, T.; Zheng, J.; Yin, S. Early Advantage for Carbon Sequestration of Monocultures and Greater Long-Term Carbon Sink Potential of Broadleaf Mixed Forests: 20-Year Evidence from the Shanghai Green Belt. Ecol. Indic. 2024, 159, 111655. [Google Scholar] [CrossRef]
  27. Kičić, M.; Scheuer, S.; Korpilo, S.; Vuletić, D.; Seletković, A.; Haase, D.; Krajter Ostoić, S. Relationships between Urban Green Space Types, Cultural Ecosystem Services and Disservices—A Public Participation Geographic Information System Study in Zagreb, Croatia. Sci. Total Environ. 2025, 981, 179549. [Google Scholar] [CrossRef]
  28. Gómez-Baggethun, E.; Barton, D.N. Classifying and Valuing Ecosystem Services for Urban Planning. Ecol. Econ. 2013, 86, 235–245. [Google Scholar] [CrossRef]
  29. Tallis, H.T.; Ricketts, T. InVEST|Natural Capital Alliance. Available online: https://naturalcapitalalliance.stanford.edu/software/invest (accessed on 1 March 2026).
  30. Hirabayashi, S.; Kroll, C.N.; Nowak, D.J. Component-Based Development and Sensitivity Analyses of an Air Pollutant Dry Deposition Model. Environ. Model. Softw. 2011, 26, 804–816. [Google Scholar] [CrossRef]
  31. Nowak, D.J.; Crane, D.E.; Stevens, J.C.; Hoehn, R.E.; Walton, J.T.; Bond, J. A Ground-Based Method of Assessing Urban Forest Structure and Ecosystem Services. Arboric. Urban For. AUF 2008, 34, 347–358. [Google Scholar] [CrossRef]
  32. Wu, L.; Fu, Z.; Huang, Y.; Guo, Z.; Li, N. An Ecological Assessment Model of Water Retention Based on Regional Differences in Characteristic Using Remote Sensing Data. Ain Shams Eng. J. 2025, 16, 103785. [Google Scholar] [CrossRef]
  33. Huang, J.; Song, P.; Liu, X.; Li, A.; Wang, X.; Liu, B.; Feng, Y. Carbon Sequestration and Landscape Influences in Urban Greenspace Coverage Variability: A High-Resolution Remote Sensing Study in Luohe, China. Forests 2024, 15, 1849. [Google Scholar] [CrossRef]
  34. Ordóñez-Barona, C.; Sabetski, V.; Millward, A.A.; Steenberg, J. De-Icing Salt Contamination Reduces Urban Tree Performance in Structural Soil Cells. Environ. Pollut. 2018, 234, 562–571. [Google Scholar] [CrossRef]
  35. Cheng, Q. Research on Improving Urban Park Green Space Landscape Quality Based on Public Psychological Perception: A Comprehensive AHP-TOPSIS-POE Evaluation of Typical Parks in Jinan City. Front. Psychol. 2025, 16, 1418477. [Google Scholar] [CrossRef]
  36. Kormann, J.M.; van der Maaten, E.; Liesebach, M.; Liepe, K.J.; van der Maaten-Theunissen, M. High Risk, High Gain? Trade-Offs between Growth and Resistance to Extreme Events Differ in Northern Red Oak (Quercus rubra L.). Front. Plant Sci. 2024, 15, 1374498. [Google Scholar] [CrossRef]
  37. CJJ/T 85-2017; Standard for Classification of Urban Green Space. China Architecture & Building Press: Beijing, China, 2017.
  38. Zhou, J.; Xiao, J.; Yin, D.; Ren, Y. Trade-Offs and Synergies Between Ecosystem Services and Their Ecological Security Patterns in the Guanzhong–Tianshui Economic Zone. Land 2025, 14, 637. [Google Scholar] [CrossRef]
  39. Ahern, J. From Fail-Safe to Safe-to-Fail: Sustainability and Resilience in the New Urban World. Landsc. Urban Plan. 2011, 100, 341–343. [Google Scholar] [CrossRef]
  40. Liang, D.; Huang, G. Influence of Urban Tree Traits on Their Ecosystem Services: A Literature Review. Land 2023, 12, 1699. [Google Scholar] [CrossRef]
  41. Li, N.; Deng, L.; Ge, Y.; Cao, M.; Cui, Y. Estimation for Refined Carbon Storage of Urban Green Space and Minimum Spatial Mapping Scale in a Plain City of China. Remote Sens. 2024, 16, 217. [Google Scholar] [CrossRef]
  42. He, X.; Bai, Y.; Zhao, Z.; Wang, X.; Fang, J.; Huang, L.; Zeng, M.; Zhang, Q.; Zhang, Y.; Zheng, X. Local and Traditional Uses, Phytochemistry, and Pharmacology of Sophora japonica L.: A Review. J. Ethnopharmacol. 2016, 187, 160–182. [Google Scholar] [CrossRef] [PubMed]
  43. Ninemets, Ü.; Valladares, F. Tolerance to Shade, Drought, and Waterlogging of Temperate Northern Hemisphere Trees and Shrubs. Ecol. Monogr. 2006, 76, 521–547. [Google Scholar] [CrossRef]
Figure 1. Study area and sample point distribution.
Forests 17 00529 g001
Figure 2. Current status of urban green trees and ecosystem services in the study area. (a) Species composition and dominance based on population proportion; (b) Comparison between total ecological values and ecological value densities; (c) Frequency distribution of diameter at breast height (DBH) and tree height (H); (d) Frequency distribution of Carbon Sequestration (CS) and Carbon Storage (CSE) values; (e) Frequency distribution of Precipitation Interception (P) and Air Pollutant Removal (AR) values.
Forests 17 00529 g002
Figure 3. Ecosystem service values of UGSs in Kaifeng. (a) Ecosystem service values of dominant tree species. (b) Comparison of ESVs across four green space types (protective, park, attached, and square green space). (c) Top ten tree species with the highest ecosystem service values. (d) Comparison of ecosystem service values among leaf trait categories (coniferous, broadleaved, evergreen, and deciduous). Different lowercase letters indicate significant differences (p < 0.05, Tukey’s HSD). Box plots show medians, interquartile ranges, and outliers; error bars in (b) and (d) represent SE. (a,c) Red dots and curves represent the mean values and kernel density estimations of the distributions, respectively; (b,d) Error bars indicate standard errors.
Forests 17 00529 g003
Figure 4. Three-dimensional clustering of tree species suitable for different types of green spaces. (a) Protective green space; (b) attached green space; (c) park green space; (d) square green space. Each solid cube represents a tree species, with colors indicating different functional clusters. Small circular dots on the coordinate planes represent the orthogonal projections of each species, facilitating the interpretation of their distribution across ecosystem service value (ESV), ecological adaptability value (EAV), and ornamental value (OV) dimensions.
Forests 17 00529 g004
Table 1. The Analytic Hierarchy Process analysis weights of ecosystem service value (ESV), ecological adaptability value (EAV), and ornamental value (OV) in UGSs across different cities.
Node ItemProtectionSquareParkAttachedCRConsistency Check
Ecosystem service value
CS0.2500.2500.2500.2500pass
CSE0.2500.2500.2500.2500pass
P0.2000.2000.4000.2000pass
AP0.4920.1380.2320.1380.023pass
Ecological adaptability value
Drought-resistant0.4410.3120.1240.1240.023pass
Waterlogging-tolerant0.1240.1240.4410.3120.023pass
Low nutrient tolerance0.4920.2320.1380.1380.023pass
Shade-tolerant0.1220.1220.2770.480.058pass
Harmful gas-resistant0.4870.230.1040.180.081pass
Ornamental value
Flower0.0960.2050.4090.2890.046pass
Foliage0.3910.2760.1380.1950.046pass
Fruit0.1380.1950.2760.3910.046pass
Form0.4530.2620.1180.1670.027pass
Fragrance0.1040.1460.3110.4390.046pass
Disclaimer/Publisher’s Note: The statements, opinions and data contained in all publications are solely those of the individual author(s) and contributor(s) and not of MDPI and/or the editor(s). MDPI and/or the editor(s) disclaim responsibility for any injury to people or property resulting from any ideas, methods, instructions or products referred to in the content.