Article

Spatiotemporal Pattern and Multi-Scenario Simulation of Carbon Storage in Hebei Province Based on Land Use


1
Department of Geography, Handan University, Handan 056005, China
2
Forest Ecology and Conservation in the Upper Reaches of the Yangtze River Key Laboratory of Sichuan Province, College of Forestry, Sichuan Agricultural University, Chengdu 611130, China
*
Author to whom correspondence should be addressed.
Forests 2026, 17(4), 513; https://doi.org/10.3390/f17040513
Submission received: 16 March 2026 / Revised: 16 April 2026 / Accepted: 20 April 2026 / Published: 21 April 2026
(This article belongs to the Section Forest Ecology and Management)

Abstract

Scientifically assessing the spatiotemporal evolution of regional carbon storage is of great significance for achieving the “dual carbon” goals and optimizing territorial spatial patterns. This study integrated the PLUS and InVEST models to systematically reconstruct the spatiotemporal pattern of carbon storage in Hebei Province from 2000 to 2020, simulate its evolution trajectory under different scenarios in 2030, and identify its driving mechanisms using the GeoDetector model. The main findings are as follows: (1) From 2000 to 2020, cropland was the dominant land use type in Hebei Province, and carbon storage exhibited a spatial pattern of “high in the northwest, low in the southeast.” Carbon storage increased from 16.23 × 10⁸ t to 16.31 × 10⁸ t, with a significantly slowed growth rate after 2010. (2) Multi-scenario simulations for 2030 indicate that under the natural development and economic priority scenarios, construction land expands significantly while cropland and grassland continue to decrease. In contrast, carbon storage shows an increasing trend under the ecological protection and cropland protection scenarios. (3) Driving factor analysis reveals that the spatial differentiation of carbon storage is primarily controlled by natural factors such as slope, elevation, and NDVI, while the explanatory power of anthropogenic factors, particularly population density, has significantly increased. The interaction between NDVI and slope exhibits a synergistic enhancement effect. This study elucidates the coupling mechanisms between land use change and carbon storage under different policy orientations, providing a scientific basis for territorial spatial optimization and the formulation of differentiated carbon neutrality pathways in Hebei Province.

1. Introduction

Land use/land cover change (LUCC) serves as a fundamental driver of carbon cycling within terrestrial ecosystems, directly modulating the spatiotemporal distribution of regional carbon stocks through alterations in vegetation cover and soil organic matter content [1,2]. With the accelerated pace of global warming and the steady implementation of China’s “dual carbon” strategy, rigorously evaluating the impact of LUCC on carbon storage holds significant theoretical and practical importance for optimizing regional spatial patterns and enhancing the carbon sink capacity of ecosystems [3,4]. In areas experiencing rapid urbanization, the scale of construction land often expands rapidly. This often encroaches on ecological land such as cropland, forest land, and grassland, ultimately leading to a downward trend in regional carbon storage [5,6]. Consequently, precisely simulating and projecting the spatiotemporal evolution of carbon stocks driven by LUCC has emerged as a frontier research topic within geography and sustainability science.
Research on land use and carbon storage has recently been applied across various geographical contexts. In terms of spatial scope, scholars have conducted studies at multiple scales, including ecologically distinct regions [7,8], watershed scales [9,10], urban agglomerations [11], and coastal zones [12,13]. Through multi-model coupling [14], policy scenario integration [15,16], and the incorporation of ecological risk [17] and habitat quality [18,19] assessments, these studies have laid a foundation for understanding the multidimensional relationship between land use change and carbon storage.
Current methods for carbon storage estimation and prediction primarily include field measurements and model simulations. Although field measurements provide accurate data, they are time-consuming and labor-intensive, making them less suitable for large-scale studies. Model analysis can compensate for the limitations of field measurements and offers significant advantages in estimating and analyzing carbon storage across different spatial and temporal scales.
For quantifying the impact of LUCC on ecosystem services, commonly used modeling approaches include PLUS, FLUS, and Markov [20,21,22]. Among these, the PLUS model employs a random forest algorithm that effectively addresses spatial autocorrelation and multicollinearity among driving variables, enabling robust simulation of patch-scale land use changes [23]. The InVEST model, characterized by its moderate data requirements and intuitive spatial representation, is well-suited for regional carbon storage assessment [24,25,26,27].
Existing case studies have primarily focused on Shaanxi [28], Hubei [29], the Yellow River Basin [7], and arid/semi-arid regions [18]; however, Hebei Province—a typical rapidly urbanizing area within the Beijing–Tianjin–Hebei coordinated development region—has been relatively underexamined using this framework [12,30]. Regarding scenario configuration, most studies have compared natural development versus ecological protection [15] or economic development versus ecological protection [16]; fewer studies have simultaneously incorporated cropland protection as an independent scenario alongside ecological protection, economic priority, and natural development within the same PLUS–InVEST assessment framework [16,31].
Situated in the northern part of the North China Plain, Hebei Province occupies a pivotal position within the coordinated development framework of the Beijing–Tianjin–Hebei urban agglomeration. The implementation of the Beijing–Tianjin–Hebei Coordinated Development Plan has effectively promoted regional ecological coordination, establishing a solid foundation for enhancing the province’s environmental quality. This initiative has also driven substantial transformations in Hebei’s land use configurations, profoundly influencing its carbon stocks. Accordingly, this investigation selects Hebei Province as the study area and integrates the PLUS–InVEST modeling framework to undertake the following research objectives: (1) Utilizing land use data spanning 2000 to 2020, reconstruct the spatiotemporal patterns of carbon stocks throughout the historical period; (2) Establish four scenarios—natural development, cropland protection, ecological protection, and economic priority—to simulate land use changes and project carbon stock evolution trends for 2030; (3) Employ the Geodetector model to identify the predominant driving factors governing carbon stock spatial differentiation and their interactive effects. The overarching aim is to elucidate the coupling mechanisms between land use change and carbon stocks under divergent policy orientations, thereby furnishing a scientific foundation for land resource management and ecological construction initiatives oriented toward carbon neutrality goals in Hebei Province and the broader North China region.

2. Study Area and Data

2.1. Study Area

Hebei Province is located in the northern part of the North China Plain (36°00′–42°37′ N, 113°27′–118°00′ E) (Figure 1). It is the only province in China that possesses a variety of landform types, including plateaus, mountains, hills, plains, lakes, coastal zones, and deserts, forming a typical and diverse complex natural ecosystem. The vegetation types include broadleaf forests, coniferous forests, and grasslands, which play an important carbon sink function in the regional carbon cycle process.

2.2. Data Source

The original data for this study were categorized into three types: basic geographic data, natural environment data, and socioeconomic data. Among them, land use, soil type, and meteorological data were obtained from the Resource and Environment Science Data Center of the Chinese Academy of Sciences. The Digital Elevation Model (DEM) was sourced from the Geospatial Data Cloud platform, from which the slope factor was subsequently derived. Vector datasets, including road networks, water systems, and nature reserves, were acquired from OpenStreetMap. The administrative boundary base map was based on the version provided by the Standard Map Service System of the Ministry of Natural Resources. To ensure consistency in spatial resolution, all raster datasets were uniformly resampled to a 30 m × 30 m resolution using the resampling tool in ArcGIS 10.8, and the projection coordinate system of all raster data was unified to WGS_1984_UTM_Zone_50N (Table 1).

3. Research Methods

3.1. PLUS Model

The PLUS (v1.40) model represents a land use simulation approach that integrates system dynamics with patch-based generation, enabling effective characterization of how LUCC influences ecosystem services [32]. The principal strength of this modeling framework resides in its capacity to conduct dynamic simulations utilizing fine-scale parcel data, thereby elucidating both the spatial and temporal processes and mechanisms underlying land use change. This methodology proves particularly well-suited for investigating phenomena such as urban expansion simulation and land use regulation.
A total of 11 driving factors were selected in this study, classified into three categories: natural environment (precipitation, slope, elevation, NDVI, and soil erosion), location accessibility (distance to government, distance to Class I-III roads, distance to rivers, and distance to protected areas), and socioeconomic factors (GDP and population).
In the LEAS module, the sampling rate was set to 0.01, the number of regression trees was set to 20, and the mTry parameter was set to 16. The parameters of the CARS module were configured as follows: The patch generation threshold was set to 0.2, the expansion coefficient was set to 0.1, and the seed percentage was set to 0.1. The neighborhood weights were set as follows: cropland: 0.263, forestland: 0.248, grassland: 0.203, water: 0.021, construction land: 0.265, and unused land: 0.001.

3.2. InVEST Model

The InVEST model (version 3.14.3) was used in this study. The InVEST model serves as a comprehensive decision-support instrument that integrates ecosystem service function assessment with economic value accounting [33]. In this investigation, the InVEST model is applied to evaluate and analyze carbon storage across Hebei Province. This modeling framework features a relatively systematic methodology for carbon stock estimation, incorporating four principal carbon pools: above-ground biomass, below-ground biomass, soil organic matter, and dead organic matter [34]. Carbon stocks denote the total quantity of carbon resources accumulated within ecosystems, primarily encompassing forms such as biomass carbon and soil carbon. During the actual estimation procedure, multiple factors must be comprehensively considered—including land use type, vegetation cover status, soil properties, and climatic conditions—and overall calculations should be performed in accordance with regional ecosystem characteristics. Within the InVEST model framework, the carbon stock calculation formula can be expressed as:
C i = C i - a b o v e + C i - b e l o w + C i - s o i l + C i - d e a d
C = i = 1 n A i × C i
In the aforementioned carbon storage estimation equations, the parameters are defined as follows: Ci represents the carbon density of land use type i (t·hm−2), which is collectively determined by four components: aboveground biomass carbon density (Ci-above), belowground biomass carbon density (Ci-below), soil organic carbon density (Ci-soil), and dead organic matter carbon density (Ci-dead). Ai denotes the area of land use type i (hm2), C signifies the total carbon storage in the study area (t), and n is the number of land use types, which is set to 6 in this study.
Accurately calibrating carbon density parameters is an important prerequisite for ensuring the accuracy of carbon storage estimation and supporting evidence-based carbon policy formulation. This study corrected carbon density values following the methods proposed by Alam et al. [35] and Chen et al. [36] and validated them using the carbon density dataset for Hebei Province from Li et al. [37]. The specific parameter values are shown in Table 2.

3.3. GeoDetector Model

The Geodetector model constitutes a quantitative analytical instrument designed to examine the relationship between geographical outcomes and explanatory factors. This methodology encompasses four core components: risk detection, factor detection, ecological detection, and interaction detection and has been extensively employed in research investigating driving mechanisms within both natural and socio-economic systems [38]. In the present investigation, the Geodetector model was utilized to assess the association between carbon storage and its influencing determinants in the study area and to explore the interactive effects among these variables. The computational formula is presented as follows:
q = 1 1 n σ 2 h = 1 L N h σ h 2
where q represents the explanatory power of a driving factor on the spatial distribution of carbon storage in the study area, with its value ranging from 0 to 1; h is the number of strata; n and σ2 are the total number of samples and the variance in the entire study area, respectively; and N h and σ h 2 are the sample size and variance within stratum h, respectively.

4. Results and Analysis

4.1. Land Use Change Analysis

4.1.1. Change in Land Use Spatial Pattern

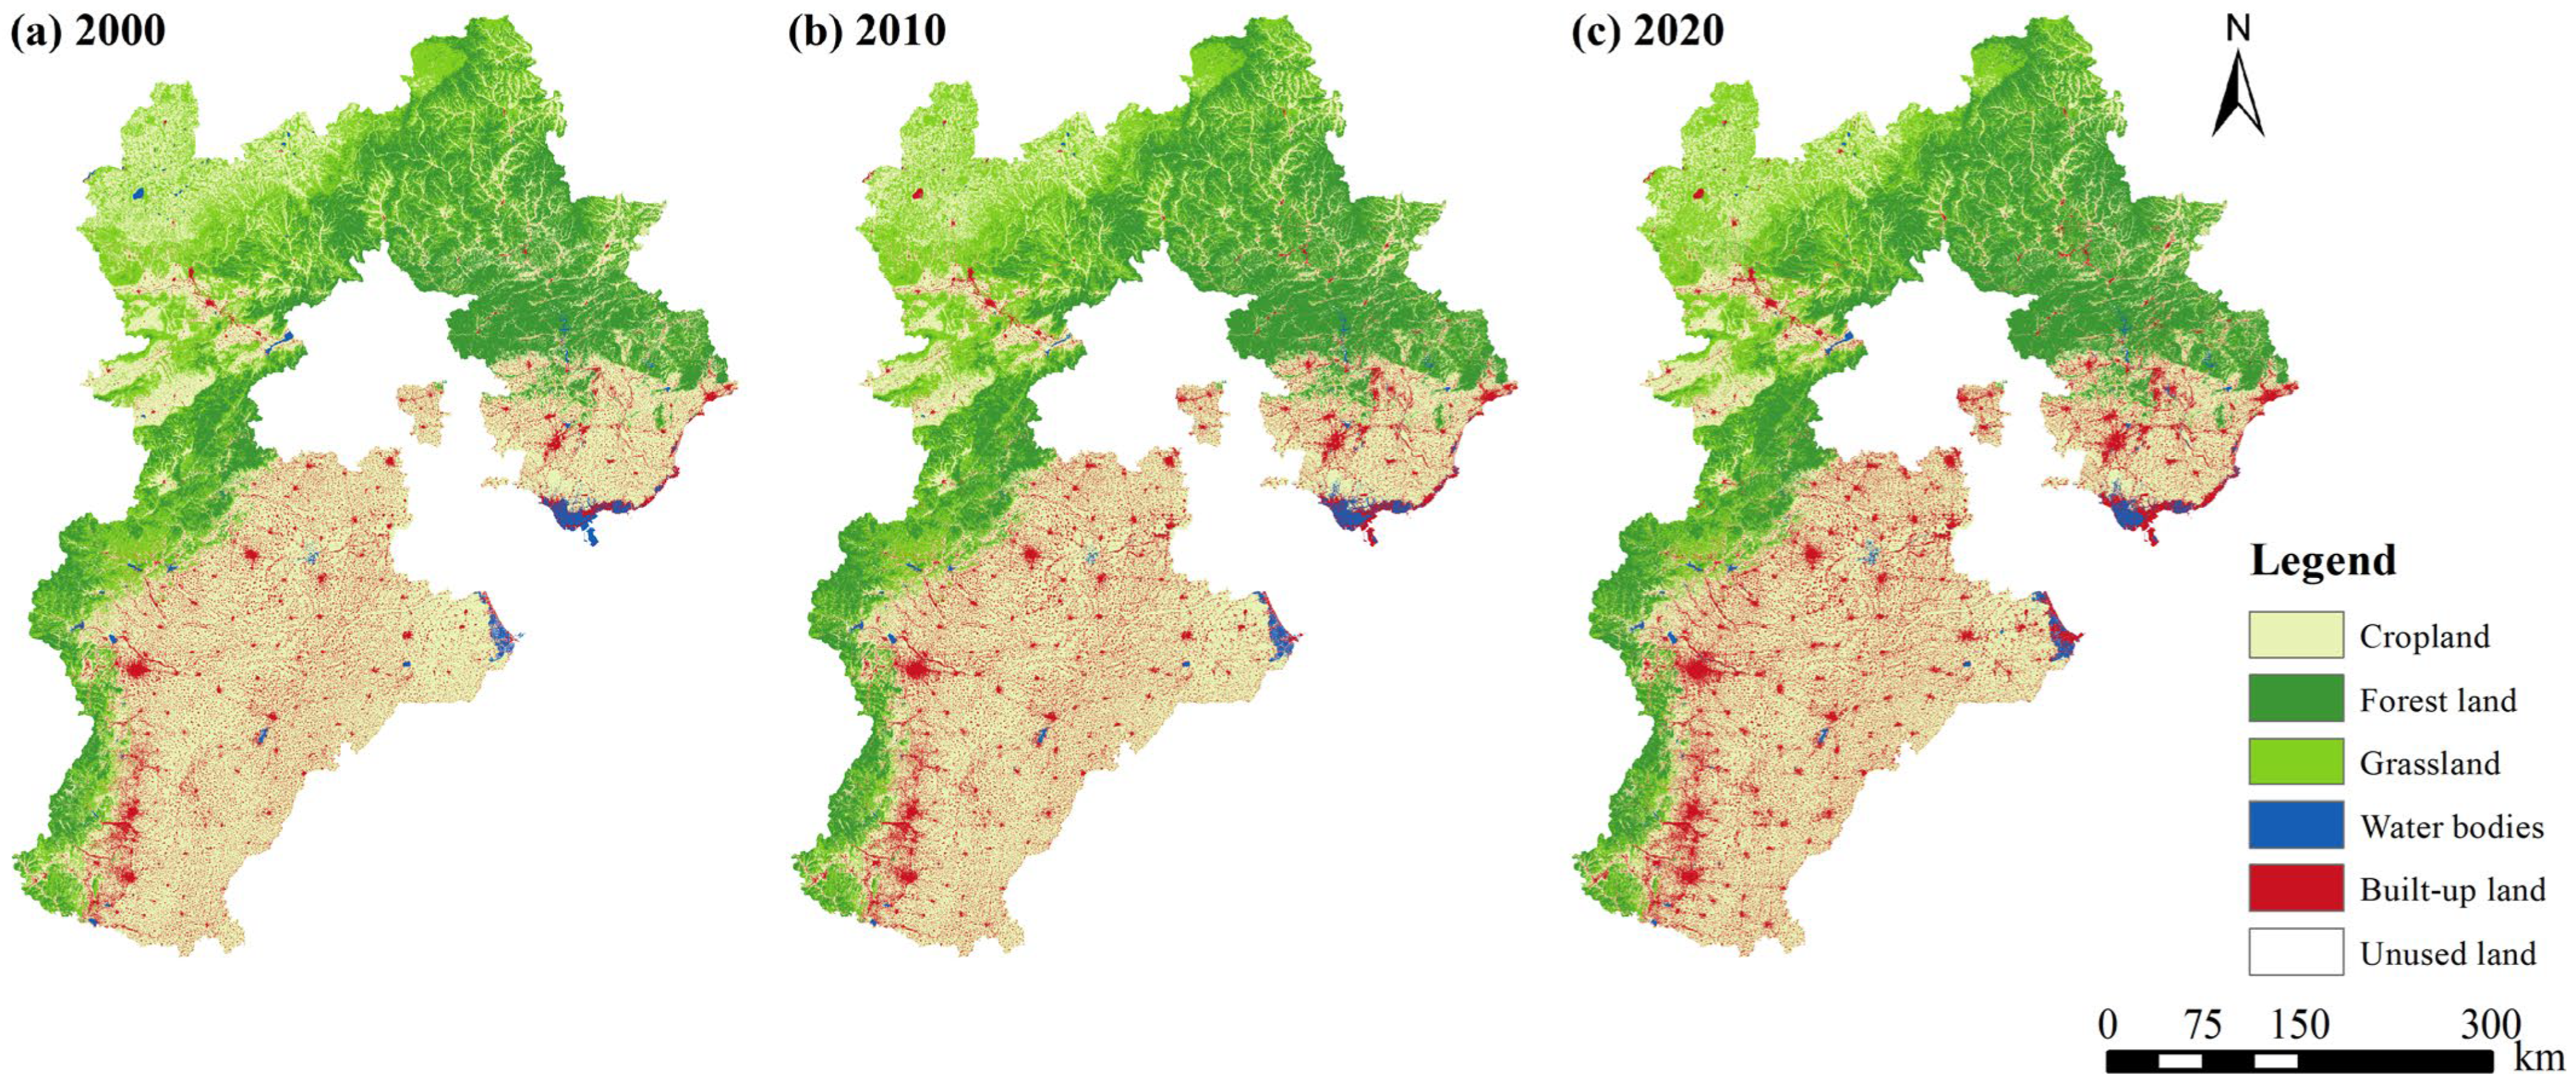
According to the spatial distribution of land use types in Hebei Province from 2000 to 2020 (Figure 2), significant spatial differentiation was observed. Cropland was primarily concentrated in the central and southern plains, covering administrative areas such as Shijiazhuang, Baoding, and Handan. Forest land was clustered in the northern Yanshan Mountains and western Taihang Mountains, including Chengde, Zhangjiakou, and western Baoding. Grassland was primarily distributed in the southern margin of the Inner Mongolia Plateau, specifically in northern Zhangjiakou and Chengde, as well as the transitional zones between mountainous areas and plains. Water bodies appeared as point or linear features along major rivers, lakes, and reservoirs, including Baiyangdian Lake, Hengshui Lake, and the Luanhe and Chaobai River basins. Built-up land exhibited expansion along transportation corridors, centered on the Beijing–Tianjin–Hebei urban agglomeration, forming concentrated areas around major cities such as Shijiazhuang and Tangshan. Unused land was mainly distributed in arid northern areas such as northern Zhangjiakou and coastal saline zones such as eastern Cangzhou.
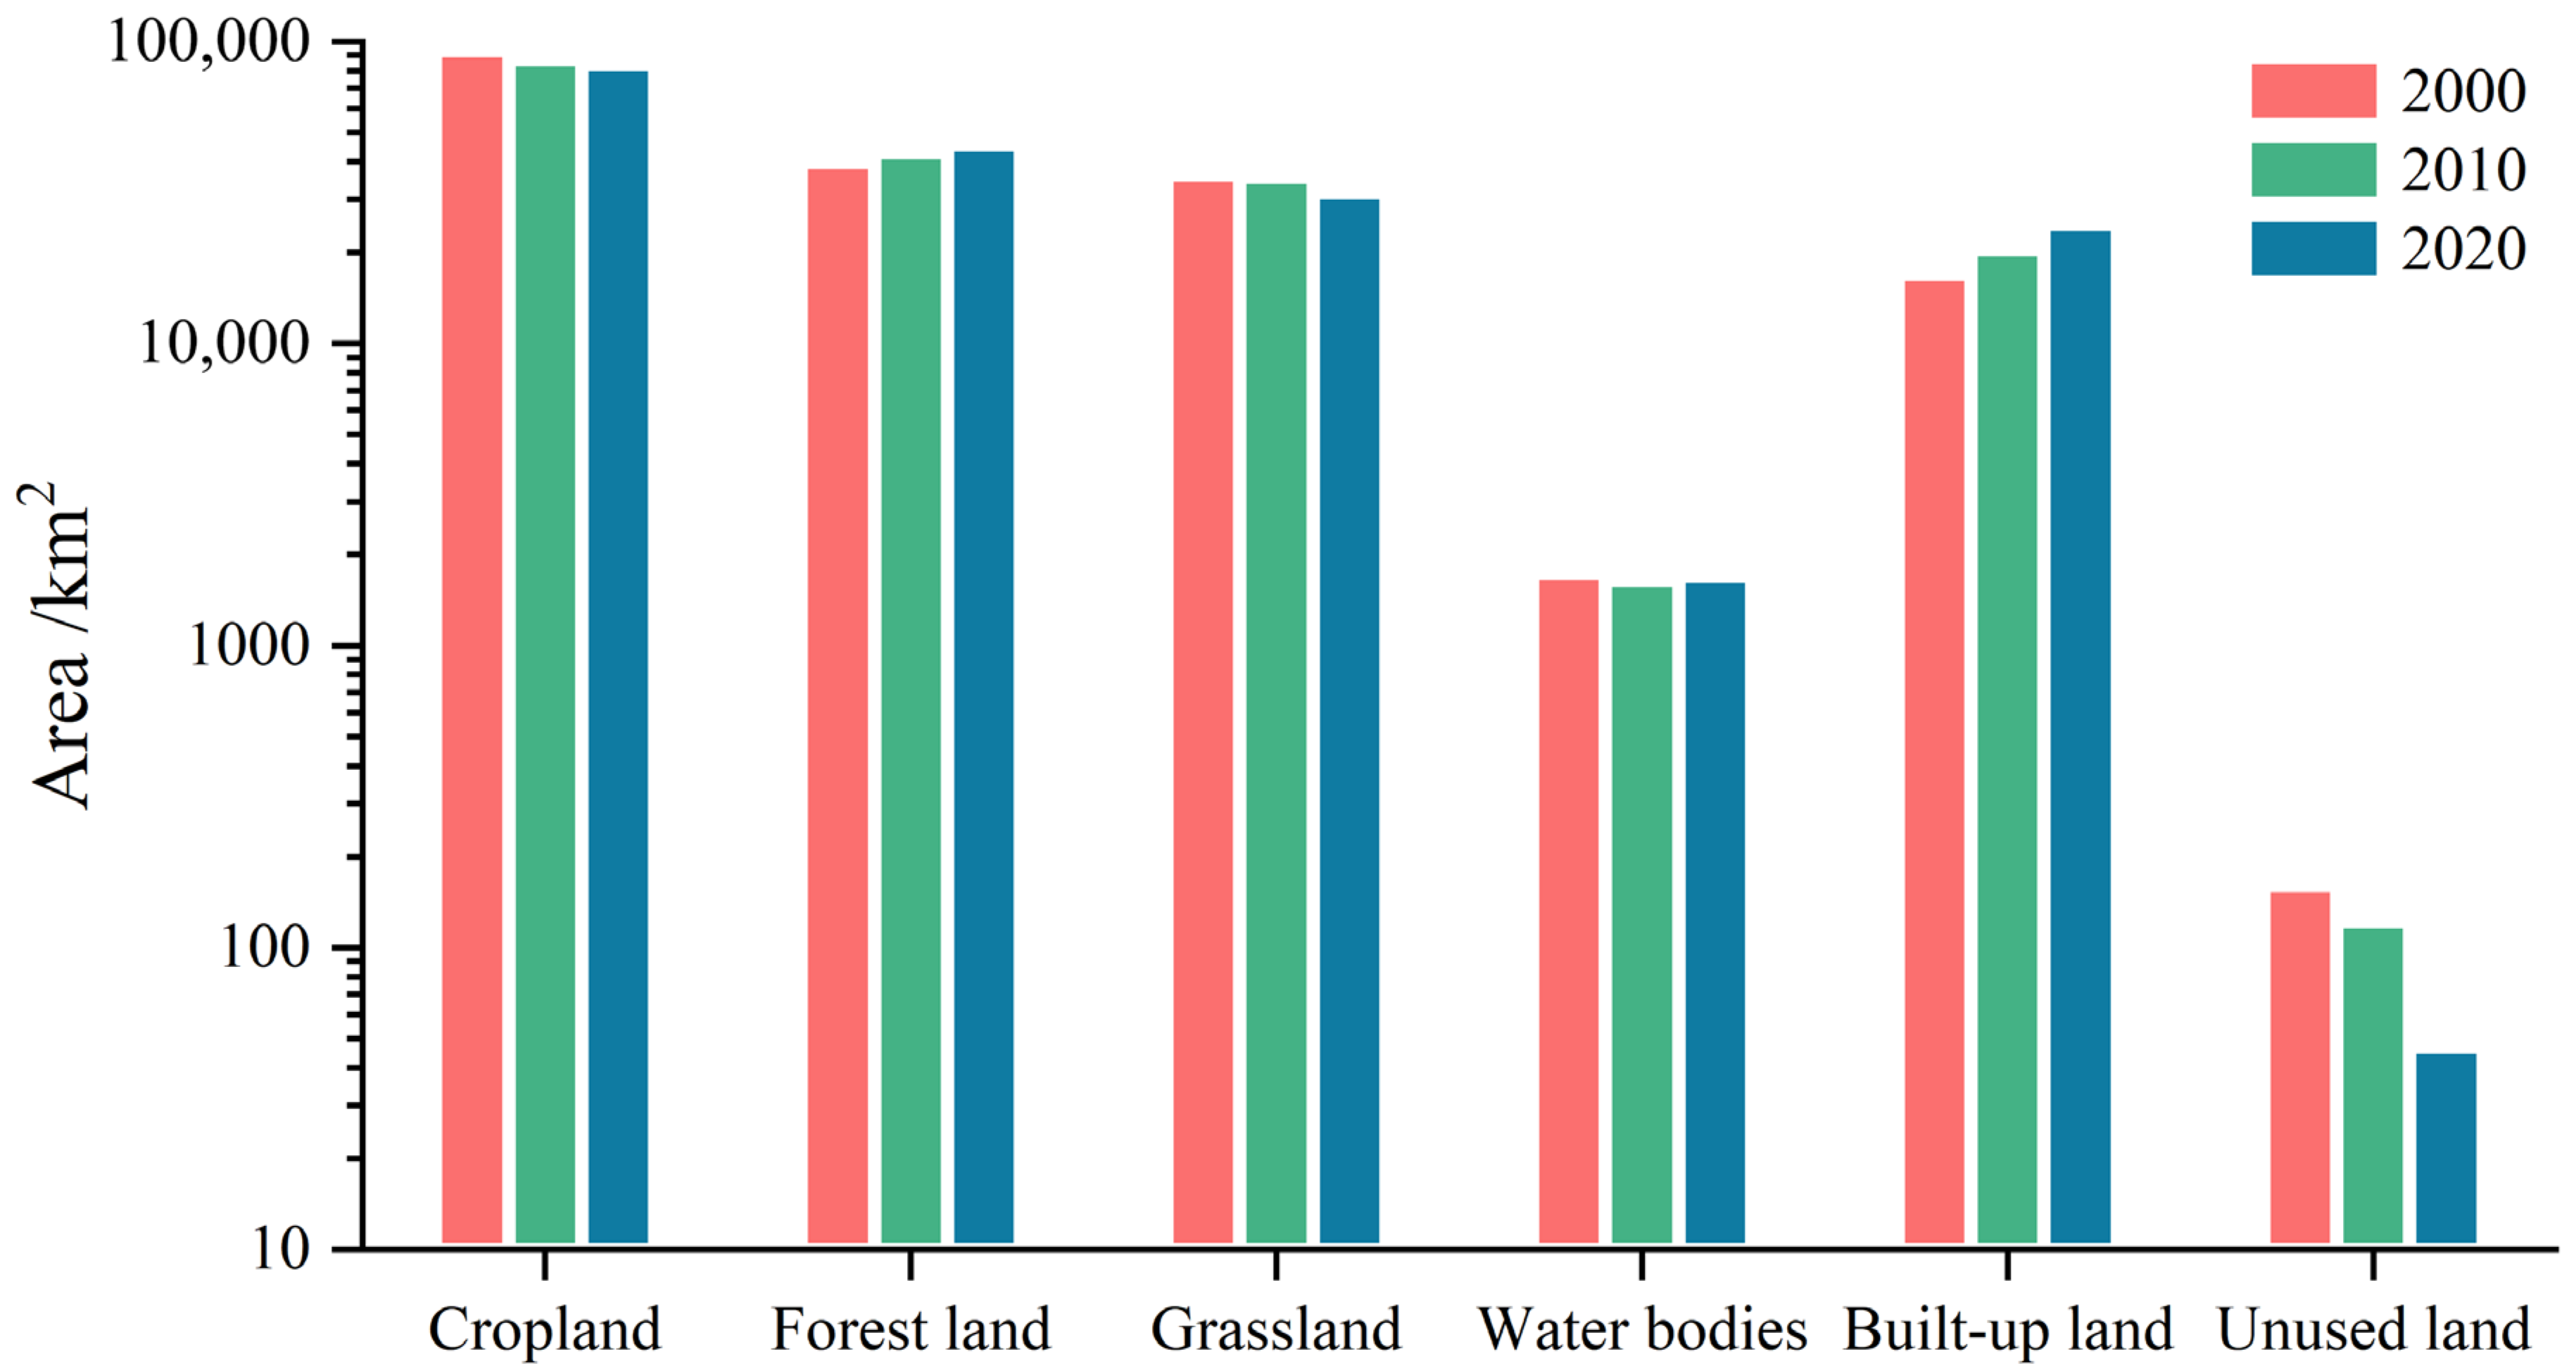
From the perspective of quantitative structure, cropland, forest land, and grassland were the dominant land use types in Hebei Province. During 2000–2020, the combined area of these three types consistently accounted for over 85% of the provincial total area (Figure 3). Cropland had the highest proportion (ranging from 49.63% to 44.74%) but showed a continuous downward trend, with a cumulative reduction of 9173.71 km2. In contrast, forest land area continued to increase, with a net gain of 5776.41 km2. Grassland area showed a continuous decreasing trend, with a cumulative reduction of 4369.88 km2. Water bodies exhibited fluctuating characteristics, decreasing from 1733.14 km2 in 2000 to 1644.74 km2 in 2010, then rebounding to 1701.62 km2 in 2020. Built-up land increased by a cumulative total of 7912.45 km2 (46.75%). Unused land area continuously shrank, with a cumulative reduction of 113.75 km2 (70.75%).

4.1.2. Land Use Transfer Analysis

Based on the land use transfer matrix of Hebei Province from 2000 to 2020 (Table 3), the total area of land use conversion during the study period reached 31,736.96 km2, accounting for 16.90% of the provincial total area. Land use transitions primarily occurred among cropland, built-up land, forest land, and grassland. This relatively high conversion intensity indicates that Hebei Province experienced significant land use restructuring under the dual drivers of rapid urbanization and ecological protection policies.
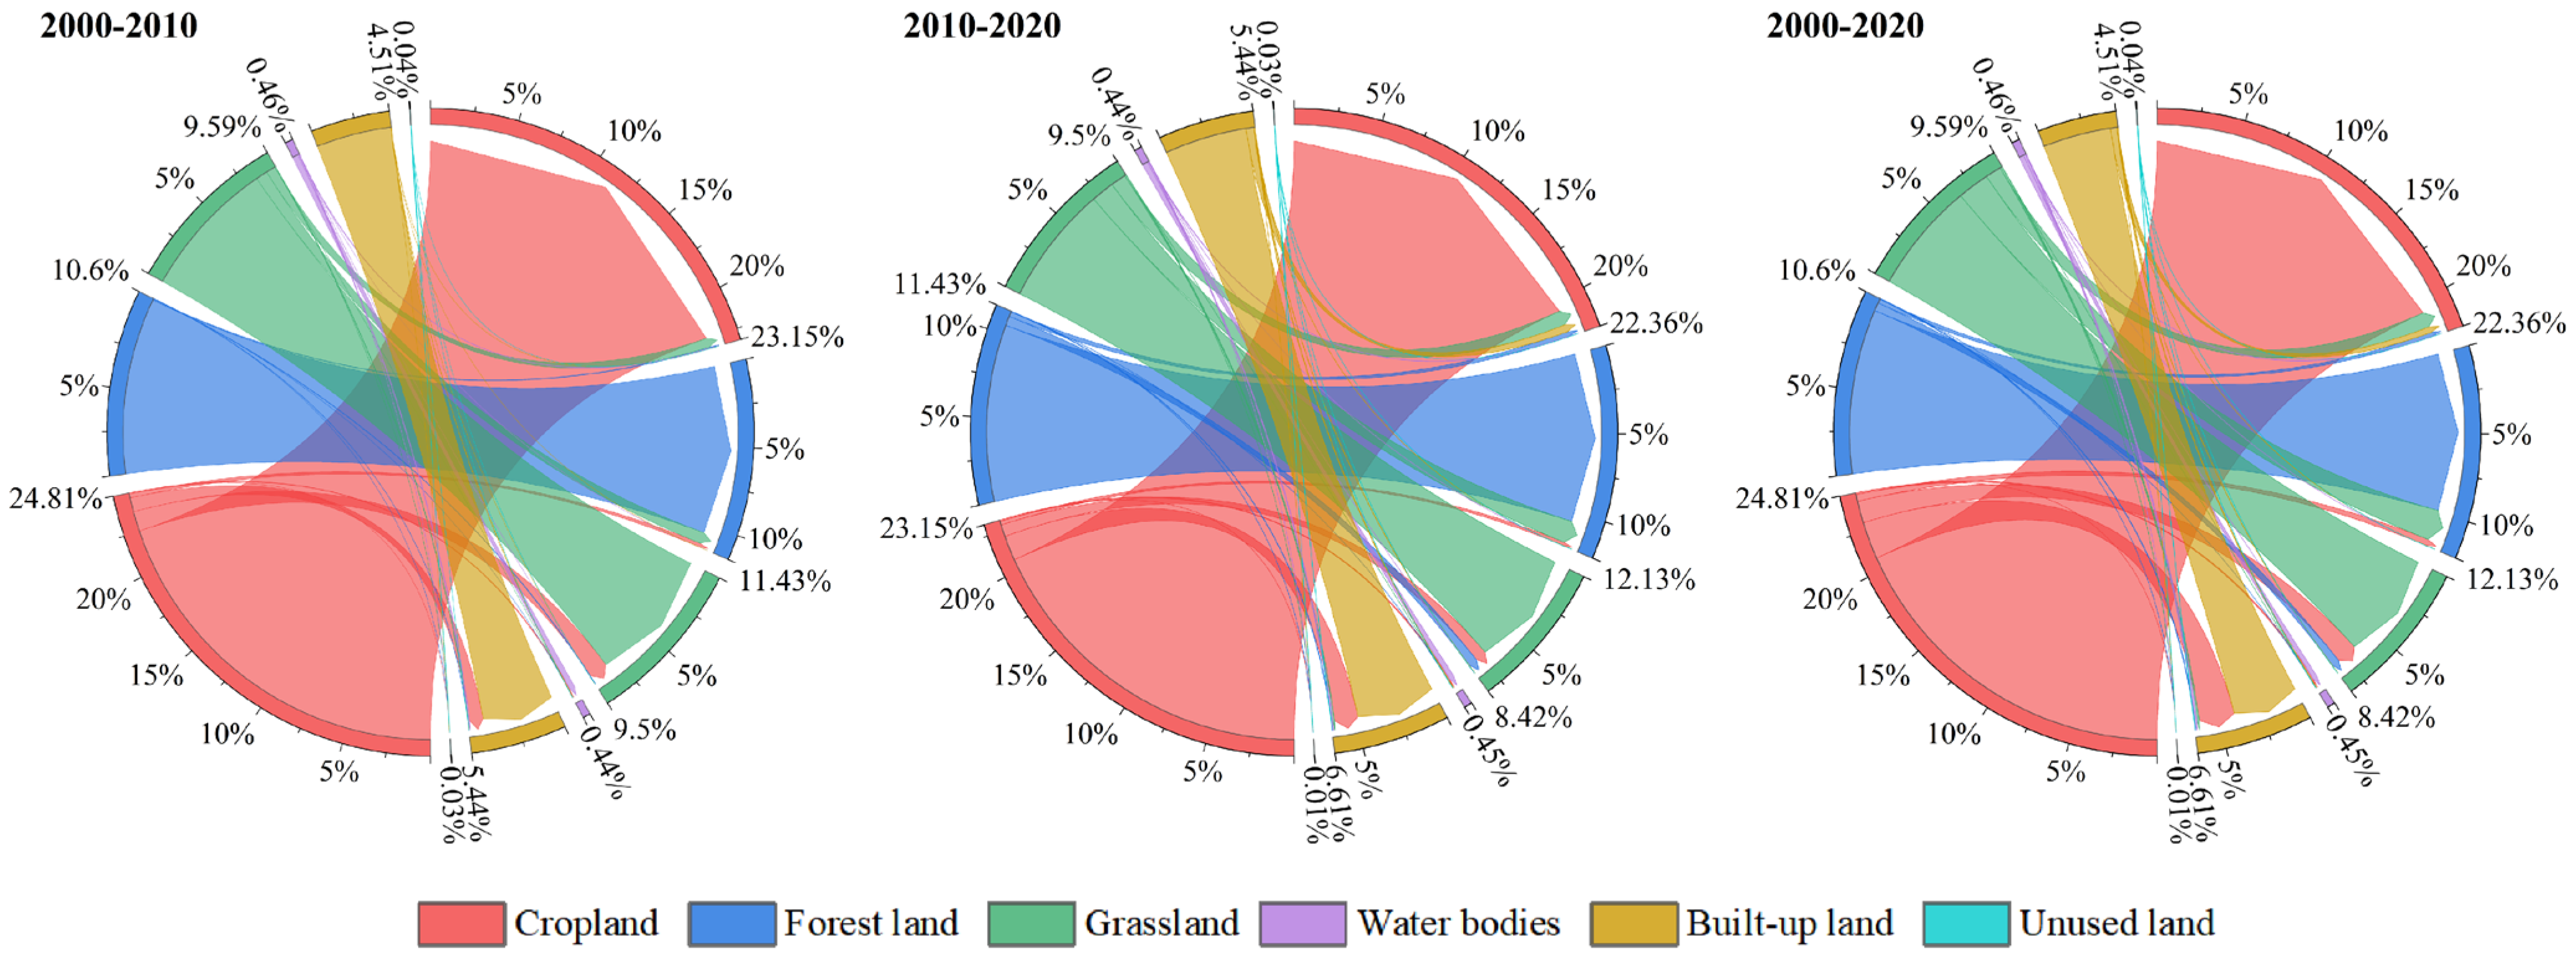
Regarding transfer-out characteristics, cropland exhibited the largest transfer-out area, totaling 15,112.75 km2, which represented 47.62% of the overall transfer-out area. Cropland was predominantly converted to built-up land and grassland (Figure 4). The conversion of cropland to built-up land reflects the continuous outward expansion of urban development boundaries and the demand for high-quality cropland occupation by industrial park construction since the implementation of the Hebei Provincial Territorial Spatial Plan. The conversion of cropland to grassland was mainly distributed on sloping cropland in ecologically fragile areas such as the Taihang and Yanshan Mountains, which is highly consistent with the implementation areas of ecological construction projects such as the Grain for Green Program (returning cropland to forest and grassland). Grassland constituted 35.36% of the total transfer-out area, with main conversions directed toward forest land (7138.47 km2) and cropland (3547.63 km2).
During the land transfer process, built-up land recorded the largest transfer-in area (9606.97 km2, accounting for 30.27% of the total area), with primary sources being cropland and grassland. This confirms that built-up land expansion was the most active land use change process during the accelerated urbanization period. Forest land contributed 27.34% of the total transfer-in area, mainly originating from grassland and cropland. Regarding inter-type conversion relationships, the transition from cropland to built-up land (8338.35 km2) and the conversion from grassland to forest land (7138.47 km2) emerged as the two most active pathways, collectively comprising 48.8% of all transferred area. These two pathways represent, respectively, the urbanization expansion driven by economic development and the territorial spatial green transformation guided by ecological policies in Hebei Province during the study period.

4.2. Spatial Distribution of Carbon Storage Analysis

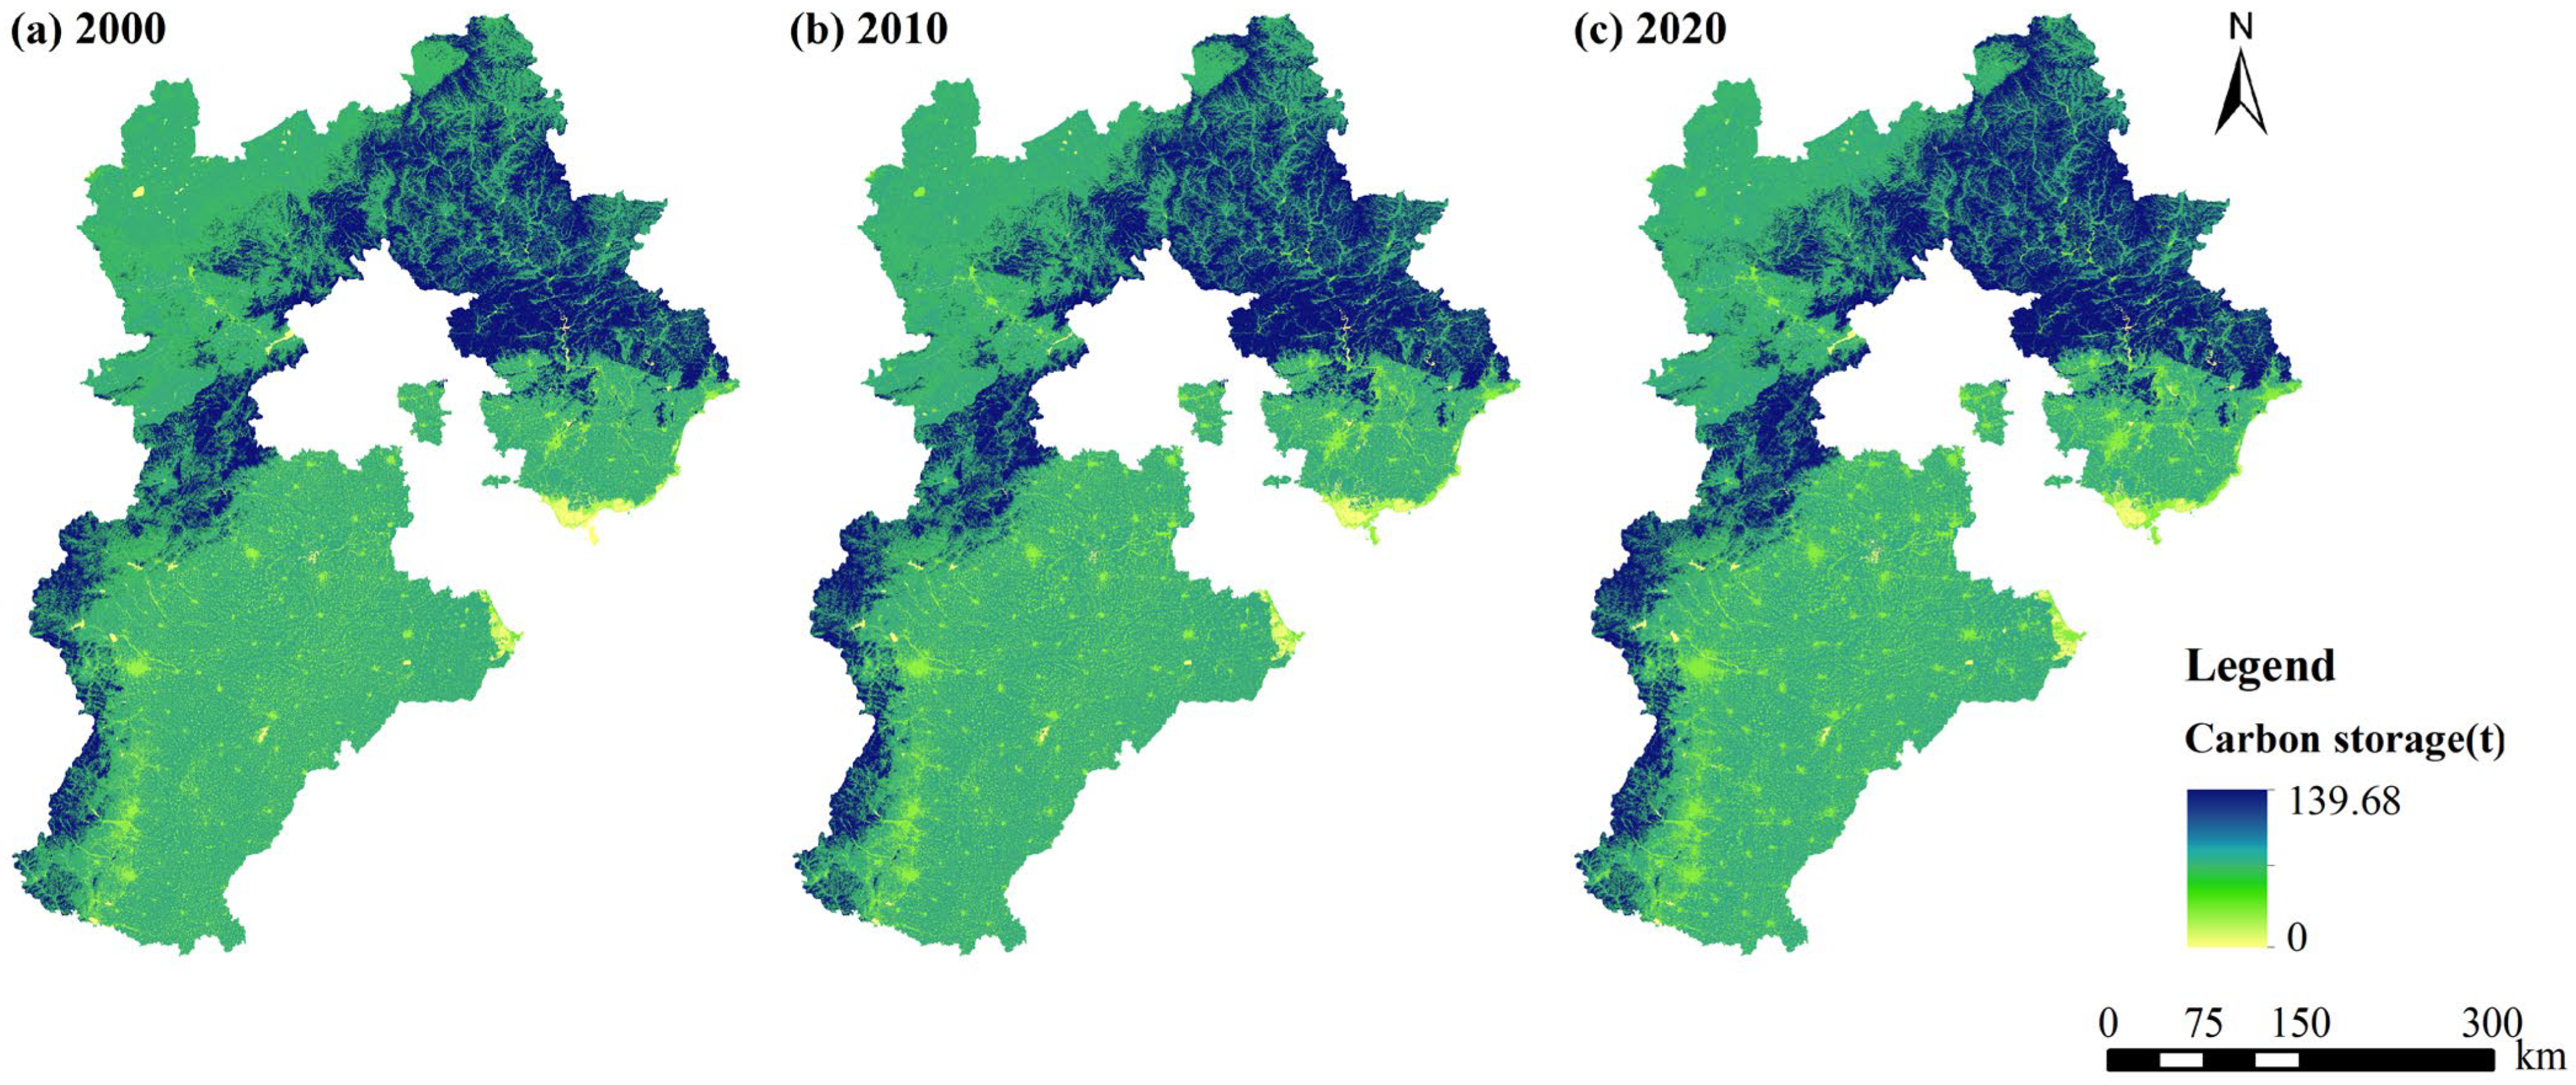
From the perspective of spatial configuration, the carbon storage in Hebei Province exhibits a distribution pattern characterized by higher values in the northwest and lower values in the southeast. The formation of this pattern is closely related to the regional combination of land use types and the spatial differentiation of topographic conditions (Figure 5). The mountainous terrains of northern Hebei, along with the Taihang Mountains—where forest land predominates—exhibited relatively elevated carbon storage levels. The central Hebei Plain, predominantly occupied by cropland and built-up land, displayed moderate carbon storage. Conversely, the coastal zones of eastern Hebei and various low-lying areas, shaped by the spatial arrangement of water bodies and built-up land, registered comparatively diminished carbon storage.
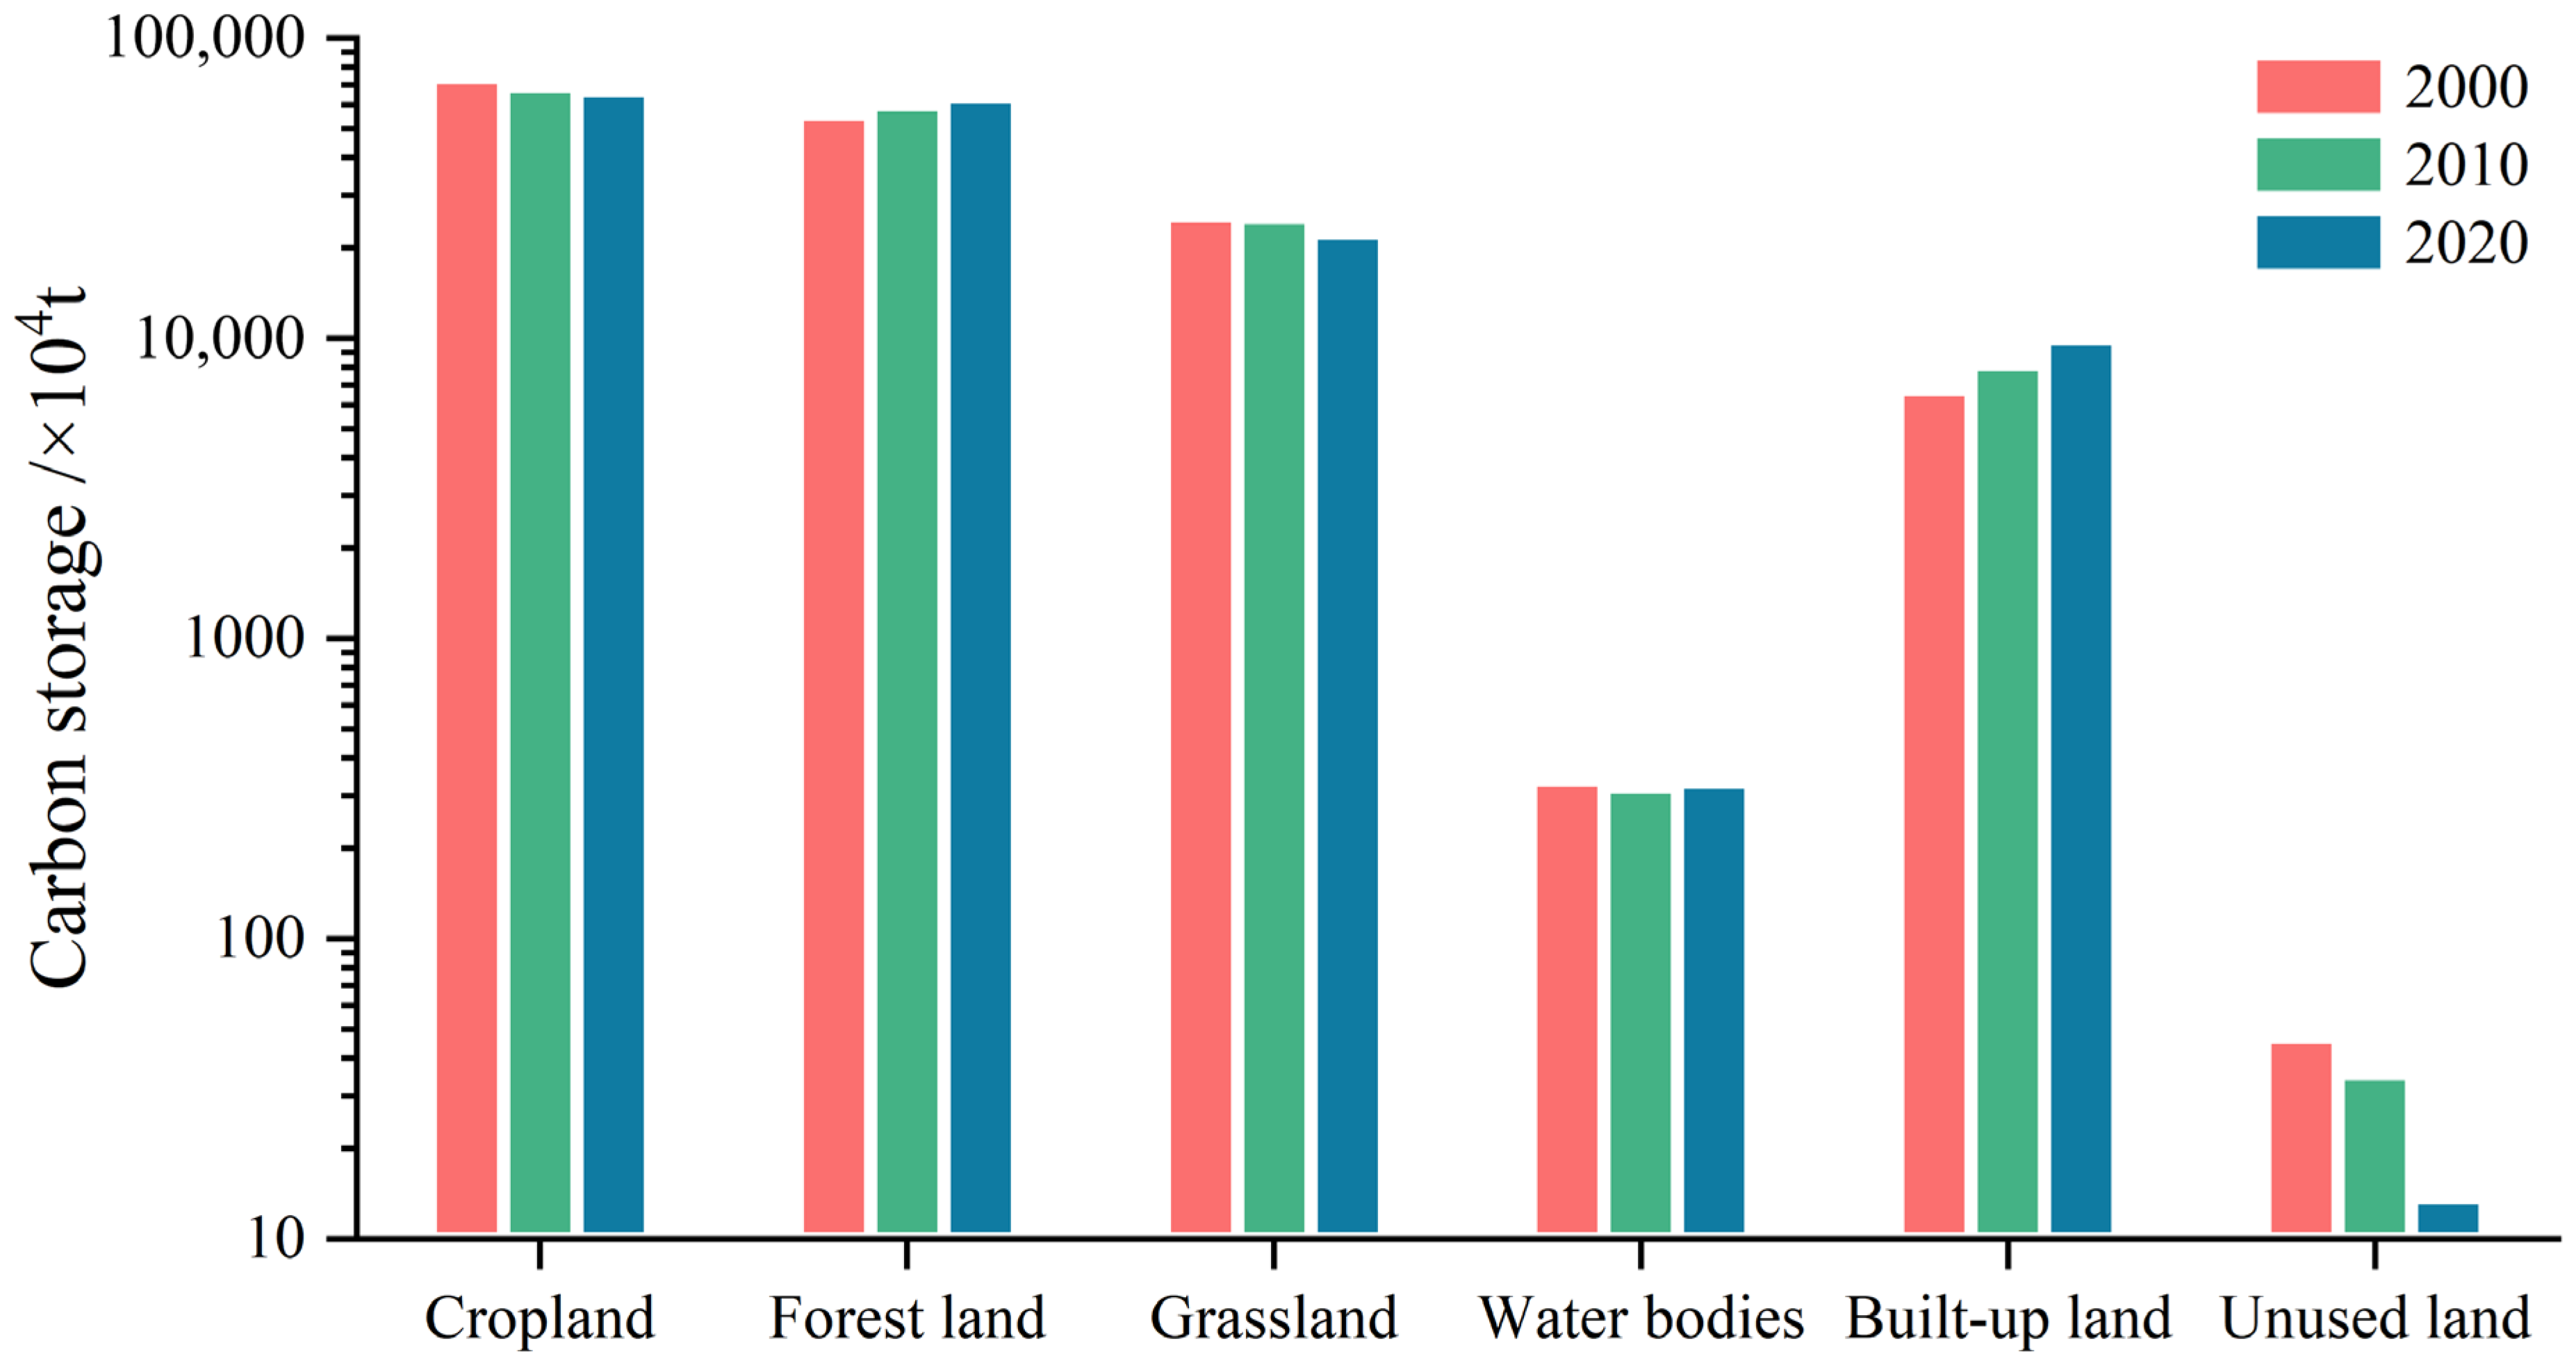
From 2000 to 2020, carbon storage in Hebei Province increased from 162,339.63 × 104 t to 163,144.95 × 104 t, with a cumulative increase of 805.32 × 10⁴ t (Figure 6). In terms of stage-specific changes, carbon storage increased by 587.05 × 10⁴ t from 2000 to 2010 and by 218.27 × 104 t from 2010 to 2020, indicating a significantly slowed growth rate. When examining carbon storage by land use type, the contributions to total regional carbon storage, in descending order, were cropland, forest land, grassland, built-up land, water bodies, and unused land. Among these, cropland accounted for the largest share of carbon storage, although its proportion declined from 45.64% in 2000 to 40.94% in 2020. The share of forest land carbon storage rose from 34.25% to 39.02%, exhibiting a sustained increasing trend. Grassland carbon storage decreased from 15.71% to 13.73%, reflecting a gradual decline. The proportion of built-up land carbon storage increased from 4.17% to 6.09%, indicating marked growth. Throughout the study period, water bodies and unused land together accounted for less than 1% of total carbon storage.
Analyzed through the lens of carbon storage dynamics, forest land registered the most pronounced increase between 2000 and 2020, accumulating a rise of 8068.49 × 104 t—establishing it as the principal contributor to regional carbon gains. Built-up land followed, with an increase of 3164.98 × 104 t. In contrast, cropland and grassland experienced declining trajectories, with reductions of 7294.93 × 104 t and 3093.88 × 104 t, respectively. Unused land also recorded a decrease of 33.22 × 10⁴ t.

4.3. Spatiotemporal Changes in Land Use Types and Carbon Storage Under Different Scenarios

4.3.1. Land Use Change Under Different Scenarios

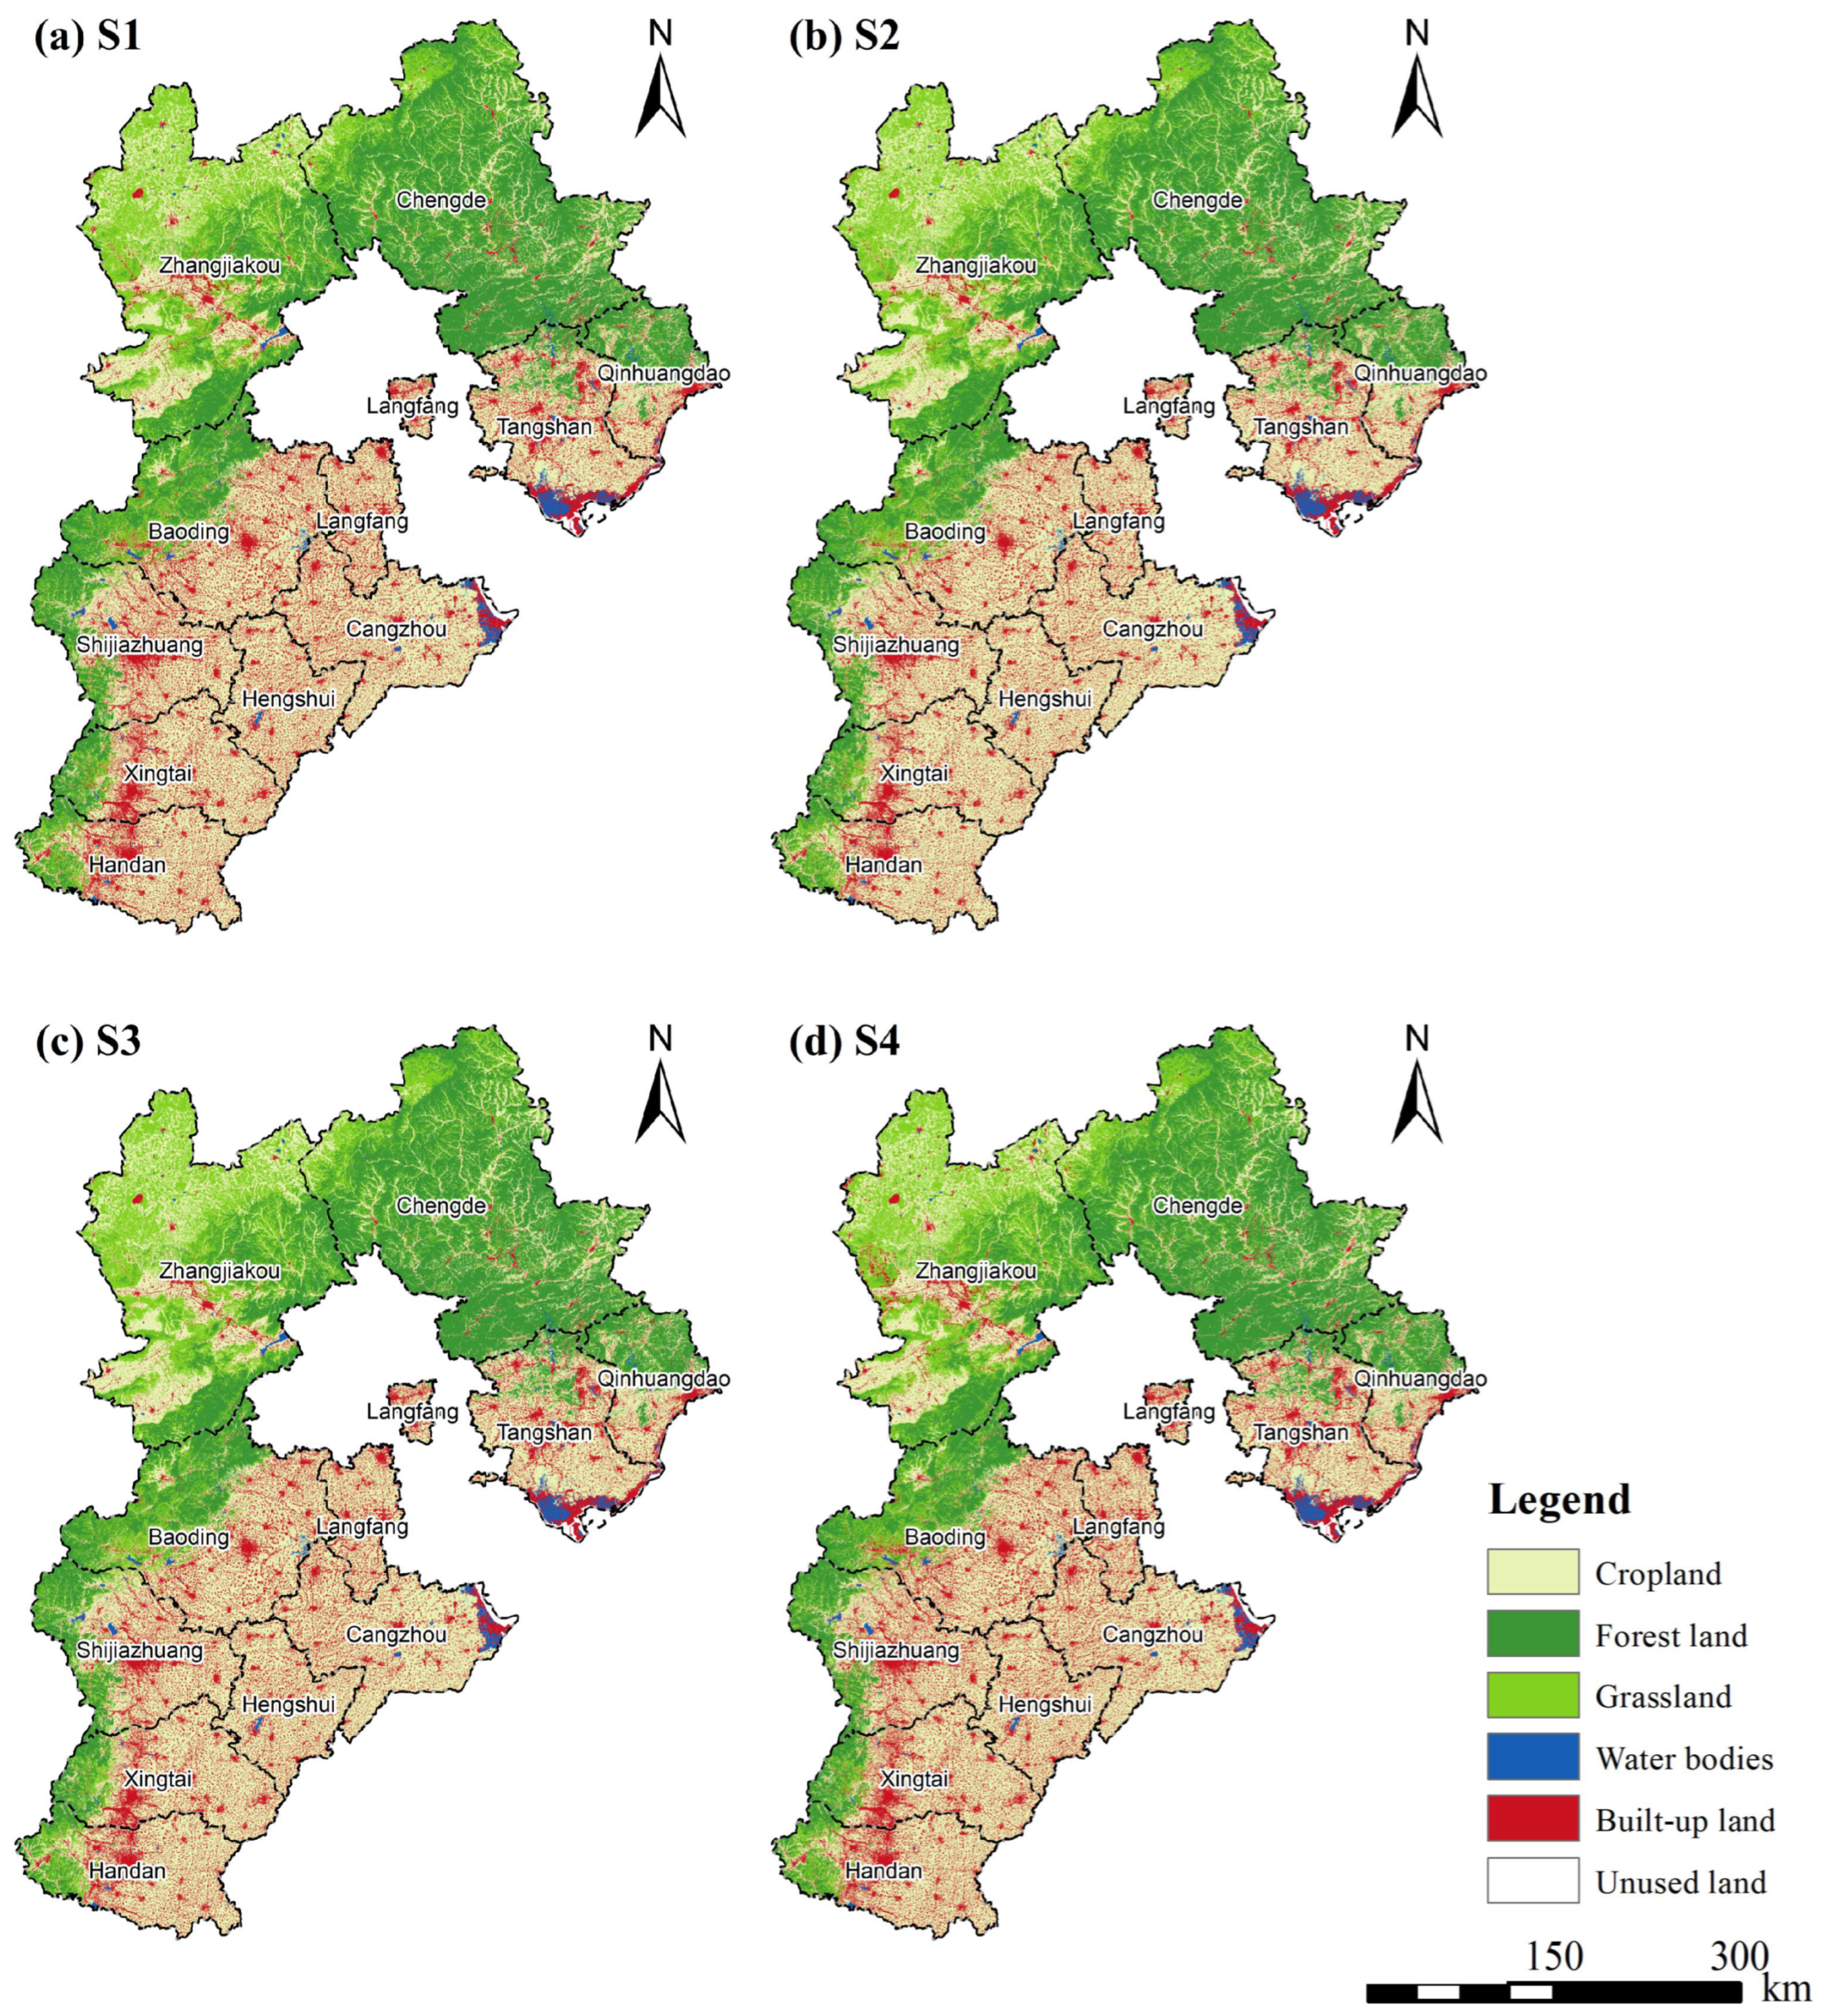
By comparing the land use pattern simulated by the PLUS model for 2020 with the actual data from the same year, the results showed a Kappa coefficient of 0.81 and an overall accuracy of 87.0%, verifying that the model has good applicability in Hebei Province and can be used for multi-scenario simulation in 2030. Based on this, this study established four scenarios: natural development (S1), cropland protection (S2), ecological protection (S3), and economic priority (S4). The simulation yielded the spatial configuration of land use types (Figure 7) and corresponding area changes (Table 4) in Hebei Province for 2030.
Under S1, the expansion of built-up land is most pronounced, with a net increase of 4193.86 km2 compared to 2020. Cropland and grassland experienced reductions of 3051.00 km2 and 3361.45 km2, respectively. From a spatial perspective, the growth of built-up land manifests as outward expansion centered around cities, including Shijiazhuang, Baoding, and Handan. Forest land within the ecological function areas of the northern Hebei mountains increased by 2184.14 km2 (4.79%), while water bodies expanded by 51.16 km2. Under S2, the proportion of cropland rose to 44.84%. The expansion of built-up land was substantially constrained, diminishing to 598.13 km2, accompanied by a grassland reduction of 2655.93 km2 (8.39%). S3 is oriented toward enhancing the carbon sink functionality of ecosystems. Forest land exhibited a net increase of 2255.08 km2 (4.95%), primarily distributed across ecological function areas in the northern Hebei mountains, such as Chengde and Zhangjiakou. Grassland area declined by 2101.94 km2 (6.64%). Under S4, the net increase in built-up land reached 4870.91 km2 (19.62%), accounting for nearly 40% of the total newly expanded built-up land across all four scenarios. Spatially, the areas surrounding Beijing and Tianjin, along with coastal regions (Langfang, Tangshan, Cangzhou), emerged as hotspots for built-up land expansion, forming a contiguous spatial configuration.

4.3.2. Temporal and Spatial Variation of Carbon Storage Under Different Scenarios

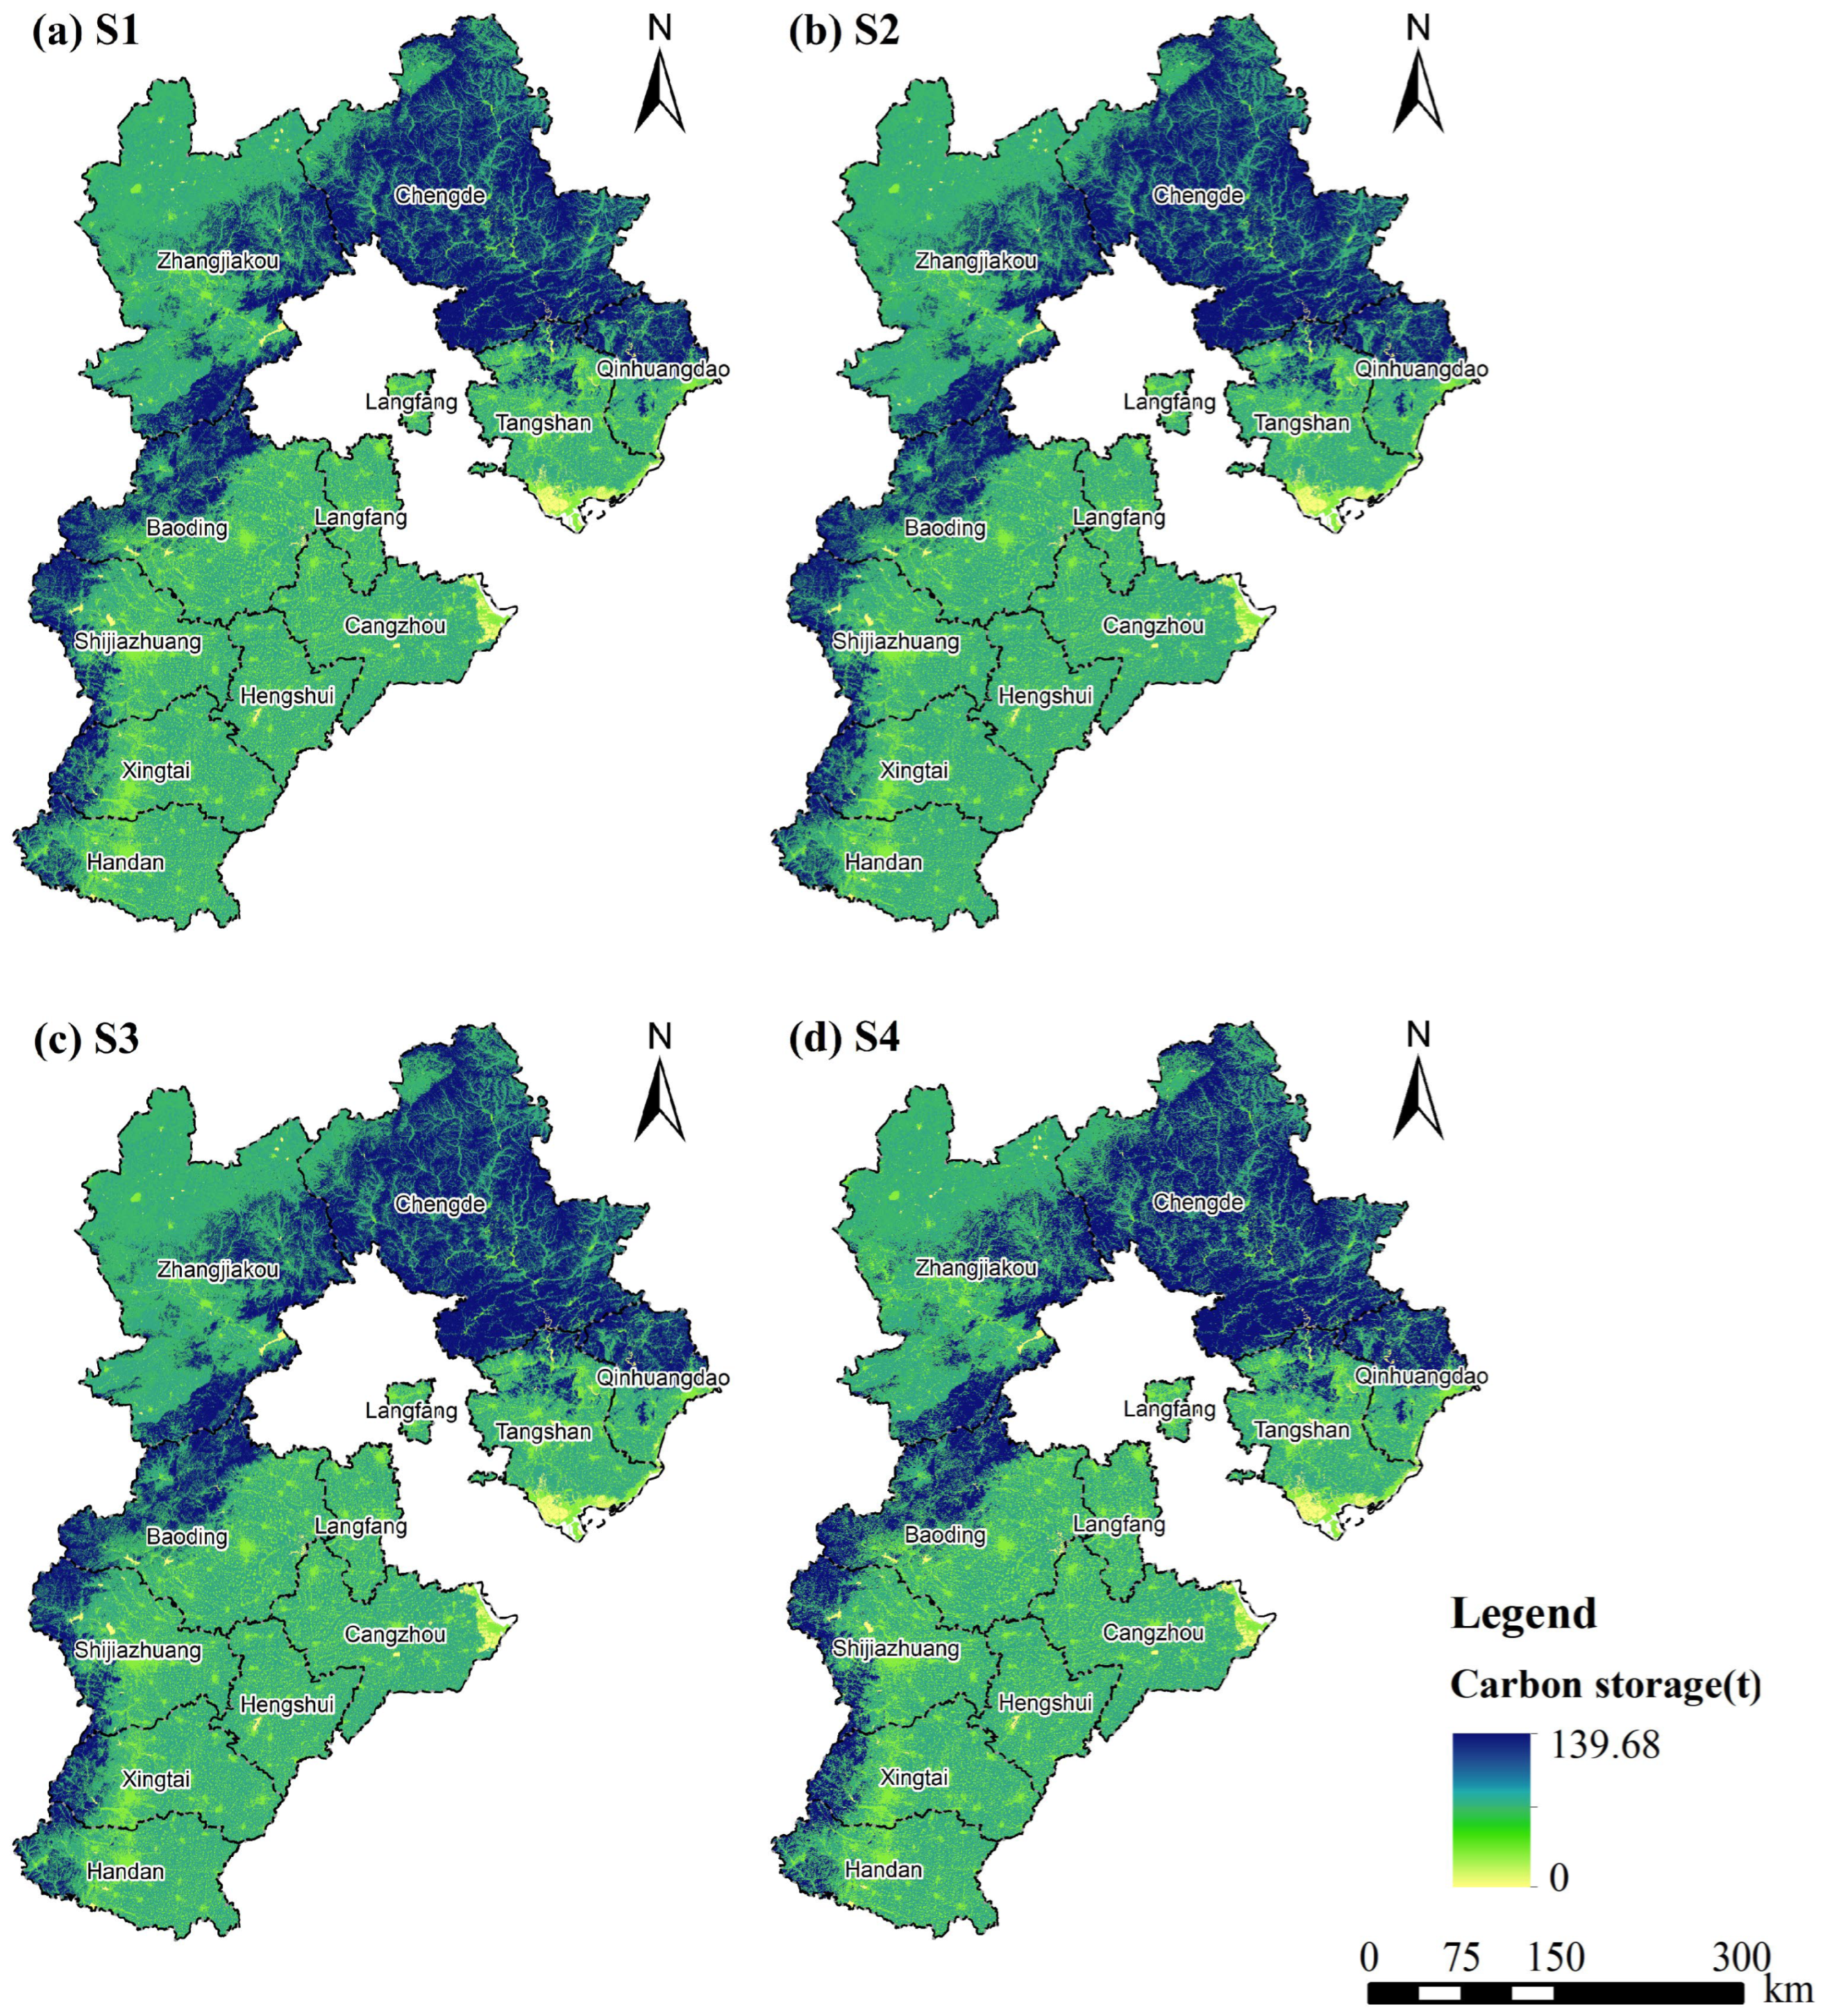
The spatial configuration of carbon storage across different development scenarios largely conforms to the historical distribution pattern, maintaining a characteristic north-high and south-low gradient (Figure 8). Zones with elevated carbon storage are predominantly situated within contiguous forest land areas, particularly in the mountainous terrain of northern Hebei (including Chengde and Zhangjiakou). Conversely, regions with diminished carbon storage are concentrated in densely populated urban centers of the central and southern Hebei Plain, as well as arid areas in northwestern Hebei. By 2030, projected total carbon storage under scenarios S1, S2, S3, and S4 reaches 162,731.39 × 104 t, 163,900.27 × 104 t, 163,640.62 × 104 t, and 162,198.58 × 104 t, respectively (Table 5).
Under scenario S1, which adheres to historical transition probabilities, aggregate carbon storage experiences a reduction of 82.59 × 10⁴ t. Within this framework, substantial built-up land expansion occurs at the expense of extensive high-carbon-density land categories—notably cropland and grassland—thereby inducing a declining trajectory in regional carbon storage. Peri-urban areas exhibit diminishing carbon storage, whereas the mountainous zones of northern Hebei register modest increases, yielding a spatial differentiation pattern characterized by “mountainous enhancement alongside plain diminution.” Scenario S2 yields the most substantial increase in total carbon storage, amounting to 1086.29 × 104 t. By constraining the conversion of cropland to built-up land while facilitating the transformation of alternative land categories to cropland, this scenario achieves positive growth in cropland carbon storage, accompanied by notable increases in forest land carbon storage—collectively elevating the regional carbon storage baseline. Agricultural zones within the central and southern Hebei Plain maintain relative stability, with localized increasing trends attributable to cropland area expansion and enhanced carbon storage capacity within cropland ecosystems. Scenario S3 generates a total carbon storage increase of 826.64 × 10⁴ t. By restricting the conversion of forest land and grassland to built-up land, this scenario produces substantial gains in forest land carbon storage while minimizing reductions in grassland carbon storage. This configuration proves more effective in decelerating carbon storage decline within the study area and contributes positively to regional carbon sink enhancement. Ecological function zones, particularly the mountainous expanses of northern Hebei, demonstrate extensive areas of significantly increased carbon storage, reflecting the synergistic effect of forest land expansion and grassland preservation on carbon sink functionality. This configuration is the most effective in mitigating the decline in carbon storage, reflecting the positive role of ecological protection policies on carbon sink functions. Scenario S4 exhibits the most pronounced reduction in total carbon storage, declining by 615.40 × 10⁴ t. While accommodating economic development imperatives, this scenario witnesses substantial built-up land expansion that encroaches upon high-carbon-density land categories, resulting in the most severe carbon storage decline across the study area. The peri-urban zones surrounding Beijing and Tianjin, together with coastal urban development areas, display the most extensive regions of significant carbon storage reduction—underscoring the pronounced adverse impact of urban expansion on regional carbon sink functionality. This result reveals the inherent conflict between short-term economic growth and long-term carbon sink protection, indicating that the extensive development model without ecological constraints will incur a significant carbon cost.

4.4. Analysis of Main Driving Factors of Carbon Storage Change

4.4.1. Single-Factor Detection

The single-factor detection results, detailed in Table 6, reveal the explanatory power (q-value) of each driving factor regarding the spatial distribution of carbon storage in Hebei Province. All selected factors passed the significance test (p < 0.01) for the years 2000, 2010, and 2020, confirming their statistically significant influence and validating the rationality of the factor selection.
Significant heterogeneity was observed in the explanatory power of individual factors. In 2020, slope (X5) emerged as the most dominant factor, with the highest q-value of 0.2268, followed by NDVI (X1, 0.2135), elevation (X4, 0.1791), annual mean temperature (X7, 0.1596), and annual precipitation (X6, 0.1100). Socio-economic factors, namely population density (X2, 0.1398) and GDP (X3, 0.1131), exhibited comparatively weaker explanatory power.
A temporal analysis from 2000 to 2020 reveals distinct evolutionary trends. Slope (X5) consistently maintained the highest explanatory power across all three time periods (q = 0.1786, 0.1967, and 0.2268, respectively), underscoring its fundamental and persistent role in shaping the region’s carbon storage pattern. Conversely, the weakest explanatory power shifted from GDP (X3, 0.0060) in 2000 to annual precipitation (X6, 0.1100) in 2020. This shift suggests that while the direct impact of socio-economic factors on the overall spatial pattern was initially minimal, the relative importance of climatic factors like precipitation may have fluctuated.
The preeminence of slope can be attributed to its control over fundamental landscape processes. By governing soil erosion, land-use suitability, and anthropogenic accessibility, slope dictates the distribution of vegetation and ecosystem stability. Hebei Province’s topography, characterized by a stepwise descent from the high northwestern plateaus and mountains to the low southeastern plains, creates distinct natural gradients. Consequently, steeper sloped regions (e.g., the Yanshan–Taihang Mountains) experience less human disturbance, supporting extensive forest cover and higher carbon density. In contrast, the gentle slopes of the Hebei Plain, serving as primary zones for agriculture and urban development, are dominated by cropland and built-up areas, resulting in comparatively lower carbon storage. The northwest-high, southeast-low pattern of carbon storage arises principally from topographically driven spatial differentiation.
The increasing q-value of NDVI (X1) from 0.1647 in 2000 to 0.2135 in 2020 highlights the growing influence of vegetation coverage on carbon storage over time. Factors such as annual mean temperature (X7) and DEM (X4) exert indirect control by modulating growing season length, species composition, and soil organic matter decomposition rates. Annual precipitation (X6), within Hebei’s semi-arid to semi-humid climate, acts as a key limiting factor for vegetation productivity. The persistently lower q-values for population density (X2) and GDP (X3) suggest that the direct influence of human activities on the spatial differentiation of carbon storage is primarily mediated through land use and land cover change, rather than acting as a direct spatial determinant itself.

4.4.2. Interactive Factor Detection

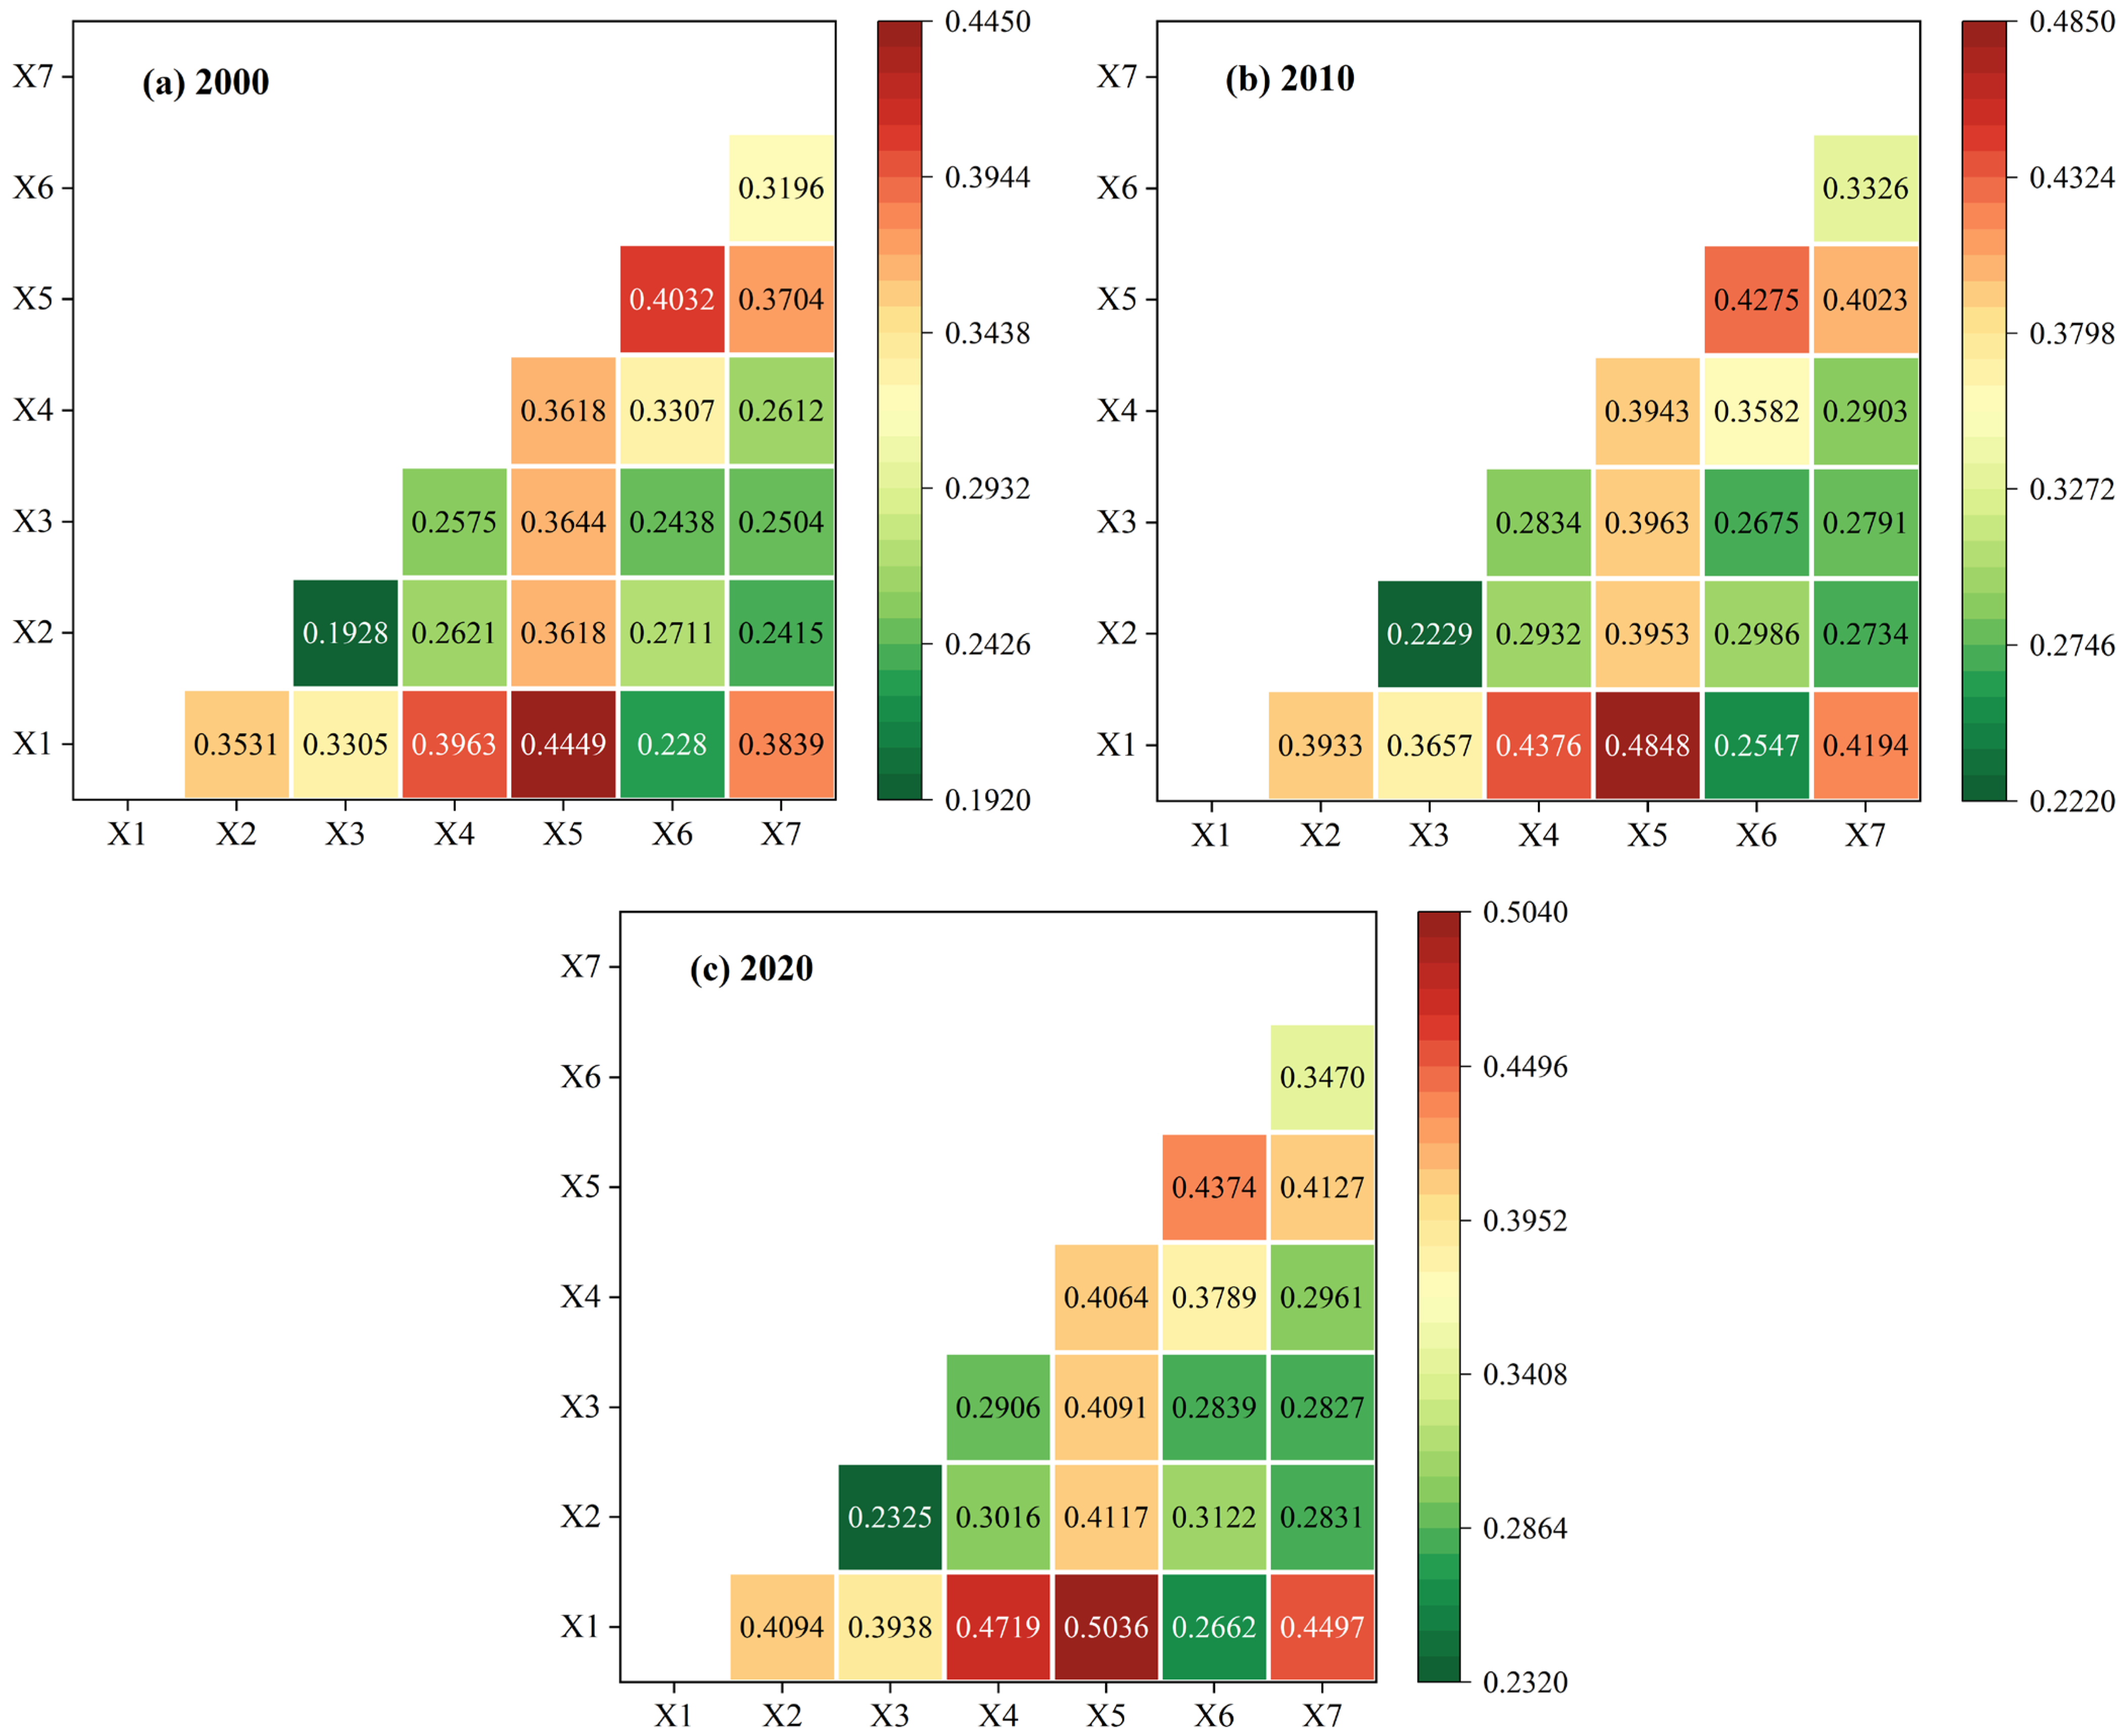
The interactive factor detection results (Figure 9) show that, from 2000 to 2020, pairwise interactions among the driving factors of spatial differentiation of carbon storage in Hebei Province all exhibited either bivariate enhancement or nonlinear enhancement, indicating significant synergistic enhancement effects among the factors.
From the perspective of temporal changes in interactions, the factor combination with the highest level of interaction in 2000 was slope (X5) and GDP (X3), with an interactive q-value significantly higher than the sum of their respective single-factor q-values. In 2010, the combination with the strongest interaction was slope (X5) and annual mean temperature (X7). In 2020, the combination with the strongest interaction was slope (X5) and the NDVI (X1). This change process reflects a stage transition in the driving mechanism of carbon storage in Hebei Province. In 2000, the mechanism was dominated by a “topography–economy” coupling; in 2010, it shifted to a “topography–hydrothermal” coupling; and in 2020, it further transitioned to a “topography–vegetation” coupling. This is mainly attributed to slope, as a fundamental topographic factor, forming a composite driving mechanism for the spatial differentiation of carbon storage through its coupling effects with hydrothermal conditions (annual mean temperature and annual precipitation), vegetation status (NDVI), and human activities (GDP and population density).
Specifically, the interaction between slope and NDVI (X5 ∩ X1) reached the highest level in 2020, indicating that the synergistic effect of topographic relief and vegetation coverage is currently the dominant mechanism driving the spatial differentiation of carbon storage in Hebei Province. In areas with steeper slopes, higher vegetation coverage forms carbon sink functional areas by enhancing photosynthetic carbon sequestration and reducing soil erosion. In areas with gentle slopes, lower vegetation coverage combined with high-intensity human development and utilization results in relatively low carbon storage. The interaction between slope and annual mean temperature (X5 ∩ X7) reflects the regulatory effect of topography on local climate. In mountainous areas, increased elevation leads to lower temperatures, slowing down the decomposition rate of organic matter and facilitating soil carbon pool accumulation. In plain areas, higher temperatures accelerate soil organic matter decomposition, resulting in relatively weaker carbon storage capacity.
It is worth noting that although socio-economic factors (GDP and population density) exhibited relatively low explanatory power individually, their explanatory power significantly improved after interacting with natural factors. For example, the interaction between slope and GDP (X5 ∩ X3) became the strongest interactive combination in 2000, indicating that the spatial coupling of topographic conditions and economic development levels had an important impact on the carbon storage pattern during the initial stage of rapid urbanization. Economically active areas are mostly concentrated in plains with gentle slopes—precisely where built-up land expands most rapidly and carbon storage losses are most severe. It can thus be observed that the coupling effect of natural geographical background and human socioeconomic activities has profoundly shaped the spatial differentiation characteristics of carbon storage.
Slope is the core dominant factor, which has important guiding significance for formulating differentiated carbon sink protection and enhancement strategies. In areas with steeper slopes, vegetation protection and ecological restoration should be strengthened to consolidate carbon sink functions. In areas with gentle slopes, land use structure should be optimized, uncontrolled expansion of built-up land should be controlled, and land-intensive use should be improved to achieve synergistic benefits between economic development and carbon sink protection.

5. Discussion

5.1. The Necessity of Carbon Storage Estimation in Hebei Province

Against the backdrop of global climate change and the “carbon peaking and carbon neutrality” strategies, accurately assessing regional terrestrial ecosystem carbon storage and its dynamic changes has emerged as a central focus in both scientific research and policy development [39]. As a critical component of the Beijing–Tianjin–Hebei urban agglomeration and a vital ecological barrier in North China, Hebei Province has undergone substantial land use transformations. It fulfills essential ecological functions, including water conservation in the Yanshan and Taihang Mountains, as well as windbreak and sand fixation, while simultaneously confronting considerable carbon emission pressures resulting from rapid urbanization in its plain areas. Recent global-scale investigations have demonstrated that land use and cover change constitutes one of the predominant factors influencing terrestrial carbon storage, and the associated carbon losses are non-negligible [40]. Conducting a systematic study on the spatiotemporal dynamics of carbon storage in Hebei Province carries multiple significances. It is not only a critical entry point for mechanistically revealing regional carbon cycle processes but also an important support for scientifically evaluating the effectiveness of major ecological projects such as the Beijing-Tianjin Sandstorm Source Control Project and the Taihang Mountains Greening Project. Furthermore, it serves as a necessary prerequisite for optimizing future territorial spatial planning and constructing a scientific framework for ecosystem carbon sink management in the arid and semi-arid regions of northern China.

5.2. The Rationality of Carbon Storage Simulation and Analysis Models

Establishing methodologically robust research approaches constitutes the foundation for guaranteeing the credibility of regional carbon storage assessment conclusions. This investigation integrates the PLUS, InVEST, and Geodetector models, fully capitalizing on the respective strengths of each analytical tool. Through its LEAS and CARS modules, the PLUS model effectively extracts the driving forces underlying land use transformations and simulates future land use configurations at the patch scale [41]. Its applicability under the complex topographical conditions of Hebei Province was validated using historical data in this study. The Carbon module of the InVEST model, characterized by its relatively modest data requirements, high computational efficiency, and straightforward assessment outputs, has been extensively applied to carbon storage research across multiple spatial scales [42]. To achieve localized calibration of carbon density parameters, this study incorporated mean annual temperature and mean annual precipitation as core climatic control factors into the correction model [43,44], while drawing on existing regional research. This improvement enabled the carbon storage estimates to exhibit higher accuracy at the regional scale. More critically, the incorporation of the Geodetector model overcomes the constraint of prior investigations that interpreted carbon storage variations solely through the lens of land use type conversion. This analytical framework quantitatively detects the explanatory capacity of diverse factors—encompassing natural determinants (e.g., climatic conditions and vegetation characteristics) and socioeconomic drivers (e.g., population distribution and economic output)—regarding the spatial heterogeneity of carbon storage [45]. It thus offers a more comprehensive lens for elucidating the multi-faceted driving mechanisms governing carbon storage dynamics in Hebei Province. The synergistic integration of these three models establishes an integrated research paradigm encompassing “historical reconstruction, future projection, and driving force analysis.”

5.3. Analysis of Driving Mechanisms of Land Use and Carbon Storage Changes

The results indicate that the land use pattern in Hebei Province underwent significant changes from 2000 to 2020. Specifically, the areas of cropland and grassland showed a clear decreasing trend, while construction land and forestland exhibited a continuous expanding trend [46]. This transformation led to a notable slowdown in the growth rate of regional carbon storage, which increased by 587.05 × 10⁴ t from 2000 to 2010 but only by 218.27 × 10⁴ t from 2010 to 2020, indicating that the enhancement of the regional carbon sink function weakened in the recent decade [47]. The study found that the spatial pattern of carbon storage in Hebei Province is characterized by high values in the northwest and low values in the southeast, which is consistent with the findings of Li et al. (2024) on carbon storage in Hebei Province [46]. Attribution analysis shows that the rapid expansion of construction land, by occupying high-carbon-density cropland, has become an important indirect factor driving changes in carbon storage. Throughout the study period, the extent of construction land in Hebei Province expanded dramatically, primarily at the expense of high-quality cropland located in the central and southern plains [48]. As a typical carbon source land type, the expansion of built-up land directly leads to the complete loss of regional aboveground biomass carbon pools, while its impervious surfaces hinder soil carbon exchange and sequestration mechanisms [49]. This pattern is consistent with the general trend observed globally, where the encroachment of urbanization on ecological spaces leads to a decline in carbon storage. During the study period, afforestation initiatives represented by the Grain for Green Program [50] did promote an increase in forest area. However, the resulting carbon sink gains only partially offset the losses caused by the decline in carbon storage in cropland and grassland, resulting in a significantly slowed growth rate of overall carbon storage. On the one hand, newly afforested areas are predominantly composed of young and middle-aged forests with relatively low carbon density, and the full realization of their carbon sink potential requires time [43,51]. On the other hand, certain afforestation projects may cause soil disturbance during the initial stage due to site preparation activities, leading to a time lag in the carbon sink effect [52]. This phenomenon reflects the stage characteristics of carbon sink benefits generated by ecological projects, as documented in studies from other regions [53].

5.4. Development Implications of Carbon Storage Changes in Hebei Province Under Future Scenarios

Multi-scenario simulations reveal divergent carbon storage trajectories under varying policy orientations. Under the natural development scenario (S1), carbon storage is projected to continue its declining trend. This result corroborates previous research findings: in the absence of policy intervention, urbanization will exacerbate the loss of carbon storage [49]. The economic priority scenario (S4) presents the most concerning pathway, with carbon storage projected to experience the most substantial reduction, reflecting the inherent tension between short-term economic gains and long-term ecological sustainability and indicating that development devoid of ecological constraints entails significant carbon costs [54]. Under both the cropland protection scenario (S2) and the ecological protection scenario (S3), carbon storage exhibits a net increase by 2030, demonstrating the efficacy of targeted land policies in mitigating carbon emissions and enhancing carbon sinks. Based on the simulation results of the ecological protection scenario, the ecological protection redline effectively curtails urban expansion while safeguarding carbon storage. Strengthening the land use control framework through rigorous implementation of national policies, including the “ecological protection redline,” is of paramount importance [55]. Based on the analysis of driving factors of carbon storage in this study, NDVI (vegetation coverage) has a significant impact on carbon storage, and improving vegetation coverage is key to enhancing the carbon sink capacity of Hebei Province. Differentiated governance strategies can be adopted according to the natural conditions and development characteristics of different regions: in the northern Bashang Plateau, priority should be given to returning cropland to grassland and improving degraded grasslands; in the western Taihang Mountains and northern Yanshan Mountains, continuous efforts should be made to implement artificial afforestation and closed forest management; in the central and southern plains, permanent basic cropland should be strictly protected during urbanization, accompanied by the simultaneous construction of cropland shelterbelts and urban green spaces. At the implementation level, Hebei Province should vigorously develop mixed forest plantations and strictly protect natural forests to maximize long-term carbon storage potential [51]. In the future, priority should be given to advancing the restoration of degraded ecosystems in key ecological function areas such as the Taihang and Yanshan Mountains. Concurrently, tending measures, including selective thinning and understory replanting, should be adopted to strengthen the scientific management of young and middle-aged forests, thereby accelerating the formation and enhancement of their carbon sink function [43]. Concurrently, exploring sustainable management models such as the understory economy and actively engaging in carbon trading markets can furnish financial support and market-based incentives for long-term ecological preservation. Through the combination of the above-mentioned zone-specific and category-based management measures, the continuous growth of carbon storage in Hebei Province can be promoted while ensuring economic development.

5.5. Limitations and Prospects

This study still has certain limitations. First, the accuracy of land use remote sensing interpretation may affect the precision of land use conversion estimation. For example, newly planted orchards may be misclassified, which is a common challenge in remote sensing inversion studies [42]. Second, the InVEST model assumes constant carbon density, thereby overlooking the dynamic processes of forest growth and soil carbon change [51,52]. Future research should incorporate field sample plot data to construct time-varying, spatially differentiated carbon density parameters. Third, the driving factor set of the PLUS model is biased toward natural and conventional socio-economic indicators, with insufficient consideration of difficult-to-quantify factors such as policy changes and market drivers [56]. In addition, the uncertainties in carbon storage estimation mainly originate from three sources: the static carbon density assumption of the InVEST model, the classification errors of land use data, and the literature-derived biases in carbon density parameters. These uncertainties primarily affect the estimation of absolute carbon storage values but have limited impact on the change trends and spatial patterns. Finally, with the deepening of the Beijing–Tianjin–Hebei coordinated development strategy and the potential future establishment of national parks, the profound impacts of major policies on land use and carbon storage need to be given focused attention in future research.

6. Conclusions

This study employed the PLUS model as a tool to first simulate the spatiotemporal evolution of land use in Hebei Province from 2000 to 2020 and then projected the spatial patterns of land use under different scenarios in 2030. Based on these simulation results, the InVEST model was further employed to analyze the spatiotemporal evolution of carbon storage during this period and to project its response under various scenarios in 2030. This research aims to provide a scientific basis for ecological protection, carbon sink capacity enhancement, land use planning, and natural resource management in Hebei Province. Methodologically, this study establishes a coupled analytical framework that can be extended to other provinces in North China. Empirically, it reveals the stage characteristic of a significantly slowed growth rate of carbon storage and the dynamic trend of increasing explanatory power of socioeconomic factors. In terms of policy, it identifies the cropland protection scenario as the optimal strategy. The main findings are as follows:
(1)
From 2000 to 2020, the area changes in land use types in Hebei Province exhibited non-equilibrium characteristics: forest land, water bodies, and built-up land showed a net increase, while cropland, grassland, and unused land showed a net decrease. By 2020, the area proportions of each land use type in descending order were cropland, forest land, grassland, built-up land, water bodies, and unused land. According to the transfer matrix analysis, the main land use conversion types during the study period included the conversion of cropland to grassland and built-up land, as well as the conversion of grassland to cropland and forest land.
(2)
Carbon storage in Hebei Province increased by 587.05 × 10⁴ t from 2000 to 2010 and by 218.27 × 104 t from 2010 to 2020, indicating a significantly slowed growth rate. From the perspective of carbon storage spaces, forest land and grassland constituted the primary carbon sink carriers in the province. In terms of spatial distribution, carbon storage exhibits marked regional differentiation: high-value areas are mainly distributed throughout Chengde, eastern Zhangjiakou, and the western parts of Baoding, Shijiazhuang, Xingtai, and Handan. Medium- and low-value areas are concentrated in Qinhuangdao, Tangshan, Langfang, Cangzhou, Hengshui, northeastern Zhangjiakou, and the eastern parts of Baoding, Shijiazhuang, Xingtai, and Handan.
(3)
The high-value areas of carbon storage in Hebei Province are primarily composed of two major zones. The first is the Taihang Mountains in the west, stretching through Baoding, Shijiazhuang, Xingtai, and Handan, which constitute the most important carbon storage and ecological function areas. The second encompasses the northern region, including the Bashang Plateau in Chengde and the Yanshan and Yinshan mountains in Zhangjiakou. Forest land and grassland, as the core land use types in these regions, provide a solid foundation for the full realization of their carbon sink function.
(4)
By 2030, the spatial pattern of carbon storage in Hebei Province exhibits distinctly different evolutionary characteristics under different scenarios. Under the natural development, cropland protection, and ecological protection scenarios, areas with carbon storage changes are highly concentrated in the central and southern regions. In contrast, under the economic priority scenario, the distribution of changes tends to be more dispersed, with areas of increased carbon storage primarily appearing in the northern and western regions.
(5)
Factor detection based on the GeoDetector model indicates that the dominant factors influencing carbon storage in Hebei Province are slope, elevation, and NDVI. Interaction analysis reveals that the strongest interaction combination shifted from “slope ∩ GDP” to “slope ∩ NDVI,” reflecting a stage transition in the driving mechanism.

Author Contributions

Conceptualization, J.Y. and J.Z. (Jiangkun Zheng); methodology, J.Z. (Jianfeng Zhang); writing—original draft preparation, J.Y. and J.Z. (Jianfeng Zhang); writing—review and editing, J.Y. and J.Z. (Jiangkun Zheng); supervision, J.Z. (Jiangkun Zheng). All authors have read and agreed to the published version of the manuscript.

Funding

This research was funded by Statistical Science Research Project of Hebei Province (No. 2025HY30).

Data Availability Statement

The data used to support the findings of this study are included within the article.

Conflicts of Interest

The authors declare no conflicts of interest.

References

  1. Han, J.; Meng, X.; Zhou, X.; Yi, B.; Liu, M.; Xiang, W.-N. A long-term analysis of urbanization process, landscape change, and carbon sources and sinks: A case study in China’s Yangtze River Delta region. J. Clean. Prod. 2017, 141, 1040–1050. [Google Scholar] [CrossRef]
  2. He, C.; Zhang, D.; Huang, Q.; Zhao, Y. Assessing the potential impacts of urban expansion on regional carbon storage by linking the LUSD-urban and INVEST models. Environ. Model. Softw. 2016, 75, 44–58. [Google Scholar] [CrossRef]
  3. Guo, W.; Teng, Y.; Yan, Y.; Zhao, C.; Zhang, W.; Ji, X. Simulation of Land Use and Carbon Storage Evolution in Multi-Scenario: A Case Study in Beijing–Tianjin–Hebei Urban Agglomeration, China. Sustainability 2022, 14, 13436. [Google Scholar] [CrossRef]
  4. Jiang, W.; Deng, Y.; Tang, Z.; Lei, X.; Chen, Z. Modelling the potential impacts of urban ecosystem changes on carbon storage under different scenarios by linking the CLUE-S and the InVEST models. Ecol. Model. 2017, 345, 30–40. [Google Scholar] [CrossRef]
  5. Seto, K.C.; Güneralp, B.; Hutyra, L.R. Global forecasts of urban expansion to 2030 and direct impacts on biodiversity and carbon pools. Proc. Natl. Acad. Sci. USA 2012, 109, 16083–16088. [Google Scholar] [CrossRef]
  6. Foley, J.A.; DeFries, R.; Asner, G.P.; Barford, C.; Bonan, G.; Carpenter, S.R.; Chapin, F.S.; Coe, M.T.; Daily, G.C.; Gibbs, H.K.; et al. Global consequences of land use. Science 2005, 309, 570–574. [Google Scholar] [CrossRef]
  7. He, H.; Dong, X.; Ding, J. Multi-scenario Simulation of Evolution of Production-Living-Ecological Space and Carbon Stock Assessment in the Yellow River Basin Based on the PLUS–InVEST Model. Environ. Sci. 2025, 5, 16. (In Chinese) [Google Scholar] [CrossRef]
  8. Zhang, Z.; Qi, S.; Abulizi, A.; Zhang, Y. Habitat Quality Evolution and Multi-Scenario Simulation Based on Land Use Change in the Tacheng Region. Sustainability 2025, 17, 6113. [Google Scholar] [CrossRef]
  9. Luo, C.; Li, C.; Zhao, J.; Guo, J.; Mei, Z. A Bayesian Network-Based Study on the Evolution of Ecosystem Service Trade-Offs Intensity Mechanisms in the Nansihu Basin, China. Geocarto Int. 2025, 40, 2567905. [Google Scholar] [CrossRef]
  10. Kuang, W.; Liu, Y.; Li, J.; Ying, C.; Cao, L.; Zhong, J. Spatiotemporal Dynamics of Land Use and Carbon Stocks Under Multiple Scenarios in the Yangtze River Basin. Environ. Sci. 2026, 47, 1914–1927. (In Chinese) [Google Scholar] [CrossRef]
  11. Zhu, Z.; Yang, Y.; Zhang, Y.; Qiu, L.; Gao, T. Spatiotemporal Dynamics and Projections of Carbon Storage Using Integrated PLUS–InVEST Modeling: A Case Study of the Guanzhong Plain Urban Agglomeration, China. Land 2026, 15, 142. [Google Scholar] [CrossRef]
  12. Zheng, H.; Zheng, H. Assessment and Prediction of Carbon Storage Based on Land Use/Land Cover Dynamics in the Coastal Area of Shandong Province. Ecol. Indic. 2023, 153, 110474. [Google Scholar] [CrossRef]
  13. Liu, C.; Huang, J.; Li, Y.; Wang, J. Spatial Synergy Between Carbon Storage and Emissions in Coastal China: Insights from PLUS-InVEST and OPGD Models. Remote Sens. 2025, 17, 2859. [Google Scholar] [CrossRef]
  14. Zhang, M.; Zhang, K. A GMOP-PLUS–InVEST-GWR Coupled Model for Simulating “Production-Living-Ecological” Functions and Carbon Stock Dynamics in the Chengdu Metropolitan Area. Land 2025, 14, 2378. [Google Scholar] [CrossRef]
  15. Chen, H.; Yang, Q.; Peng, L.; Su, K.; Zhang, H.; Liu, X. Spatiotemporal evolution characteristics and scenario simulation of production-living-ecological space at county level in Three Gorges reservoir areas. Trans. Chin. Soc. Agric. Eng. 2022, 38, 285–294. (In Chinese) [Google Scholar] [CrossRef]
  16. Hu, L.; Wang, G.; Huang, Q.; Xie, J. Policy-Driven Land Use Optimization for Carbon Neutrality: A PLUS–InVEST Model Coupling Approach in the Chengdu-Chongqing Economic Circle. Sustainability 2025, 17, 5831. [Google Scholar] [CrossRef]
  17. Peng, Y.; Cheng, W.; Xu, X.; Song, H. Analysis and prediction of the spatiotemporal characteristics of land-use ecological risk and carbon storage in Wuhan metropolitan area. Ecol. Indic. 2024, 158, 111432. [Google Scholar] [CrossRef]
  18. Liu, S.; Huang, J. Spatio-Temporal Evolution and Driving Forces of Habitat Quality in China’s Arid and Semi-Arid Regions: An Interpretable Machine Learning Perspective for Ecological Management. Land 2025, 14, 1937. [Google Scholar] [CrossRef]
  19. Zhang, J.; Shen, Y. Driving Mechanisms and Multi-Scenario Simulation of Spatiotemporal Evolution in Habitat Quality Within Core Region of Anyang, Yellow River Basin. Sustainability 2026, 18, 1818. [Google Scholar] [CrossRef]
  20. Hu, N.; Xu, D.; Zou, N.; Fan, S.; Wang, P.; Li, Y. Multi-Scenario Simulations of Land Use and Habitat Quality Based on a PLUS–InVEST Model: A Case Study of Baoding, China. Sustainability 2023, 15, 557. [Google Scholar] [CrossRef]
  21. Shao, Z.; Chen, R.; Zhao, J.; Wang, Y.; Zhang, L. Spatio-temporal evolution and prediction of carbon storage in Beijing’s ecosystem based on FLUS and InVEST models. Acta Ecol. Sin. 2022, 42, 9456–9469. (In Chinese) [Google Scholar] [CrossRef]
  22. Zhu, W.; Zhang, J.; Cui, Y.; Zheng, H.; Zhu, L. Assessment of territorial ecosystem carbon storage based on land use change scenario: A case study in Qihe River Basin. Acta Geogr. Sin. 2019, 74, 446–459. (In Chinese) [Google Scholar] [CrossRef]
  23. Shi, J.; Shi, P.; Wang, Z.; Zhang, H.; Liu, W. Spatial-temporal evolution and prediction of carbon storage in Jiuquan city ecosystem based on PLUS–InVEST model. Environ. Sci. 2024, 45, 300–313. (In Chinese) [Google Scholar] [CrossRef]
  24. Sharp, R.; Tallis, H.T.; Ricketts, T.; Guerry, A.D.; Wood, S.A.; Chaplin-Kramer, R.; Nelson, E.; Ennaanay, D.; Wolny, S.; Olwero, N.; et al. InVEST User’s Guide; The Natural Capital Project, Stanford University: Stanford, CA, USA, 2020. [Google Scholar]
  25. Zafar, Z.; Zubair, M.; Zha, Y.; Mehmood, M.S.; Rehman, A.; Fahd, S.; Nadeem, A.A. Predictive modeling of regional carbon storage dynamics in response to land use/land cover changes: An InVEST-based analysis. Ecol. Inform. 2024, 82, 102701. [Google Scholar] [CrossRef]
  26. Li, L.; Ji, G.; Li, Q.; Zhang, J.; Gao, H.; Jia, M.; Li, M.; Li, G. Spatiotemporal Evolution and Prediction of Ecosystem Carbon Storage in the Yiluo River Basin Based on the PLUS–InVEST Model. Forests 2023, 14, 2442. [Google Scholar] [CrossRef]
  27. Gao, L.; Tao, F.; Liu, R.; Wang, Z.; Leng, H.; Zhou, T. Multi-scenario simulation and ecological risk analysis of land use based on the PLUS model: A case study of Nanjing. Sustain. Cities Soc. 2022, 85, 104055. [Google Scholar] [CrossRef]
  28. Wei, X.; Zhang, S.; Luo, P.; Zhang, S.; Wang, H.; Kong, D.; Zhang, Y.; Tang, Y.; Sun, S. A Multi-Scenario Prediction and Spatiotemporal Analysis of the Land Use and Carbon Storage Response in Shaanxi. Remote Sens. 2023, 15, 5036. [Google Scholar] [CrossRef]
  29. Wang, Z.; Wang, Y.; Wang, X.; Chen, W. Dynamic Changes in the Production-Living-Ecological Space and Ecosystem Service Responses Based on Multi-Scenario Simulations: A Case Study of Hubei Province. Environ. Sci. 2026, 47, 2497–2510. (In Chinese) [Google Scholar] [CrossRef]
  30. Ye, Y.; Lai, M.; Dong, M.; Li, Z.; Yuan, J.; Lyu, J. Coupling the PLUS–InVEST Model for Multi-Scenario Land Use Simulation and Carbon Storage Assessment in Northern Anhui, China. Sustainability 2025, 17, 4185. [Google Scholar] [CrossRef]
  31. Zhang, Q.; Liu, S.; Niu, Y.; Hu, Y.; Li, L.; Cai, E.; Zhang, Y.; Zhao, M. Multi-Scenario Simulation of the Dynamic Relationship Between Land Use and Carbon Storage in the Urbanization Process: A Case Study of Zhengzhou, China. Land 2025, 14, 1227. [Google Scholar] [CrossRef]
  32. Liang, X.; Guan, Q.; Clarke, K.C.; Liu, S.; Wang, B.; Yao, Y. Understanding the drivers of sustainable land expansion using a patch-generating land use simulation (PLUS) model: A case study in Wuhan, China. Comput. Environ. Urban Syst. 2021, 85, 101569. [Google Scholar] [CrossRef]
  33. Wang, L.; Zhu, R.; Yin, Z.; Chen, Z.; Fang, C.; Lu, R.; Zhou, J.; Feng, Y. Impacts of Land-Use Change on the Spatio-Temporal Patterns of Terrestrial Ecosystem Carbon Storage in the Gansu Province, Northwest China. Remote Sens. 2022, 14, 3164. [Google Scholar] [CrossRef]
  34. Wang, K.; Li, X.; Lyu, X.; Dang, D.; Wei, H.; Liu, J.; Wang, Z.; Zhang, Y. Optimizing the land use and land cover pattern to increase its contribution to carbon neutrality. Remote Sens. 2022, 14, 4751. [Google Scholar] [CrossRef]
  35. Alam, S.A.; Starr, M.; Clark, B.J.F. Tree biomass and soil organic carbon densities across the Sudanese woodland savannah: A regional carbon sequestration study. J. Arid Environ. 2013, 89, 67–76. [Google Scholar] [CrossRef]
  36. Chen, G.; Yang, Y.; Liu, L.; Li, W.; Xie, J. Research review on total below ground carbon allocation in forest ecosystems. J. Subtrop. Resour. Environ. 2007, 2, 34–42. [Google Scholar]
  37. Li, J.; Xia, S.; Yu, X.; Li, X.; Wu, H. Evaluation of carbon storage on terrestrial ecosystem in Hebei Province based on InVEST model. J. Ecol. Rural. Environ. 2020, 36, 854–861. (In Chinese) [Google Scholar] [CrossRef]
  38. Wang, J.F.; Xu, C.D. Geodetector: Principle and prospective. Acta Geogr. Sin. 2017, 72, 116–134. (In Chinese) [Google Scholar] [CrossRef]
  39. Piao, S.; Fang, J.; Ciais, P.; Peylin, P.; Huang, Y.; Sitch, S.; Wang, T. The carbon balance of terrestrial ecosystems in China. Nature 2009, 458, 1009–1013. [Google Scholar] [CrossRef]
  40. Chang, X.; Xing, Y.; Wang, J.; Yang, H.; Gong, W. Effects of land use and cover change (LUCC) on terrestrial carbon stocks in China between 2000 and 2018. Resour. Conserv. Recycl. 2022, 182, 106333. [Google Scholar] [CrossRef]
  41. Liu, Q.; Zhou, J.; Liu, F.; Xia, H.; Zhou, C.; Li, J. Using the InVEST-PLUS-GeoDetector Model to Predict and Analyze the Pattern of Ecosystem Carbon Storage in the Dongting Lake Basin, China. Sustainability 2026, 18, 2543. [Google Scholar] [CrossRef]
  42. Zhu, L.; Song, R.; Sun, S.; Li, Y.; Hu, K. Land use/land cover change and its impact on ecosystem carbon storage in coastal areas of China from 1980 to 2050. Ecol. Indic. 2022, 142, 109178. [Google Scholar] [CrossRef]
  43. Zhou, Z.; Wang, Y.; Jia, G.; Li, X.; Zhang, H. Current Status and Carbon Sequestration Potential Prediction of Arbor Forest Carbon Storage in Hebei Province. For. Resour. Manag. 2022, 2, 45–53. (In Chinese) [Google Scholar] [CrossRef]
  44. Zhang, X.; Zhao, X.; Li, H.; Ma, Z.; Wang, Y. Soil Organic Carbon Storage and Carbon Sequestration Mechanisms in Hebei Plain. Earth Sci. Front. 2011, 18, 41–55. (In Chinese) [Google Scholar]
  45. Huang, X.; Liu, X.; Wang, Y. Spatio-Temporal Variations and Drivers of Carbon Storage in the Tibetan Plateau under SSP-RCP Scenarios Based on the PLUS–InVEST-GeoDetector Model. Sustainability 2024, 16, 5711. [Google Scholar] [CrossRef]
  46. Li, L.; Chen, L.; Han, M.; Hou, J. Spatio-temporal variation and multi-scenario simulation of ecosystem carbon storage in Hebei Province, China. Chin. J. Appl. Ecol. 2024, 35, 3247–3256. (In Chinese) [Google Scholar] [CrossRef]
  47. Gong, S.; Zhang, Y.; Li, Y. Spatio-temporal variation and prediction of carbon storage in Beijing–Tianjin–Hebei region: A PLUS–InVEST model approach. J. Arid Land Resour. Environ. 2023, 37, 20–28. (In Chinese) [Google Scholar] [CrossRef]
  48. Zhang, P.; Li, L.; Su, Y.; Wang, Q.; Han, H.; Han, H.; Li, X. Spatial and temporal distribution characteristics of carbon storage in Handan City based on PLUS and InVEST models. Bull. Soil Water Conserv. 2023, 43, 338–348. (In Chinese) [Google Scholar] [CrossRef]
  49. Cai, J.; Chi, H.; Lu, N.; Bian, J.; Chen, H.; Yu, J.; Yang, S. Analysis of Spatiotemporal Predictions and Drivers of Carbon Storage in the Pearl River Delta Urban Agglomeration via the PLUS–InVEST-GeoDetector Model. Energies 2024, 17, 5093. [Google Scholar] [CrossRef]
  50. Pei, H.; Liu, M.; Li, Y.; Zhang, H.; Xiao, Y.; Yang, G. Impacts of Ecological Restoration Measures on Ecosystem Services in Arid and Semi-Arid Regions: A Case Study of Bashang Area, Hebei Province. Res. Soil Water Conserv. 2022, 29, 192–199. (In Chinese) [Google Scholar] [CrossRef]
  51. Sha, Z.; Bai, Y.; Li, R.; Lan, H.; Zhang, X.; Li, J.; Liu, X.; Chang, S.; Xie, Y. The global carbon sink potential of terrestrial vegetation can be increased substantially by optimal land management. Commun. Earth Environ. 2022, 3, 8. [Google Scholar] [CrossRef]
  52. Liang, Y.; Hashimoto, S.; Liu, L. Integrated assessment of land-use/land-cover dynamics on carbon storage services in the Loess Plateau of China from 1995 to 2050. Ecol. Indic. 2021, 120, 106939. [Google Scholar] [CrossRef]
  53. Huang, Y.; Xie, F.; Song, Z.; Zhu, S. Evolution and Multi-Scenario Prediction of Land Use and Carbon Storage in Jiangxi Province. Forests 2023, 14, 1933. [Google Scholar] [CrossRef]
  54. Wang, Q.; Zhang, W.; Xia, J.; Ou, D.; Tian, Z.; Gao, X. Multi-Scenario Simulation of Land-Use/Land-Cover Changes and Carbon Storage Prediction Coupled with the SD-PLUS–InVEST Model: A Case Study of the Tuojiang River Basin, China. Land 2024, 13, 1518. [Google Scholar] [CrossRef]
  55. Jin, Y.; Li, Y.; Zhang, H.; Liu, X.; Shi, H. Evaluation of Effectiveness and Multi-Scenario Analysis of Land Use Development Strategies and Ecological Protection Redlines on Carbon Storage in the Great Bay Area of China Using the PLUS–InVEST-PSM Model. Land 2024, 13, 1918. [Google Scholar] [CrossRef]
  56. Wang, Z.; Li, X.; Mao, Y.; Li, L.; Wang, X.; Lin, Q. Dynamic simulation of land use change and assessment of carbon storage based on climate change scenarios at the city level: A case study of Bortala, China. Ecol. Indic. 2022, 134, 108499. [Google Scholar] [CrossRef]
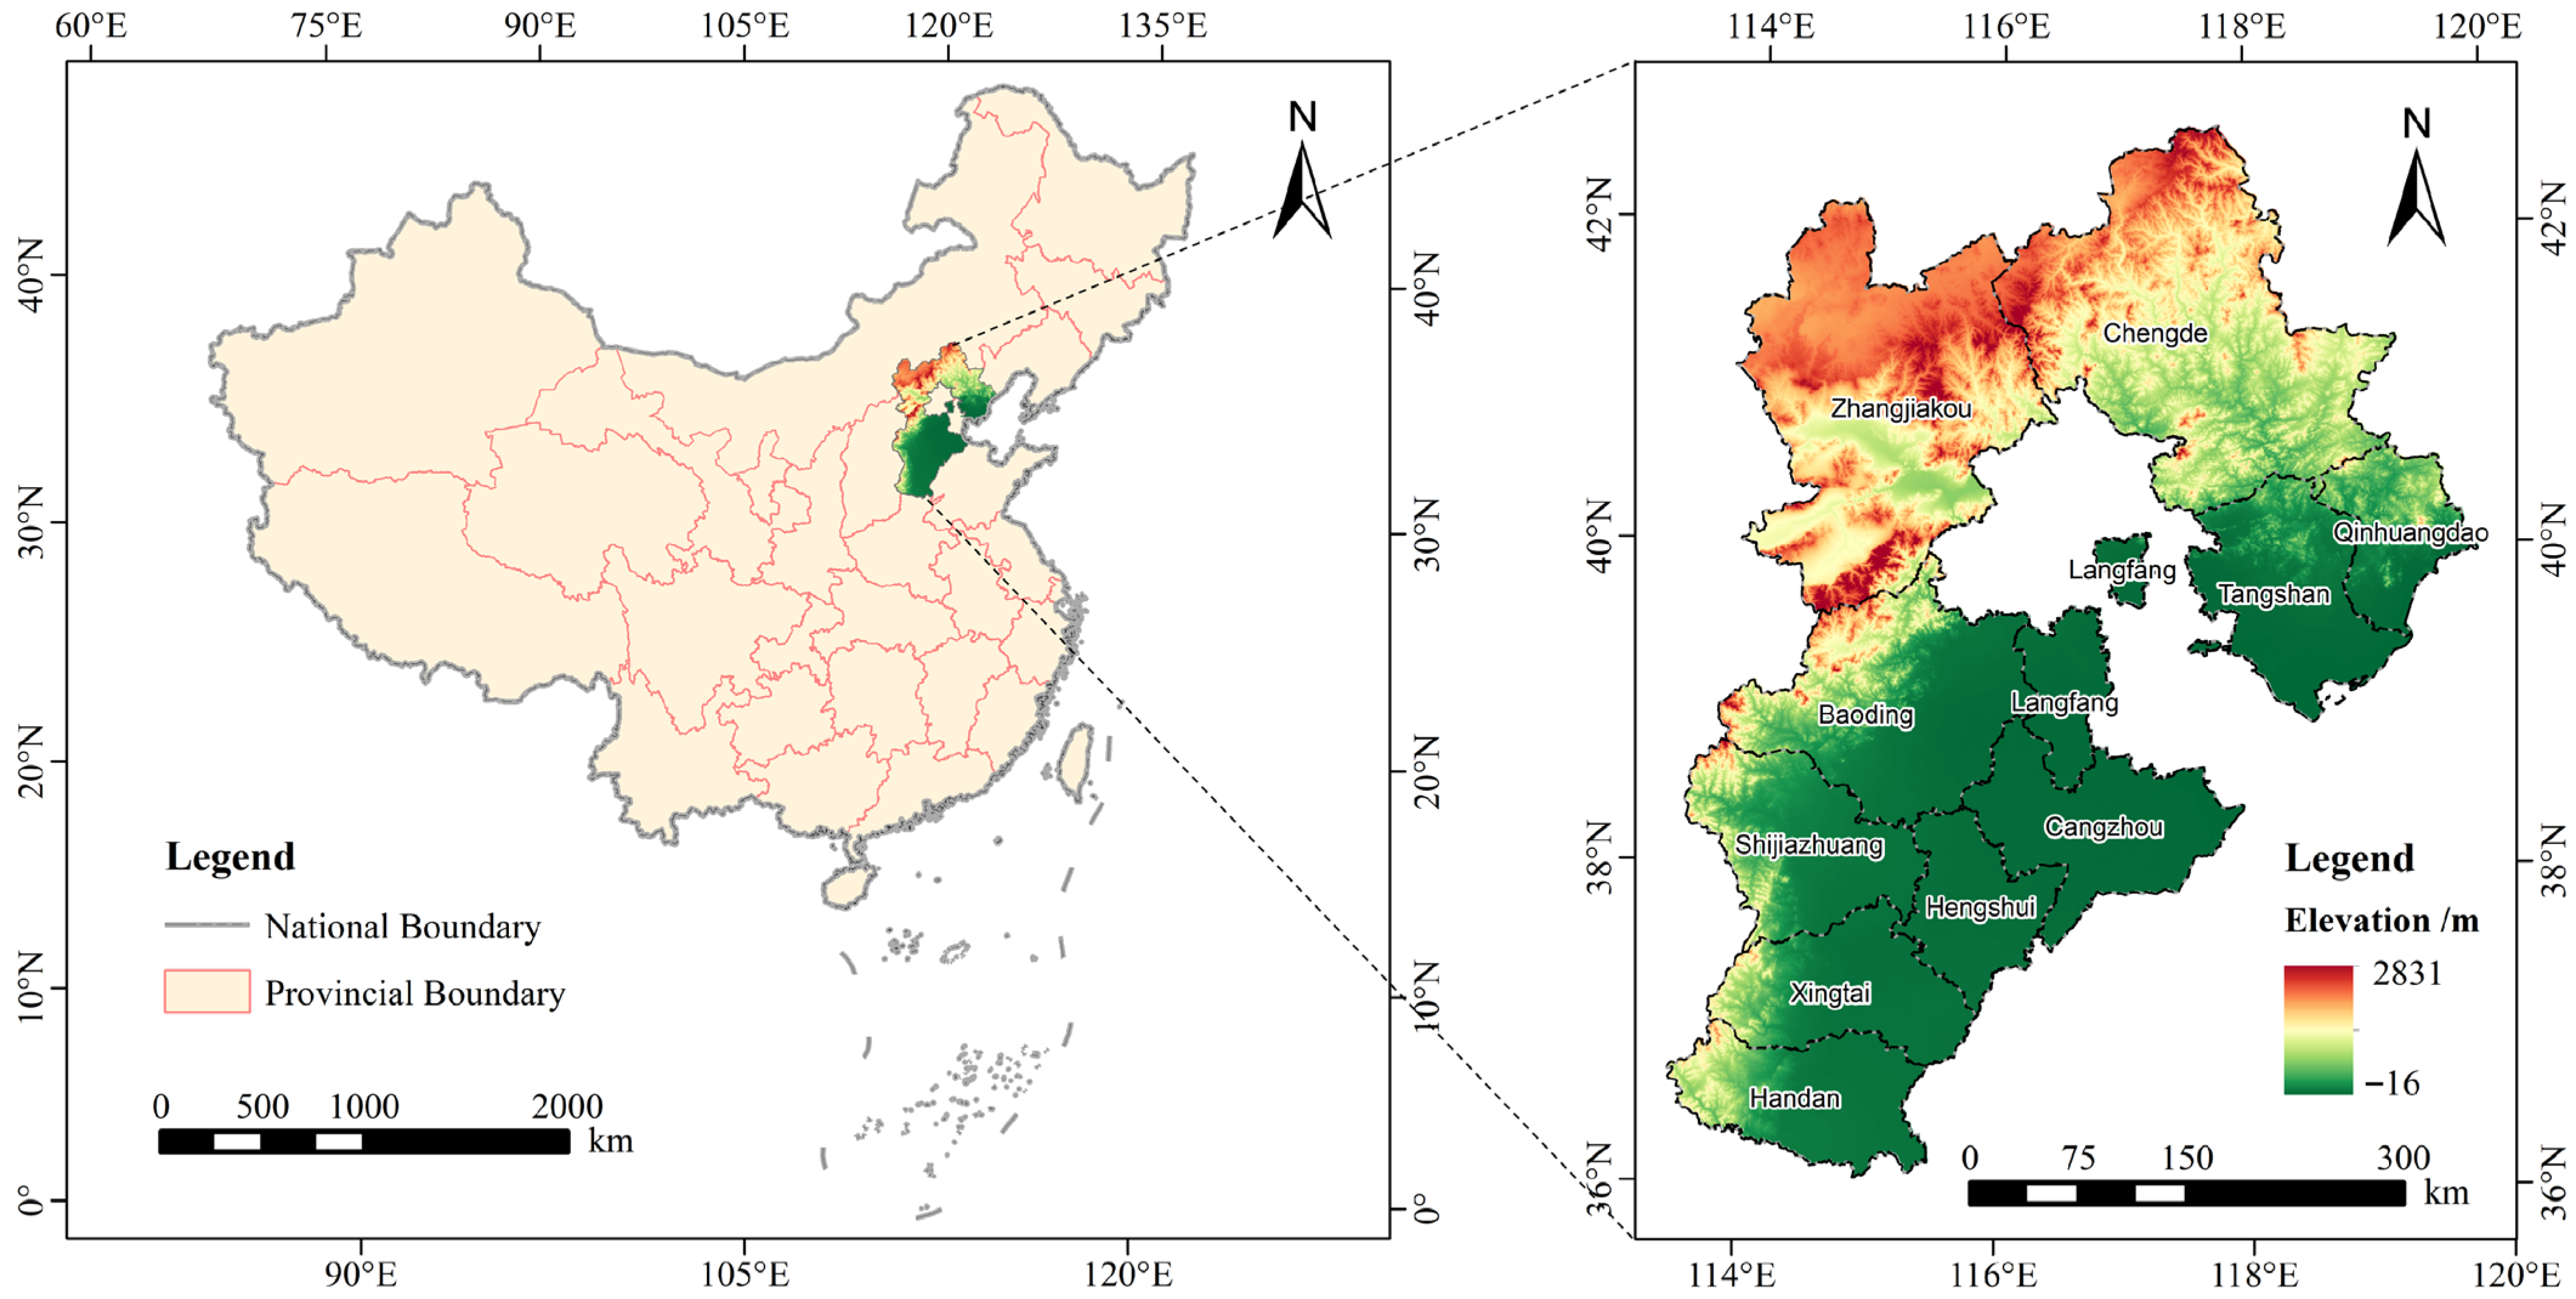
Figure 1. Geographical location and topography of Hebei Province.
Forests 17 00513 g001
Figure 2. Spatial distribution of land use types in Hebei Province from 2000 to 2020.
Forests 17 00513 g002
Figure 3. Land use area changes in Hebei Province, 2000–2020.
Forests 17 00513 g003
Figure 4. The chord diagram of land use transfer proportions.
Forests 17 00513 g004
Figure 5. Spatial distribution of carbon storage in Hebei Province from 2000 to 2020.
Forests 17 00513 g005
Figure 6. Carbon storage changes in Hebei Province, 2000–2020.
Forests 17 00513 g006
Figure 7. Spatial patterns of land use in Hebei Province under different scenarios in 2030.
Forests 17 00513 g007
Figure 8. Spatial patterns of carbon storage in Hebei Province under different scenarios in 2030.
Forests 17 00513 g008
Figure 9. Interactive detection results in different years.
Forests 17 00513 g009
Table 1. Data information of driving factors.
Data NameData AccuracyData SourceData Processing
Land use30 mResources and Environmental Science Data Center, Chinese Academy of Sciences (https://www.resdc.cn/, accessed on 16 August 2025)Projection conversion
Mask extraction
Resampling
NDVI
Soil type1 km
Soil erosion degree
Population density
GDP per capita
Annual precipitation
Annual evaporation
Annual average temperature
Elevation30 mGeospatial data cloud (https://www.gscloud.cn/, accessed on 9 August 2025)
SlopeGenerated from elevation data
Distance to county government30 mOpenStreetMap (https://www.openstreetmap.org/, accessed on 9 August 2025)Projection conversion
Distance analysis
Mask extraction
Distance to class I, II and III roads
Distance to water body
Distance to nature reserve
Administrative divisionStandard map service system of the ministry of natural resources (http://bzdt.ch.mnr.gov.cn/, accessed on 16 August 2025)
Table 2. Carbon density of each land use type (mg C/hm2).
Land Use TypeCaboveCbelowCsoilCdead
Cropland21.458.8048.500.77
Forest land75.2416.2842.006.16
Grassland25.2011.2031.602.80
Water bodies2.290.0017.160.00
Built-up land0.000.0040.000.00
Unused land0.000.0029.200.00
Table 3. Land use transfer matrix in Hebei Province, 2000–2020 (km2).
Land Use TypeCroplandForest LandGrasslandWater BodiesBuilt-Up LandUnused LandTotal Transferred OutTransfer-Out Rate (%)
Cropland78,062.421502.554905.36361.378338.355.1215,112.7547.62
Forest land901.1636,903.931825.754.95167.720.682900.269.14
Grassland3547.637138.4724,786.9014.27510.8910.8411,222.135.36
Water bodies109.3912.0430.341069.17502.799.41663.972.09
Built-up land1372.6023.6076.37218.3915,230.053.561694.525.34
Unused land8.260.0114.4033.4787.2217.42143.360.45
Total Transferred In5939.048676.676852.22632.459606.9729.6131,736.96-
Transfer-in Rate (%)18.7127.3421.591.9930.270.09-100
Table 4. Areas of land use types and their changes under different scenarios (km2).
Year/PeriodScenarioCroplandForest LandGrasslandWater BodiesBuilt-Up LandUnused Land
2030S180,950.4647,764.7428,277.671752.7829,030.8830.32
S284,209.0347,418.5828,983.191730.7025,435.1530.20
S382,051.8147,835.6829,537.181714.4026,637.3930.39
S480,367.9047,375.0228,563.771757.0429,707.9335.19
2020–2030S1−3051.002184.14−3361.4551.164193.86−16.71
S2207.571837.98−2655.9329.08598.13−16.83
S3−1949.652255.08−2101.9412.781800.37−16.64
S4−3633.561794.42−3075.3555.424870.91−11.84
Note: Positive values indicate area increase, and negative values indicate area decrease compared to 2020.
Table 5. Estimates of land use types and carbon storage under different scenarios (×104 t).
YearScenarioCroplandForest LandGrasslandWater BodiesBuilt-Up LandUnused LandTotal Carbon Storage
2030S164,371.8166,717.7920,020.59340.9211,612.358.85162,731.39
S266,963.0266,234.2720,520.10336.6210,174.068.82163,900.27
S365,247.6066,816.8720,912.32333.4510,654.968.87163,640.62
S463,908.5566,173.4320,223.15341.7411,883.1710.28162,198.58
2020–2030S1−2426.153050.80−2379.919.951677.54−4.88−82.59
S2165.062567.29−1880.405.66239.25−4.911086.29
S3−1550.363149.89−1488.182.49720.15−4.86826.64
S4−2889.412506.45−2177.3510.781948.36−3.46−615.40
Table 6. Single-factor detection results from 2000 to 2020.
qX1X2X3X4X5X6X7
20000.16470.08910.00600.12340.17860.11780.1125
20100.18910.10630.08460.14550.19670.11790.1320
20200.21350.13980.11310.17910.22680.11000.1596
Note: X1 represents the normalized difference vegetation index (NDVI), X2 represents population density, X3 represents GDP, X4 represents elevation, X5 represents slope, X6 represents annual precipitation, and X7 represents annual mean temperature.
Disclaimer/Publisher’s Note: The statements, opinions and data contained in all publications are solely those of the individual author(s) and contributor(s) and not of MDPI and/or the editor(s). MDPI and/or the editor(s) disclaim responsibility for any injury to people or property resulting from any ideas, methods, instructions or products referred to in the content.