Article

Development of Rapid Isothermal Detection Methods for Heart Rot of Abies georgei var. smithii

1
Beijing Key Laboratory for Forest Pest Control, College of Forestry, Beijing Forestry University, Beijing 100083, China
2
Key Laboratory of Forest Ecology in Tibet Plateau, Ministry of Education, Tibet Agricultural & Animal Husbandry University, Nyingchi 860000, China
3
Key Laboratory of Alpine Ecology and Biodiversity, Institute of Tibetan Plateau Research, Chinese Academy of Sciences, Beijing 100083, China
4
National Key Station of Field Scientific Observation & Experiment, Nyingchi 860000, China
*
Authors to whom correspondence should be addressed.
Forests 2026, 17(4), 409; https://doi.org/10.3390/f17040409
Submission received: 20 January 2026 / Revised: 23 February 2026 / Accepted: 28 February 2026 / Published: 25 March 2026
(This article belongs to the Special Issue Forest Fungal Diseases Detection, Diagnosis and Control)

Abstract

Abies georgei var. smithii (Viguie & Gaussen) is a dominant conifer along the southeastern margin of the Qinghai–Tibet Plateau, where heart rot often develops covertly, complicating forest health monitoring and disease management. Fomitopsis subpinicola B.K. Cui, M.L. Han & Shun Liu is an important causal agent of heart rot affecting A. georgei var. smithii in this region, yet rapid, field-deployable molecular diagnostics of this pathogen remain limited. Here, we developed and evaluated two TEF1α-based isothermal platforms for specific detection of F. subpinicola: RAA and LAMP. To reduce potential cross-reactivity, TEF1α sequences from representative taxa within the F. pinicola species complex and closely related non-complex species were aligned for primer/probe design. Candidate RAA primers were screened by gel electrophoresis to select an optimal pair, and two LAMP primer sets were compared by specificity testing to identify the best-performing set. Both assays specifically detected F. subpinicola with no cross-amplification in the tested non-target fungi. Limits of detection were 9.97 copies/μL for fluorescent RAA (25 min), 9.97 × 10² copies/μL for RAA-LFD (15 min), and 9.97 × 10³ copies/μL for LAMP (35 min). In 30 increment core samples from A. georgei var. smithii, all methods consistently detected samples with obvious decay, while fluorescent RAA additionally yielded positives in some apparently asymptomatic samples, indicating promise for early or low-abundance screening. Together, these assays constitute a tiered and application-oriented detection system, enabling flexible selection of diagnostic approaches according to sensitivity requirements, operational conditions, and field surveillance needs for heart rot of A. georgei var. smithii.

1. Introduction

Heart rot is a widespread yet often underestimated form of internal wood decay in trees. It is characterized by brown rot that develops within the stem and may persist for years with little or no external symptom expression [1]. Because the decay remains concealed, infected trees can appear visually “healthy”, while progressive degradation of heartwood tissue reduces timber value, weakens mechanical stability, and increases the risk of wind breakage and uprooting [1,2,3]. At the stand scale, chronic heart rot can alter forest structure, elevate operational safety risks, and impair ecosystem services such as carbon storage, water regulation, and soil stabilization—functions that are particularly critical in high-elevation and steep-slope environments [4,5]. Given both the economic losses associated with timber degradation and the ecological importance of subalpine forests, timely and reliable early detection is essential for effective disease management.
In the subalpine forests of southeastern Tibet, heart rot has been increasingly observed in Abies georgei var. smithii (Viguie & Gaussen), a foundation species forming extensive high-elevation forests along the southeastern margin of the Qinghai–Tibet Plateau, where hydrological regulation and soil retention are vital to watershed stability [6]. However, management efforts are constrained by the covert nature of infection and the limited feasibility of routine laboratory-based diagnostics [7,8]. In practice, detection often occurs at advanced stages, after extensive internal decay has already developed, thereby narrowing the window for early intervention, targeted surveillance.
Brown-rot fungi in the genus Fomitopsis are among the most consequential agents associated with conifer heart rot [1]. Historically, many outbreaks were broadly attributed to Fomitopsis pinicola (sensu lato), based largely on basidiomatal morphology and the longstanding use of an umbrella name for red-belted Fomitopsis taxa [9]. Recent multilocus phylogenetic studies have demonstrated that F. pinicola represents a species comprising several cryptic, morphologically similar taxa (e.g., Fomitopsis subpinicola, Fomitopsis abieticola, Fomitopsis mounceae, Fomitopsis ochracea) [9,10]. Importantly, members of the F. pinicola species complex differ not only genetically but also in geographic distribution and host association. Studies on East Asian taxa have shown that species within the complex often exhibit restricted distribution ranges and varying degrees of host specialization. For example, Fomitopsis abieticola is associated with Abies, whereas Fomitopsis kesiyae and Fomitopsis massoniana are linked to specific Pinus hosts, and Fomitopsis tianshanensis has been reported from Picea. These differences indicate that species within the complex are not uniformly associated with Abies, and highlight the importance of species-level identification for accurate ecological interpretation and disease diagnosis. This taxonomic refinement has practical implications: assays developed under the broad “F. pinicola” concept may lack species-level specificity, obscuring host–pathogen associations and compromising diagnostic accuracy. Notably, F. pinicola sensu stricto has not been confirmed from China, whereas Fomitopsis subpinicola B.K. Cui, M.L. Han & Shun Liu is a dominant East Asian lineage and has been implicated as a key pathogen associated with heart rot of A. georgei var. smithii in southeastern Tibet [11,12]. Accurate detection of F. subpinicola is therefore critical for reliable surveillance and evidence-based management in this region.
Conventional diagnosis relies on (i) field recognition of basidiomata and (ii) isolation from decayed wood followed by cultural and morphological characterization [10,11,13]. These approaches are time-consuming, require taxonomic expertise, and are often inconclusive when fruiting bodies are absent or multiple fungi co-occur within the same substrate. Culture-based identification can also be hindered by slow growth, contamination, and limited morphological resolution among cryptic species. PCR and qPCR have improved detection specificity and sensitivity [11]; however, they require laboratory infrastructure and multi-step workflows that are difficult to implement in mountain forests. In addition, wood tissues frequently contain amplification inhibitors such asphenolics and other extractives, which may reduce assay robustness unless DNA extraction is carefully optimized [14].
Isothermal nucleic acid amplification provides a practical alternative for rapid, field-deployable detection. Recombinase-aided amplification (RAA) enables DNA amplification at a constant low temperature within minutes and can be detected either by real-time fluorescence or by lateral flow dipsticks [15,16]. Loop-mediated isothermal amplification (LAMP) similarly operates at a single temperature and can be coupled with colorimetric indicators for visual interpretation without specialized optics [17,18]. Although these platforms are increasingly applied for on-site detection of plant pathogens, no isothermal assay has been specifically developed for F. subpinicola, Existing assays targeting “F. pinicola” may suffer from reduced specificity if species-complex boundaries and diagnostic signatures are not explicitly considered [10,19].
Marker selection is central to assay design. The ITS region is widely used for fungal identification but may lack sufficient resolution within the F. pinicola complex [10,20,21]. In contrast, translation elongation factor 1-alpha (TEF1α) generally exhibits greater interspecific variability and has proven effective for distinguishing closely related taxa, making it a suitable target for species-specific diagnostics in cryptic complexes [22,23]. Accordingly, we selected TEF1α and conducted multiple sequence alignments across representative taxa within the F. pinicola complex and related non-complex species to identify diagnostic regions and minimize cross-reactivity during primer and probe design [23,24].
In this study, we developed and systematically evaluated three TEF1α-based isothermal assays for rapid detection of F. subpinicola: fluorescent RAA, recombinase-aided amplification combined with lateral flow dipstick (RAA-LFD), and colorimetric LAMP. We screened candidate primers, optimized reaction conditions and readout criteria, and assessed analytical specificity and sensitivity using genomic DNA and a plasmid standard. Performance was further validated using increment core samples from A. georgei var. smithii collected in the field. Beyond establishing individual assays, we propose a tiered diagnostic framework: fluorescent RAA for high-sensitivity screening, and RAA-LFD or LAMP for rapid, equipment-light testing in large-scale field surveys and routine monitoring. This integrated strategy aims to strengthen early warning capacity and improve surveillance of heart rot in subalpine A. georgei var. smithii forests.

2. Materials and Methods

2.1. Fungal Materials and Strain Sources

The target pathogen investigated in this study was F. subpinicola, a member of the F. pinicola species complex, which is closely associated with heart rot of A. georgei var. smithii at Sejila Mountain, Nyingchi, Tibet, China. Three independent isolates of F. subpinicola were used as target strains for assay validation, including one previously reported isolate (FP0001) obtained from a basidiocarp collected in Nyingchi, Tibet, and two field-derived isolates obtained in this study (designated as Fsp-01 and Fsp-02) from heart-rotted A. georgei var. smithii. All isolates are preserved in the Forest Pathology Laboratory, Beijing Forestry University (Table 1). For specificity evaluation, non-target fungi included phylogenetically related species within the genus Fomitopsis, as well as ecologically relevant wood-decay fungi associated with conifer hosts in the study area (Table 1).
Among these, Fomitopsis cupreorosea, Fomitopsis cajanderi, Fomitopsis dickinsii, Heterobasidion annosum, Fomitopsis rosea, Fomitopsis betulina, Ganoderma applanatum sensu lato, and Fusarium oxysporum were available as living cultures obtained from the China Forestry Culture Collection Center (CAFCC) (strain numbers listed in Table 1). All living-culture isolates (including both target and non-target strains) were cultured on potato dextrose agar (PDA) plates at 30 °C for 3 days, transferred to fresh PDA plates, and incubated for an additional 5 days. Fresh mycelium was then harvested for nucleic acid extraction.
For Heterobasidion linzhiense and Porodaedalea alpicola, for which pure cultures were not available, total DNA was extracted directly from field-collected basidiocarp tissues (sample information and identifiers are provided in Table 1). DNA from these specimens was used exclusively for molecular specificity testing to represent decay-associated or pathogenic fungi that may co-occur in the surveyed forest ecosystem.

2.2. DNA Extraction

Genomic DNA extraction from fungal cultures: Approximately 50–100 mg of fresh mycelia or basidiocarp tissues were placed into microcentrifuge tubes and mixed with an equal volume of anhydrous quartz sand (Sinopharm Chemical Reagent Co., Ltd., Shanghai, China) and lysis buffer (50 mM Tris-HCl, pH 8.0; 10 mM EDTA; 0.1% SDS). Samples were vigorously vortexed and ground to disrupt mycelia. After centrifugation at 14,000× g for 5 min, the supernatant was transferred to a new tube. DNA was precipitated by adding an equal volume of isopropanol and mixing thoroughly, followed by centrifugation at 12,000× g for 10 min to discard the supernatant. The pellet was washed once with 75% ethanol and centrifuged at 12,000× g for 5 min, air-dried at room temperature, and resuspended in sterile double-distilled water. DNA integrity was evaluated by 1% agarose gel electrophoresis, and DNA concentration and purity (A260/280 ratio) were determined using a NanoDrop 2000 spectrophotometer (Thermo Fisher Scientific, Waltham, MA, USA). Extracted DNA was stored at −20 °C until use.
DNA extraction from increment core samples of A. georgei var. smithii: Wood DNA was extracted using a Chelex-100 crude extraction method. Increment core samples were collected from living trees in the field; a suitable amount of wood chips was cut into small pieces and transferred into 1.5 mL microcentrifuge tubes. A 5% Chelex-100 resin suspension (Bio-Rad Laboratories, Hercules, CA, USA) was added to fully wet and immerse the wood material. Tubes were incubated at 65 °C for 10 min, vortexed for 10 min, and centrifuged at 14,000× g for 5 min. The supernatant was used directly as crude DNA template. DNA integrity and concentration were assessed using the same procedures described for fungal genomic DNA. DNA solutions were diluted with sterile water to a uniform concentration of 50 ng/μL and stored at −20 °C.

2.3. Construction of Plasmid Standard and Copy Number Calculation

A 439 bp TEF1α fragment was amplified from F. subpinicola genomic DNA by PCR using primers PF (5′-GGTACTGGTGAGTTCGAGGC-3′) and PR (5′-AGGAGGGTCTTGCCCTTGAC-3′). PCR products were verified by agarose gel electrophoresis, purified, and ligated into the pMDTM19-T vector (Takara Bio Inc., Dalian, China) to generate the recombinant plasmid pMD19-T-TEF. The plasmid was transformed into Escherichia coli DH5α competent cells (Tiangen Biotech, Beijing, China) and plated on LB agar containing ampicillin for selection. Positive clones were cultured, and recombinant plasmids were extracted. Plasmid DNA concentration was measured using a NanoDrop 2000, and the copy number was calculated based on the total length of the recombinant plasmid using the following formula:
copies/μL = (6.02 × 10²³ × concentration (ng/μL))/(DNA length (bp) × 660)
Based on this calculation, the concentration of the recombinant plasmid stock was approximately 9.97 × 10¹⁰ copies/μL. The plasmid stock was serially diluted 10-fold to generate a dilution range from 9.97 × 10¹⁰ to 9.97 × 10⁻² copies/μL.

2.4. TEF1α Sequence Acquisition, Multiple Sequence Alignment, and Target Region Selection

During primer and probe design, the TEF1α gene was selected as the molecular target. The reference TEF1α sequence of the target pathogen, F. subpinicola, was obtained from a record submitted to the National Microbiology Data Center (NMDC; accession no. NMDCN00099HT) by the authors of a previous study that identified F. subpinicola as the causal agent of heart rot of A. georgei var. smithii at Sejila Mountain.
To evaluate sequence variability and ensure assay specificity, TEF1α sequences of representative taxa within the F. pinicola species complex, including Fomitopsis abieticola, Fomitopsis hengduanensis, Fomitopsis kesiyae, Fomitopsis massoniana, Fomitopsis tianshanensis, Fomitopsis mounceae, Fomitopsis ochracea, and Fomitopsis schrenkii, were downloaded from the National Center for Biotechnology Information (NCBI) database. Additionally, TEF1α sequences from other Fomitopsis species outside the complex (Fomitopsis palustris, Fomitopsis nivosa, Fomitopsis cajanderi, Fomitopsis dickinsii, and Fomitopsis rosea) were included as non-target controls (Table 2). The NMDC-released TEF1α sequence of the target strain (as described above) was incorporated as the reference target sequence Multiple sequence alignment was performed using the ClustalW algorithm implemented in BioEdit (v7.0.9.1; Ibis Biosciences, Carlsbad, CA, USA) to identify polymorphic regions suitable for primer and probe design.

2.5. Primer and Probe Design and Screening

RAA primer design and screening: Based on the selected polymorphic region in TEF1α, nine pairs of candidate RAA primers were designed (30–35 bp in length; amplicon size 100–200 bp; GC content 30%–70%). A total of 14 TEF1α sequences (including one validated F. subpinicola reference sequence and 13 representative taxa within and outside the F. pinicola species complex; accession numbers listed in Table 2) were included in the alignment analysis. Primer length, GC content, and amplicon size were selected according to commonly used design principles for recombinase-based isothermal amplification assays [15]. Candidate primer pairs were further evaluated using NCBI Primer-BLAST (National Center for Biotechnology Information, Bethesda, MD, USA; available online: https://www.ncbi.nlm.nih.gov/tools/primer-blast/; accessed on 27 February 2026) to assess potential non-target amplification against publicly available nucleotide sequences. Only primer pairs meeting the criteria of GC content between 30% and 70%, similar melting temperatures (Tm), minimal predicted secondary structure (including hairpin and primer–dimer formation), and absence of significant non-target matches in Primer-BLAST were retained for experimental screening. Primer performance was screened using recombinase-aided amplification coupled with agarose gel electrophoresis (RAA-AGE), and the amplification efficiency and specificity of different primer combinations were compared.
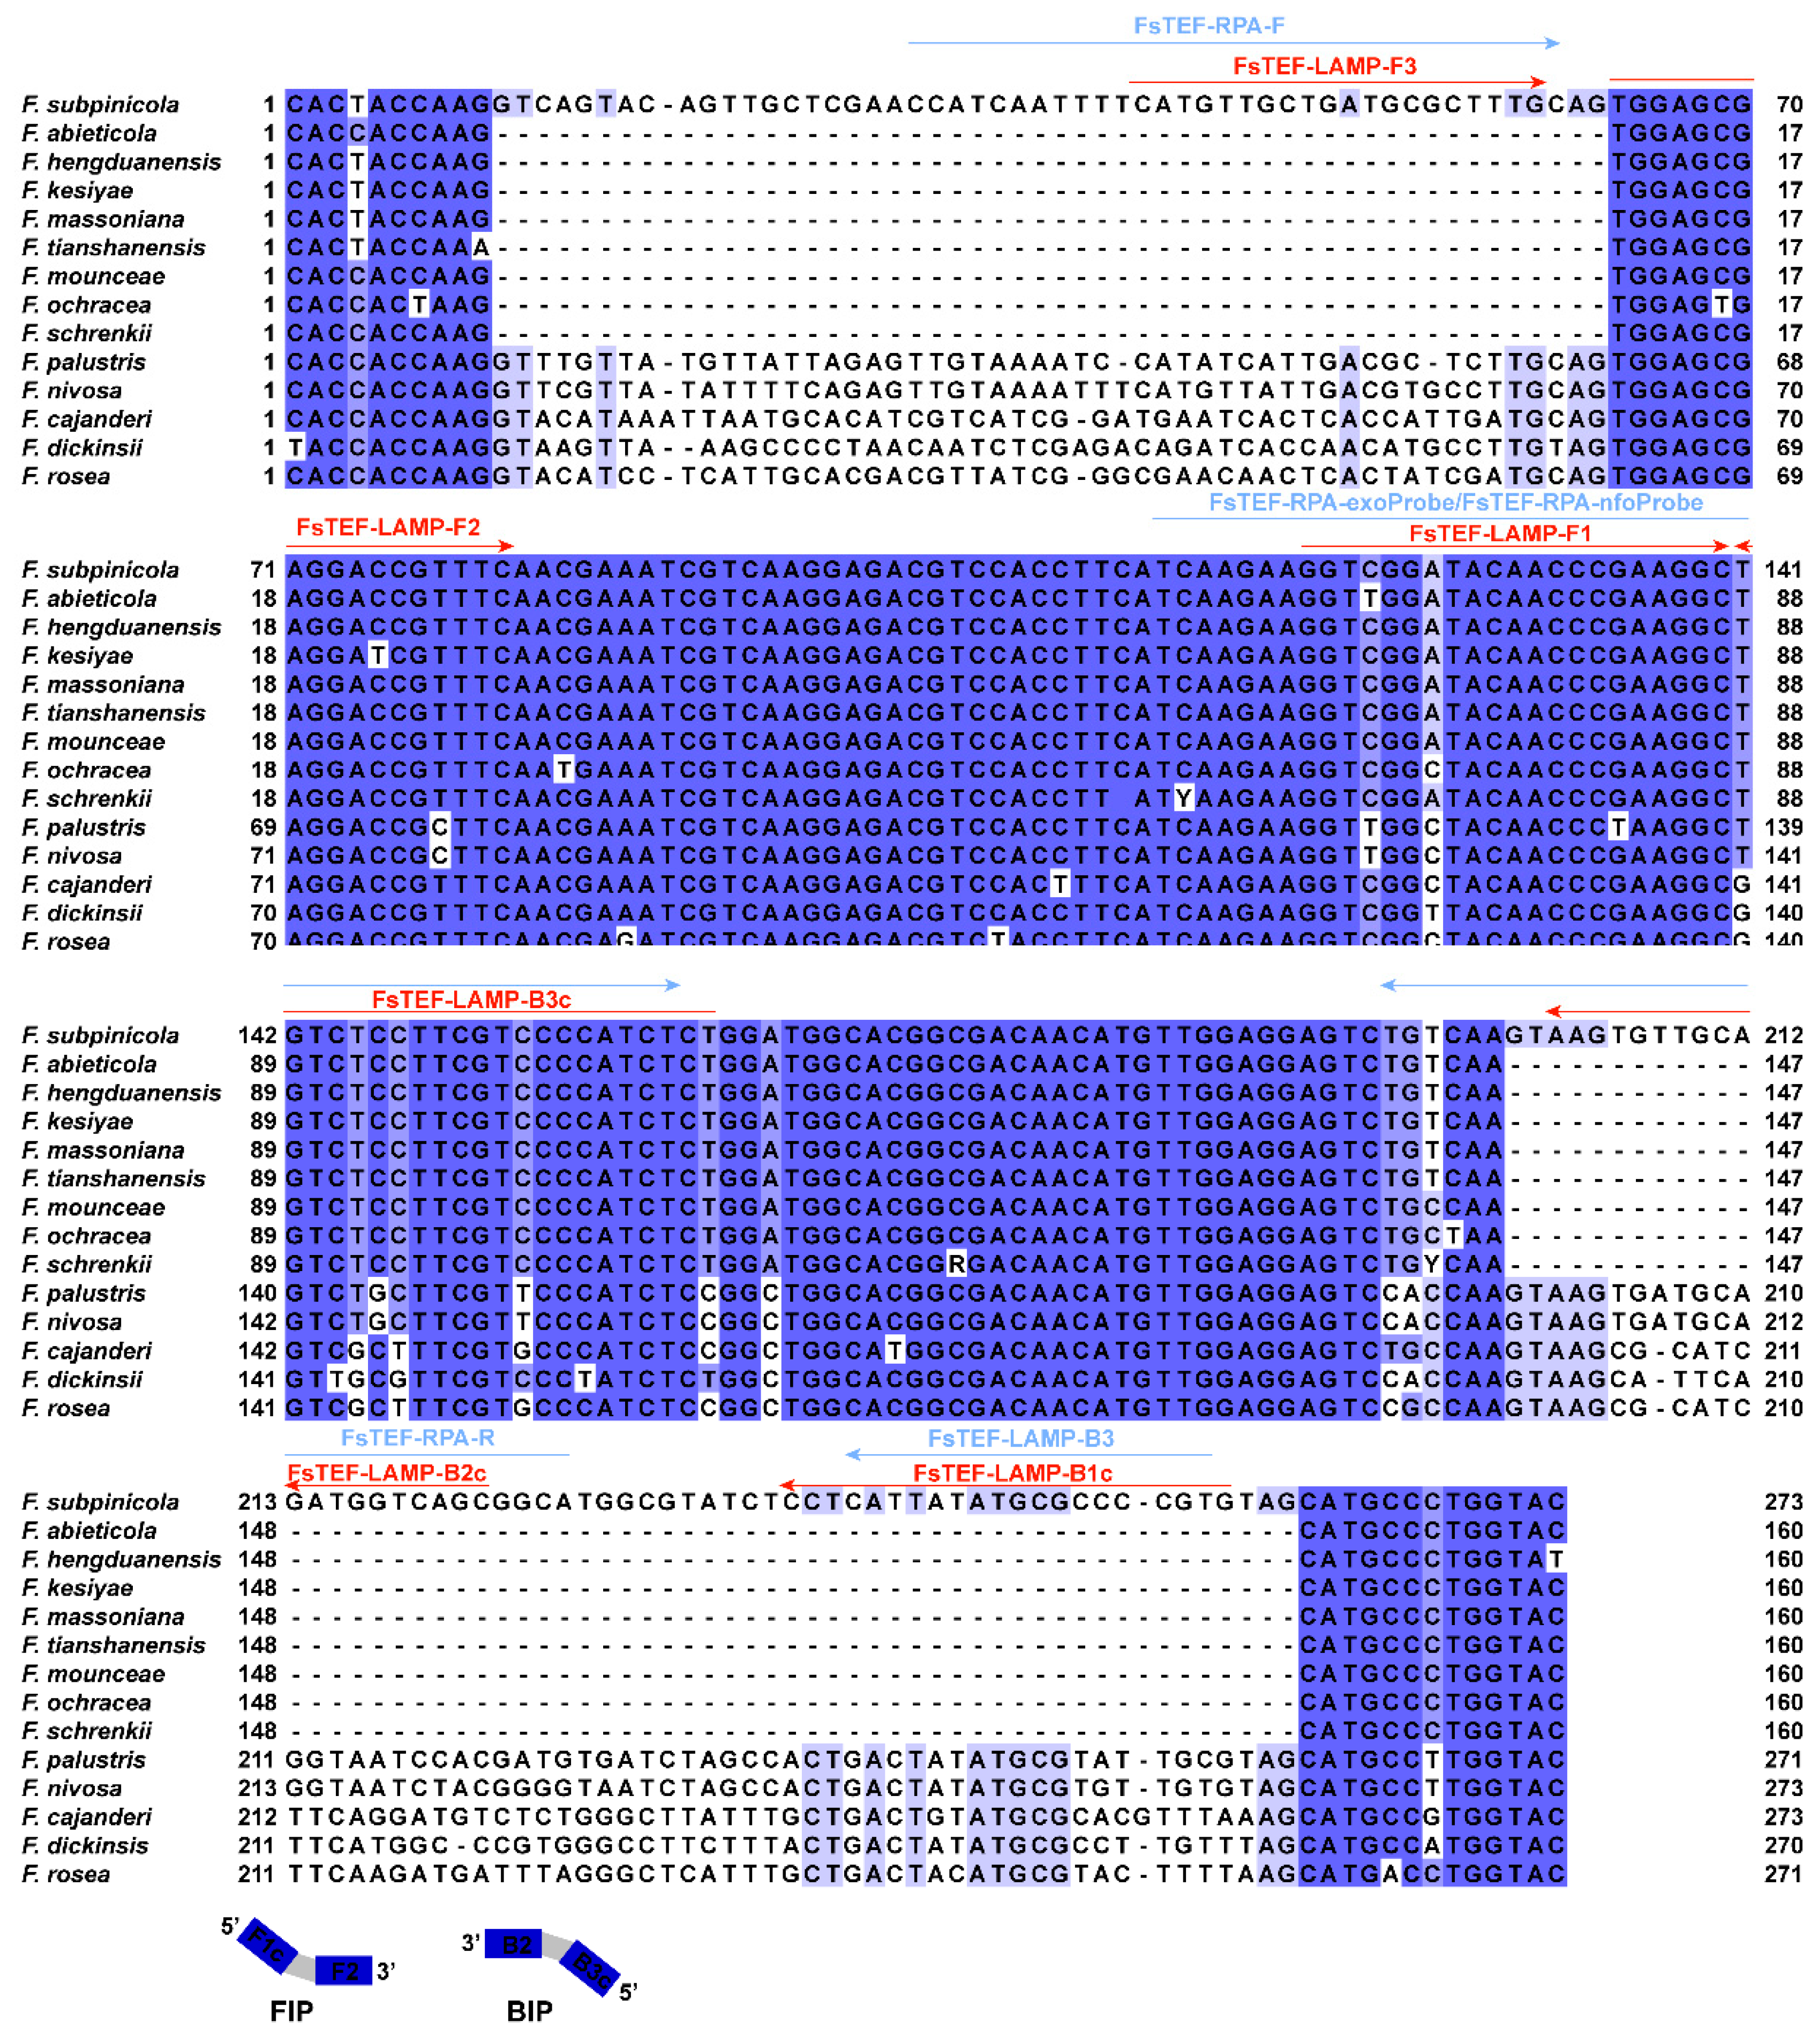
RAA probe design: Two types of target-specific probes were designed within the amplicon of the optimal RAA primer pair to support fluorescent detection and lateral flow readout. Probe sequences were selected to maintain compatible melting temperatures with the corresponding primer pair and to minimize predicted secondary structure formation. For fluorescent RAA, a tetrahydrofuran (THF) abasic site (dSpacer) was introduced at a defined internal position; a reporter fluorophore (FAM) and a quencher (BHQ1) were labeled at designated dT residues, and the probe was blocked at the 3′ end with a phosphate group. For RAA-LFD, the probe was labeled with FAM at the 5′ end, contained an internal dSpacer, and was blocked at the 3′ end; in addition, the corresponding reverse primer was 5′-biotin-labeled to enable visual detection using lateral flow dipsticks. All primers and probes were synthesized by Ribobio Co., Ltd. (Beijing, China). Sequences and applications of primers and probes used in the final RAA assays provided in Figure 1 and Table 3. Sequences and expected amplicon sizes of all candidate RAA primer pairs are provided in Supplementary Table S1.
LAMP primer design: LAMP primers were designed using PrimerExplorer V5 (Eiken Chemical Co., Japan; http://primerexplorer.jp/lampv5/index.html (accessed on 27 February 2026)) with the TEF1α sequence as template. Primer sets were experimentally evaluated for specificity using genomic DNA from the target strain and non-target Fomitopsis species, and the primer set showing the highest specificity was selected for subsequent analyses. Based on these results, Fs-LAMP1 was selected as the final LAMP primer set. Sequences of candidate LAMP primer sets are provided in Supplementary Table S2.

2.6. Reaction Systems and Result Interpretation Criteria

Core reagents for isothermal amplification were obtained from commercial sources: kits for real-time fluorescent RAA and lateral-flow RAA were purchased from Qitian Biotechnology Co., Ltd. (Wuxi, China), and LAMP reactions were performed using the WarmStart Colorimetric LAMP 2× Master Mix (New England Biolabs, Ipswich, MA, USA). Unless otherwise stated, DNA template derived from cultured fungal isolates were standardized to 1 ng/μL in all assays. For fluorescent RAA and LAMP, 1 μL of template was added per reaction; for RAA-LFD, 2 μL of template was added.
Fluorescent RAA: Total reaction volume was 25 μL, containing 12.5 μL Buffer A, one lyophilized enzyme pellet (provided), 0.7875 μL each of forward and reverse primers (10 μM; final 0.315 μM), 0.9 μL fluorescent probe (10 μM; final 0.36 μM), 6.525 μL sterile double-distilled water, and 1 μL DNA template. The reaction was initiated by adding 2.5 μL magnesium acetate (280 mM; freshly prepared; final 28 mM). Tubes were immediately placed in a real-time PCR instrument (CFX96 Touch, Bio-Rad, Hercules, CA, USA) and incubated isothermally at 40 °C for 25 min, with fluorescence recorded every 30 s. Sterile water was used as the no-template control (NC).
For sensitivity analysis of the fluorescent RAA assay, fluorescence intensity measured at 25 min was extracted from the real-time amplification curves as the quantitative metric for statistical analysis. Data from three technical replicates (n = 3) were analyzed using OriginPro 2025 (OriginLab Corporation, Northampton, MA, USA). Normality testing was performed prior to one-way ANOVA followed by Tukey’s honestly significant difference (HSD) post hoc test to evaluate statistical significance. Data are presented as mean ± SEM.
All reactions were performed in triplicate. The fluorescence signal was monitored for 25 min. A sample was considered positive if its fluorescence curve exceeded a threshold defined as the mean baseline fluorescence of the no-template control (NC) during 0–10 min plus three standard deviations (mean + 3 × SD), and continued to rise; otherwise, it was considered negative.
RAA-LFD: Total reaction volume was 50 μL, containing 25 μL Buffer A, one lyophilized enzyme pellet, 13.2 μL sterile double-distilled water, 2.1 μL each of forward and reverse primers (10 μM; final 0.42 μM), 0.6 μL probe (10 μM; final 0.12 μM), and 2 μL DNA template. Reactions were initiated by adding 5 μL magnesium acetate (280 mM; final 28 mM) and incubated at 37 °C for 15 min in a water bath or metal heat block. After amplification, 5 μL product was mixed with 45 μL PBS buffer (pH 7.4; Qitian Biotechnology, Wuxi, China). A lateral flow dipstick (Qitian Biotechnology, Wuxi, China) was inserted vertically into the mixture, and results were read after 2 min. The appearance of both the test line (T) and control line (C), regardless of the intensity of the T line, was interpreted as a positive result; the presence of only the C line indicated a negative result; and absence of the C line indicated an invalid test. All strips were independently evaluated by two investigators to reduce subjectivity.
LAMP: Total reaction volume was 25 μL, including 12.5 μL 2 × WarmStart Colorimetric LAMP Master Mix (with UDG; NEB), 2.5 μL 10 × LAMP primer mix (FIP/BIP 16 μM each, F3/B3 2 μM each, LF/LB 4 μM each), 1 μL DNA template, and 9 μL nuclease-free water. Reactions were incubated at 65 °C for 35 min. Results were interpreted visually: a color change from bright pink to yellow indicated positive amplification, whereas no change (remaining pink) indicated negative. Because some water sources (DEPC-treated water) caused background color shifts, nuclease-free double-distilled water was used as the NC in all subsequent LAMP assays. The absence of amplification signals in the NC reactions confirmed that the water and reagents were free of nucleic acid contamination.

2.7. Analytical Specificity and Sensitivity, and Testing of Field Samples

Unless otherwise stated, all sensitivity, specificity, and field-sample assays were performed in three independent technical replicates. Sensitivity assays were conducted across independent experimental runs on different days to assess repeatability.
Specificity: Genomic DNA (adjusted to 1 ng/μL based on NanoDrop 2000 measurements, Thermo Fisher Scientific, Waltham, MA, USA) from the target strain F. subpinicola and ten non-target fungi was used as template in fluorescent RAA, RAA-LFD, and LAMP assays. NCs were included in all runs.
Sensitivity: The recombinant plasmid pMD19-T-TEF was used as template across the 10-fold dilution series to determine the limit of detection (LOD) for each assay. Sterile water served as NC, and each dilution was tested in triplicate across independent experimental runs to confirm repeatability.
Field sample testing: Increment cores were collected from 30 A. georgei var. smithii trees in the Sejila area of Nyingchi, Tibet (one core per tree). Samples 5, 6, 7, 8, 9, 10, 21, 24, 27, 28, and 29 exhibited visible internal decay, whereas all remaining samples were visually normal and did not show obvious macroscopic decay. Crude DNA was extracted using Chelex-100 method as described in Section 2.2 and quantified using a NanoDrop 2000 spectrophotometer prior to diluted to 50 ng/μL. All samples were tested by the three isothermal methods, with technical replicates for each method to compare performance on real wood samples. For visually asymptomatic samples (samples without visible internal decay) that tested positive by fluorescent RAA, the corresponding amplification products were further subjected to bidirectional Sanger sequencing using a primer pair designed for sequence confirmation of the TEF1α target region (primer sequences are provided in Supplementary Table S3). To assess reproducibility under practical conditions, selected field-sample assays were independently repeated by a second operator and performed using different incubation devices, including a real-time PCR instrument, a portable fluorometer (custom-built by Forest Engineering Research Team, Beijing Forestry University, Beijing, China), a dry metal block, and a water bath, depending on the assay format.

3. Results

3.1. Identification of a Species-Specific TEF1α Target for Fomitopsis Subpinicola

To identify a molecular target suitable for specific detection of F. subpinicola, TEF1α sequences from members of the F. pinicola species complex and closely related taxa were compared. Overall, TEF1α sequences were highly conserved across the complex, supporting their suitability as a stable molecular marker.
Despite this general conservation, F. subpinicola displayed a distinct diagnostic feature relative to other taxa, namely a unique 54-bp insertion within the aligned region (positions 193–245 of the reference sequence; Figure 1). This insertion was absent from all other examined members of the complex as well as from closely related species. This insertion provided a useful molecular feature for species discrimination under the tested conditions. Based on this region, primer and probe binding sites were defined for subsequent RAA and LAMP assay development. A representative F. subpinicola strain from Sejila Mountain was used for target design to ensure relevance to the local pathogen population.

3.2. Screening and Selection of RAA and LAMP Primer Sets

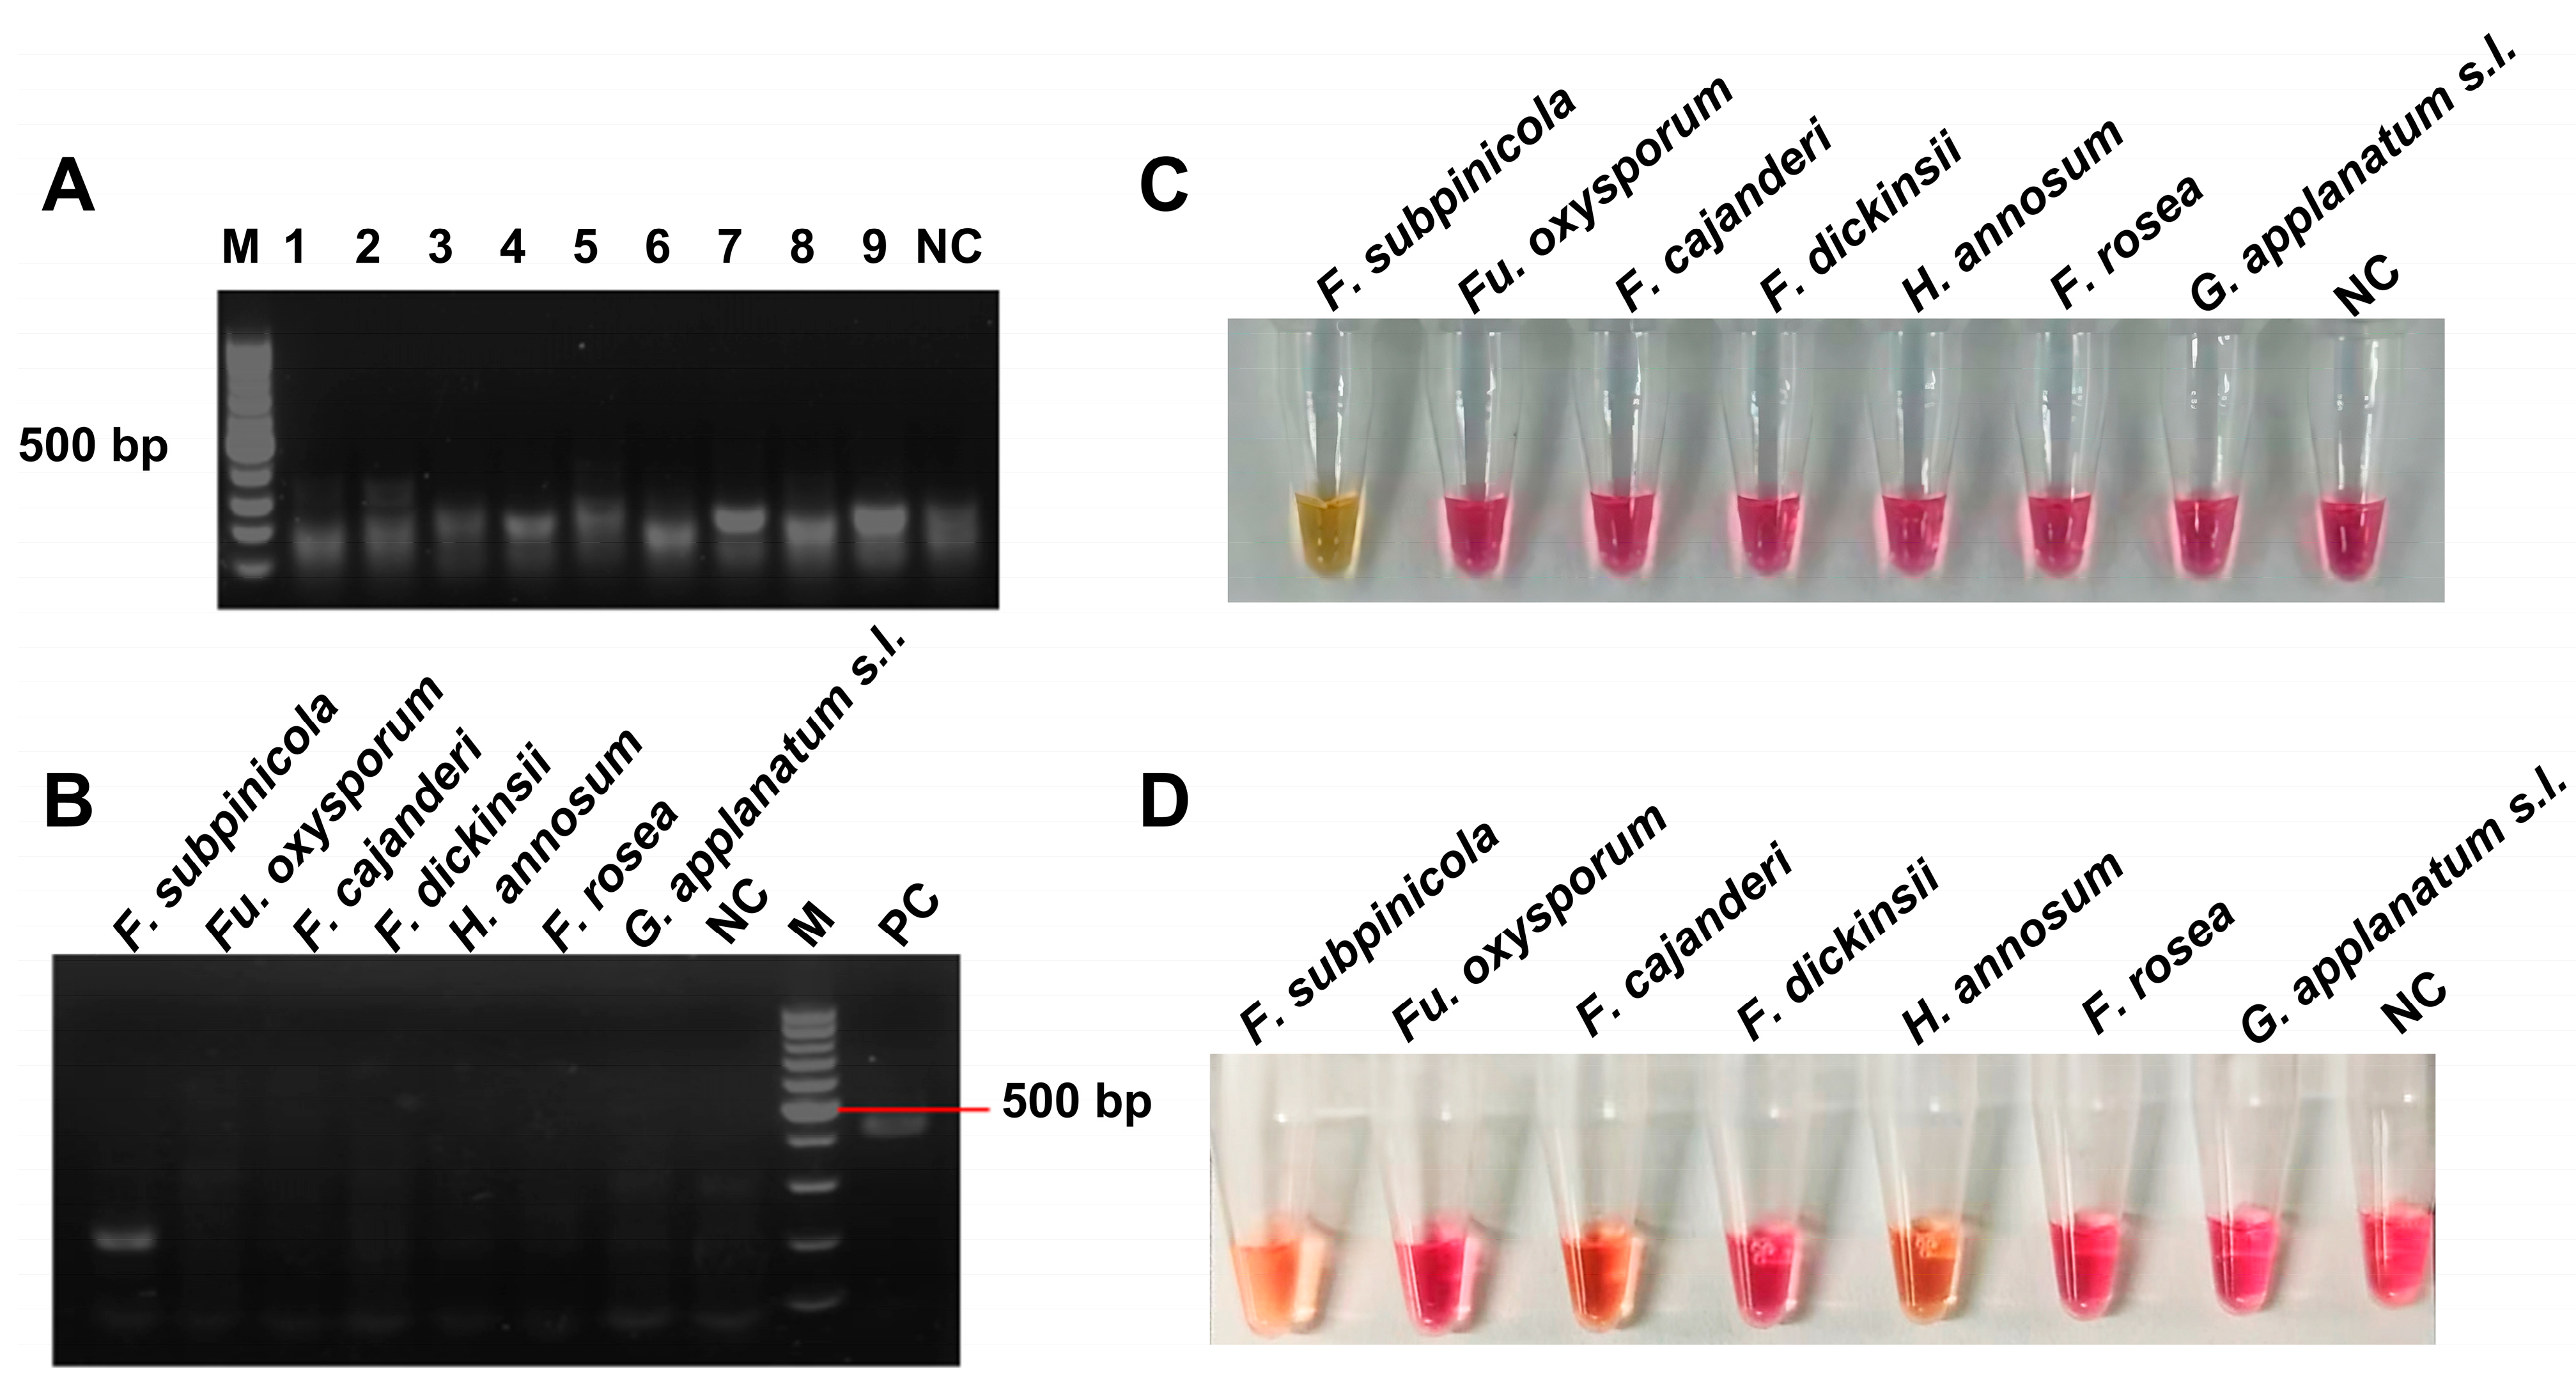
To identify primer sets capable of specific amplification of F. subpinicola, nine candidate RAA primer pairs (RAA1-RAA9) were initially evaluated. As shown in Figure 2A, lanes 1–9 correspond to the amplification results obtained with primer pairs RAA1 through RAA9, respectively. The expected amplicon size was 197 bp. Among these, the primer pair RAA9 consistently produced a single, strong amplicon of the expected size without detectable non-specific amplification, whereas other primer pairs showed weaker signals or non-specific bands. Therefore, primer pair RAA9 was selected and subsequently designated as FsTEF-RAA-F/R for further analyses.
Preliminary specificity testing showed that FsTEF-RAA-F/R amplified only the target template, with no amplification observed from six non-target fungi or negative controls (Figure 2B), suggesting specificity under the tested conditions at the screening stage.
For LAMP, two candidate primer sets were compared. The Fs-LAMP1 set yielded positive reactions exclusively in the presence of F. subpinicola DNA, while all non-target templates remained negative (Figure 2C). In contrast, the Fs-LAMP2 set produced signs of non-specific amplification in some non-target templates (Figure 2D).
Following primer selection, the specificity of the finalized RAA and LAMP assays was further evaluated using an expanded panel of phylogenetically related and ecologically relevant fungi, as described in the Section 2.

3.3. Optimization of Isothermal Amplification Conditions

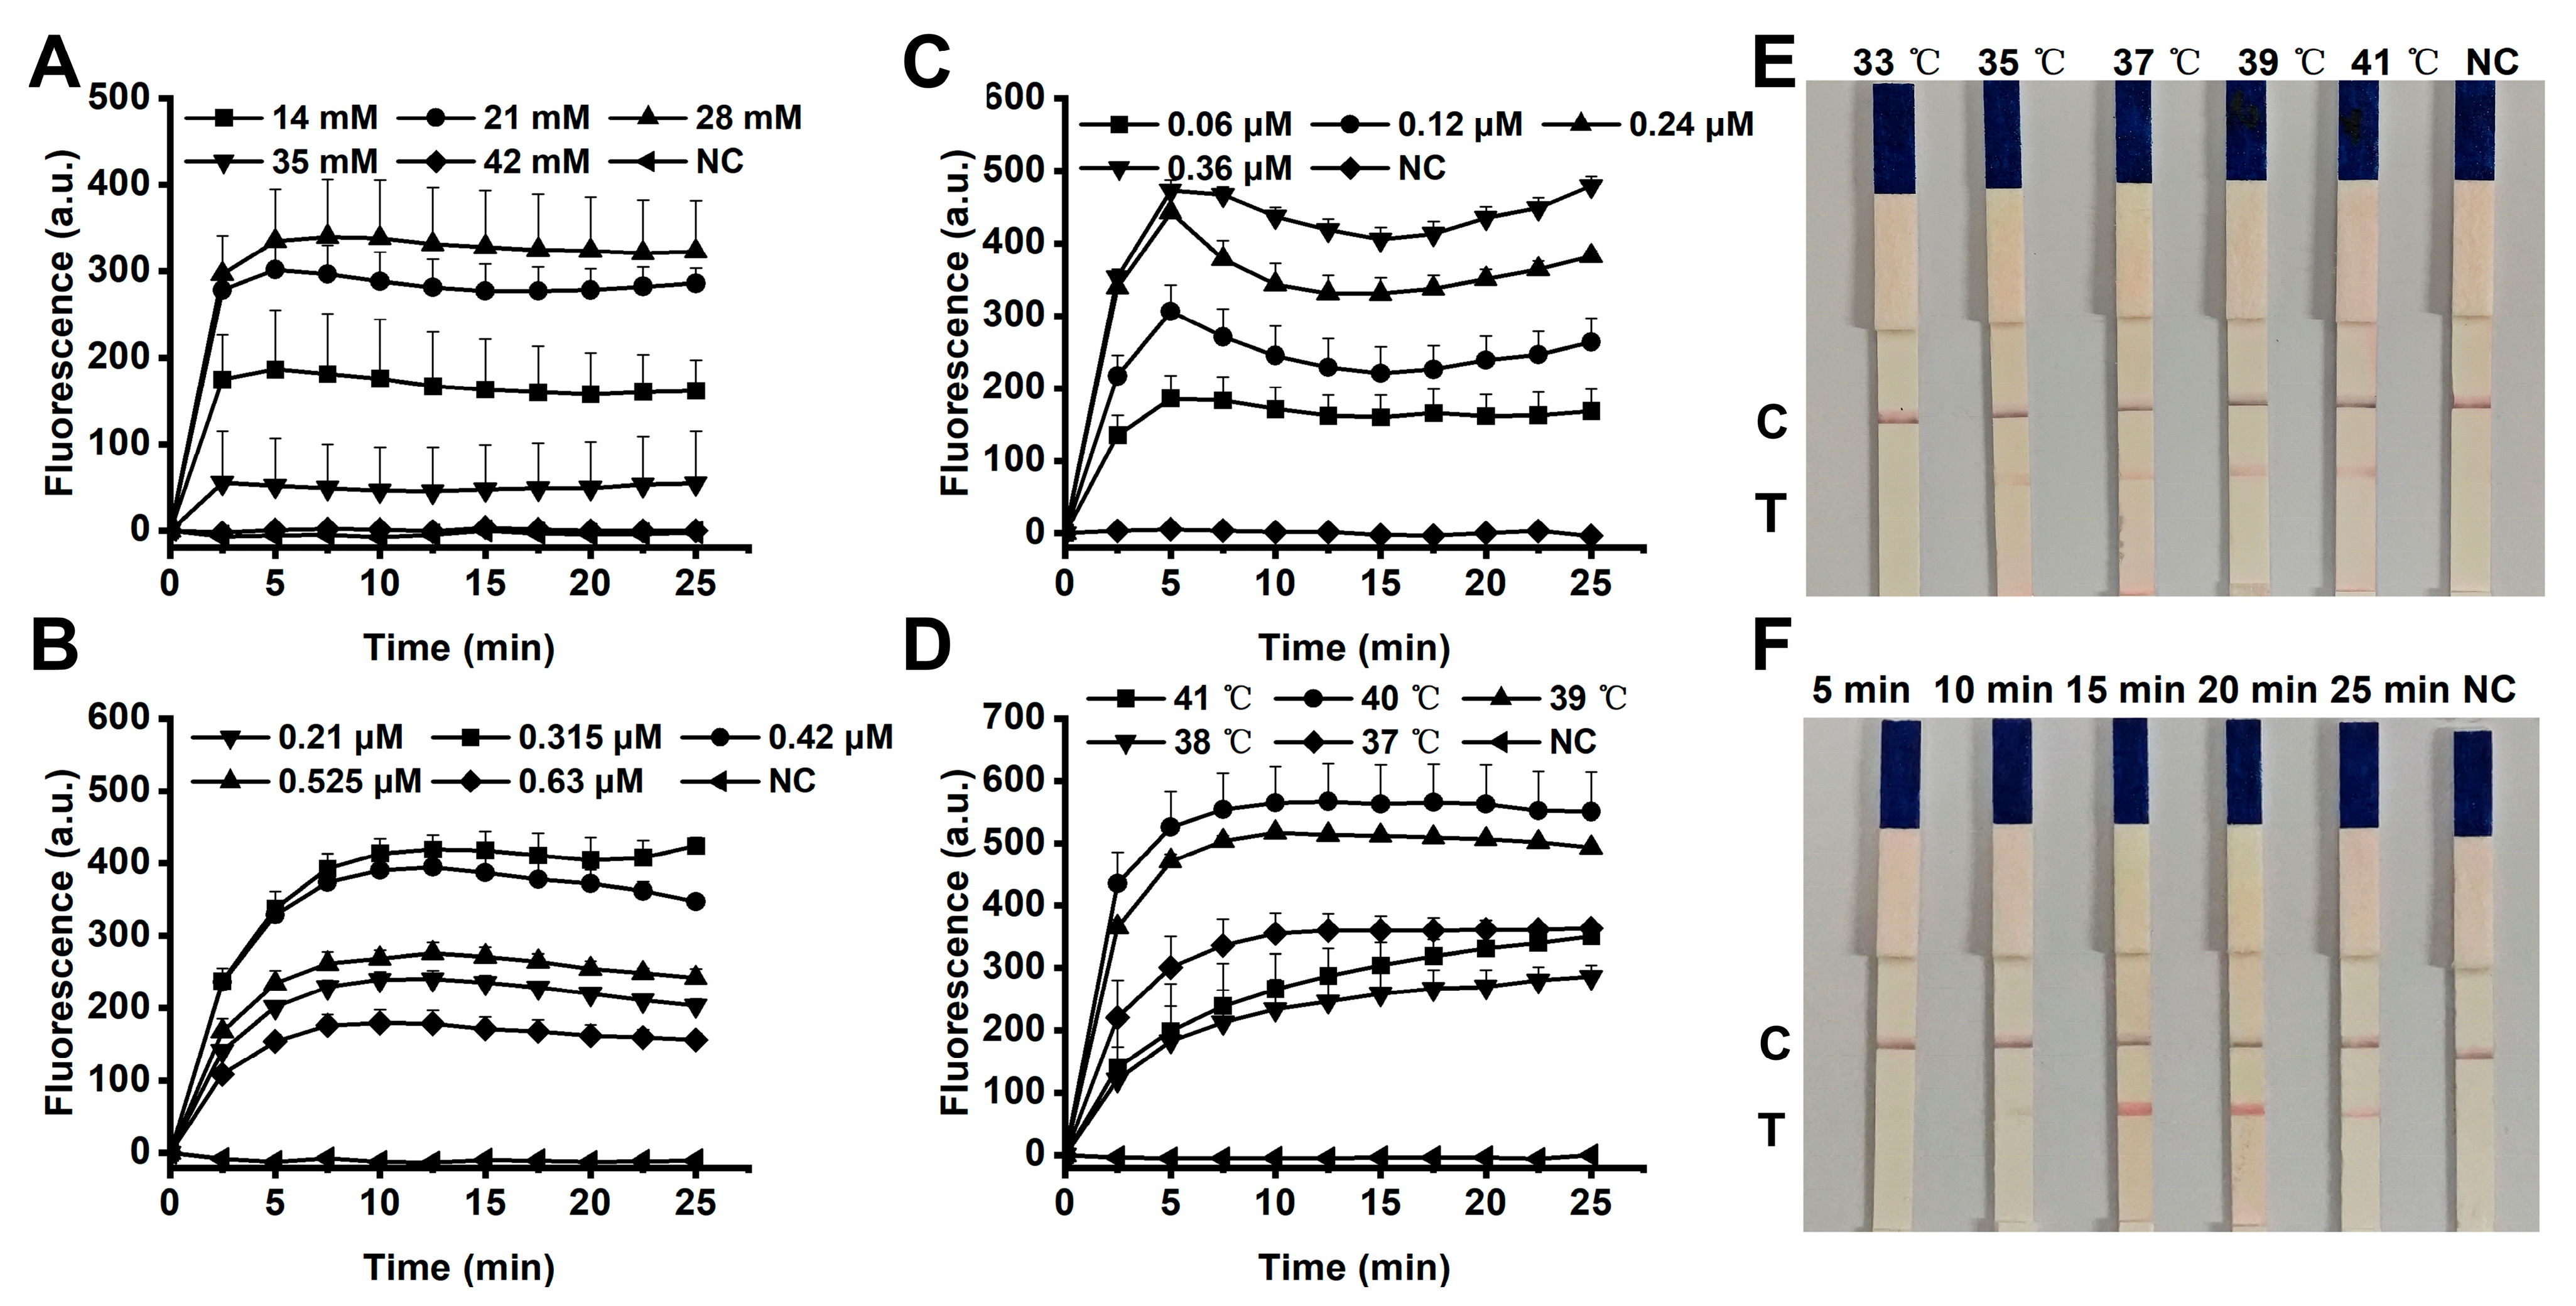
Fluorescent RAA assay: To establish robust reaction conditions for fluorescent RAA detection, key parameters affecting amplification efficiency were optimized. Fluorescence intensity increased with increasing magnesium acetate concentration and reached a maximum at 28 mM, whereas a further increase resulted in a slight reduction in signal intensity (Figure 3A). Accordingly, 28 mM magnesium acetate was selected for subsequent optimization.
Under this condition, primer concentration, probe concentration, and reaction temperature were further evaluated. An optimal parameter combination was identified that produced rapid amplification, strong fluorescence signals, and low background noise (Figure 3B–D). The finalized fluorescent RAA assay therefore operates optimally at 40 °C with 28 mM magnesium acetate, a primer concentration of 0.315 μM, a probe concentration of 0.36 μM, and an incubation time of 25 min.
RAA-LFD assay: To enhance field applicability, temperature conditions that could be easily maintained outside the laboratory were prioritized for the RAA-LFD assay. Clear and comparable test-line signals were obtained at both 37 °C and 39 °C (Figure 3E). Because 37 °C is more readily achievable under field conditions, it was selected as the final reaction temperature.
Time-course evaluation showed that a distinct test line was visible within 15 min at 37 °C, and extending the reaction time resulted in little additional signal enhancement (Figure 3F). Accordingly, the final RAA-LFD conditions were set to 37 °C for 15 min.
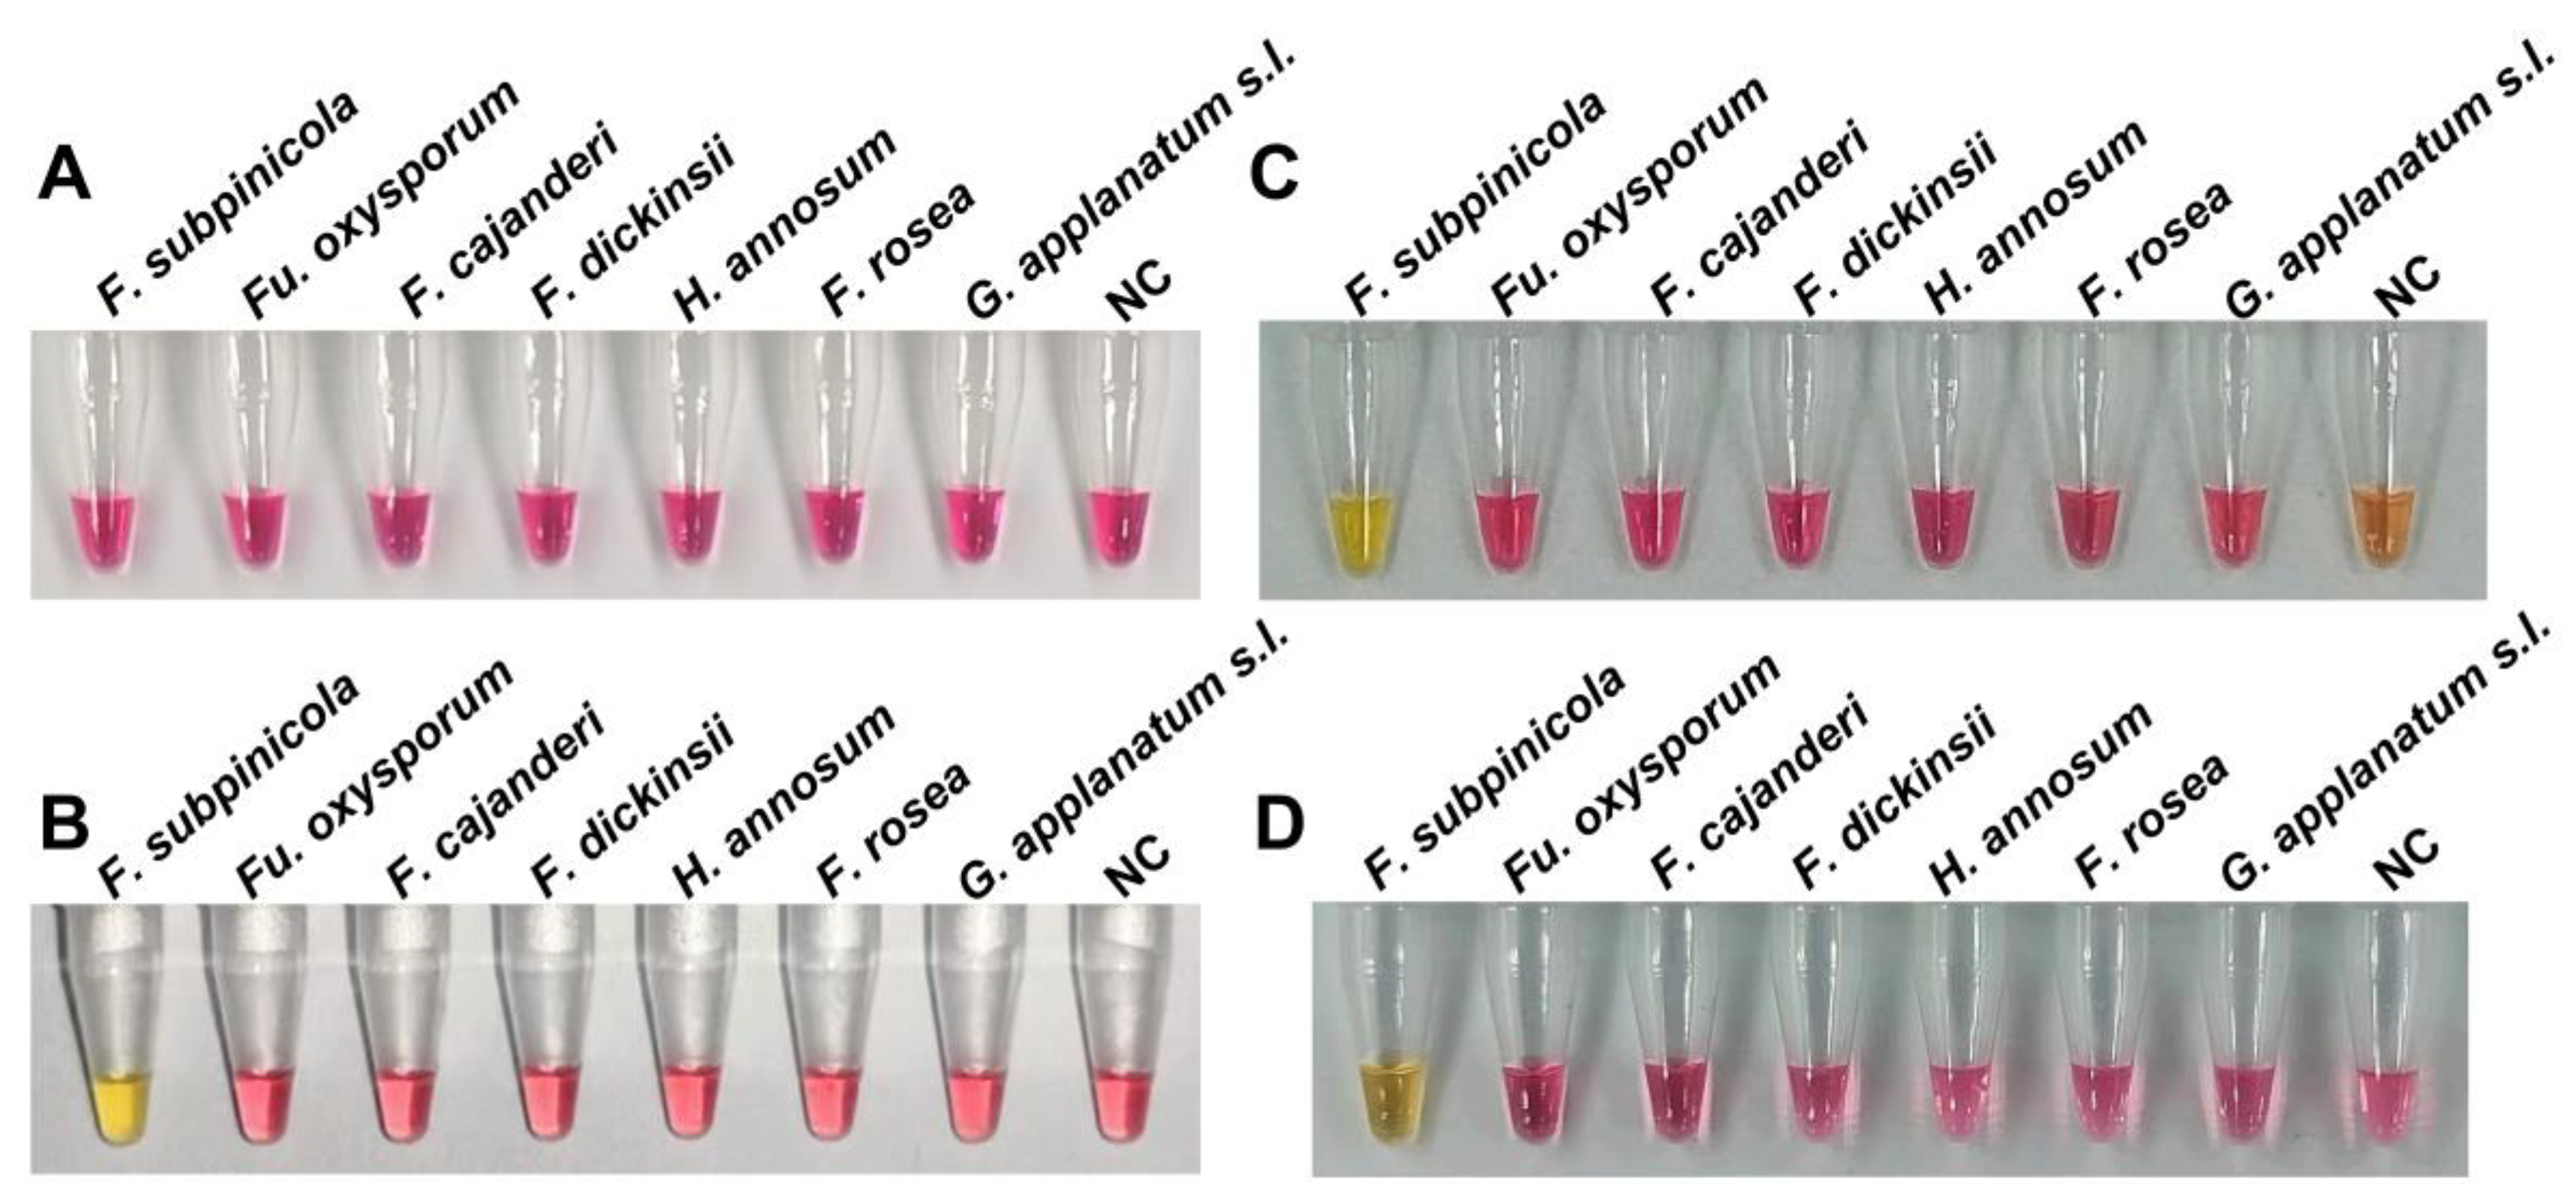
Colorimetric LAMP assay: Colorimetric LAMP results of different tested species obtained under this fixed incubation time are shown in Figure 4. Reaction time and solvent effects on the colorimetric readout were evaluated. At 30 min, no visible color change was observed for any species (Figure 4A), whereas at 35 min clear positive color development was obtained for the target species (Figure 4B). Extending the reaction time beyond 35 min did not further enhance the signal; therefore, 35 min was selected as the optimal reaction time.
When DEPC-treated water was used as the reaction solvent, the negative control exhibited an apparent color change, indicating the occurrence of false-positive signals under standard conditions (Figure 4C). Increasing the reaction temperature eliminated this effect and restored correct negative-control behavior (Figure 4D), demonstrating that solvent composition and temperature can influence pH-based colorimetric LAMP reactions.

3.4. Analytical Sensitivity of the Three Assays

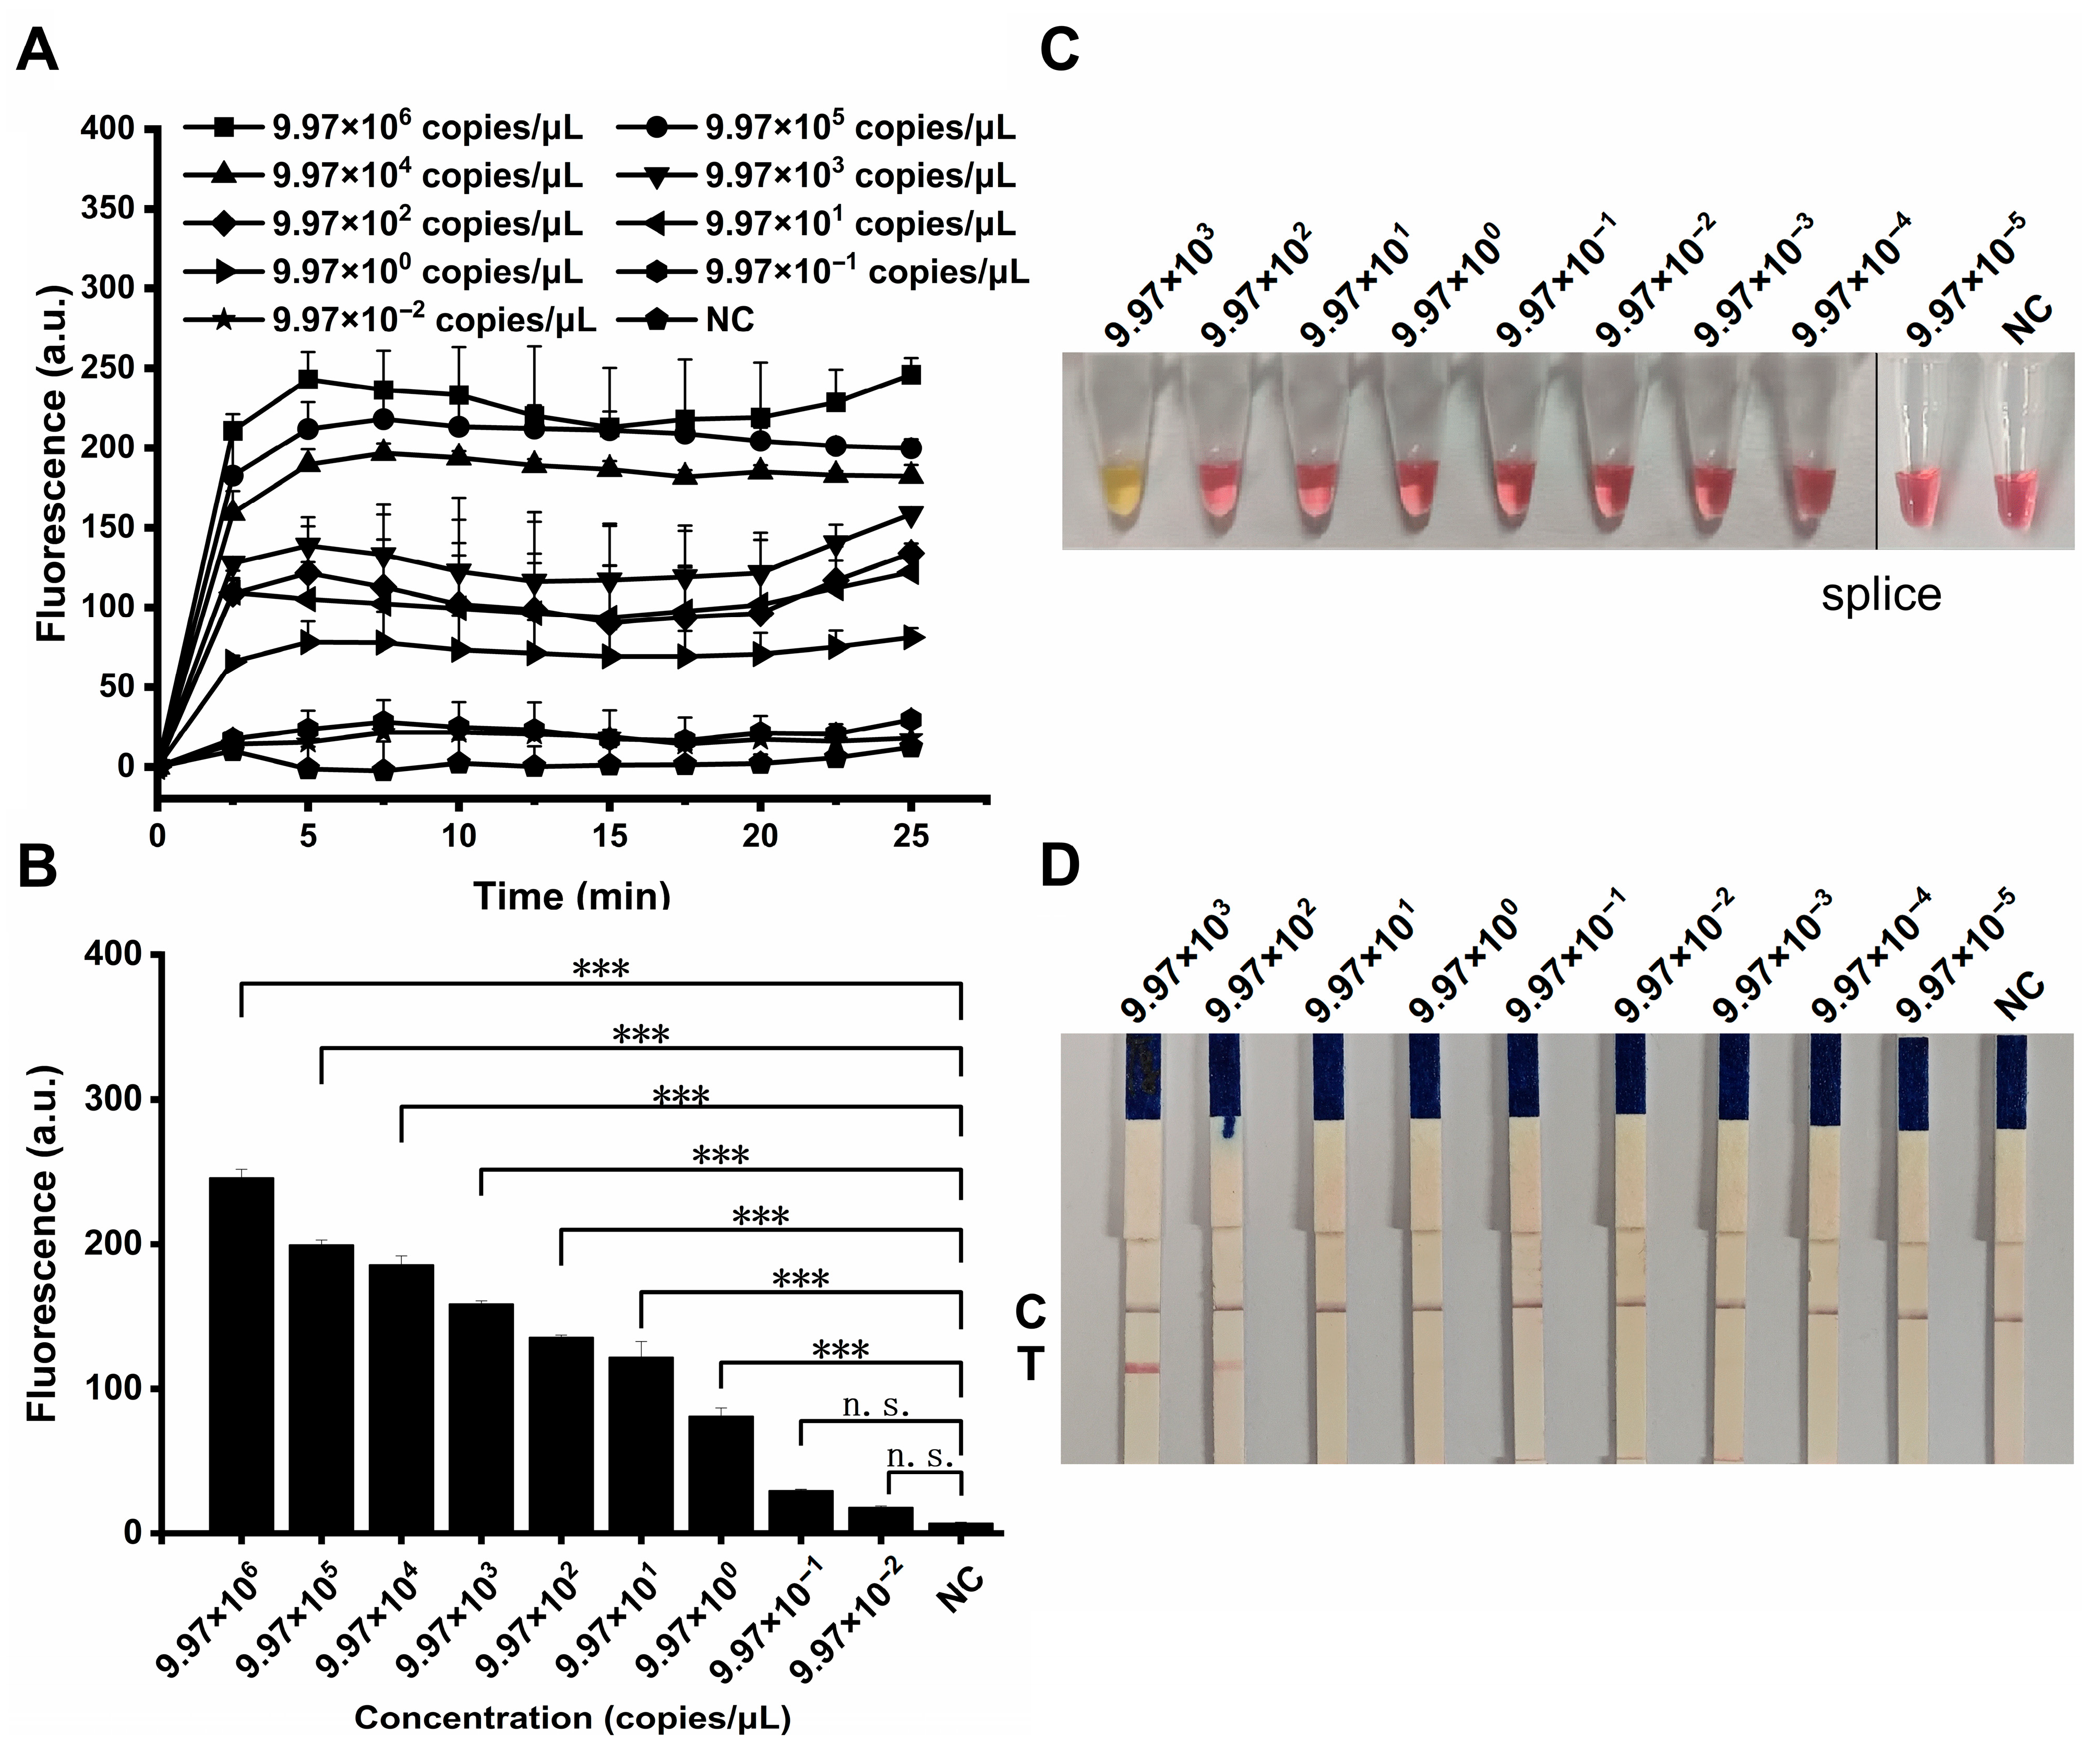
Using a serially diluted plasmid standard as template, the analytical sensitivity of the three assays was determined. Fluorescent RAA detected the target at concentrations as low as approximately 9.97 copies/μL, producing positive signals in all three independent replicates at the lowest dilution tested (Figure 5A,B). Each dilution was tested in three technical replicates, and the limit of detection (LOD) was defined as the lowest concentration at which all replicates yielded positive amplification.
In comparison, the limits of detection for LAMP and RAA-LFD were approximately 9.97 × 10³ copies/μL and 9.97 × 10² copies/μL, respectively (Figure 5C,D). No positive signals were observed in negative controls for any assay, indicating the absence of detectable non-specific amplification or contamination.

3.5. Analytical Specificity of the Assays

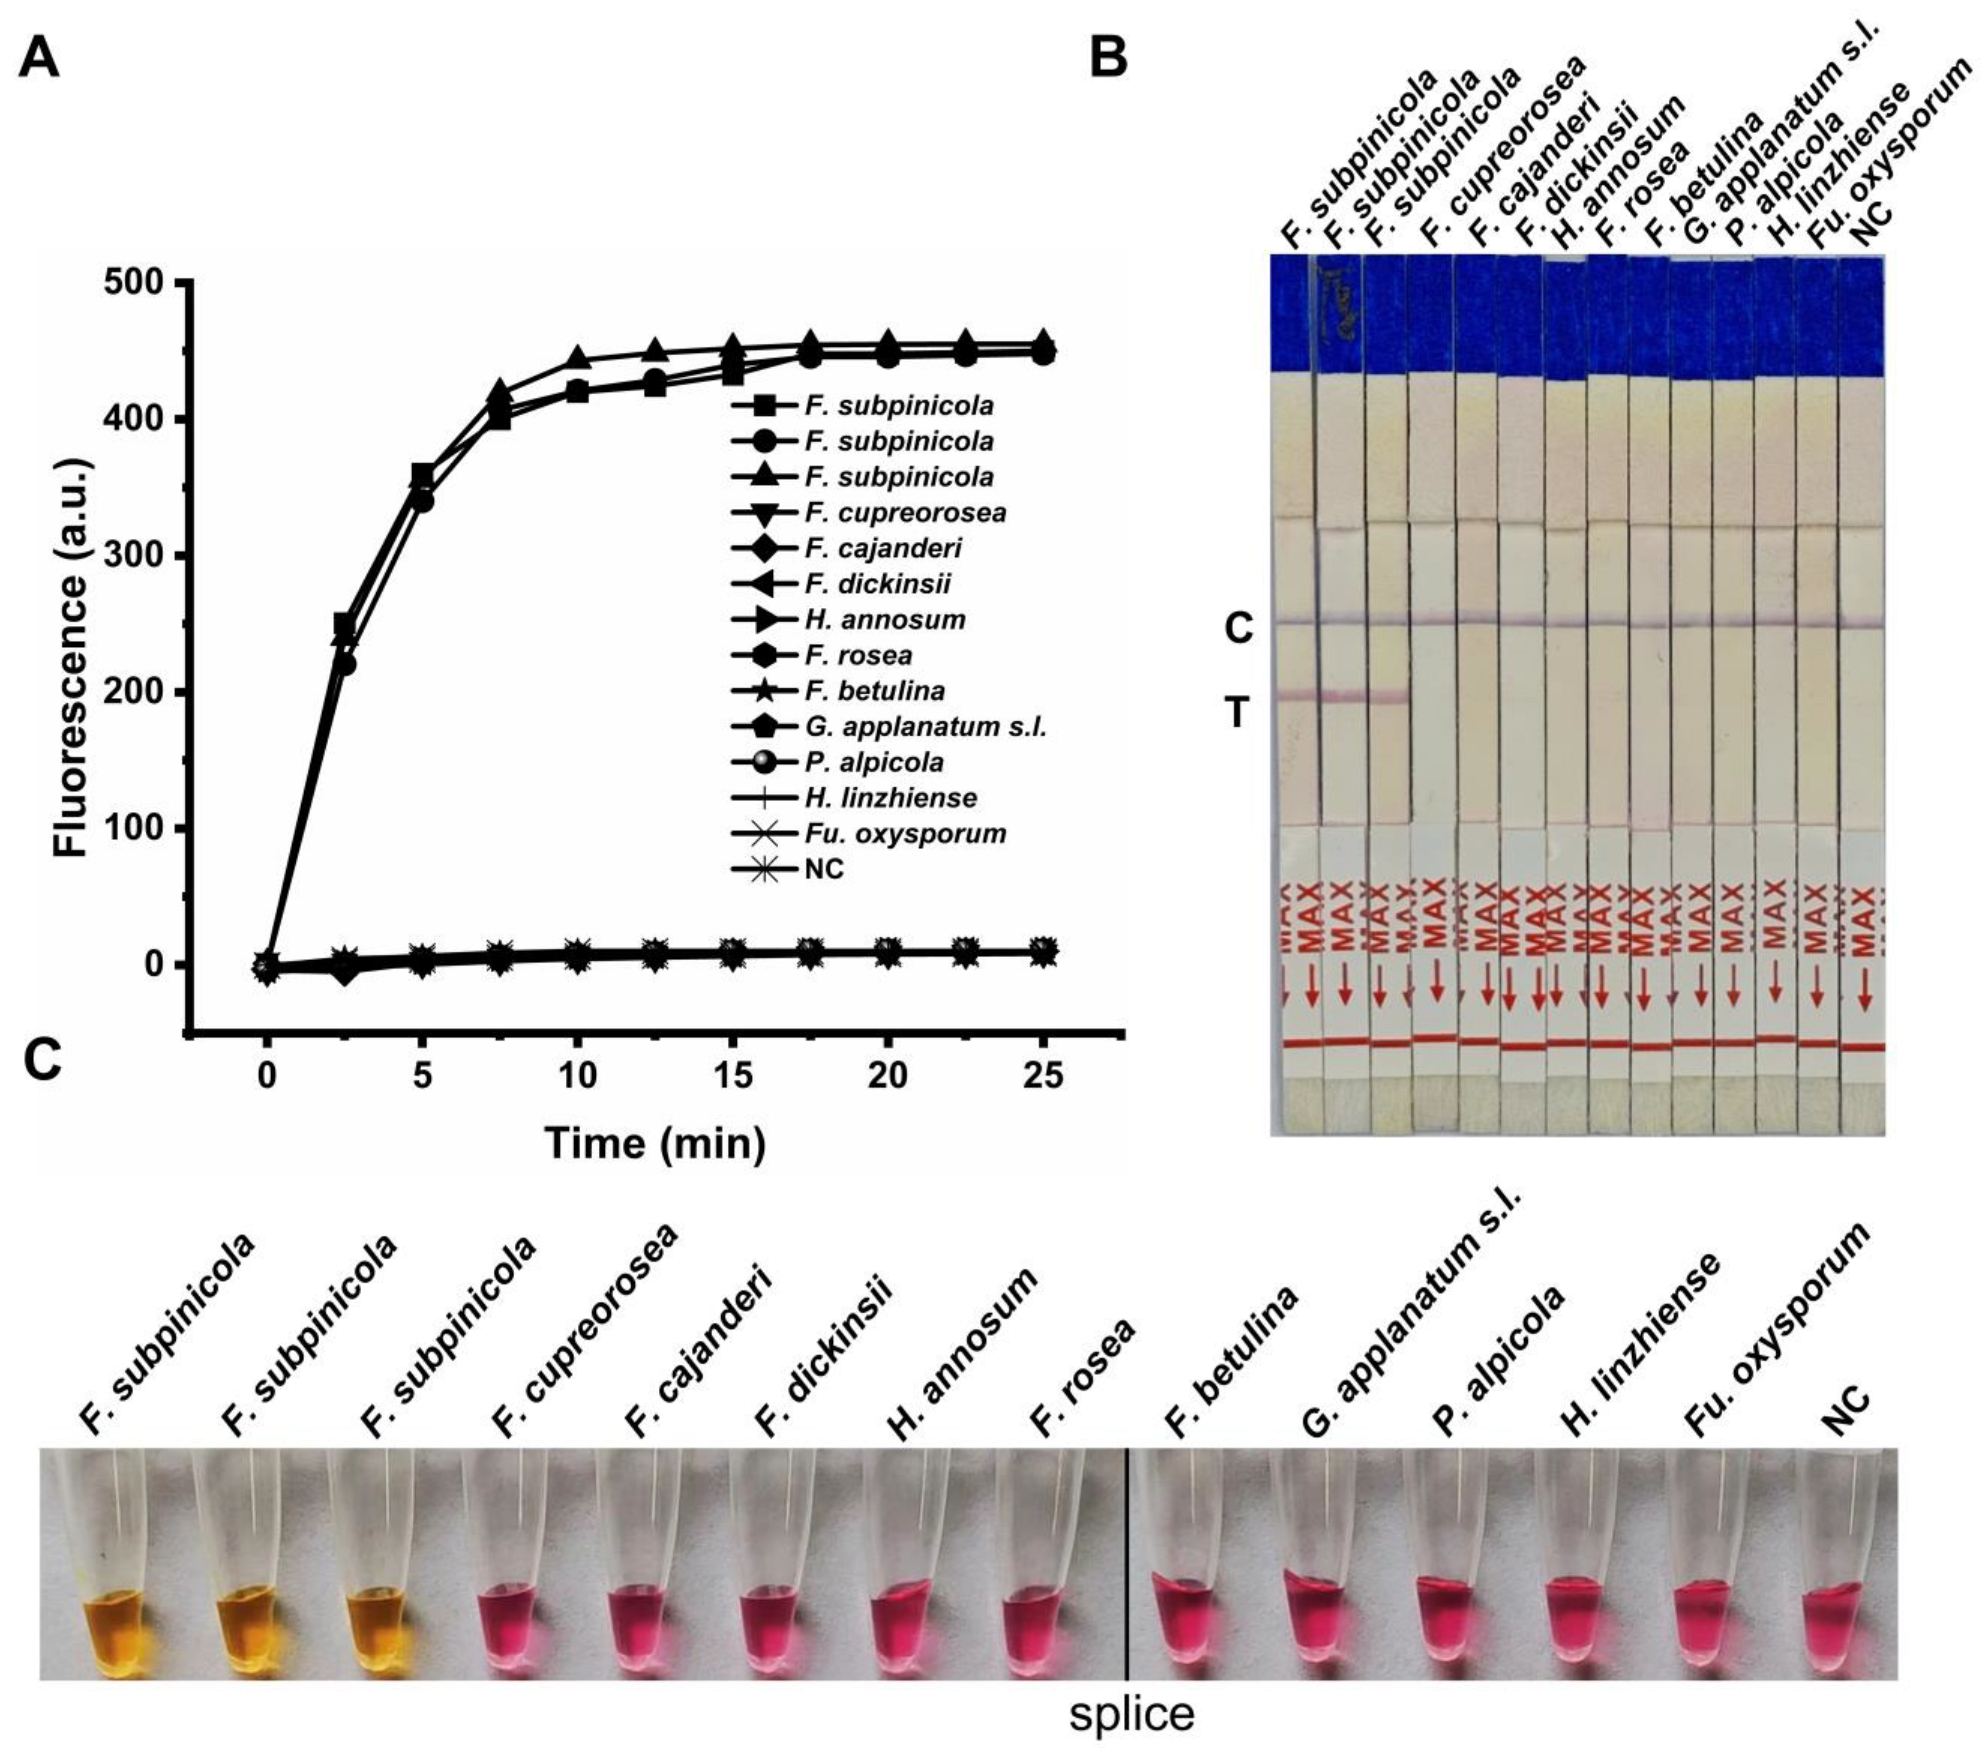
The analytical specificity of the three methods was evaluated using genomic DNA from three independent isolates of F. subpinicola as target templates, together with ten non-target fungi representing phylogenetically related or ecologically relevant wood-decay species. In the fluorescent RAA assay, all three F. subpinicola isolates consistently generated positive amplification curves, whereas no amplification was observed for any of the non-target fungi or negative controls (Figure 6A). Similarly, the RAA-LFD assay produced distinct test lines for all three target isolates, with only control lines visible for non-target samples (Figure 6B).
In the LAMP assay, a clear color change was observed exclusively in reactions containing DNA from the three F. subpinicola isolates, while all non-target samples and negative controls remained unchanged (Figure 6C). These results demonstrate that all three assays exhibit high analytical specificity for F. subpinicola and reliably discriminate the target pathogen from closely related and co-occurring fungi and ten non-target fungi.

3.6. Detection of F. subpinicola in Increment Core Samples and Comparison of Methods

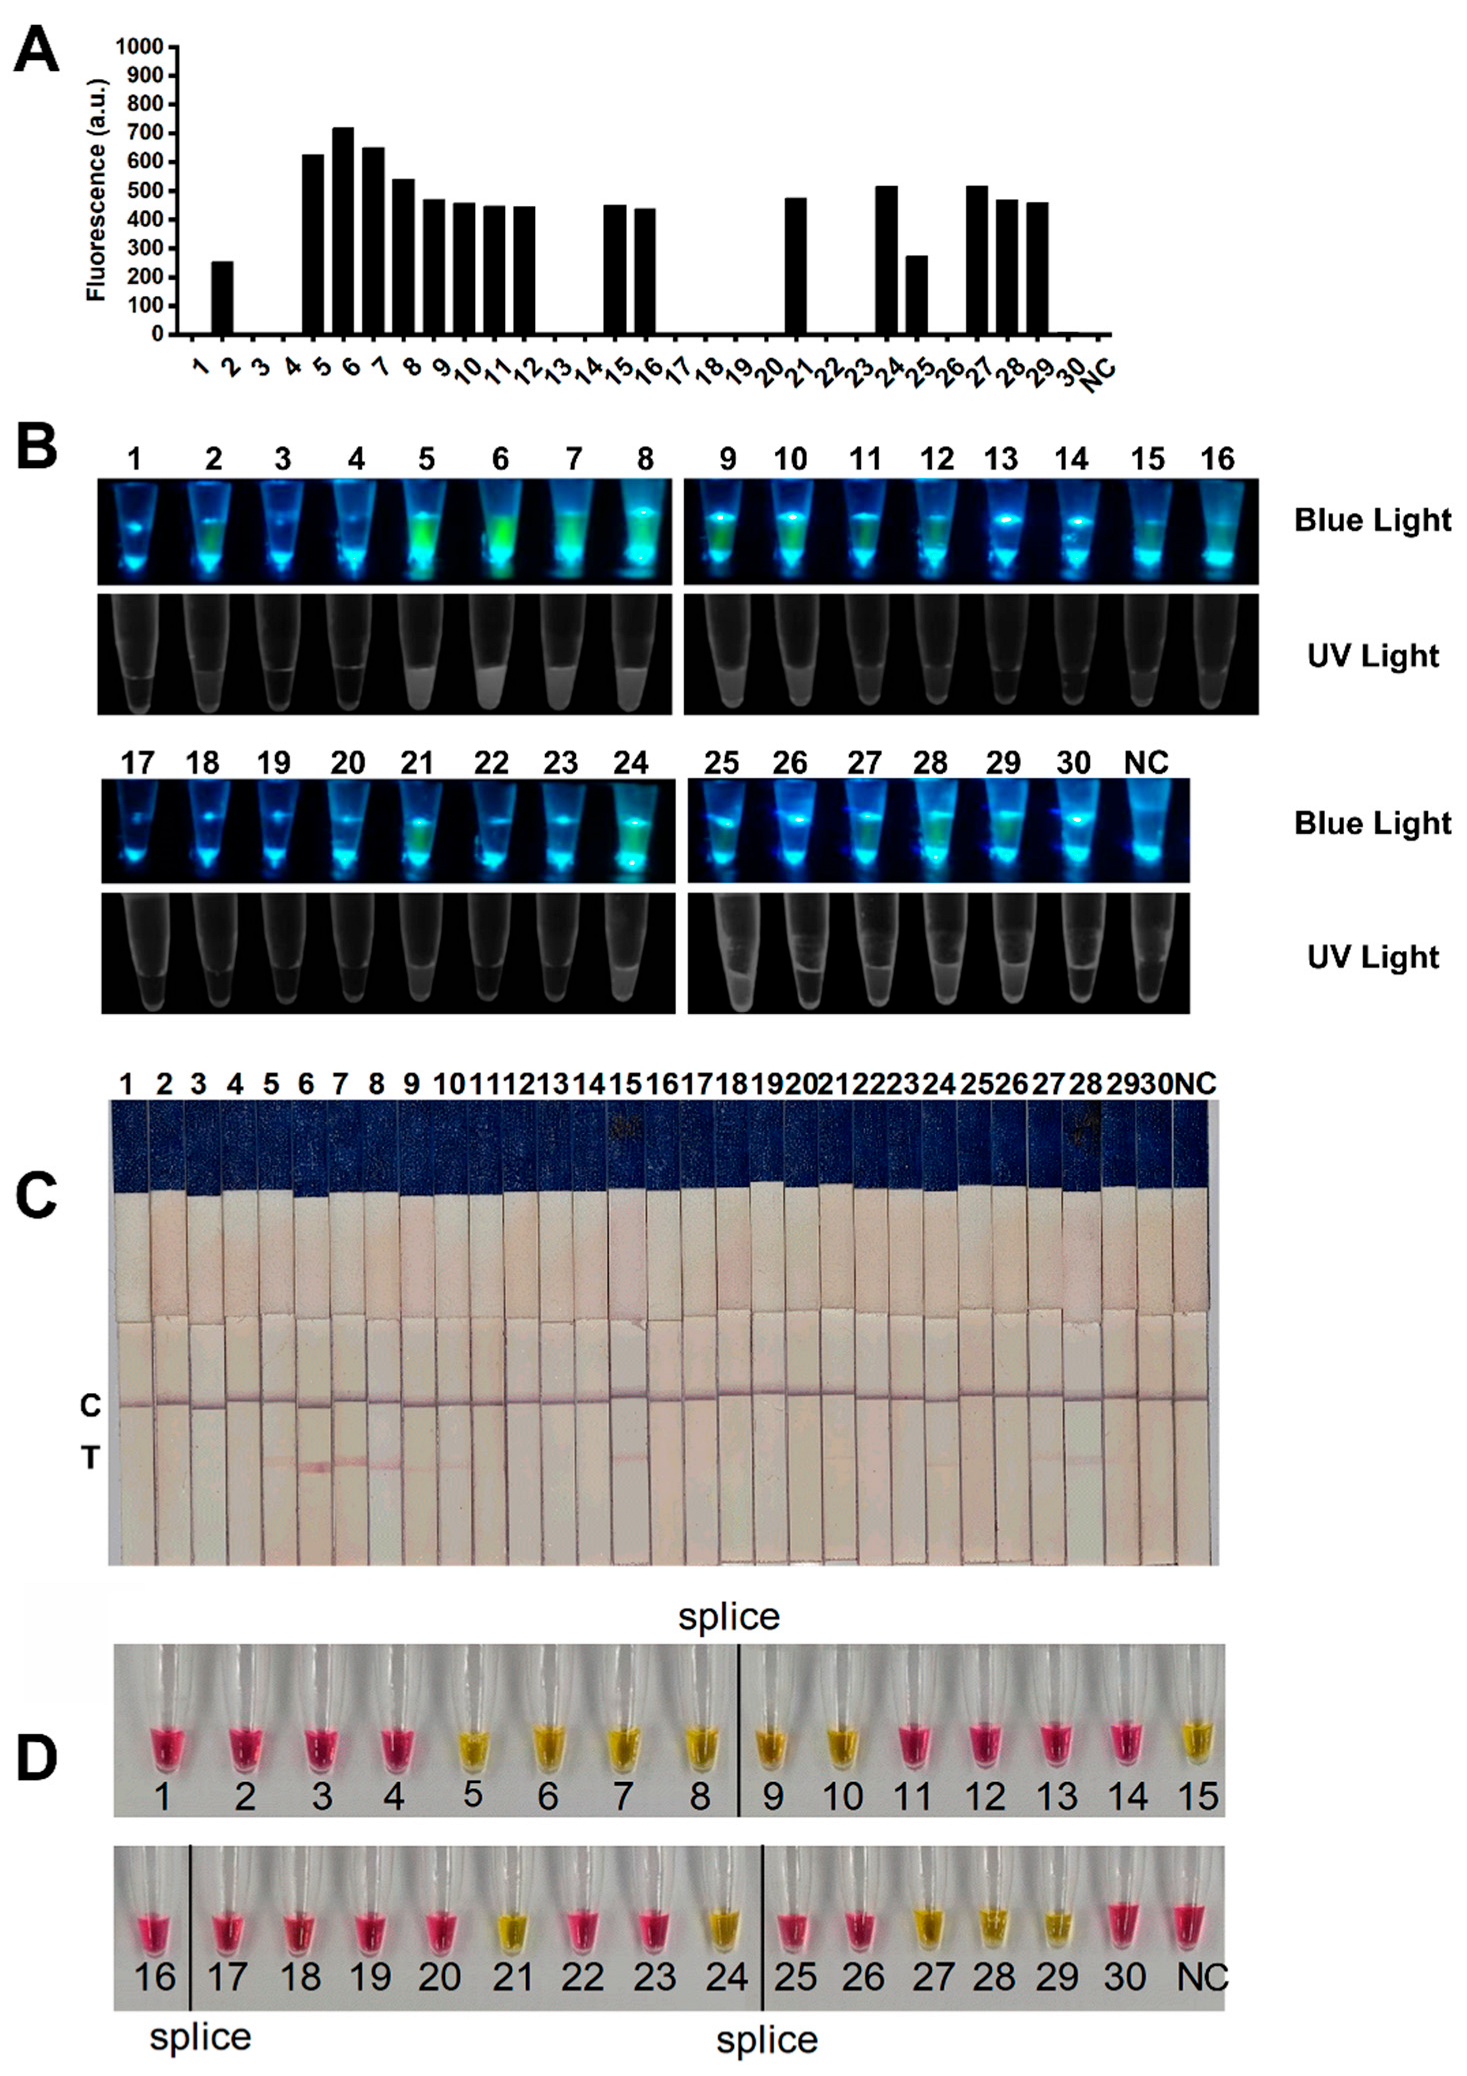
All three assays were applied to 30 increment core samples collected from A. georgei var. smithii, including 12 samples with visible internal decay and 18 apparently healthy samples. All three methods consistently detected F. subpinicola in the decayed samples, in agreement with results obtained by conventional isolation and identification, in which wood tissues were cultured to obtain fungal isolates and species identity was confirmed by sequencing of representative isolates from decayed samples (Figure 7).
Among the asymptomatic samples, fluorescent RAA detected positive signals in five samples, whereas RAA-LFD and LAMP did not detect any positives in these cases. The remaining asymptomatic samples were negative by all three methods. Sequencing of amplification products from the five fluorescent RAA-positive samples confirmed high sequence identity with the reference TEF1α sequence of F. subpinicola (Supplementary Figure S1), supporting that these signals represent true target DNA detection rather than non-specific amplification.
Taken together, these results indicate that all three assays reliably detect F. subpinicola in clearly decayed wood, while fluorescent RAA exhibits higher sensitivity and may enable detection of low-level or infections that might not be detectable by RAA-LFD or LAMP under the tested conditions. Across independent technical replicates, experimental runs, operators, and incubation devices, all assays produced fully concordant qualitative results, with consistent discrimination between positive and negative samples.

4. Discussion

Accurate and early detection of pathogens causing heart rot is critical for effective forest health management, particularly in ecologically fragile regions such as the southeastern Qinghai–Tibet Plateau [24,25]. In this study, three TEF1α-based isothermal amplification assays were developed for rapid detection of F. subpinicola, a major causal agent of heart rot in A. georgei var. smithii, and their performance was systematically evaluated [12]. To our knowledge, this study represents the first report of a molecular detection assay specifically developed for F. subpinicola following its recognition as a distinct species within the F. pinicola complex.
A major challenge addressed in this work is the taxonomic complexity of the F. pinicola species complex and its implications for diagnostic specificity. Because the primary objective of this study was to establish a rapid detection tool for the dominant pathogen population associated with heart rot of A. georgei var. smithii in the Sejila region, a validated local isolate was selected as the reference for target design. This approach prioritizes diagnostic relevance to the epidemiologically important population under investigation. Earlier diagnostics often targeted “F. pinicola” in a broad sense without accounting for cryptic diversity, which may lead to misidentification or cross-reactivity and compromise diagnostic accuracy [26]. We explicitly incorporated TEF1α sequences from multiple validated members of the complex, as well as closely related non-complex taxa, during primer/probe design. This strategy helped to minimize the risk of cross-amplification at the design stage and was supported by specificity testing, in which none of the non-target Fomitopsis species yielded amplification [23,24]. These results further support TEF1α as an effective marker for discriminating F. subpinicola, particularly because the selected target region contained sequence features unique to the target strain and absent from closely related taxa [22].
Marked differences in analytical sensitivity were observed among these three readout formats. Fluorescent RAA achieved the highest sensitivity, with an LOD near the ~10 copy level, whereas RAA-LFD and LAMP were one and two orders of magnitude less sensitive, respectively. This pattern is expected because real-time fluorescence detection can record low-level accumulation of amplification products at an early stage, whereas lateral-flow and colorimetric readouts require enough product to reach a visually detectable threshold [27,28]. Similar sensitivity hierarchies among isothermal technologies have been reported for other plant pathogens, reflecting intrinsic methodological differences rather than unreliability of any single technique [16]. In our hands, the optimized RAA and LAMP conditions could be run on multiple commonly available incubation devices, including a dry block thermostat, a conventional PCR thermal cycler, and a water bath, and all produced clear and consistent positive/negative results, suggesting that the assays are robust to variation in basic equipment. In addition, consistent qualitative results were obtained when selected assays were independently repeated by different operators.
The three visualization formats have different strengths and preferred application scenarios. Fluorescent RAA requires an optical device but provides the highest sensitivity and quantitative time-to-positive information. In this study, fluorescent signals could be read both as real-time curves on a laboratory real-time PCR instrument and as end-point fluorescence on a portable fluorescence reader or under blue/UV light, which makes this format suitable for early detection and for use in small laboratories that have access to basic fluorescence devices. By contrast, the RAA-LFD assay produces a simple yes/no result on a lateral-flow strip without the need for any instrumentation. This format is easy to interpret, can be performed by non-specialists, and is therefore attractive for on-site screening of many trees by field technicians. Colorimetric LAMP, as implemented here, uses a visible color change in a closed tube and only requires a constant-temperature heater, which makes it suitable for basic laboratories and small field stations where fluorescence readers and lateral-flow strips may not be available. Together, fluorescent RAA, RAA-LFD, and colorimetric LAMP provide a range of options that can be matched to different levels of equipment and expertise.
The choice of a colorimetric readout for LAMP rather than a fluorescent readout was deliberate. Colorimetric LAMP has been widely adopted in plant pathogen diagnostics because it is simple, low-cost, and allows direct visual discrimination between positive and negative reactions without specialized optics [17,18,29]. In addition, the closed-tube format reduces the risk of amplicon contamination compared with gel electrophoresis. However, the present study also revealed that pH-based colorimetric LAMP can be sensitive to the composition of the reaction solvent. We found that DEPC-treated water may not be suitable as the solvent or as the negative-control water in pH-based LAMP systems. A plausible explanation is that DEPC or its breakdown products alter the pH during heating, which triggers the pH indicator dye (such as phenol red) to change color even when no amplification occurs [27,29]. The disappearance of the false-positive signal after heating to 72 °C is consistent with this chemically driven background shift. We therefore recommend using verified nuclease-free water instead of DEPC-treated water in colorimetric LAMP assays to avoid such interference.
In field sample testing, all three methods consistently detected F. subpinicola in increment core samples exhibiting clear internal decay symptoms, and the results were consistent with those obtained by conventional isolation and identification, demonstrating the reliability of these methods in practical samples. Among visually asymptomatic samples, fluorescent RAA detected five additional positive samples, whereas no signals were obtained from these samples using RAA-LFD or LAMP. This discrepancy is consistent with the previously observed differences in analytical sensitivity among the three detection formats. As discussed above, fluorescent RAA can detect very low template copy numbers, whereas RAA-LFD and colorimetric LAMP require great product accumulation to produce a visible signal. To determine whether the fluorescent RAA signals represented true positives rather than non-specific amplification, the amplicons from these asymptomatic samples were sequenced. The obtained sequences showed high concordance with the reference TEF1α sequence of F. subpinicola, confirming amplification specificity. These findings suggest that the asymptomatic samples likely contained low-abundance target DNA below the detection thresholds of RAA-LFD and LAMP. Considering the prolonged and often concealed progression of heart rot in A. georgei var. smithii, these samples may represent early-stage or latent colonization with minimal and uneven pathogen biomass distributed within the wood tissue [30].
Although the present study demonstrated reliable detection performance using both cultured isolates and field-collected increment cores, potential inhibition effects associated with crude DNA extraction methods should be considered in practical applications. In particular, Chelex-based extraction, while rapid and convenient for field use, may co-extract wood-derived compounds such as phenolics, polysaccharides, or secondary metabolites that could partially inhibit amplification reactions under harsher field conditions. Although no obvious inhibition was observed in our controlled experiments, further evaluation under variable environmental conditions and using diverse sample matrices would help to better define the robustness limits of the assays.
The primers and probes were designed primarily based on TEF1α sequences available from validated F. subpinicola isolates collected from southeastern Tibet and related reference strains. While in silico comparisons included multiple members of the F. pinicola species complex, geographic variation in F. subpinicola populations beyond the current sampling range cannot be fully excluded. Therefore, broader validation across additional geographic regions and population backgrounds will be important to confirm the long-term universality and stability of the detection system. Moreover, comparison with other publicly available TEF1α sequences annotated as F. subpinicola indicates that intraspecific sequence variability may occur within this locus. Although the selected primer/probe region was suitable for the pathogen population examined in this study, further evaluation using geographically diverse isolates would help clarify the extent of sequence conservation within the species.
In terms of diagnostic workflow, the tools developed here are intended primarily for rapid screening and preliminary assessment rather than for definitive pathogen confirmation. For forest disease management, rapid on-site or near-site detection can be used to identify trees that are likely to be infected at an early stage and to guide targeted monitoring and sampling, even if laboratory confirmation by isolation or sequencing is still required for final diagnosis. In this context, fluorescent RAA is best suited for sensitive detection and confirmation in laboratory or semi-laboratory settings where a real-time PCR instrument or a portable fluorescence reader is available. RAA-LFD and colorimetric LAMP, although less sensitive, are highly accessible, instrument-free, and well suited for broad field surveys and initial screening of large numbers of trees by technical personnel. One practical approach is to use RAA-LFD or colorimetric LAMP as first-line screening tools and then apply fluorescent RAA or real-time PCR as confirmatory methods to selected samples that require higher diagnostic confidence. The present study focused on A. georgei var. smithii as the target host species. Validation of the developed assays across additional host tree species will be an important direction for future work, to further assess their robustness and broader applicability in forest ecosystems.
In summary, by integrating updated taxonomic understanding of the F. pinicola species complex with isothermal amplification technology, this study establishes a set of rapid, sensitive, and field-deployable molecular tools targeting F. subpinicola. Although formal large-scale inter-laboratory validation was beyond the scope of the present study, the observed consistency across independent runs, repetition by a second operator, and multiple detection devices supports the robustness of the assays for routine laboratory use and near-site field applications. Further validation across multiple laboratories and broader geographic sampling would strengthen the generalizability of these findings. These methods have strong potential for early surveillance of heart rot in subalpine A. georgei var. smithii forests on the Qinghai–Tibet Plateau and in similar forest ecosystems. More broadly, the workflow presented here may serve as a reference framework for developing rapid detection methods for other wood-decay fungi, thereby supporting pest surveys, forest health assessment, and evidence-based disease management decisions.


5. Conclusions

In this study, three rapid isothermal amplification assays targeting the TEF1α gene of F. subpinicola were developed and evaluated for the detection of this pathogen associated with heart rot in A. georgei var. smithii. The fluorescent RAA, RAA–LFD, and colorimetric LAMP assays demonstrated reliable performance using both cultured isolates and field-collected wood core samples.
These methods provide practical tools for rapid and field-applicable detection of F. subpinicola without the need for sophisticated laboratory infrastructure, making them suitable for forest health monitoring and routine screening of internal decay. By integrating updated taxonomic resolution within the F. pinicola species complex, this study enhances diagnostic specificity and contributes to the development of robust molecular tools for wood-decay fungi. The approaches developed here have the potential to support pathogen surveillance and evidence-based disease management in subalpine and remote forest ecosystems.

Supplementary Materials

The following supporting information can be downloaded at: https://www.mdpi.com/article/10.3390/f17040409/s1, Figure S1: Multiple sequence alignment of the TEF1α target region amplified from the reference strain FP0001 and five asymptomatic increment core samples that tested positive by fluorescent RAA. Identical nucleotides across all sequences are indicated by shading. Primer binding sites used for sequencing confirmation (FsTEF-Seq-F/R) are indicated; Table S1: Candidate RAA primer pairs designed for screening; Table S2: Candidate LAMP primer sets evaluated in this study; Table S3: Primers used for Sanger sequencing confirmation of fluorescent RAA–positive samples.

Author Contributions

Conceptualization, Y.K. and Y.W.; methodology, Y.K.; investigation, Y.K.; data analysis and curation, Y.K.; sample collection and resources, J.L. (Jieting Li), Y.L., J.L. (Jiangrong Li), and G.Z.; visualization, Y.K.; writing—original draft preparation, Y.K.; writing—review and editing, C.T., J.L. (Jiangrong Li), and Y.W.; project administration and funding acquisition, J.L. (Jiangrong Li) and Y.W. All authors have read and agreed to the published version of the manuscript.

Funding

This work was supported by Science and Technology Plan Projects of Xizang Autonomous Region, China (XZ202301JD0001G), the Fundamental Research Funds for the Central Universities (QNTD202510), Science and Technology Plan Projects of Linzhi, Xizang (SYQ2024-14), and the Key Laboratory of Forest Ecology on the Tibetan Plateau, Ministry of Education, Tibet Agricultural & Animal Husbandry University (XZA-JYBSYS-2023-32).

Data Availability Statement

The data supporting the findings of this study are included within the article and its Supplementary Materials. Further data are available from the corresponding authors upon reasonable request.

Conflicts of Interest

The authors declare that they have no conflict of interest.

References

  1. Schwarze, F.W. Wood decay under the microscope. Fungal Biol. Rev. 2007, 21, 133–170. [Google Scholar] [CrossRef]
  2. Palm-Hellenurm, K.; Baders, E.; Frelich, L.E.; Köster, K.; Metslaid, M.; Polyachenko, O.; Seedre, M.; Shorohova, E.; Stanturf, J.A.; Vodde, F.; et al. The fate of remnant trees after wind disturbances in boreal and temperate forests. Front. For. Glob. Change 2024, 7, 1405430. [Google Scholar] [CrossRef]
  3. Wu, J.; Chen, Q.; Yang, L.R.; Tang, C.; Wang, Y.L. Detection of pine wood nematodes by droplet digital PCR, qPCR, and RPA-LFA. Phytopathol. Res. 2025, 7, 71. [Google Scholar] [CrossRef]
  4. Liepiņš, J.; Jaunslaviete, I.; Liepiņš, K.; Jansone, L.; Matisons, R.; Lazdiņš, A.; Jansons, Ā. Effect of stem rot on wood basic density, carbon, and nitrogen content of living deciduous trees in hemiboreal forests. Silva Fenn. 2023, 57, 23040. [Google Scholar] [CrossRef]
  5. Honkaniemi, J.; Lehtonen, M.; Väisänen, H.; Peltola, H. Effects of wood decay by Heterobasidion annosum on the vulnerability of Norway spruce stands to wind damage: A mechanistic modelling approach. Can. J. For. Res. 2017, 47, 777–787. [Google Scholar] [CrossRef]
  6. Zhang, Y.; Guo, L.; Li, J.; Zhang, B.; Zhu, S.; Chen, G. Effect of heartwood rot on radial growth of Abies georgei var. smithii at Sejila Mountain. Chin. J. Appl. Ecol. 2024, 35, 2951–2958. [Google Scholar] [CrossRef]
  7. Soge, A.O.; Popoola, O.I.; Adetoyinbo, A.A. Detection of wood decay and cavities in living trees: A review. Can. J. For. Res. 2021, 51, 937–947. [Google Scholar] [CrossRef]
  8. Wang, X.; Liang, S.; Gan, Q.; Cai, B.; Liu, C. Current status and future perspectives of the diagnostic of plant bacterial pathogens. Front. Plant Sci. 2025, 16, 1547974. [Google Scholar] [CrossRef]
  9. Haight, J.-E.; Laursen, G.A.; Glaeser, J.A.; Taylor, D.L. Phylogeny of Fomitopsis pinicola: A species complex. Mycologia 2016, 108, 925–938. [Google Scholar] [CrossRef]
  10. Liu, S.; Han, M.L.; Xu, T.M.; Wang, Y.; Wu, D.M.; Cui, B.K. Taxonomy and Phylogeny of the Fomitopsis pinicola Complex with Descriptions of Six New Species from East Asia. Front. Microbiol. 2021, 12, 644979. [Google Scholar] [CrossRef]
  11. Liu, S.; Song, C.-G.; Xu, T.-M.; Ji, X.; Wu, D.-M.; Cui, B.-K. Species Diversity, Molecular Phylogeny, and Ecological Habits of Fomitopsis (Polyporales, Basidiomycota). Front. Microbiol. 2022, 13, 859411. [Google Scholar] [CrossRef]
  12. Li, J.; Li, Y.; Liu, Y.; Chen, G.; Zhang, Y.; Jiang, N.; Wang, Y.; Li, J. Identification of pathogenic fungus causing heart rot of Abies georgei var. smithii in southeastern Tibet and screening of its antagonistic Trichoderma strains. Mycosystema 2025, 44, 1–24. [Google Scholar] [CrossRef]
  13. Spirin, V.; Runnel, K.; Vlasák, J.; Viner, I.; Barrett, M.; Ryvarden, L.; Bernicchia, A.; Rivoire, B.; Ainsworth, A.; Grebenc, T. The genus Fomitopsis (Polyporales, Basidiomycota) reconsidered. Stud. Mycol. 2024, 107, 149–249. [Google Scholar] [CrossRef]
  14. Schrader, C.; Schielke, A.; Ellerbroek, L.; Johne, R. PCR inhibitors—Occurrence, properties and removal. J. Appl. Microbiol. 2012, 113, 1014–1026. [Google Scholar] [CrossRef] [PubMed]
  15. Piepenburg, O.; Williams, C.H.; Stemple, D.L.; Armes, N.A. DNA Detection Using Recombination Proteins. PLoS Biol. 2006, 4, e204. [Google Scholar] [CrossRef]
  16. Song, X.; Cao, Y.; Yan, F. Isothermal Nucleic Acid Amplification-Based Lateral Flow Testing for the Detection of Plant Viruses. Int. J. Mol. Sci. 2024, 25, 4237. [Google Scholar] [CrossRef]
  17. Ward, L.I.; Harper, S.J. Loop-Mediated Isothermal Amplification for the Detection of Plant Pathogens. In Plant DNA Fingerprinting and Barcoding: Methods and Protocols; Sucher, N.J., Hennell, J.R., Carles, M.C., Eds.; Humana Press: Totowa, NJ, USA, 2012; pp. 161–170. [Google Scholar]
  18. Notomi, T.; Okayama, H.; Masubuchi, H.; Yonekawa, T.; Watanabe, K.; Amino, N.; Hase, T. Loop-mediated isothermal amplification of DNA. Nucleic Acids Res. 2000, 28, E63. [Google Scholar] [CrossRef]
  19. Yuan, Y.; Bian, L.-S.; Wu, Y.-D.; Chen, J.-J.; Wu, F.; Liu, H.-G.; Zeng, G.-Y.; Dai, Y.-C. Species diversity of pathogenic wood-rotting fungi (Agaricomycetes, Basidiomycota) in China. Mycology 2023, 14, 204–226. [Google Scholar] [CrossRef]
  20. Schoch, C.L.; Seifert, K.A.; Huhndorf, S.; Robert, V.; Spouge, J.L.; Levesque, C.A.; Chen, W.; Consortium, F.B.; List, F.B.C.A.; Bolchacova, E.; et al. Nuclear ribosomal internal transcribed spacer (ITS) region as a universal DNA barcode marker for Fungi. Proc. Natl. Acad. Sci. USA 2012, 109, 6241–6246. [Google Scholar] [CrossRef] [PubMed]
  21. Lücking, R.; Aime, M.C.; Robbertse, B.; Miller, A.N.; Ariyawansa, H.A.; Aoki, T.; Cardinali, G.; Crous, P.W.; Druzhinina, I.S.; Geiser, D.M.; et al. Unambiguous identification of fungi: Where do we stand and how accurate and precise is fungal DNA barcoding? IMA Fungus 2020, 11, 14. [Google Scholar] [CrossRef]
  22. Stielow, J.B.; Levesque, C.A.; Seifert, K.A.; Meyer, W.; Irinyi, L.; Smits, D.; Renfurm, R.; Verkley, G.; Groenewald, M.; Chaduli, D. One fungus, which genes? Development and assessment of universal primers for potential secondary fungal DNA barcodes. Persoonia Mol. Phylogeny Evol. Fungi 2015, 35, 242–263. [Google Scholar] [CrossRef]
  23. Raja, H.A.; Miller, A.N.; Pearce, C.J.; Oberlies, N.H. Fungal Identification Using Molecular Tools: A Primer for the Natural Products Research Community. J. Nat. Prod. 2017, 80, 756–770. [Google Scholar] [CrossRef]
  24. Groth-Helms, D.; Rivera, Y.; Martin, F.N.; Arif, M.; Sharma, P.; Castlebury, L.A. Terminology and guidelines for diagnostic assay development and validation: Best practices for molecular tests. PhytoFrontiers 2023, 3, 23–35. [Google Scholar] [CrossRef]
  25. Sturrock, R.; Frankel, S.; Brown, A.; Hennon, P.; Kliejunas, J.; Lewis, K.; Worrall, J.; Woods, A. Climate change and forest diseases. Plant Pathol. 2011, 60, 133–149. [Google Scholar] [CrossRef]
  26. Haight, J.E.; Nakasone, K.K.; Laursen, G.A.; Redhead, S.A.; Taylor, D.L.; Glaeser, J.A. Fomitopsis mounceae and F. schrenkii-two new species from North America in the F. pinicola complex. Mycologia 2019, 111, 339–357. [Google Scholar] [CrossRef]
  27. Tanner, N.A.; Zhang, Y.; Evans, T.C., Jr. Visual Detection of Isothermal Nucleic Acid Amplification Using pH-Sensitive Dyes. Biotechniques 2015, 58, 59–68. [Google Scholar] [CrossRef] [PubMed]
  28. Strachan, S.; Bhuiyan, S.A.; Thompson, N.; Nguyen, N.T.; Ford, R.; Shiddiky, M.J.A. Latent potential of current plant diagnostics for detection of sugarcane diseases. Curr. Res. Biotechnol. 2022, 4, 475–492. [Google Scholar] [CrossRef]
  29. Dao Thi, V.L.; Herbst, K.; Boerner, K.; Meurer, M.; Kremer, L.P.M.; Kirrmaier, D.; Freistaedter, A.; Papagiannidis, D.; Galmozzi, C.; Stanifer, M.L.; et al. A colorimetric RT-LAMP assay and LAMP-sequencing for detecting SARS-CoV-2 RNA in clinical samples. Sci. Transl. Med. 2020, 12, eabc7075. [Google Scholar] [CrossRef] [PubMed]
  30. Haraguchi, R.; Hirao, T.; Yamada, T. Quantitative analyses of distribution of the heart rot fungus Serpula himantioides in living Chamaecyparis pisifera using real-time polymerase chain reaction. For. Pathol. 2024, 54, e12881. [Google Scholar] [CrossRef]
Figure 1. Multiple sequence alignment of TEF1α gene fragments from Fomitopsis subpinicola and representative species within and outside the Fomitopsis pinicola species complex. Arrows indicate the relative positions of the RAA primers, LAMP primers, and probes designed in this study on the TEF1α sequence. Dashes indicate true sequence gaps in non-target taxa.
Forests 17 00409 g001
Figure 2. Screening of RAA and LAMP primer sets for Fomitopsis subpinicola. (A) Agarose gel electrophoresis analysis of products generated by recombinase-aided amplification using nine candidate RAA primer pairs targeting the TEF1α region. Lanes 1–9 represent amplification products obtained using primer pairs RAA1–RAA9, respectively. (B) Specificity evaluation of the selected RAA primer pair FsTEF-RAA-F/R by recombinase-aided amplification followed by agarose gel electrophoresis using genomic DNA from F. subpinicola and representative non-target Fomitopsis species. (C) Colorimetric LAMP specificity test using the Fs-LAMP1 primer set with nuclease-free water at 65 °C for 30 min. (D) Colorimetric LAMP specificity test using the Fs-LAMP2 primer set with nuclease-free water at 65 °C for 30 min. M, 100 bp DNA marker; NC, no-template control; PC, kit-provided internal positive control. Abbreviations: F., Fomitopsis; Fu., Fusarium; G., Ganoderma; s.l., sensu lato; H., Heterobasidion.
Forests 17 00409 g002
Figure 3. Optimization of reaction conditions for fluorescent RAA and RAA-LFD. (A) Fluorescent RAA reactions with different magnesium acetate concentrations. (B) Fluorescent RAA reactions with different primer concentrations. (C) Fluorescent RAA reactions with different probe concentrations. (D) Fluorescent RAA reactions performed at different temperatures. (E) RAA-LFD reactions performed at different temperatures. (F) Effect of reaction time on RAA-LFD amplification at 37 °C. NC, no-template control; T, test line; C, control line.
Forests 17 00409 g003
Figure 4. Evaluation of colorimetric LAMP performance under different incubation times and water sources. (A,B) Colorimetric LAMP results for the panel of tested species using nuclease-free water, incubated at 65 °C for 30 min (A) or 35 min (B). These panels represent assays performed on different species, rather than time-course measurements on the same sample. (C) LAMP reactions using DEPC-treated water at 65 °C for 35 min. (D) LAMP reactions using DEPC-treated water at 72 °C for 35 min. NC, no-template control. Abbreviations: F., Fomitopsis; Fu., Fusarium; G., Ganoderma; s.l., sensu lato; H., Heterobasidion.
Forests 17 00409 g004
Figure 5. Analytical sensitivity of fluorescent RAA, RAA-LFD, and colorimetric LAMP assays. (A) Real-time fluorescence amplification curves of the fluorescent RAA assay obtained using a 10-fold serial dilution of the pMD19-T-TEF plasmid. (B) Quantitative comparison of fluorescent RAA signals. Fluorescence intensity measured at 25 min was extracted from the real-time amplification curves and used as the quantitative metric for statistical analysis. Data represent the mean ± SEM of three technical replicates (n = 3). Statistical significance was evaluated by one-way ANOVA followed by Tukey’s honestly significant difference (HSD) post hoc test. *** p < 0.001; n.s., p > 0.05. (C) Colorimetric LAMP detection using 10-fold serially diluted plasmid templates using nuclease-free water. (D) RAA-LFD detection using 10-fold serially diluted plasmid templates. NC, no-template control; T, test line; C, control line.
Forests 17 00409 g005
Figure 6. Analytical specificity of the three isothermal amplification assays. (A) Fluorescent RAA amplification curves obtained using genomic DNA from three independent Fomitopsis subpinicola, representative non-target fungal species, and the no-template control. (B) RAA-LFD results showing the responses of the test line (T) and control line (C) for DNA templates from the three F. subpinicola isolates and non-target fungi. (C) LAMP specificity results obtained using DNA templates from the three F. subpinicola isolates and non-target fungi. NC, no-template control. Abbreviations: F., Fomitopsis; Fu., Fusarium; G., Ganoderma; H., Heterobasidion; P., Porodaedalea; s.l., sensu lato.
Forests 17 00409 g006
Figure 7. Detection of Fomitopsis subpinicola in increment core samples from Abies georgei var. smithii. (A) Fluorescence signal output of fluorescent RAA measured on a real-time PCR instrument. (B) Fluorescence of RAA products visualized using a portable blue-light fluorescence reader and under ultraviolet (UV) illumination. (C) Results of RAA-LFD detection. (D) Results of colorimetric LAMP detection. Samples 1–30 represent individual increment core samples. NC, no-template control; T, test line; C, control line.
Forests 17 00409 g007
Table 1. Fungal strains and DNA materials used for analytical specificity testing.
Fungal NameStrain/Sample IDMaterial TypeHost/SubstrateSource/ReferencePurpose in This Study
Fomitopsis subpinicolaFP0001Living cultureAbies georgei var. smithii (heartwood)[12]Target strain (assay validation)
Fomitopsis subpinicolaFsp-01Living cultureAbies georgei var. smithii (heartwood)This studyTarget strain (assay validation)
Fomitopsis subpinicolaFsp-02Living cultureAbies georgei var. smithii (heartwood)This studyTarget strain (assay validation)
Fomitopsis cupreoroseaCFCC 89189Living cultureWoodCGMCCNon-target (specificity)
Fomitopsis cajanderiCFCC 80992Living cultureWoodCGMCCNon-target (specificity)
Fomitopsis dickinsiiCFCC 89076Living cultureWoodCGMCCNon-target (specificity)
Heterobasidion annosumCFCC 5374Living cultureWoodCGMCCNon-target (specificity)
Fomitopsis roseaCFCC 5377 Living cultureWoodCGMCCNon-target (specificity)
Fomitopsis betulinaCFCC 51045Living cultureWoodCGMCCNon-target (specificity)
Fusarium oxysporumCFCC 52208Living culturePlant-associated (soil-borne)CGMCCNon-target (specificity)
Ganoderma applanatum sensu latoCFCC 81000Living cultureWoodCGMCCNon-target (specificity)
Porodaedalea alpicolaPA-AG-01BasidiocarpLiving Abies georgei var. smithii (heartwood)Field-collected (this study)Non-target (specificity)
Heterobasidion linzhienseRR-AG-01BasidiocarpDecaying Abies georgei var. smithii (fallen stem and basal wood)Field-collected (this study)Non-target (specificity)
Table 2. TEF1α sequences used for multiple sequence alignment and primer/probe design.
SpeciesComplex StatusDatabaseAccession NumberApplication
Fomitopsis subpinicolaFomitopsis pinicola complexNMDCNMDCN00099HTAlignment & primer design
Fomitopsis abieticolaFomitopsis pinicola complexGenBankMN161746.1Alignment
Fomitopsis hengduanensisFomitopsis pinicola complexGenBankMN161748.1Alignment
Fomitopsis kesiyaeFomitopsis pinicola complexGenBankMN161750.1Alignment
Fomitopsis massonianaFomitopsis pinicola complexGenBankMN161754.1Alignment
Fomitopsis tianshanensisFomitopsis pinicola complexGenBankMN161777.1Alignment
Fomitopsis mounceaeFomitopsis pinicola complexGenBankMN161758.1Alignment
Fomitopsis ochraceaFomitopsis pinicola complexGenBankMN161761.1Alignment
Fomitopsis schrenkiiFomitopsis pinicola complexGenBankMN161763.1Alignment
Fomitopsis palustrisFomitopsis pinicola complexGenBankKR610688.1Alignment
Fomitopsis nivosaFomitopsis pinicola complexGenBankKR610686.1Alignment
Fomitopsis cajanderiOutside complexGenBankKR610664.1Alignment
Fomitopsis dickinsiiOutside complexGenBankKR610713.1Alignment
Fomitopsis roseaOutside complexGenBankKR610694.1Alignment
Note: Sequences listed in this table were used exclusively for in silico multiple sequence alignment and primer/probe placement and were not necessarily included in wet-lab specificity testing.
Table 3. Sequences of primers and probes used in the final isothermal detection assays developed in this study.
Primer/ProbeSequence (5′-)Modification/LabelPurpose (Expected Product Size)
PF GGTACTGGTGAGTTCGAGGCTEF1α amplification for plasmid construction
PRAGGAGGGTCTTGCCCTTGAC
FsTEF-RAA-FCCATCAATTTTCATGTTGCTGATGCGCTTTGCRAA forward primer (197 bp)
FsTEF-RAA-RTGCCGCTGACCATCTGCAACACTTACTTGACA–/5′-BiotinRAA reverse primer (197 bp); biotin-labeled version used for RAA-LFD
FsTEF-RAA-exoProbeTCAAGAAGGTCGGATACAACCCGAAGGCTG/i6FAM-dT/THF(dSp)/iBHQ1-dT/CCTTCGTCCCCATCT-SpC3FAM–THF–BHQ1, 3′ C3Fluorescent RAA (exo) probe
FsTEF-RAA-LFD-probe/i6FAM/TCAAGAAGGTCGGATACAACCCGAAGGCTGT/THF(dSp)/TCCTTCGTCC
CCATCT-SpC3
5′ FAM, THF, 3′ C3Probe for RAA-LFD
Fs-LAMP1-F3CATGTTGCTGATGCGCTTTGLAMP outer primer
Fs-LAMP1-B3ACGGAGCGCATATAATGAGGLAMP outer primer
Fs-LAMP1-FIPGCCTTCGGGTTGTATCCGACCTGGAGCGAGGACCGTTTCF1c–F2LAMP inner primer
Fs-LAMP1-BIPTGTCTCCTTCGTCCCCATCTCTGCTGACCATCTGCAACACTTB1c–B2LAMP inner primer
Fs-LAMP1-LFTTCTTGATGAAGGTGGACGTCTCLAMP loop primer
Fs-LAMP1-LBACAACATGTTGGAGGAGTCTGTCLAMP loop primer
Note: A 5′-biotin-labeled version of FsTEF-RAA-R was used in the RAA-LFD assay. “–” indicates not applicable.
Disclaimer/Publisher’s Note: The statements, opinions and data contained in all publications are solely those of the individual author(s) and contributor(s) and not of MDPI and/or the editor(s). MDPI and/or the editor(s) disclaim responsibility for any injury to people or property resulting from any ideas, methods, instructions or products referred to in the content.