Article

An Anisotropic Bilinear Cohesive Zone-Based Damage Evolution Model with Experimentally Calibrated Parameters for Mode I Cracking in Chinese Fir

1
School of Mechanical and Electrical Engineering, Beijing Institute of Graphic Communication, Beijing 102600, China
2
School of Technology, Beijing Forestry University, Beijing 100083, China
*
Author to whom correspondence should be addressed.
Forests 2026, 17(3), 351; https://doi.org/10.3390/f17030351
Submission received: 29 January 2026 / Revised: 22 February 2026 / Accepted: 7 March 2026 / Published: 11 March 2026
(This article belongs to the Section Wood Science and Forest Products)

Abstract

This study investigates the crack damage evolution in Chinese fir using an anisotropic bilinear cohesive zone-based constitutive model. The crack initiation and propagation processes were numerically modeled and simulated, and the results were validated through double cantilever beam (DCB) fracture tests. By exploiting the bijective relationship between the equivalent linear elastic fracture mechanics (LEFM) resistance curve (R-curve) and the cohesive softening law, the bilinear cohesive parameters were inversely identified from experimental data. The simulation results show good agreement with experimental observations in terms of crack path, propagation rate, and failure mode. The accuracy of the maximum load simulation results for mode I fracture of wood beams is 96.8%. These results further demonstrate the accuracy and applicability of the proposed cohesive zone model in describing crack propagation behavior in Chinese fir and provide a reliable theoretical and numerical framework for predicting fracture performance in timber structures.

1. Introduction

Historic timber buildings constitute an essential component of forest-based cultural heritage, particularly traditional Chinese wooden structures characterized by mortise-and-tenon systems and hierarchical load-transfer mechanisms. Chinese fir (Cunninghamia lanceolata) is one of the most widely planted and utilized timber species in China, extensively applied in both historical architecture and modern timber engineering. Due to its natural anisotropy and biological origin, timber is sensitive to environmental fluctuations, long-term mechanical loading, and aging effects, which frequently lead to crack initiation and progressive fracture [1,2,3]. Such crack development compromises structural performance and durability, posing challenges for sustainable forest resource utilization and heritage conservation [4,5].
Non-destructive testing (NDT) technologies have been widely adopted for the evaluation of timber structures, providing important support for forest-based construction systems [6,7]. Techniques such as ultrasonic testing [8], X-ray imaging [9], infrared thermography [10], electromagnetic induction [11], and acoustic emission monitoring [12,13] enable effective detection of internal defects and degradation. These methods significantly improve structural assessment efficiency and safety without damaging timber components and have been increasingly applied to service-life evaluation and maintenance of wooden structures [14,15,16]. However, while NDT methods can identify existing defects, they offer limited capability in predicting fracture evolution and crack resistance development. Fracture mechanics provides a theoretical framework for understanding crack propagation in wood. Linear Elastic Fracture Mechanics (LEFM) has been used to evaluate macroscopic crack behavior [17], yet it does not explicitly account for the nonlinear fracture process zone (FPZ) that forms ahead of the crack tip [18,19]. In wood materials, microcracking, cell wall damage, and fiber bridging significantly influence crack growth resistance. Therefore, LEFM alone cannot fully capture the rising resistance (R-) curve behavior typically observed in timber.
Cohesive zone models (CZM), based on traction–separation relationships, provide an effective approach to describe progressive damage within the FPZ [20,21,22]. Such models have been applied to fracture analysis of concrete, rock, welded joints, and railway structures [23,24,25,26] and further extended to various material systems [27,28,29,30,31,32,33]. Advanced numerical formulations, including phase-field cohesive models [34,35] and discontinuous Galerkin approaches [36], have enhanced computational stability. For orthotropic materials such as wood, hybrid cohesive and multi-phase field models have been developed to better represent anisotropic fracture behavior [37]. Experimental studies have evaluated R-curves and cohesive laws in different wood species [38,39], and adaptive cohesive models have been proposed for cyclic fracture simulations [40,41,42]. Despite these developments, cohesive parameter identification for plantation timber species such as Chinese fir remains insufficiently standardized. In many studies, parameters are obtained through direct fitting of load–displacement curves, while the physical linkage between experimentally measured R-curves and cohesive softening parameters is not systematically established. Furthermore, the relative contributions of microcracking and fiber-bridging mechanisms are often discussed qualitatively rather than quantified, limiting the reproducibility and practical application of cohesive modeling in timber engineering.
To address these issues, this study develops an integrated experimental–numerical calibration framework for Mode I fracture in Chinese fir. Double Cantilever Beam (DCB) tests are conducted to determine equivalent crack lengths and R-curves based on LEFM principles [36,37]. A bijective relationship between the R-curve and a bilinear cohesive softening law is established [38], enabling inverse identification of cohesive parameters with explicit physical interpretation. The calibrated model is implemented in ABAQUS (Version 6.14, Dassault Systèmes Simulia Corp., Providence, RI, USA) using a VUMAT subroutine to embed a zero-thickness cohesive formulation within continuum elements, allowing simulation of crack initiation and propagation in Chinese fir beams [39,40]. The simulation results show good agreement with experimental observations, and the applicability of cohesive modeling for plantation timber fracture behavior is further validated [41,42]. By systematically linking R-curve characterization, cohesive parameter inversion, and finite element implementation, this study provides a reproducible methodology for fracture parameter determination in Chinese fir. The findings contribute to improved prediction of fracture performance in plantation timber and support the sustainable utilization and structural reliability of forest-based materials.

2. Cohesive Zone Model and Damage Evolution

2.1. Cohesive Bilinear Softening Constitutive Model and Key Parameters

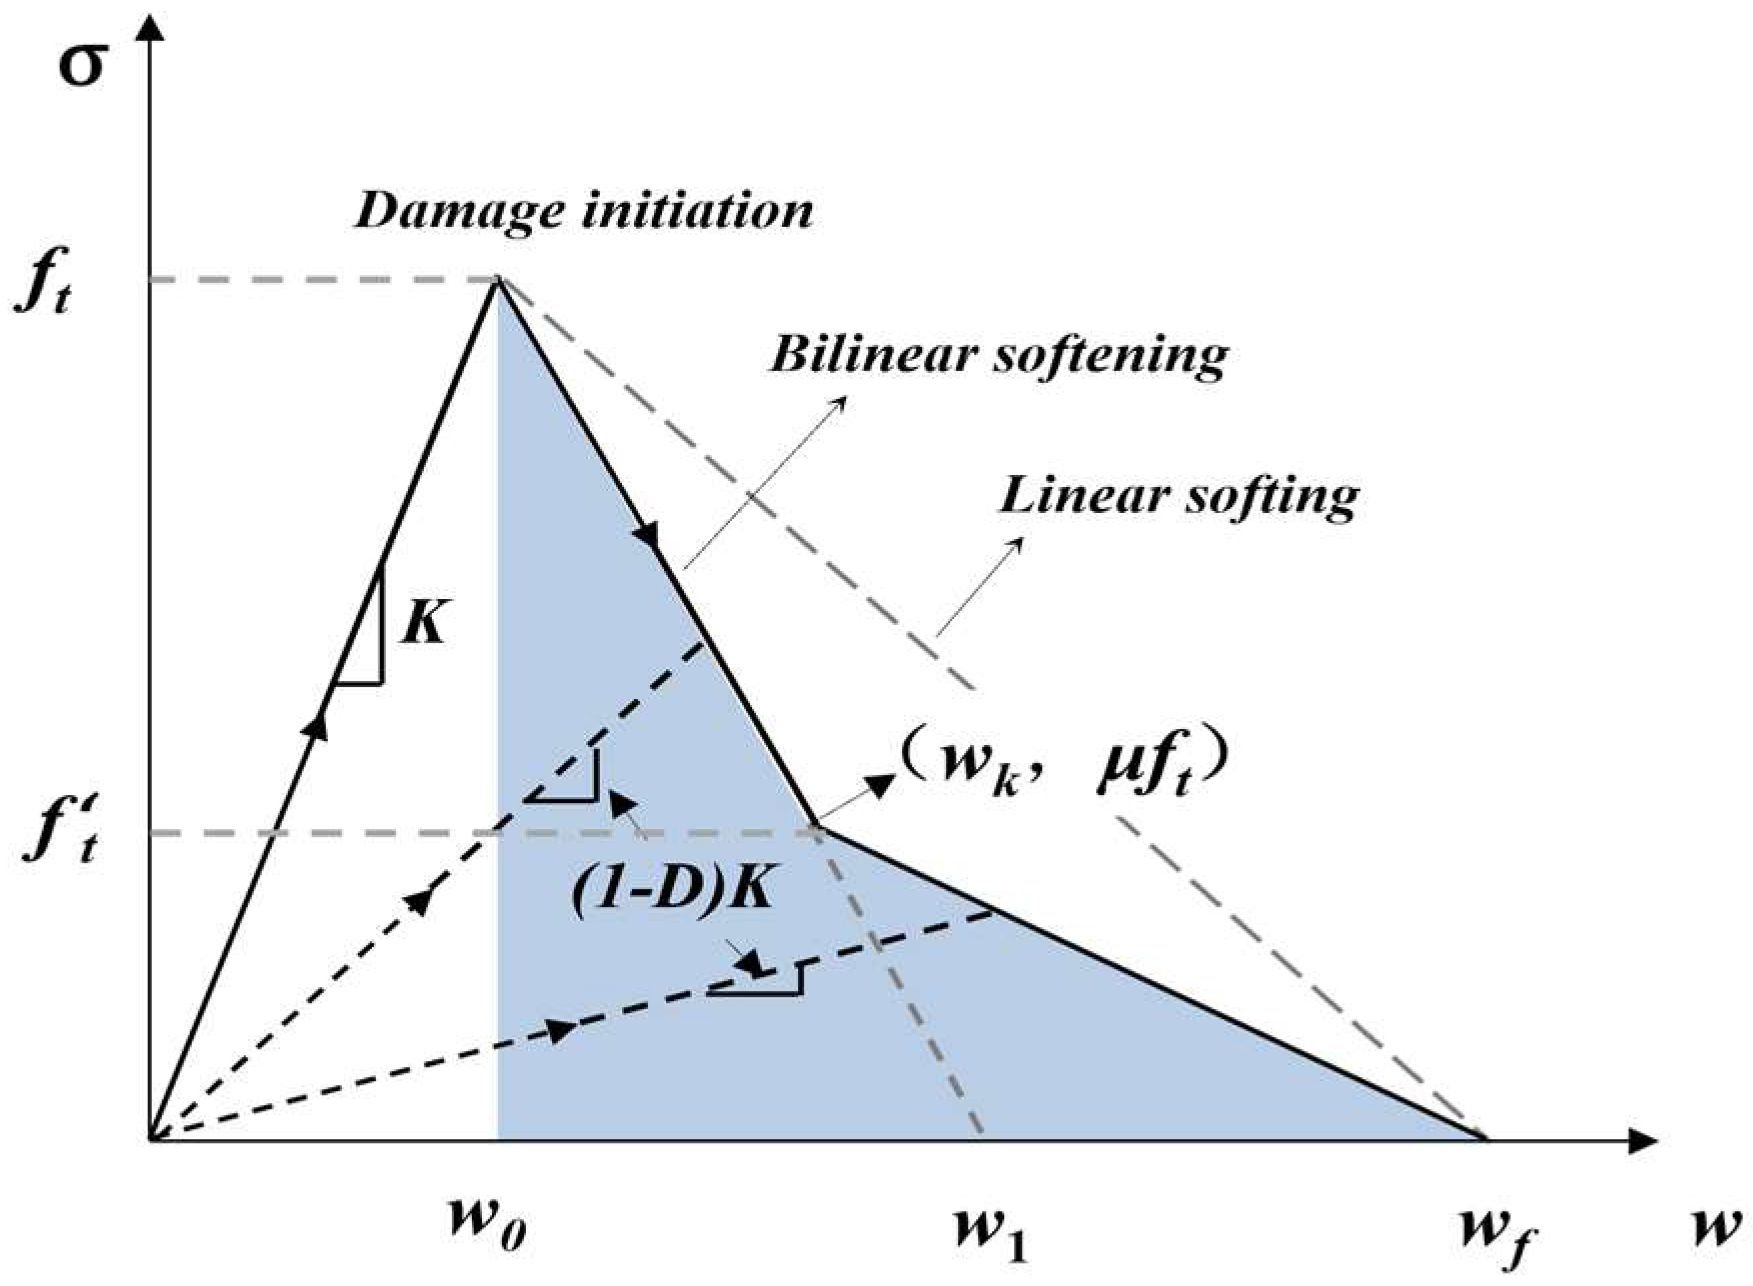
Timber and similar quasi-brittle engineering materials exhibit distinctive nonlinear damage zones preceding crack advancement fronts during mechanical failure processes. These damage regions encompass complex energy dissipation mechanisms involving coupled failure modes including matrix microcracking, fiber pullout, and interfacial delamination phenomena. Addressing such material characteristics, cohesive force modeling introduces traction-separation relationships to describe progressive interfacial failure behavior, establishing theoretical foundations for quasi-brittle fracture analysis. Compared to conventional linear elastic fracture mechanics, this methodology more accurately captures mechanical response characteristics during material softening phases [43,44,45]. Existing studies have shown that a bilinear or concave softening law is essential for capturing the post-peak behavior of materials like concrete, rock, and timber. As illustrated in Figure 1, the bilinear softening law represents two distinct softening stages, each governed by different toughening mechanisms. To accurately describe the fracture behavior of wood, this study develops a bilinear cohesive model for Cunninghamia lanceolata (Chinese fir), with key parameters identified through calibration. The proposed model provides a practical basis for simulating damage evolution in wood structures under tensile loading.
The cohesive zone methodology conceptualizes interfacial failure through a traction-separation constitutive relationship governing progressive debonding processes. In longitudinal wood fracture, damage evolution mechanisms are represented by stress-displacement functions where interfacial traction diminishes as separation increases. This constitutive behavior, characterized by σ = f(w), captures the gradual loss of load-carrying capacity during crack propagation processes. The proposed framework employs zero-thickness interface elements to simulate transitions from intact material to complete separation, enabling accurate prediction of energy dissipation throughout fracture processes [46,47]. According to the cohesive stress-crack opening displacement relationship during the fracture process shown in Figure 1, when the crack opening displacement extends from w to w0, the cohesive stress reaches its peak value ft, at which point damage response begins at the interface. As the energy consumed by crack propagation reaches the material’s fracture energy GF (i.e., the area of the shaded region in the figure, with opening displacement wf), the interface completely fails and no longer transmits stress. D represents the average damage at the intersection of the crack surface and the crack element edge, with an initial value of 0. Compared to the linear softening curve, the bilinear softening curve adds an inflection point, where the displacement value is denoted by wk and the stress ratio by μ. In ABAQUS, the implementation of the bilinear softening constitutive model requires the introduction of a damage variable D, which is updated in each incremental step through the separation displacement w. This value evolves from 0 to 1 along the cohesive bilinear softening curve after damage initiation.
Assuming that the traction-separation behavior during the entire loading process satisfies a bilinear softening relationship, the correlation between damage variable D and separation displacement w can be expressed according to Equations (1) and (3). For the first stage of damage evolution, the damage variable D1 is defined as:
D 1 ( w ) = w 1 ( w w 0 ) w ( w 1 w 0 ) ,     w 0 < w < w k
From the damage variable, the equivalent cohesive force on the crack surface can be obtained as:
f t = ( 1 D 1 ) f t , f t 0 f t , o t h e r ( n o   d a m a g e   t o   c o m p r e s s i v e   s t i f f i n e s s )
Stage 2 of Damage Evolution:
D 2 ( w ) = 1 μ f t ( w f w ) K w ( w f w k ) ,     w k < w < w f d y d x
f t = ( 1 D 2 ) f t
where K represents the initial stiffness of the material.
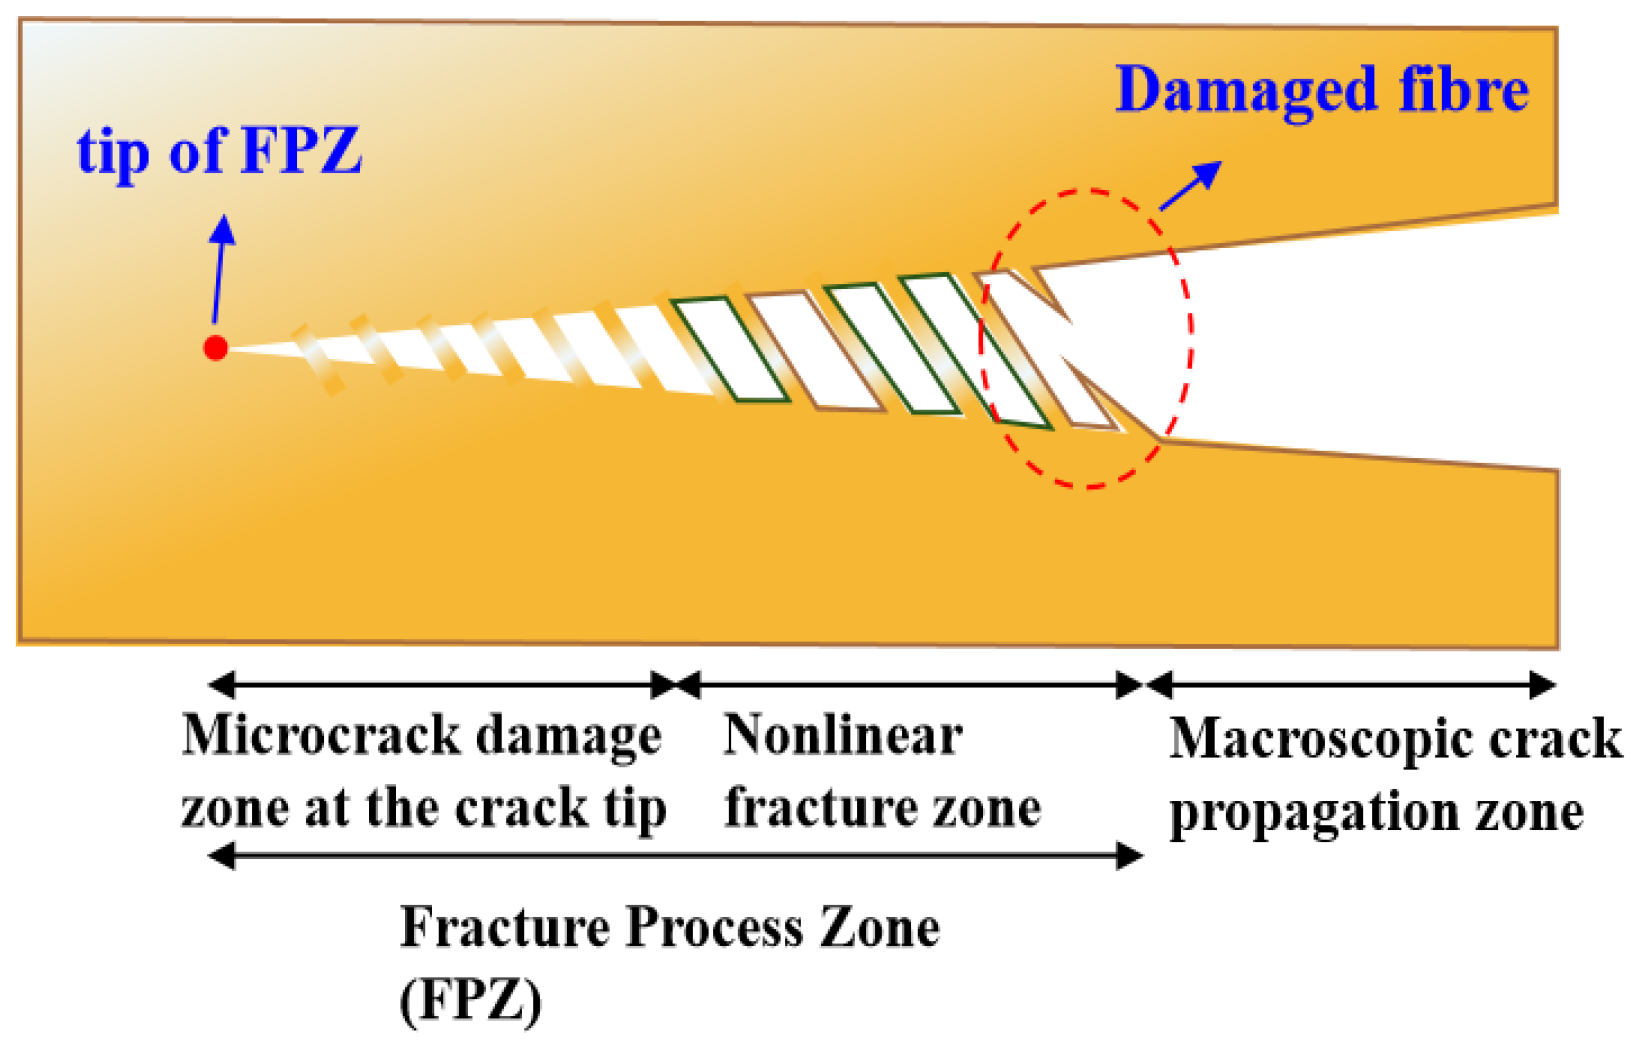
Figure 2 depicts the progressive evolution of crack damage in wood. During crack initiation, a Fracture Process Zone (FPZ) containing numerous microcracks forms ahead of the crack tip. These microcracks constitute the delamination front, with microcrack damage preceding this front. Coalescence of existing microcracks generates macroscopic cracks that subsequently propagate. During propagation, fiber bridging occurs in weakened regions behind the crack tip, gradually diminishing as fracture surfaces separate completely, with fibers deteriorating until ultimate failure. In solid wood and wood-based composites, this bridging mechanism dissipates energy, significantly influencing fracture properties. To elucidate the effects of microcrack damage and bridging on the wood fracture process, a bilinear model was adopted to approximate the softening characteristics based on relevant literature.
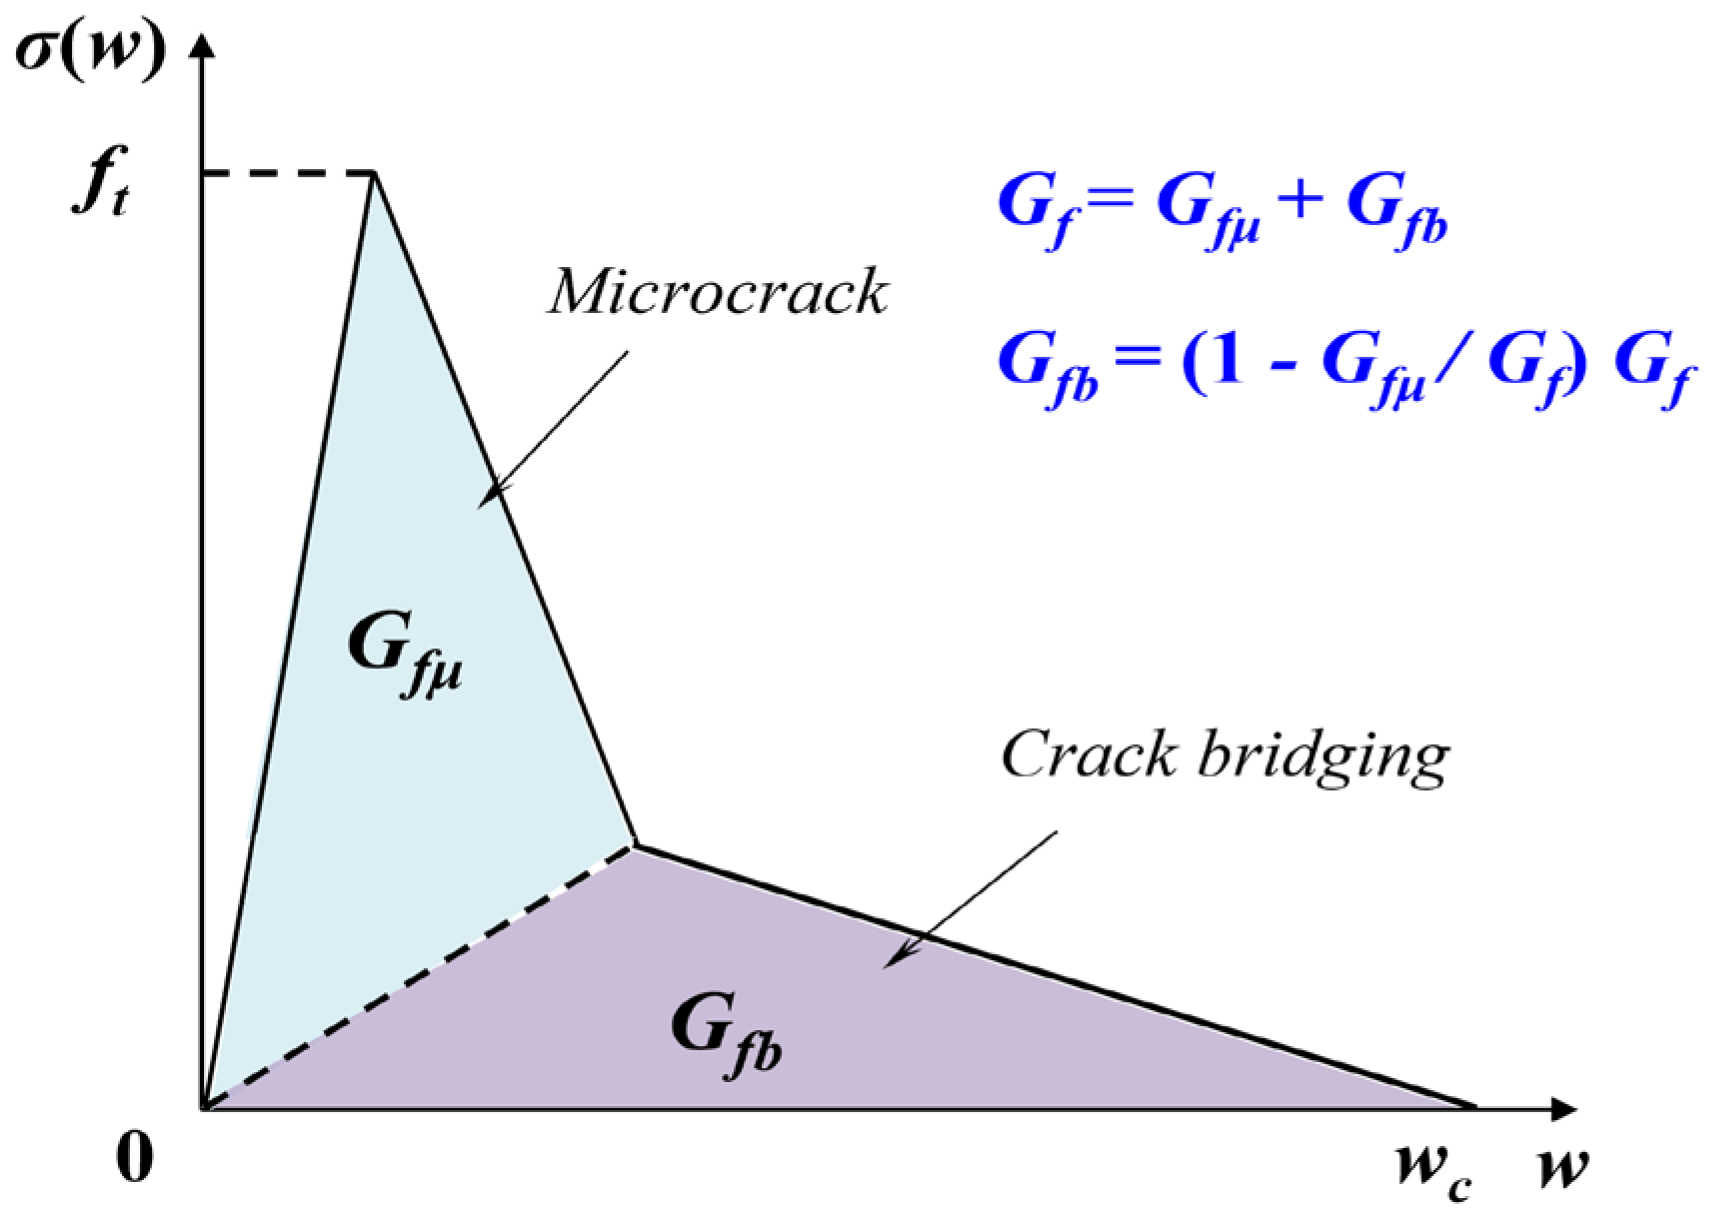
Figure 3 depicts the bilinear softening relationship utilized in the cohesive zone modeling of wood. The total cohesive fracture energy Gf, represented by the area enclosed by the stress-displacement relationship, can be decomposed into two components: energy G attributed to microcracking processes and energy Gfb related to fiber bridging mechanisms. Cohesive zone activation occurs when the normal stress σ attains the tensile strength ft, initiating interface separation while maintaining stress transmission across crack surfaces. As the separation displacement w increases, the transmitted normal stress progressively diminishes until it vanishes at the critical displacement wc (σ = f(wc) = 0). The integrated area beneath the stress-displacement curve defines the cohesive fracture energy Gf, which quantifies the energy expenditure required for complete interface decohesion per unit crack area.
In this study, the four key parameters defining the bilinear softening curve are:
a. Total fracture energy Gf representing the area beneath the complete traction-separation curve
b. Energy partitioning coefficient φ quantifying the relative contribution of microscale damage versus fiber bridging mechanisms
c. Ultimate separation displacement wc (mm) corresponding to complete interface failure
d. Peak interfacial strength ft (MPa) marking damage initiation.
These parameters collectively define material resistance to crack propagation characteristics and provide foundations for finite element implementation through user-defined subroutines.
Figure 3 demonstrates that the cohesive energy Gf equals the combined contributions of G and Gfb, yielding Gf = G + Gfb. Despite lacking explicit quantitative evidence, prior studies propose that the pronounced initial drop in the softening behavior stems from microcrack evolution, while bridging effects control the subsequent gentle decline [34,35]. Accordingly, G and Gfb may be viewed as energy dissipations linked to microcracking and bridging mechanisms, respectively, acknowledging that such division represents a pragmatic idealization rather than a unique physical separation. This dual-component representation of fracture energy Gf obviates the requirement to specify the kink point coordinates (wk, μft) at the bilinear junction in Figure 1, enabling energy distribution characterization via the single non-dimensional parameter φ = G/Gf.

2.2. Relationship Between Resistance R-Curve and Bilinear Cohesive Parameters

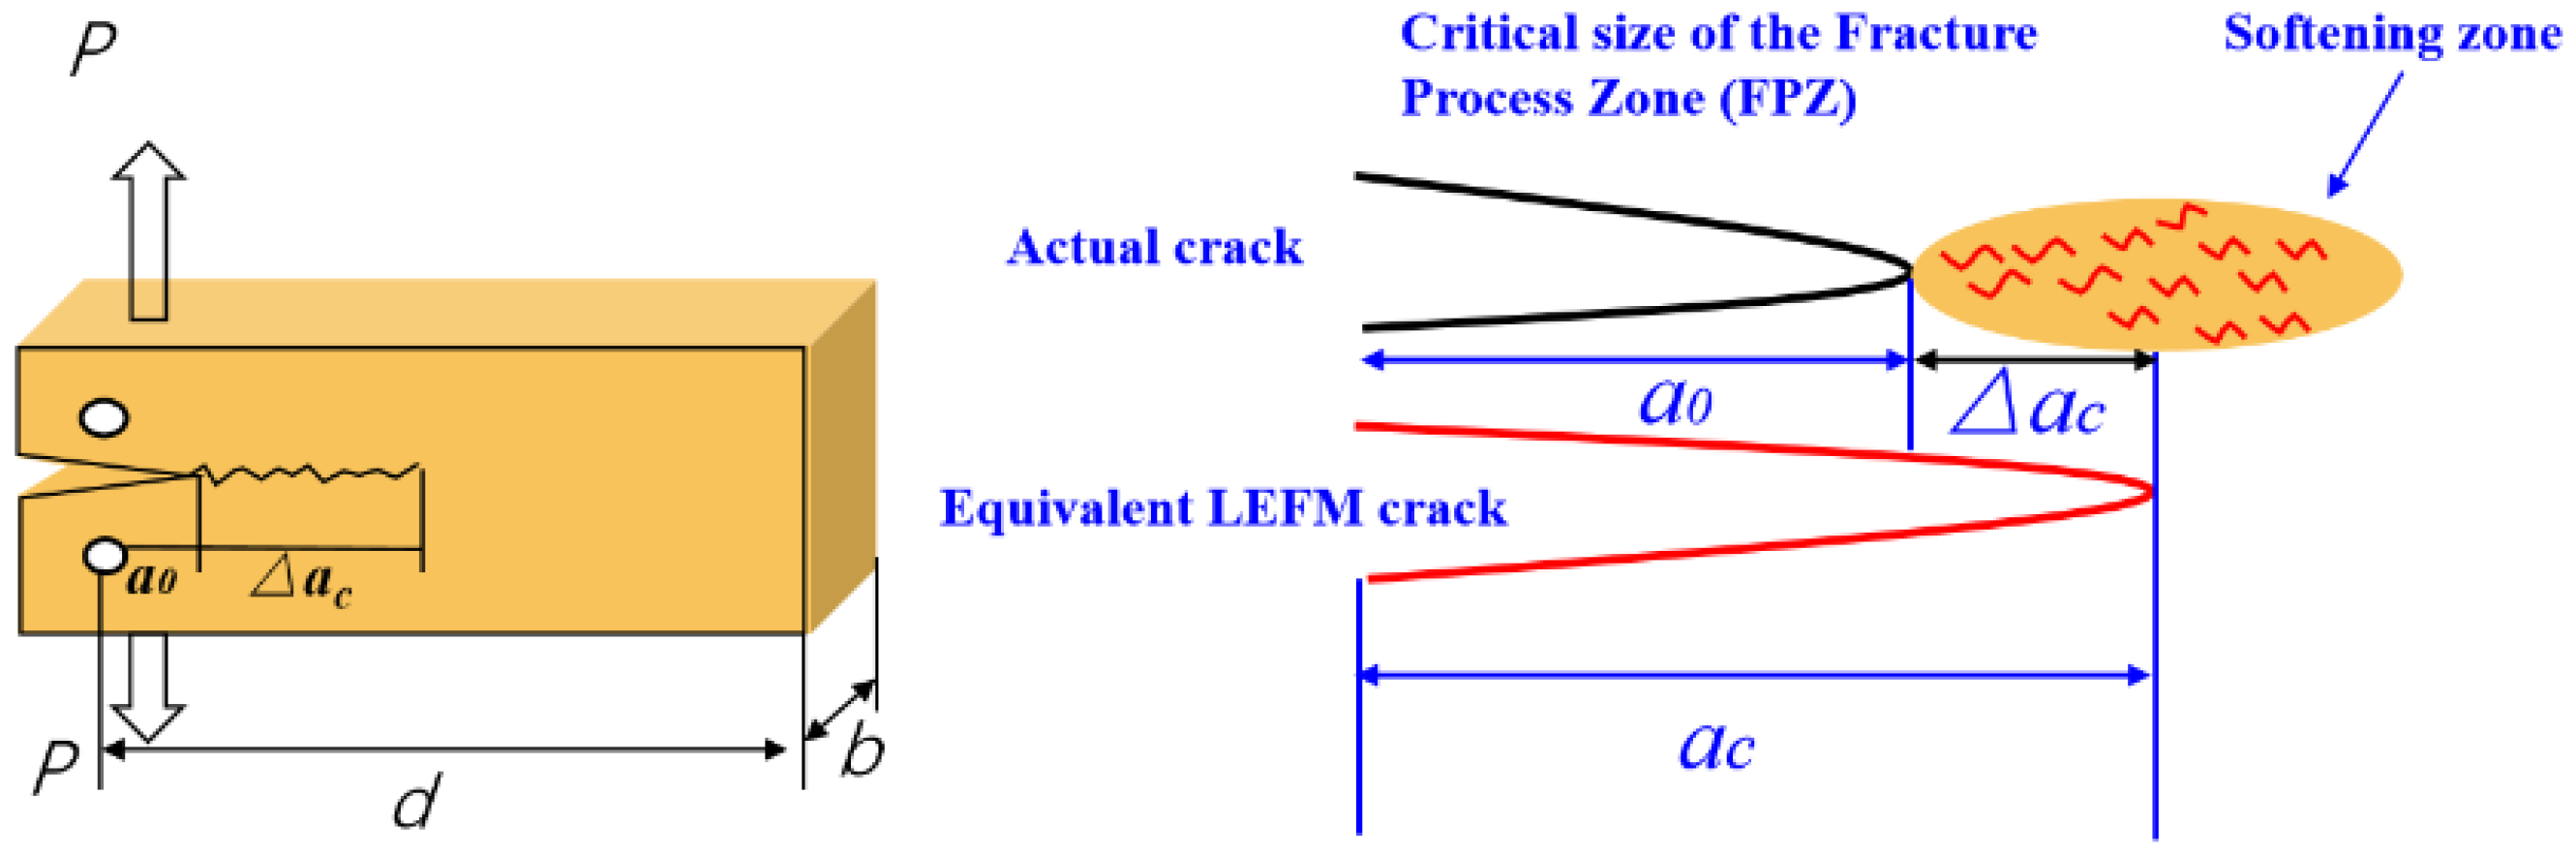
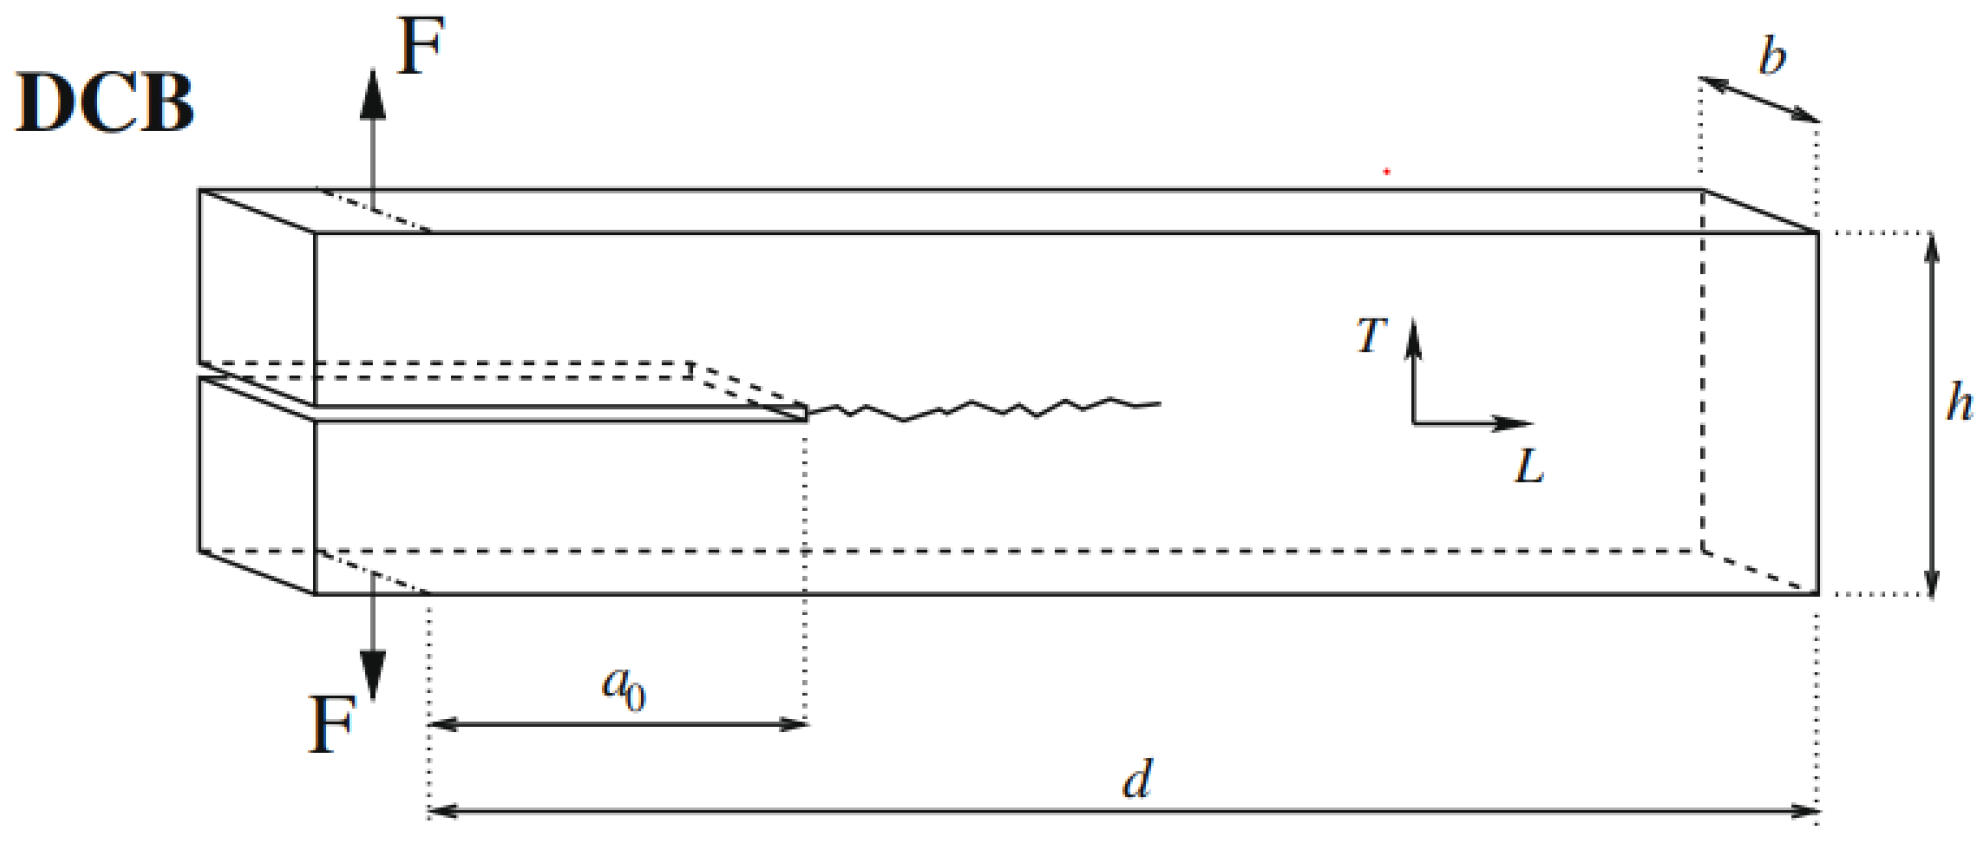
Figure 4 illustrates that crack advancement in wood’s longitudinal (L) direction involves dual mechanisms conceptually linked to microcrack formation and fiber bridging processes [48]. The presence of bridging phenomena prevents direct application of conventional Linear Elastic Fracture Mechanics (LEFM) to wood’s quasi-brittle fracture behavior. Consequently, an “equivalent LEFM” framework has been developed to effectively characterize fracture properties [49]. A key element in this approach is the equivalent elastic crack length a, whose tip position extends beyond the Fracture Process Zone (FPZ) origin by a distance ac = a0 + Δac, with a0 denoting the initial notch length. This equivalent LEFM methodology has facilitated determination of wood’s fracture toughness and resistance curves [50,51].
The resistance curve methodology employs an energetic equivalence principle wherein nonlinear fracture processes are represented through idealized elastic crack configurations. This equivalent crack length encompasses both physical crack extension and softening zone effects, providing unified measures of structural damage. By correlating specimen compliance variations with crack advancement, the approach enables determination of energy release rates throughout fracture processes. The resulting R-curve characterizes material evolving resistance to crack propagation, transitioning from initial toughening to steady-state behavior. The equivalent LEFM crack length is defined as the crack length that approximates a purely linear elastic structure. The method for determining the resistance curve (R-curve) in this study follows three steps:
Given any data point (δ, P) from the measured load–displacement response, calculate the corresponding secant compliance value;
The equivalent elastic crack length a is evaluated through direct measurement of the fracture process zone dimensions. This investigation employs Digital Image Correlation (DIC) techniques to monitor displacement field discontinuities across the specimen surface, thereby quantifying the effective crack advancement length a [52];
Calculate the energy dissipation rate using the specified relationship, ensuring consistency with the crack growth resistance GR under quasi-static propagation conditions.
G ( a ) = P 2 2 b λ ( a ) a
where b is the specimen thickness. When applied to any point of the load–displacement response, the resistance to crack propagation GR varies according to the corresponding equation. The resistance curve driven by crack length a is commonly referred to as the R-curve.
W F = 0 δ F P ( δ ) d δ = b a 0 d a 0 G R ( a ) d a
G F = W F b ( d a 0 ) G R c
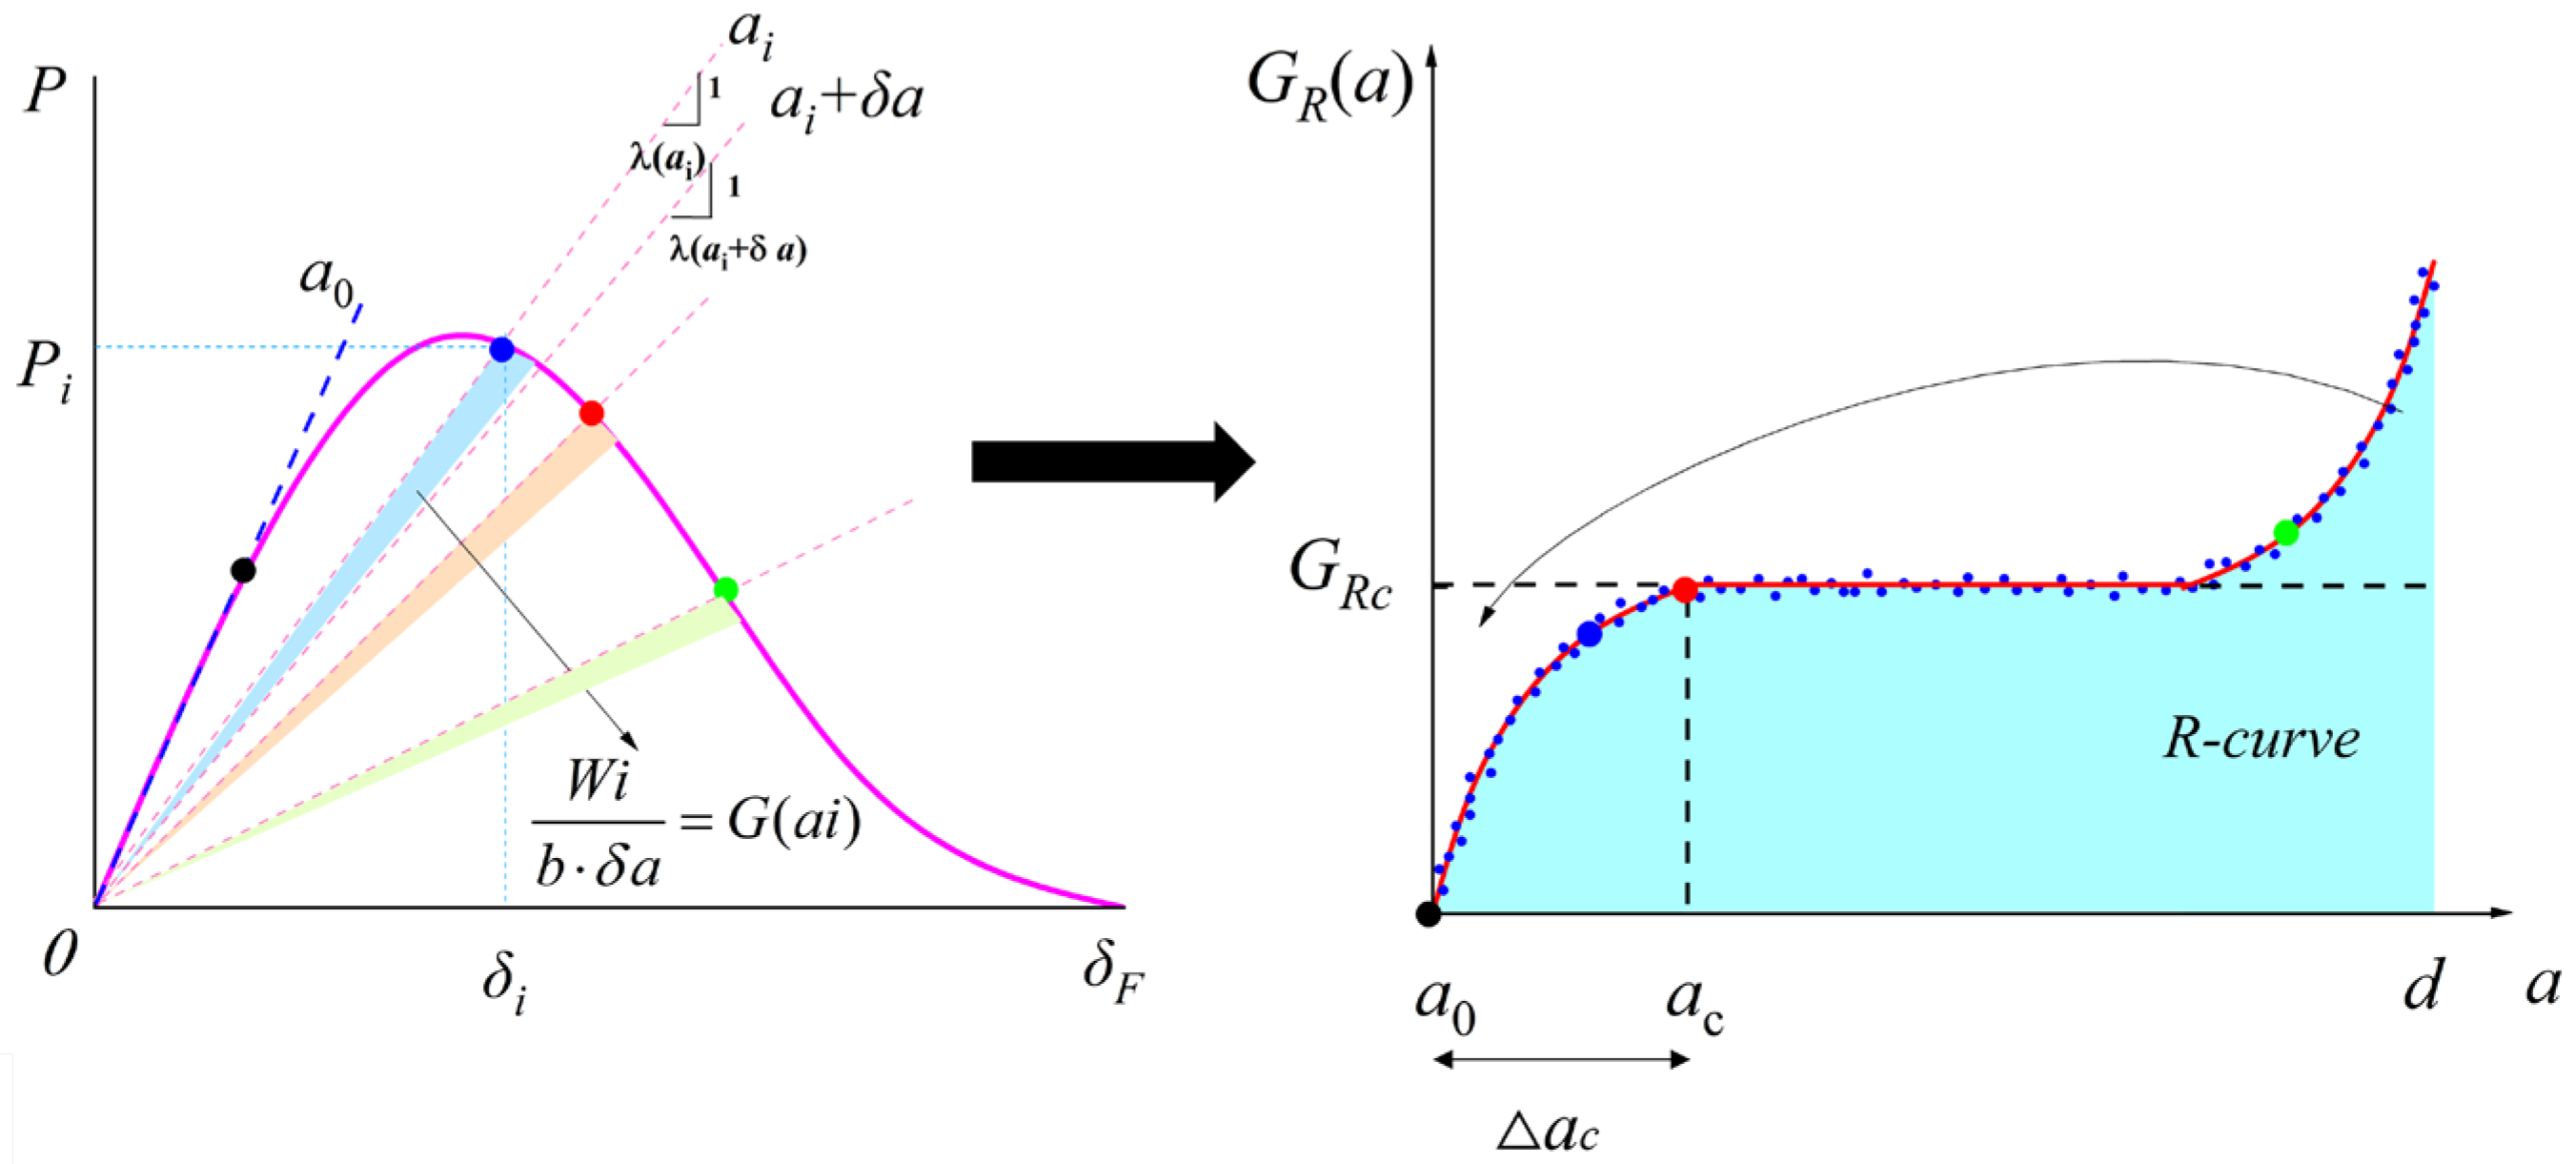
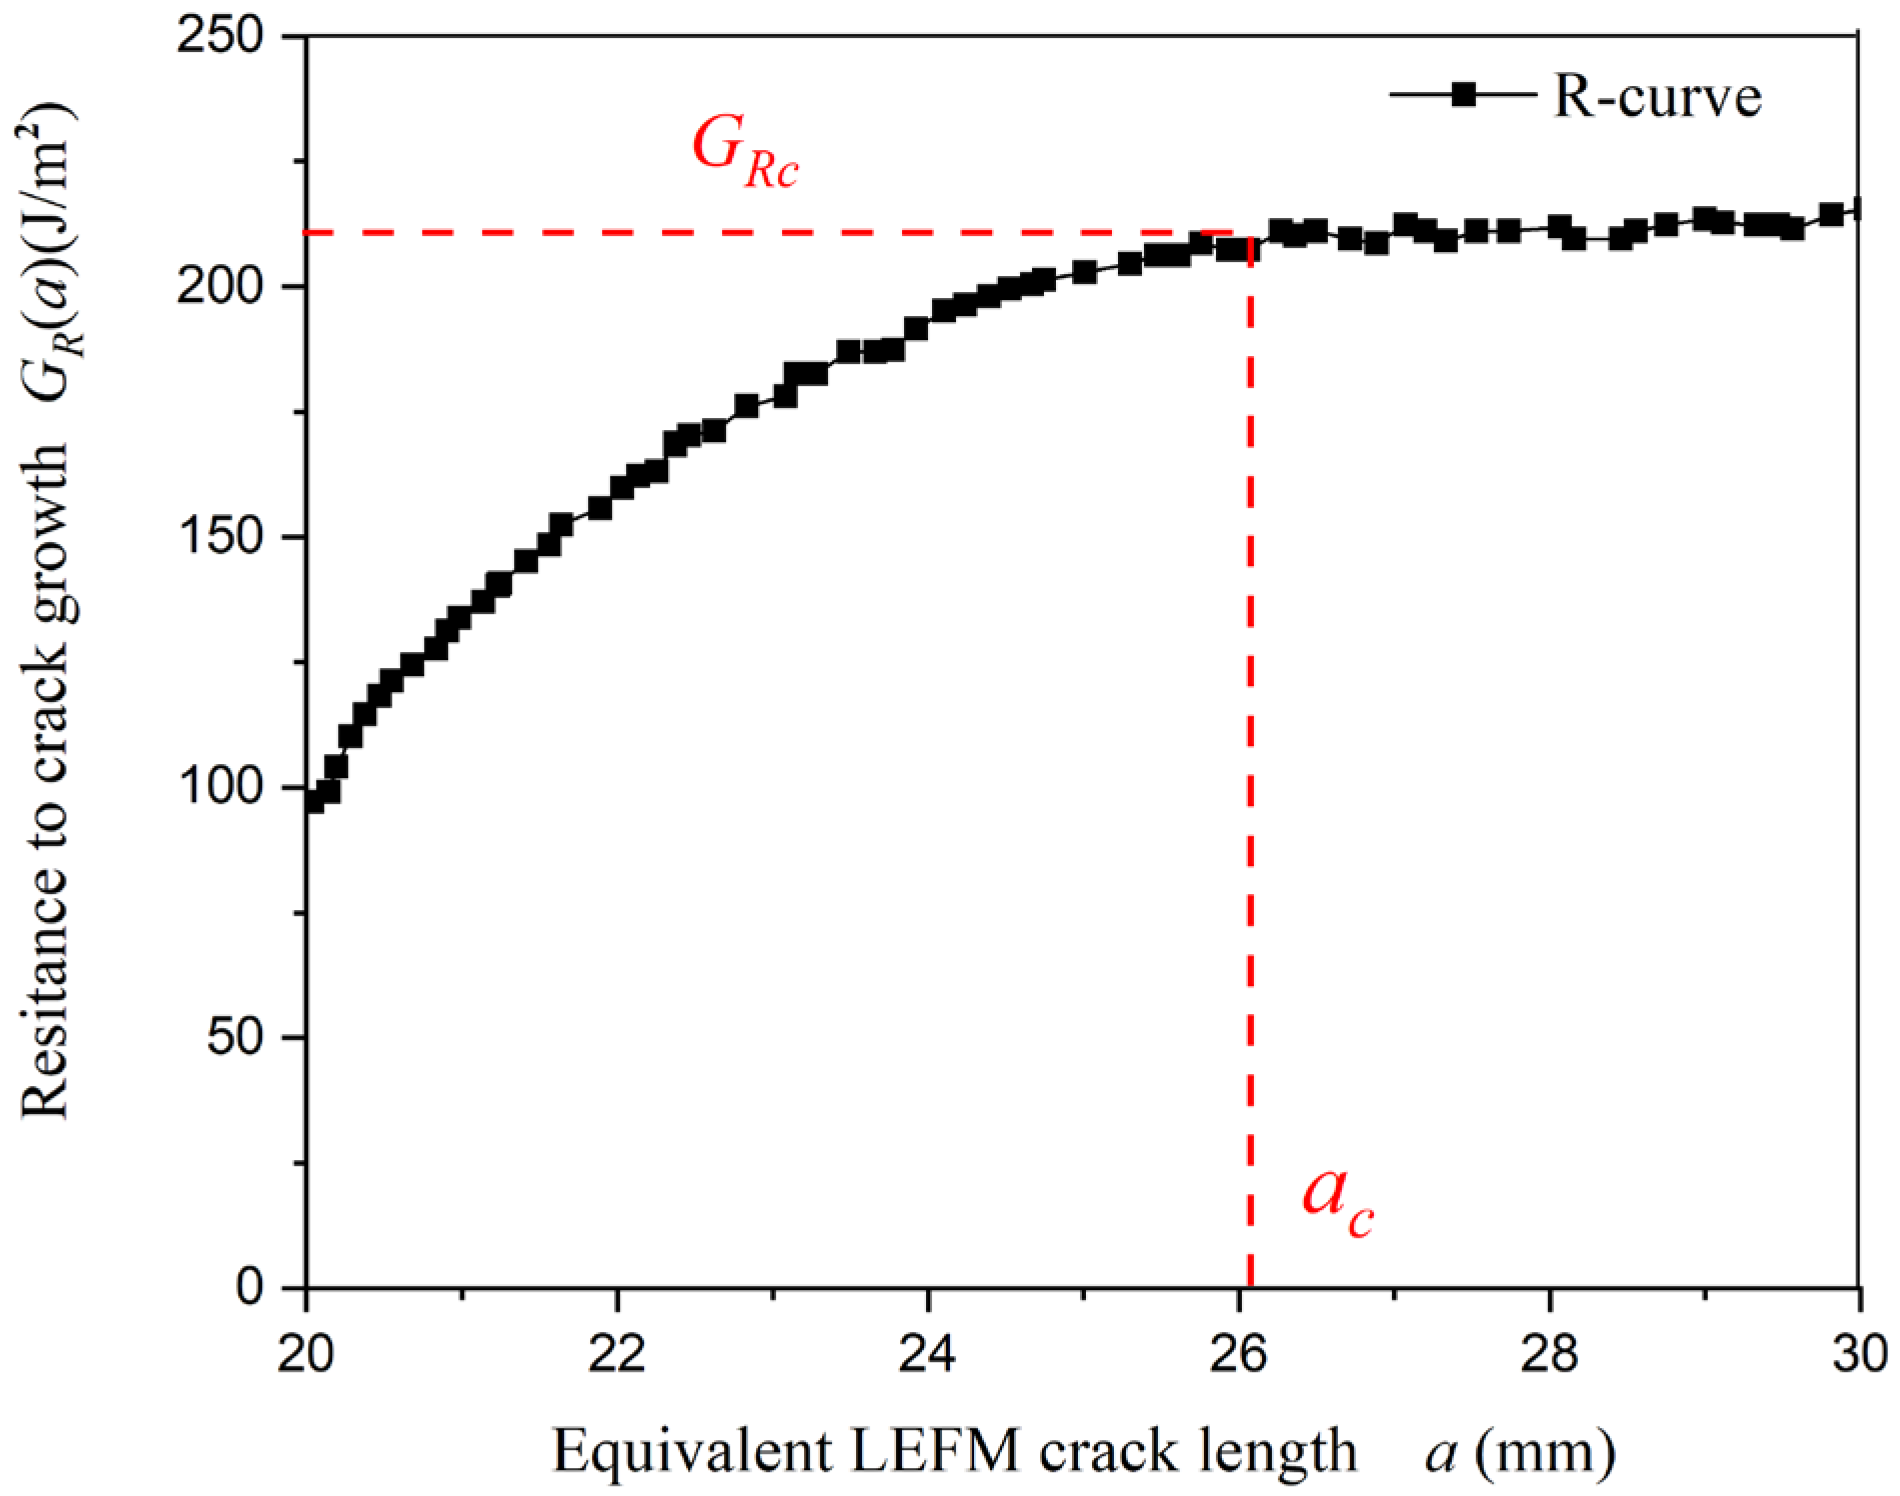
To further clarify the cohesive crack evolution during the quasi-brittle fracture of wood, stable crack propagation develops after the initial transient stage. Figure 5 presents a representative resistance curve (R-curve) obtained from DCB tests, illustrating the variation in crack growth resistance GR(a) with the normalized equivalent crack extension δa. After the initial rising segment of the R-curve, corresponding to crack initiation and the gradual development of the fracture process zone, the curve reaches a horizontal plateau.
This plateau segment corresponds to the stage of stable crack propagation, during which the crack growth resistance approaches a steady-state value. In this regime, the advancement of the main crack is synchronized with the development of the cohesive zone. The horizontal portion of the R-curve therefore allows determination of the cohesive fracture energy Gf, which represents the total energy required for complete crack surface separation under Mode I loading conditions. Thus, the plateau resistance can be expressed as GRc = Gf.
Achieving steady-state propagation necessitates three criteria: (1) cohesive traction distribution throughout the fracture path; (2) invariant cohesive zone dimension δa during stable growth; and (3) synchronized progression of the stress-free crack and equivalent elastic crack. Furthermore, energy balance considerations dictate that during stable propagation, the cohesive fracture energy Gf, plateau resistance GRc, and mean fracture energy GF converge to identical values (Gf = GRc = GF). Consequently, the cohesive fracture energy Gf can be determined from the R-curve plateau value GRc. This approach proves advantageous over using GF, since obtaining reliable mean fracture energy measurements necessitates complete specimen separation. Furthermore, precise measurement in this region is difficult due to the long tail typically observed in the load–displacement curve (which asymptotically approaches the horizontal axis).
The method for determining key parameters of bilinear softening curves using resistance R-curves was developed by Dourado, Morel, and colleagues (2008) [53]. The general procedure for deriving bilinear cohesive parameters in this study is as follows:
(1) Execute quasi-static testing of DCB configurations and establish the experimental crack growth resistance curves from the resulting data.
(2) From the experimental R-curve, determine the constant resistance level GRc at the plateau and measure the equivalent crack extension Δac from the starting point. The cohesive fracture energy Gf is then equated to GRc.
(3) Calculate the displacement field on the wooden beam surface using the DIC method, and accurately measure the critical crack opening displacement wc based on the discontinuity of the displacement field.
(4) Calculate ft using the power function fitting formula.
f t = 0.0916 E G f b b 0.2 G f 2 / 3
E represents Young’s modulus, b denotes specimen thickness, and Gf refers to the steady-state cohesive fracture energy.
(5) With the plateau-related parameters (Gf, wc) and initial strength ft already established from the R-curve analysis, only the energy distribution coefficient φ (representing Gfμ/Gf) requires determination. A single-parameter function cannot adequately capture φ’s effect, given its primary influence on the transitional R-curve segment and load maximum, combined with its interaction with ft and wc values. Consequently, an iterative fitting procedure targeting either the R-curve’s transition zone or peak load response provides the most effective solution. This investigation employs iterative calibration of φ by matching the R-curve behavior at its intermediate stage before the onset of the steady-state plateau.

3. Determination of the Softening Constitutive Curve of Chinese Fir Using DCB Test

3.1. Specimen Preparation and Experimental Setup

As shown in Figure 6, the experimental material was Chinese fir (Cunninghamia lanceolata). The air-dried specimens had an average moisture content of approximately 10% and a density of 0.365 g/cm3. Double cantilever beam (DCB) specimens were adopted, with beam dimensions of b (20 mm) × h (20 mm) × l (200 mm). An initial notch of 18.5 mm (longitudinal direction) × 3 mm (width) was cut at the center of the left side along the grain direction. Subsequently, a sharp blade was used to introduce a pre-crack with a length of 1.5 mm ± 1 mm along the l direction. Finally, a hole with a diameter of 4 mm was drilled at the center of each separated cantilever beam, where a0 = 20 mm and d = 190 mm. To facilitate displacement measurement, black speckles were sprayed on the specimen surface over a white background, forming a random speckle pattern for testing. To ensure statistical reliability, a total of 20 specimens were prepared and 20 replicate tests were conducted.
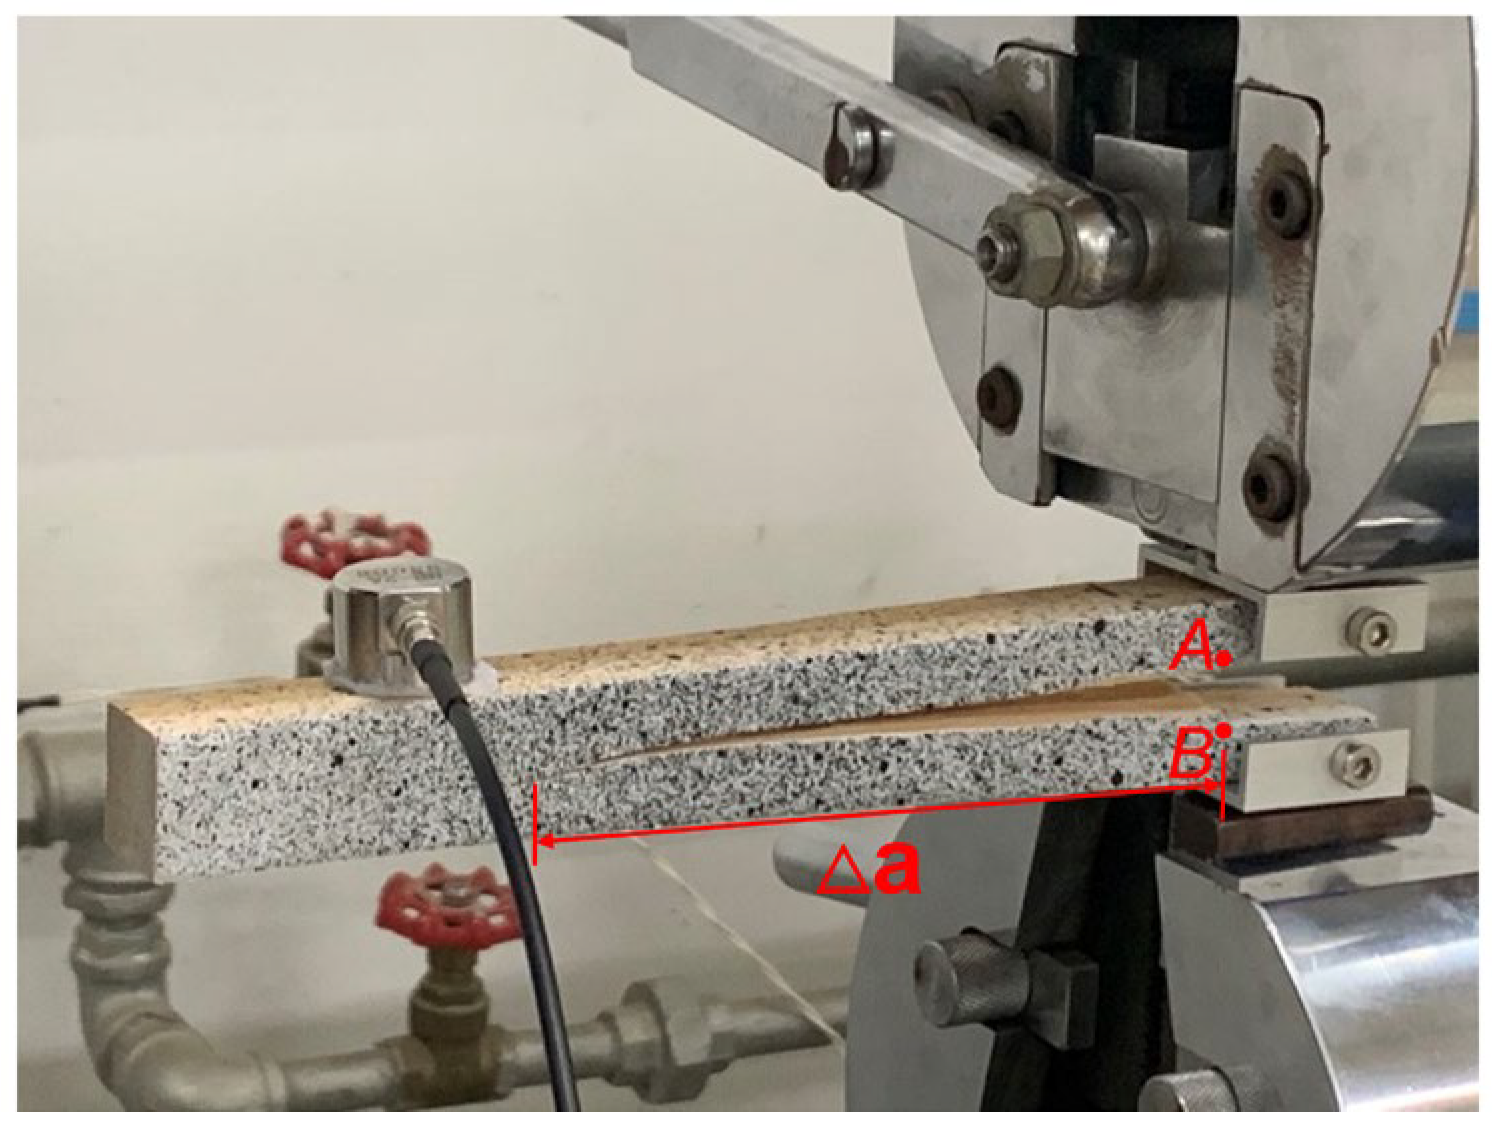
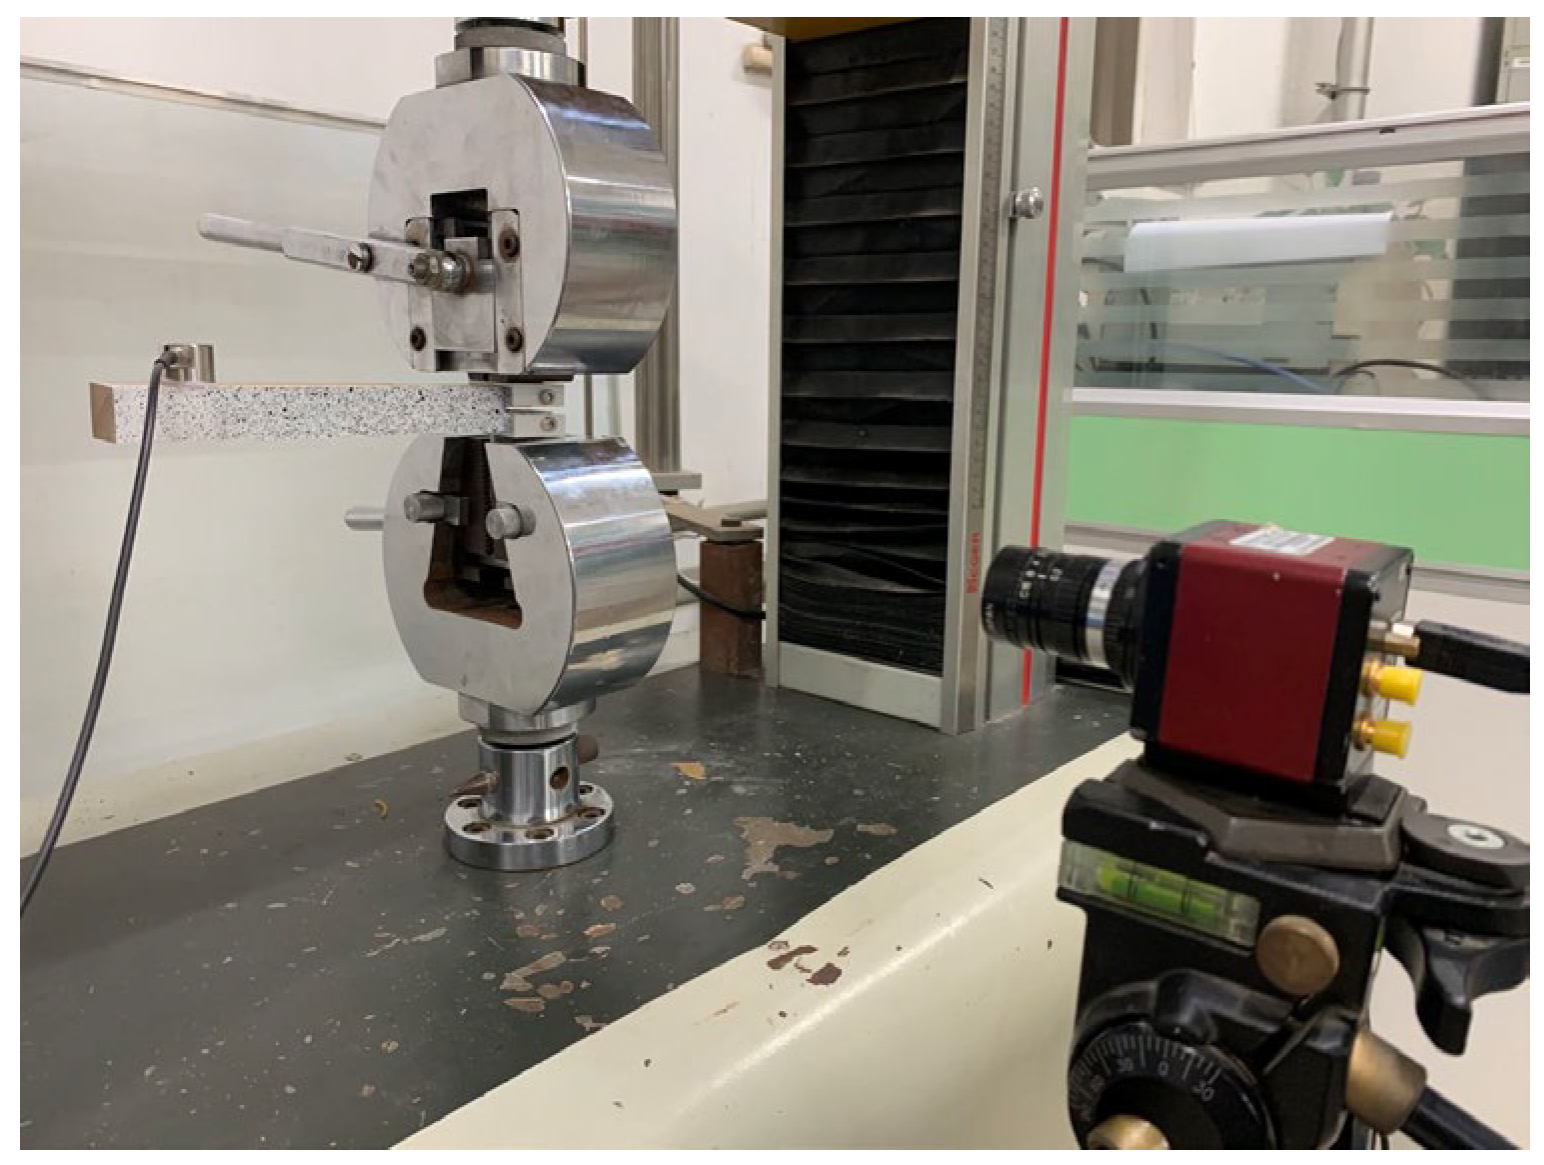
As illustrated in Figure 7, the experimental setup consisted of a loading system, an acoustic emission (AE) system, and a digital image measurement system. The loading system employed an electronic universal testing machine (Reger, Shenzhen, China). Prior to the formal test, a preload was applied to reduce frictional noise between the fixture and the wooden beam. The mechanical tests were conducted under displacement control with a tensile loading rate of 5 mm/min. The AE monitoring equipment was a DS2 acoustic emission monitoring system, which mainly included an AE sensor, a preamplifier, an AE data acquisition unit, and a host computer. The channel threshold was set to 20 mV. The sensor frequency range was 50–400 kHz, the preamplifier gain was 40 dB, and the sampling rate was 2.5 MHz/s. In this experiment, the AE sensor was primarily used to determine the crack initiation moment. Only one sensor was mounted on the upper surface of the DCB specimen, and high-vacuum grease was used as the acoustic coupling agent between the sensor and the specimen surface. The first AE signal exceeding the threshold during the test was regarded as an indicator of crack initiation [54]. The front surface of the wooden beam was monitored using a self-developed two-dimensional digital image measurement system to capture crack-tip images. A CCD industrial camera (MV-EM200M, Shaanxi Vision Image Technology Co., Ltd., Xi’an, China) was mounted on a horizontal support and positioned 250 mm in front of the specimen. The image acquisition frequency was set to 1 Hz. The acoustic emission system and the digital image measurement system were triggered simultaneously with the start of the testing machine, enabling synchronized and continuous monitoring of the entire process of microcrack initiation and propagation. As shown in Figure 8, points a and b were selected on the same vertical line ahead of the crack tip. The crack opening displacement (COD) was determined from the relative displacement between points a and b. By tracking the speckle displacement field on the beam surface and identifying discontinuities in the displacement field, the crack propagation length ∆a was accurately measured.

3.2. Calculation and Plotting of Equivalent LEFM-Based Resistance R-Curve

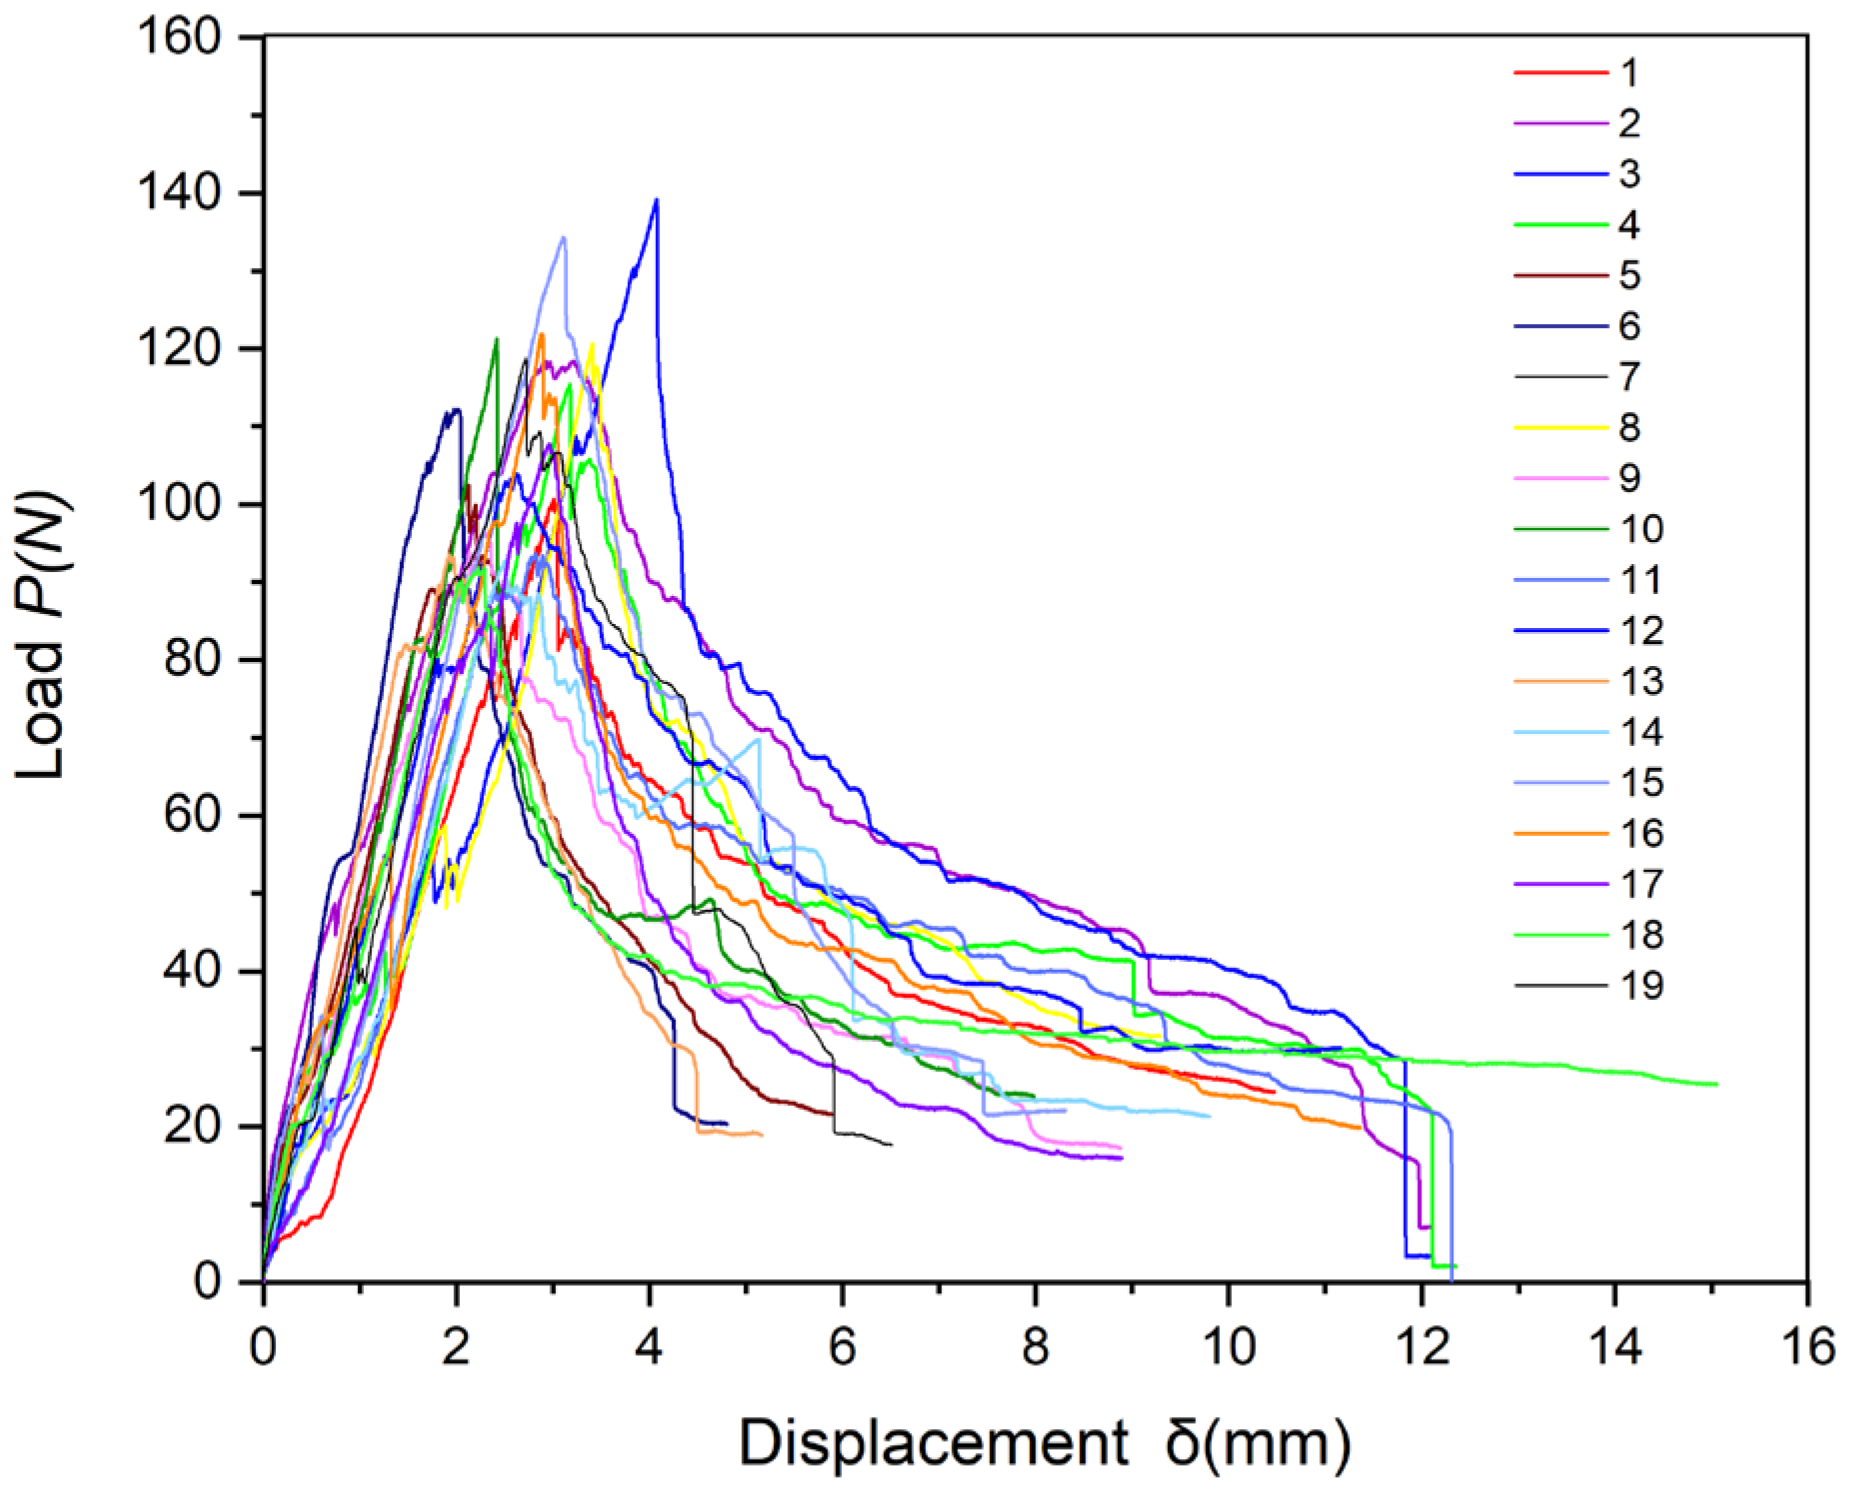
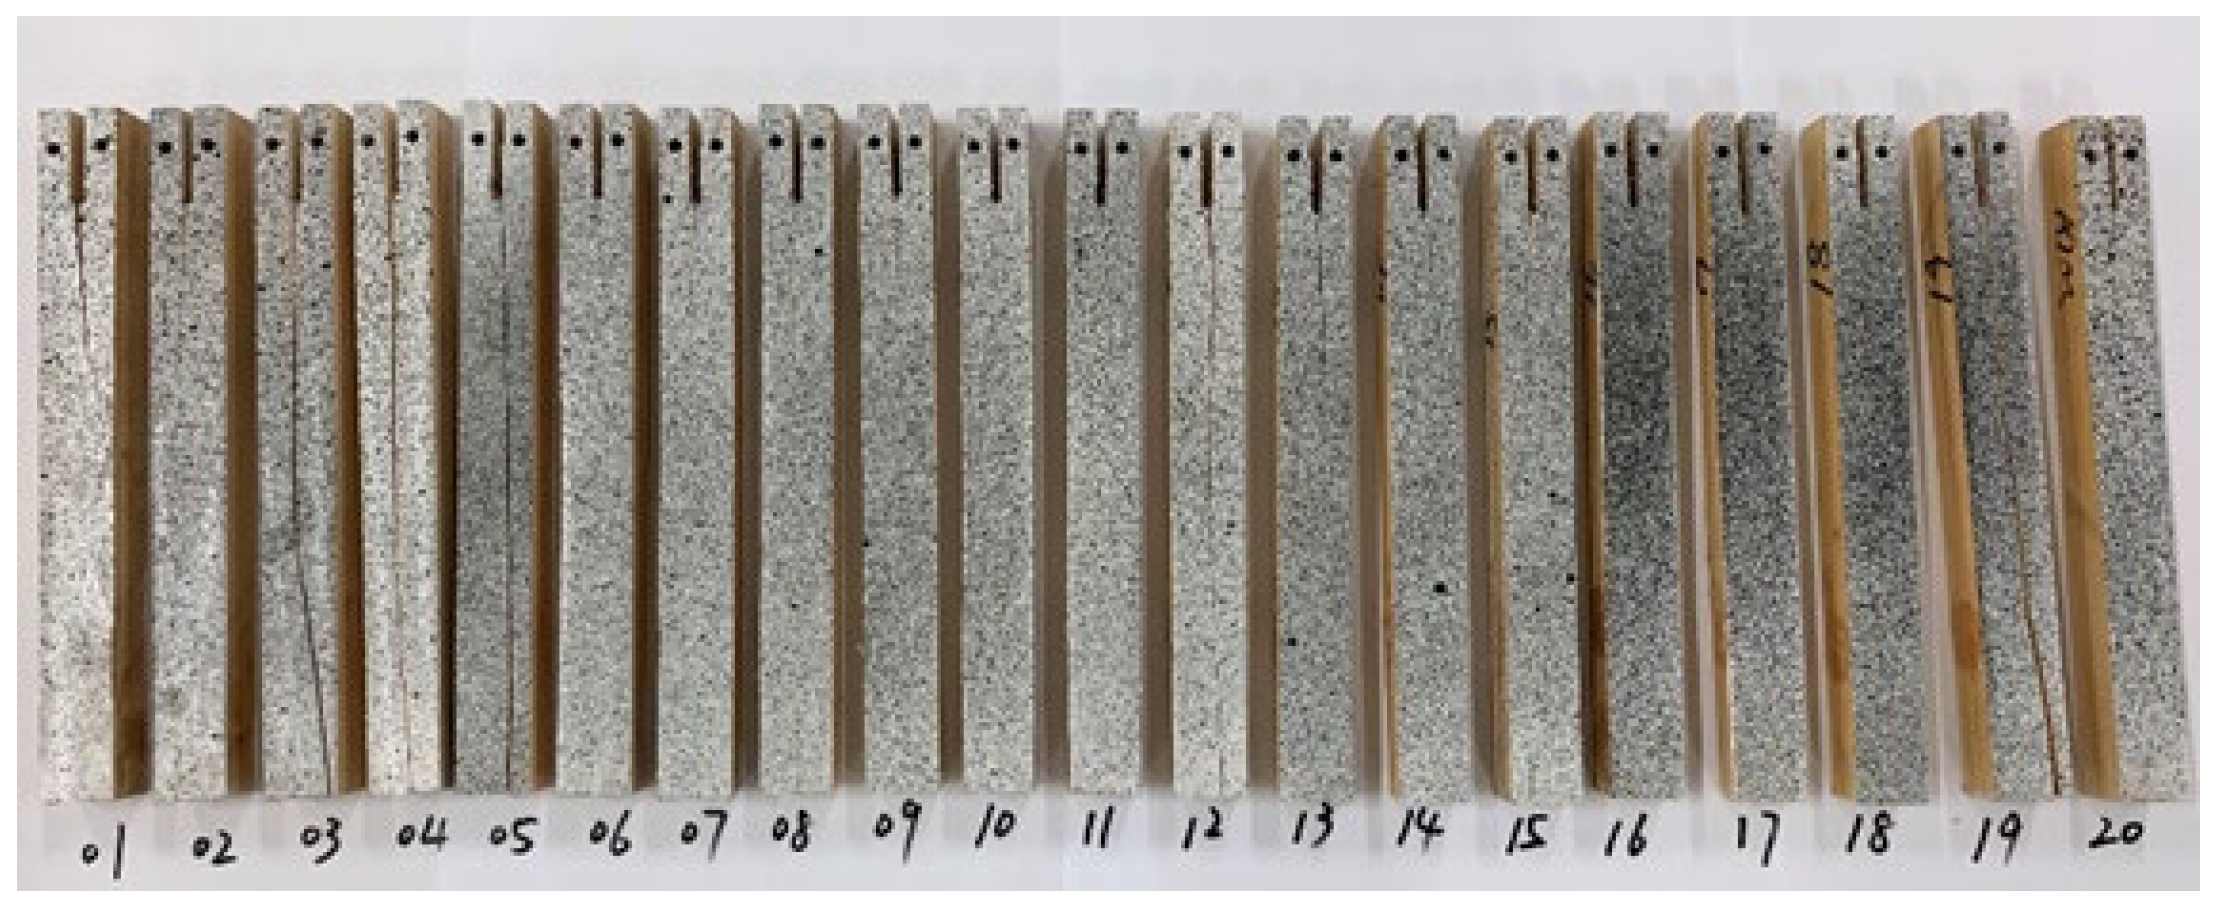
As shown in Figure 9, the load–displacement (P-δ) curves for double cantilever beam specimens D1–D19 exhibit consistent behavior. During the Chinese fir DCB test, no significant crack opening displacement occurred in the linear elastic stage as the tensile load increased. Upon reaching the peak load, the wooden beam began to split along the grain, resulting in load reduction as the crack entered stable propagation until complete beam failure. Figure 10 shows specimens D1–D20 after fracture, where cracks have completely traversed some beams. In these cases, since the beam length did not cover the complete stable crack propagation distance, the measured resistance R-curve includes both the steady-state plateau value and the portion preceding it.
Figure 5 demonstrates that accurate determination of the equivalent crack length is essential for reliable R-curve construction. In this study, two-dimensional digital image correlation (DIC) was employed to monitor the full-field displacement around the crack tip, enabling precise evaluation of the equivalent crack extension Δa [52]. The crack-tip position was identified by analyzing displacement discontinuities in the opening displacement field along the ligament ahead of the crack. Specifically, a vertical virtual extensometer was defined in front of the crack tip, and the crack opening displacement (COD) distribution along the ligament was extracted. The updated crack-tip location was determined as the position corresponding to the maximum displacement jump (i.e., the peak displacement gradient), rather than using averaged field values or arbitrary individual points. The crack extension Δa was therefore calculated from the difference between successive crack-tip positions determined using this maximum-discontinuity criterion. Based on the evolution of the equivalent crack length, the R-curves were constructed for each specimen, as exemplified by specimen D07 in Figure 11. The stabilized energy release rate observed in the plateau region corresponds to the cohesive fracture energy Gf, which was measured as 207.4 J/m2 for specimen D07. Table 1 summarizes the key fracture parameters obtained from all tested specimens.

3.3. Determination of Bilinear Softening Constitutive Curve

Based on the bilinear mapping relationship between the wood resistance curves and the bilinear cohesive softening constitutive model, along with the relevant calculation formulas, the characteristic parameters of the constitutive curves for Chinese fir double cantilever beam test specimens D1–D19 are shown in Table 2. According to the experimental results, the averaged parameters were determined as follows: cohesive fracture energy Gf = 201.9 J/m2, tensile strength ft = 6.31 MPa, cohesive energy distribution coefficient φ = 0.537, and critical opening displacement wc = 1.29 mm.
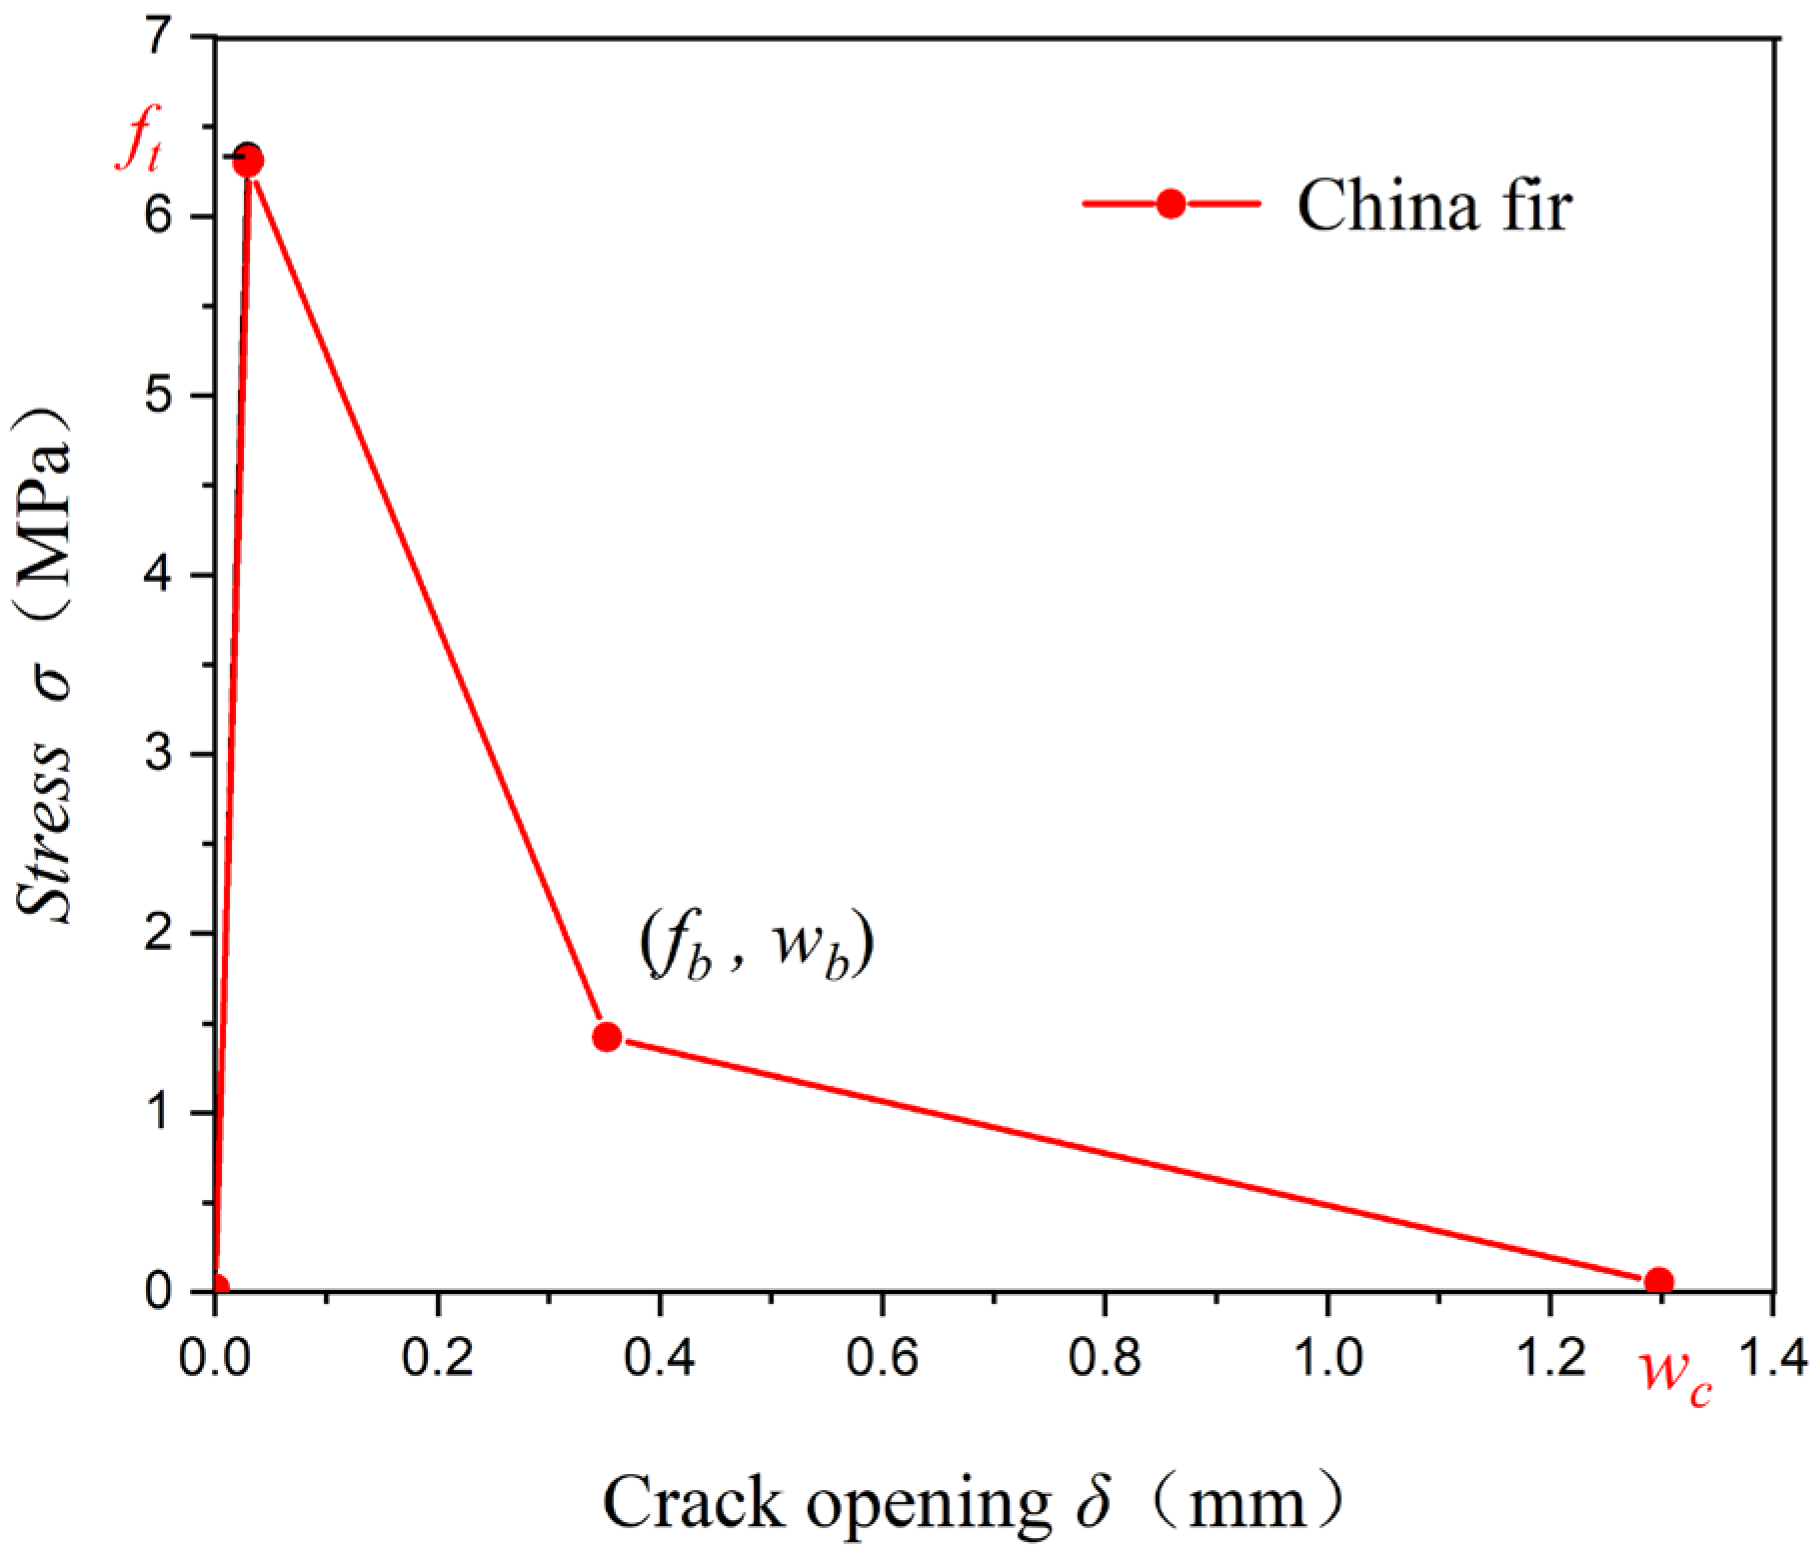
The parameter φ defines the energy partition between microcracking and fiber-bridging mechanisms. Its value was determined through an iterative procedure, in which φ was adjusted until the numerically simulated R-curve matched the experimentally obtained R-curve in the transition region prior to the plateau segment. This iterative fitting ensures that the model accurately captures the gradual evolution of crack resistance before stable crack propagation is fully established. The critical opening displacement wc represents the interface separation at complete failure, i.e., the point at which the cohesive traction reduces to zero. Therefore, wc defines the endpoint of the bilinear cohesive law and determines the total extent of the fracture process zone in the numerical implementation. For implementation in the VUMAT user subroutine, the bilinear cohesive softening constitutive relationship of Chinese fir was further expressed in coordinate form, as illustrated in Figure 12. Determining the coordinates (fb, wb) allows accurate definition of the inflection point and thus precise shaping of the bilinear softening curve.
Since the bilinear softening model’s area integral yields the cohesive fracture energy Gf—representing the work required for complete crack surface separation in Chinese fir—this value combines energy dissipation from microcracking processes and bridging mechanisms, such that Gf = Gfl + Gfb. It should be emphasized that this decomposition represents an idealized interpretation of the fracture process. In reality, microcracking and fiber bridging mechanisms may interact and evolve simultaneously; however, both mechanisms contribute collectively to the total cohesive fracture energy Gf. This relationship can be reformulated as:
G f = f t w b 2 + f b w c 2
For simplicity, the value of w0 corresponding to the peak stress ft, which had a mean value of 0.06 mm measured in the experiment, can be ignored in the equation. Therefore, the softening relationship is given by Equation (10).
σ = ( I E ) D w
where I denotes the identity matrix, and E denotes a diagonal matrix containing damage parameters.
e = w b ( w w 0 ) ( 1 β ) w ( w b w 0 ) ,     w 0 w w b
e = 1 β w b ( w c w 0 ) w ( w c w b ) ,     w b w w c
β = f b w 0 f t w b
Accordingly, the stress softening constitutive model for Chinese fir is defined by the independent parameters wb, fb, ft, and Gf. The coordinate pair (fb, wb) represents the cohesive traction and crack opening displacement at the inflection point of the bilinear softening curve, marking the transition from the microcracking-dominated stage to the fiber-bridging-dominated stage.
In this study, the coordinates of the bilinear softening model were determined as follows: (fb, wb) = (0.34 MPa, 1.31 mm), with the remaining key points given by (0, 0), (0.06 mm, 6.31 MPa), and (1.29 mm, 0). The initial opening displacement w0 = 0.06 mm was neglected in the energy integration process because its contribution to the total fracture energy Gf is minimal. This simplification does not significantly affect the calculated fracture energy or the simulated R-curve response, while improving numerical efficiency and stability in the VUMAT implementation.

4. Numerical Simulation Results and Analysis of Fracture Tests on Chinese Fir Beams

4.1. Development of a VUMAT User Subroutine for the Cohesive Zone Model

Since the cohesive models currently available in ABAQUS® only include the traditional bilinear model (i.e., linear softening), whereas the constitutive model applicable to Chinese fir crack damage evolution in this study is bilinear softening, implementation can only be achieved through the user-defined subroutine VUMAT. The VUMAT user subroutine in this paper is written in Fortran code format, primarily through the definition of material parameters (transferring the cohesive softening constitutive model parameters to the user subroutine), providing failure criteria for simulating Chinese fir beam damage (quadratic nominal stress criterion), while compiling subroutine modules for calculating interface state damage and damage stiffness matrix, and updating damage state variables (element mapping).

4.2. Model Establishment and Material Parameters

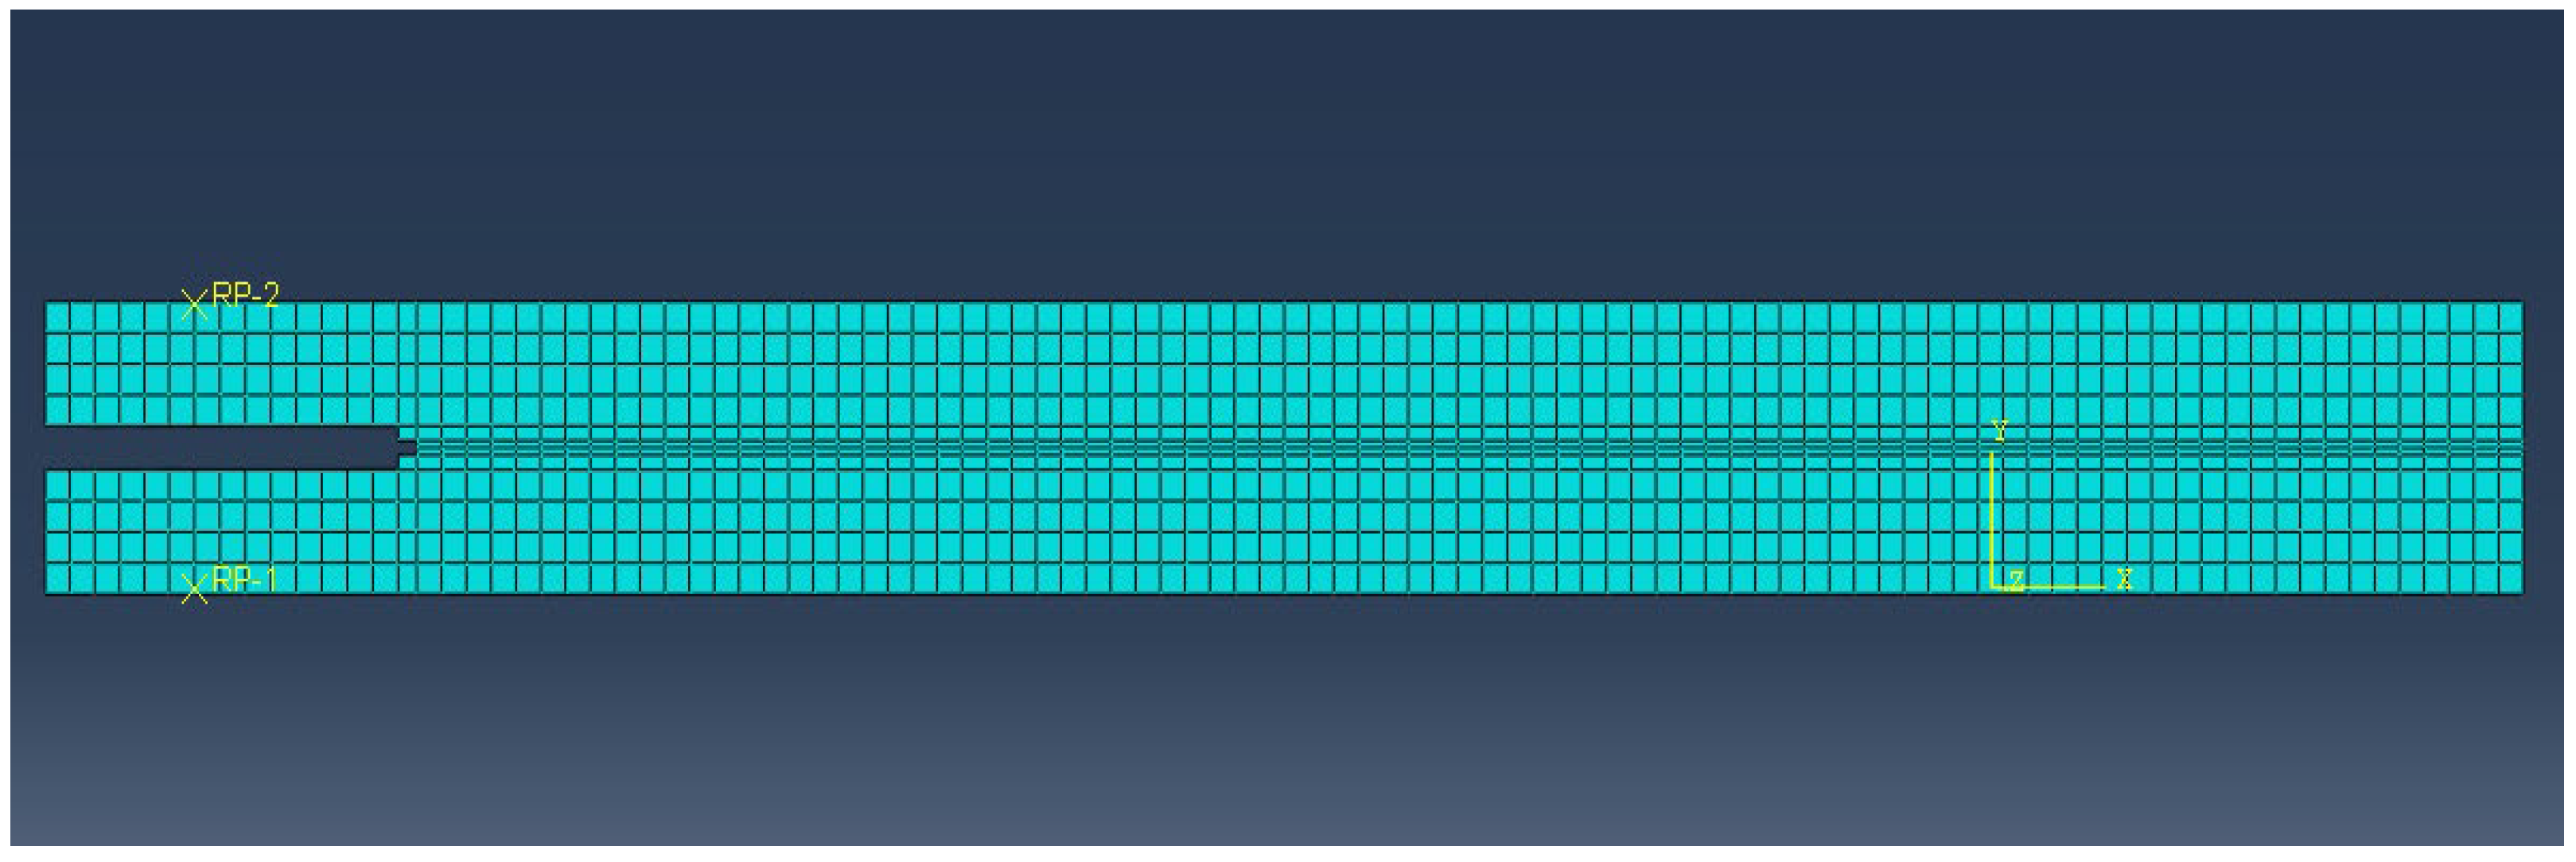
The ABAQUS® (Abaqus 6.14, Dassault Systèmes) software package was employed for computational modeling. Three-dimensional representations are displayed in Figure 13. DCB test specimens were modeled with dimensions of 200 mm × 20 mm × 20 mm (longitudinal × tangential × radial). The Chinese fir components utilized C3D8R hexahedral elements. To accommodate wood’s directional behavior, element material assignments incorporated user-defined coordinate systems following fiber orientation. Orthotropic constants along the principal material directions (L, R, T) are provided in Table 3. To better capture the crack propagation behavior of wood, cohesive elements were inserted along the a priori crack propagation path of the Chinese fir. A layer of zero-thickness cohesive elements was placed in the prefabricated crack extension plane of the double cantilever wood beam model (as shown in Figure 14). The element type was COH3D8, and the constitutive model executed by these cohesive elements adopted the bilinear softening constitutive model derived in Section 3.3. The material parameters were transmitted to the backend for calculation through the user subroutine VUMAT, enabling the simulation of the fracture process of the Chinese fir beam. During the loading process, displacement loading was employed, with displacement load applied at the loading end at the center of the upper part of the wood beam, while the lower part had two fixed supports. To more accurately analyze the boundary stresses at the crack tip position and improve convergence, refined mesh partitioning was performed at the loading end, the contact positions between the supports and the wood beam, and at the prefabricated crack tip location.

4.3. Finite Element Simulation Results

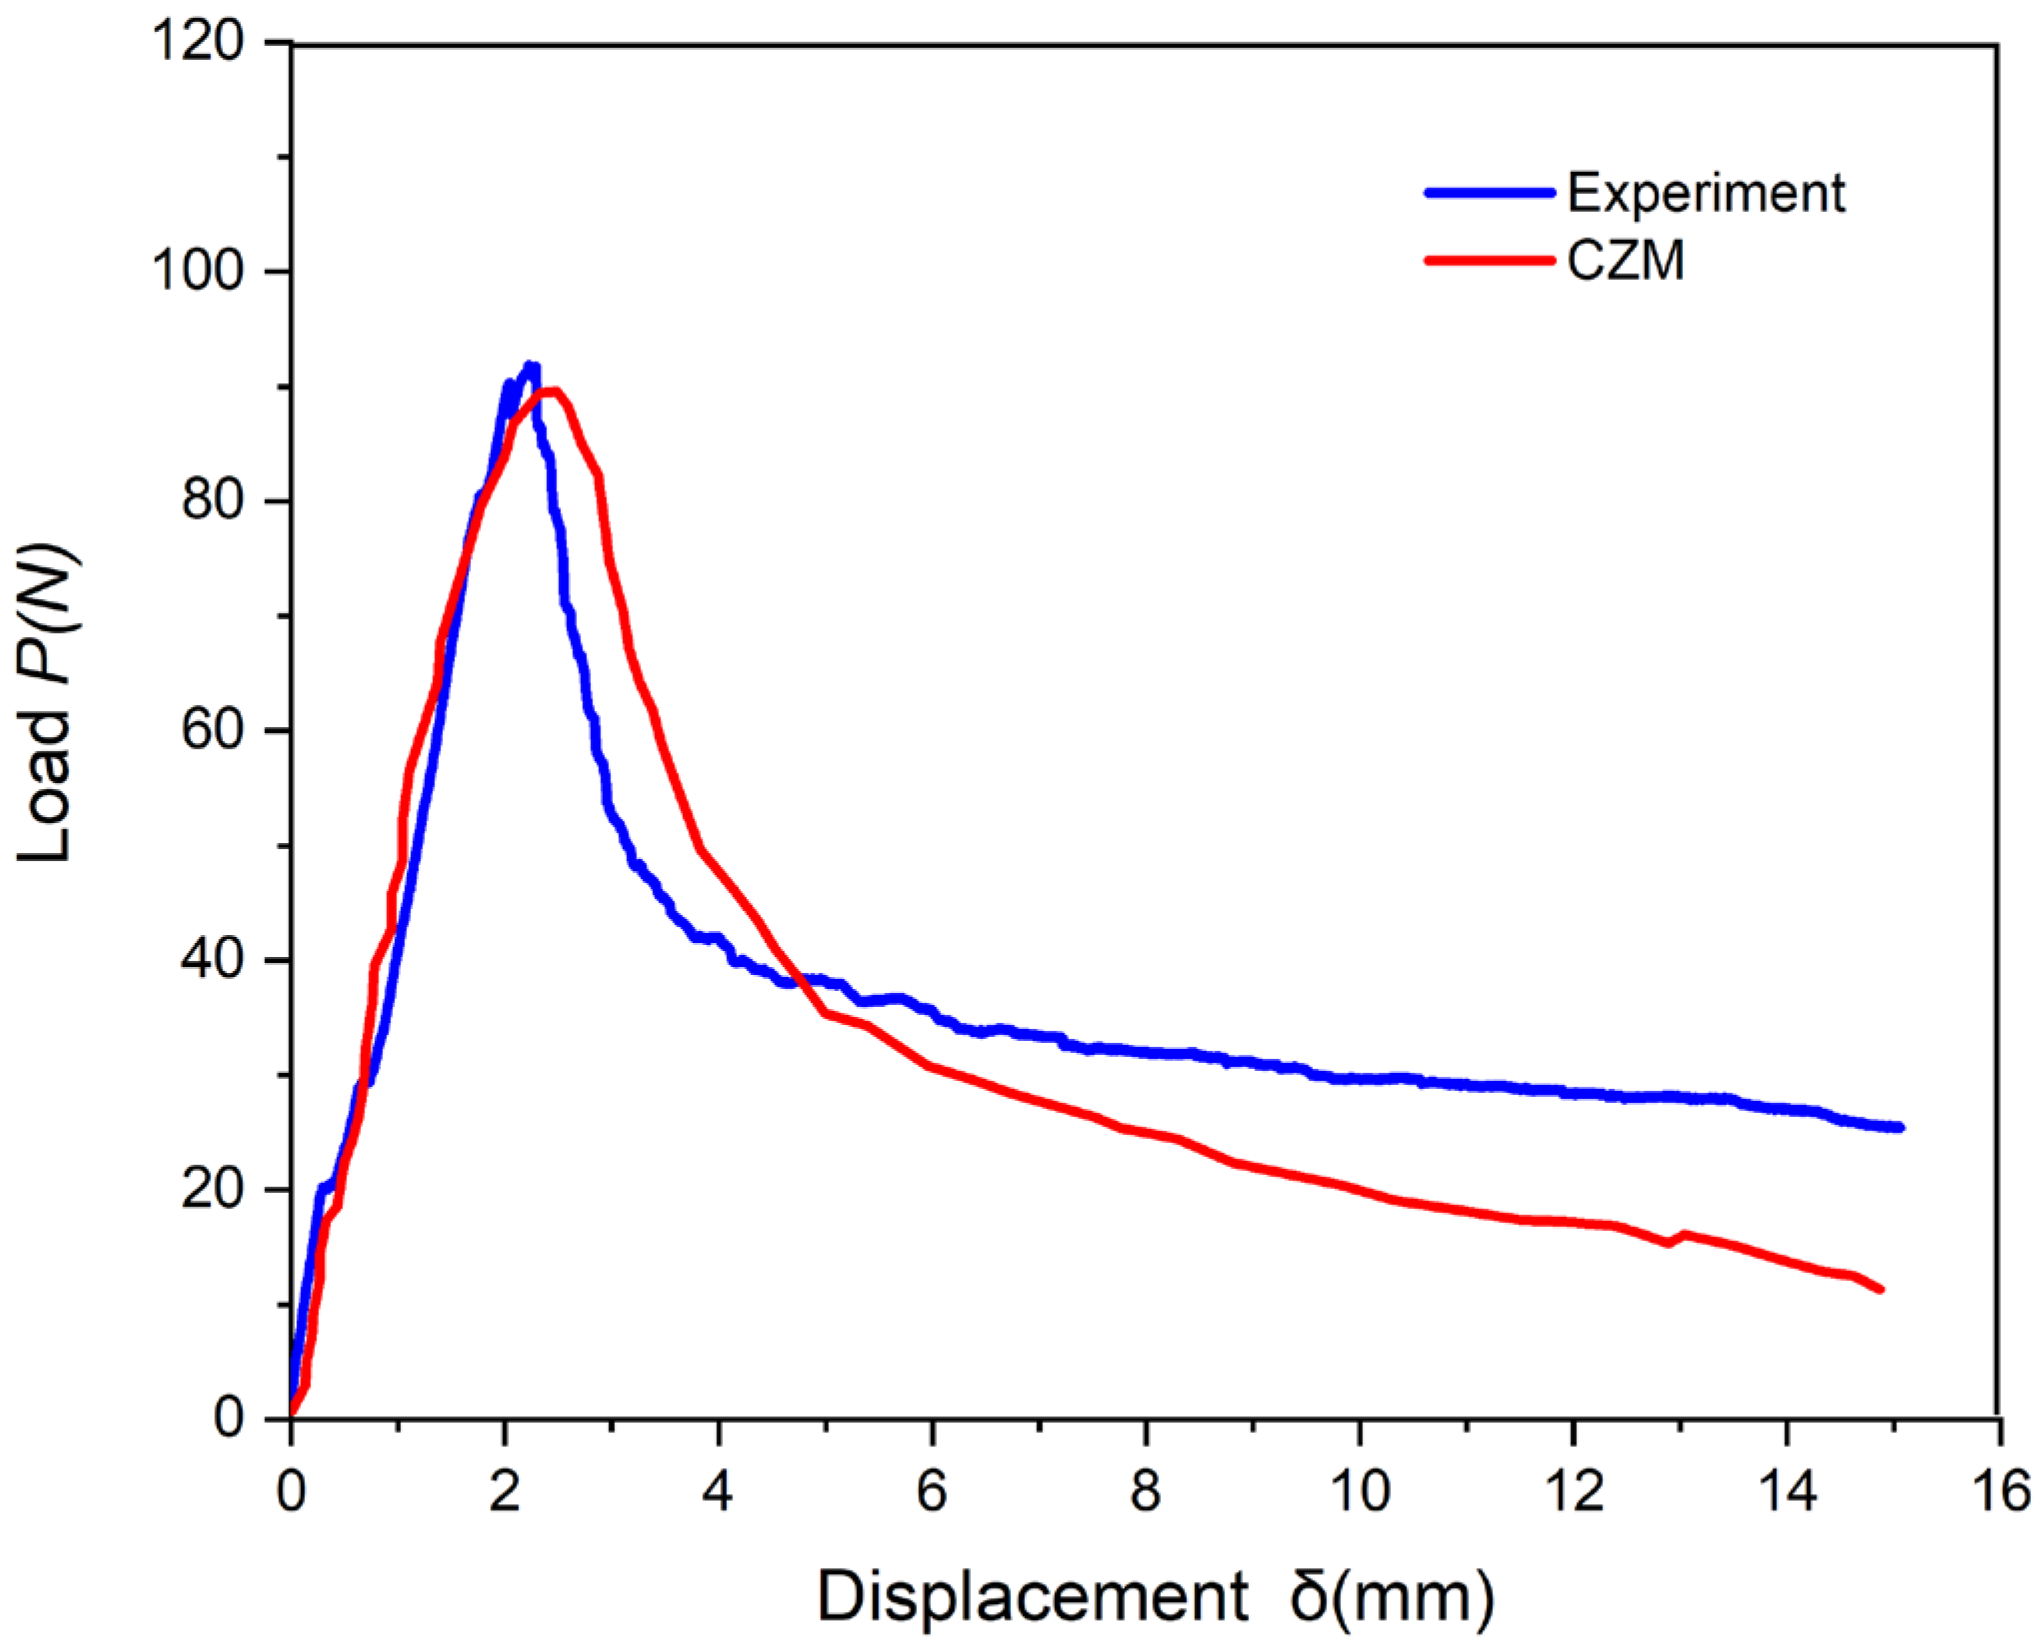
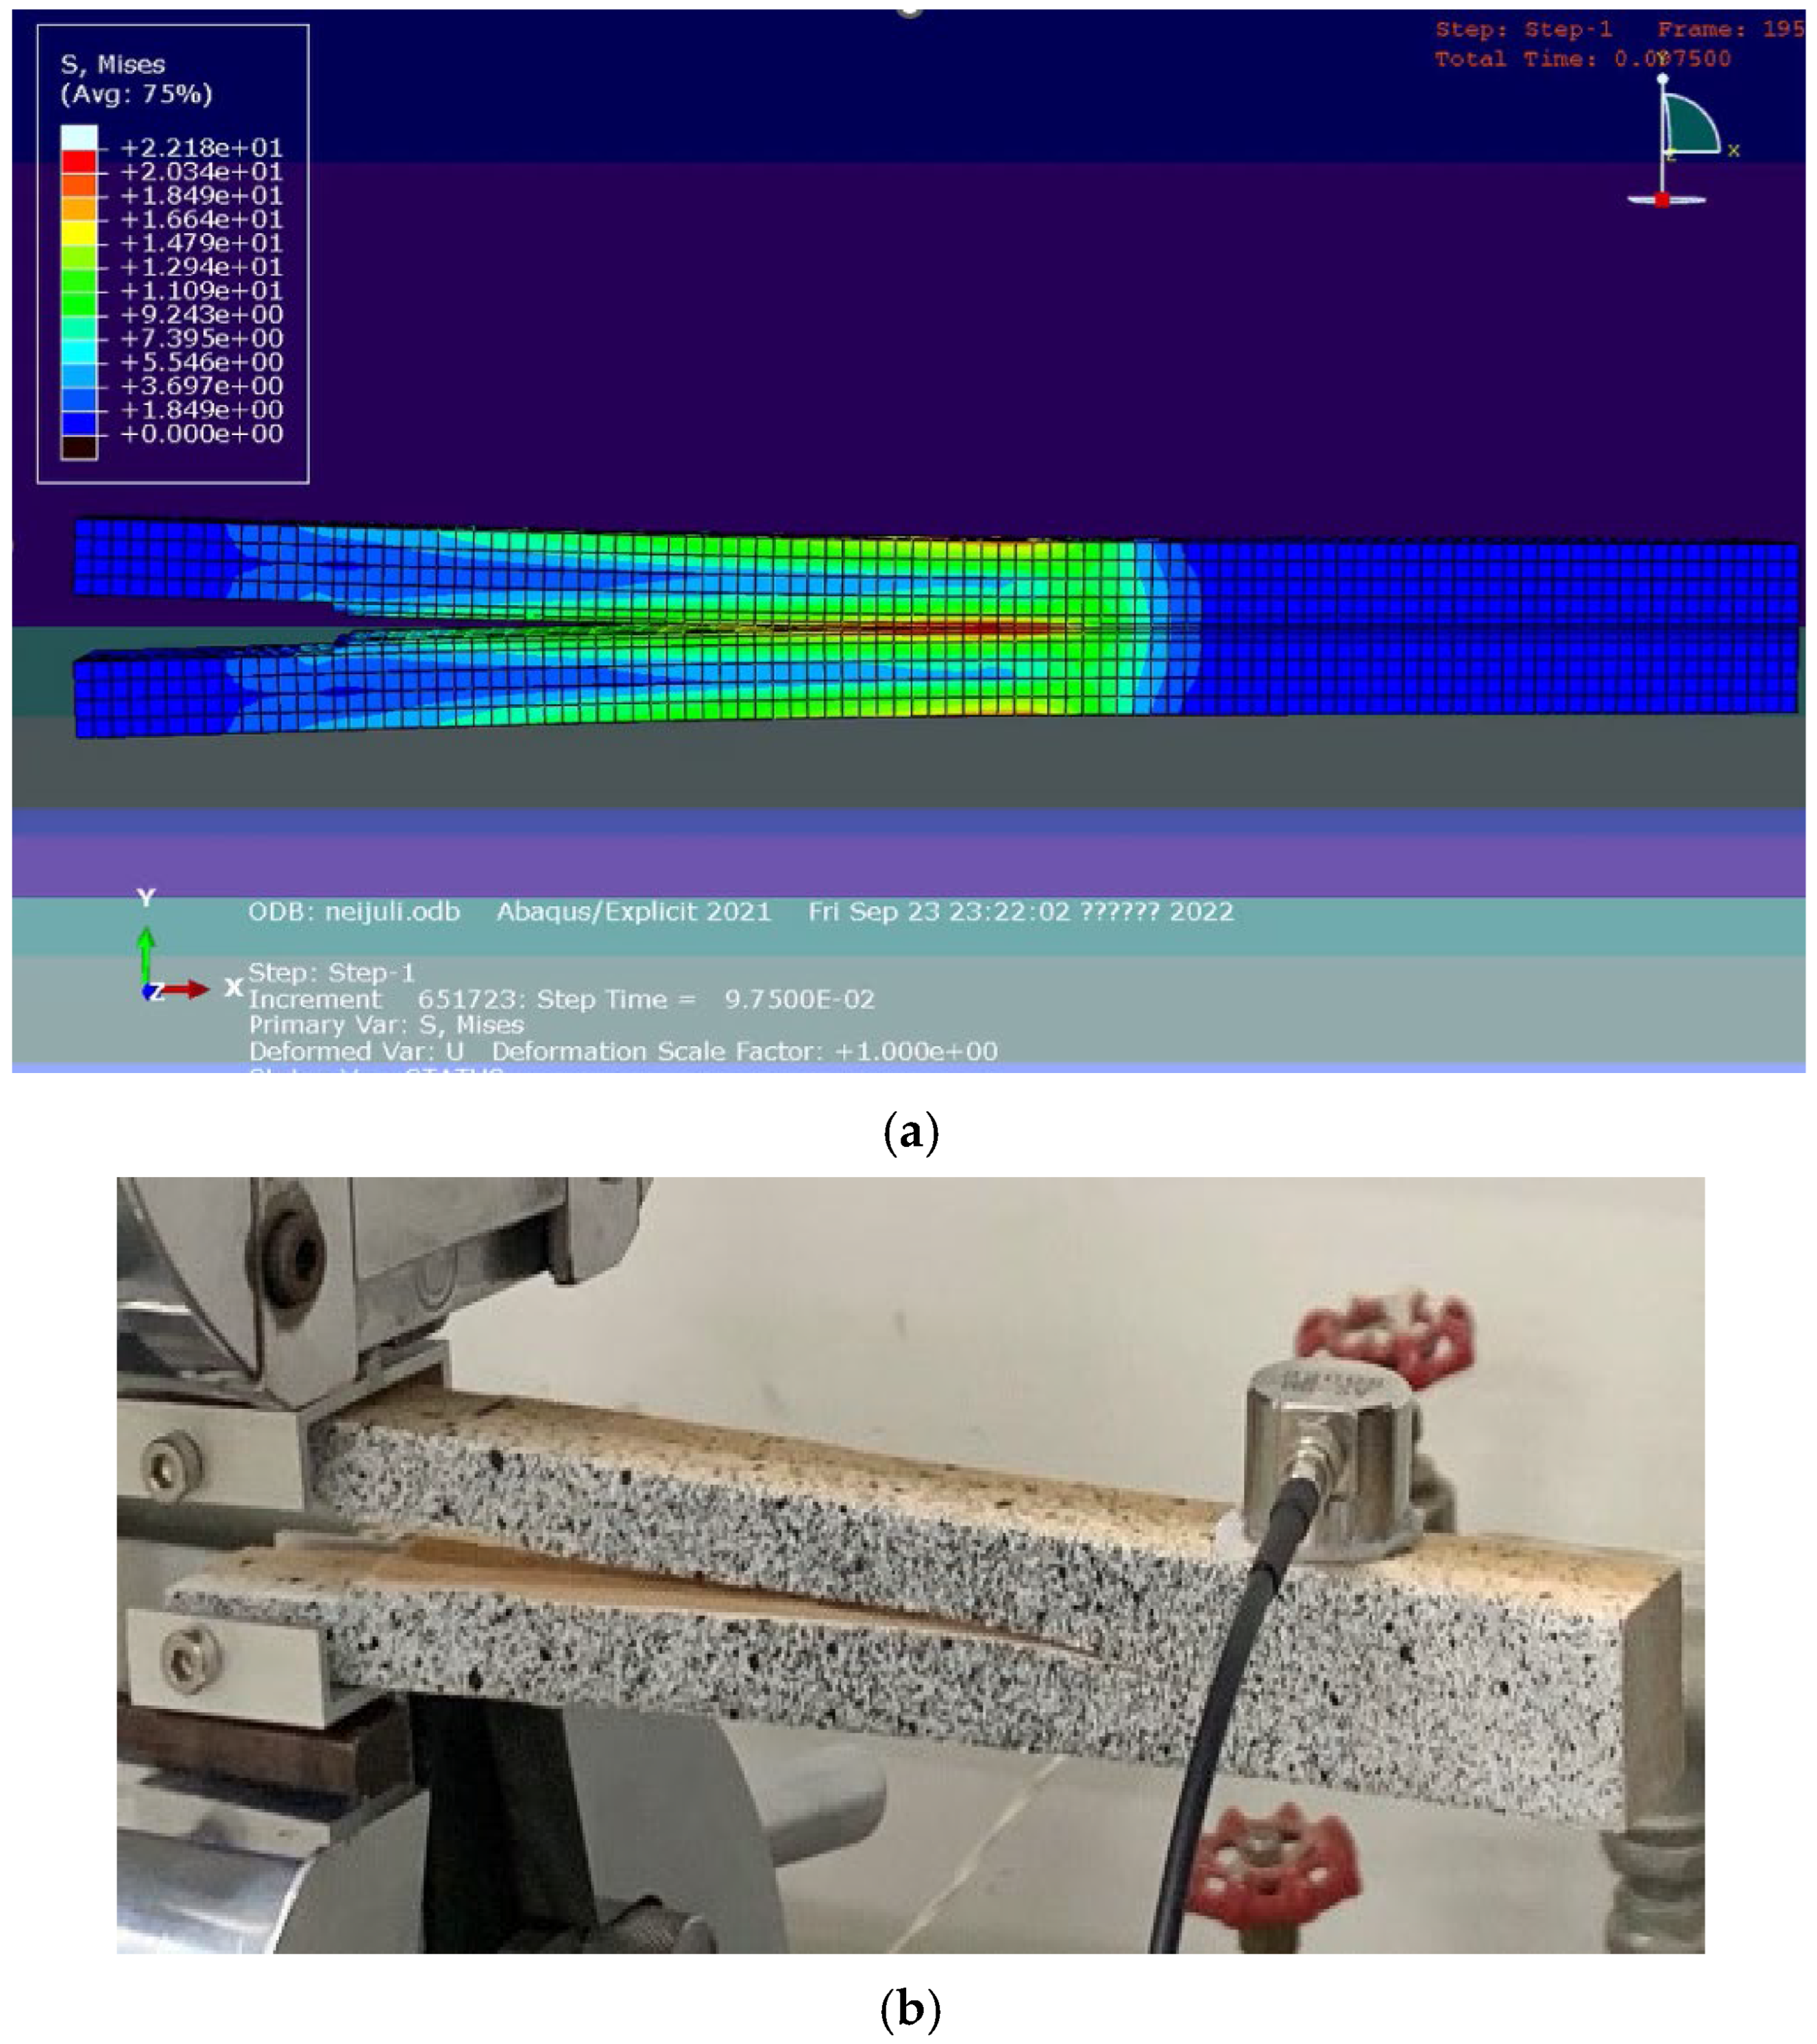
The bilinear softening cohesive zone model parameters from Section 3.3 were implemented in ABAQUS® to simulate both longitudinal grain fracture in double cantilever beam (DCB) tests of Chinese fir. Three specimen groups with varying notch-to-height ratios were used for transverse fracture analysis. Figure 15 and Figure 16 present the finite element simulation results alongside experimental displacement–load curves. Figure 15 demonstrates that zero-thickness cohesive elements effectively simulate longitudinal grain crack propagation in Chinese fir. By incorporating cohesive elements along the crack path with defined softening behavior, the complete fracture process was accurately captured from initial loading through crack propagation, with simulation results closely matching experimental observations. To validate the cohesive bilinear softening constitutive model parameters, load–displacement curves from finite element simulations were compared with experimental results (Figure 16). Both curves showed excellent agreement during the loading phase, with peak loads of 90 N and 93 N, respectively, and the accuracy of the simulation results reached 96.8% (slightly lower than the experimental results), which is consistent with the experimental results. This further shows that the simulation results can better predict the dangerous load of mode I fracture of timber beams. As cracks initiated and propagated, loads decreased in both cases. In experiments, fixture friction eventually halted crack propagation, causing load stabilization at a constant value. Conversely, simulation results showed continued load decrease approaching zero as cracks fully penetrated the specimen. This difference is evident in Figure 16, where the CZM load–displacement curve asymptotically approaches the x-axis while the experimental curve ultimately parallels the x-axis at a constant value.

5. Conclusions

This study proposes an integrated experimental–numerical calibration framework for identifying the parameters of a bilinear cohesive zone model (CZM) for Mode I fracture in anisotropic wood. Based on double cantilever beam (DCB) tests and linear elastic fracture mechanics (LEFM), equivalent crack lengths and R-curves were determined, and a bijective relationship between the R-curve and the cohesive constitutive law was established for inverse parameter identification. A VUMAT subroutine incorporating an embedded zero-thickness cohesive formulation was developed to simulate crack propagation. The numerical results show good agreement with experimental load–displacement responses and crack growth behavior, validating the proposed approach. The calibrated bilinear CZM accurately captures the damage evolution and fracture characteristics of Chinese fir, providing a reliable framework for predicting fracture performance in anisotropic timber structures. Future work will focus on extending the proposed cohesive modeling framework to different wood species and moisture conditions, investigating mixed-mode fracture behavior, refining the energy partition mechanism between microcracking and fiber bridging, and enhancing experimental–numerical coupling strategies for more complex structural configurations. These efforts will further improve the robustness and applicability of the proposed methodology.

Author Contributions

Conceptualization, Z.G.; methodology, J.T. and D.Z.; software, J.T.; formal analysis, J.T.; investigation, J.T. and D.Z.; data curation, Z.T. and J.T.; visualization, J.T. and D.Z.; writing—original draft preparation, Z.T. and J.T.; writing—review and editing, Z.G., D.Z., Z.T. and J.T.; supervision, Z.G.; project administration, Z.G.; funding acquisition, Z.G. All authors have read and agreed to the published version of the manuscript.

Funding

This research was supported by the Beijing Institute of Graphic Communication (BIGC) Project, grant number Ea202514.

Data Availability Statement

All data supporting the findings of this study are included within the article. The data presented in this study are available on request from the corresponding author.

Conflicts of Interest

The authors declare no conflicts of interest.

References

  1. Peng, Y.Y.; Wang, C.; Zhang, X.C.; Zheng, W.; Yu, Y.M. Inorganic-accelerated aging method: An efficient and simple strategy to obtain antique Chinese fir wood for the restoration of ancient wooden architecture. J. Build. Eng. 2024, 84, 108372. [Google Scholar] [CrossRef]
  2. Zhou, C.; Dong, Y.; Hou, M. DGPCD: A benchmark for typical official-style Dougong in ancient Chinese wooden architecture. Herit. Sci. 2024, 12, 201. [Google Scholar] [CrossRef]
  3. Li, A.Q.; Zhou, K.P.; Wang, C.C.; Xie, L.L. Prospective analyses on restoration and reinforcement techniques toward wooden structure of Chinese ancient architectures (Review). J. Southeast Univ. Nat. Sci. Ed. 2019, 49, 195–206. (In Chinese) [Google Scholar]
  4. Zhang, X.M.; Yu, G.X.; Xu, W.F.; Luo, M.; Du, W.W.; Lv, Y.H. Simulation of laser ultrasound in wood nondestructive testing. Appl. Phys. 2018, 8, 480–488. [Google Scholar] [CrossRef]
  5. Zhou, J.N.; Sun, J.C.; Cheng, Z.Q.; Li, L.L.; Yan, Y. Fatigue and self-healing properties of asphalt binders based on the damage growth and crack growth models. Constr. Build. Mater. 2025, 465, 140197. [Google Scholar] [CrossRef]
  6. Liu, L. Simulation of linear EMAT transducer based on Lorentz force mechanism. Appl. Phys. 2022, 12, 461–466. [Google Scholar] [CrossRef]
  7. Kim, Y.J.; Ha, T. Nondestructive and destructive tests for damage quantification of deteriorated structural timber. Constr. Build. Mater. 2025, 469, 140542. [Google Scholar] [CrossRef]
  8. Moura, M.A.N.; Leal, C.E.F.; Moreno Júnior, A.L.; Ferreira, G.C.S.; Parsekian, G.A. Post-fire prediction of residual compressive strength of mortars using ultrasonic testing. Constr. Build. Mater. 2024, 416, 135273. [Google Scholar] [CrossRef]
  9. Gan, Y.D.; Liang, M.F.; Schlangen, E.; van Breugel, K.; Šavija, B. Two scale models for fracture behaviours of cementitious materials subjected to static and cyclic loadings. Constr. Build. Mater. 2024, 426, 136107. [Google Scholar] [CrossRef]
  10. Yan, H.; Tian, L.P.; Feng, R.M.; Mitri, H.; Chen, J.Z.; Zhang, B. Fracture evolution in coalbed methane reservoirs subjected to liquid nitrogen thermal shocking. J. Cent. South Univ. 2020, 27, 1846–1860. [Google Scholar] [CrossRef]
  11. Liu, H.C.; Wang, S.Z.; Zhao, Y.F.; Deng, K.L.; Chen, Z.M. A cyclic self-enhancement technique for complex defect profile reconstruction based on thermographic evaluation. Acta Mech. Sin. 2025, 41, 424076. [Google Scholar] [CrossRef]
  12. Ma, J.; Yang, Z.Q.; Yang, L.J.; Tang, J. A physical view of computational neurodynamics. J. Zhejiang Univ.-Sci. A 2019, 20, 639–659. [Google Scholar] [CrossRef]
  13. Jia, M.H.; Qian, K.; Yu, K.J. Acoustic emission characteristics and failure patterns of basalt fiber and basalt textile reinforced concrete under flexural load. J. Nat. Fibers 2022, 19, 14725–14743. [Google Scholar] [CrossRef]
  14. Zhou, Z.L.; Wang, H.Q.; Cai, X.; Zang, H.Z.; Chen, L.; Liu, F. Bearing characteristics and fatigue damage mechanism of multi-pillar system subjected to different cyclic loads. J. Cent. South Univ. 2020, 27, 542–553. [Google Scholar] [CrossRef]
  15. Park, S.; Rhee, J.H.; Baek, S.; Pyo, S.; Kim, G. A multi-frequency ultrasonic method for nondestructive detection of setting times and internal structure transition of building materials. Constr. Build. Mater. 2024, 425, 136087. [Google Scholar] [CrossRef]
  16. Işık, N.; Halifeoğlu, F.M.; İpek, S. Nondestructive testing techniques to evaluate the structural damage of historical city walls. Constr. Build. Mater. 2020, 253, 119228. [Google Scholar] [CrossRef]
  17. Zhang, L.; Tiemann, A.; Zhang, T.; Gauthier, T.; Hsu, K.; Mahamid, M.; Moniruzzaman, P.K.; Ozevin, D. Nondestructive assessment of cross-laminated timber using non-contact transverse vibration and ultrasonic testing. Eur. J. Wood Wood Prod. 2021, 79, 335–347. [Google Scholar] [CrossRef]
  18. Yazdani, M.; Yavari, A. Scaled boundary finite element method for calculating the J-integral based on LEFM. Mech. Adv. Mater. Struct. 2024, 31, 3817–3828. [Google Scholar] [CrossRef]
  19. Liu, G.G.; Luo, X.; Zhang, Y.Q.; Li, H. Predicting fatigue damage growth in cement-treated base layer built with construction and demolition waste. Constr. Build. Mater. 2023, 406, 133371. [Google Scholar] [CrossRef]
  20. Wang, X.; Liu, Z.; Tong, T.; Wu, D.C. Bond-slip behavior of deformed rebar in grouted duct connection: Experiment, theoretical analysis and cohesive-zone element model. Constr. Build. Mater. 2024, 421, 135694. [Google Scholar] [CrossRef]
  21. Jia, M.H.; Yu, K.J.; Qian, K. Measurement and visualization of crack patterns in basalt fabric reinforced fine-grained concrete with different textile structures using high-speed photography and a cohesive finite element model. Constr. Build. Mater. 2022, 349, 128785. [Google Scholar] [CrossRef]
  22. Tang, X.T.; Sun, H.H.; Wang, C.S.; Sun, C.J.; Peng, X.Y. Tension-bending coupled fatigue life study of semi-parallel steel wire cables using a developed LEFM method. Structures 2024, 69, 107381. [Google Scholar] [CrossRef]
  23. Pirmohammad, S.; Shokorlou, Y.M. Finite element analysis of road structure containing top-down crack within asphalt concrete layer. J. Cent. South Univ. 2020, 27, 242–255. [Google Scholar] [CrossRef]
  24. Kong, C.; Xin, T.; Yang, X.R.; Chen, P.; Qian, Z.X.; Fang, Y.X.; Yang, Y.; Dai, C.Q. Effect of rubber material on mechanical interaction properties of slab-mat composite assembled track. Constr. Build. Mater. 2024, 443, 137837. [Google Scholar] [CrossRef]
  25. Bertolli, V.; Cagnoni, A.; Pisani, M.A.; D’Antino, T. Adhesion of structural bonded oak timber joints: Direct shear test and analytical cohesive model. Constr. Build. Mater. 2025, 486, 141880. [Google Scholar] [CrossRef]
  26. Zhao, W.J.; Liu, C.Y.; Che, P.C.; Ning, Z.L.; Fan, H.B.; Sun, J.F.; Huang, Y.J.; Ngan, A.H.W. Microstructures and mechanical properties of laser-directed energy deposited CrCoNi medium-entropy alloy. Rare Met. 2024, 43, 3286–3300. [Google Scholar] [CrossRef]
  27. Ren, J.J.; Li, H.L.; Cai, X.P.; Deng, S.J.; Wang, J.; Du, W. Viscoelastic deformation behavior of cement and emulsified asphalt mortar in China railway track system I prefabricated slab track. J. Zhejiang Univ. -Sci. A 2020, 21, 304–316. [Google Scholar] [CrossRef]
  28. Gao, X.L.; Su, C.T. Cohesive model of complex friction behaviors in reinforcement-concrete interfaces. Constr. Build. Mater. 2023, 402, 132898. [Google Scholar] [CrossRef]
  29. Yin, Z.Y.; Wang, P.; Dai, S. Microstructures and micromechanics of geomaterials. J. Zhejiang Univ. -Sci. A 2023, 24, 299–302. [Google Scholar] [CrossRef]
  30. Elango, E.; Saravanan, S.; Raghukandan, K. Experimental and numerical studies on aluminum-stainless steel explosive cladding. J. Cent. South Univ. 2020, 27, 1742–1753. [Google Scholar] [CrossRef]
  31. Zhang, H.X.; Liu, H.J.; Zheng, R.C.; Bu, Y.H.; Guo, S.L.; Lu, C.; Ren, Y.Q.; Sun, J.H. Application of ABAQUS Flow-Solid coupling model to evaluate sealing capability of sandstone formation interface based on the cracking behavior of cohesive force units. Constr. Build. Mater. 2023, 409, 133863. [Google Scholar] [CrossRef]
  32. Yin, Z.Y.; Wang, H.L.; Geng, X.Y. Physical model testing in geotechnical engineering. J. Zhejiang Univ. -Sci. A 2022, 23, 845–849. [Google Scholar] [CrossRef]
  33. Luo, H.; Wang, Y.Q.; Zhang, P. Simulation and experimental study of 7A09 aluminum alloy milling under double liquid quenching. J. Cent. South Univ. 2020, 27, 372–380. [Google Scholar] [CrossRef]
  34. Wu, J.-Y. A generalized phase-field cohesive zone model (PF-CZM) for fracture. J. Mech. Phys. Solids 2024, 180, 105841. [Google Scholar] [CrossRef]
  35. Kota, S.K.; Kumar, S.; Giovanardi, B. A discontinuous Galerkin/cohesive zone model approach for the computational modeling of fracture in geometrically exact slender beams. Comput. Mech. 2025, 75, 595–612. [Google Scholar] [CrossRef]
  36. Pech, S.; Lukacevic, M.; Füssl, J. A hybrid multi-phase field model to describe cohesive failure in orthotropic materials, assessed by modeling failure mechanisms in wood. Eng. Fract. Mech. 2022, 271, 108591. [Google Scholar] [CrossRef]
  37. Gómez-Royuela, J.L.; Majano-Majano, A.; Lara-Bocanegra, A.J.; Xavier, J.; de Moura, M.F.S.F. Evaluation of R-curves and cohesive law in mode I of European beech. Theor. Appl. Fract. Mech. 2022, 118, 103220. [Google Scholar] [CrossRef]
  38. Morel, S.; Dourado, N.; Valentin, G.; Morais, J. Wood: A quasibrittle material R-curve behavior and peak load evaluation. Int. J. Fract. 2005, 131, 385–400. [Google Scholar] [CrossRef]
  39. Ziccarelli, A.; Kanvinde, A.; Deierlein, G. Cyclic adaptive cohesive zone model to simulate ductile crack propagation in steel structures due to ultra-low cycle fatigue. Fatigue Fract. Eng. Mater. Struct. 2023, 46, 1821–1836. [Google Scholar] [CrossRef]
  40. Hamidi, K.; Bouziadi, F.; Boulekbache, B.; Hamrat, M.; Tahenni, T.; Haddi, A.; Hawileh, R.A.; Amziane, S. Finite element analysis of interfacial shear behavior for CFRP flexural-externally strengthened reinforced concrete beams using a modified CZM model. J. Compos. Mater. 2025, 59, 1755–1773. [Google Scholar] [CrossRef]
  41. Li, N.; Zhang, S.C.; Wang, H.B.; Ma, X.F.; Zou, Y.S.; Zhou, T. Effect of thermal shock on laboratory hydraulic fracturing in Laizhou granite: An experimental study. Eng. Fract. Mech. 2021, 248, 107741. [Google Scholar] [CrossRef]
  42. Wu, J.-Y.; Huang, Y. Comprehensive implementations of phase-field damage models in Abaqus. Theor. Appl. Fract. Mech. 2020, 106, 102440. [Google Scholar] [CrossRef]
  43. Bažant, Z.P. Concrete fracture models: Testing and practice. Eng. Fract. Mech. 2002, 69, 165–205. [Google Scholar] [CrossRef]
  44. Elices, M.; Guinea, G.V.; Gómez, J.; Planas, J. The cohesive zone model: Advantages, limitations and challenges. Eng. Fract. Mech. 2002, 69, 137–163. [Google Scholar] [CrossRef]
  45. Planas, J.; Elices, M.; Guinea, G.V. Cohesive cracks versus nonlocal models: Closing the gap. Int. J. Fract. 1993, 63, 173–187. [Google Scholar] [CrossRef]
  46. Hillerborg, A.; Modéer, M.; Petersson, P.E. Analysis of crack formation and crack growth in concrete by means of fracture mechanics and finite elements. Cem. Concr. Res. 1976, 6, 773–782. [Google Scholar] [CrossRef]
  47. Petersson, P.E. Crack Growth and Development of Fracture Zones in Plain Concrete and Similar Materials; Report TVBM-1005; Division of Building Materials, Lund Institute of Technology: Lund, Sweden, 1981. [Google Scholar]
  48. Yu, Y.; Xin, R.X.; Zeng, W.H.; Liu, W. Fracture resistance curves of wood in the longitudinal direction based on digital image correlation. Theor. Appl. Fract. Mech. 2021, 114, 102997. [Google Scholar] [CrossRef]
  49. de Moura, M.F.S.F.; Silva, M.A.L.; de Morais, A.B.; Morais, J.J.L. Equivalent crack based mode II fracture characterization of wood. Eng. Fract. Mech. 2006, 73, 978–993. [Google Scholar] [CrossRef]
  50. Morel, S.; Mourot, G.; Schmittbuhl, J. Influence of the specimen geometry on R-curve behavior and roughening of fracture surfaces. Int. J. Fract. 2003, 121, 23–42. [Google Scholar] [CrossRef]
  51. Yoshihara, H. Mode II R-curve of wood measured by 4-ENF test. Eng. Fract. Mech. 2004, 71, 2065–2077. [Google Scholar] [CrossRef]
  52. Tu, J.; Zhao, D.; Zhao, J.; Zhao, Q. Experimental study on crack initiation and propagation of wood with LT-type crack using digital image correlation (DIC) technique and acoustic emission (AE). Wood Sci. Technol. 2021, 55, 1577–1591. [Google Scholar] [CrossRef]
  53. Morel, S.; Lespine, C.; Coureau, J.-L.; Planas, J.; Dourado, N. Bilinear softening parameters and equivalent LEFM R-curve in quasibrittle failure. Int. J. Solids Struct. 2010, 47, 837–850. [Google Scholar] [CrossRef]
  54. Tu, J.; Yu, L.; Zhao, J.; Zhang, J.; Zhao, D. Damage modes recognition of wood based on acoustic emission technique and Hilbert–Huang transform analysis. Forests 2022, 13, 631. [Google Scholar] [CrossRef]
Figure 1. The relationship between interface cohesion and relative displacement.
Forests 17 00351 g001
Figure 2. Progressive evolution process of wood crack damage.
Forests 17 00351 g002
Figure 3. Typical bilinear cohesive zone model.
Forests 17 00351 g003
Figure 4. Equivalent LEFM crack.
Forests 17 00351 g004
Figure 5. The relationship between the load–displacement (P-δ) curve and the resistance curve (R-curve).
Forests 17 00351 g005
Figure 6. Dimensions of Chinese fir double cantilever beams.
Forests 17 00351 g006
Figure 7. Test device.
Forests 17 00351 g007
Figure 8. DCB double cantilever beam experiment.
Forests 17 00351 g008
Figure 9. Load–displacement curve of DCB specimen.
Forests 17 00351 g009
Figure 10. DCB specimen (complete fracture).
Forests 17 00351 g010
Figure 11. Resistance curve of specimen D07.
Forests 17 00351 g011
Figure 12. Constitutive model of fir crack damage evolution.
Forests 17 00351 g012
Figure 13. Solid model and meshing of wooden beam.
Forests 17 00351 g013
Figure 14. Insertion position of cohesion element.
Forests 17 00351 g014
Figure 15. Comparison of crack growth modes between cohesion simulation and DCB test: (a) cohesive simulation result; (b) DCB experimental result.
Forests 17 00351 g015
Figure 16. Results of load–displacement curve of cohesion model and DCB experiment.
Forests 17 00351 g016
Table 1. Measured characteristics of test specimens.
Specimen Numberλ (a0)
10−3 mm/N
ac
(mm)
Cohesive Fracture Energy
GRc (J/m2)
D0119.4223.5197.1
D0222.2325.9204.6
D0318.1822.5187.4
D0428.5730.5215.4
D0633.1333.7220.8
D0723.4526.1207.4
D0820.5624.5201.9
D0928.8923.6195.7
D1019.9822.1183.0
D1125.5428.2215.1
D1223.6727.7210.9
D1318.7821.5174.1
D1418.0822.1175.7
D1526.8629.5213.2
D1625.5129.1209.5
D1732.0131.9217.4
D1819.9924.1199.1
D1921.3324.7205.9
Mean value23.6826.1201.9
Table 2. Test parameters of each specimen.
Specimen NumberGf
(J/m2)
ft
(MPa)
φ
(G/Gf)
wc
(mm)
D01197.16.340.5621.22
D02204.66.290.5121.35
D03187.46.390.6011.15
D04215.46.240.4991.47
D06220.86.210.4951.58
D07207.46.280.5081.41
D08201.96.310.5231.32
D09195.76.340.5511.21
D10183.06.420.6111.11
D11215.16.250.5011.45
D12210.96.270.5051.31
D13174.16.470.6250.90
D14175.76.460.6140.90
D15213.26.250.5051.40
D16209.56.270.5011.43
D17217.46.230.4991.50
D18199.16.330.5401.25
D19205.96.290.5091.38
Mean value201.96.310.5371.29
Table 3. Test parameters of each specimen.
Tree SpeciesDensity
(g/cm3)
EL
(MPa)
ER
(MPa)
ET
(MPa)
μTLμRLμTR
Chinese fir3.6512,20012006100.470.20.43
Disclaimer/Publisher’s Note: The statements, opinions and data contained in all publications are solely those of the individual author(s) and contributor(s) and not of MDPI and/or the editor(s). MDPI and/or the editor(s) disclaim responsibility for any injury to people or property resulting from any ideas, methods, instructions or products referred to in the content.