Article

Soil Carbon Flux Responses to Warming and Drought Are Mediated by Soil Moisture and Vary Among Quercus Species


1
Division of Environmental Science and Ecological Engineering, Korea University, Seoul 02841, Republic of Korea
2
OJEong Resilience Institute, Korea University, Seoul 02841, Republic of Korea
*
Author to whom correspondence should be addressed.
Forests 2026, 17(3), 293; https://doi.org/10.3390/f17030293
Submission received: 29 January 2026 / Revised: 19 February 2026 / Accepted: 24 February 2026 / Published: 26 February 2026

Abstract

Climate change intensifies temperature extremes and drought frequency. However, the interactive effects of warming and drought on soil carbon fluxes remain poorly understood, particularly during extreme temperature events and across plant species. We conducted a factorial experiment examining warming (+3 and +5 °C) and drought effects on soil CO2 emissions and CH4 uptake in one-year-old Quercus variabilis Blume and Quercus acutissima Carruth seedlings during three successive warming periods (period 1, 2–12 July; period 2, 19–30 July; and period 3, 7–18 August 2024). In both species, warming initially increased CO2 emissions by 23%–26% and subsequently reduced them by 26%–37% during period 2 (coinciding with the rainy season), highlighting critical temperature-moisture interactions. Drought reduced CO2 emissions by 12%–36%. CO2 emissions were positively correlated with soil moisture (r = 0.45–0.56). In Q. variabilis, warming initially reduced CH4 uptake at +5 °C; however, during period 3, uptake increased by 44.5% and 24.8% under +3 and +5 °C treatments, respectively, while the drought treatment reduced CH4 uptake by 11.7%. Contrarily, Q. acutissima showed no warming or drought treatment effects. These findings demonstrate that soil carbon flux responses to extreme climate conditions exhibit nonlinearity and are affected by soil moisture and species type.

1. Introduction

Soil greenhouse gases (GHG) fluxes, including CO2 emissions and CH4 uptake, play critical roles in regulating atmospheric composition and global climate [1]. Forest soils are particularly important because they represent notable sources of CO2 through microbial decomposition and root respiration, while simultaneously serving as sinks for atmospheric CH4 through methanotrophic oxidation [2,3,4]. Understanding the response of these fluxes to climate change is essential for predicting future carbon-climate feedback and developing effective mitigation strategies.
Climate projections indicate an increasing frequency and intensity of extreme weather events, including heatwaves and droughts, particularly in temperate regions [1,5]. In South Korea, historical meteorological records show that extreme temperature events (>3–5 °C above normal) can persist for 2–3 weeks during summer months, frequently coinciding with altered precipitation patterns [6]. These short-term climate extremes may elicit different ecosystem responses compared to gradual, long-term changes; however, their effects on soil GHG dynamics remain poorly understood [7]. Most experimental studies have focused on gradual warming or prolonged drought rather than pulse-like extremes, which effectively represent projected climate scenarios [8].
Soil CO2 emissions are driven primarily by microbial decomposition and root respiration, both of which are highly sensitive to temperature and moisture availability [9,10]. Warming typically stimulates soil respiration by increasing enzymatic activity and metabolic rates following temperature-dependent kinetics [11]. However, this relationship is strongly modulated by soil moisture. Water stress can limit substrate diffusion and microbial activity [12], whereas excess moisture or reduced soil porosity from compaction may create conditions that inhibit aerobic processes by limiting oxygen availability [13,14]. The interactive effects of warming and drought on CO2 emissions remain context-dependent and vary with ecosystem type, seasonal moisture patterns, and vegetation characteristics [15].
Soil CH4 uptake is mediated by methanotrophic bacteria that oxidize atmospheric CH4 in well-aerated soils [16]. Methanotrophic activity is regulated by temperature and moisture, although these factors operate through different mechanisms. Warming may stimulate methanotrophic activity through increased enzyme kinetics [17]; however, the effects of soil moisture are complex. Moderate moisture supports microbial activity; however, excess water reduces soil aeration and oxygen availability necessary for aerobic CH4 oxidation, while extreme dryness may limit microbial function [4].
Additionally, vegetation type may modulate soil GHG emissions through differences in litter chemistry, root architecture, and rhizosphere properties that influence soil microbial community composition and activity [3,16,18]. Microbial community structure is determined by species type, as soils under different tree species support either copiotrophic microbial communities associated with rapid nutrient turnover or oligotrophic communities specializing in processing recalcitrant organic matter [19,20], which may fundamentally alter soil carbon cycling responses to environmental change [21]. Furthermore, species differ in their physiological responses to heat and drought stress, including changes in root activity and carbon allocation, which can modify the rhizosphere processes [22,23]. Owing to these species-mediated pathways, understanding the mechanisms by which different tree species modulate soil GHG responses to climate extremes is essential.
However, research on the interactive effects of warming and drought on soil GHG fluxes across different vegetation types and temporal scales remains limited. This knowledge gap is particularly critical for oak-dominated forests in East Asian temperate regions, where Quercus species contribute substantially to forest carbon cycling and are important afforestation species that are projected to experience increased climate extremes [6]. Understanding early-stage seedling responses is critical for predicting afforestation success under future climatic conditions [24].
Therefore, in this study, we investigated the interactive effects of short-term warming (+3 and +5 °C) and drought on soil CO2 emissions and CH4 uptake in nursery plots containing one-year-old seedlings of two ecologically important oak species (Q. variabilis Blume and Q. acutissima Carruth). Realistic extreme climate scenarios were simulated based on 116 years of meteorological records by applying warming and drought treatments during the summer of 2024. We hypothesized that: (1) warming enhances both CO2 emissions and CH4 uptake, with effects modulated by moisture availability; (2) drought reduces CO2 emissions while potentially affecting CH4 uptake through soil physical conditions; and (3) treatment responses vary temporally with seasonal moisture patterns and differ between Q. variabilis and Q. acutissima, indicating species-specific rhizosphere effects.

2. Materials and Methods

2.1. Study Location and Fieldwork

The study was conducted at the Forest Technology and Management Research Center, Pocheon, South Korea (37°45′38.9″ N, 127°10′13.4″ E), using soil composed of 70% sand, 12.5% silt, and 17.5% clay. We established 48 experimental plots (1.5 × 1.0 m) in a complete factorial design with three warming treatments (TC: ambient temperature; T1: +3 °C; T2: +5 °C), two drought treatments (PC: ambient precipitation; DR: drought), and two vegetation treatments (Q. variabilis; Q. acutissima), with four replicates per treatment combination. One-year-old seedlings were obtained from the Forest Management Technology Research Institute and planted uniformly in the experimental plots. A total of 63 seedlings were planted in each plot following standard planting guidelines for seed and seedling management in Korea.
Warming and drought scenarios were designed to simulate extreme events documented in long-term meteorological records (1908–2023) from the Korea Meteorological Administration. Warming treatments (+3 and +5 °C) represented the magnitude of extreme summer temperature differences (3–5 °C above normal) that have historically persisted for 2–3 weeks during heatwave events in South Korea [6]. Analysis of historical records revealed that these extreme temperature events lasted for up to 18–25 days, most frequently occurring in July and August.
Drought conditions were determined using the Standardized Precipitation Evapotranspiration Index (SPEI) calculated using the Hargreaves method [25]. Analysis of two temporal-scale drought indices (SPEI-2-SPEI-24) from historical data (2015–2016) revealed typical summer dry periods, averaging 23 consecutive days. These findings informed the design of the field experiment, wherein warming treatments were applied during three warming periods (period 1: 2–12 July; period 2: 19–30 July; and period 3: 7–18 August), whereas drought treatments were applied during two periods (2–24 July and 29 July–20 August).
Warming was performed using infrared heaters (FT-1000, Mor Electronic Heating Assoc., Comstock Park, MI, USA) positioned 60 cm above the plots and controlled using infrared sensors (SI-111, Apogee Instruments, Logan, UT, USA) connected to a data logger (CR1000X, Campbell Scientific, Inc., Logan, UT, USA). Drought was simulated using automated transparent polyethylene rainout shelters activated by rainfall detection sensors (HTL-301; Haimil, Gyeonggi-do, Republic of Korea) during precipitation events. Environmental variables, including soil temperature and moisture at a depth of 10 cm (CS655, Campbell Scientific, Inc., Logan, UT, USA) and canopy surface temperature, were continuously monitored at 30-min intervals.

2.2. Field Measurements

Soil gas fluxes were measured using static chamber gas chromatography. Static chambers were constructed using polyvinyl chloride (14 cm diameter × 30 cm height) with a removable lid and collar. The collars were installed in the soil for at least 24 h before sampling to minimize disturbance effects. A battery-operated fan was mounted inside each chamber to ensure adequate gas mixing [26]. Gas flux measurements were conducted thrice on the final day of each warming treatment period between 09:00 and 14:00 to minimize diurnal variations [27]. After sealing the chamber, four 20-mL gas samples were collected from the headspace at 0, 15, 30, and 45 min using a 50 mL airtight syringe equipped with a three-way stopcock [28]. The samples were immediately transferred to pre-evacuated vials and transported to the laboratory for analysis.
CO2 and CH4 concentrations were analyzed by gas chromatography using a flame ionization detector (ChroZen; Youngin Chromass, Gyeonggi-do, Republic of Korea). The fluxes were calculated from the linear rate of concentration change over time using the following equation [29]:
F = Δ C Δ τ × V A × M × 1 ν m
where ΔC/Δt is the concentration change rate determined by linear regression of measurements at 0, 15, 30, and 45 min after chamber closure, V is the chamber volume (m3), A is the surface area (m2), M is the molecular weight of the gas (g mol−1), and Vm is the molar volume (m3 mol−1) at sampling temperature calculated via the ideal gas law. CO2 and CH4 fluxes were expressed in mg CO2 m−2 h−1 and µg CH4 m−2 h−1, respectively.

2.3. Data Analysis

Linear mixed-effects models (LMMs) were used to assess the effects of the treatments on environmental variables and carbon fluxes. Dependent variables (soil temperature, air temperature, soil moisture, CO2 emissions, and CH4 uptake) were analyzed separately using independent variables, including warming treatment, drought treatment, species type, period, and all interactions. Plot identity was used as a random effect to account for repeated measurements and between-plot variations. The models were fitted using the restricted maximum likelihood (REML) with the nlme package [30]. Model fit was evaluated using marginal R2 and conditional R2 [31]. Analysis of variance (ANOVA) was performed to test the significance of fixed effects and interactions [32,33]. As preliminary analyses revealed significant species and period interactions for soil and air temperature, CO2 emissions, and CH4 uptake, and drought and warming interactions for soil moisture, period-specific LMMs were fitted separately for each species to examine treatment response patterns across the three periods. These reduced models included warming treatment, drought treatment, and their interactions as fixed effects, with plot identity as a random effect. Post hoc pairwise comparisons were performed using the estimated marginal means (emmeans package [34]) with Tukey’s HSD adjustment. The significance level was set at p = 0.05. Pearson correlation analysis was performed separately for each species, using the HMISC package. Principal component analysis (PCA) was conducted separately for Q. variabilis and Q. acutissima to visualize the multivariate relationships among environmental variables, carbon fluxes, and treatment effects. All statistical analyses were performed using R version 4.2.2.

3. Results

3.1. Soil Temperature and Moisture, and Air Temperature

Warming treatment and period significantly affected both soil and air temperatures, with additional species effects occurring only for air temperature. Significant species and period interactions were observed for both soil and air temperatures. Soil moisture was influenced solely by the period, with a significant interaction between drought and period (Table 1).
The warming treatments consistently elevated the soil and air temperatures across all periods for both species. In Q. variabilis, T2 increased soil temperature by 2.3, 2.0, and 3.0 °C, and air temperature by 4.6, 3.1, and 4.1 °C compared with that of TC during periods 1, 2, and 3, respectively (p < 0.05). Similarly, T1 increased soil temperature by 1.2, 1.0, and 1.8 °C during periods 1, 2, and 3, respectively, and air temperature by 3.1 and 2.9 °C during periods 1 and 3, respectively (p < 0.05). Similar patterns occurred in Q. acutissima, where T2 increased soil temperature by 2.7, 2.5, and 2.9 °C, and air temperature by 4.4, 4.0, and 4.5 °C compared to that of TC during periods 1, 2, and 3 (p < 0.05). T1 increased soil temperature by 1.8, 2.0, and 2.1 °C, and air temperature by 2.5, 2.8, and 3.1 °C during periods 1, 2, and 3, respectively (p < 0.05). Notably, during period 3, both warming treatments exhibited the greatest difference in air temperature from the control for Q. acutissima (p < 0.05).
Drought treatment effects were minimal: in Q. variabilis, DR reduced soil temperature by 0.8 °C compared to that of PC during period 1 only (p = 0.027), whereas no significant drought effects were observed in Q. acutissima across any period. No significant effects of drought treatment were observed on air temperature in either species across any period.
Regarding soil moisture, neither warming nor drought treatments significantly affected soil moisture during any period in Q. variabilis. In Q. acutissima, DR reduced soil moisture by 3.1% v/v compared with PC during period 1 (p = 0.001), and T2 reduced it by 2.3% v/v during period 3 (p = 0.01). Notably, during period 2, soil moisture was the highest across treatments (12%–13% v/v in Q. variabilis and 11%–13% v/v in Q. acutissima; Table A2), coinciding with the rainy season and potentially obscuring treatment-induced differences.

3.2. Soil CO2 Emissions

Warming and drought treatments and periods significantly affected the CO2 emissions. Species had no significant main effect; however, significant interactions were observed between warming and period, drought and period, species and period, and warming, drought, species, and period (p < 0.001; Table 1). Period-specific analyses revealed significant differences between the warming and drought treatments during periods 1 and 2, whereas the drought treatment showed significant effects only during period 3 in both species (Table S2).
CO2 emission responses to warming exhibited distinct temporal dynamics across the three periods. During period 1, warming stimulated emissions in both species: T2 increased emissions by 23.1% in Q. variabilis, whereas T1 increased emissions by 26.2% in Q. acutissima, compared with those of the controls (Figure 1).
This stimulatory effect was reversed during period 2, when warming suppressed emissions: T1 reduced emissions by 26.3% in Q. variabilis, whereas both T1 and T2 reduced emissions by 29.7% and 37.1%, respectively, in Q. acutissima relative to those of the controls, which showed peak emissions (Figure 1). By period 3, warming effects had decreased, with no significant differences detected between species (Figure 1). Notably, during period 2, absolute CO2 emissions reached their highest values across all treatments for both species, despite the suppressed warming response.
Regarding drought treatment, DR suppressed CO2 emissions throughout the three periods. However, the magnitude of drought-induced suppression varied, peaking during period 2, when DR reduced emissions by 31.5% in Q. variabilis and 36.1% in Q. acutissima compared to those of PC (p < 0.05; Figure 1). During periods 1 and 3, the DR effects were moderate, reducing emissions by 23.0% and 11.7% in Q. variabilis and 16.8% and 13.4% in Q. acutissima, respectively (p < 0.05; Figure 1).

3.3. Soil CH4 Uptake

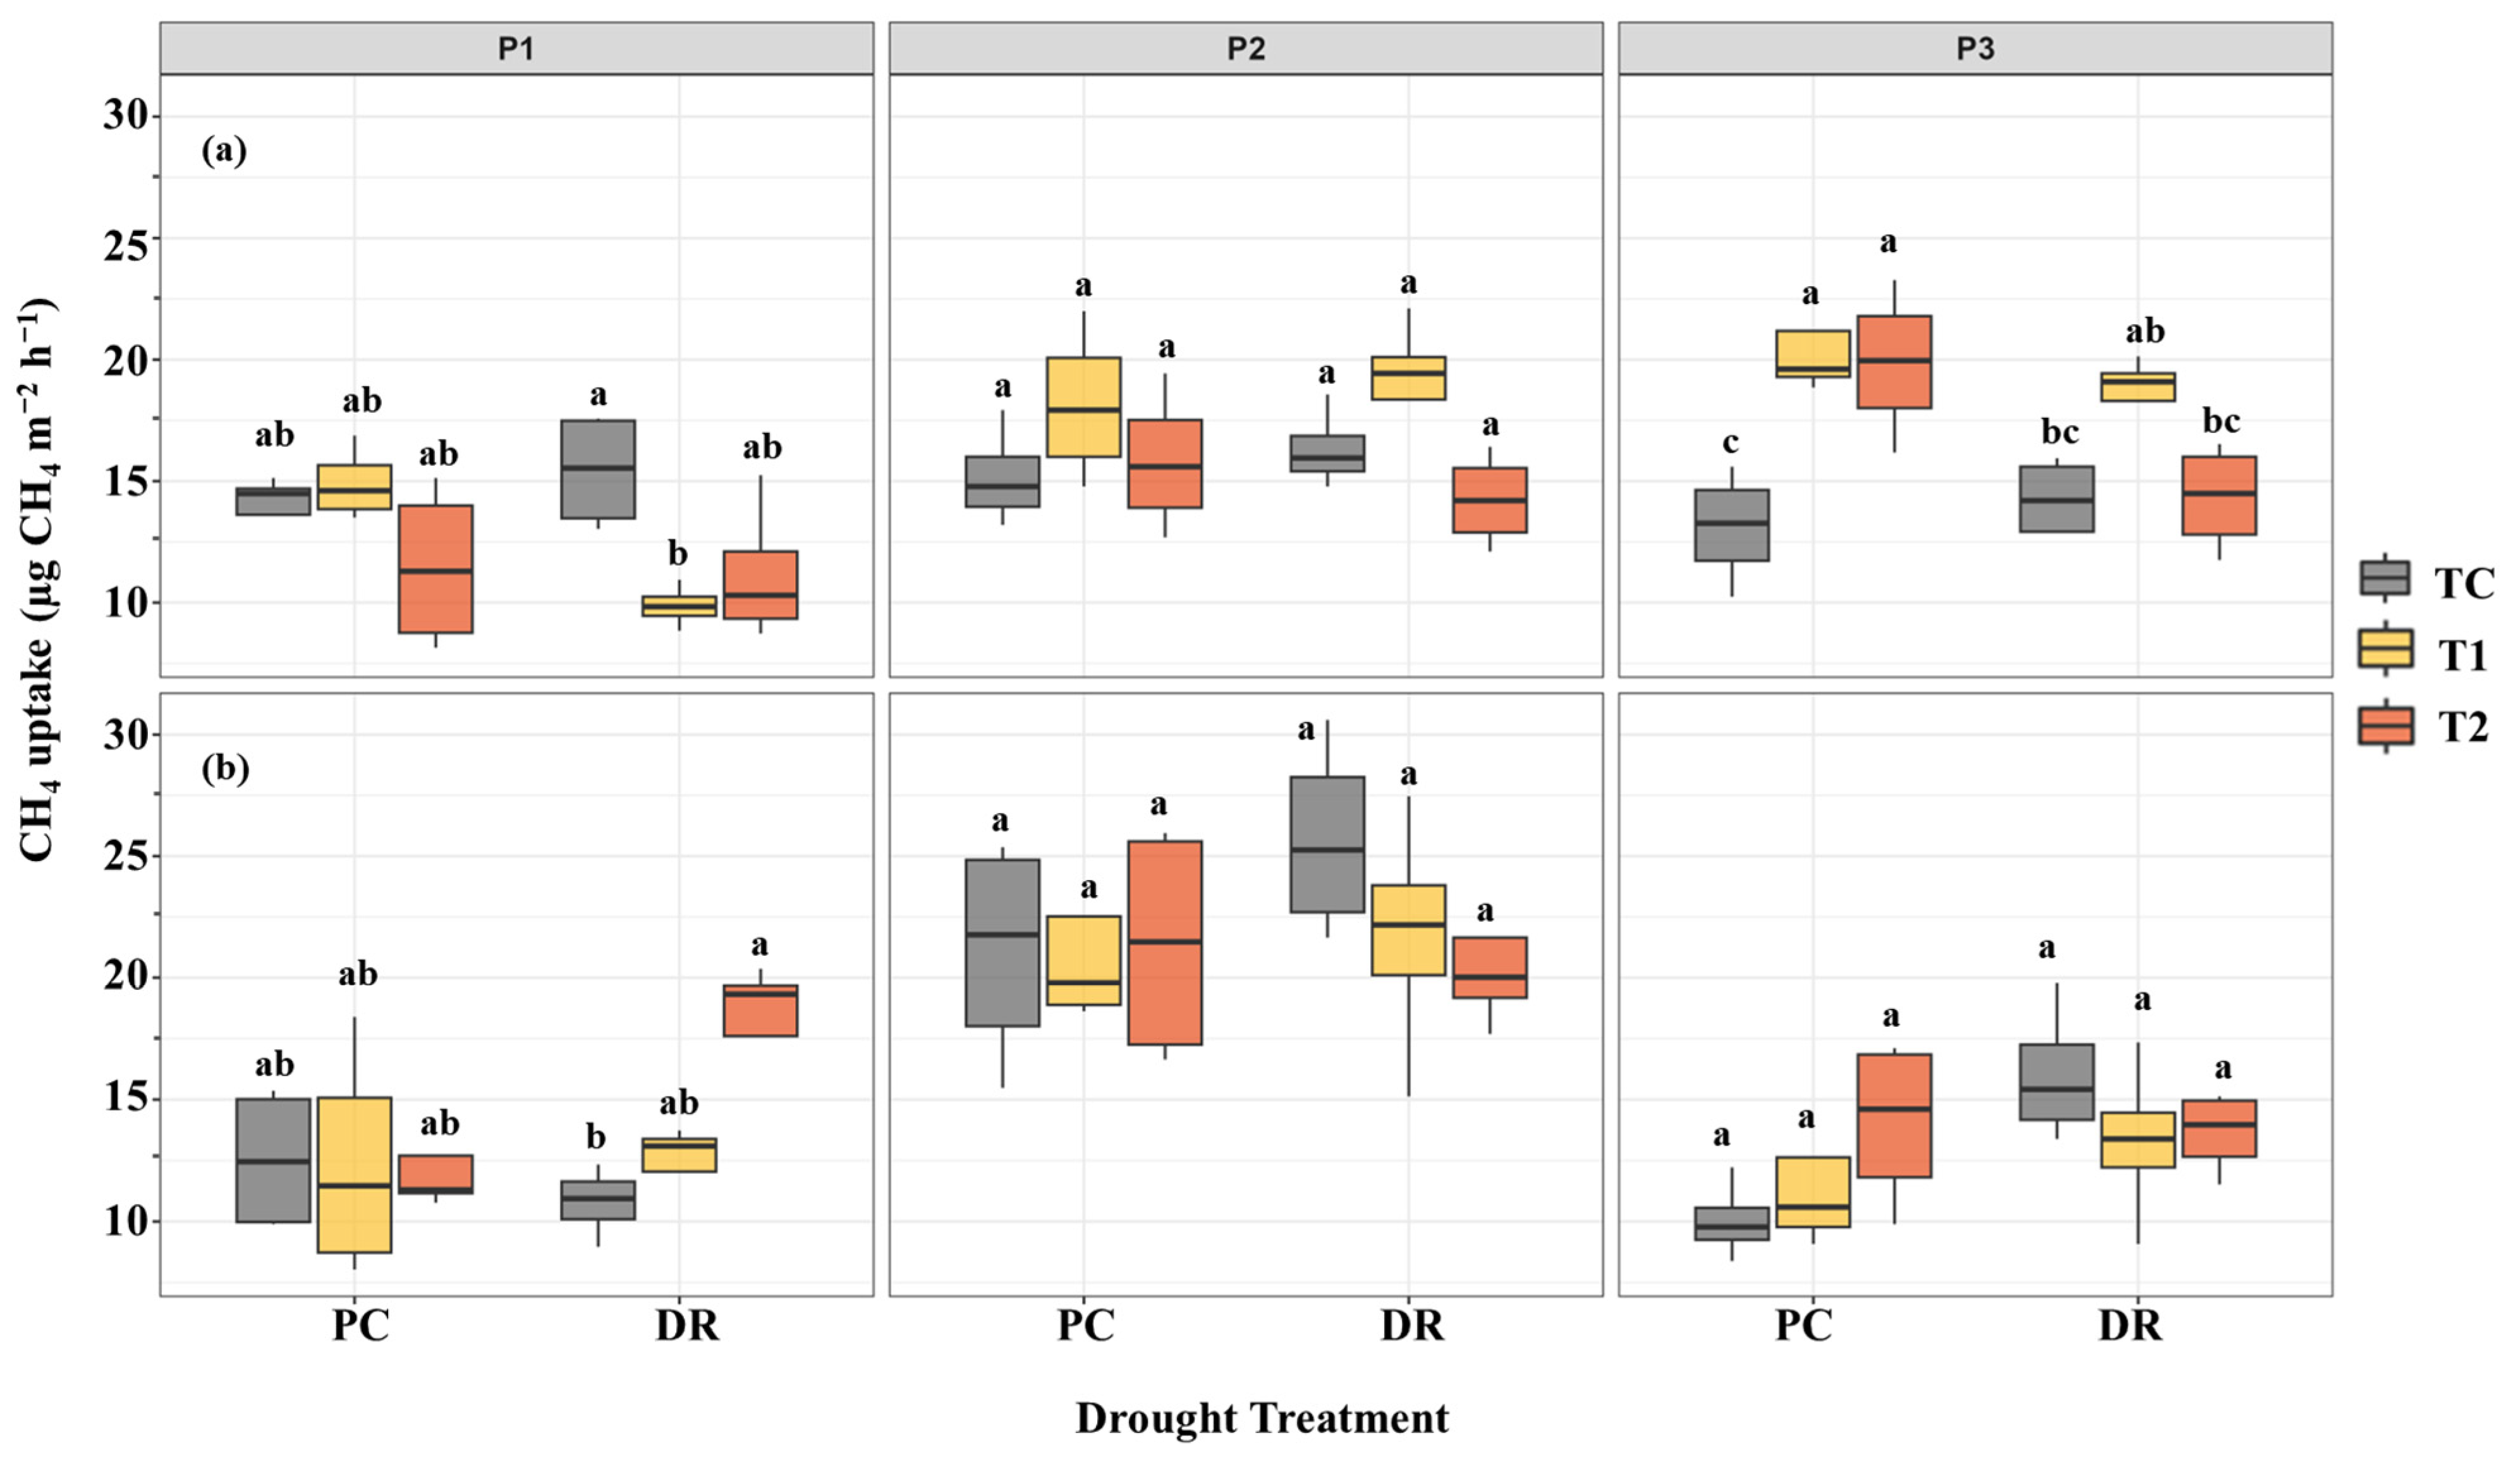
Warming, drought, and species treatments had no significant main effects on CH4 uptake; however, period significantly affected CH4 uptake. Significant interactions were observed between warming and species, drought and species, warming and period, and between species and period (Table 1). In Q. variabilis, period-specific analyses revealed that warming effects were significant during all three periods, drought effects were significant only during period 3, and warming and drought interactions were significant during periods 1 and 3 (Table S2).
In Q. variabilis, T2 initially suppressed CH4 uptake during period 1 by 22.6% compared with that of TC (p = 0.02). An increasing trend in the uptake under warming conditions was observed during period 2 (Figure 2a). This stimulatory effect was most pronounced during period 3, with T1 and T2 increasing the uptake by 44.5% and 24.8%, respectively, compared to that of TC (p < 0.05). In Q. acutissima, no significant warming effects were observed across any period, although T2 showed a marginal trend toward an increased uptake of 26.6% under DR conditions during period 1 (p = 0.08; Figure 2b).
The effects of drought treatment on CH4 uptake were limited. In Q. variabilis, DR reduced uptake by 11.7% compared with that of PC during period 3 (p = 0.04; Figure 2a). No significant drought effects were observed in Q. acutissima during any period (Figure 2b). Notably, the absolute CH4 uptake was higher in period 2 than in period 1 by 68%–138% in this species before declining again in period 3 (Table A2; Figure 2b).

3.4. Correlation with Soil and Air Temperature and Soil Moisture

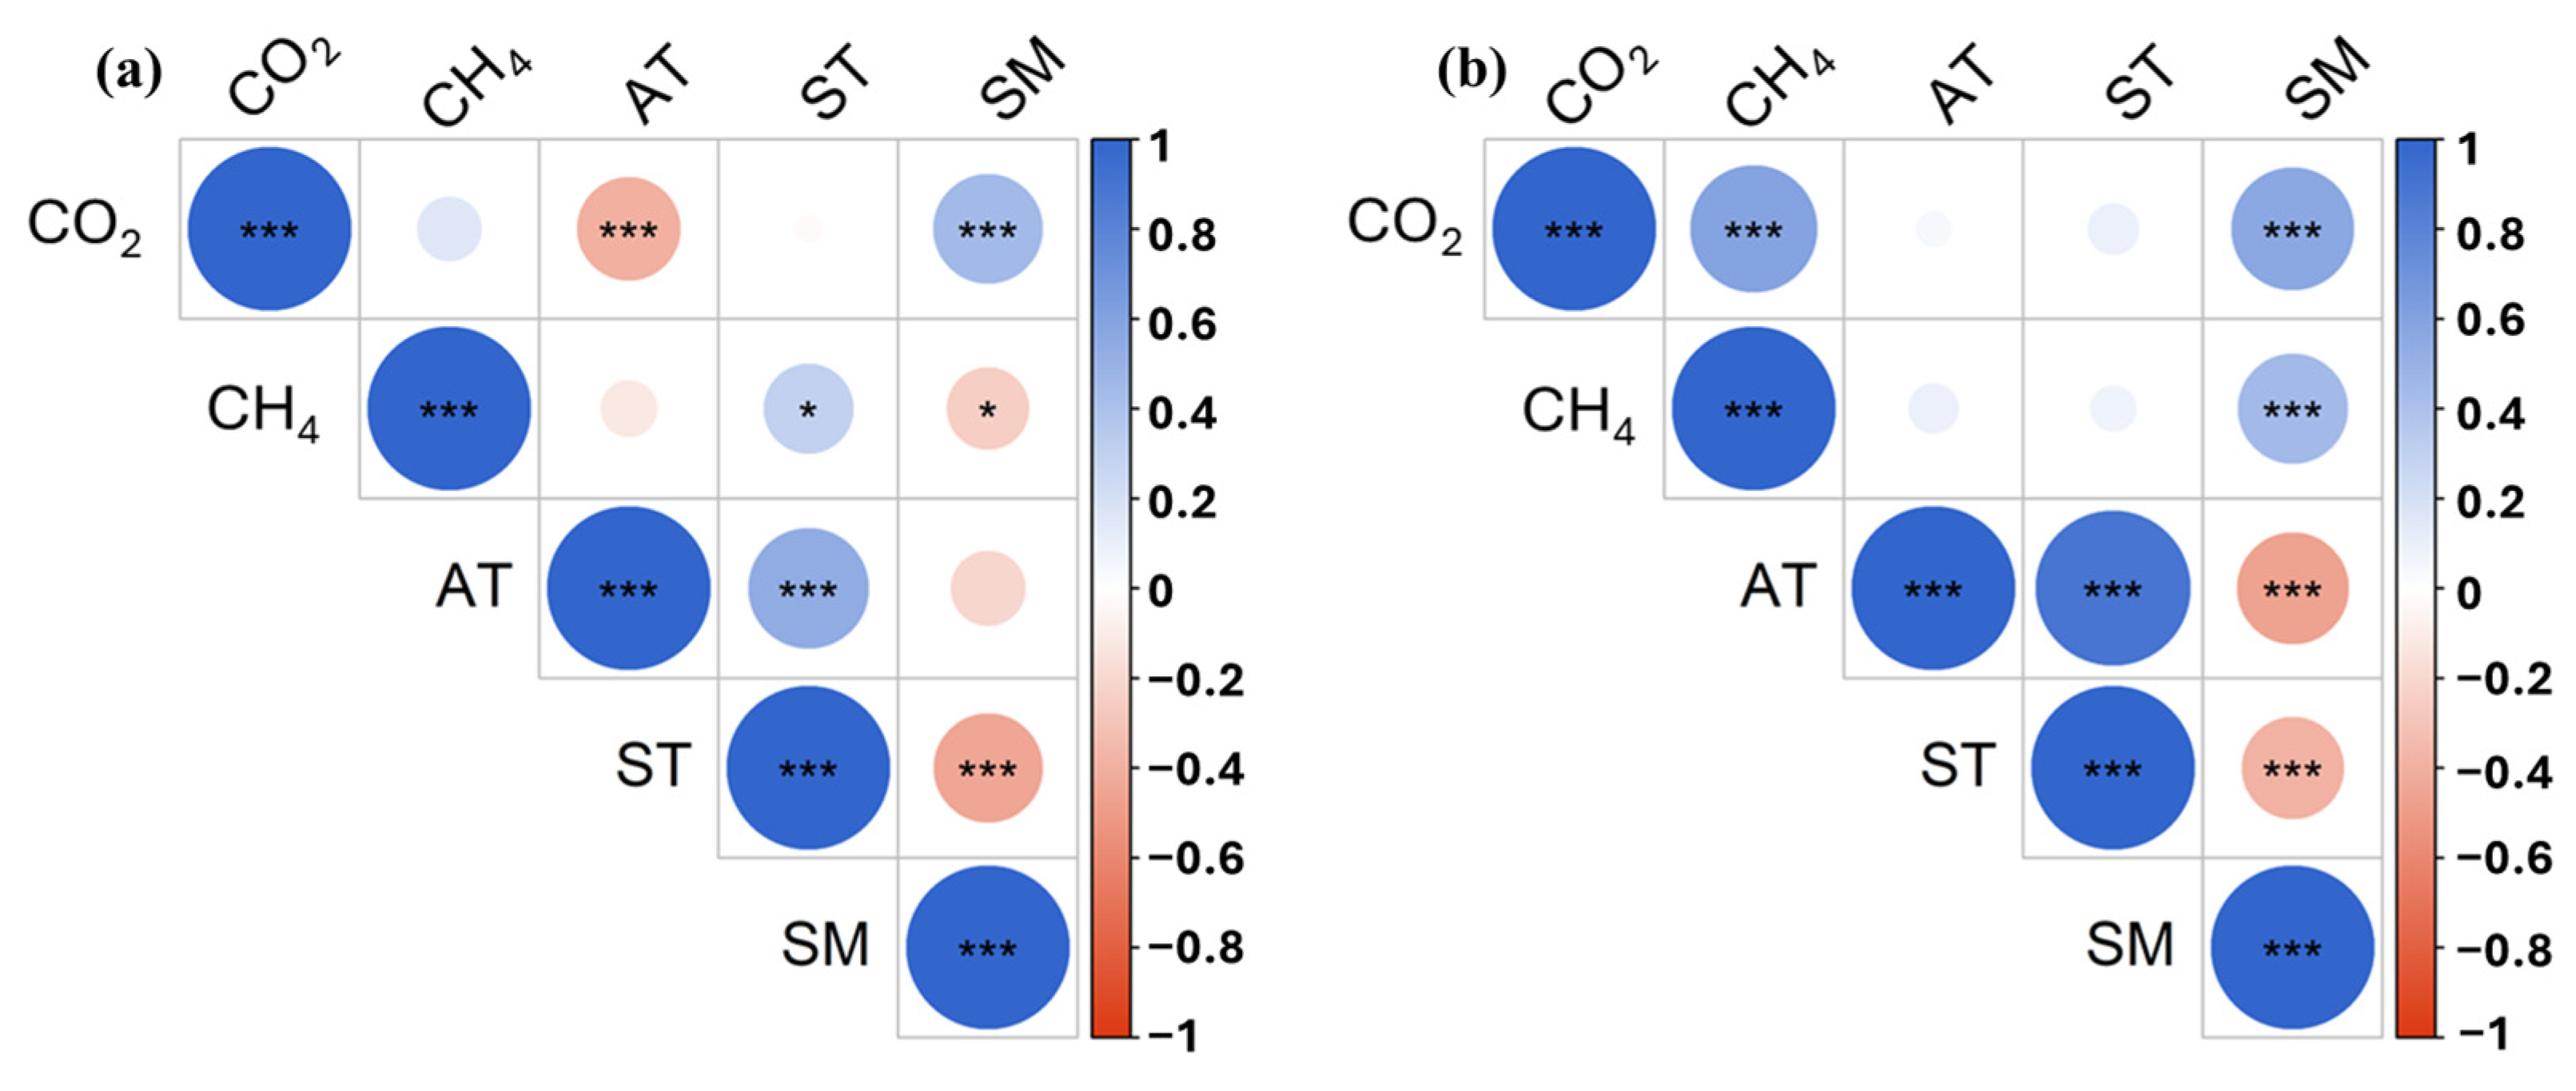
CO2 emissions were positively correlated with soil moisture for both Q. variabilis (r = 0.45, p < 0.001) and Q. acutissima (r = 0.56, p < 0.001; Figure 3). CH4 uptake showed species-specific relationships: positive correlations with soil temperature (r = 0.30, p < 0.05) and negative correlations with moisture (r = −0.25, p < 0.05) in Q. variabilis, and a positive correlation with moisture (r = 0.45, p < 0.001) in Q. acutissima (Figure 3).
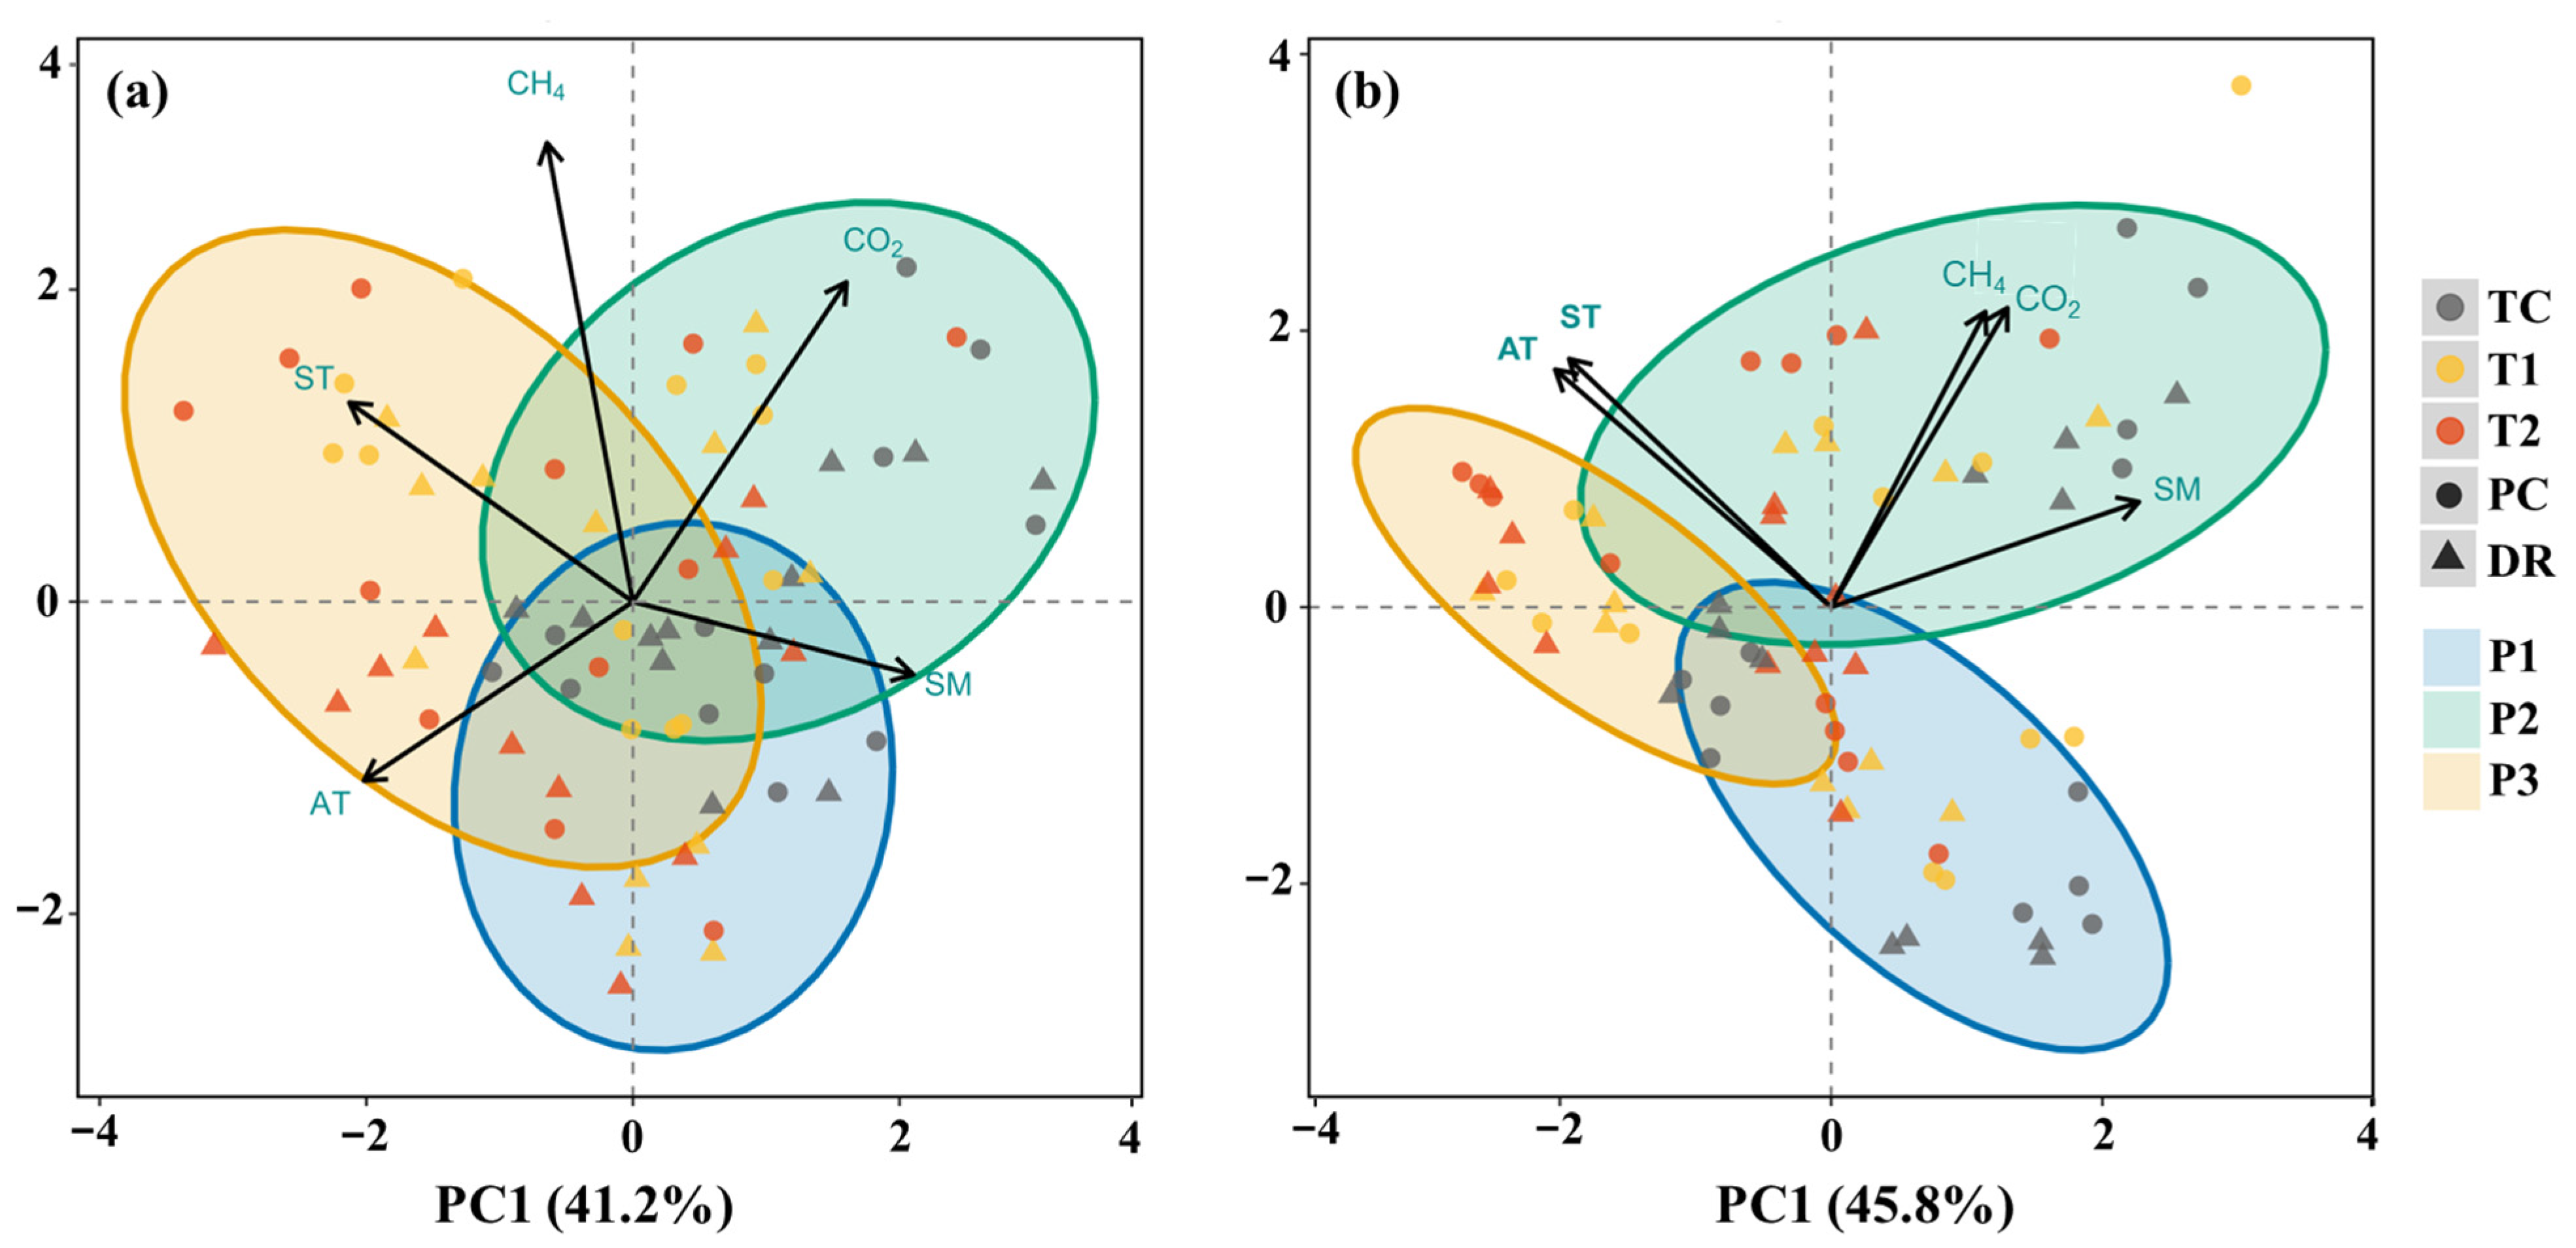
The PCA explained 67.6% of the variance in Q. variabilis and 83.9% in Q. acutissima (Figure 4). PC1 represents the moisture-temperature gradient in both species. In Q. variabilis, CH4 uptake was strongly associated with temperature (PC2), whereas CO2 emissions were intermediate. For Q. acutissima, both fluxes clustered together, indicating similar drivers. Temporal separation was evident, with periods 1, 2, and 3 forming distinct clusters for both species. The treatment effects were more pronounced in Q. acutissima, particularly along PC1, suggesting that this species was more responsive to the experimental manipulation.

4. Discussion

4.1. Treatment Effects on CO2 Emissions

CO2 emissions under warming treatments tended to increase (23%–26%) in period 1, which aligned with the expected temperature sensitivity of soil respiration [35,36]. During this period, when soil moisture was moderate (Table A2), warming likely stimulated microbial and root metabolic activities within the optimal moisture range for enzyme function [37,38].
However, the stimulatory pattern was reversed during period 2, with warm-treated plots showing lower emissions than those of the controls, indicating either thermal acclimation of soil respiration or moisture limitation effects [39,40]. This period coincides with the rainy season, resulting in increased soil moisture (Table A2). The interactions between increased temperatures and saturated soil conditions may limit oxygen availability [13]. Heavy rainfall events have been shown to notably restructure fungal communities at this site, reducing overall fungal diversity by 54% and increasing the relative abundance of Ascomycota by 14% [41]. These treatment-induced shifts in microbial community composition may alter the temperature sensitivity of decomposition processes and contribute to the reduced warming effects observed during the rainy period, although this requires direct verification through concurrent microbial community analysis [39,42].
Notably, absolute CO2 emissions peaked during period 2 across all treatments. This demonstrates that, although warming reduced emissions relative to ambient controls during this period, the increased soil moisture overrode this suppression effect, resulting in the highest absolute CO2 emissions despite the reduced warming responses [43]. The strong correlations between CO2 emissions and soil moisture (r = 0.45–0.56) support this interpretation and align with previous studies showing that moisture availability is a crucial driver of microbial activity and root respiration in temperate forest soils [10,43,44,45,46]. These findings are consistent with those of meta-analyses showing that precipitation changes exert stronger control on soil CO2 emissions than temperature changes in water-limited ecosystems [15,47]. This pattern is particularly important, as most warming experiments have demonstrated sustained increases in soil respiration without considering potential mid-season reversals [43,48,49,50,51].
The consistent suppression of CO2 emissions under drought conditions (12%–36% reduction) across all periods supports the widely documented moisture limitation of soil respiration [52]. At this site, complete rainfall exclusion for 8–10 weeks reduced the microbial biomass carbon and nitrogen by 10% and 15%, respectively [53], indicating rapid microbial community responses to moisture stress that likely underpinned the CO2 emission reductions we observed. The greatest reductions during period 2 (31%–36%) coincided with increased summer temperatures, indicating that the combined heat and drought stress may impose severe constraints on microbial activity and root respiration [12]. This pattern indicates that period 2 represents the most sensitive phase for both warming and drought treatment effects on soil CO2 emissions.
The stronger warming effects observed in Q. acutissima than in Q. variabilis may indicate species-specific differences in root respiration rates, root exudation patterns, litter quality, or rhizosphere microbial communities [54,55]. Previous studies have shown that plant species types strongly influence the soil microbial communities through litter quality, and root exudation chemistry [18,56]. Copiotrophic bacterial communities (e.g., Proteobacteria) associated with labile carbon sources typically exhibit higher metabolic rates and stronger temperature sensitivity than oligotrophic communities specialized for recalcitrant organic matter decomposition [20]. Preliminary microbial community analysis data from our experimental plots revealed species-specific patterns consistent with differential carbon cycling strategies. Q. acutissima soils exhibited higher associations with resource-related variables, such as microbial biomass carbon, total carbon, and nitrogen, and greater Proteobacteria abundance, whereas Q. variabilis soil had a higher abundance of Actinobacteria and Ascomycota (Kwon et al., in preparation) [57]. These findings suggest that Q. acutissima has more active copiotrophic communities associated with rapid labile carbon turnover, whereas Q. variabilis supports taxa that specializes in recalcitrant organic matter decomposition [20,58,59]. These species-specific effects on the microbial community structure can notably alter the temperature sensitivity of soil respiration, with copiotrophic communities typically exhibiting increased metabolic responses to warming [39,60,61].

4.2. Treatment Effects on CH4 Uptake

The contrasting responses of CH4 uptake to warming between species and across periods highlight the complexity of methanotrophic activity during extreme temperature events. In Q. variabilis, warming initially suppressed CH4 uptake in period 1; however, this effect was reversed in the following periods, with consistently enhanced uptake during periods 2 and 3, reaching 44.5% and 24.8% enhancements under T1 and T2, respectively, by period 3. The shift from warming-induced suppression to enhancement of CH4 uptake suggests acclimation of methanotrophic communities to elevated temperatures. This interpretation is supported by the positive correlation between CH4 uptake and soil temperature (r = 0.30), coupled with a negative correlation with soil moisture (r = −0.25), indicating that methanotrophic bacteria in these plots are temperature-stimulated and moisture-sensitive. Elevated temperatures likely increase methanotroph metabolic rates and CH4 oxidation kinetics, whereas reduced moisture levels under drought conditions improve soil aeration and oxygen availability for aerobic methanotrophs [62,63,64].
By contrast, Q. acutissima showed no significant warming effects across any period, despite marginal warming and drought interactions during period 1. However, this species showed a distinct pattern in period 2, where CH4 uptake increased by 68%–138% from period 1 to 2, coinciding with the rainy season, when soil moisture peaked at 11–13 vol% (Table A2). Additionally, the positive correlation with soil moisture (r = 0.42), in contrast to that of Q. variabilis, suggests fundamentally different moisture-methanotroph relationships between species [65,66,67]. Increased moisture during period 2 may have enhanced CH4 diffusion through the soil to methanotrophic microsites or maintained optimal hydration levels for methanotrophic enzyme activity despite potential constraints on oxygen availability [68,69].
The less pronounced drought effects on CH4 uptake compared to those of CO2 emissions (only 12% reduction in Q. variabilis) suggest that methanotrophic activity may be more resilient to moisture stress than the broader heterotrophic respiration [19,70].

5. Conclusions

This study, using one-year-old Quercus seedlings, revealed that soil carbon flux responses to climate extremes are nonlinear and vary with species and soil moisture conditions. Our key findings included the following: (1) warming effects on CO2 emissions were highly dynamic, shifting from stimulation (23%–26%) during moderate moisture conditions to suppression during the rainy season, likely owing to thermal acclimation and oxygen limitation; (2) drought consistently suppressed CO2 emissions (12%–36%) across all periods, likely due to the moisture limitation of CO2 emissions; and (3) species-specific responses were pronounced, with Q. acutissima showing stronger warming sensitivity than that of Q. variabilis, which was attributed to differences in microbial community composition. For CH4 uptake, Q. variabilis progressively enhanced CH4 uptake under warming (24.8%–44.5% by period 3), whereas drought moderately reduced CH4 uptake, suggesting methanotrophic resilience to moisture stress. By contrast, Q. acutissima showed no significant warming or drought effects on CH4 uptake and showed stronger moisture dependency.
These patterns provide insights into the early-stage forest responses to climate extremes; however, they may not fully capture the complexity of mature forest ecosystems characterized by deeper soil profiles, long-established root systems, and more developed microbial communities. Therefore, future studies must consider the different forest ages and rhizosphere development stages to better represent the natural ecosystem dynamics.
In addition, the relatively short experimental duration limits our ability to assess long-term acclimation, recovery processes, and non-linear ecosystem responses. To address these limitations, future research should (1) extend the experimental duration to multi-seasonal and multi-year to evaluate longer-term acclimation and recovery dynamics, (2) integrate microbial community analysis with functional gene expression to better understand the mechanistic drivers, and (3) examine whether the shift observed in carbon fluxes is consistent across multiple growing seasons or represents a temporary, year-specific phenomenon. Nevertheless, our findings highlight that single-time point measurements and linear assumptions may fundamentally mischaracterize ecosystem responses to climate extremes.

Supplementary Materials

The following supporting information can be downloaded at: https://www.mdpi.com/article/10.3390/f17030293/s1, Table S1. Period effects on soil temperature (ST), air temperature (AT), and soil moisture (SM) in Quercus variabilis and Quercus acutissima seedlings; Table S2. Period effects on soil CO2 emissions and CH4 uptake in Quercus variabilis and Quercus acutissima seedlings.

Author Contributions

Conceptualization, Y.S.; data collection, A.S.; software, A.S.; formal analysis, A.S.; writing—original draft preparation, A.S.; writing—review and editing, A.S., H.J., J.-M.L., D.K. and Y.S.; visualization, A.S.; supervision, Y.S.; project administration, Y.S.; funding acquisition, Y.S. All authors have read and agreed to the published version of the manuscript.

Funding

This work was supported by the National Research Foundation of Korea (NRF) (Grant No. 2022R1A2C1011309); the Basic Science Research Program through the National Research Foundation of Korea (NRF) funded by the Ministry of Education (RS-2021-NR060142); and the Carbon Neutral Infrastructure Building Program provided by the Korea Forestry Promotion Institute (KoFPI RS-2024-00403486).

Data Availability Statement

All data are presented in the paper.

Conflicts of Interest

The authors declare no conflicts of interest. Funding sponsors had no role in the design of this study; collection, analyses, or interpretation of data; writing of the manuscript; or decision to publish the results.

Abbreviations

The following abbreviations are used in this manuscript:
ANOVAAnalysis of variance
ATAir temperature
LMMLinear mixed-effects models
PCAPrincipal component analysis
REMLRestricted maximum likelihood
SMSoil moisture
SPEIStandardized Precipitation Evapotranspiration Index
STSoil temperature

Appendix A

Table A1. Mean air temperature (AT), soil temperature (ST), soil moisture (SM), soil CO2 emissions, and CH4 uptake under different treatments and species, presented as the mean ± standard error.
VariablesTCPCTCDRT1PCT1DRT2PCT2DR
Quercus
variabilis
AT (°C)33.56 ± 0.43 b33.42 ± 0.61 b36.34 ± 0.38 a36.35 ± 0.60 a37.08 ± 0.48 a37.76 ± 0.70 a
ST (°C)28.23 ± 0.41 cd27.85 ± 0.41 d29.72 ± 0.51 b28.96 ± 0.41 bc 30.91 ± 0.51 a29.88 ± 0.48 ab
SM (% v/v)9.52 ± 1.41 a9.62 ± 1.02 a9.22 ± 1.02 a8.88 ± 1.10 a8.24 ± 1.47 a9.25 ± 1.22 a
CO2 84.91 ± 14.87 a62.44 ± 8.36 bc72.04 ± 8.28 abc58.52 ± 5.69 c78.74 ± 11.20 ab56.04 ± 5.88 c
CH414.02 ± 0.61 b15.34 ± 0.56 ab17.96 ± 1.02 a15.84 ± 1.38 ab15.70 ± 1.32 ab13.22 ± 0.76 b
Quercus
acutissima
AT (°C)31.37 ± 0.89 c31.28 ± 0.85 c33.83 ± 1.02 b34.33 ± 0.81 ab35.75 ± 0.96 a35.51 ± 0.80 a
ST (°C)27.36 ± 0.58 b27.28 ± 0.56 b29.19 ± 0.70 a29.33 ± 0.65 a30.28 ± 0.75 a29.72 ± 0.58 a
SM (% v/v)11.02 ± 1.06 a8.71 ± 0.89 ab10.30 ± 1.56 a8.64 ± 0.99 ab8.49 ± 0.91 ab6.50 ± 0.82 b
CO2 102.11 ± 20.85 a67.80 ± 11.45 bc80.61 ± 12.66 b63.90 ± 8.12 bc75.08 ± 10.84 bc55.66 ± 5.56 c
CH414.55 ± 1.68 a17.49 ± 2.02 a15.25 ± 1.77 a15.78 ± 1.60 a15.99 ± 1.55 a17.46 ± 1.17 a
CO2 emissions are presented in mg CO2 m−2 h−1, and CH4 uptake is presented in µg CH4 m−2 h−1. TC = ambient temperature, T1 = +3 °C, T2 = +5 °C, PC = ambient precipitation, and DR = drought. Different lowercase letters within a row indicate significant differences among treatments within each species (p < 0.05).
Table A2. Mean air temperature (AT), soil temperature (ST), soil moisture (SM), soil CO2 emissions, and CH4 uptake by species, treatment, and period (P), presented as the mean ± standard error.
SpeciesVariablesPTCPCTCDRT1PCT1DRT2PCT2DR
Quercus variabilisAT (°C)133.56 ± 0.4133.84 ± 0.6336.67 ± 0.3536.88 ± 0.5937.99 ± 0.4838.54 ± 0.59
232.71 ± 1.1032.25 ± 1.4235.18 ± 0.7734.93 ± 1.2935.27 ± 0.5435.86 ± 1.53
334.42 ± 0.4734.18 ± 1.0437.18 ± 0.4637.24 ± 0.9937.97 ± 0.6238.87 ± 0.94
ST (°C)126.95 ± 0.3226.54 ± 0.6028.14 ± 0.2827.59 ± 0.2929.64 ± 0.4128.30 ± 0.31
228.02 ± 0.3627.86 ± 0.4629.20 ± 0.3128.63 ± 0.2430.27 ± 0.3729.46 ± 0.31
329.72 ± 0.5629.16 ± 0.4031.82 ± 0.6030.65 ± 0.4132.83 ± 0.8131.87 ± 0.46
SM (% v/v)110.70 ± 2.319.47 ± 0.5210.45 ± 0.529.90 ± 1.519.87 ± 2.4610.22 ± 1.08
212.30 ± 2.5013.40 ± 1.2112.20 ± 1.2611.50 ± 1.7510.97 ± 2.6612.70 ± 1.84
35.56 ± 1.395.97 ± 0.615.00 ± 0.445.22 ± 0.923.87 ± 0.884.82 ± 0.95
CO2 147.22 ± 4.4534.94 ± 1.8454.11 ± 2.3541.73 ± 4.5956.43 ± 2.3844.74 ± 2.92
2153.49 ± 5.9998.75 ± 5.34103.79 ± 15.3582.20 ± 5.68123.65 ± 8.7080.07 ± 8.46
354.01 ± 4.3053.63 ± 4.3558.20 ± 2.3651.62 ± 2.5456.12 ± 3.1743.31 ± 3.30
CH4113.81 ± 0.8915.41 ± 1.2114.89 ± 0.759.86 ± 0.4311.46 ± 1.7111.14 ±1.45
215.16 ± 1.0116.31 ± 0.8118.15 ± 1.6019.02 ± 1.4415.82 ± 1.4714.22 ± 0.97
313.09 ± 1.1714.31 ± 0.8120.85 ± 1.5118.64 ± 0.8219.84 ± 1.5514.31 ± 1.12
Quercus acutissimaAT (°C)127.77 ± 0.7527.94 ± 0.8229.45 ± 0.1031.22 ± 0.7131.99 ± 1.0632.59 ± 0.70
232.14 ± 0.9431.56 ± 0.6434.82 ± 0.8034.39 ± 0.65 36.36 ± 0.9035.41 ± 0.78
334.18 ± 0.4034.34 ± 0.1137.24 ± 0.4737.39 ± 0.1538.89 ± 0.4138.54 ± 0.27
ST (°C)124.92 ± 0.1724.89 ± 0.0626.31 ± 0.2827.05 ± 0.5327.51 ± 0.3627.74 ± 0.43
227.78 ± 0.3327.67 ± 0.2429.64 ± 0.5029.70 ± 0.8830.61 ± 0.8029.79 ± 0.65
329.39 ± 0.4229.28 ± 0.3931.62 ± 0.5631.24 ± 0.7632.73 ± 0.9331.64 ± 0.76
SM (% v/v)112.25 ± 1.018.77 ± 1.0211.82 ± 1.668.87 ± 0.739.69 ± 0.606.78 ± 0.68
213.72 ± 1.0111.70 ± 1.0814.07 ± 3.0112.00 ± 1.4710.95 ± 1.079.30 ± 0.97
37.10 ± 1.015.67 ± 0.675.02 ± 0.115.05 ± 0.294.85 ± 0.853.42 ± 0.51
CO2 146.63 ± 5.0133.22 ± 1.8654.62 ± 2.1346.19 ± 3.7444.13 ± 3.4941.15 ± 3.49
2198.34 ± 7.49118.99 ± 7.47129.11 ± 23.9094.09 ± 15.60124.22 ± 5.6475.40 ± 10.33
361.37 ± 6.1951.20 ± 4.4458.11 ± 3.2751.42 ± 2.7556.90 ± 3.7850.08 ± 3.69
CH4112.53 ± 1.4910.79 ± 0.7112.33 ± 2.4012.33 ± 0.9812.55 ± 1.4417.94 ± 1.73
221.09 ± 2.37 25.68 ± 2.0521.61 ± 2.2621.73 ± 2.5321.38 ± 2.5120.80 ± 1.66
310.03 ± 0.8016.01 ± 1.4011.81 ± 1.7713.29 ± 1.6814.05 ± 1.7413.64 ± 0.84
CO2 emissions are presented in mg CO2 m−2 h−1, and CH4 uptake is presented µg CH4 m−2 h−1. CO2 emissions are presented in mg CO2 m−2 h−1, and CH4 uptake is presented µg CH4 m−2 h−1. TC = ambient temperature, T1 = +3 °C, T2 = +5 °C, PC = ambient precipitation, and DR = drought.

References

  1. IPCC. Climate Change 2021: The Physical Science Basis. Contribution of Working Group I to the Sixth Assessment Report of the Intergovernmental Panel on Climate Change; Masson-Delmotte, V., Zhai, P., Pirani, A., Connors, S.L., Péan, C., Berger, S., Caud, N., Chen, Y., Goldfarb, L., Gomis, M.I., et al., Eds.; Cambridge University Press: Cambridge, UK; New York, NY, USA, 2021. [Google Scholar]
  2. Smith, K.A.; Ball, T.; Conen, F.; Dobbie, K.E.; Massheder, J.; Rey, A. Exchange of greenhouse gases between soil and atmosphere: Interactions of soil physical factors and biological processes. Eur. J. Soil Sci. 2018, 69, 10–20. [Google Scholar] [CrossRef] [Scilit]
  3. Saher, A.; Kim, G.; Ahn, J.; Chae, N.; Chung, H.; Son, Y.; Saher, A.; Kim, G.; Ahn, J.; Chae, N.; et al. Factors affecting CO2, CH4, and N2O fluxes in temperate forest soils. Forests 2025, 16, 1723. [Google Scholar] [CrossRef] [Scilit]
  4. Le Mer, J.; Roger, P. Production, oxidation, emission and consumption of methane by soils: A review. Eur. J. Soil Biol. 2001, 37, 25–50. [Google Scholar] [CrossRef] [Scilit]
  5. Seneviratne, S.I.; Zhang, X.; Adnan, M.; Badi, W.; Dereczynski, C.; Di Luca, A.; Ghosh, S.; Iskandar, I.; Kossin, J.; Lewis, S.; et al. Weather and climate extreme events in a changing climate. In Climate Change 2021: The Physical Science Basis. Contribution of Working Group I to the Sixth Assessment Report of the Intergovernmental Panel on Climate Change; Masson-Delmotte, V., Zhai, P., Pirani, A., Connors, S.L., Péan, C., Berger, S., Caud, N., Chen, Y., Goldfarb, L., Gomis, M.I., et al., Eds.; Cambridge University Press: Cambridge, UK; New York, NY, USA, 2021; pp. 1513–1766. [Google Scholar] [CrossRef] [Scilit]
  6. Korea Meteorological Administration. Available online: https://data.kma.go.kr (accessed on 1 March 2024).
  7. Reichstein, M.; Bahn, M.; Ciais, P.; Frank, D.; Mahecha, M.D.; Seneviratne, S.I.; Zscheischler, J.; Beer, C.; Buchmann, N.; Frank, D.C.; et al. Climate extremes and the carbon cycle. Nature 2013, 500, 287–295. [Google Scholar] [CrossRef] [Scilit] [PubMed]
  8. Kreyling, J.; Beier, C. Complexity in climate change manipulation experiments. Bioscience 2013, 63, 763–767. [Google Scholar] [CrossRef] [Scilit]
  9. Davidson, E.A.; Janssens, I.A. Temperature sensitivity of soil carbon decomposition and feedbacks to climate change. Nature 2006, 440, 165–173. [Google Scholar] [CrossRef] [Scilit]
  10. Luo, Y.; Zhou, X. Soil Respiration and the Environment; Academic Press: Cambridge, MA, USA, 2006; pp. 1–316. [Google Scholar] [CrossRef] [Scilit]
  11. Lloyd, J.; Taylor, J.A. On the temperature dependence of soil respiration. Funct. Ecol. 1994, 8, 315. [Google Scholar] [CrossRef] [Scilit]
  12. Schimel, J.P. Life in dry soils: Effects of drought on soil microbial communities and processes. Annu. Rev. Ecol. Evol. Syst. 2018, 49, 409–432. [Google Scholar] [CrossRef] [Scilit]
  13. Manzoni, S.; Schimel, J.P.; Porporato, A. Responses of soil microbial communities to water stress: Results from a meta-analysis. Ecology 2012, 93, 930–938. [Google Scholar] [CrossRef] [Scilit]
  14. Staněk, L.; Neruda, J.; Ulrich, R. Changes in the concentration of CO2 in forest soils resulting from the traffic of logging machines. J. For. Sci. 2025, 71, 250–267. [Google Scholar] [CrossRef] [Scilit]
  15. Liu, L.; Wang, X.; Lajeunesse, M.J.; Miao, G.; Piao, S.; Wan, S.; Wu, Y.; Wang, Z.; Yang, S.; Li, P.; et al. A cross-biome synthesis of soil respiration and its determinants under simulated precipitation changes. Glob. Chang. Biol. 2016, 22, 1394–1405. [Google Scholar] [CrossRef] [Scilit]
  16. Bodelier, P.L.E.; Laanbroek, H.J. Nitrogen as a regulatory factor of methane oxidation in soils and sediments. FEMS Microbiol. Ecol. 2004, 47, 265–277. [Google Scholar] [CrossRef] [Scilit] [PubMed]
  17. Dunfield, P.F. The soil methane sinks. In Greenhouse Gas Sinks; Reay, D., Hewitt, C.N., Smith, K.A., Grace, J., Eds.; CABI: Wallingford, UK, 2007; pp. 152–170. [Google Scholar]
  18. Bardgett, R.D.; Mommer, L.; De Vries, F.T. Going underground: Root traits as drivers of ecosystem processes. Trends Ecol. Evol. 2014, 29, 692–699. [Google Scholar] [CrossRef] [Scilit]
  19. Ho, A.; Lüke, C.; Reim, A.; Frenzel, P. Resilience of (seed bank) aerobic methanotrophs and methanotrophic activity to desiccation and heat stress. Soil Biol. Biochem. 2016, 101, 130–138. [Google Scholar] [CrossRef] [Scilit]
  20. Fierer, N.; Bradford, M.A.; Jackson, R.B. Toward an ecological classification of soil bacteria. Ecology 2007, 88, 1354–1364. [Google Scholar] [CrossRef] [Scilit]
  21. Kivlin, S.N.; Emery, S.M.; Rudgers, J.A. Fungal symbionts alter plant responses to global change. Am. J. Bot. 2013, 100, 1445–1457. [Google Scholar] [CrossRef] [Scilit] [PubMed]
  22. Kim, G.J.; Jo, H.; Cho, M.S.; Noh, N.J.; Han, S.H.; Khamzina, A.; Kim, H.S.; Son, Y. Photosynthetic responses of Larix Kaempferi and Pinus Densiflora seedlings are affected by summer extreme heat rather than by extreme precipitation. Sci. Rep. 2024, 14, 5250. [Google Scholar] [CrossRef] [Scilit]
  23. Hasibeder, R.; Fuchslueger, L.; Richter, A.; Bahn, M. Summer drought alters carbon allocation to roots and root respiration in mountain grassland. New Phytol. 2015, 205, 1117–1127. [Google Scholar] [CrossRef] [Scilit]
  24. Jo, H.; Noulèkoun, F.; Khamzina, A.; Chang, H.; Son, Y. Physiological and shoot growth responses of Abies Holophylla and Abies Koreana seedlings to open-field experimental warming and increased precipitation. Water 2022, 14, 356. [Google Scholar] [CrossRef] [Scilit]
  25. Hargreaves, G.H.; Samani, Z.A. Reference crop evapotranspiration from temperature. Appl. Eng. Agric. 1985, 1, 96–99. [Google Scholar] [CrossRef] [Scilit]
  26. Jain, N.; Arora, P.; Tomer, R.; Mishra, S.V.; Bhatia, A.; Pathak, H.; Chakraborty, D.; Kumar, V.; Dubey, D.S.; Harit, R.C.; et al. Greenhouse gases emission from soils under major crops in northwest India. Sci. Total Environ. 2016, 542, 551–561. [Google Scholar] [CrossRef] [Scilit]
  27. Do Carmo, J.B.; de Sousa Neto, E.R.; Duarte-Neto, P.J.; Ometto, J.P.H.B.; Martinelli, L.A. Conversion of the coastal Atlantic forest to pasture: Consequences for the nitrogen cycle and soil greenhouse gas emissions. Agric. Ecosyst. Environ. 2012, 148, 37–43. [Google Scholar] [CrossRef] [Scilit]
  28. Mu, C.C.; Zhu, B.W.; Han, L.D.; Yu, L.L.; Gu, H. Short-term effects of fire disturbance on greenhouse gases emission from Betula platyphylla-forested wetland in Xiaoxing’an mountains, northeast China. Chin. J. Appl. Ecol. 2011, 22, 857–865. [Google Scholar]
  29. Lessard, R.; Rochette, P.; Topp, E.; Pattey, E.; Desjardins, R.L.; Beaumont, G. Methane and carbon dioxide fluxes from poorly drained adjacent cultivated and forest sites. Can. J. Soil Sci. 1994, 74, 139–146. [Google Scholar] [CrossRef] [Scilit]
  30. Pinheiro, J.; Bates, D.; R Core Team. nlme: Linear and Nonlinear Mixed Effects Models, R Package Version 3.1-166; R Core Team: Vienna, Austria, 2025. Available online: https://cran.r-project.org/package=nlme (accessed on 5 December 2025).
  31. Nakagawa, S.; Schielzeth, H. A general and simple method for obtaining R2 from generalized linear mixed-effects models. Methods Ecol. Evol. 2013, 4, 133–142. [Google Scholar] [CrossRef] [Scilit]
  32. Tadesse Kifle, E.; Noulèkoun, F.; Son, Y.; Khamzina, A. Woody species diversity, structural composition, and human use of church forests in central Ethiopia. For. Ecol. Manag. 2022, 506, 119991. [Google Scholar] [CrossRef] [Scilit]
  33. Noulèkoun, F.; Mensah, S.; Kim, H.S.; Houndonougbo, J.S.H.; Mensah, M.; Lee, W.K.; Son, Y.; Khamzina, A. Contrasting ecological mechanisms mediate the impact of land conversion on ecosystem multifunctionality. Funct. Ecol. 2025, 39, 783–798. [Google Scholar] [CrossRef] [Scilit]
  34. Lenth, R.; Singmann, H.; Love, J.; Buerkner, P.; Herve, M. Package “Emmeans”. R Package Version 4.0-3. 2018. Available online: http://cran.r-project.org/package=emmeans (accessed on 5 December 2025).
  35. Bond-Lamberty, B.; Thomson, A. Temperature-associated increases in the global soil respiration record. Nature 2010, 464, 579–582. [Google Scholar] [CrossRef] [Scilit]
  36. Davidson, E.A.; Janssens, I.A.; Lou, Y. On the variability of respiration in terrestrial ecosystems: Moving beyond Q10. Glob. Chang. Biol. 2006, 12, 154–164. [Google Scholar] [CrossRef] [Scilit]
  37. Allison, S.D.; Treseder, K.K. Warming and drying suppress microbial activity and carbon cycling in boreal forest soils. Glob. Chang. Biol. 2008, 14, 2898–2909. [Google Scholar] [CrossRef] [Scilit]
  38. Liang, G. Global pattern of warming effects on microbial respiration is explained by soil microbial biomass carbon and nitrogen. Catena 2025, 250, 108728. [Google Scholar] [CrossRef] [Scilit]
  39. Bradford, M.A.; Davies, C.A.; Frey, S.D.; Maddox, T.R.; Melillo, J.M.; Mohan, J.E.; Reynolds, J.F.; Treseder, K.K.; Wallenstein, M.D. Thermal adaptation of soil microbial respiration to elevated temperature. Ecol. Lett. 2008, 11, 1316–1327. [Google Scholar] [CrossRef] [Scilit]
  40. Luo, Y.; Wan, S.; Hui, D.; Wallace, L.L. Acclimatization of soil respiration to warming in a tall grass prairie. Nature 2001, 413, 622–625. [Google Scholar] [CrossRef] [Scilit] [PubMed]
  41. Kwon, M.; Li, G.; Jo, H.; Kim, G.J.; Chung, H.; Son, Y. Changes in soil microbial communities associated with Pinus Densiflora and Larix Kaempferi Seedlings under extreme warming and precipitation manipulation. Sustainability 2024, 16, 4331. [Google Scholar] [CrossRef] [Scilit]
  42. Allison, S.D.; Wallenstein, M.D.; Bradford, M.A.; Allison, S.D.; Wallenstein, M.D.; Bradford, M.A. Soil-carbon response to warming dependent on microbial physiology. Nature 2010, 3, 336–340. [Google Scholar] [CrossRef] [Scilit]
  43. Liang, G.; Stefanski, A.; Eddy, W.C.; Bermudez, R.; Montgomery, R.A.; Hobbie, S.E.; Rich, R.L.; Reich, P.B. Soil respiration response to decade-long warming modulated by soil moisture in a boreal forest. Nat. Geosci. 2024, 17, 905–911. [Google Scholar] [CrossRef] [Scilit]
  44. Fairbairn, L.; Rezanezhad, F.; Gharasoo, M.; Parsons, C.T.; Macrae, M.L.; Slowinski, S.; Van Cappellen, P. Relationship between soil CO2 fluxes and soil moisture: Anaerobic sources explain fluxes at high water content. Geoderma 2023, 434, 116493. [Google Scholar] [CrossRef] [Scilit]
  45. Karaklić, V.; Samardžić, M.; Orlović, S.; Zorić, M.; Kesić, L.; Perendija, N.; Galić, Z. Effect of stand age on soil CO2 emissions in Pedunculate Oak (Quercus Robur L.) Forests. Forests 2024, 15, 1574. [Google Scholar] [CrossRef] [Scilit]
  46. Bian, H.; Li, C.; Zhu, J.; Xu, L.; Li, M.; Zheng, S.; He, N. Soil moisture affects the rapid response of microbes to labile organic c addition. Front. Ecol. Evol. 2022, 10, 857185. [Google Scholar] [CrossRef] [Scilit]
  47. Zhou, L.; Zhou, X.; Shao, J.; Nie, Y.; He, Y.; Jiang, L.; Wu, Z.; Hosseini Bai, S. Interactive effects of global change factors on soil respiration and its components: A meta-analysis. Glob. Chang. Biol. 2016, 22, 3157–3169. [Google Scholar] [CrossRef] [Scilit]
  48. Chen, X.; Hu, H.; Wang, Q.; Wang, X.; Ma, B. Exploring the factors affecting terrestrial soil respiration in global warming manipulation experiments based on meta-analysis. Agriculture 2024, 14, 1581. [Google Scholar] [CrossRef] [Scilit]
  49. Bond-Lamberty, B.; Ballantyne, A.; Berryman, E.; Fluet-Chouinard, E.; Jian, J.; Morris, K.A.; Rey, A.; Vargas, R. Twenty years of progress, challenges, and opportunities in measuring and understanding soil respiration. J. Geophys. Res. Biogeosci. 2024, 129, e2023JG007637. [Google Scholar] [CrossRef] [Scilit]
  50. Wu, Z.; Dijkstra, P.; Koch, G.W.; Peñuelas, J.; Hungate, B.A. Responses of terrestrial ecosystems to temperature and precipitation change: A meta-analysis of experimental manipulation. Glob. Chang. Biol. 2011, 17, 927–942. [Google Scholar] [CrossRef] [Scilit]
  51. Rustad, L.E.; Campbell, J.L.; Marion, G.M.; Norby, R.J.; Mitchell, M.J.; Hartley, A.E.; Cornelissen, J.H.C.; Gurevitch, J.; Alward, R.; Beier, C.; et al. A meta-analysis of the response of soil respiration, net nitrogen mineralization, and aboveground plant growth to experimental ecosystem warming. Oecologia 2001, 126, 543–562. [Google Scholar] [CrossRef] [Scilit]
  52. Moyano, F.E.; Manzoni, S.; Chenu, C. Responses of soil heterotrophic respiration to moisture availability: An exploration of processes and models. Soil Biol. Biochem. 2013, 59, 72–85. [Google Scholar] [CrossRef] [Scilit]
  53. Kwon, M.; Jo, H.; Kim, G.J.; Kim, H.S.; Son, Y. Effects of open-field experimental extreme climate events on soil microbial biomass and extracellular enzyme activity under Pinus Densiflora and Larix Kaempferi Seedlings. Forestist 2023, 73, 270–277. [Google Scholar] [CrossRef] [Scilit]
  54. Fanin, N.; Kardol, P.; Farrell, M.; Nilsson, M.C.; Gundale, M.J.; Wardle, D.A. The ratio of gram-positive to gram-negative bacterial plfa markers as an indicator of carbon availability in organic soils. Soil Biol. Biochem. 2019, 128, 111–114. [Google Scholar] [CrossRef] [Scilit]
  55. Phillips, R.P.; Brzostek, E.; Midgley, M.G. The mycorrhizal-associated nutrient economy: A new framework for predicting carbon-nutrient couplings in temperate forests. New Phytol. 2013, 199, 41–51. [Google Scholar] [CrossRef] [Scilit]
  56. Phillips, R.P.; Ibáñez, I.; D’Orangeville, L.; Hanson, P.J.; Ryan, M.G.; McDowell, N.G. A Belowground perspective on the drought sensitivity of forests: Towards improved understanding and simulation. For. Ecol. Manag. 2016, 380, 309–320. [Google Scholar] [CrossRef] [Scilit]
  57. Kwon, M.; Li, G.; Chung, H.; Saher, A.; Kim, H.-S.; Son, Y. Soil Microbial Community Structure, Extracellular Enzyme Activity, and Microbial Biomass Under Extreme Warming and Drought in Soils Planted with Quercus variabilis and Quercus seedlings; Forest Technology and Management Research Center, National Institute of Forest Science: Pocheon, Republic of Korea, 2026; in preparation. [Google Scholar]
  58. Song, Y.-H.; Xu, F.-B.; Wang, M.-H.; Xie, Y.-B.; Tian, L.-M.; Lv, C.-X.; Zhang, X.-W.; Guo, Z.-M.; Zhang, D. Plant species diversity improves soil physicochemical traits and modulates soil microbial community structure, with a pronounced enhancement of fungal diversity in urban forests. Plants 2025, 15, 79. [Google Scholar] [CrossRef] [Scilit]
  59. Žifčáková, L.; Větrovský, T.; Howe, A.; Baldrian, P. Microbial activity in forest soil reflects the changes in ecosystem properties between summer and winter. Environ. Microbiol. 2016, 18, 288–301. [Google Scholar] [CrossRef] [Scilit]
  60. Lladó, S.; López-Mondéjar, R.; Baldrian, P. Forest soil bacteria: Diversity, involvement in ecosystem processes, and response to global change. Microbiol. Mol. Biol. Rev. 2017, 81, e00063-16. [Google Scholar] [CrossRef] [Scilit]
  61. Habtewold, J.Z.; Helgason, B.L.; Yanni, S.F.; Janzen, H.H.; Ellert, B.H.; Gregorich, E.G. Warming effects on the structure of bacterial and fungal communities in diverse soils. Appl. Soil Ecol. 2021, 163, 103973. [Google Scholar] [CrossRef] [Scilit]
  62. Zhang, L.; Lin, W.; Sardans, J.; Li, X.; Hui, D.; Yang, Z.; Wang, H.; Lin, H.; Wang, Y.; Guo, J.; et al. Soil Warming-induced reduction in water content enhanced methane uptake at different soil depths in a subtropical forest. Sci. Total Environ. 2024, 927, 171994. [Google Scholar] [CrossRef] [Scilit] [PubMed]
  63. Zheng, Y.; Cai, Y.; Jia, Z. Role of methanotrophic communities in atmospheric methane oxidation in paddy soils. Front. Microbiol. 2024, 15, 1481044. [Google Scholar] [CrossRef] [Scilit] [PubMed]
  64. Murguia-Flores, F.; Ganesan, A.L.; Arndt, S.; Hornibrook, E.R.C. Global uptake of atmospheric methane by soil from 1900 to 2100. Glob. Biogeochem. Cycles 2021, 35, e2020GB006774. [Google Scholar] [CrossRef] [Scilit]
  65. Wigley, K.; Armstrong, C.; Smaill, S.J.; Reid, N.M.; Kiely, L.; Wakelin, S.A. Methane cycling in temperate forests. Carbon Balance Manag. 2024, 19, 37. [Google Scholar] [CrossRef] [Scilit]
  66. Guan, S.; Qi, Z.; Li, S.; Du, S.; Xu, D.; Guan, S.; Qi, Z.; Li, S.; Du, S.; Xu, D. Effects of rice root development and rhizosphere soil on methane emission in paddy fields. Plants 2024, 13, 3223. [Google Scholar] [CrossRef] [Scilit]
  67. Bodelier, P.L.E.; Meima-Franke, M.; Hordijk, C.A.; Steenbergh, A.K.; Hefting, M.M.; Bodrossy, L.; Von Bergen, M.; Seifert, J. Microbial minorities modulate methane consumption through niche partitioning. ISME J. 2013, 7, 2214–2228. [Google Scholar] [CrossRef] [Scilit]
  68. Visvanathan, C.; Pokhrel, D.; Cheimchaisri, W.; Hettiaratchi, J.P.A.; Wu, J.S. Methanotrophic activities in tropical landfill cover soils: Effects of temperature, moisture content and methane concentration. Waste Manag. Res. 1999, 17, 313–323. [Google Scholar] [CrossRef] [Scilit]
  69. Curry, C.L. The consumption of atmospheric methane by soil in a simulated future climate. Biogeosciences 2009, 6, 2355–2367. [Google Scholar] [CrossRef] [Scilit]
  70. White, J.D.; Ahrén, D.; Ström, L.; Kelly, J.; Klemedtsson, L.; Keane, B.; Parmentier, F.J.W. Methane producing and oxidizing microorganisms display a high resilience to drought in a swedish hemi-boreal mire. J. Geophys. Res. Biogeosci. 2023, 128, e2022JG007362. [Google Scholar] [CrossRef] [Scilit]
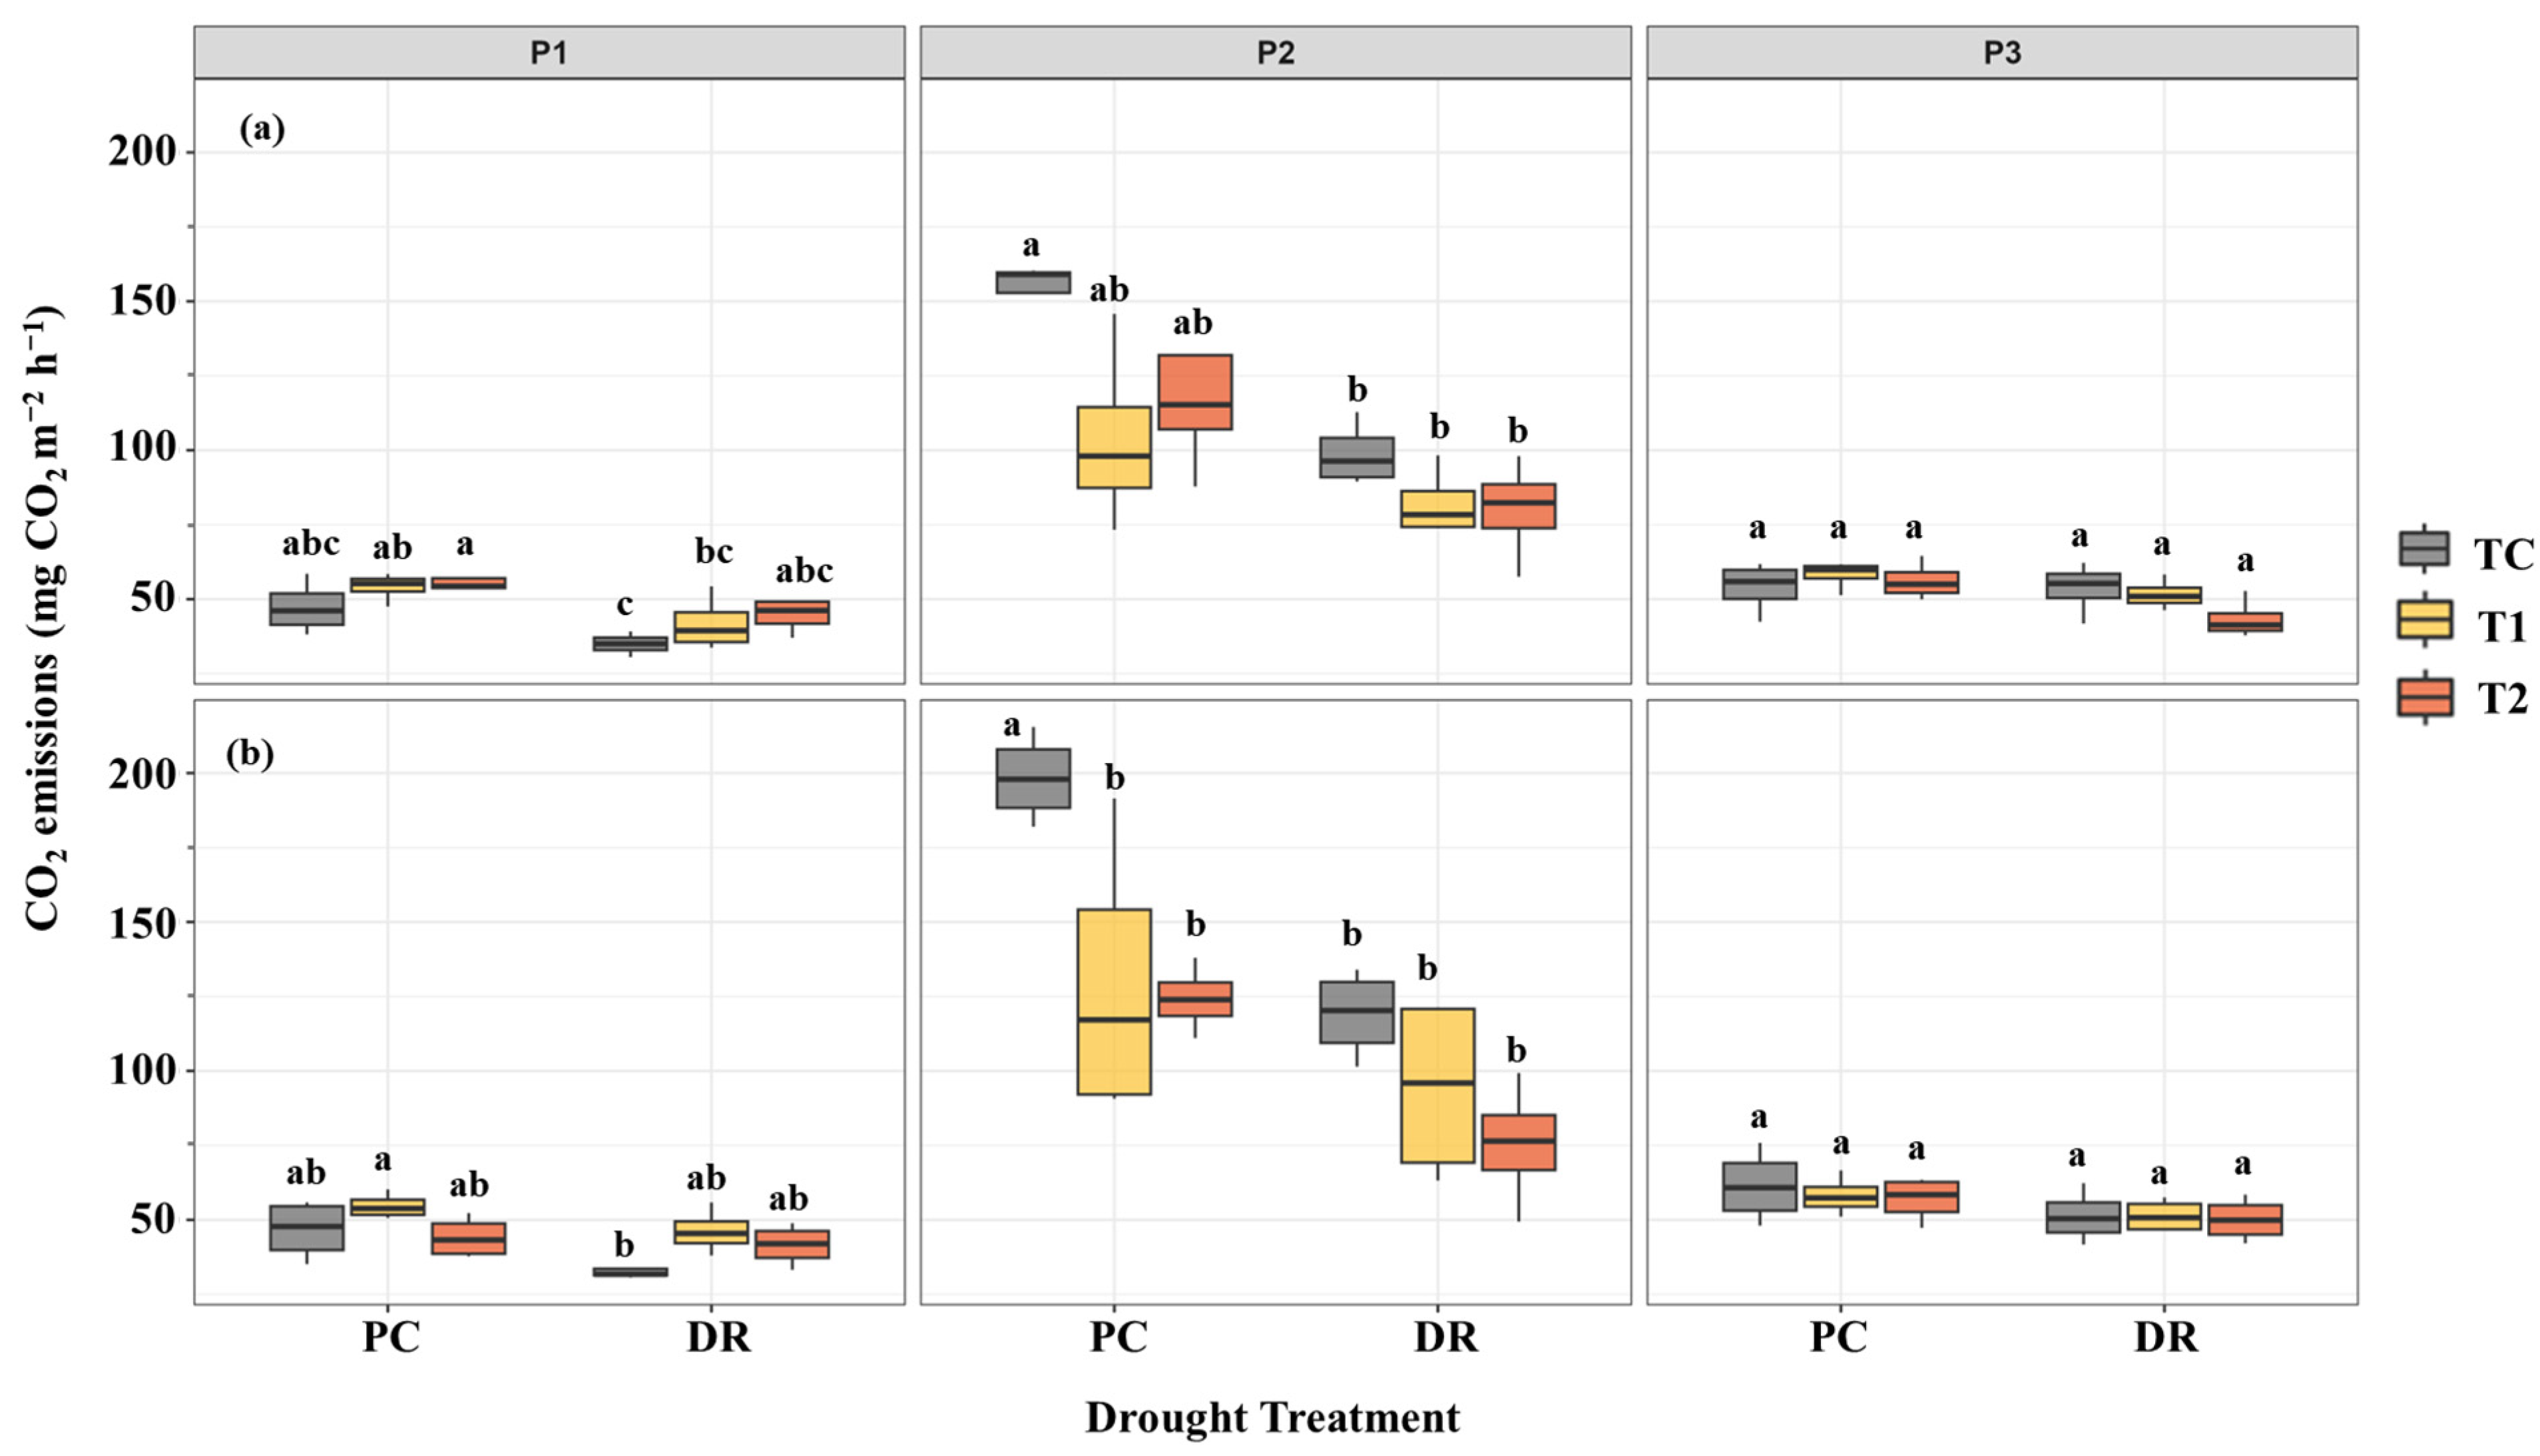
Figure 1. Means and standard errors of soil CO2 emissions in (a) Quercus variabilis Blume and (b) Quercus acutissima Carruth under different temperature and drought treatments and periods. Boxes represent the interquartile range, horizontal lines within boxes represent medians, and whiskers represent the range of the data (n = 4). P1 = period 1, P2 = period 2, P3 = period 3. TC = ambient temperature, T1 = +3 °C, T2 = +5 °C, PC = ambient precipitation, DR = drought. Different letters indicate significant differences among treatments (p < 0.05).
Forests 17 00293 g001
Figure 2. CH4 uptake in (a) Quercus variabilis and (b) Quercus acutissima under different temperature and drought treatments and periods. Boxes represent the interquartile range, horizontal lines within boxes represent medians, and whiskers represent the range of the data (n = 4). P1 = period 1, P2 = period 2, P3 = period 3. TC = ambient temperature, T1 = +3 °C, T2 = +5 °C, PC = ambient precipitation, DR = drought. Different letters indicate significant differences among treatments (p < 0.05).
Forests 17 00293 g002
Figure 3. Pearson’s correlation results for CO2, CH4, environmental, and soil property variables for (a) Quercus variabilis and (b) Quercus acutissima. AT = air temperature, ST = soil temperature, and SM = soil moisture. * p < 0.05; *** p < 0.001.
Forests 17 00293 g003
Figure 4. Principal component analysis biplot showing relationships among soil carbon fluxes, environmental variables, and treatments in (a) Q. variabilis and (b) Q. acutissima. Percentages indicate variance explained by each component. TC = ambient temperature, T1 = +3 °C, T2 = +5 °C, PC = ambient precipitation, DR = drought. P1 = period 1, P2 = period 2, P3 = period 3. AT = air temperature, ST = soil temperature, and SM = soil moisture.
Forests 17 00293 g004
Table 1. Significance statistics of the LMMs assessing treatment effects on the soil temperature (ST), air temperature (AT), soil moisture (SM), CO2 emissions, and CH4 uptake. F- and p-values were obtained from ANOVA performed on the LMMs.
Explanatory VariablesSTATSMCO2CH4
F-Valuep-ValueF-Valuep-ValueF-Valuep-ValueF-Valuep-ValueF-Valuep-Value
Warming (W)37.64<0.00142.97<0.0011.770.1848.130.0010.840.439
Drought (D)3.460.0710.110.7461.480.23159.61<0.0010.240.623
Species (S)2.750.10631.30<0.0010.050.8103.770.0591.760.193
Period (T)355.23<0.001139.68<0.001258.33<0.001323.06<0.00159.57<0.001
W × D0.540.5860.100.9050.070.9321.890.1642.800.074
W × S0.590.5570.150.8570.560.5711.970.1533.870.029
D × S1.360.2510.030.8712.460.1240.490.4866.070.018
W × T1.150.3411.060.3830.560.69216.26<0.0012.790.032
D × T1.440.2442.390.0993.490.03527.64<0.0010.250.776
S × T20.70<0.0001130.78<0.0010.340.7075.250.00731.16<0.001
W × D × S0.140.8680.310.7330.110.8880.610.5450.360.694
W × D × T0.310.8710.140.9680.500.7342.380.0593.210.017
W × S × T0.320.8630.350.8461.020.3991.810.1344.140.004
D × S × T1.270.2880.890.4170.580.5621.240.2920.980.379
W × D × S × T0.430.7810.320.8640.120.9720.030.9981.570.191
σ Plot0.721.132.314.630.95
σ Rsd 0.711.051.5214.672.89
R2 m0.790.780.560.850.62
R2 c0.890.890.860.860.66
σ: standard deviation; R2 m: marginal R2; R2 c: conditional R2. Significant p-values are indicated in bold.
Disclaimer/Publisher’s Note: The statements, opinions and data contained in all publications are solely those of the individual author(s) and contributor(s) and not of MDPI and/or the editor(s). MDPI and/or the editor(s) disclaim responsibility for any injury to people or property resulting from any ideas, methods, instructions or products referred to in the content.