Article

Modeling Diameter Growth of European Beech in Mixtures with Various Tree Species: The Impact of Size-Symmetric and Size-Asymmetric Competition


by
Živa Bončina
1,
Vasilije Trifković
1,
Zala Žnidaršič
2 and
Matija Klopčič
1,*
1
Department of Forestry and Renewable Forest Resources, Biotechnical Faculty, University of Ljubljana, Jamnikarjeva 101, 1000 Ljubljana, Slovenia
2
Department of Agronomy, Biotechnical Faculty, University of Ljubljana, Jamnikarjeva 101, 1000 Ljubljana, Slovenia
*
Author to whom correspondence should be addressed.
Forests 2026, 17(2), 248; https://doi.org/10.3390/f17020248
Submission received: 15 January 2026 / Revised: 4 February 2026 / Accepted: 11 February 2026 / Published: 13 February 2026
(This article belongs to the Section Forest Ecology and Management)

Abstract

Mixed forests provide several ecosystem service benefits, and they also often show higher productivity than pure forests. In mixed forests, several interactions among tree species occur, with size-symmetric and size-asymmetric competition being particularly important. We studied diameter growth of European beech in pure stands and in mixtures with oak, maple, pine, spruce, fir, and spruce and fir combined on extremely diverse beech sites in Slovenia, using forest inventory sample plots (n = 26,793, 500 m2 each). For each mixture, we developed models of 10-year individual tree diameter increment (id) using natural splines and incorporating tree, competition, stand, site, and climate variables that were mainly gathered in regular forest inventories. Competition was represented using simple indices: stand basal area (BA) for size-symmetric competition, basal area of overtopping trees (BAL) for size-asymmetric competition, and reduced competition due to harvesting (CUT). The models revealed differences among mixtures and a strong influence of competition. Id was among the lowest in pure stands and substantially higher in mixtures, indicating strong intraspecific competition. Overall, size-symmetric competition was more influential, but size-asymmetric competition appeared important in some mixtures. We recommend growing beech in mixtures with other species and applying a forest management approach that accounts for competition symmetry, which proved crucial in each mixture.

1. Introduction

Approximately 23% of the land in the pan-European region is covered by mixed forests [1], which have been recognized as having several advantages over pure forests and monocultures. They can provide a broader range and higher levels of ecosystem services [2,3,4]. Forests with higher structural and species diversity are often more resistant and resilient to biotic and abiotic disturbances [5,6,7]. Finally, mixed forests can also exhibit higher productivity in certain environmental conditions [8,9,10].
In mixed forests, several interactions among tree species occur simultaneously. Interactions between species growing in mixtures are often described in terms of competition, competitive reduction, and facilitation [11]. Competition occurs when interactions between species or populations reduce another species’ functioning, survival, or growth. Competitive reduction occurs when interspecific competition impacts growth less than intraspecific competition [9,12]. Finally, facilitation occurs when at least one species positively influences the functioning and growth of another [9], which can happen due to, for example, increased nitrogen fixation [13] or hydraulic lift [14]. In natural mixed forests, processes can be described in terms of species complementarity, reflected in changes in the growth of individual trees or entire stands [9,10,11,15]. Trees in mixtures tend to be more productive if they use site resources more efficiently due to niche differentiation in ecological processes, such as nitrogen fixation, increased light absorption, and increased water-use efficiency. This may reflect differences in height growth patterns, phenology, crown and root architecture, and resource-use strategies [4,8,16,17]. Competition works differently in mixed forests than in pure ones since tree species occupy growing space differently. In addition, the allocation of resources such as light, water, and nutrients among species is different. When there is a strong niche complementarity between tree species, interspecific competition may be lower than intraspecific competition [18,19].
To address the effect of mixture on the diameter growth of individual trees, mixing effects should be analyzed through possible growth deviations in mixtures compared with pure forests [5,10,20]. Trees are classified into mixture classes based on neighboring trees, e.g., [21], or based on the BA proportion of admixed species, e.g., [10,22].
According to the limitation-caused matter partitioning (LCMP) hypothesis, competition and its prevailing mode are influenced by the dominant limiting resource, for example, light, water, or nutrients [23,24]. Size-asymmetric competition mode arises when larger individuals claim resources disproportionately to their size, leaving fewer resources available to smaller individuals; a classic example is competition for light. In contrast, the size-symmetric competition mode occurs when competitors divide resources evenly [25]: for example, competition for water and belowground soil resources [24,26].
Mixture and competition should be studied together, and species proportion can be used as a proxy for the partitioning of growing space [15]. Different metrics and procedures have been used in studies to express and describe different complementary interactions on individual tree or stand growth. Sometimes the competition status of a tree is included as a modifier component that reduces the potential growth rate of a tree [15,17,18]. Various competition indices based on tree-to-tree distances, crown dimensions, stand density, or detailed spatial information have often been used to characterize size-symmetric and size-asymmetric competition [18,24,26,27,28,29]. However, for practical forestry, simple measures of competition are especially welcome, as competition indices are computationally demanding. Simpler stand-level metrics, such as stand basal area (BA), a proxy for belowground resource availability and thus size-symmetric competition, and overtopping basal area (BAL), a surrogate for size-asymmetric light-related competition, have already been used in ecological modeling [22,30,31].
European beech (Fagus sylvatica L.; hereafter beech) is one of the most important tree species in Europe, currently covering approximately 12 × 106 ha [32] and providing high ecological and economic value in Central European forestry [33]. Due to its strong competitiveness, broad ecological amplitude, and capacity to recover after disturbances [7], it dominates late-successional forests [34]. However, beech commonly form mixed stands with various tree species, namely Norway spruce (Picea abies (L.) H. Karst., hereafter spruce), silver fir (Abies alba Mill., hereafter fir), pines (Pinus spp., hereafter pine), oaks (Quercus spp., hereafter oak), maples (Acer spp., hereafter maple), and many other species. Multiple studies have reported enhanced beech growth in mixtures with different species. Beech may exhibit a facilitative relationship and benefit from higher growth rates wen mixed with species such as Scots pine (Pinus sylvestris L.) [35], spruce [36], Douglas-fir (Pseudotsuga menziesii (Mirb.) Franco) [37], fir [28], or conifer species [31].
For modeling the growth of individual trees, several approaches have been identified. To predict resource and growth partitioning among trees in a stand, site-specific potential growth–size relationships for individual trees can be developed, reflecting growth rate under optimal growth conditions [24]. This potential growth is subsequently reduced to the expected growth rate by means of various modifiers, reflecting the competition status of the observed tree [22]. The second approach is to develop individual tree growth models by testing the relevance and contribution of many potential explanatory variables, e.g., [18,28,31,38,39,40]. The objective is to determine the main predictors of tree growth; thus, it is crucial to test the relevance of all meaningful variables related to tree characteristics, competition, and stand, site, and climate conditions.
Tree and stand characteristics have often been identified as the main predictors of individual tree growth [29,39], but competition indices, e.g., [24,26,41], or proxies for competition, e.g., [18,22,31], have also been shown to be crucial for the growth of individual trees. The influence of size-symmetric and size-asymmetric competition on tree growth was found to be divergent and differed by tree species composition and forest type, e.g., [10,15,18,31]. Among tree variables, tree diameter or its transformations [29,42,43] have frequently been recognized as a crucial predictor.
Explanatory stand factors usually encompass parameters related to stand density, structural diversity, and tree species mixture [44]. Stand density can be described by the stand density index (SDI), number of trees, or stand basal area. Stand density most frequently indicates a negative impact on tree growth. Structural diversity, indicated by various indices, such as the Gini index [45], influences tree growth through competition, which differs between diverse stand structures, e.g., [36]. With respect to species mixture, beech has often been reported to grow better in mixed than in pure stands [39,46]. This has been confirmed in mixtures with pine [27,35], oak [38], or spruce and fir [31,46]; however, del Río et al. [18] found that there were no complementary effects between beech and fir in forests in Spain.
Beech diameter growth is also affected by climate variables and climate change in complex ways. Studies report contrasting growth trends, with some findings showing increasing growth [36,47] and some showing decreasing growth [48,49]. Growth reductions have been observed, particularly in Central Europe [41] and Mediterranean regions [50]. Repeated drought events clearly reduce beech growth [38,51], and simulations forecast further decline, especially at the southern edge of its distribution [49]. However, mixing beech with other species may reduce drought-related declines in tree growth [9].
Beech is currently an important species and is expected to remain so in the future. Understanding its functioning and growth in pure and mixed forests is crucial for adapting forest management to changing climatic conditions [52]. Identifying conditions under which mixed forests enhance beech functioning and growth is particularly crucial. Slovenia offers favorable conditions for such a study. Beech is the most common tree species in Slovenia, accounting for 33% of the national timber volume and covering approximately 70% of the forested area [53]. Most of these forests are mixed and mainly dominated by beech, providing an appropriate context for investigating the diameter growth of beech trees in pure forests and in mixtures with other species. Despite its relatively small area, Slovenia exhibits a highly heterogeneous landscape, encompassing the Alps, the Mediterranean region, the Dinaric Mountains, and the Pannonian Basin, covering a large altitudinal gradient (0 to ~1750 m). Furthermore, the broad gradients of climatic, edaphic, and stand conditions provide an additional strong foundation for investigating the growth of beech trees in pure and mixed forests. Our research objectives were (i) to develop individual tree diameter increment models for beech in pure stands and in various two-species and three-species mixtures growing on beech forest sites, using only explanatory variables for which data are collected during regular forest inventories or can be derived from publicly available databases, and to assess whether the explanatory variables included in the models, as well as the magnitude and direction of their effects, differ among mixtures, and (ii) to inspect the influence of BA and BAL as indicators of size-symmetric and size-asymmetric competition across different mixtures to support the adaptation of forest management to the symmetry of competition within each mixture.

2. Materials and Methods

2.1. Study Area, Species Mixtures, and Data

Slovenian forests (in total 1.2 million ha; forest cover of 59%) are characterized by substantial variation in tree species mixture, stand structure, and geoclimatic conditions. Climatic regimes range from Sub-Mediterranean in the southwest to temperate humid in the central region and the continental climate in the northeast (Table 1). The relief is highly diverse, featuring plains and low hills to predominantly rugged hilly terrain with slopes of varying steepness to high mountains. The altitude of examined forests ranges 0-~1750 m, and the bedrock is highly diverse, ranging from predominant carbonate rocks (mainly limestone and dolomite) to various silicate rocks, including magmatic rocks, schists, and sandstones. The dominant soil types include leptosols, eutric and chromic cambisols, and dystric cambisols [54].
The average stand volume of forests in 2014, the last year of our dataset, was 304 m3/ha, and the mean annual volume increment was 7.4 m3/ha [55]. Forests are managed, and close-to-nature forestry practices, relying predominantly on natural regeneration, have been implemented for decades and, in some areas, for more than a century. Suppressed understory trees and advanced regeneration of various tree species, as well as shrubs, are integral parts of these forests. The most widely applied silvicultural systems include irregular shelterwood, group selection, and single-tree selection [56].
Based on potential natural vegetation, beech forests cover approximately 70% of the forested area [53]. Beech is the most abundant species in the stand volume (33.0%), followed by spruce (30.0%) and fir (7.5%) [55]. Moreover, our dataset encompasses a wide spectrum of developmental stages, stand densities, and combinations of site characteristics (Table 1), providing a comprehensive basis for modeling diameter growth across diverse conditions.
More than 98,000 circular fixed-area permanent sampling plots (PSPs) were established by the Slovenia Forest Service in the 1990s [55] and have since been remeasured every 10 years, with roughly 10% of PSPs surveyed each year. The PSPs mainly form a systematic sampling grid of 0.25 × 0.50 km, but, in areas of highly intense forest management, also of 0.20 × 0.50 km or 0.25 × 0.25 km. On PSPs, trees with a diameter at breast height (dbh) between 10 and 29.9 cm are measured within a 200 m2 subplot (radius = 7.98 m), while those with dbh ≥ 30 cm are recorded within a larger 500 m2 subplot (radius = 12.62 m) [57]. The first measurements in our database were conducted in the period of 1994–2004, and the first remeasurements were conducted in the period of 2003–2013 [55]. An example of the dataset is shown in Table S1.
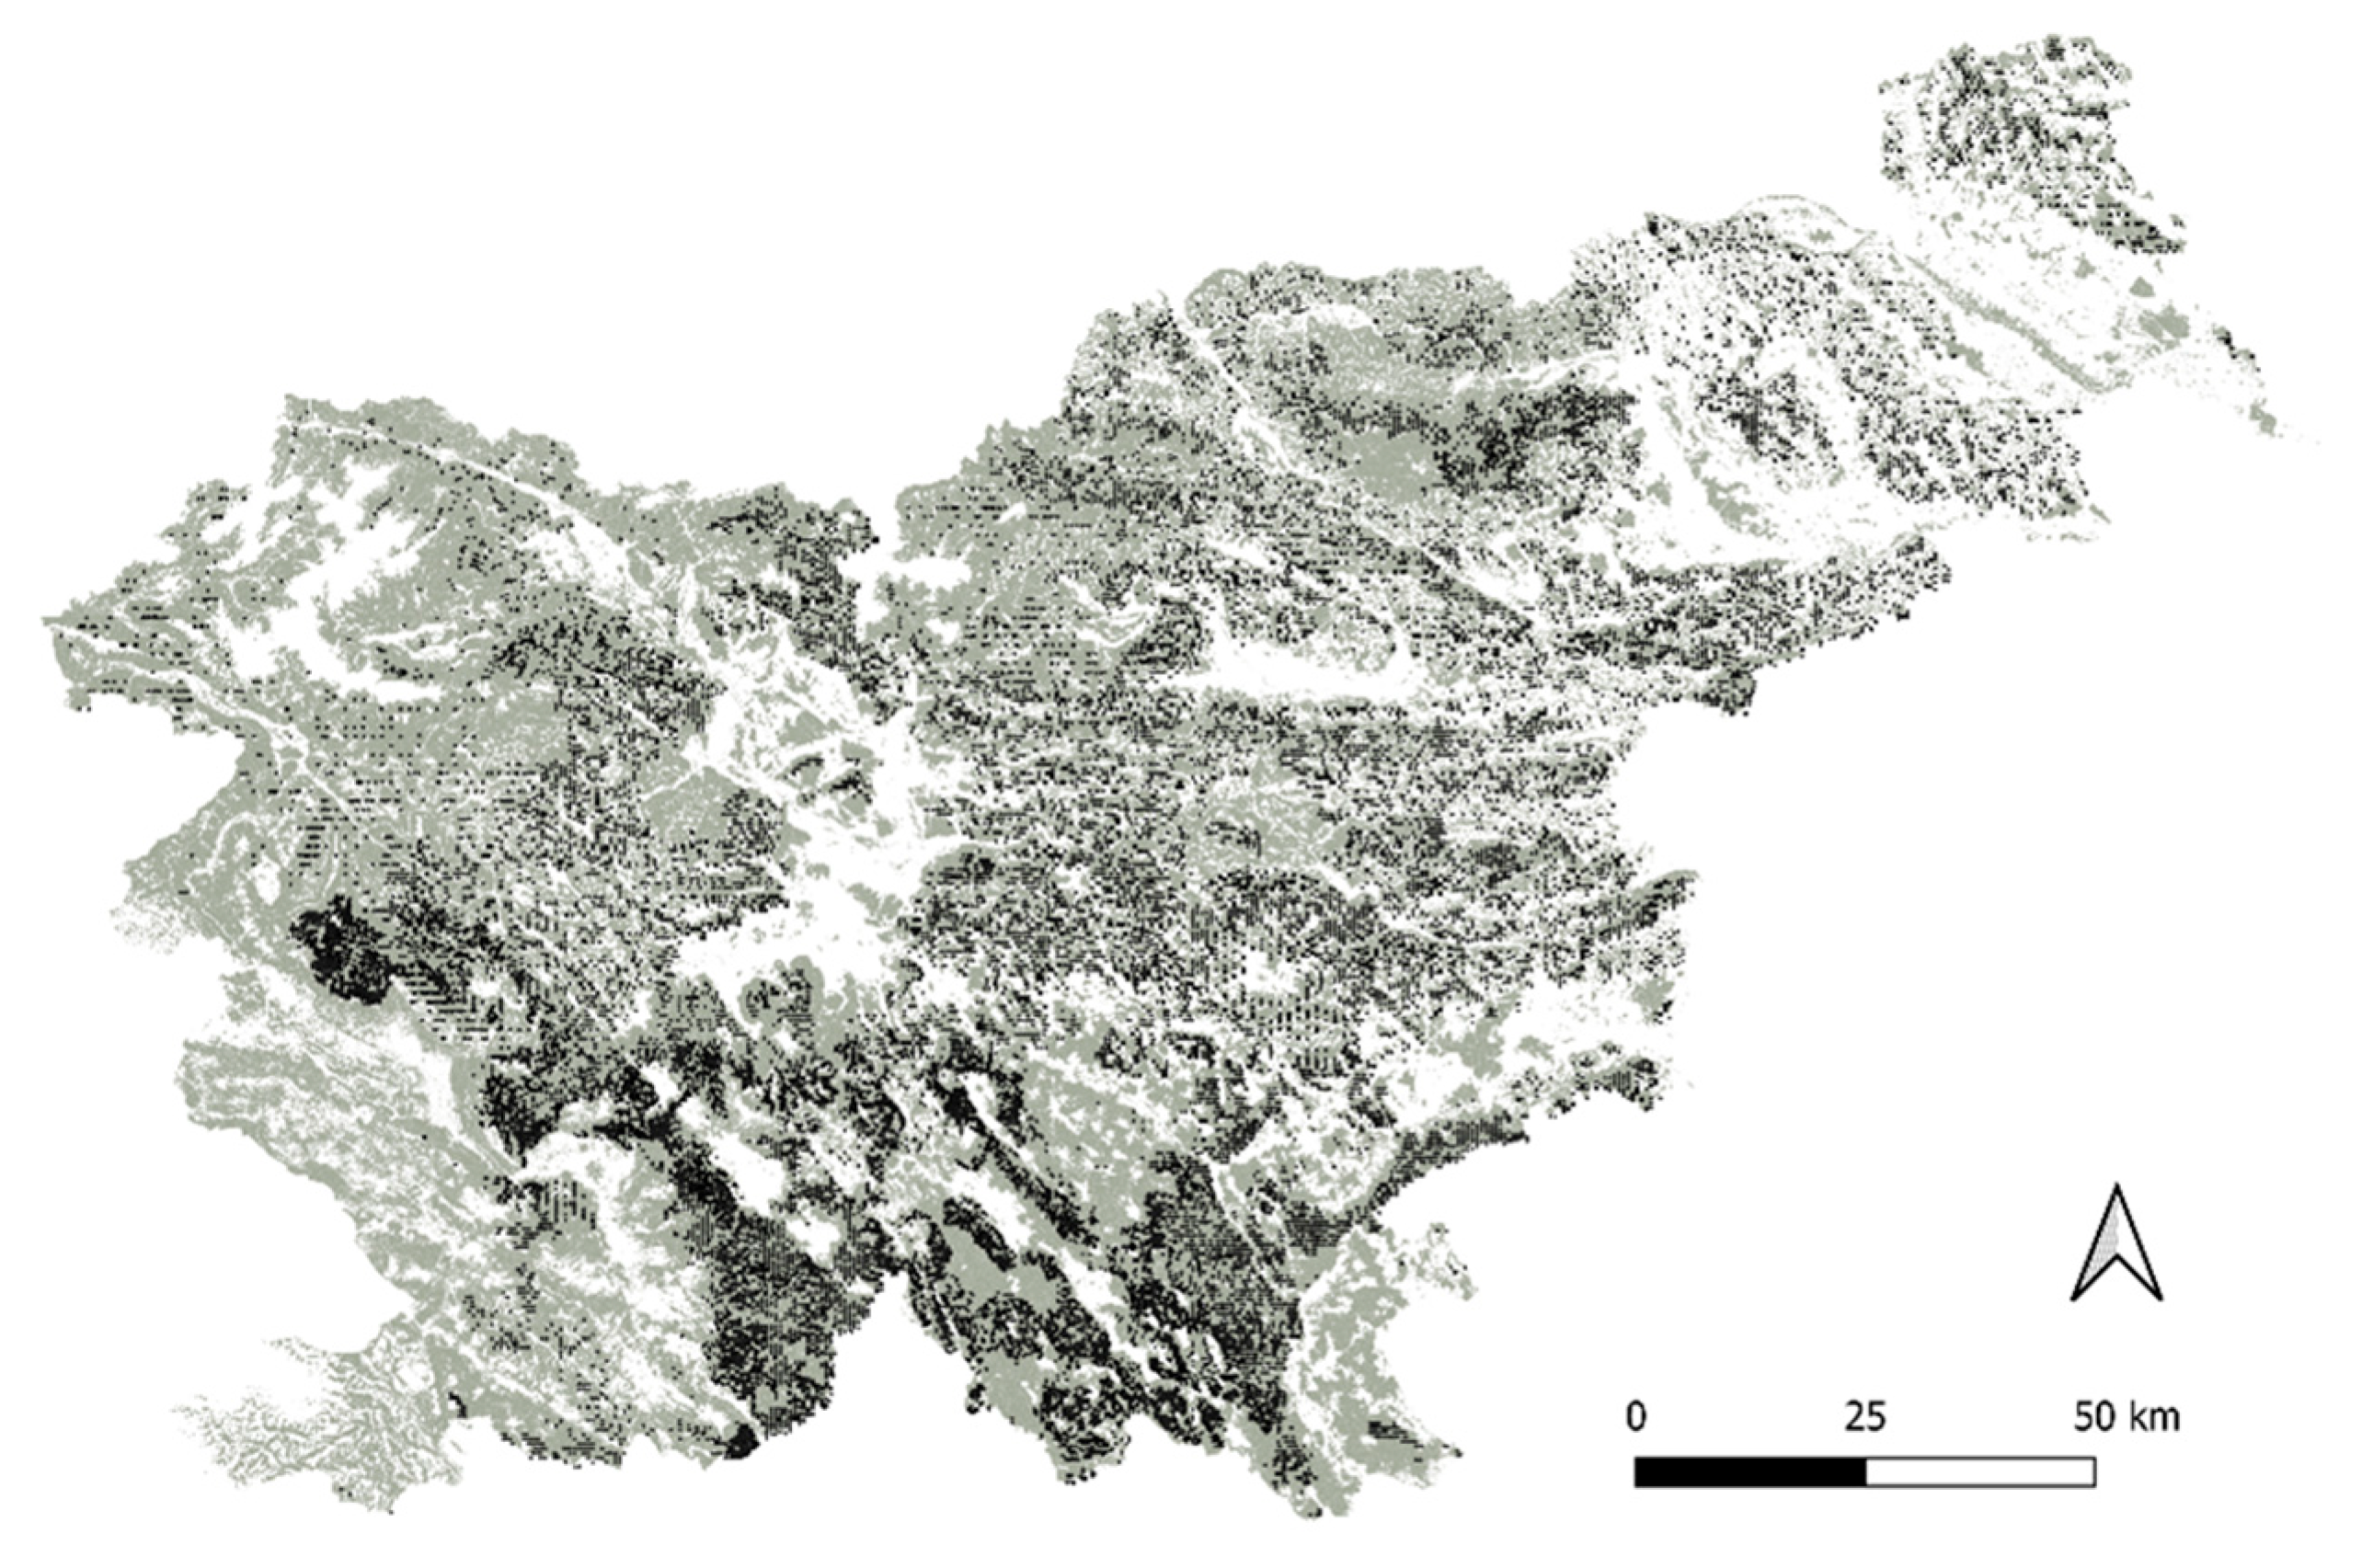
The study focused on the diameter growth of beech in homogeneous stands within beech forest types. The initial database comprised 193,314 individual beech tree data (dbh ≥ 10 cm) collected from 26,793 PSPs (Figure 1). Only structurally homogeneous plots, defined as homogeneous in tree sizes (i.e., even-sized) according to the Gini index [45], were included (n = 15,558). The Gini index, which is frequently used in forestry to assess stand structural homogeneity or heterogeneity [45,58], was calculated at the plot level based on tree basal area [59]. To classify forests into homogeneous and heterogeneous categories, k-means cluster analysis was performed using a Gini index threshold of 0.33 [58], which is consistent with the relevant literature [45].
Following the study objectives, we modeled the diameter growth of beech in pure stands and mixtures with several other tree species. Altogether, 131,905 individual beech trees were analyzed and used for modeling, while an additional 99,846 trees of admixed tree species were included in calculations of all competition and stand explanatory variables. Mixtures were defined based on (i) the proportion of beech in the basal area in each plot and (ii) the dominant admixed species. Accordingly, we considered pure beech plots (≥90% beech) and mixtures where the proportion of beech was <30%, 30%–59.99%, and 60%–89.99%, and the proportion of an admixed species (in one case, two admixed species) was at least 80% of the remaining BA. In addition to pure beech stands, we addressed six main mixtures in which beech is mixed with oak (Quercus robur L., Q. petraea (Matt.) Liebl.maple (Acer pseudoplatanus L., A. platanoides L.), pine (Pinus nigra JF Arnold, P. sylvestris L.), spruce, fir, and spruce and fir combined (spruce and fir). In total, we modeled beech growth in 18 mixtures and in pure beech stands (Table 1 and Table S2). For each mixture, we ensured a sufficient number of sample plots to avoid problems of overparameterization and convergence due to singularity errors [10].

2.2. Growth Modeling Procedure

2.2.1. Diameter Increment as the Response Variable

When measured in the field, tree dbh values were rounded down to the nearest centimeter [57]. Therefore, both the first and second dbh measurements were adjusted by adding a random component ρ, uniformly drawn from the interval [0, 1] for trees with a positive increment. The 10-year diameter increment (id) was then computed as the difference between these corrected dbh values [60], representing the dependent response variable. For trees with an observed zero increment, id was set to the random component ρ, while negative increments were truncated to zero under the assumption that they resulted from measurement error. Extremely large increments (id > 15 cm) were interpreted as errors and excluded from the modeling procedure [43]. After data cleaning, id ranged from 0 to 15 cm 10y−1, with a mean of 2.9 cm 10y−1. To analyze the diameter growth of beech across mixtures, analysis of covariance (ANCOVA) with dbh as a covariate was applied, and the estimated marginal means were plotted and compared. To reduce skewness and heteroscedasticity in the models, a square-root transformation of id was applied in the modeling procedure [61].

2.2.2. Explanatory Variables as Potential Predictors

In the modeling procedure, five groups of potential explanatory variables were included, namely tree, competition, stand, site, and climate explanatory variables (Table 2). Among tree variables, we used dbh and the quotient dbh/QMD, which indicates the position of the tree within the diameter distribution on a plot, e.g., [43].
To express competition among trees, three variables were used. The first was overtopping basal area (BAL), defined as the basal area of trees larger in dbh than the subject tree [40]. BAL is used to characterize size-asymmetric competition among trees on a plot, e.g., [30]. Stand basal area (BA) was applied to indicate size-symmetric competition among trees [22]. To detect the influence of release effects and reduced competition due to forest management, the relative basal area of harvested and naturally dead trees (CUT) was applied, indicating the impact of silvicultural measures and mortality. It was defined as the ratio between the BA of harvested and dead trees between two consecutive measurements and the BA of the stand at the first measurement.
Five stand variables were applied in the modeling procedure. Dominant stand diameter (DDOM), calculated as the mean diameter of the 100 thickest trees per ha, and quadratic mean diameter (QMD) both indicate the development phase of a stand represented by each plot. Although only homogeneous stands were included in the analysis, we used the Gini coefficient (GINI), calculated at the plot level, to describe tree size diversity, as it proved to be a good indicator of stand structure [45,59]. In addition, we also applied the maximum diameter of trees on a plot (DMAX), expressing forest management goals related to target tree size.
Among site variables, we included twelve, namely, elevation (ELE), slope (SLP), aspect (ASP), site productivity (SProd), variables describing soil characteristics (DSoil, DSoil_A, pH, pH_A, ORG, ORG_A, and SoilT), and beech forest types (BeechT), which are important tools for ecological forest management planning in Slovenia, allowing site-specific planning. As a proxy for SProd, a coefficient K was used, representing the volume of a tree with a reference dbh of 45 cm. K is applied in the one-parameter tree volume functions used in Slovenia to calculate tree volume [62]. It ranges from 1.20 to 2.95 m3, reflecting differences between sites in terms of the height of a tree of the same dbh.
Seventeen climate variables were tested for inclusion in the models. Temperature-related variables (T, Tmax, Tmin, Tmax_Jul, Tmin_Jan, Tspr, Tspr_sum, BIO2, BIO10, and BIO11), solar radiation (SOLRAD), and annual precipitation (PCP) were derived using long-term climate records [63] and the SLOCLIM high-resolution daily climate dataset for the period of 1950–2018 at 1 km2 resolution [64]. To calculate the standardized precipitation evapotranspiration index (SPEI), daily historical climate data of precipitation and evapotranspiration over Slovenia on a regular grid with a resolution of 0.125° were obtained for the period of 1981–2010 [63]. The SPEI was then calculated using the SPEI package in R, v1.8.0 [65]. The SPEI indices were calculated using data available up to 2010. For plots where the second measurement was conducted after 2010 (i.e., in 2011–2014), we assigned the SPEI value corresponding to the latest available year, namely 2010.
Table 2. Description of explanatory variables included in the diameter increment modeling procedure; model: x means the variable was included in the model calculation, and mc means the variable was excluded from the modeling procedure to avoid multicollinearity.
TypeAcronymDescriptionUnitMeanSDMinMaxModel
DependentidDiameter increment at breast heightcm2.92.1014.5
Treedbh Diameter at breast heightcm26.811.81088x
dbh/QMDQuotient dbh/QMD mc
CompetitionBALOvertopping basal aream2 ha−118.4912.06089.22x
BAStand basal aream2 ha−132.0210.530.8790.54x
CUTRelative basal area of cut and dead trees%10.1%13.5%0.0%99.4%x
StandNNumber of trees per hectare 698381403000mc
QMDQuadratic mean diametercm26.27.210.068.8mc
DDOMDominant diameter as mean diameter of the 100 thickest trees per hacm38.68.710.075.3x
DMAXMaximum plot diameter cm44.710.410.088mc
GINIGini index (heterogeneity)%0.260.050.000.33x
SiteASPAspect1-warmer aspects S, SE, SW, W; 0-colder aspects N, NE, NW, Ex
SLPSlope°20.19.7054x
ELEElevationm a.s.l.688294.5801629x
SProdCoefficient K as a proxy for site productivitym31.970.261.202.95x
DSoilDepth of soil (cm)cm59.324.50365x
DSoil_ADepth of soil A horizoncm13.55.1057x
pHSoil pH (average) 5.121.110.007.60x
pH_ASoil pH of the A horizon 5.071.330.007.50x
ORGSum of organic matter%8.33.3038x
ORG_ASum of organic matter in A horizon%3.90.908x
BeechTBeech forest typeCategorical variable *x
SoilTSoil typeCategorical variable *x
ClimateTAverage annual temperature°C8.01.5011mc
TmaxMaximum annual temperature°C12.82.17.018.5mc
TminMinimum annual temperature°C3.71.5−1.07.0mc
Tmax_JulMaximum temperature in July°C23.02.316.028.0mc
Tmin_JanMinimum temperature in January°C−4.21.5−9.51.5mc
TsprAverage temperature for March, April, and May °C7.52.01.012.0x
Tspr_sumSum temperature for March, April, and May °C22.45.93.036.0mc
SOLRADSolar radiation kJ m−21907.5105.615802395mc
BIO2Mean diurnal range (Tmax–Tmin) °C9.12.40.016.0mc
BIO10Mean temperature of warmest quarter (°C)°C16.42.010.321.8mc
BIO11Mean temperature of coldest quarter (°C)°C−0.61.3−4.35mc
SPEI6Sept_minMinimum September value of SPEI-6 in the 10-year period between dbh measurements −1.870.12−2.38−1.43x
SPEI6Sept_avgAverage September value of SPEI-6 in the 10-year period between dbh measurements −0.110.16−0.760.32x
SPEI6_
duration
Maximum number of months with SPEI-6 continuously ≤ −1.5 in the 10-year period between dbh measurementsmonth5.41.138x
SPEI6Sept_shareShare of years in the 10-year period between dbh measurements with September value of SPEI-6 ≤ −1.5%14.45.1030x
PCPMean annual precipitation (mm)mm1686.5406.38503600mc
* BeechT—colline and submontane, montane, altimontane and subalpine, thermophilus, and acidophilus; SoilT—eutric and chromic cambisol, dystric cambisol, leptosol, and other soil types.

2.3. Model Formulation

To avoid multicollinearity, we eliminated one of the explanatory variables in pairs for which the Pearson correlation coefficient was greater than 0.8, using the cor() function in the stats R package, v4.1.3 [66]. We eliminated fifteen potential explanatory variables, eleven of them being climate variables (Table 2, marked with mc).
As our data are arranged in a hierarchical structure, the most appropriate method to model the diameter growth of an individual tree is linear or nonlinear mixed-effects modeling. We estimated the linear mixed-effects model with natural splines using the lmer() function from the lme4 package [67]. This formulation incorporated a random intercept with a fixed mean, allowing intercepts to vary among plots while keeping slope variability constant across them. However, when the linear mixed-effects modeling procedure was applied, the variance component associated with the plot-level random effect was small (τ00 = 0.109, p < 0.01), suggesting that plot-specific differences exert only a limited influence on diameter increment. The intraclass correlation coefficient, representing the proportion of total variance attributable to plot-level heterogeneity, was around 0.27, which fell below the commonly cited threshold of 0.5 for supporting the use of a random-intercept mixed model [68]. In addition, parameter estimates from the mixed-effects model were only marginally different from those of the fixed-effects model. Based on these results, we omitted this methodology and proceeded with a generalized linear modeling approach. Our basic model was therefore specified as in Equation (1):
i d = β 0 + i n β i   x i + ε i
where id represents the 10-year diameter increment of beech, β0 is the intercept, βi are coefficients associated with the predictor variables xi, and εi is a residual error term. A single model was developed for all beech trees, and separate models were developed for each mixture, since our focus was the investigation of growth patterns of beech across different mixtures.
To detect potential nonlinear relationships between the response and explanatory variables, id was modeled using natural cubic splines, implemented with the ns() function from the splines R package [66]. Natural cubic splines constitute a flexible extension of generalized linear modeling, approximating nonlinear patterns through piecewise cubic polynomials while enforcing linearity beyond the boundary knots. This formulation generally yields more stable behavior at the extremities of the data range compared with standard cubic splines and prevents unrealistic responses beyond the boundary knots [69]. The model with natural splines is specified as in Equation (2):
i d = β 0 i + β 1 i   x i + β 2 i x i a 1 i 3 +   β 3 i x i a 2 i 3 + + β k i + 1 x i a k i 3   + ε i i = 1 , , n
where id represents the 10-year diameter increment of beech, β0 is the intercept, βi are coefficients associated with the predictor variable xi, ai are knots, and εi is a residual error term. The model parameters were estimated using the maximum likelihood estimation (MLE) [70]. Splines with one to three knots were generated for variables exhibiting a significant deviation between the residual and component lines and were subsequently incorporated into a stepwise model selection procedure. This was followed by backward elimination, wherein the number of knots in variables with non-significant spline segments was reduced and the model was refitted. Variable inclusion or removal was guided by changes in the Akaike Information Criterion (AIC) computed using the stepAIC() function from the MASS R package, v7.3-56 [71].
When the model for each mixture was developed, we additionally calculated the variance inflation factors (VIF) using the vif() function in the car R package, v3.0-12 [72]. If VIF > 10, the predictor was removed from the model to avoid multicollinearity (Table 2, marked with mc). Since our main focus was the effects of BA and BAL on beech growth, in some models, these predictors were retained despite VIF values being slightly over 10.
After the model was built, extreme outliers were removed within each model with outlierTest() and influencePlot() from the car package, v3.0-12 [72], and the model was refitted with cleaned data. Because the sampling grid density of PSPs varied among regions, plot data were weighted by relative spatial resolution to account for differences in sampling intensity. Relative spatial resolution was calculated as the quotient between the spatial resolution of the observed plot and the mean spatial resolution of all plots.
The predictive performance of the fitted model was assessed using 10-fold blocked cross-validation, implemented with the trainControl() and groupKFold() functions from the caret R package, v6.0-91 [73]. The fit of each model was quantified using the coefficient of determination (R2), root mean square error (RMSE), and mean absolute error (MAE).

3. Results

3.1. Diameter Growth of Beech in Pure Stands and Two-Species Mixtures

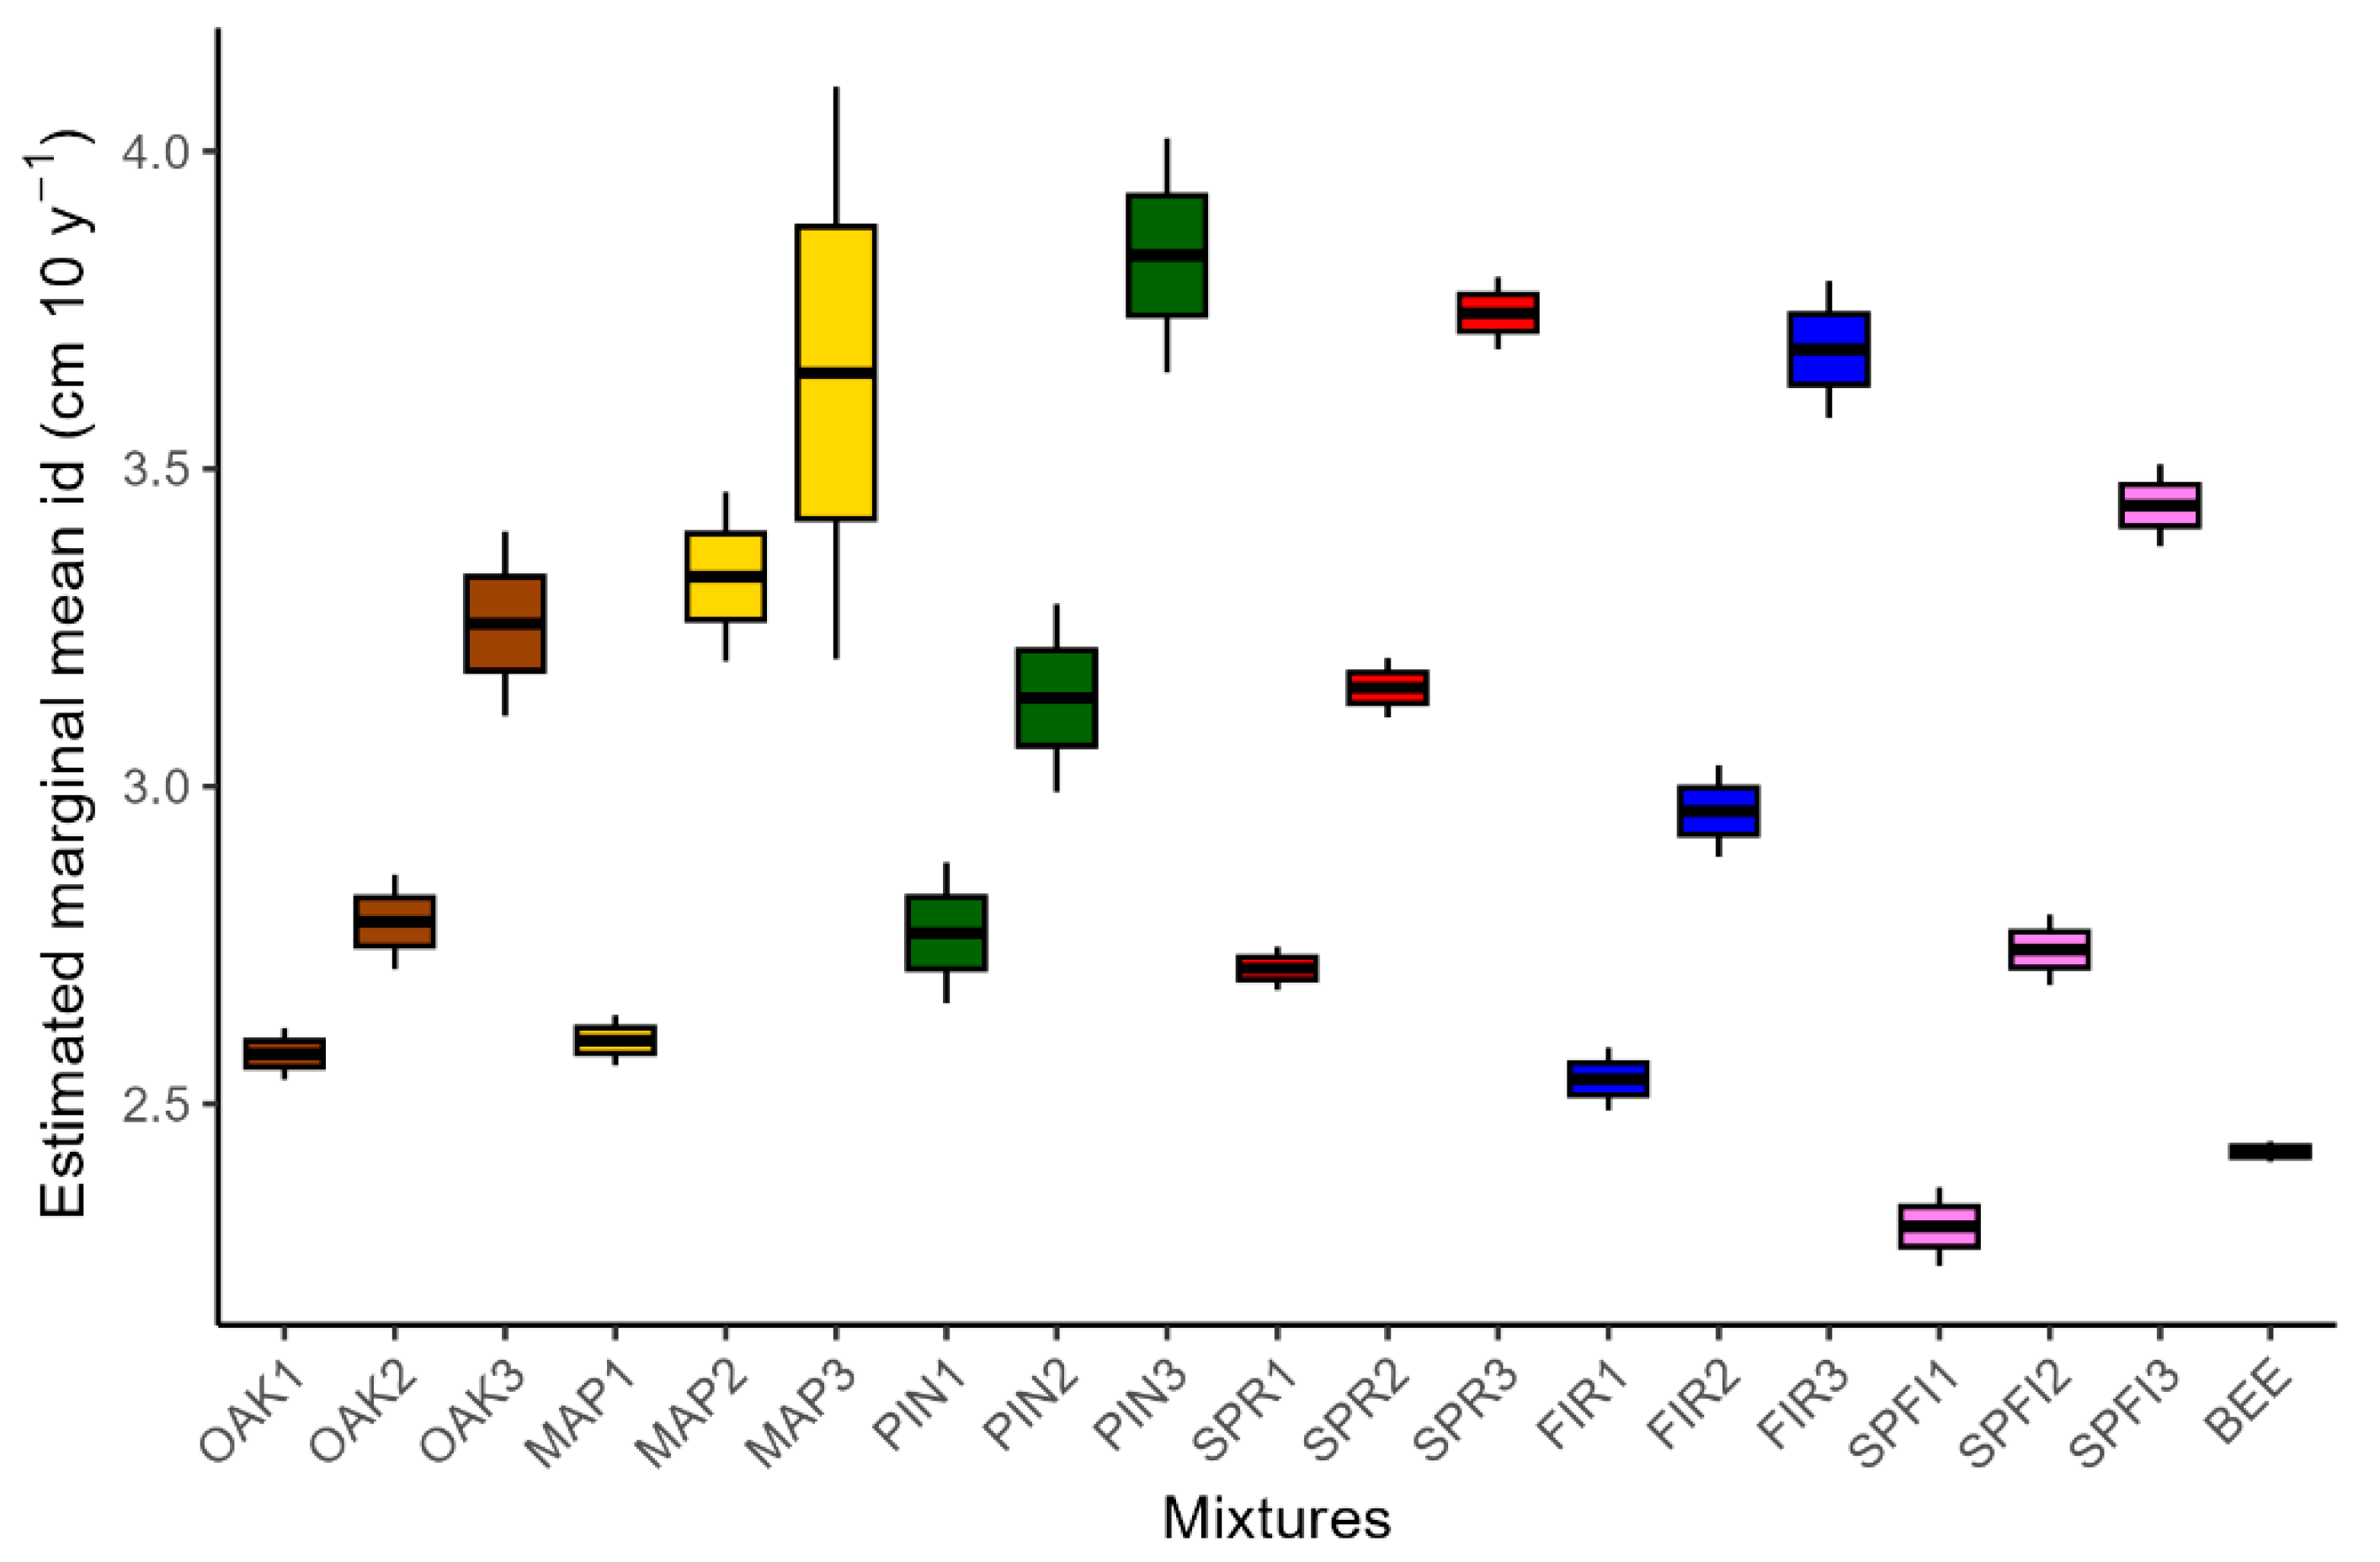
The average id of beech significantly differed between pure stands and mixtures (ANCOVA, p < 0.05). In pure stands, the estimated marginal mean id was the second lowest (2.42 cm 10y−1); the lowest was found in the beech–spruce and fir mixture with 60%–90% beech (SPFI1, 2.31 cm 10y−1). The highest diameter growth was observed in the mixture with pine and a proportion of beech up to 30% (PIN3, 3.84 cm 10y−1). Within mixtures composed of the same admixed species, the same pattern was observed across all mixture classes: the estimated marginal mean id increased as the proportion of admixed species increased (Figure 2). The largest difference between mixtures with the same species was found for fir and spruce and fir, for which the highest estimated marginal mean id in fir- (FIR3) and spruce and fir-dominated mixtures (SPFI3) was 45% and 49% higher than in the corresponding mixtures with 60%–90% beech (FIR1, SPFI1), respectively. The lowest difference was found for mixtures with oak (26%).

3.2. Diameter Increment Model for All Beech Trees Irrespective of Mixture

The model for all beech trees, regardless of mixture, explained 26.4% of the variance in the diameter increment of beech. The model is shown in Equation (3), and the coefficients and other parameters are given in Table S3:
√id = β0 + β1 ns(dbh,2) + β2 ns(BAL,2) + β3 ns(BA,3) + β4 (CUT,2) + β5 ns(DDOM, 3) + β6 GINI + β7SProd + β8ASP + β9 ns(SLP,3) + β10 ns(ELE,3) + β11 ns(DSoil,2) + β12DSoil_A + β13Orgs + β14Orgs_A + β15SoilT + β16BeechT + β17Tspr + β18SPEI6Sept_min + β19SPEI6Sept_avg + β20SPEI6_duration + ei
It achieved an RMSE of 0.606 cm and an MAE of 0.471 cm. The most influential predictors were those describing the tree characteristics (dbh) and competition (BA, BAL, and CUT), which together contributed 78.6% to the explained variance. Tree dbh accounted for 36.2% of the explained variability, and competition predictors explained 42.4%, of which CUT, BA, and BAL contributed 19.4%, 16.8%, and 6.2%, respectively. Stand, site predictors, and climate predictors added 4.9%, 12.8%, and 3.5%, respectively.

3.3. Diameter Increment Models for Beech in Pure Stands and Mixtures

There were obvious differences in the predictors included in the diameter increment models among mixtures, as well as in the magnitude and direction of their effects (Tables S4–S6). Model performance differed among mixtures as well, as R2 ranged from 20 to 34% in most mixtures, with the lowest observed in mixtures with oak and pine (Table 3). An exception with much higher R2 was the model MAP3, which was, however, developed on a small sample of 70 trees; thus, the results should be interpreted with caution. When validated, RMSE ranged from 0.494 to 0.646 cm, and MAE ranged from 0.390 to 0.519 cm; again, mixtures with pine and oak showed the highest prediction errors (Table 3).
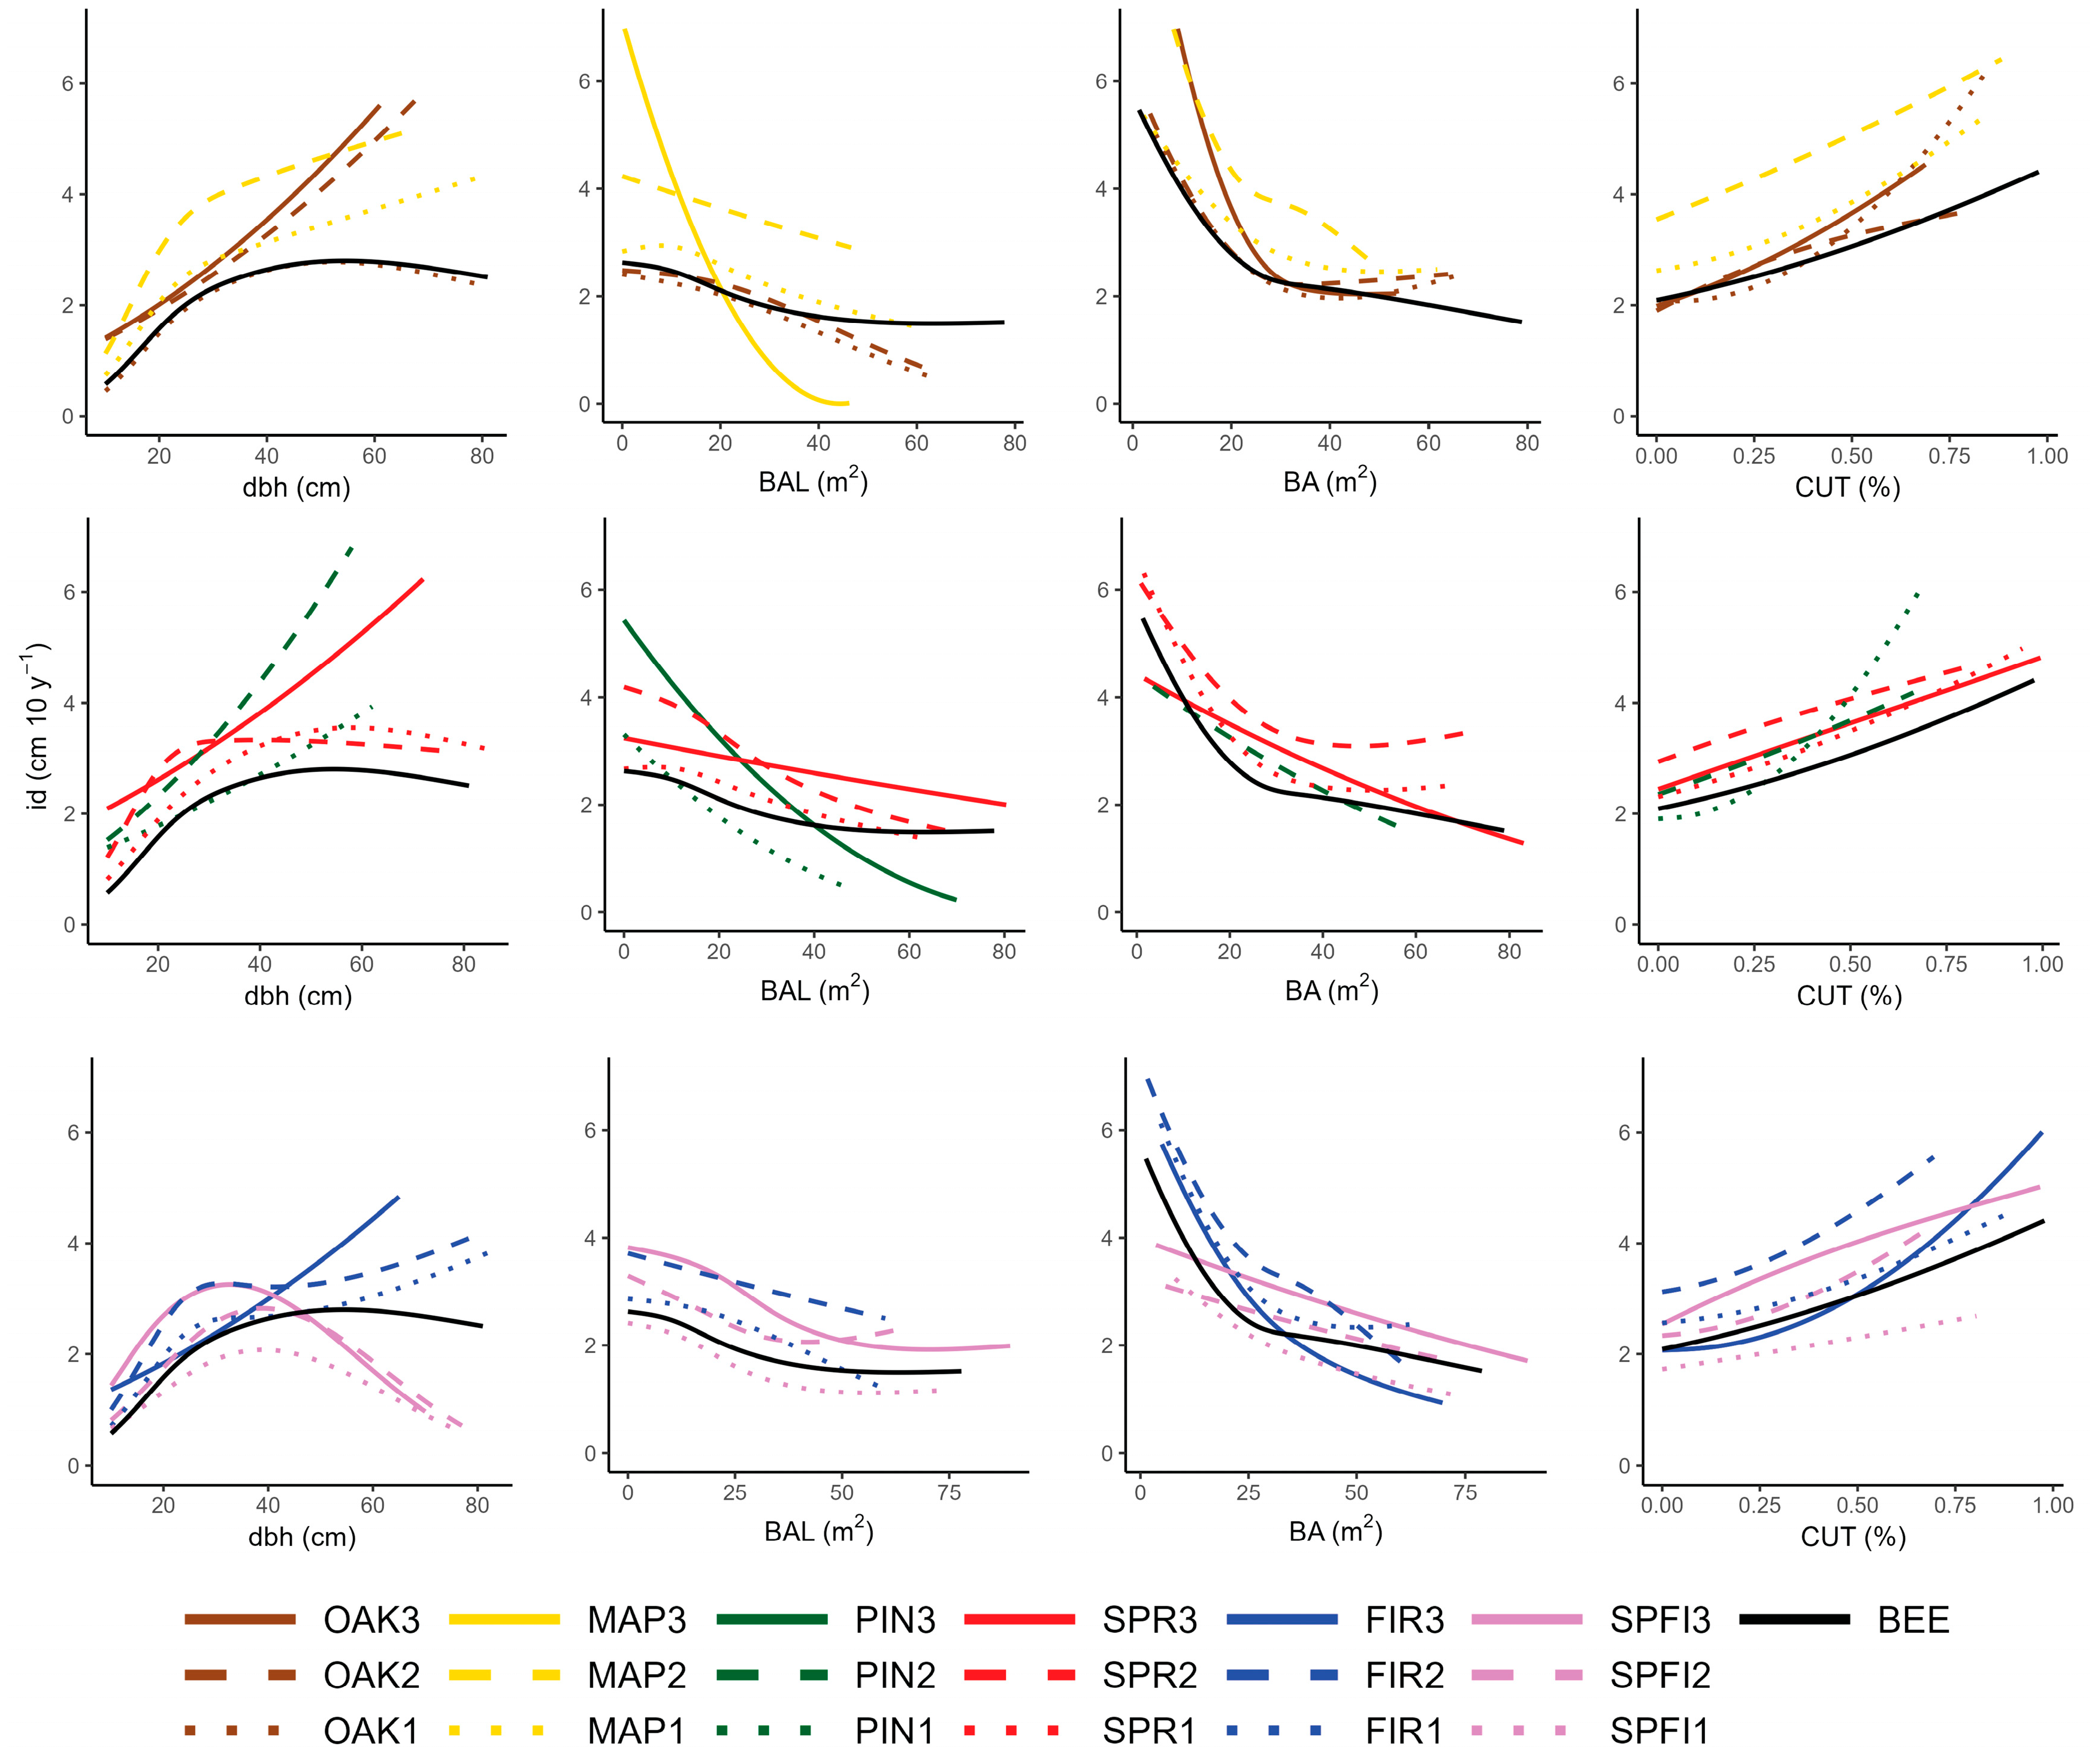
Across mixtures, the most important predictor was tree dbh, which was included in all models except in maple- and pine-dominated mixtures (MAP3 and PIN3) (Table 4). The relationship between id and dbh differed between mixtures, as natural splines with 0–2 knots were determined, reflecting different relationship patterns. The decline in beech id with increasing dbh was most pronounced in stands where beech was admixed with spruce and fir. We detected a linear relationship in mixtures with admixed pine (PIN1, PIN2) and oak (OAK1, OAK2), but also in spruce (SPR3) and fir-dominated stands (FIR3). In two mixtures with fir, the increment curve showed an increase with increasing dbh at lower values, then remained static for mid-sized trees, and subsequently it began to rise again for large-sized trees (Figure 3). A logarithmic-shaped curve with a decline at larger dbh, representing the expected growth pattern, was observed only in pure beech stands and in stands with lower admixture of oak and spruce (OAK1, SPR1, and SPR2).
Predictors describing competition were strongly influential in all models, accounting for 16%–75% of the explained variability, with an average of 40% (Table 4). There was no consistent pattern specifying whether BA, indicating size-symmetric competition, or BAL, indicating size-asymmetric competition, was more important within a specific mixture; however, in general, BA appeared to have a larger influence (Table 4). BA appeared more important in pure beech stands and in several mixtures with oak, spruce, fir, and maple, with the exception of maple-dominated stands (MAP3). With increasing BA, id declined, most often sharply down to approximately 30 m2/ha, while beyond this threshold, the decline became more gradual. Curves with a gentler decline were observed for mixtures with spruce and fir, while the most rapid reduction in id with increasing BA occurred when beech grew in mixtures with maple and pine (Figure 3).
BAL was particularly influential in maple- and pine-dominated stands (MAP3, PIN3), but also in beech stands with a lower proportion of admixed pine (PIN1). In spruce–fir–beech mixtures, BAL was more important than BA in two of those mixtures. The largest reduction in id with increasing BAL occurred when beech grew in mixtures with maple and pine, while in other mixtures, the slope of the curve was gentler and similar across mixtures.
CUT exerted a substantial influence, in some cases surpassing the influence of BAL and BA. CUT appeared to have the largest influence in mixtures with spruce and oak (Table 4). In all models, CUT exhibited a progressively increasing relationship with id.
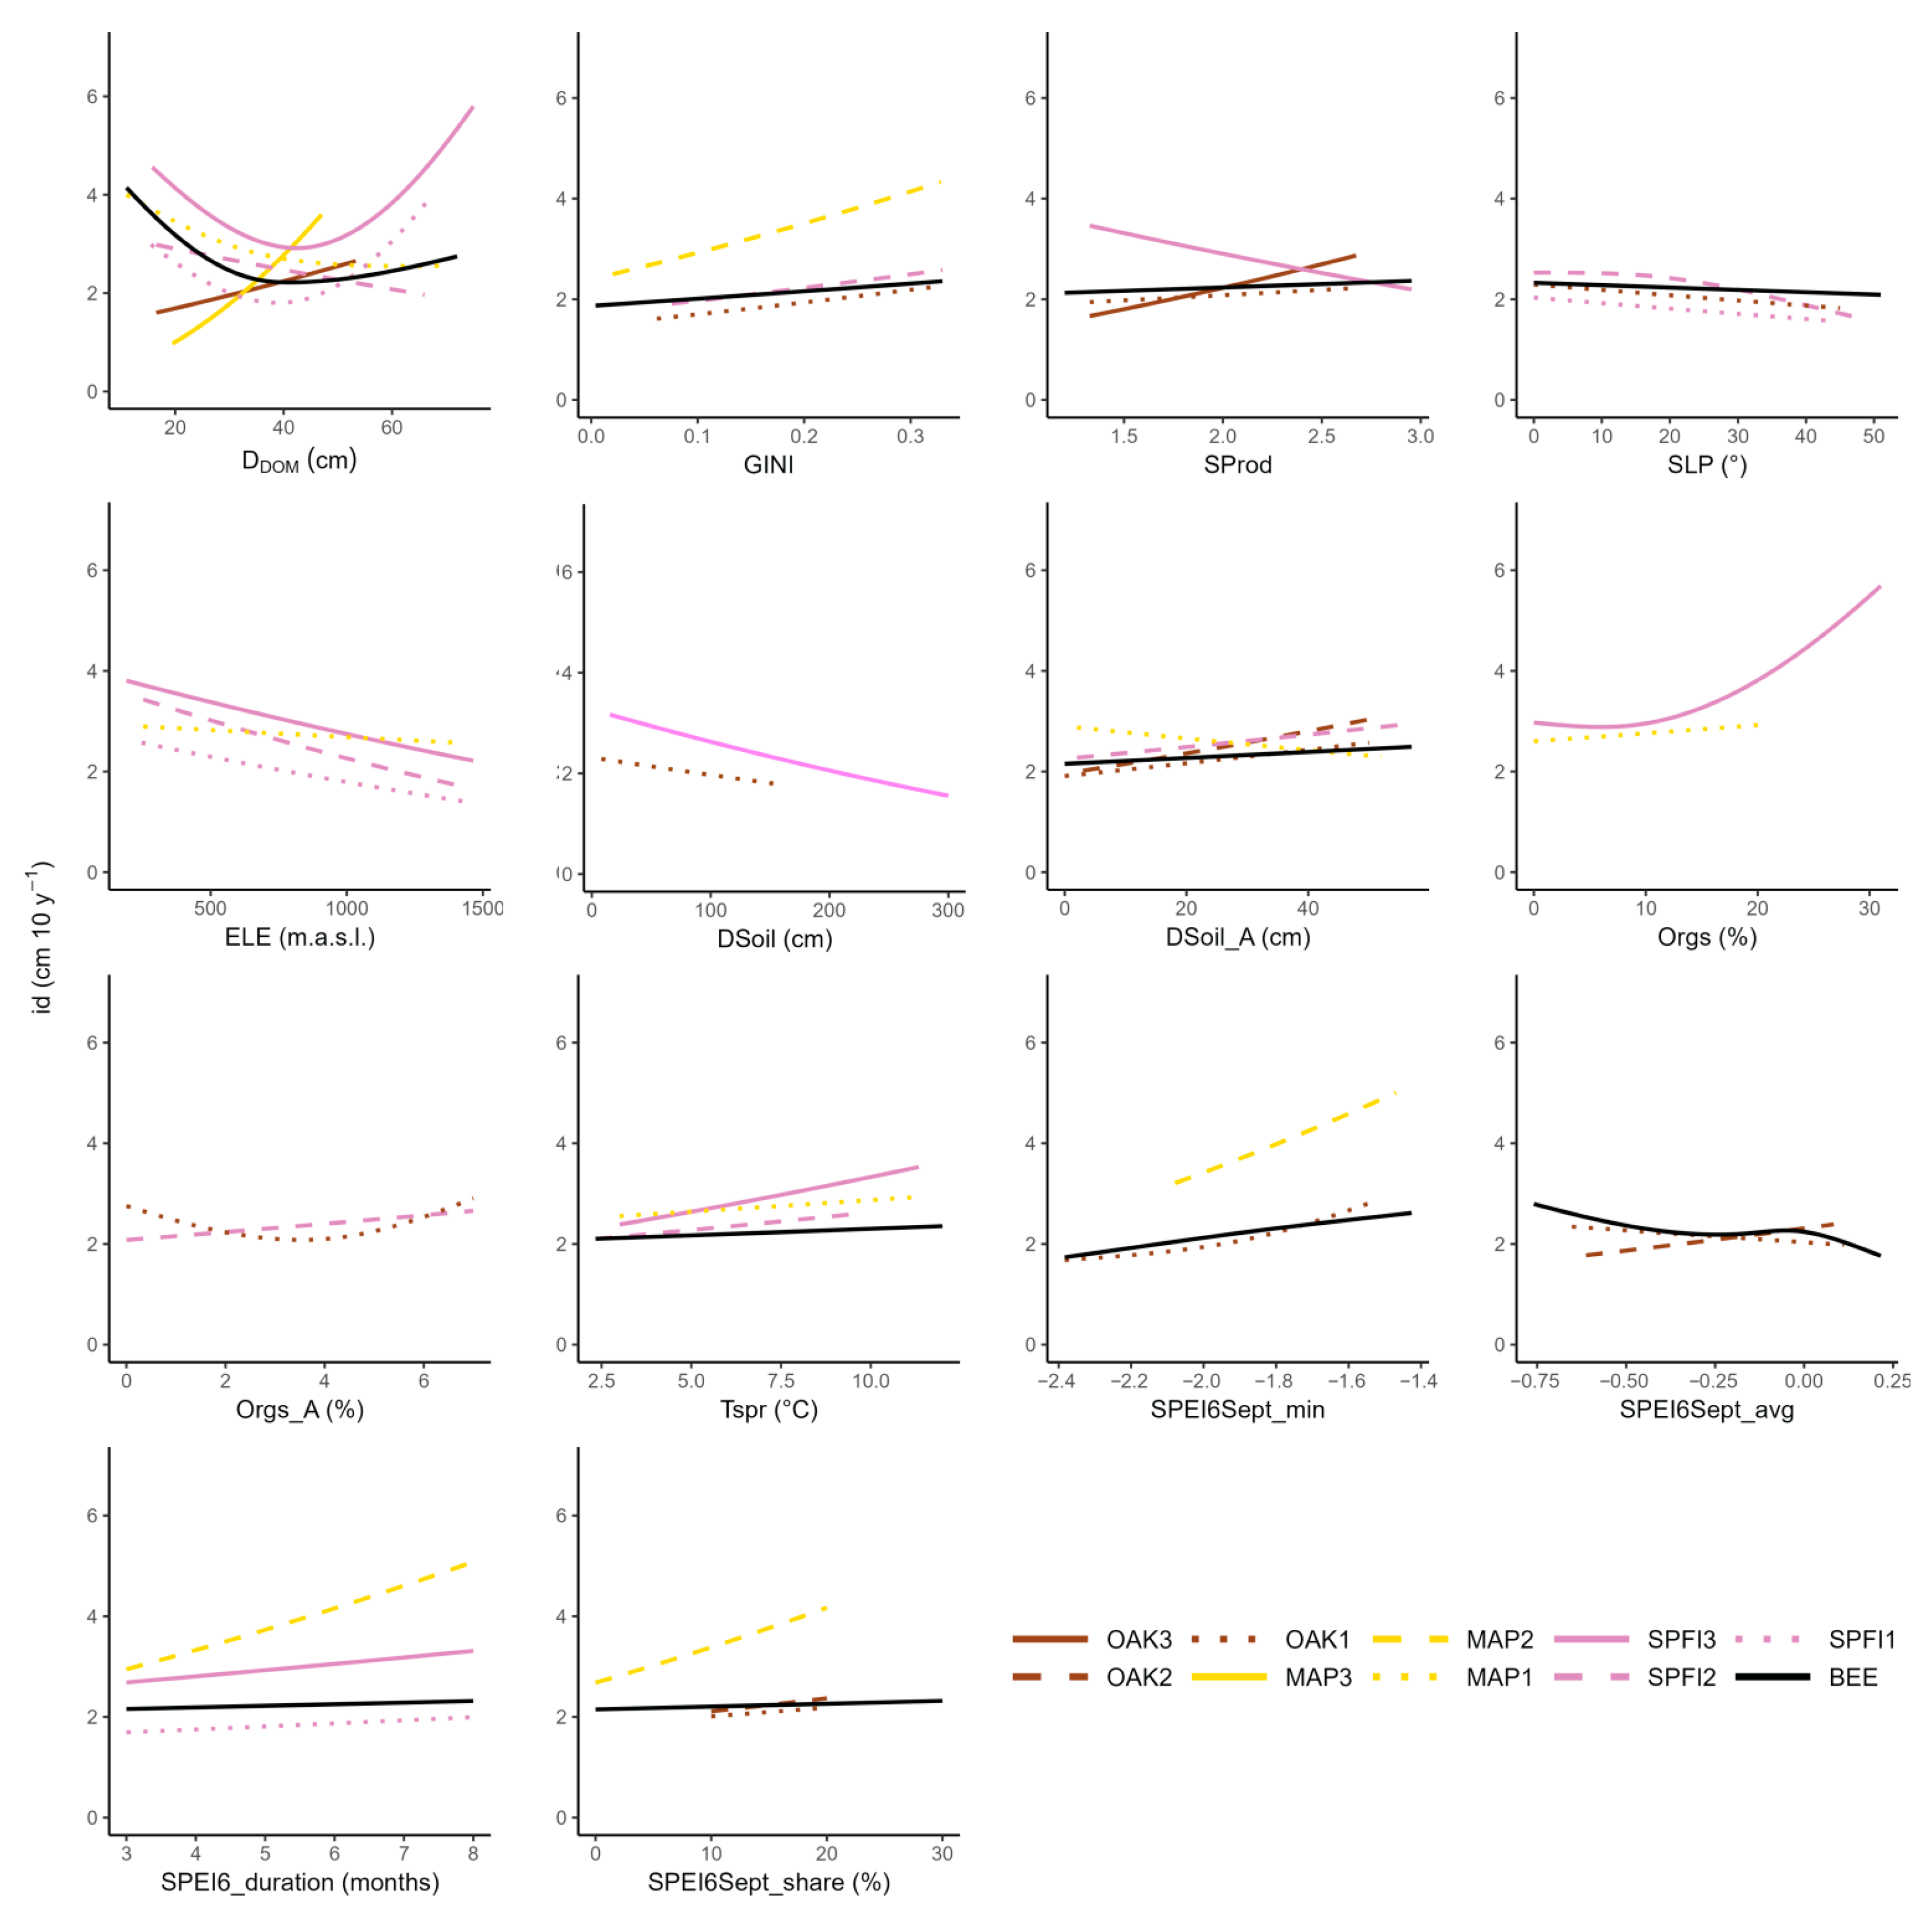
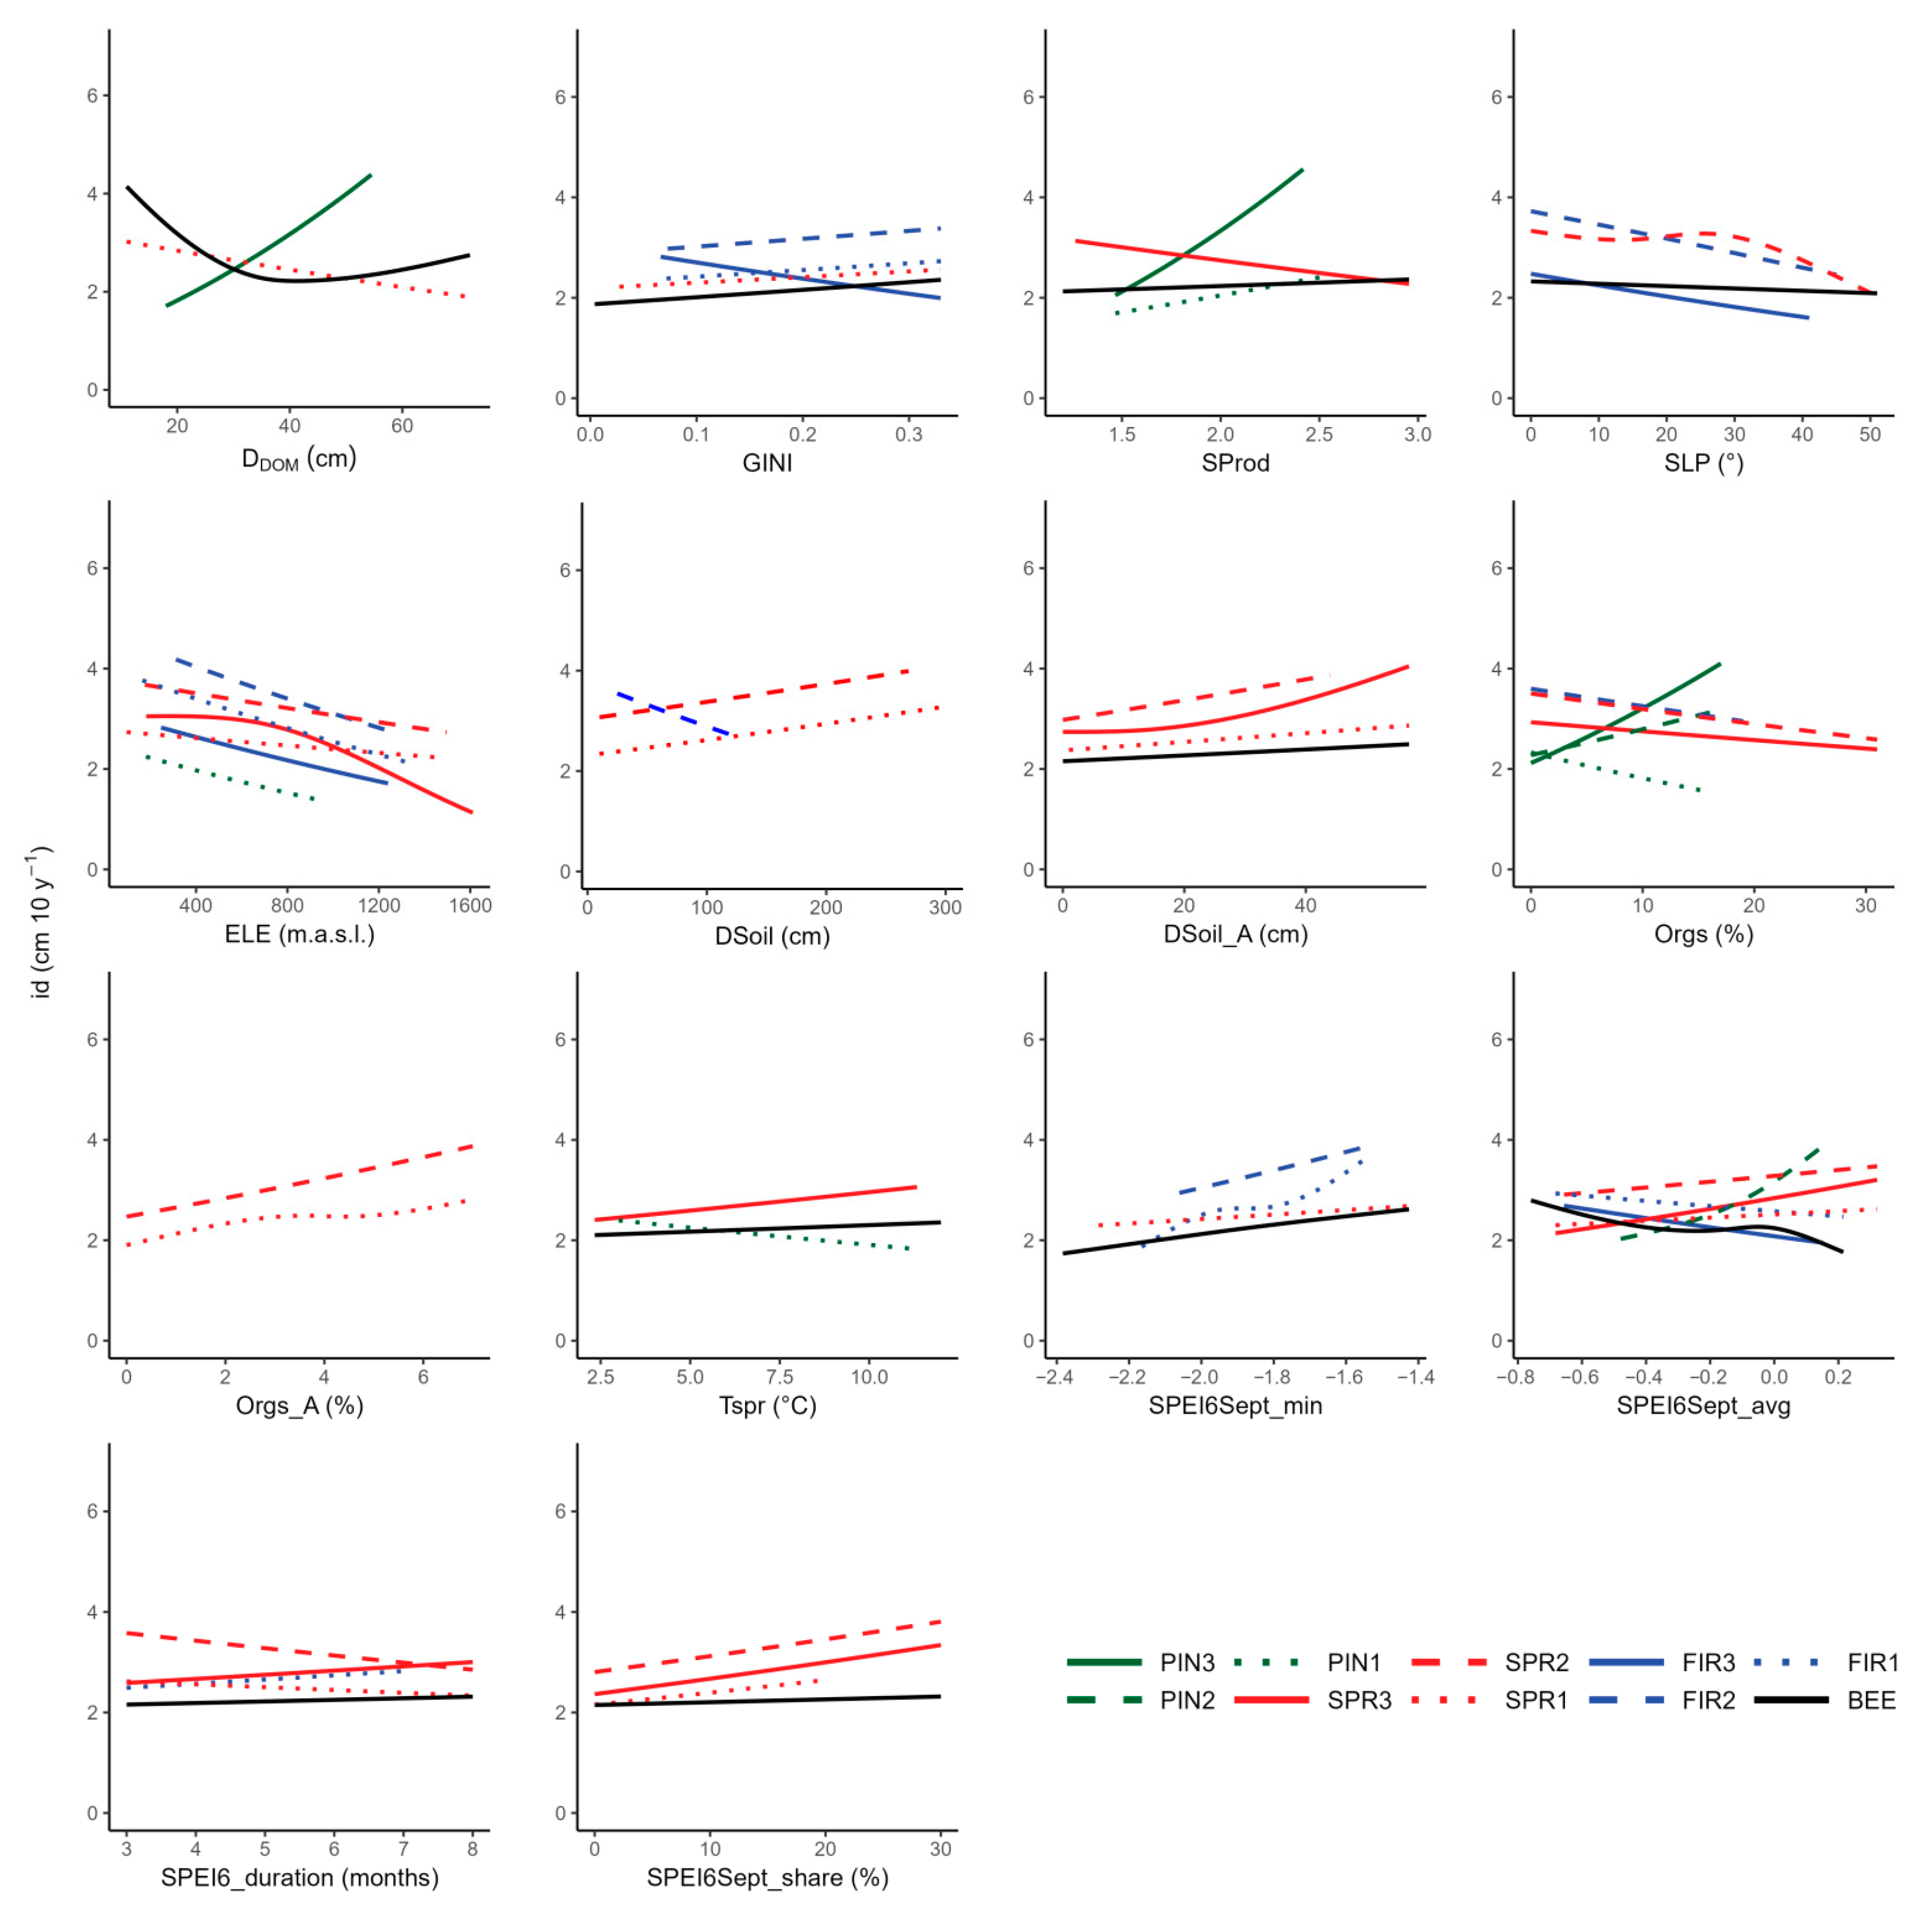
The effects of other predictors were generally smaller (Table 4, Figure 4 and Figure 5). The influence of DDOM varied among mixtures and was included in all models containing spruce and fir, where its contribution to the explained variability was the highest. ELE played an important role in mixtures containing spruce and/or fir and was included in all models for mixtures with at least one of these species. For all mixtures where it was included, id increased with ELE and decreased with SLP. In contrast, SProd exhibited an opposing effect across mixtures. In spruce-dominated (SPR3) and spruce and fir-dominated stands (SPFI3), this relationship was surprisingly negative and linear, indicating lower id at higher site productivity. Soil parameters played the greatest role in mixtures where beech is mixed with pine, followed by mixtures with spruce and oak (Table 4); however, the direction of their effects was not always consistent (Figure 4 and Figure 5). Climatic parameters appeared to exert a stronger influence in mixtures with spruce but also stood out in some models for maple (MAP2) and pine (PIN2) (Table 4). For all mixtures, id increased with higher SPEI6Sept_min, indicating better growth in areas with lower drought intensity. Average SPEI6Sept_avg showed a diverse relationship, as it increased id in five mixtures and decreased in four mixtures.

4. Discussion

In the study, we aimed to develop diameter-growth models for beech across mixtures with various tree species, including tree, competition, stand, site, and climate variables, and, in particular, to determine whether the relevance of size-symmetric and size-asymmetric competition differs between mixtures.
The performance of the 19 models we developed ranged from 19% to 34%, despite the large number of variables included in the modeling procedure. The low performance rate of the models is not an issue as the models were mainly intended for studying influential factors and competition mechanisms among mixtures rather than for high-precision prediction of individual tree growth. Nevertheless, it was comparable to that reported in similar studies, e.g., [43,74,75], while [10,29,76] reported substantially higher R2 values. The ability to explain beech diameter growth was quite similar among mixtures, although a somewhat poorer model performance was observed in mixtures with pine. The low overall performance suggests that additional, unmeasured factors influence beech diameter growth in these mixtures. The diameter growth of pine and oak, and thus also the competitiveness of both species in mixtures, strongly depends on soil conditions [74]. More detailed soil data at sites where beech co-occurs with these and other species might improve growth models. The performance of models in different mixtures was likely influenced by the number of sample plots and trees as well. In mixtures with fewer plots and trees, the variability in independent predictors was lower, which may have affected the results. In the mixture with maple where beech constitutes <30% (MAP3), the results are likely to be unreliable due to the small sample size [10].
In the final models, the influence of predictors differed among mixtures. Different sets of predictors were included in the models. They explained varying amounts of variability, and their effects differed in magnitude and direction.

4.1. Competition as a Crucial Predictor of Beech Diameter Growth

Competition-related predictors BA, BAL, and CUT were recognized as the most influential, as they explained, on average, 40% of the variability in id. Competition is known to be an important driver of tree growth [9,22,26], and for beech it was often found to be the most influential predictor, far more than site or climatic conditions [24,77]. In mixtures in which competition variables were less important, other predictors, especially site-related predictors, contributed considerably more to the explained variability of id (e.g., in mixtures with spruce and fir). In these mixtures, the negative impact of competition for belowground resources or light seems to be less crucial for beech growth. A probable reason for this may be that, in these mixtures, site conditions represent the dominant limiting resource for beech growth, or even for the growth of all species [24].
There was no clear pattern indicating whether size-asymmetric or size-symmetric competition influenced beech diameter growth more across or within mixtures with a certain tree species. Most models included both components, as was also the case in Switzerland [31]. However, in general, the prevailing mode of competition seemed to be size-symmetric competition, represented by BA. This means that competition for belowground resources, including nutrients and water, seems more important than competition for light. This is in line with Mina et al. [31] but contrasts with the findings of del Río et al. [18]. Size-symmetric competition was found to be more pronounced on low-productivity sites, while size-asymmetric competition was more pronounced on more fertile sites [24].
The BA contribution to the explained id variability was greater than that of BAL in pure beech stands and in mixtures with fir, oak, and maple (the exception was MAP3). This confirmed the importance of the size-symmetric competition and belowground competitive ability of beech [18,78]. If admixed with fir or oak, beech might be assumed to benefit from the hydraulic redistribution of water taken up by deeper rooting systems of the admixed species [79]. In addition, several studies reported beech’s ability to make morphological and physiological adjustments to its rooting system compared to competing species in mixed stands [77,80]. For example, the fine-root development of beech may be facilitated in mixtures with spruce due to reduced intraspecific competitive pressure [80].
In most mixtures, id decreased sharply with BA up to approximately 25–30 m2/ha, while beyond this threshold the decline became more gradual. Compared to beech growth in mixtures in Spain [22], the pattern was similar, but at lower stand densities than the decrease in id, and in our case, much more rapid. This means that size-symmetric competition for belowground resources increases sharply with increasing stand density. At higher stand densities, the negative influence of size-symmetric competition diminishes; however, it is not obvious which predictor becomes more influential at these stand densities. An exception was mixtures with beech–spruce and fir. In all mixtures of these species, id at the lowest BA was lower than in other mixtures, and the overall relationship was divergent, and in two mixtures it was even linear. However, the contribution of BA in these models was lower than that of BAL and CUT.
In contrast, size-asymmetric competition, measured with BAL, appeared to possess greater significance than size-symmetric competition in mixtures dominated by pine (PIN3) and maple (MAP3), with a smaller contribution also relevant in the three-species mixture of beech–spruce and fir (SPFI). Competition for vertical space and light is obviously a crucial driver of beech diameter growth in these mixtures, indicating its lower competitiveness on specific sites. There, the admixed species are more adapted to specific site conditions, such as maple on moist, nutrient-rich soils or Scots pine on shallow, sandy, and dry soils [81]. In mixtures with pine, the results were unexpected. Given that sites of beech–pine mixtures are the least productive (Table S2) and that size-symmetric competition has been identified as the dominant mode of competition for pine diameter growth in Spain [26], we expected a similar pattern in our study. Instead, size-asymmetric competition seems to be more influential than size-symmetric competition. On these specific sites, maple or pine, as light-demanding species, exhibit rapid juvenile growth, enabling them to overtop beech and subject it to increased shading and size-asymmetric competition. This might relate to the crown size of trees. The size and shape of the beech crown differ depending on whether it grows in a pure stand or in a mixture [36]. In addition, the crown size varies among species at the same dbh; for example, maple usually exhibits a larger crown than beech at the same dbh [82,83].
BAL was also an important predictor in the three-species mixture of beech–spruce and fir. This confirmed the finding of Mina et al. [10] that, in these mixtures, beech diameter growth was subjected to competitive reduction if the larger-sized trees were fir or spruce. For beech, the composition of overtopping competitors was found to be important, suggesting that how species are stratified in a stand is crucial for modulating its growth [84]. We did not study these interactions directly, but with a higher proportion of fir and spruce (SPFI2 and SPFI3), the mean diameter increment of beech was higher, and the contribution of BAL to the explained id variability was greater than in SPFI1, with a proportion of beech of 60%–90%. This signals accentuated competitive reduction or even facilitation on beech growth, which is in accordance with [31]. However, it may also happen due to strongly expressed intraspecific competition in mixtures with a higher beech proportion due to the intense lateral expansion of its crowns [36].
The diameter growth of beech clearly benefited from the admixture of other tree species, as estimated marginal means of id for all mixtures except one were higher than that of pure beech stands. This confirms findings of other studies that beech is a strong self-competitor [28,31,36] and that intraspecific competition often exceeds interspecific competition in beech mixtures [18,29,84].
Another variable indirectly expressing competition was CUT, which quantifies the proportion of harvest and mortality in a ten-year period, which was found to also be an important predictor in other studies, especially for broadleaves, e.g., [29,31]. CUT increased diameter growth and was more important than BA and BAL in several models, indicating a strong effect of management on competition between trees and, consequently, their growth. Harvesting increases growing space of individual trees and, consequently, reallocates growth to selected crop trees [85]. Harvest reduces BA and, for the most retained trees, also BAL, although some dominant trees may not experience the latter. In young and middle-aged stands, the way BA and BAL are reduced depends on the thinning method. In Slovenia, selective thinning, or thinning from above, is predominantly applied [85]. This means that harvesting is mainly oriented to help the dominant crop trees by enlarging their growing space. Timber harvest, however, can also be realized for regeneration purposes in mature and uneven-aged stands or as a salvage harvest after natural disturbances. Harvest intensities in thinning range 5%–50% of stand basal area or stand volume, while in other regular, regeneration, and salvage harvests the range is 5%–100%. With higher intensity of harvesting, competition is progressively reduced, resulting in progressively increasing diameter growth of retained trees. As CUT also embraced tree mortality, it captures a comprehensive effect of regular harvesting and natural disturbances on tree growth and development.

4.2. Other Predictors of Beech Diameter Growth

The most important predictor in the majority of mixtures was tree dbh, which can also be classified as a measure of past competition experienced by the tree [42]. As dbh increased up to 20–25 cm, id increased in all mixtures, but after that threshold, differences between mixtures became apparent. The biological dynamics of diameter growth are best emulated by the curve in which id first increases with increasing dbh, reaches the culmination at a certain dbh, and starts to decline afterward, e.g., [42,75,76]. Such a response was expected to be common across mixtures, but it was identified only in pure beech stands and some mixtures with spruce, spruce and fir, and oak. The id of beech declined the most strongly at large tree sizes when admixed with spruce and fir, expressing an almost parabolic relationship. In two mixtures with fir, the beech growth pattern was unexpected. After an increase and reaching the expected maximum at mid-sized dbh, id temporarily stabilized and then increased again, reaching the maximum values at the largest dbh. This may be related to the fact that these plots exhibited the least homogeneous stand structure among the studied forests, and for heterogeneous fir–beech forests, such a pattern was already identified [58]. In addition, in several mixtures with pine and oak, the dbh-id relation was even linear, which is also in accordance with some other studies, e.g., [46].
All other stand, site, and climate factors contributed much less to the explained variability of id, but in some models, individual variables nevertheless contributed a considerable part of the explained variability. Elevation (ELE) was included in models for 11 mixtures; the greatest influence was found in beech mixtures with spruce, fir, or both. The relationship with id was negative and linear in all models, except in SPR1, where natural splines had one knot expressing a progressively declining relationship. The latter was also observed for basal area growth of beech trees on the country-wide level [39], while many studies confirmed the decrease in diameter growth with increasing elevation, e.g., [86]. Related to changing climate conditions, elevation-specific diameter growth changes were detected for beech, and this pattern may be expected to continue in the future, which may not be the case for spruce and fir [21]. SLP was less important and was included in models for only six mixtures. In all these models, the diameter growth of beech constantly dropped with increasing slope, with the exception being SPR2, which had a slight increase between 15° and 30°. On steep slopes, growing conditions, especially regarding water supply, but also nutrient supply, are harsher, which may negatively affect the diameter growth of trees.
The effect of DDOM was difficult to interpret, as its influence varied substantially among mixtures. In some mixtures, the relationship was parabolic, showing the lowest id at mid-sized DDOM. Most surprising were its influences in SPFI2, SPR3, and MAP3, in which the diameter growth of beech was negatively and linearly related to DDOM. The underlying reasons for this pattern remain unclear. Related to the Gini index, beech exhibited higher diameter growth in less homogeneous stands across all mixtures except one (FIR1). This probably indicates more efficient light and belowground resource use in structurally diverse stands, although this was not tested directly.
Soil variables had the strongest influence in beech mixtures with pine and slightly less in spruce and maple mixtures, all likely indicating the specificity of such sites. Specific soil conditions in sites where beech is admixed with or to pine and maple may confer an advantage to the admixed species. Pine thrives in sandy nutrient-poor soil with low water-holding capacity [81], which is too extreme for vigorous growth of beech. In contrast, maple thrives in nutrient-rich and moist soil [81], which is also proper for beech, but as maple is a light-demanding species, its dominance on such sites is also related to a rapid height growth of trees in early stand stages. Related to soil and belowground relationships between trees, possible distinguishing factors of beech growth in mixtures might also be diverse mycorrhizal relationships in pure beech forests and in various mixtures. Also, allelopathy or exposure to pollution might be important factors influencing individual tree diameter growth as both decrease the vitality of trees of a certain tree species; however, they were not addressed in our study. Site productivity was recognized as a predictor in only six models, and in some of them it appeared to have an unexpected effect on id. Diameter growth increased with increased Sprod, as was expected in pure beech stands and in mixtures with pine and oak (PIN1, PIN3, OAK1, and OAK3), while in mixtures with dominant spruce (SPR3) and spruce and fir (SPFI3), SProd unexpectedly had a negative linear effect. In confirmation of the absence of SProd in several models, Pretzsch and Biber [24] found that productivity did not improve id estimation of beech, while it was an important predictor for other species. A plausible explanation seems to be that higher SProd enhances beech growth but simultaneously increases the growth of competing species, and increased competition reduces beech id. In addition to id growth, SProd also influences stand density [9] and tree height [39], and thus spruce and fir may become more competitive on more productive sites as they reach larger dimensions than beech.
For climate predictor influence, there was no clear pattern across mixtures. Mean spring temperature (Tspr) increased id in four mixtures. At high elevations, beech growth was often recognized as being temperature-driven, whereas at low elevations it was predominantly influenced by summer rainfall and negatively affected by high summer temperatures, e.g., [38,51]. Tspr reduced id in PIN1, probably due to spring drought stress related to low water-holding capacity of soil at these sites. Beech was shown to be highly sensitive to warm and dry periods [29]. With decreasing drought stress, measured by SPEI6Sept_min, id increased as expected in all mixtures where it was included in the model. SPEI6Sept_avg had varying effects across mixtures. If the index was higher, meaning less dry conditions, id increased in four mixtures with pine, spruce, and oak. The opposite occurred in three mixtures where beech mixed with fir or oak and in pure beech stands. This implies that such metrics of drought (in addition to SPEI6Sept_avg, also SPEI6_duration and SPEI6Sept_share) are not the most suitable metrics to be used in forest ecology modeling where different approaches are required than in agriculture. In the average SPEI value, severe drought can be compensated by very wet years, which can obscure the modeling results. Drought metrics emphasizing extremes would probably be more appropriate than mean values [43]. Our results suggested the variable influence of climate and drought on beech diameter growth across mixtures; thus, more research is needed in this area.

4.3. Methodological Aspects and Limitations

The surrogates for size-symmetric and size-asymmetric competition were BA and BAL, indices that were not calculated from crown characteristics and spatially explicit data on individual trees. Indices based on this information were found to be superior to distance-independent indices such as BA and BAL [87] because crown morphology differs among tree species [5], but they were not superior in stable stand structures in unmanaged stands [88]. Data gathered in regular forest management and national forest inventories usually do not enable calculation of crown-characteristics-based indices because insufficient data are collected there [18,62]; thus, spatially non-explicit indices are more easily applicable.
A further limitation of our study is the use of 10-year diameter increment data coupled with explanatory variables measured at the beginning of the inventory period. Although this is a common approach in growth studies based on national forest inventory data, e.g., [43], it is important to recognize potential changes in stand structure between two measurements. In our analysis, these potential changes were considered only through the CUT variable, while all other explanatory variables described conditions at the beginning of the inventory period.
The climate variables included were mainly long-term averages, which did not directly address extreme events during this period that can be crucial for beech growth, e.g., [43]. However, we included the SPEI to detect the influence of severe or long-term droughts, but for the last three years of the observation period, we could not calculate SPEI due to a lack of data. In 2013, a significant drought was observed in Slovenia [89]; therefore, the absence of these data could represent a potential bias in our results.
Another aspect to note is how mixtures were defined. We developed models for pure beech stands and various two- and three-species mixtures of beech with other species. Species composition and species proportions were thus captured through mixture category. Some other studies investigated the effects of mixture on tree growth by including species-specific competition indices (e.g., BA or BAL per species) in the modeling procedure [15,22,26,31]. This approach was also tested in our study, but correlations between species-specific BA and BAL were high; thus, we chose a different approach. In addition, we consider our approach to be more management oriented as field foresters often classify forest stands into categories of species composition.
It is difficult, however, to interpret the effect of mixture on diameter growth without considering the site where each mixture typically occurs [9]. In our study, some results most likely reflected site effects associated with specific mixtures rather than the intrinsic effects of mixture on beech growth. Site was represented by multiple explanatory variables; however, results would likely be more robust if the study was conducted on a single site type where mixtures with all species in different proportions occur.
Data from regular forest management inventories and national forest inventories [62] usually cover large forest areas, and the same was true of our database. In addition, the dataset encompassed a wide range of stand characteristics and wide ecological gradients of all relevant site conditions. These characteristics of our dataset offset the limitations described above.

5. Conclusions

Our study confirmed that modeling diameter growth of individual trees using only explanatory variables gathered in regular forest inventories (or calculated from them) is a useful tool to explore which predictors have the greatest influence and whether size-symmetric or size-asymmetric competition is more important for beech diameter growth in pure forests and two- and three-species mixtures. In general, size-symmetric competition appeared to have a larger influence across all mixtures, but size-asymmetric competition was a crucial competition predictor in some mixtures with pine, maple, and spruce and fir. Both can be influenced by forest management through affecting stand density and competition for belowground resources (by influencing BA) or through altering vertical structure and thus competition for light (by influencing BAL). Beech was confirmed to be a strong self-competitor, and intraspecific competition appears to have a greater impact on its growth than interspecific competition, as it grew much better in mixtures with various species than in pure forests. Niche complementarity between admixed species, competitive reduction, and facilitative effects on beech in mixtures resulted in increased diameter growth. Therefore, we recommend growing beech in mixtures with other species and applying forest management approaches that account for the symmetry of competition, which was found to be crucial in each two-species or three-species mixture.

Supplementary Materials

The following supporting information can be downloaded at: https://www.mdpi.com/article/10.3390/f17020248/s1; Table S1: Dataset example of trees on one permanent sample plot; only explanatory variables that were included in the modeling procedure are shown. Table S2: Mean values (Mean) and standard deviations (SD) for selected variables within the beech mixtures (with oak, maple, pine, spruce, fir, and spruce and fir with varying proportions) and in pure beech stands. A higher number in the mixture name indicates a higher proportion of admixed tree species. The two highest and two lowest mean values for each variable are highlighted in gray and orange, respectively. Table S3: Model for beech diameter increment across all mixtures (n = 193,314). Coefficients, standard errors (Std_Error), and significance levels are shown for all tree-, competition-, stand-, site-, and climate-related predictors. R2 * denotes the relative decrease in R2 when a predictor is omitted and the model is refitted. R2 * (group) gives the summed relative decrease in R2 for each predictor group. Table S4: Models for beech diameter increment in mixtures with oak (OAK) and maple (MAP) and in pure beech stands (BEE); coefficients and significance levels are shown for all predictors; for each predictor with two or more knots in natural splines, coefficients are given for separate sections. Table S5: Model for beech diameter increment in mixtures with pine (PIN) and spruce (SPR); coefficients and significance levels are shown for all predictors; for each predictor with two or more knots in natural splines, coefficients are given for separate sections. Table S6: Models for beech diameter increment in mixtures with fir (FIR) and spruce & fir (SPFI); coefficients and significance levels are shown for all predictors; for each predictor with two or more knots in natural splines, coefficients are given for separate sections.

Author Contributions

Conceptualization, Ž.B. and M.K.; methodology, Ž.B., V.T., Z.Ž. and M.K.; data curation and formal analysis, Ž.B., Z.Ž. and V.T.; visualization, Ž.B.; writing—original draft preparation, Ž.B.; writing—review and editing, M.K., V.T. and Z.Ž. All authors have read and agreed to the published version of the manuscript.

Funding

This research was carried out within the framework of the research core funding P4-0059 “Forest, Forestry and Renewable Forest Resources” and the project “Infrastructure Center Research Forest of the Department of Forestry and Renewable Forest Resources at the Biotechnical Faculty” (part of the MRIC UL) (contract I0-0022-0481-0481-08), funded by the Slovenian Research and Innovation Agency (ARIS) and the projects V4-2422 “Analysis and proposal for further development of the forest inventory system of the public forestry service”, V4-2014 “The Development of Forest Models for Slovenia”, and V4-2211 “Managing Forest Management Risks from Climate Change”, funded by the Slovenian Research and Innovation Agency (ARIS) and Ministry of Agriculture, Forestry and Food of the Republic of Slovenia. The first author, Ž.B., received funding from the Pahernik Foundation.

Data Availability Statement

The datasets presented in this article are not readily available because they were gathered and are owned by the Slovenia Forest Service. Requests to access the datasets should be directed to the corresponding author or directly to the Slovenia Forest Service (zgs.tajnistvo@zgs.si).

Acknowledgments

We thank the Slovenia Forest Service for providing measurement data from the permanent sample plots and Jan Nagel for proofreading and editing the manuscript.

Conflicts of Interest

The authors declare no conflicts of interest.

Abbreviations

The following abbreviations are used in this manuscript:
ASPAspect
baBasal area
balOvertopping basal area
BeechTBeech forest type
CUTRelative basal area of harvested and naturally dead trees
dbhMultidisciplinary Digital Publishing Institute
DDOMDominant stand diameter
ELEElevation
GINIGini coefficient
idDiameter increment
QMDQuadratic mean diameter
SoilTSoil type
SPEIStandardized Precipitation Evapotranspiration Index
SProdSite productivity
TsprAverage temperature of the spring months

References

  1. Pettenella, D.; Rametsteiner, E.; Requardt, A.; Corona, P.; Bastrup-Birk, A.; Koehl, M. State of Forests 2011 Europe’s Status & Trends in Sustainable Forest Management in Europe; FOREST EUROPE Liaison Unit Oslo: Oslo, Norway; United Nations Economic Commission for Europe (UNECE): Geneva, Switzerland; Food and Agriculture Organization of the United Nations (FAO): Rome, Italy, 2011; p. 344. [Google Scholar]
  2. Knoke, T.; Seifert, T. Integrating Selected Ecological Effects of Mixed European Beech-Norway Spruce Stands in Bioeconomic Modelling. Ecol. Modell. 2008, 210, 487–498. [Google Scholar] [CrossRef] [Scilit]
  3. Gamfeldt, L.; Snäll, T.; Bagchi, R.; Jonsson, M.; Gustafsson, L.; Kjellander, P.; Ruiz-Jaen, M.C.; Fröberg, M.; Stendahl, J.; Philipson, C.D.; et al. Higher Levels of Multiple Ecosystem Services Are Found in Forests with More Tree Species. Nat. Commun. 2013, 4, 1340. [Google Scholar] [CrossRef] [Scilit] [PubMed]
  4. Pretzsch, H.; Biber, P. Tree Species Mixing Can Increase Maximum Stand Density. Can. J. For. Res. 2016, 46, 1179–1193. [Google Scholar] [CrossRef] [Scilit]
  5. Pretzsch, H.; Dieler, J. Evidence of Variant Intra- and Interspecific Scaling of Tree Crown Structure and Relevance for Allometric Theory. Oecologia 2012, 169, 637–649. [Google Scholar] [CrossRef] [Scilit]
  6. Thom, D.; Seidl, R. Natural Disturbance Impacts on Ecosystem Services and Biodiversity in Temperate and Boreal Forests. Biol. Rev. Camb. Philos. Soc. 2016, 91, 760–781. [Google Scholar] [CrossRef] [Scilit]
  7. Cerioni, M.; Klopčič, M.; Roženbergar, D.; Nagel, T.A. Multiple Dimensions of Forest Resilience to Compound Disturbances in a Mixed Sub-Montane Forest Landscape. For. Ecol. Manag. 2025, 577. [Google Scholar] [CrossRef] [Scilit]
  8. Vilà, M.; Carrillo-Gavilán, A.; Vayreda, J.; Bugmann, H.; Fridman, J.; Grodzki, W.; Haase, J.; Kunstler, G.; Schelhaas, M.J.; Trasobares, A. Disentangling Biodiversity and Climatic Determinants of Wood Production. PLoS ONE 2013, 8, e53530. [Google Scholar] [CrossRef] [Scilit]
  9. Forrester, D.I. The Spatial and Temporal Dynamics of Species Interactions in Mixed-Species Forests: From Pattern to Process. For. Ecol. Manag. 2014, 312, 282–292. [Google Scholar] [CrossRef] [Scilit]
  10. Mina, M.; Huber, M.O.; Forrester, D.I.; Thürig, E.; Rohner, B. Multiple Factors Modulate Tree Growth Complementarity in Central European Mixed Forests. J. Ecol. 2018, 106, 1106–1119. [Google Scholar] [CrossRef] [Scilit]
  11. Vandermeer, J. The Ecology of Intercropping; JSTOR: New York, NY, USA, 1992. [Google Scholar] [CrossRef] [Scilit]
  12. Forrester, D.I.; Smith, R.G.B. Faster Growth of Eucalyptus grandis and Eucalyptus pilularis in Mixed-Species Stands than Monocultures. For. Ecol. Manag. 2012, 286, 81–86. [Google Scholar] [CrossRef] [Scilit]
  13. Binkley, D. Seven Decades of Stand Development in Mixed and Pure Stands of Conifers and Nitrogen-Fixing Red Alder. Can. J. For. Res. 2003, 33, 2274–2279. [Google Scholar] [CrossRef] [Scilit]
  14. Zapater, M.; Hossann, C.; Bréda, N.; Bréchet, C.; Bonal, D.; Granier, A. Evidence of Hydraulic Lift in a Young Beech and Oak Mixed Forest Using 18O Soil Water Labelling. Trees Struct. Funct. 2011, 25, 885–894. [Google Scholar] [CrossRef] [Scilit]
  15. Riofrío, J.; Del Río, M.; Bravo, F. Mixing Effects on Growth Efficiency in Mixed Pine Forests. Forestry 2017, 90, 381–392. [Google Scholar] [CrossRef] [Scilit]
  16. Morin, X.; Fahse, L.; Scherer-Lorenzen, M.; Bugmann, H. Tree Species Richness Promotes Productivity in Temperate Forests through Strong Complementarity between Species. Ecol. Lett. 2011, 14, 1211–1219. [Google Scholar] [CrossRef] [Scilit]
  17. Bravo-Oviedo, A.; Del Rio, M.; Calama, R.; Valentine, H.T. New Approaches to Modelling Cross-Sectional Area to Height Allometry in Four Mediterranean Pine Species. Forestry 2014, 87, 399–406. [Google Scholar] [CrossRef] [Scilit]
  18. del Río, M.; Schütze, G.; Pretzsch, H. Temporal Variation of Competition and Facilitation in Mixed Species Forests in Central Europe. Plant Biol. 2014, 16, 166–176. [Google Scholar] [CrossRef] [Scilit]
  19. Condés, S.; Pretzsch, H.; del Río, M. Species Admixture Can Increase Potential Tree Growth and Reduce Competition. For. Ecol. Manag. 2023, 539, 120997. [Google Scholar] [CrossRef] [Scilit]
  20. del Río, M.; Pretzsch, H.; Alberdi, I.; Bielak, K.; Bravo, F.; Brunner, A.; Condés, S.; Ducey, M.J.; Fonseca, T.; von Lüpke, N.; et al. Characterization of the Structure, Dynamics, and Productivity of Mixed-Species Stands: Review and Perspectives. Eur. J. For. Res. 2016, 135, 23–49. [Google Scholar] [CrossRef] [Scilit]
  21. Pretzsch, H.; Grams, T.; Häberle, K.H.; Pritsch, K.; Bauerle, T.; Rötzer, T. Growth and Mortality of Norway Spruce and European Beech in Monospecific and Mixed-Species Stands under Natural Episodic and Experimentally Extended Drought. Results of the KROOF Throughfall Exclusion Experiment. Trees Struct. Funct. 2020, 34, 957–970. [Google Scholar] [CrossRef] [Scilit]
  22. Rodríguez de Prado, D.; Riofrío, J.; Aldea, J.; Bravo, F.; Herrero de Aza, C. Competition and Climate Influence in the Basal Area Increment Models for Mediterranean Mixed Forests. For. Ecol. Manag. 2022, 506. [Google Scholar] [CrossRef] [Scilit]
  23. Hara, T. Mode of Competition and Size-Structure Dynamics in Plant Communities. Plant Species Biol. 1993, 8, 75–84. [Google Scholar] [CrossRef] [Scilit]
  24. Pretzsch, H.; Biber, P. Size-Symmetric versus Size-Asymmetric Competition and Growth Partitioning among Trees in Forest Stands along an Ecological Gradient in Central Europe. Can. J. For. Res. 2010, 40, 370–384. [Google Scholar] [CrossRef] [Scilit]
  25. Schwinning, S.; Weiner, J. Mechanisms Determining the Degree of Size Asymmetry in Competition among Plants. Oecologia 1998, 113, 447–455. [Google Scholar] [CrossRef] [Scilit] [PubMed]
  26. Cattaneo, N.; Bravo-Oviedo, A.; Bravo, F. Analysis of Tree Interactions in a Mixed Mediterranean Pine Stand Using Competition Indices. Eur. J. For. Res. 2018, 137, 109–120. [Google Scholar] [CrossRef] [Scilit]
  27. Condés, S.; Del Rio, M.; Sterba, H. Mixing Effect on Volume Growth of Fagus sylvatica and Pinus sylvestris Is Modulated by Stand Density. For. Ecol. Manag. 2013, 292, 86–95. [Google Scholar] [CrossRef] [Scilit]
  28. Bosela, M.; Tobin, B.; Šebeň, V.; Petráš, R.; Larocque, G. Different Mixtures of Norway spruce, Silver fir, and European beech Modify Competitive Interactions in Central European Mature Mixed Forests. Can. J. For. Res. 2015, 45, 1577–1586. [Google Scholar] [CrossRef] [Scilit]
  29. Vospernik, S. Basal Area Increment Models Accounting for Climate and Mixture for Austrian Tree Species. For. Ecol. Manag. 2021, 480, 118725. [Google Scholar] [CrossRef] [Scilit]
  30. Pukkala, T.; Lähde, E.; Laiho, O. Growth and Yield Models for Uneven-Sized Forest Stands in Finland. For. Ecol. Manag. 2009, 258, 207–216. [Google Scholar] [CrossRef] [Scilit]
  31. Mina, M.; del Río, M.; Huber, M.O.; Thürig, E.; Rohner, B. The Symmetry of Competitive Interactions in Mixed Norway Spruce, Silver Fir and European Beech Forests. J. Veg. Sci. 2018, 29, 775–787. [Google Scholar] [CrossRef] [Scilit]
  32. Brus, D.J.; Hengeveld, G.M.; Walvoort, D.J.J.; Goedhart, P.W.; Heidema, A.H.; Nabuurs, G.J.; Gunia, K. Statistical Mapping of Tree Species over Europe. Eur. J. For. Res. 2012, 131, 145–157. [Google Scholar] [CrossRef] [Scilit]
  33. Ellenberg, H.; Leuschner, C. Vegetation Mitteleuropas Mit Den Alpen in Ökologischer, Dynamischer Und Historischer Sicht; Eugen Ulmer Stuttgart: Stuttgart, Germany, 2010. [Google Scholar]
  34. Dyderski, M.K.; Paź, S.; Frelich, L.E.; Jagodziński, A.M. How Much Does Climate Change Threaten European Forest Tree Species Distributions? Glob. Change Biol. 2018, 24, 1150–1163. [Google Scholar] [CrossRef] [Scilit]
  35. González de Andrés, E.; Seely, B.; Blanco, J.A.; Imbert, J.B.; Lo, Y.H.; Castillo, F.J. Increased Complementarity in Water-Limited Environments in Scots Pine and European Beech Mixtures under Climate Change. Ecohydrology 2016, 10, e1810. [Google Scholar] [CrossRef] [Scilit]
  36. Pretzsch, H. Canopy Space Filling and Tree Crown Morphology in Mixed-Species Stands Compared with Monocultures. For. Ecol. Manag. 2014, 327, 251–264. [Google Scholar] [CrossRef] [Scilit]
  37. Thurm, E.A.; Biber, P.; Pretzsch, H. Stem Growth is Favored at Expenses of Root Growth in Mixed Stands and Humid Conditions for Douglas-Fir (Pseudotsuga menziesii) and European Beech (Fagus sylvatica). Trees Struct. Funct. 2017, 31, 349–365. [Google Scholar] [CrossRef] [Scilit]
  38. Manso, R.; Morneau, F.; Ningre, F.; Fortin, M. Effect of Climate and Intra-and Inter-Specific Competition on Diameter Increment in Beech and Oak Stands. Forestry 2014, 88, 540–551. [Google Scholar] [CrossRef] [Scilit]
  39. Bončina, A.; Trifković, V.; Klopčič, M.; Bončina, Ž. Growth of European Beech across Altitudinal and Climatic Gradients: Experiences from Slovenia. Agric. For. Meteorol. 2025, 374. [Google Scholar] [CrossRef] [Scilit]
  40. Wykoff, W.R.; Crookston, N.L.; Stage, A.R. User’s Guide to the Stand Prognosis Model; U.S. Department of Agriculture, Forest Service, Intermountain Forest and Range Experiment Station: Ogden, UT, USA, 1982. [Google Scholar]
  41. Bosela, M.; Lukac, M.; Castagneri, D.; Sedmák, R.; Biber, P.; Carrer, M.; Konôpka, B.; Nola, P.; Nagel, T.A.; Popa, I.; et al. Contrasting Effects of Environmental Change on the Radial Growth of Co-Occurring Beech and Fir Trees across Europe. Sci. Total Environ. 2018, 615, 1460–1469. [Google Scholar] [CrossRef] [Scilit]
  42. Ciceu, A.; Pitar, D.; Badea, O. Modeling the Diameter Distribution of Mixed Uneven-Aged Stands in the South Western Carpathians in Romania. Forests 2021, 12, 958. [Google Scholar] [CrossRef] [Scilit]
  43. Trifković, V.; Bončina, A.; Ficko, A. Analyzing Asymmetries in the Response of European Beech to Precipitation Anomalies in Various Stand and Site Conditions Using Decadal Diameter Censuses. Agric. For. Meteorol. 2022, 327, 109195. [Google Scholar] [CrossRef] [Scilit]
  44. Forrester, D.I. Linking Forest Growth with Stand Structure: Tree Size Inequality, Tree Growth or Resource Partitioning and the Asymmetry of Competition. For. Ecol. Manag. 2019, 447, 139–157. [Google Scholar] [CrossRef] [Scilit]
  45. Duduman, G. A Forest Management Planning Tool to Create Highly Diverse Uneven-Aged Stands. Forestry 2011, 84, 301–314. [Google Scholar] [CrossRef] [Scilit]
  46. Pretzsch, H.; Hilmers, T.; Uhl, E.; Bielak, K.; Bosela, M.; del Rio, M.; Dobor, L.; Forrester, D.I.; Nagel, T.A.; Pach, M.; et al. European Beech Stem Diameter Grows Better in Mixed than in Mono-Specific Stands at the Edge of Its Distribution in Mountain Forests. Eur. J. For. Res. 2021, 140, 127–145. [Google Scholar] [CrossRef] [Scilit]
  47. Bosela, M.; Štefančík, I.; Petráš, R.; Vacek, S. The Effects of Climate Warming on the Growth of European Beech Forests Depend Critically on Thinning Strategy and Site Productivity. Agric. For. Meteorol. 2016, 222, 21–31. [Google Scholar] [CrossRef] [Scilit]
  48. Zimmermann, J.; Hauck, M.; Dulamsuren, C.; Leuschner, C. Climate Warming-Related Growth Decline Affects Fagus sylvatica, But Not Other Broad-Leaved Tree Species in Central European Mixed Forests. Ecosystems 2015, 18, 560–572. [Google Scholar] [CrossRef] [Scilit]
  49. Martinez del Castillo, E.; Zang, C.S.; Buras, A.; Hacket-Pain, A.; Esper, J.; Serrano-Notivoli, R.; Hartl, C.; Weigel, R.; Klesse, S.; Resco de Dios, V.; et al. Climate-Change-Driven Growth Decline of European Beech Forests. Commun. Biol. 2022, 5, 163. [Google Scholar] [CrossRef] [Scilit]
  50. Jump, A.S.; Hunt, J.M.; Peñuelas, J. Rapid Climate Change-Related Growth Decline at the Southern Range Edge of Fagus sylvatica. Glob. Change Biol. 2006, 12, 2163–2174. [Google Scholar] [CrossRef] [Scilit]
  51. Di Filippo, A.; Biondi, F.; Čufar, K.; De Luis, M.; Grabner, M.; Maugeri, M.; Presutti Saba, E.; Schirone, B.; Piovesan, G. Bioclimatology of Beech (Fagus sylvatica L.) in the Eastern Alps: Spatial and Altitudinal Climatic Signals Identified through a Tree-Ring Network. J. Biogeogr. 2007, 34, 1873–1892. [Google Scholar] [CrossRef] [Scilit]
  52. Bugmann, H.; Cordonnier, T.; Truhetz, H.; Lexer, M.J. Impacts of Business-as-Usual Management on Ecosystem Services in European Mountain Ranges under Climate Change. Reg. Environ. Change 2017, 17, 3–16. [Google Scholar] [CrossRef] [Scilit]
  53. Bončina, A.; Rozman, A.; Dakskobler, I.; Klopčič, M.; Babij, V.; Poljanec, A. Forest Growth Types of Slovenia: Vegetation, Stand, and Management Characteristics; Department of Forestry and Renewable Forest Resources, Biotechnical Faculty and Slovenia Forest Service: Ljubljana, Slovenia, 2021; 575p, (In Slovene). Available online: https://plus.cobiss.net/cobiss/si/sl/data/cobib/40167427/sikskl (accessed on 12 May 2023).
  54. Ministry of Agriculture, Forestry and Food. Pedological Map. Ministry of Agriculture, Forestry and Food. Ljubljana. [Database]. 2021. Available online: https://podatki.gov.si/dataset/pedoloska-karta (accessed on 15 September 2024).
  55. Slovenia Forest Service. 2014. Forestry Dataset. Slovenia Forest Service. Ljubljana. [Database]. Available online: https://www.zgs.si/ (accessed on 7 April 2018).
  56. Poljanec, A.; Ficko, A.; Boncina, A. Spatiotemporal Dynamic of European Beech (Fagus sylvatica L.) in Slovenia, 1970–2005. For. Ecol. Manag. 2010, 259, 2183–2190. [Google Scholar] [CrossRef] [Scilit]
  57. Poljanec, A. Manual for Inventory of Permanent Sample Plots; Slovenia Forest Service: Ljubljana, Slovenia, 2010; 27p. (In Slovene) [Google Scholar]
  58. Klopcic, M.; Boncina, A. Stand Dynamics of Silver Fir (Abies alba Mill.)-European Beech (Fagus sylvatica L.) Forests during the Past Century: A Decline of Silver Fir? Forestry 2011, 84, 259–271. [Google Scholar] [CrossRef] [Scilit]
  59. Dănescu, A.; Albrecht, A.T.; Bauhus, J. Structural Diversity Promotes Productivity of Mixed, Uneven-Aged Forests in Southwestern Germany. Oecologia 2016, 182, 319–333. [Google Scholar] [CrossRef] [Scilit] [PubMed]
  60. Mivule, K. Utilizing Noise Addition for Data Privacy, an overview. arXiv 2013, arXiv:1309.3958. [Google Scholar] [CrossRef] [Scilit]
  61. Zar, J.H. Biostatistical Analysis; Prentice-Hall/Pearson: Upper Saddle River, NJ, USA, 2010; 931p. [Google Scholar]
  62. Tomppo, E.; Gschwantner, T.; Lawrence, M.; Mcroberts, R.E. National Forest Inventories Pathways for Common Reporting; Springer: Berlin/Heidelberg, Germany, 2010; 613p. [Google Scholar] [CrossRef] [Scilit]
  63. Slovenian Environmental Agency (ARSO) Ministry of Natural Resources and Spatial Planning, Slovenian Environment Agency (ARSO). Climate Change: Observations 1981–2010, Daily Data, Resolution 0,125°. [Database]. 2024. Available online: https://podatki.gov.si/dataset/arsopodnebne-spremembe-meritve-1981-2010-dnevni-podatki-locljivost-0-125 (accessed on 14 January 2026).
  64. Skrk, N.; Serrano-Notivoli, R.; Cufar, K.; Merela, M.; Crepinsek, Z.; Kajfez Bogataj, L.; De Luis, M. SLOCLIM: A High-Resolution Daily Gridded Precipitation and Temperature Dataset for Slovenia. Earth Syst. Sci. Data 2021, 13, 3577–3592. [Google Scholar] [CrossRef] [Scilit]
  65. Beguería, S.; Vicente-Serrano, S.M. SPEI: Calculation of the Standardized Precipitation-Evapotranspiration Index, Version 1.8.1; [R package]. 2023. Available online: https://cran.r-project.org/web/packages/SPEI/index.html (accessed on 17 May 2024).
  66. R Core Team. R A Language and Environment for Statistical Computing. R Foundation for Statistical Computing, Vienna.—References—Scientific Research Publishing. 2021. Available online: https://www.scirp.org/reference/referencespapers?referenceid=3131254 (accessed on 9 January 2026).
  67. Bates, D.; Mächler, M.; Bolker, B.M.; Walker, S.C. Fitting Linear Mixed-Effects Models Using Lme4. J. Stat. Softw. 2015, 67, 1–48. [Google Scholar] [CrossRef] [Scilit]
  68. Liljequist, D.; Elfving, B.; Roaldsen, K.S. Intraclass Correlation—A Discussion and Demonstration of Basic Features. PLoS ONE 2019, 14, e0219854. [Google Scholar] [CrossRef] [Scilit]
  69. Perperoglou, A.; Sauerbrei, W.; Abrahamowicz, M.; Schmid, M. A Review of Spline Function Procedures in R. BMC Med. Res. Methodol. 2019, 19, 46. [Google Scholar] [CrossRef] [Scilit]
  70. Myung, I.J. Tutorial on Maximum Likelihood Estimation. J. Math. Psychol. 2003, 47, 90–100. [Google Scholar] [CrossRef] [Scilit]
  71. Venables, W.N.; Ripley, B.D. Modern Applied Statistics with S, 4th ed.; Springer: New York, NY, USA, 2002; ISBN 0-387-95457-0. Available online: https://www.stats.ox.ac.uk/pub/MASS4/ (accessed on 14 January 2026).
  72. Fox, J.; Weisberg, S. An R Companion to Applied Regression, 3rd ed.; Sage: Thousand Oaks, CA, USA, 2019; Available online: https://www.john-fox.ca/Companion/ (accessed on 9 June 2020).
  73. Kuhn, M. Building Predictive Models in R Using the caret Package. J. Stat. Softw. 2008, 28, 1–26. [Google Scholar] [CrossRef] [Scilit]
  74. Trasobares, A.; Zingg, A.; Walthert, L.; Bigler, C. A Climate-Sensitive Empirical Growth and Yield Model for Forest Management Planning of Even-Aged Beech Stands. Eur. J. For. Res. 2016, 135, 263–282. [Google Scholar] [CrossRef] [Scilit]
  75. Bončina, A.; Trifković, V.; Ficko, A.; Klopčič, M. Diameter Growth of European Beech on Carbonate: A Regional versus Forest Type Perspective. Eur. J. For. Res. 2023, 142, 917–932. [Google Scholar] [CrossRef] [Scilit]
  76. Sharma, R.P.; Štefančík, I.; Vacek, Z.; Vacek, S. Generalized Nonlinear Mixed-Effects Individual Tree Diameter Increment Models for Beech Forests in Slovakia. Forests 2019, 10, 451. [Google Scholar] [CrossRef] [Scilit]
  77. Pretzsch, H. Forest Dynamics, Growth and Yield: From Measurement to Model; Springer: Berlin/Heidelberg, Germany, 2010; ISBN 9783540883067. [Google Scholar]
  78. Rewald, B.; Leuschner, C. Belowground Competition in a Broad-Leaved Temperate Mixed Forest: Pattern Analysis and Experiments in a Four-Species Stand. Eur. J. For. Res. 2009, 128, 387–398. [Google Scholar] [CrossRef] [Scilit]
  79. Magh, R.K.; Grün, M.; Knothe, V.E.; Stubenazy, T.; Tejedor, J.; Dannenmann, M.; Rennenberg, H. Silver-Fir (Abies alba MILL.) Neighbors Improve Water Relations of European Beech (Fagus sylvatica L.), but Do Not Affect N Nutrition. Trees 2018, 32, 337–348. [Google Scholar] [CrossRef] [Scilit]
  80. Bolte, A.; Kampf, F.; Hilbrig, L. Space Sequestration below Ground in Old-Growth Spruce-Beech Forests—Signs for Facilitation? Front. Plant Sci. 2013, 4, 322. [Google Scholar] [CrossRef] [Scilit]
  81. Bončina, A.; Trifković, V.; Ficko, A. Diameter Growth of Silver Fir (Abies alba Mill.), Scots Pine (Pinus sylvestris L.), and Black Pine (Pinus nigra Arnold) in Central European Forests: Findings from Slovenia. Forests 2023, 14, 793. [Google Scholar] [CrossRef] [Scilit]
  82. Hemery, G.E.; Savill, P.S.; Pryor, S.N. Applications of the Crown Diameter-Stem Diameter Relationship for Different Species of Broadleaved Trees. For. Ecol. Manag. 2005, 215, 285–294. [Google Scholar] [CrossRef] [Scilit]
  83. Pretzsch, H.; Schütze, C. Crown Allometry and Growing Space Efficiency of Norway Spruce (Picea Abies [L.] Karst.) and European Beech (Fagus sylvatica L.) in Pure and Mixed Stands. Plant Biol. 2005, 7, 628–639. [Google Scholar] [CrossRef] [Scilit]
  84. Pretzsch, H.; Block, J.; Dieler, J.; Dong, P.H.; Kohnle, U.; Nagel, J.; Spellmann, H.; Zingg, A. Comparison between the Productivity of Pure and Mixed Stands of Norway Spruce and European Beech along an Ecological Gradient. Ann. For. Sci. 2010, 67, 712. [Google Scholar] [CrossRef] [Scilit]
  85. Boncina, A.; Kadunc, A.; Robic, D. Effects of Selective Thinning on Growth and Development of Beech (Fagus sylvatica L.) Forest Stands in South-Eastern Slovenia. Ann. For. Sci. 2007, 64, 47–57. [Google Scholar] [CrossRef] [Scilit]
  86. Fuchs, Z.; Vacek, Z.; Vacek, S.; Černý, J.; Cukor, J.; Šimůnek, V.; Gallo, J.; Hájek, V. Growth Responses of European Beech (Fagus sylvatica L.) and Oriental Beech (Fagus Orientalis Lipsky) Along an Elevation Gradient Under Global Climate Change. Forests 2025, 16, 655. [Google Scholar] [CrossRef] [Scilit]
  87. Bravo, F.; Hann, D.W.; Maguire, D.A. Impact of Competitor Species Composition on Predicting Diameter Growth and Survival Rates of Douglas-Fir Trees in Southwestern Oregon. Can. J. For. Res. 2001, 31, 2237–2247. [Google Scholar] [CrossRef]
  88. Weiskittel, A.R.; Kenefic, L.S.; Li, R.; Brissette, J. Stand Structure and Composition 32 Years after Precommercial Thinning Treatments in a Mixed Northern Conifer Stand in Central Maine. North. J. Appl. For. 2011, 28, 92–96. [Google Scholar] [CrossRef] [Scilit]
  89. Pogačar, T.; Žnidaršič, Z.; Vlahović, Ž.; Črepinšek, Z.; Sušnik, A. Grassland Model Based Evaluation of Drought Indices: A Case Study from the Slovenian Alpine Region. Agronomy 2022, 12, 936. [Google Scholar] [CrossRef] [Scilit]
Figure 1. Location of the analyzed permanent sample plots with beech (black dots; n = 26,793) in the forests of Slovenia.
Forests 17 00248 g001
Figure 2. Estimated marginal means of 10-year diameter increment (id) by forest mixtures; the horizontal line represents the estimated marginal mean, boxes represent the mean ± standard error, and the lines represent the 95% confidence interval; mixtures are defined in Table 1.
Forests 17 00248 g002
Figure 3. Effect of the most influential predictors, dbh, BAL, BA, and CUT, on the diameter increment of beech in mixtures and pure beech stands when all other predictors were held constant at their mean values (see Table 2). ASP was fixed at the reference level of 0 (cold), SoilT at the reference level of eutric and chromic cambisols, and BeechT at the reference level of acidophilus.
Forests 17 00248 g003
Figure 4. Effect of predictors on diameter increment of beech in mixtures with oak, maple, and spruce and fir (OAK, MAP, and SPFI) and pure beech stands (BEE) when all other predictors were held constant at their mean values (see Table 2); ASP was fixed at the reference level of 0 (cold), SoilT at the reference level of eutric and chromic cambisols, and BeechT at the reference level of acidophilus.
Forests 17 00248 g004
Figure 5. Effect of predictors on diameter increment of beech in mixtures with pine, spruce, and fir (PIN, SPR, FIR) and pure beech stands (BEE) when all other predictors were held constant at their mean values (see Table 2); ASP was fixed at the reference level of 0 (cold), SoilT at the reference level of eutric and chromic cambisols, and BeechT at the reference level of acidophilus.
Forests 17 00248 g005
Table 1. Definition of beech mixtures analyzed and tree species’ proportions, sample sizes (N trees and N plots), and mean values of basic tree, stand, site, and climate characteristics for all mixtures (dbh—mean diameter of beech trees used for modeling, BA—stand basal area, DDOM—mean diameter of the 100 thickest trees on a plot (i.e., dominant stand diameter), QMD—quadratic mean stand diameter, SProd—site productivity (for details see explanation in Table 2), ELE—elevation, and Tspr—mean spring temperature in the period March–May).
MixtureBeech ShareAdmixed
Species
N TreesN Plotsdbh (cm)BA (m2 ha−1)DDOM (cm)QMD (cm)SProdELE (m a.s.l.)Tspr (°C)
OAK160%–90%oak
(Quercus petraea,
Q. robur)
927583527.13238.425.72.0114378.5
OAK230%–60%273637424.833.338.725.51.9654368.5
OAK3<30%71924622.732.538.526.51.9684638.6
MAP160%–90%maple
(Acer pseudoplatanus,
A. platanoides)
975096728.330.938.026.41.9948097.1
MAP230%–60%84914927.527.836.225.72.0447837.2
MAP3<30%702620.926.734.223.62.0037118.0
PIN160%–90%pine
(Pinus sylvestris,
P. nigra)
123111924.82936.724.31.9083928.9
PIN230%–60%495470123.931.537.524.91.7973699.7
PIN3<30%3672133819.533.335.023.71.7913839.3
SPR160%–90%spruce
(Picea abies)
12,924118726.632.338.325.61.9367616.9
SPR230%–60%688898826.334.240.727.21.9447707.3
SPR3<30%4739176823.037.541.928.61.9428077.5
FIR160%–90%fir
(Abies alba)
622866530.432.142.329.11.9849346.8
FIR230%–60%290050430.432.445.131.01.9678816.9
FIR3<30%129448425.934.547.432.01.9968266.9
SPFI160%–90%spruce & fir
(Picea abies,
Abies alba)
39573472835.540.726.71.9729796.7
SPFI230%–60%6909827.435.843.028.21.9938957.0
SPFI3<30%44214222.737.343.028.51.9828607.1
BEE>90%-58,587465028.431.838.126.81.9787277.3
Table 3. Performance of the models across different mixtures and in pure beech stands; R2 is the coefficient of determination, RMSE is the root mean square error, and MAE is the mean absolute error.
MixtureR2 (%)RMSE (cm) MAE (cm)
OAK128.50.6190.481
OAK224.40.6320.494
OAK326.40.6240.492
MAP131.20.5570.430
MAP233.80.5770.457
MAP367.90.4940.409
PIN129.10.5990.478
PIN219.50.6460.519
PIN321.60.6340.498
SPR131.10.5750.446
SPR231.20.5950.460
SPR325.30.6060.469
FIR133.00.5140.396
FIR232.50.5050.390
FIR329.80.5500.430
SPFI 129.70.5370.415
SPFI 230.80.5400.422
SPFI329.90.5540.427
BEE29.30.5660.438
Table 4. The relative contribution of predictors in the models of beech diameter increment in mixtures and pure beech stands; the relative contribution is expressed as the relative decrease in R2 (%) when the predictor was omitted from the model and the model was refitted; at the bottom, the summed relative contribution to the explained variability by groups of variables is shown.
MixtureOAK1OAK2OAK3MAP1MAP2MAP3PIN1PIN2PIN3SPR1SPR2SPR3FIR1FIR2FIR3SPFI1SPFI2SPFI3BEE
dbh51.631.545.145.141.5 16.067.2 37.746.924.849.152.241.839.848.835.241.3
BAL6.98.7 6.71.474.643.9 65.04.913.11.74.71.7 10.04.75.16.0
BA14.017.637.218.523.1 10.6 28.07.89.323.216.036.114.23.32.521.4
CUT11.321.68.214.56.4 24.96.3 17.811.427.14.911.810.84.48.420.113.4
DDOM 2.43.5 7.3 12.51.2 10.61.39.47.8
GINI2.2 5.3 0.6 0.70.61.1 2.3 1.4
Sprod0.3 3.1 3.6 12.7 2.0 4.00.3
ASP 5.5 0.4 8.2 0.91.20.7 2.30.2
ELE 0.5 2.7 1.32.217.411.56.32.811.015.69.3
SLP1.4 2.5 4.82.02.86.8 0.5
DSoil0.7 0.80.7 1.3 1.8
DSoil_A0.82.8 0.6 0.30.81.1 0.6 0.2
Orgs 0.4 4.62.19.8 1.21.1 0.5 2.8
Orgs_A1.8 1.13.0 1.3
SoilT1.42.64.10.53.0 2.26.0 1.33.61.12.9 1.71.2 0.4
BeechT2.04.2 8.25.79.9 1.92.61.4 4.54.73.1 1.9
Tspr 1.1 2.2 1.9 2.55.90.5
SPEI6Sept_min3.8 2.2 0.4 2.82.0 2.6
SPEI6Sept_avg0.52.4 7.7 0.51.03.40.8 0.9 1.7
SPEI6_duration 6.7 0.51.90.80.6 1.0 1.60.2
SPEI6Sept_share1.23.1 5.9 3.12.73.2 0.2
Tree effects51.631.545.145.141.5016.067.2037.746.924.849.152.241.839.848.835.241.3
Competition effects32.247.945.439.730.974.668.816.965.050.732.338.132.829.546.928.616.427.740.8
Stand effect2.202.43.55.37.30012.51.8000.70.61.110.63.69.49.2
Site effect8.415.17.210.68.718.113.18.122.55.415.227.813.315.89.320.228.620.23.5
Climate effects5.55.501.114.802.27.704.55.69.34.22.00.91.02.57.55.2
Disclaimer/Publisher’s Note: The statements, opinions and data contained in all publications are solely those of the individual author(s) and contributor(s) and not of MDPI and/or the editor(s). MDPI and/or the editor(s) disclaim responsibility for any injury to people or property resulting from any ideas, methods, instructions or products referred to in the content.