


Abstract
Accurately quantifying the ecological functions of small and micro green spaces in high density urban environments supports urban ecological planning and management. This study assessed 271 pocket parks in the main urban area of Fuzhou, China, using multi-source remote sensing data from the growing seasons of 2019 to 2024. Six indicators were derived, including NDVI, NPP, WET, NDBSI, ISI, and LST. A composite Eco-environmental Index (EEI) was constructed using the entropy weight method. We combined the coefficient of variation, Theil–Sen slope estimation, the Mann–Kendall test, and the Hurst exponent to quantify spatial heterogeneity, interannual stability, and short-term persistence. We also examined climatic associations using correlation analysis. Pocket parks consistently outperformed their surrounding 500 m buffers across all indicators, and park buffer contrasts increased for most indicators. The mean EEI significantly increased from 0.563 in 2019 to 0.650 in 2024, with a pronounced step increase around 2022. At the site level, 261 of 271 parks (96.3%) exhibited an upward trend in EEI, indicating widespread ecological improvement. Specifically, park vegetation greenness (NDVI) rose from 0.413 to 0.578, widening the gap with surrounding areas. Parks consistently maintained a lower land surface temperature (LST) than their buffers, with a cooling magnitude ranging from 3.5 °C to 4.6 °C. Precipitation was positively associated with NDVI and NPP, while LST was positively associated with air temperature and negatively associated with precipitation. These findings support the planning and adaptive management of pocket parks to strengthen urban ecological resilience.
1. Introduction
Accelerated urbanization has promoted socio-economic development but has also increased pressure on resources and the environment. Cities therefore face multiple sustainability challenges, including stronger urban heat island effects, air pollution, biodiversity loss, and habitat fragmentation [1]. Against this backdrop, urban green space ecosystems, as a vital component of urban natural ecological spaces, deliver significant ecological, environmental, and cultural benefits. They play an irreplaceable role in regulating climate, purifying air, maintaining biodiversity, and improving residents’ quality of life [2]. However, land resources in high-density built-up areas are scarce and expensive, posing practical obstacles to the construction of large-scale concentrated green spaces—especially in developing countries experiencing rapid urbanization and surging populations. Consequently, pocket parks, characterized by their small size and wide distribution, have emerged as an innovative strategy to optimize urban ecological patterns. Pocket parks refer to micro-scale urban open spaces with recreational functions, constructed by “utilizing small vacant spaces” (such as leftover plots, abandoned lands, or bare lands) in cities through approaches like “greening in gaps” and “converting illegal constructions into green spaces” [3]. Although individual pocket parks are small, their distributed arrangement can create a connected set of green patches that supports city-wide ecological functions. They represent a low-cost green infrastructure suitable for improving the ecological environment of high-density cities.
Globally, the ecological importance of these small green spaces has been increasingly recognized across diverse climatic zones. For instance, a systematic review by Dong et al. highlighted the worldwide proliferation of pocket parks as a flexible strategy for urban renewal [3]. These spaces serve as vital “urban oases” that provide localized ecosystem services, particularly in mitigating the Urban Heat Island (UHI) effect in high-density areas. For instance, in the Mediterranean region, Rosso et al. conducted field tests confirming that individuals perceive significantly higher thermal comfort levels in pocket parks compared to nearby streets [4]. Similarly, in Melbourne, Australia, Motazedian et al. investigated the microclimatic interactions of small urban parks during heat events, emphasizing their role in local temperature regulation [5]. In China, Ma et al. demonstrated that the cooling effect of pocket parks in Xi’an could extend up to 100 m beyond their boundaries [6]. However, the magnitude of these services, particularly cooling intensity, is modulated by a complex set of variables. Existing literature suggests that park size is a primary determinant, with larger parks generally offering stronger “cold island” effects. Yet, for pocket parks where size is constrained, other variables become critical. Vegetation structure (e.g., tree canopy vs. grassy lawns), landscape configuration (e.g., shape index), and shading processes (transpiration and interception) play dominant roles in regulating the thermal environment [2,7]. Understanding how these variables interact within micro-scale spaces is essential for maximizing the efficiency of limited urban land resources.
Since 2018, Fujian Province has continuously advanced the construction of pocket parks and proposed an accessibility target of green views within 300 m and park access within 500 m. Fuzhou, as the provincial capital, exemplifies the ecological pressures of rapid urbanization. As a modern city with a permanent population of 8.501 million and a gross regional product (GRP) of CNY 1.42 trillion in 2024, its 74.27% urbanization rate and highly concentrated urban population create an urgent demand for ecological spaces. Against this backdrop, Fuzhou has acted as a pioneer in the construction of the “City of a Thousand Gardens.” By utilizing urban leftover plots, the large-scale construction of pocket parks has formed a bead-like distribution network. By 2024, the city had built over 1500 parks and green spaces and plans to further promote thematic pocket parks featuring floral enhancements, colorful greening, and lighting improvements along key road sections. These small and micro green spaces scattered throughout the urban fabric not only increase the total urban green coverage but also provide ecosystem services like other forms of green infrastructure. However, current research on the eco-environmental quality of Fuzhou’s parks mostly focuses on the cooling effects of larger urban parks. For instance, one study analyzing 31 parks in Fuzhou identified a size-dependent efficiency threshold of 10,800 square meters, implying that the cooling gradient efficiency diminishes significantly for parks smaller than this size [8]. Wang et al. investigated the relationship between the area of 50 urban parks in Fuzhou and their cooling effects, revealing that the optimal park area range for cooling effects is 5940–560,000 m2, and that the external morphological characteristics and internal patch characteristics of parks have a significant impact on cooling effects [9]. Additionally, Li et al. examined the diurnal and nocturnal variations in the cooling effects of different types of urban parks in Fuzhou, discovering that larger parks exhibit a stronger cooling intensity and gradient throughout the day, and the daytime cooling effects of large parks are strongly influenced by two-dimensional factors [10]. These findings highlight a critical knowledge gap: while the benefits of large-scale green spaces are well-documented, the multi-dimensional ecological functions of pocket parks—many of which fall below these established size thresholds—remain under-quantified.
Therefore, a comprehensive evaluation of pocket park eco-environmental quality should integrate multiple ecological dimensions and track changes over time. It should also assess stability and explore potential climatic associations, while acknowledging the role of urban development and park management. With the development of remote sensing technology, especially the open access to medium-to-high resolution images such as Sentinel-2 and Landsat 8, technical feasibility has been provided for long time series and refined monitoring of eco-environmental changes in urban small and micro green spaces [11]. Meanwhile, the emergence of the Google Earth Engine (GEE) cloud computing platform has greatly improved the efficiency of processing large volumes of remote sensing data, making multi-temporal and multi-indicator dynamic monitoring feasible [12].
Moreover, despite the rapid expansion of pocket park programs, their eco-environmental performance remains less quantified than that of larger urban parks. This gap is partly due to their small size and heterogeneous surroundings, which increase the risk of mixed pixel effects and scale mismatch when using conventional remote sensing products. In addition, many existing studies emphasize a single function, such as cooling, rather than a multi-dimensional assessment that integrates vegetation functioning, moisture conditions, thermal environment, and built-up characteristics. There is also limited evidence on whether short-term improvements in pocket park eco-environmental indicators are spatially widespread and temporally stable at the city scale.
Based on the above research background and issues, this study takes 271 pocket parks in the main urban area (within the 2nd Ring Road) of Fuzhou as the research objects. Using multi-source remote sensing data from the growing seasons between 2019 and 2024, and by constructing a comprehensive indicator system including the Normalized Difference Vegetation Index (NDVI), Net Primary Productivity (NPP), Wetness (WET), Normalized Difference Built-up and Soil Index (NDBSI), Impervious Surface Index (ISI), and Land Surface Temperature (LST). This study addresses three objectives using the coefficient of variation, Theil–Sen slope estimation, the Mann–Kendall test, and the Hurst exponent: (1) Reveal the spatiotemporal variation characteristics of the multi-dimensional eco-environmental quality of Fuzhou’s pocket parks. (2) Quantify the stability and recent (2019–2024) trend characteristics of pocket park eco-environmental quality. (3) Analyze the influence mechanism of climatic factors on the eco-environmental quality of pocket parks. This study makes three contributions. First, it provides a park-centric assessment of 271 pocket parks and their surrounding 500 m buffers, with statistics summarized per park to avoid dominance by a small number of large sites. Second, it constructs an entropy-weighted composite EEI from six indicators to represent multiple dimensions of eco-environmental quality at the pocket park scale. Third, it integrates variability, trend, and exploratory persistence analyses to characterize recent dynamics from 2019 to 2024 and to support maintenance prioritization under climate variability. This study provides an evidence base for the planning, construction, and adaptive management of small and micro green spaces in high-density urban environments, and contributes to the quality improvement of Fuzhou’s “City of a Thousand Gardens” initiative and urban sustainable development.
2. Materials and Methods
2.1. Study Area
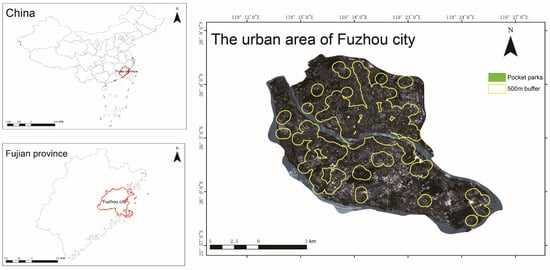
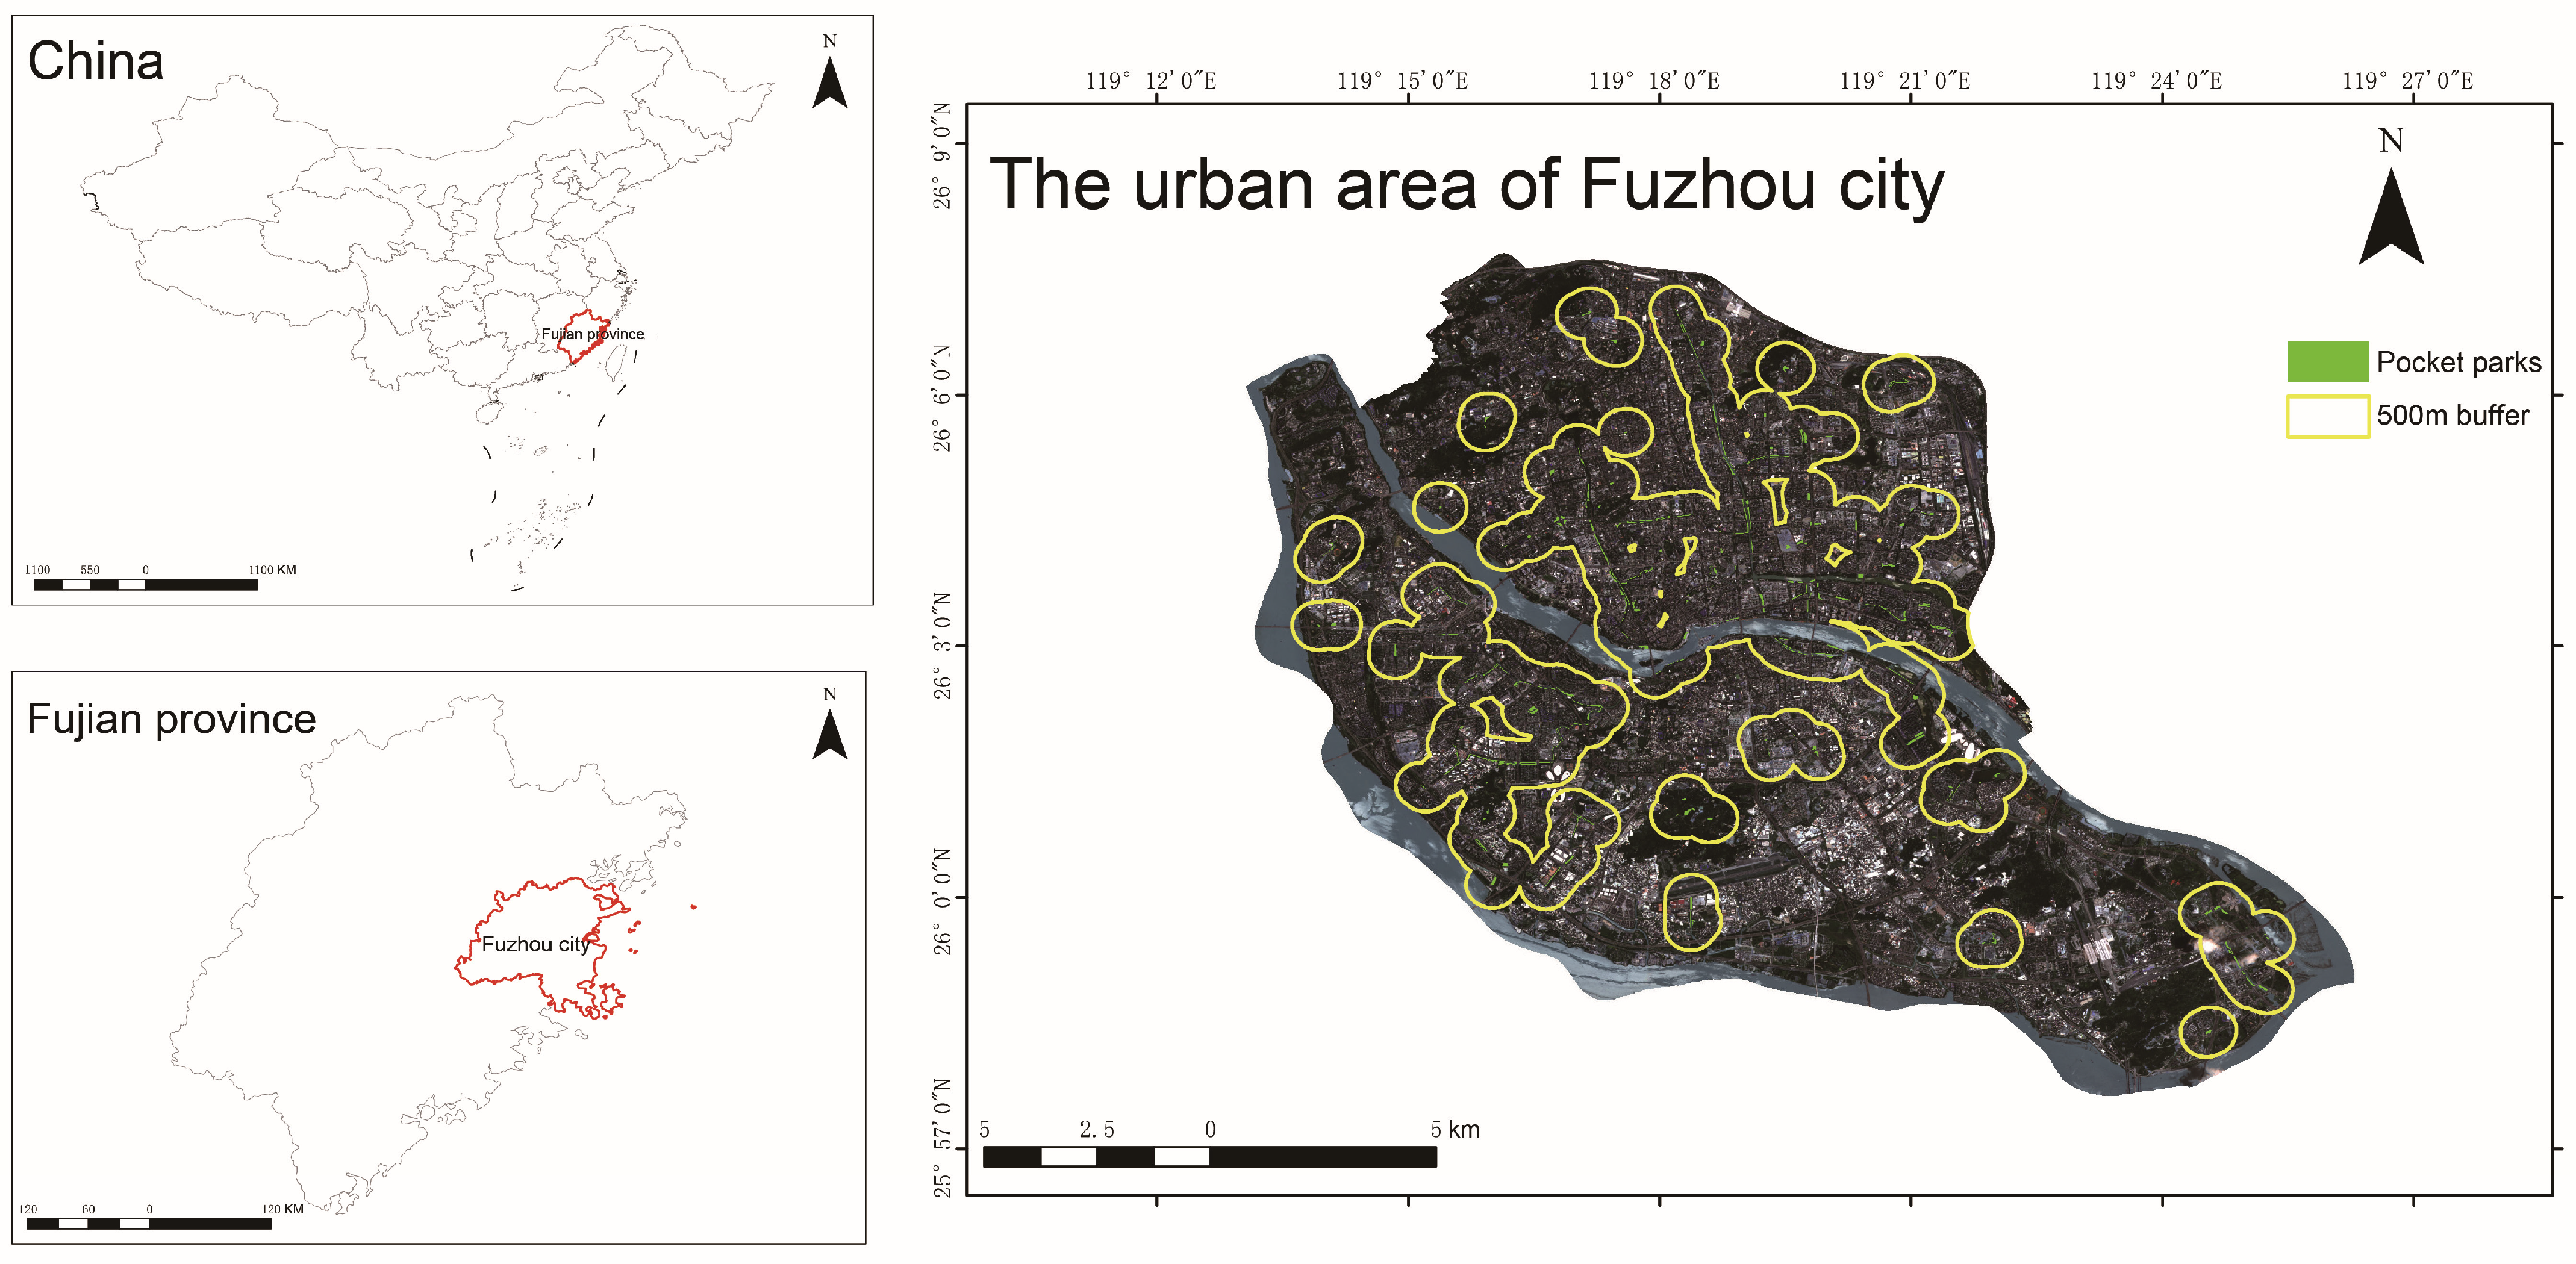
The study area consists of pocket parks in the main urban area (within the 2nd Ring Road) of Fuzhou (Figure 1). Located on the southeastern coast of China (25°15′ N–26°39′ N, 118°08′ E–120°31′ E), Fuzhou has a subtropical monsoon climate, with an annual average air temperature of 21.4 °C and annual precipitation of 1626 mm. This warm and humid climate provides favorable conditions for vegetation growth. The widespread distribution of pocket parks within this climatic and urban context makes it an ideal area for assessing the ecological benefits of small-scale green infrastructure.
Figure 1.
Location map of pocket parks in the main urban area of Fuzhou City.
2.2. Data Acquisition and Preprocessing
Based on the thematic vector data of Parks and Green Spaces provided by the Fuzhou Municipal Bureau of Landscape Architecture, this study extracted 271 pocket parks (with an area ranging from 400 to 10,000 m2) in Fuzhou’s main urban area. A 500 m buffer zone was selected to align with the “15-min community life circle” planning policy and Fujian Province’s park accessibility targets. Remote sensing data (Sentinel-2, Landsat 8, MODIS) were processed on GEE. We utilized ArcGIS 10.8 for spatial operations and Python 3.2.2 for statistical analysis. Data from the vegetation growing seasons (April–September) of Fuzhou from 2019 to 2024 were selected, and annual growing season composites were generated on GEE by selecting observations with low cloud contamination and then compositing them. Climatic data were sourced from the National Tibetan Plateau Scientific Data Center, including 1 km spatial resolution datasets of monthly precipitation, average air temperature, maximum air temperature, minimum air temperature, and potential evapotranspiration. These datasets were cumulated on a monthly basis, and the average values from April to September were calculated. All data were unified into the same geographic coordinate system, and standardized preprocessing (such as radiometric calibration, atmospheric correction, and image registration) was performed on data from different time phases. The data source is shown in Table 1. Based on these six indicators, we further constructed an entropy-weighted composite Eco-environmental Index (EEI) to summarize overall eco-environmental quality. All indicators (and EEI) were summarized as annual growing season (April–September) composites for 2019–2024. Trend- and persistence-related statistics were computed on pixel-level six-point annual time series (10 m), and results were further summarized to each pocket park polygon and its 500 m buffer for reporting. Downscaling was implemented to improve spatial alignment with pocket park boundaries and to reduce scale mismatch when comparing small parks with their surrounding buffers.
Table 1.
Research data and sources.
2.3. Remote-Sensing-Based Indicators and Composite EEI Construction
In this study, eco-environmental quality (EEQ) refers to the overall condition of the urban ecological environment within and around pocket parks, as reflected by vegetation structure and functioning, surface moisture and energy conditions, and the degree of human-induced surface modification. Because EEQ cannot be directly observed from satellite imagery, we operationalize it using six remote-sensing-based indicators as observable proxies for key ecological dimensions. Specifically, NDVI represents vegetation greenness/cover, NPP reflects vegetation productivity and carbon sequestration potential, WET captures surface/vegetation moisture conditions, LST characterizes the thermal environment, and NDBSI and ISI indicate dryness and imperviousness associated with urban construction. To facilitate interpretation and spatiotemporal comparison, we further aggregate these six indicators into a single Eco-environmental Index (EEI) using an entropy-weighted composite approach [13]. These indicators provide a consistent and spatially explicit basis for comparing relative eco-environmental conditions across parks, buffers, and years. The rationale is that these indicators capture complementary dimensions of urban eco-environmental condition that are observable from satellite data and have clear ecological interpretations.
High-resolution data (10 m) were generated for all indicators. Specifically, NDVI, WET, NDBSI, and ISI were calculated directly from Sentinel-2 imagery. The detailed definitions, ecological meanings, and calculation methods for these indicators are summarized in Table 2. To address the resolution differences of other products, we applied downscaling techniques: MODIS NPP (500 m) was downscaled using a polynomial model based on the NDVI-NPP relationship, and Landsat 8 LST (30 m) was downscaled using a random forest regression model integrating Sentinel-2 spectral indices. The specific methods of downscaling are elaborated in the following section.
Table 2.
Definitions and calculation methods of the remote sensing indicators used in this study.
2.3.1. NPP Downscaling
NPP reflects the ability of vegetation in ecosystems to sequester carbon through photosynthesis, and is of great significance for evaluating regional ecological quality and carbon cycles [19]. In this study, 10 m spatial resolution NDVI data and MODIS NPP products were integrated, and a polynomial model was constructed to realize the downscaling estimation of NPP. First, sample data that can represent the relationship between NDVI and NPP in the study area were obtained through the random point generation method (specifically, 5000 random points were generated annually to ensure comprehensive coverage of the feature space); second, synchronous point data extraction was conducted based on the generated random points; and finally, a polynomial model was used to construct the relationship between NDVI and NPP. The coefficient of determination (R2) was calculated to screen the optimal polynomial order. We evaluated candidate models from linear to cubic polynomials and selected the order with the best fit based on R2 for each year. A cubic polynomial was selected in most years. The generic form is
where represents the NPP, and x represents the NDVI. The coefficients a to d were estimated separately for each year using ordinary least squares.
To reduce overfitting, the polynomial order was selected by comparing R2 across candidate models (linear to cubic) using the sampled points for each year. The final downscaled NPP was produced at 10 m resolution by applying the optimal model to the annual growing season NDVI composite. For model calibration, we generated random sampling points within the study area and extracted paired MODIS NPP and NDVI values after bringing NDVI to the MODIS grid by spatial aggregation. Model fitting was performed separately for each year to account for interannual variability in vegetation and climate conditions. To reduce sensitivity to sampling, points were distributed across the full range of NDVI values. Given the lack of in situ measurements, we assessed the reliability of the downscaled NPP primarily through a scale-consistency check (Section 2.3.4). Specifically, the 10 m NPP was aggregated back to 500 m and compared pixel-by-pixel with MODIS NPP using R2 and RMSE for each year.
2.3.2. LST Downscaling
LST reflects the surface energy balance and environmental conditions, and serves as a critical parameter for climate change research and ecological monitoring [20]. It is retrieved via the radiative transfer equation algorithm [21] (pp. 605–624). In this study, a multiple linear regression model was used to establish a linear relationship between Landsat-derived LST and three spectral indices: the Normalized Difference Vegetation Index (NDVI), Normalized Difference Built-up Index (NDBI), and Normalized Difference Water Index (NDWI). This model was applied to downscale LST to a 10 m spatial resolution, whose formula is as follows [22]:
Herein, a0–a3 represent the output coefficients of the Landsat linear regression; NDVI10m, NDBI10m, and NDWI10m denote the 10 m resolution spectral indices calculated from Sentinel-2 data; and ΔLST10m refers to the regression residual. The regression coefficients were estimated for each year using co-located Landsat LST at 30 m and Sentinel-2 derived indices aggregated to 30 m. The fitted model was then applied to the 10 m Sentinel-2 indices, and the residual term was redistributed to 10 m following a scale-consistent approach so that the aggregated 10 m LST matched the original 30 m LST.
2.3.3. Composite EEI Construction
To integrate the six remote sensing indicators (NDVI, NPP, WET, NDBSI, ISI, and LST) into a composite Eco-environmental Index (EEI), this study adopted the entropy weight method, which is an objective weighting approach widely used in composite index construction. Unlike Principal Component Analysis (PCA), which reduces dimensionality by discarding some variance, the entropy method objectively assigns weights based on the information dispersion of all indicators, ensuring no ecological dimension is ignored. To make indicators comparable, all indicators were normalized to the range [0, 1]. Considering their ecological implications, NDVI, NPP, and WET were treated as positive indicators (higher values indicate better eco-environmental quality), while NDBSI, ISI, and LST were treated as negative indicators (higher values indicate worse eco-environmental quality). The entropy weight (wj) for each indicator was calculated, and the final EEI was computed as
where Zi,j is the normalized value of indicator j for unit i. A higher indicates better eco-environmental quality. Weights were computed using pooled samples across 2019–2024 to ensure temporal comparability of EEI among years.
2.3.4. Validation of Downscaled NPP and LST
Due to the lack of in situ measurements within all pocket parks, we evaluated the reliability of the downscaled NPP and LST products using a scale-consistency assessment. Specifically, the 10 m downscaled NPP and LST were aggregated back to the native spatial resolutions of the corresponding source products (500 m for MODIS NPP and 30 m for Landsat LST) and then compared pixel-by-pixel with the original products over the study area during the growing season (April–September) for each year from 2019 to 2024.
Aggregation was implemented using an area-weighted mean to ensure energy/mass consistency when resampling from finer to coarser grids. The agreement between aggregated downscaled products and the original products was quantified using the coefficient of determination (R2) and root mean square error (RMSE). Validation metrics were summarized by year and are provided in Section 3 to document the scale consistency of the downscaled products. We use this assessment to evaluate scale consistency rather than absolute accuracy, and we report R2 and RMSE by year for transparency.
2.4. Spatio-Temporal Variation Analysis
2.4.1. Pixel-Level Time Series Analysis and Park-Level Summarization
All trend- and persistence-related statistics were computed at the pixel level to preserve fine-scale spatial heterogeneity within pocket parks and their surroundings. Specifically, for each indicator we constructed annual vegetation growing season composites (April–September) for 2019–2024 and generated a six-point annual time series for every 10 m pixel. Theil–Sen slope estimation and the Mann–Kendall (MK) test were applied to each pixel-level time series, and the Hurst exponent (R/S analysis) was also estimated at the pixel level.
To report results at the pocket park and buffer-zone scales, pixel-level outputs (e.g., Sen slope class, MK significance class, Hurst class, and the combined trend–persistence typology) were summarized within each pocket park polygon and its 500 m buffer by calculating the area proportion of pixels in each class. In Section 3, statements such as “xx% of pixels” refer to the proportion of 10 m pixels within the corresponding analysis masks (pocket parks or buffers) that fall into a given class.
For each year, we computed growing season composites at the pixel level. For descriptive statistics such as Table 3, we first calculated the mean value of each indicator across all valid 10 m pixels within each pocket park polygon. We then averaged these park-level means across the 271 parks to obtain the annual mean for pocket parks.
Table 3.
Annual mean values of remote sensing indicators (NDVI, NPP, WET, NDBSI, ISI, LST) for pocket parks and buffers over the period of 2019–2024.
For buffer zones, we generated a 500 m buffer around each park polygon and excluded the park polygon itself from the buffer mask. We computed the mean value across buffer pixels for each park, and then averaged these buffer-level means across parks to obtain the annual mean for buffers.
The “Differences” reported in Table 3 were computed as the annual mean of pocket parks minus the annual mean of buffers. This approach gives equal weight to each park and avoids domination by a small number of large buffers. Buffer zones were summarized for each park separately, and overlaps between buffers were allowed because the objective was a park-centric comparison rather than an comprehensive accounting of the entire city.
2.4.2. Coefficient of Variation (CV)
Coefficient of variation (CV) analysis quantifies the degree of dispersion of data across spatiotemporal dimensions by calculating the ratio of the data’s standard deviation to its mean. It can measure the stability of the ecological environment quality of pocket parks and facilitate consistent comparisons across indicators and regions [23]. In this study, CV values were classified into five levels: low fluctuation (CV ≤ 0.1), relatively low fluctuation (0.1 < CV ≤ 0.2), moderate fluctuation (0.2 < CV ≤ 0.3), relatively high fluctuation (0.3 < CV ≤ 0.4), and high fluctuation (CV > 0.4). For CV, indicator values were averaged over each park polygon (and buffer) to obtain one value per unit per year. Trend and persistence analyses (Sen–MK and Hurst) were conducted on pixel-level time series and then summarized to parks/buffers as area proportions.
2.4.3. Trend Analysis
Theil–Sen Median (Sen) slope estimation and Mann–Kendall (MK) non-parametric test can be used to quantitatively identify the change trends and trend magnitudes of remote sensing data time series, and test the statistical significance of the trends [24]. In this study, the change trends were classified into five levels by combining the positive/negative signs of the Sen slope (β) and the p-values of the MK test: significantly decreasing (β < 0 and p < 0.05), non-significantly decreasing (β < 0 and p ≥ 0.05), stable (β = 0), non-significantly increasing (β > 0 and p ≥ 0.05), and significantly increasing (β > 0 and p < 0.05).
Because the series includes only six annual observations, Sen slopes are interpreted as short-term trend signals. MK p-values are reported as descriptive support and should not be over-interpreted.
2.4.4. Persistence Analysis Using the Hurst Exponent
The Hurst exponent (H) is a commonly used metric to describe long-range dependence (memory) in a time series and to characterize whether observed variations tend to be persistent or anti-persistent [25]. In this study, H was estimated using rescaled range (R/S) analysis. In general, H > 0.5 indicates persistence (i.e., changes tend to continue in the same direction), H ≈ 0.5 suggests near-random behavior, and H < 0.5 indicates anti-persistence (i.e., changes tend to reverse direction). Because Hurst estimation was developed for longer series, H values from six-point annual records are expected to have high uncertainty.
Because the study period contains only six annual observations (2019–2024), the Hurst exponent is used here as an exploratory descriptor of temporal dependence rather than a deterministic tool for long-horizon prediction. To facilitate interpretation, we further combined the sign of the Sen slope (β) with H to form a trend–persistence typology: (1) decreasing with persistence (β < 0, H > 0.5), (2) decreasing with anti-persistence (β < 0, H < 0.5), (3) increasing with anti-persistence (β > 0, H < 0.5), and (4) increasing with persistence (β > 0, H > 0.5). This typology is used to identify areas where the observed short-term trend is more/less likely to persist, conditional on broadly similar driving conditions.
2.4.5. Analysis of Climatic Associations
We examined climatic associations between growing season climate variables and EEI and its component indicators (NDVI, NPP, WET, NDBSI, ISI, and LST) for 2019–2024. Because the analysis period includes only six years, these associations are interpreted as interannual covariation and are not used for causal inference.
Associations were quantified using the pooled park–year dataset (271 parks × 6 years = 1626 observations). For each park and year, we paired the park-level growing season mean of each remote sensing indicator (computed from 10 m pixels within the park polygon) with the corresponding growing season climate variables for that year. Pearson correlation coefficients were then computed across all park–year observations. Because repeated measurements from the same park across years are not strictly independent, p-values are reported for descriptive purposes only.
3. Results
3.1. Scale-Consistency Validation of Downscaled NPP and LST
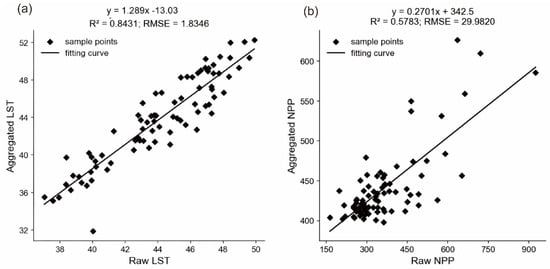
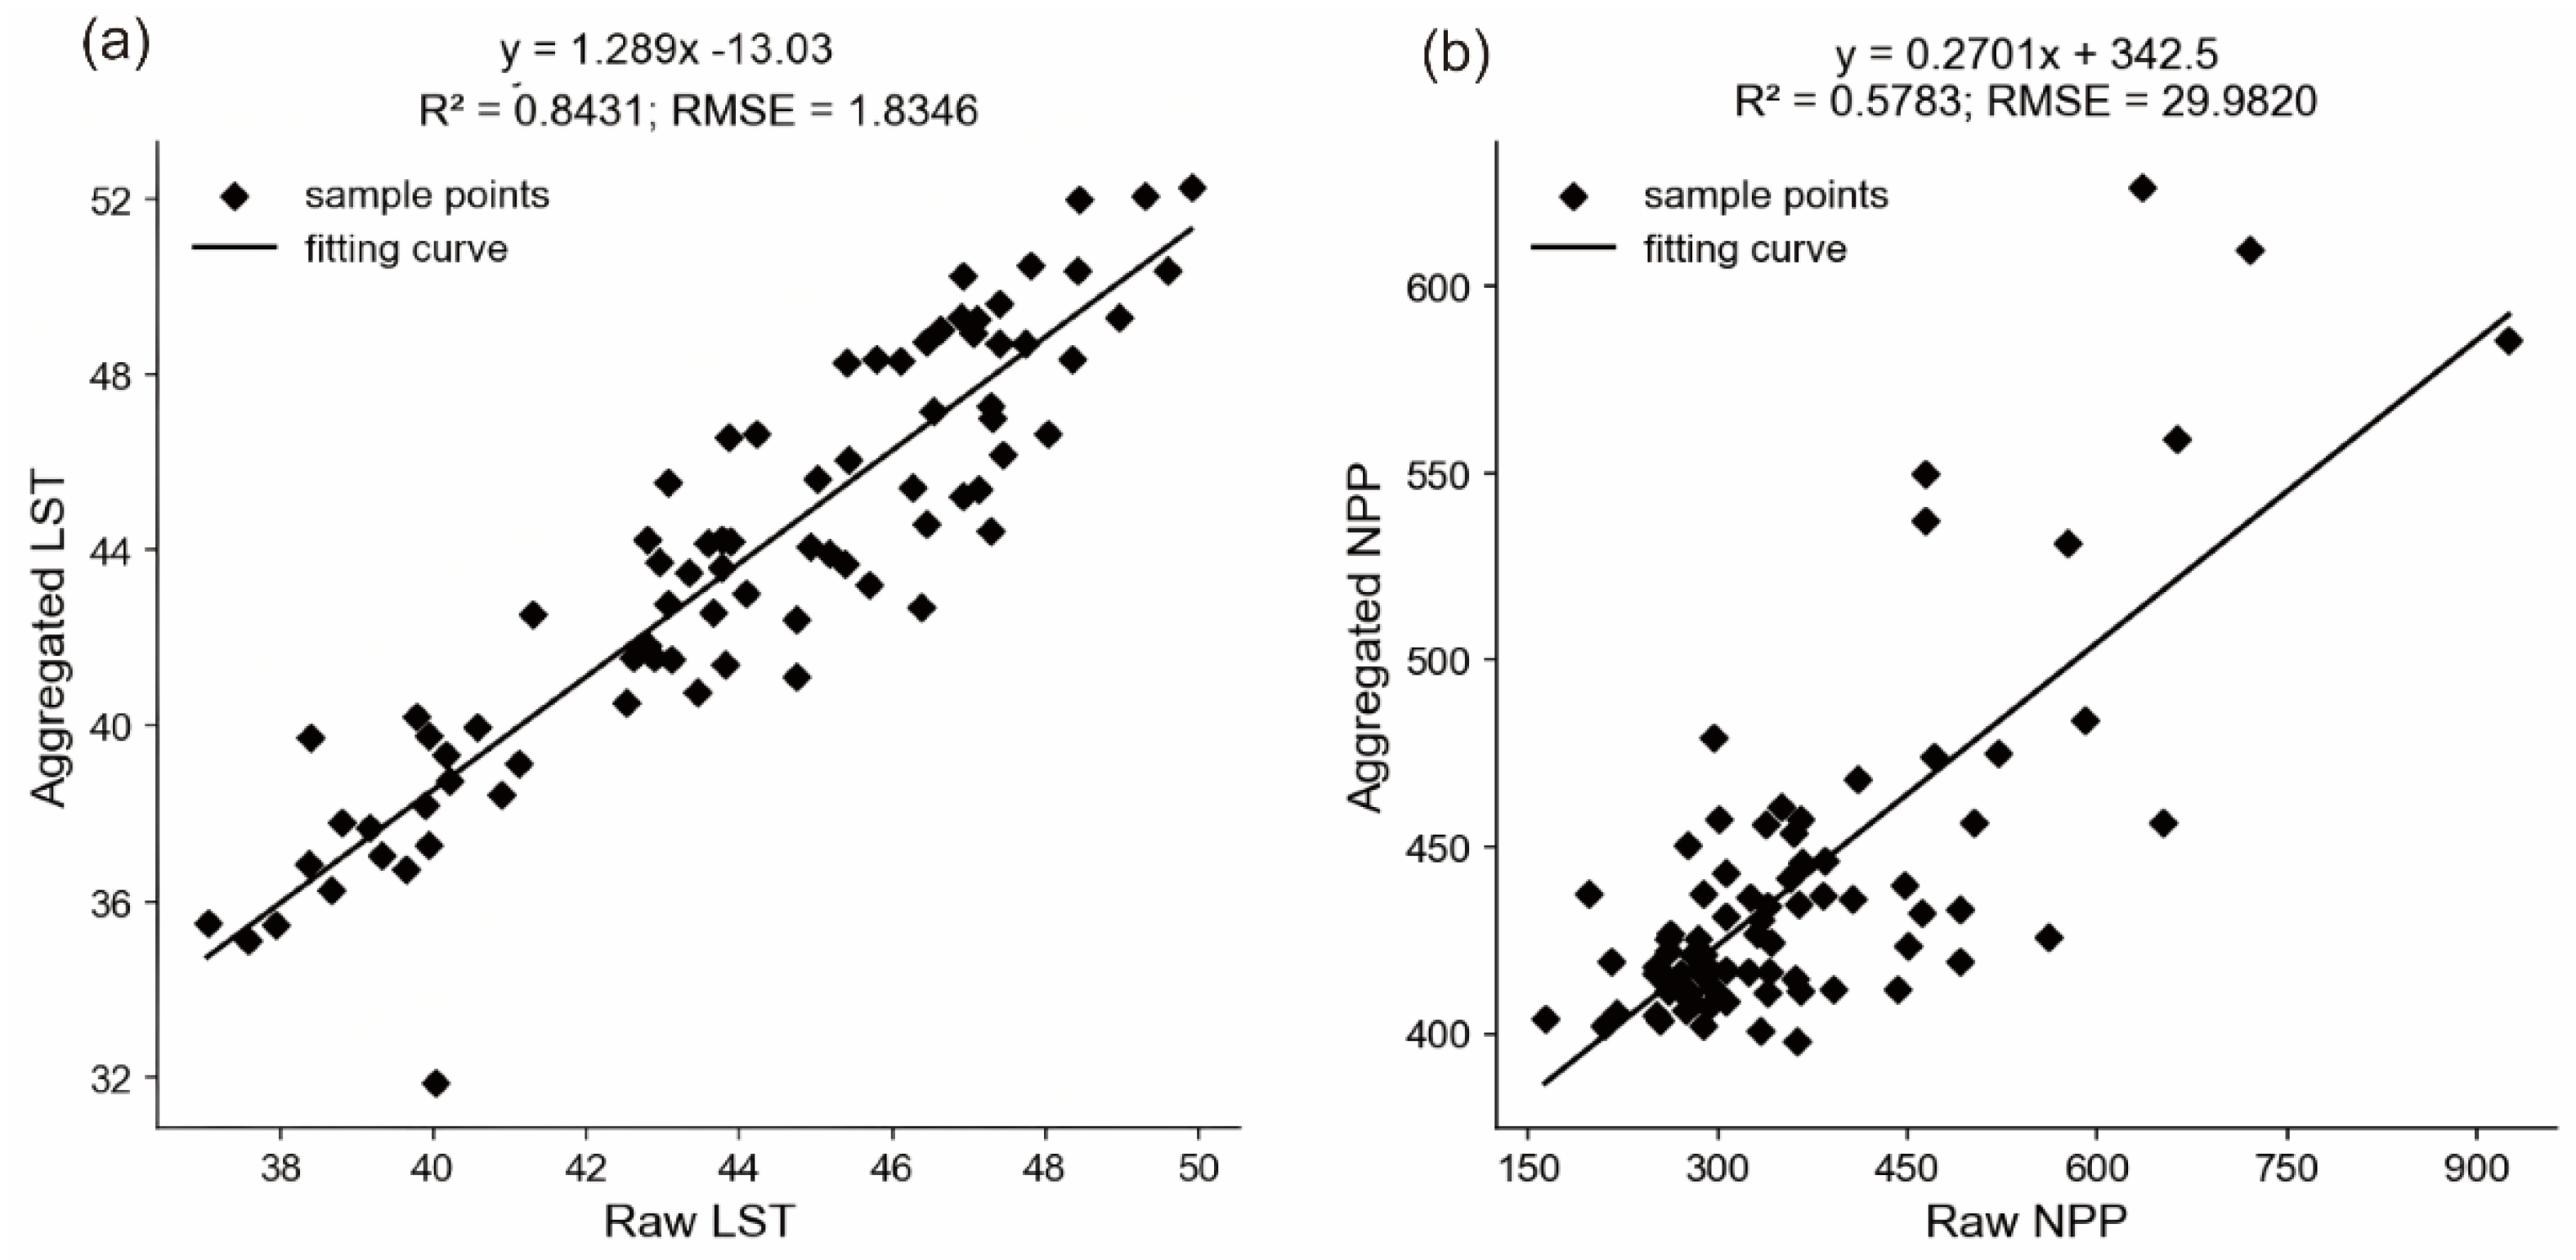
To evaluate the reliability of the downscaled NPP and LST products, we conducted a scale-consistency assessment by aggregating the 10 m estimates back to the native resolutions of the source datasets (500 m for MODIS NPP and 30 m for Landsat LST) and comparing them pixel-by-pixel with the original products over the study area (Figure 2). For NPP, the aggregated 10 m estimates show moderate agreement with MODIS NPP (R2 = 0.5783; RMSE = 29.9820), indicating that the downscaled NPP captures the broad spatial variation but retains uncertainty at finer scales. For LST, agreement is higher (R2 = 0.8431; RMSE = 1.8346), suggesting that the downscaled LST preserves the spatial pattern of Landsat LST with relatively small errors. This assessment supports the use of the downscaled products for comparative analyses between pocket parks and buffer zones, while interpretations of NPP should be made with greater caution than those of LST.
Figure 2.
Scale-consistency validation of downscaled NPP and LST. (a) Linear regression between MODIS NPP (raw) and aggregated 10 m downscaled NPP at 500 m. (b) Linear regression between Landsat LST (raw) and aggregated 10 m downscaled LST at 30 m. Points represent sample pixels, and the fitted line indicates the linear relationship. Reported R2 and RMSE quantify agreement between the aggregated downscaled products and original datasets.
3.2. Spatio-Temporal Variation Characteristics of Ecological Environment Quality of Pocket Parks
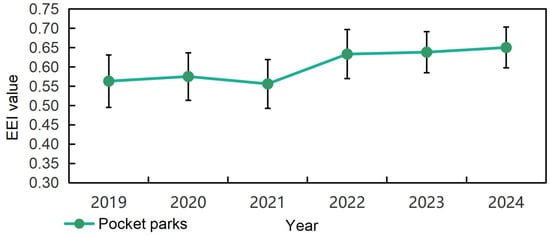
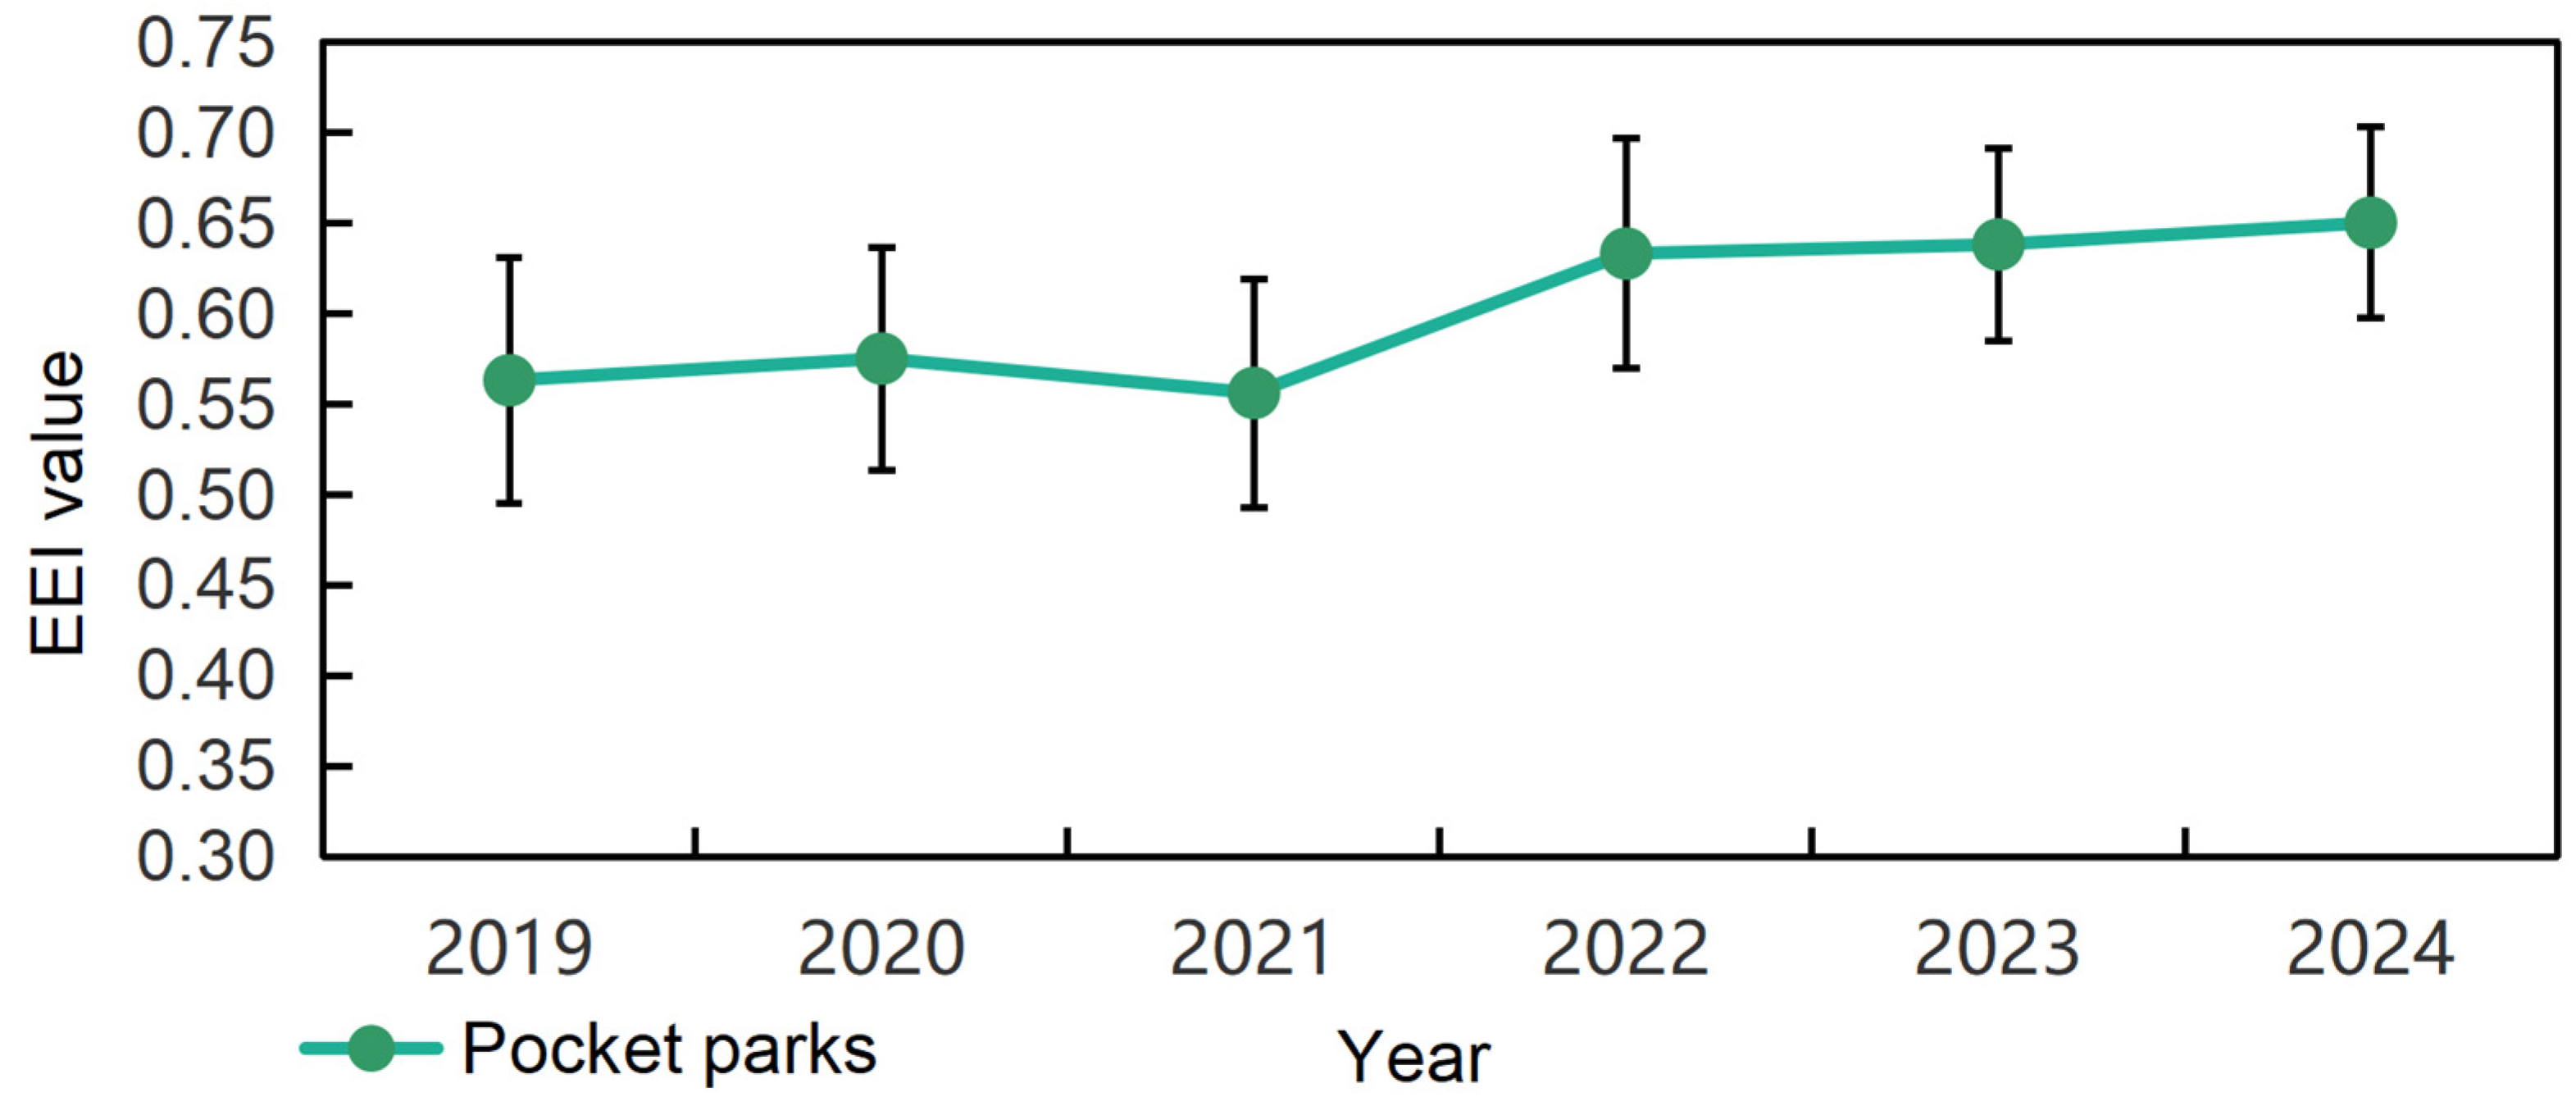
At the composite-index level, the Eco-environmental Index (EEI) of pocket parks shows a clear interannual improvement from 2019 to 2024 (Figure 3). The mean growing season EEI increased from 0.563 in 2019 to 0.650 in 2024, with a small rise in 2020, a slight decline in 2021, and a pronounced step increase in 2022 followed by a gradual upward trend through 2024. Nevertheless, the 2019–2024 comparison indicates that higher EEI conditions became more prevalent and that both the upper and lower bounds of the EEI increased, suggesting an overall improvement in eco-environmental quality across the study area rather than changes limited to a few high-quality locations.
Figure 3.
Interannual variation of pocket park EEI during the growing season (2019–2024). Values represent the annual growing season mean EEI averaged across 271 pocket parks.
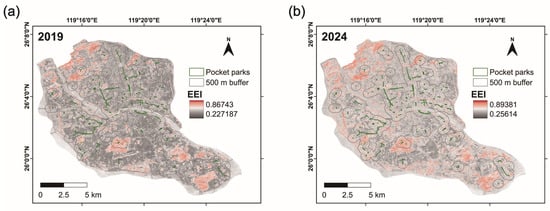
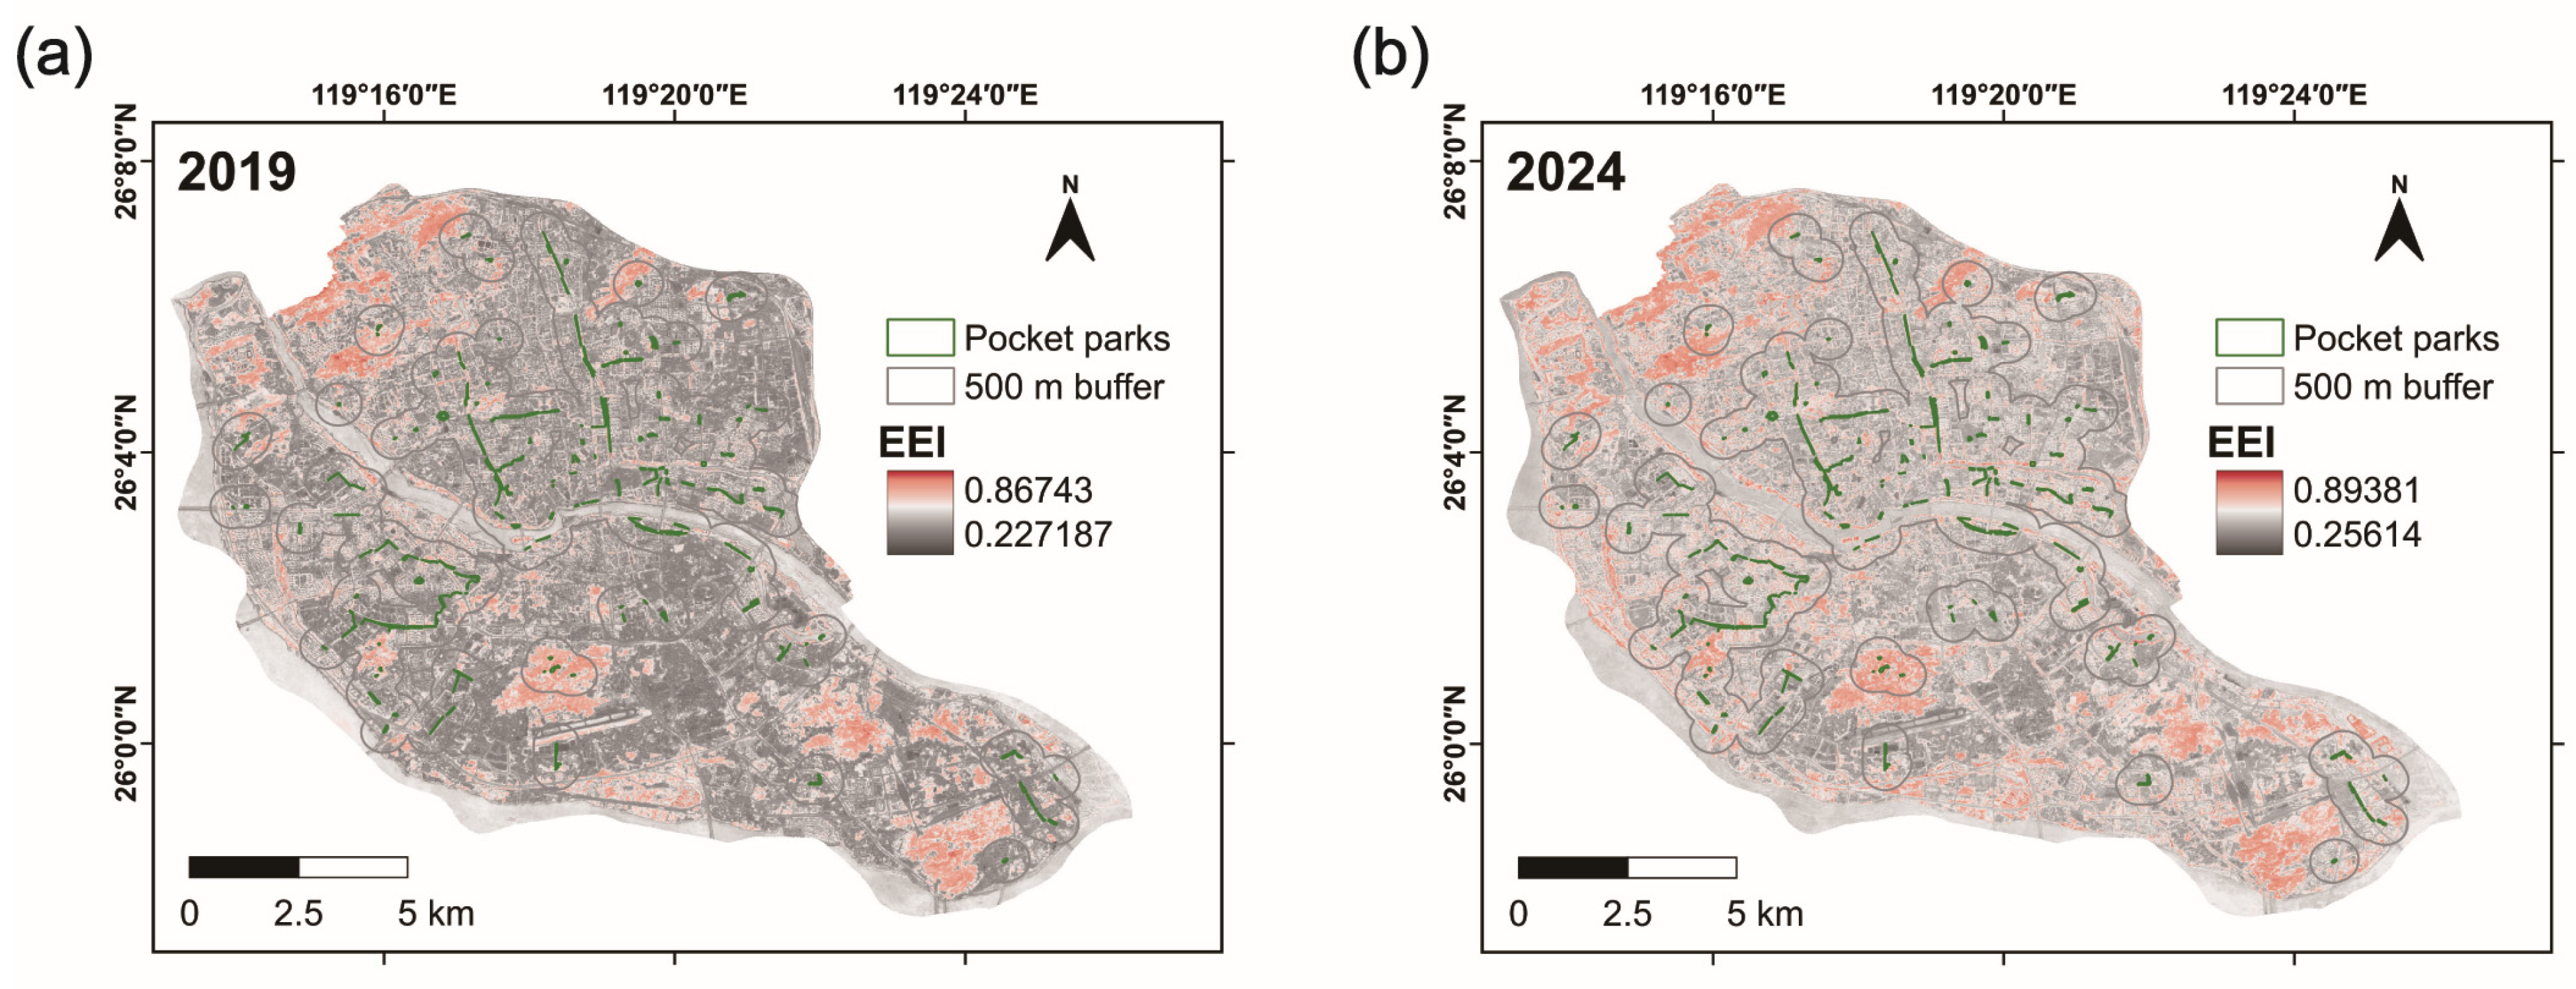
This interpretation is reinforced by park-level statistics for all 271 pocket parks: 261 parks (96.31%) increased in mean EEI between 2019 and 2024, whereas only 10 (3.69%) decreased, indicating a broadly shared improvement rather than one driven by a small subset of sites (Figure 4). However, this improvement was not uniform across all sites. The average park-level EEI increased from 0.589 to 0.678, but with notable variability (Standard Deviation of change = 0.052). While the median increase was +0.085, the magnitude of change ranged significantly from a maximum increase of +0.236 (Paiwei Road North-side Pocket Park) to a maximum decrease of −0.176 (Nanhu Park). This heterogeneity suggests that while the overall trend is positive, specific local factors (likely park size, renovation intensity, or surrounding context) modulate the magnitude of the ecological improvement. The step increases around 2022 are consistent with component-level improvements, particularly the higher NDVI and lower LST, together with a smaller improvement in NDBSI (Table 3). This timing also coincides with intensified greening and park-upgrading activities reported in local planning documents, although causal attribution cannot be established.
Figure 4.
Spatial distribution of EEI in pocket parks and surrounding 500 m buffers in 2019 (a) and 2024 (b). Maps show the growing season (April–September) EEI composites. Pocket park polygons and their 500 m buffers are overlaid for reference.
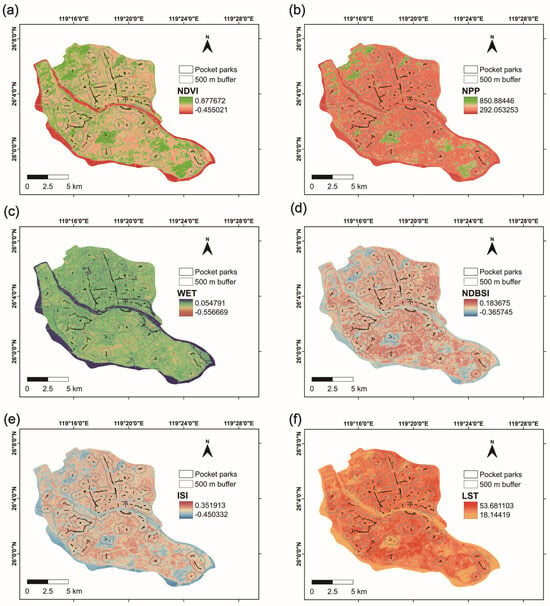
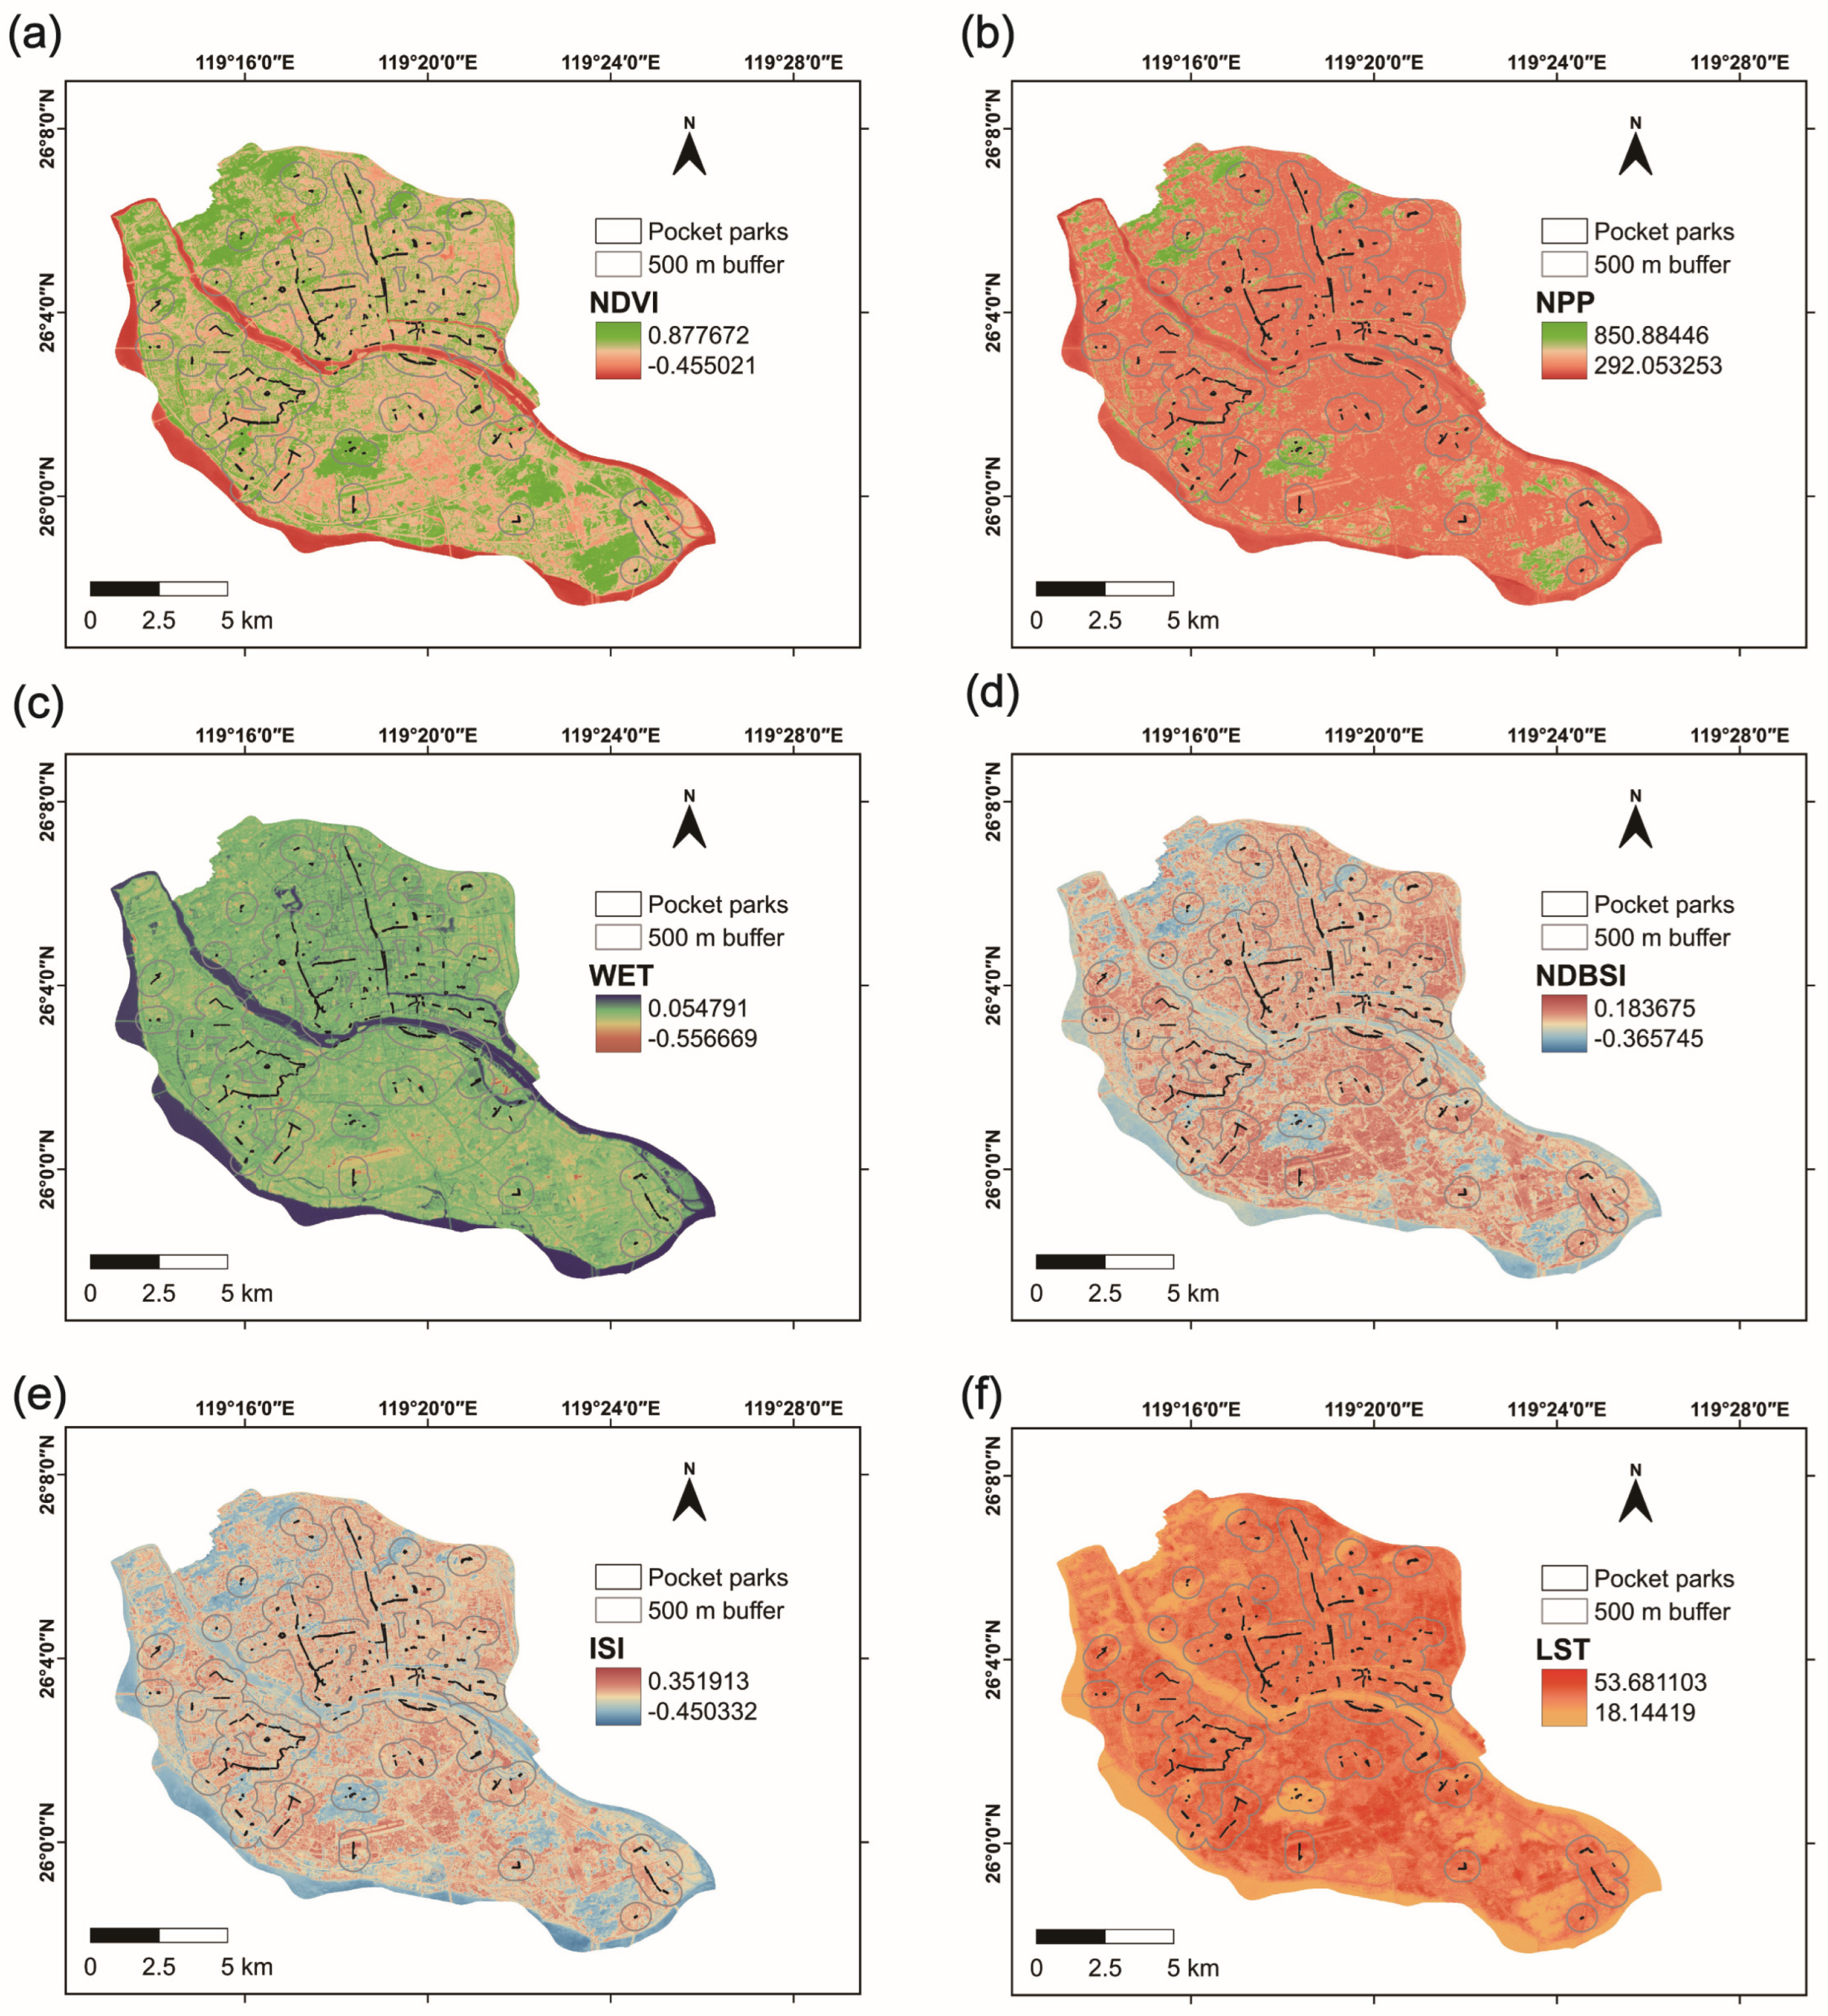
We further explored the specific EEI indicators in the main urban area of Fuzhou from 2019 to 2024. Results showed that the spatial distribution of ecological environment quality in each pocket park and its buffer zone exhibits spatial heterogeneity (Figure 5). According to the statistical results of the annual average ecological environment index of pocket parks and their buffer zones as a whole, pocket parks and their surrounding buffer zones show clear differences in indicator values (Table 3). Specifically, the NDVI of pocket parks increased from 0.413 to 0.578, and the NPP fluctuated upward to 540.99, both higher than those of the buffer zones, with the gaps continuously widening. This indicates that the vegetation coverage and carbon sequestration capacity of pocket parks have steadily improved. WET values in pocket parks are higher than the surrounding buffer zones, with positive and increasing differences, reflecting higher ecological humidity and lower vegetation water stress. The NDBSI of pocket parks is generally lower than that of the buffer zones, indicating a milder degree of surface dryness. ISI remains negative in pocket parks, which is consistent with a lower imperviousness signal than in surrounding built-up areas. The LST of pocket parks has consistently been lower than that of the buffer zones, with the difference ranging from −3.81 to −4.61, demonstrating a stable cooling effect that helps mitigate the urban heat island effect.
Figure 5.
Spatial distribution of annual average Eco-environmental Index (EEI) indicators of pocket parks and their buffer zones in the main urban area of Fuzhou City (2019–2024): (a) NDVI; (b) NPP; (c) WET; (d) NDBSI; (e) ISI; (f) LST.
In summary, Fuzhou’s pocket parks outperform the surrounding buffer zones in terms of vegetation coverage, carbon sequestration, humidity, moisture status, and surface thermal environment. Moreover, the gaps in most indices show an expanding trend, highlighting the continuous improvement effect of pocket parks on the local ecological environment.
3.3. Stability Analysis of Ecological Environment Quality of Pocket Parks
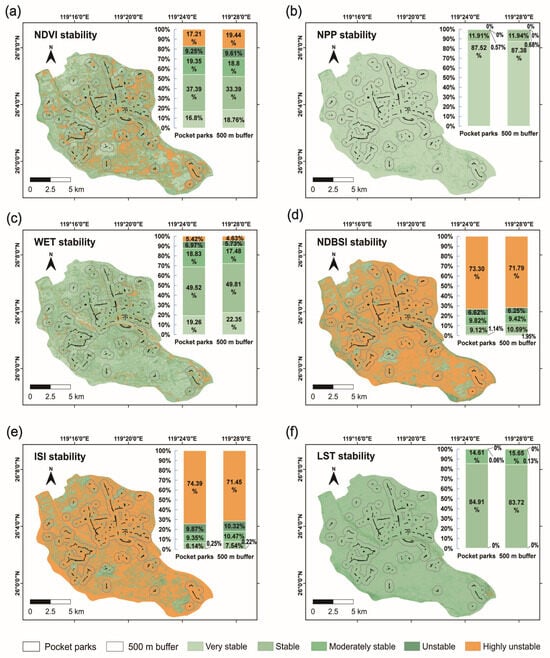
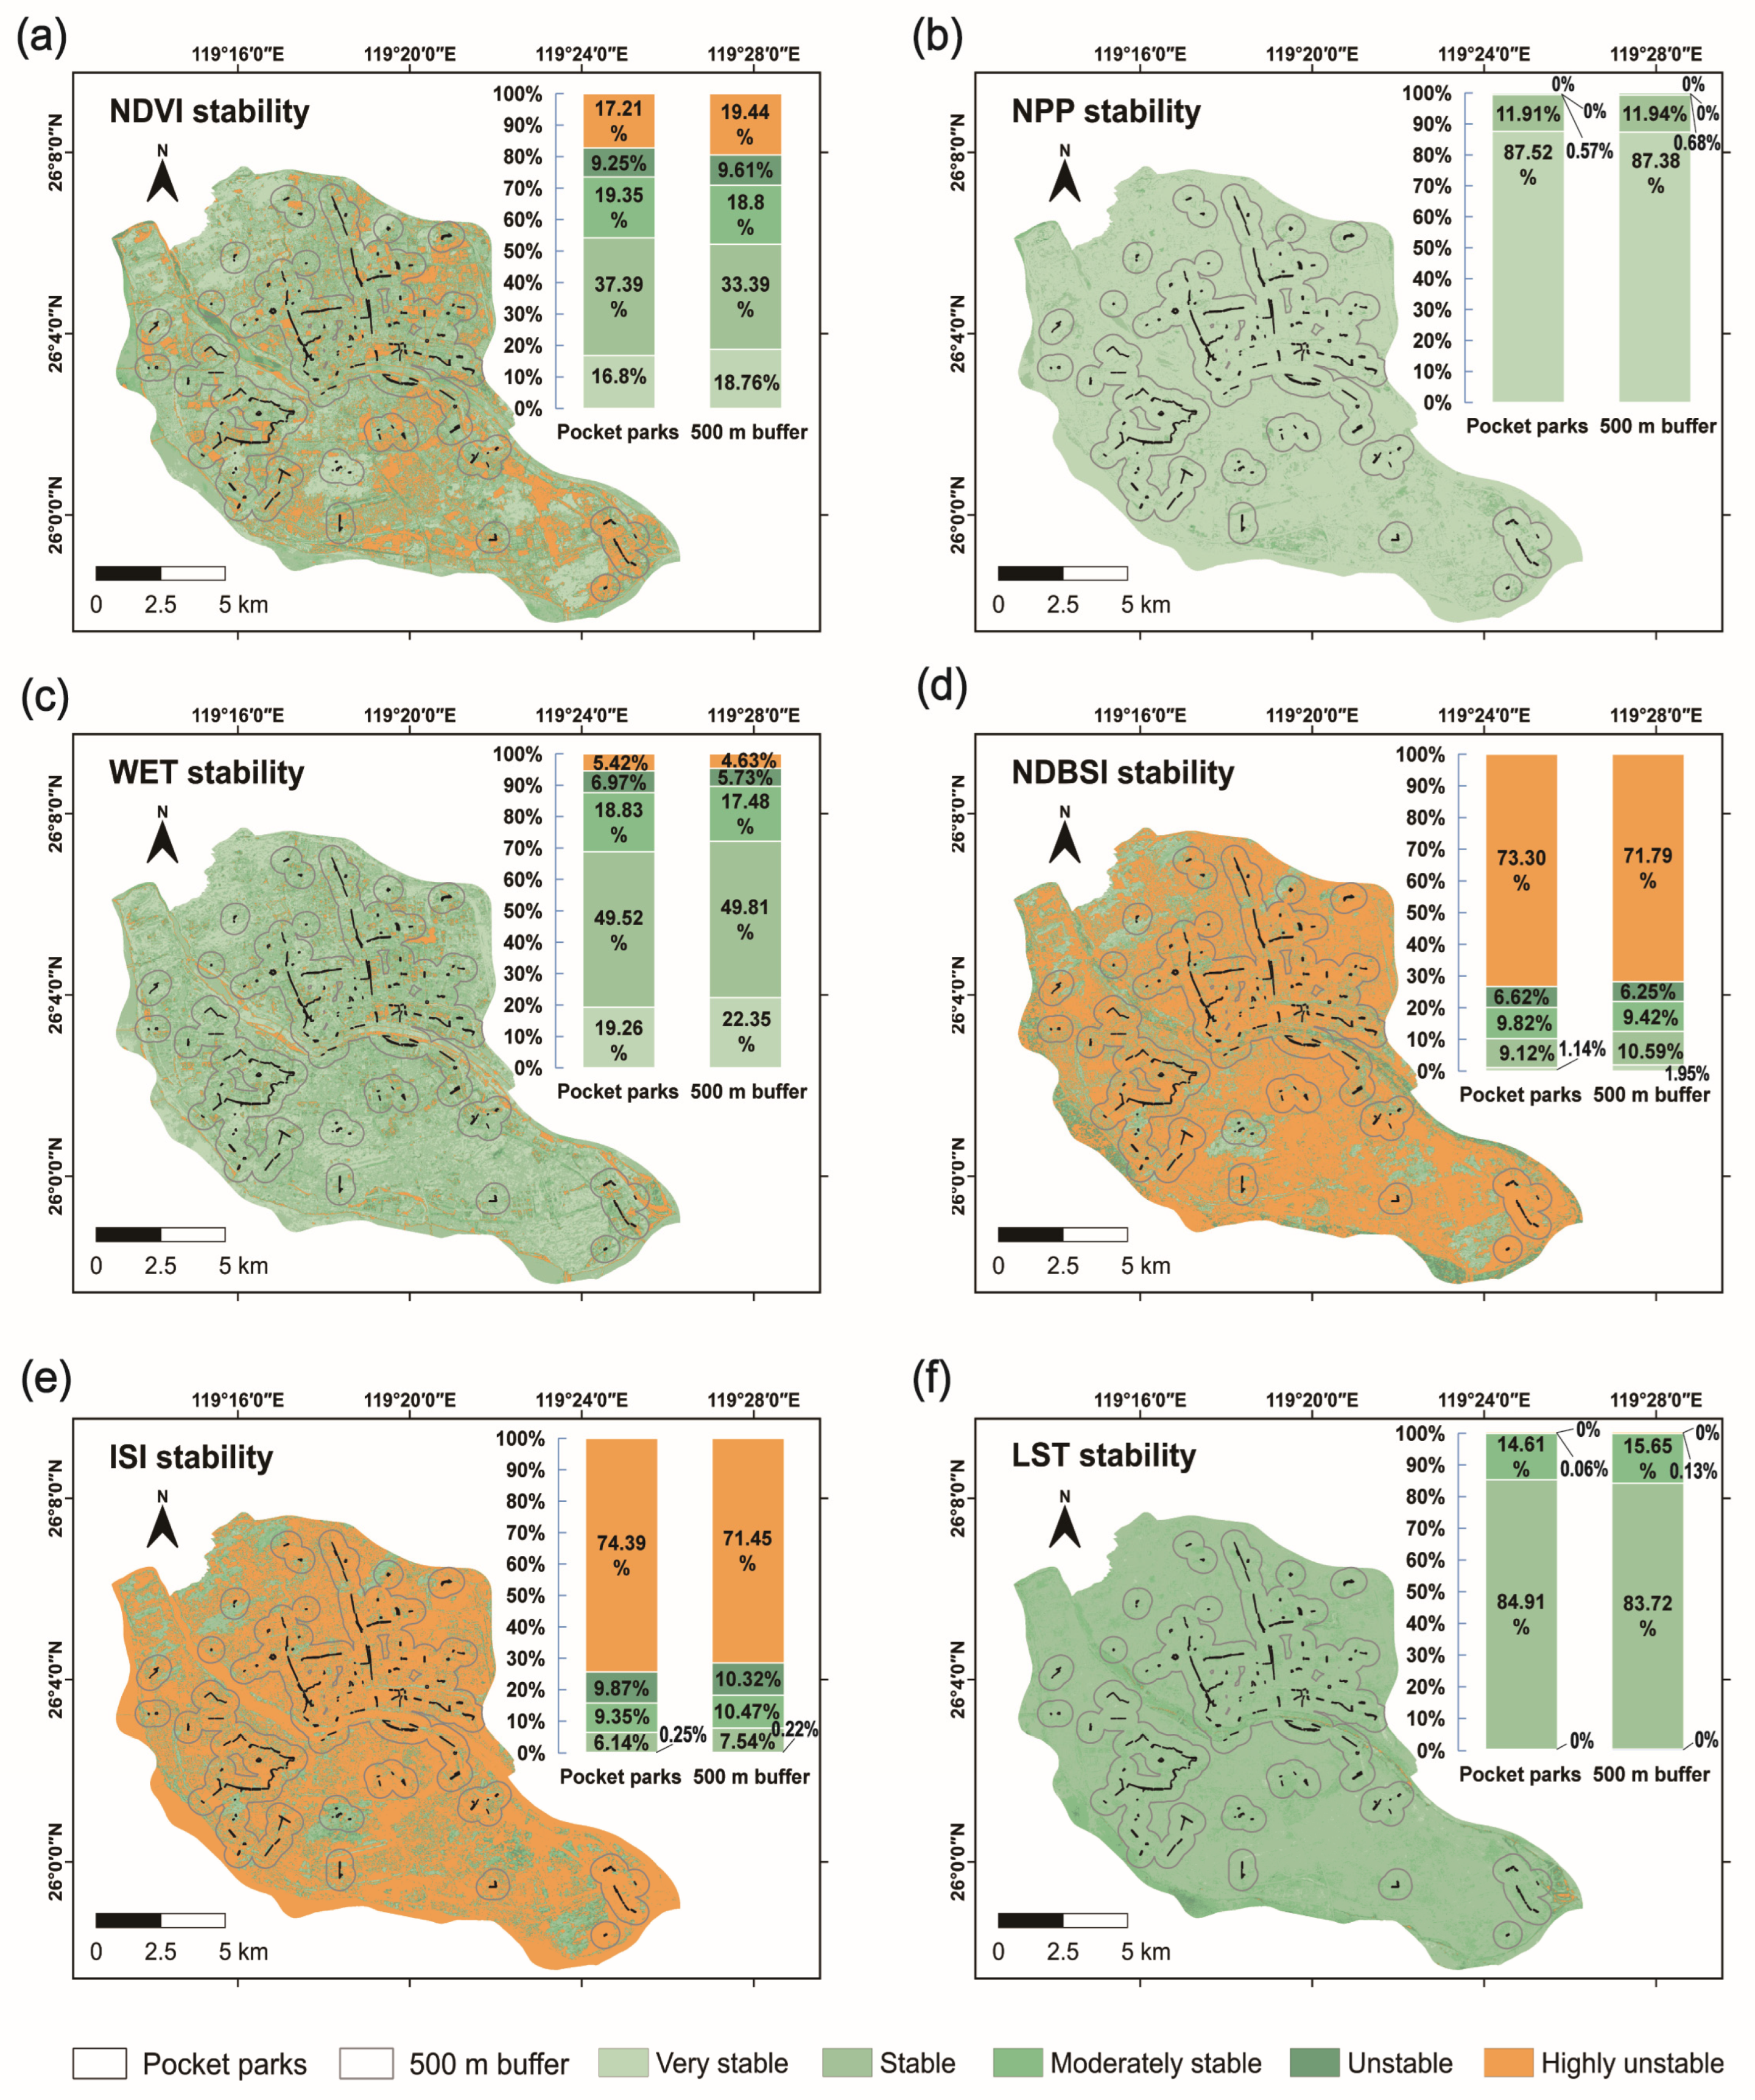
According to the coefficient of variation (CV) analysis results of remote sensing indices for Fuzhou’s pocket parks and their surrounding 500 m buffer zones from 2019 to 2024 (Figure 6), the fluctuation stability characteristics of each index are as follows: NDVI and NPP are mostly in the low-variability class, reflecting the high temporal stability of vegetation coverage and carbon sequestration capacity. WET also shows low interannual variability overall, indicating relatively stable regional moisture conditions. LST similarly exhibits strong temporal consistency, which may be related to stable vegetation coverage and urban heat island regulation. In contrast, NDBSI and ISI show relatively high interannual variability, suggesting that the built-up and bare soil index, and impervious surfaces undergo drastic interannual changes, affected by climatic factors or urban construction activities.
Figure 6.
Spatial distribution of coefficient of variation (CV) of Eco-environmental Index (EEI) indicators of pocket parks and their buffer zones in the main urban area of Fuzhou City (2019–2024): (a) NDVI; (b) NPP; (c) WET; (d) NDBSI; (e) ISI; (f) LST.
Overall, NPP, LST, and WET have high temporal stability, while NDBSI and ISI show obvious fluctuations. Pocket parks and their surrounding buffer zones exhibit similar volatility patterns across all indices, reflecting the spatial consistency of ecosystem dynamics.
3.4. Trend Analysis of Ecological Environment Quality Changes of Pocket Parks
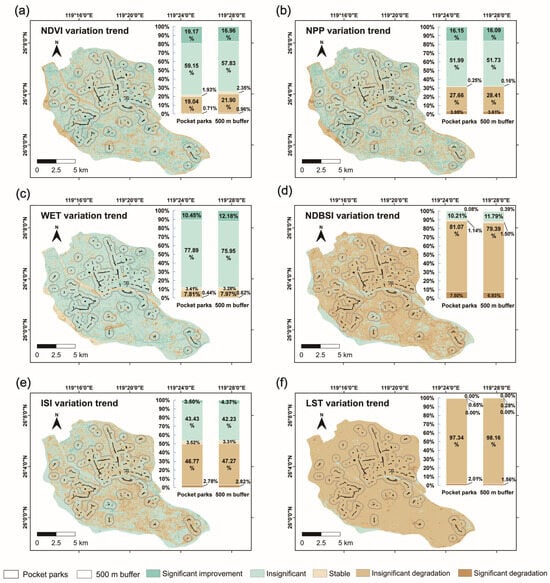
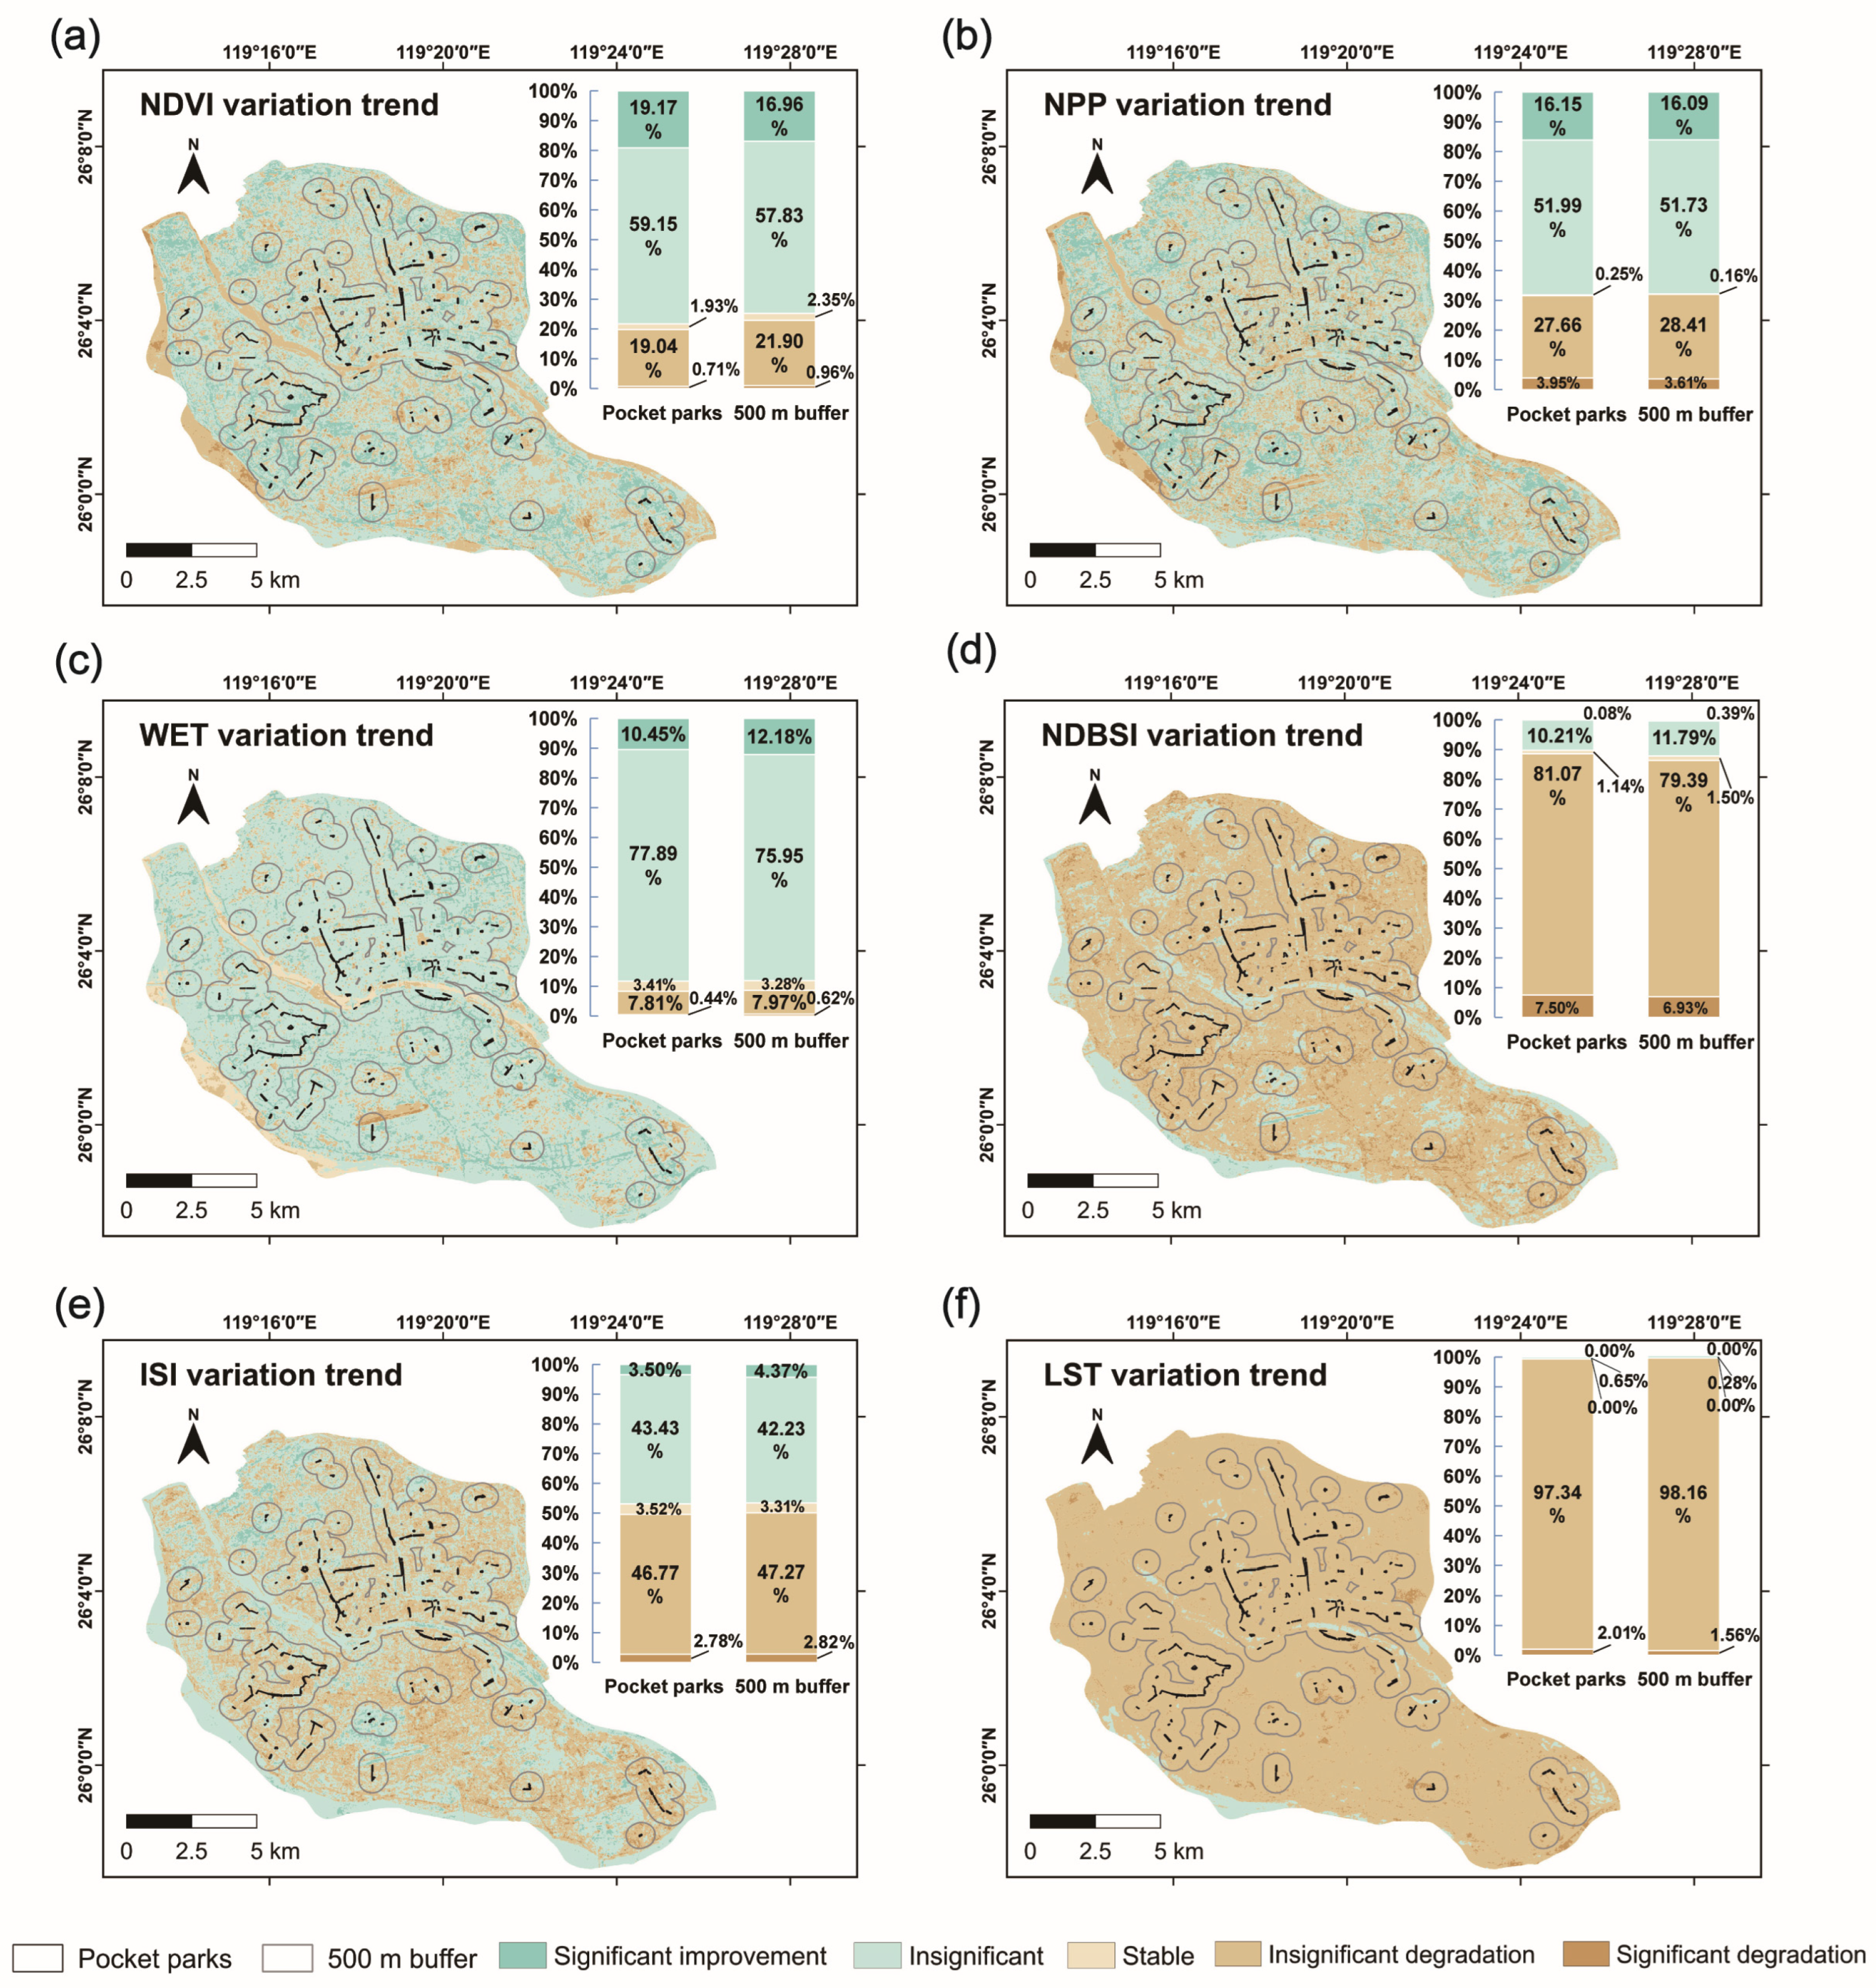
Based on the analysis results of the change trends of remote sensing indices for Fuzhou’s pocket parks and their surrounding 500 m buffer zones from 2019 to 2024 (Figure 7), it is found that the NDVI and NPP of pocket parks are mainly characterized by increases (accounting for 59.16% and 51.99%, respectively), with a certain proportion increasing (19.17% and 16.15%). In terms of practical significance (effect size), the spatially averaged NDVI within pocket parks increased significantly from 0.413 ± 0.052 (mean ± SD) in 2019 to 0.578 ± 0.061 in 2024, representing a total net increase of +0.165 over the study period. Similarly, NPP showed a net increase of +83.4 gC/m2/year. This indicates that vegetation coverage and carbon sequestration capacity generally show an upward trend, and are slightly superior to those of the buffer zones. WET is generally increasing (77.89%), indicating a weak-to-moderate improving tendency in surface/vegetation moisture conditions, although the magnitude of change is limited over the six-year period. NDBSI is dominated by a decreasing trend, indicating a reduction in built-up and bare soil coverage and an alleviation of surface dryness; the change trend of ISI is not significant, and the expansion of impervious surfaces tends to be moderate. LST generally shows a decrease (97.34%). The cooling effect is practically significant, with the mean LST decreasing from 35.10 °C in 2019 to 30.96 °C in 2024, a total reduction of approximately 4.1 °C, despite interannual climatic fluctuations. This confirms that the statistical trends shown in the maps correspond to physically meaningful changes in the thermal environment.
Figure 7.
Change trends of Eco-environmental Index (EEI) indicators of pocket parks and their buffer zones in the main urban area of Fuzhou City (2019–2024): (a) NDVI; (b) NPP; (c) WET; (d) NDBSI; (e) ISI; (f) LST.
Overall, the study area presents a positive trend in vegetation growth, carbon sequestration, humidity improvement, and alleviation of surface dryness, with a slight decrease in surface temperature, while moisture conditions show a weak improving tendency with a limited magnitude over the six-year period. The change trends of pocket parks are basically consistent with those of the surrounding buffer zones, and the ecological benefits have spatial continuity. These trend classes describe short-term signals over 2019 to 2024 and should be interpreted with caution given the limited number of annual composites.
3.5. Persistence Characteristics of Eco-Environmental Indices Based on the Hurst Exponent
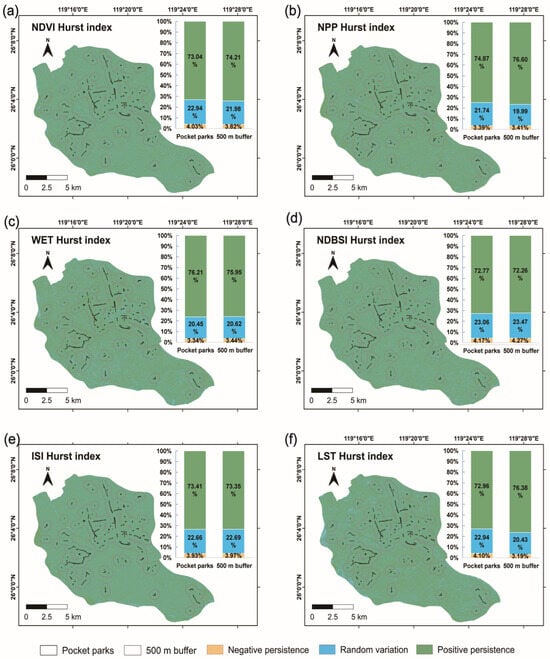
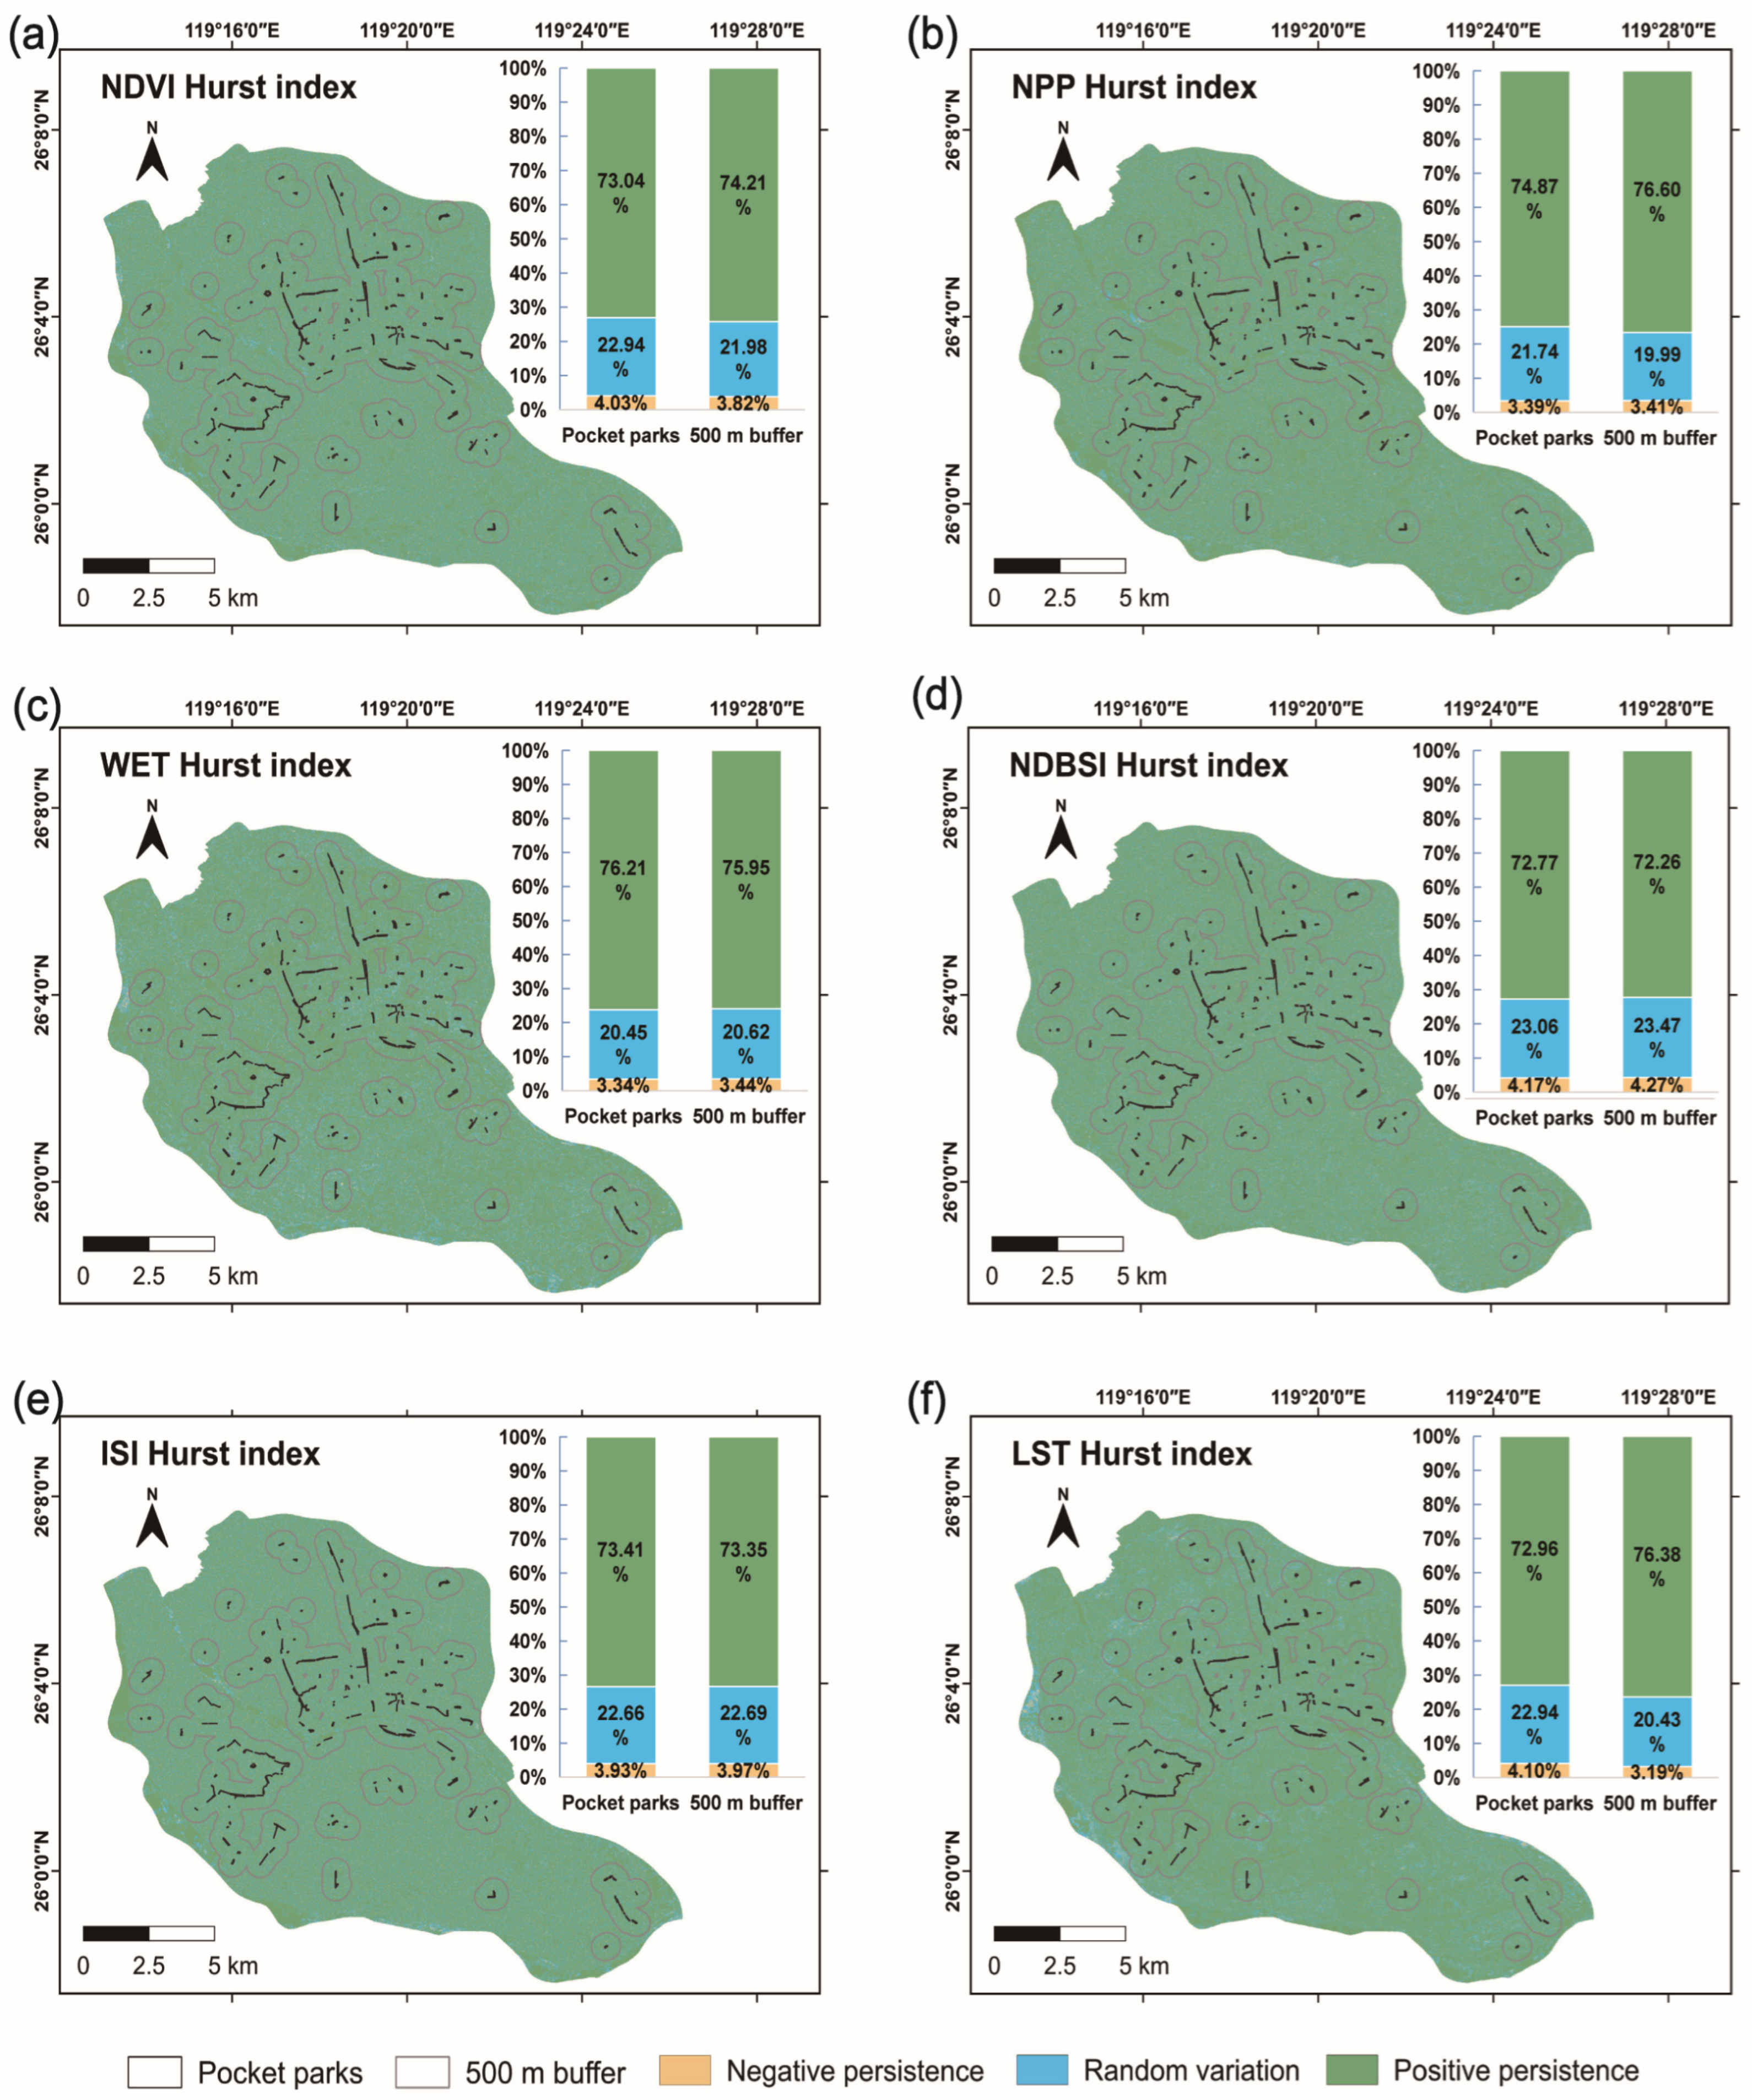
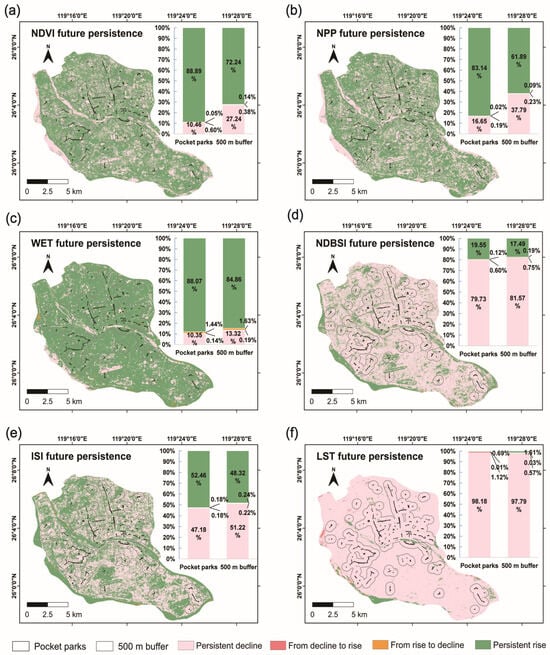
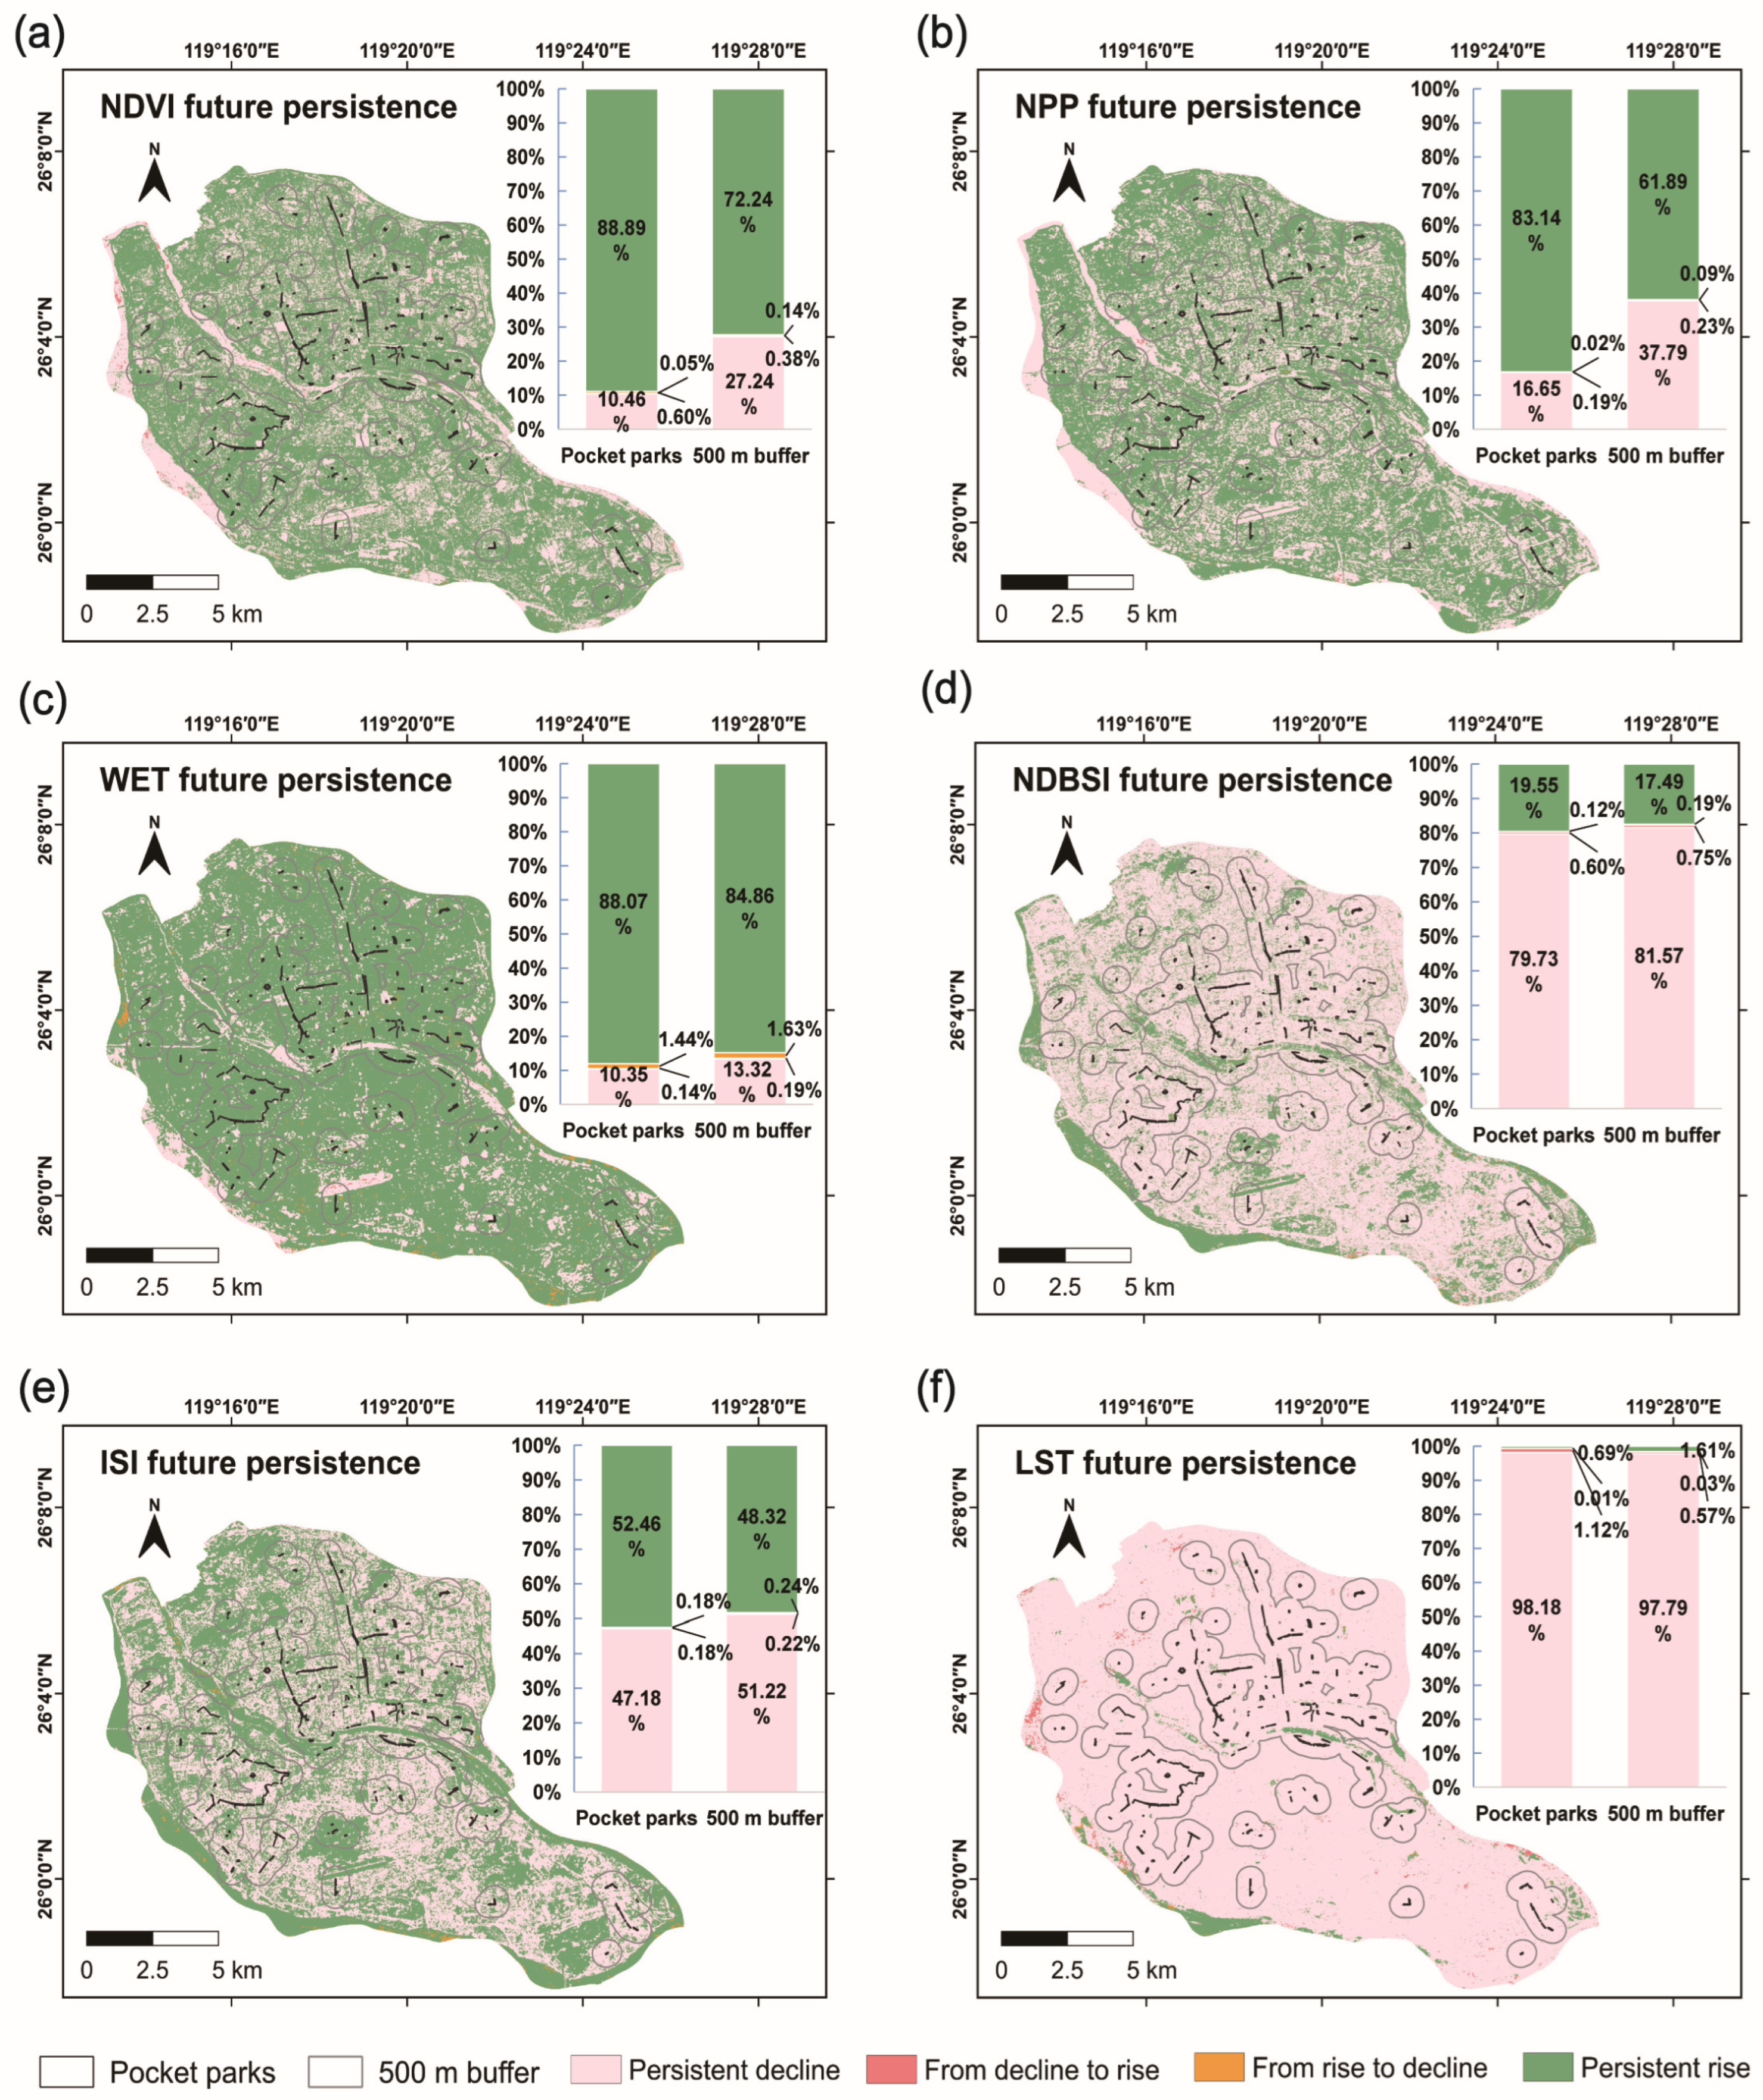
We present the Hurst-based maps as an exploratory description of short-term temporal dependence from 2019 to 2024. Hurst exponent results show that most indices in both pocket parks and buffer zones are characterized by persistence (H > 0.5), with the proportion of pixels with H > 0.5 exceeding 72% (Figure 8). This suggests that the observed short-term variations during 2019–2024 tend to exhibit temporal dependence rather than purely random fluctuations. For NDVI, NPP, WET, and ISI, the share of persistent behavior (H > 0.5) exceeds 73%, indicating relatively strong continuity in the recent interannual changes of greenness/productivity, moisture conditions, and imperviousness signals. LST shows the highest proportion of persistence in buffer zones (76.38%), implying stronger inertia in the recent thermal–environment variations. Only a small fraction of pixels show anti-persistence (H < 0.5 constitutes < 5%), suggesting limited evidence for systematic short-term reversals within the study period.
Figure 8.
Hurst exponent (H) of Eco-environmental Index (EEI) indicators of pocket parks and their buffer zones in the main urban area of Fuzhou City (2019–2024): (a) NDVI; (b) NPP; (c) WET; (d) NDBSI; (e) ISI; (f) LST.
By overlaying the Sen slope sign (β) with the Hurst exponent, the trend–persistence typology further indicates where the observed short-term trends are more likely to be persistent versus potentially reversible (Figure 9). For NDVI, NPP, and WET, a large share of areas falls into the “increasing with persistence” class (β > 0 and H > 0.5), suggesting that the recent improving tendency is more likely to be maintained if the underlying climatic and management conditions remain broadly similar. NDBSI and LST are mainly classified as “decreasing with persistence” (β < 0 and H > 0.5), indicating that the recent reductions in surface dryness and surface temperature tend to be temporally consistent during 2019–2024. For ISI, pocket parks show a slight dominance of the “increasing with persistence” class, whereas buffer zones show a weak tendency toward “decreasing with persistence”, implying contrasting recent dynamics of imperviousness signals between parks and their surroundings.
Figure 9.
Persistence characteristics of Eco-environmental Index (EEI) indicators of pocket parks and their buffer zones in the main urban area of Fuzhou City (2019–2024): (a) NDVI; (b) NPP; (c) WET; (d) NDBSI; (e) ISI; (f) LST.
Overall, Hurst-based persistence patterns suggest that many indices exhibit non-random temporal dependence over the 2019–2024 window. These findings should be interpreted as evidence of short-term persistence characteristics rather than definitive forecasts, and they mainly serve to support comparative assessment and management prioritization between pocket parks and their surrounding buffers.
3.6. Climatic Associations
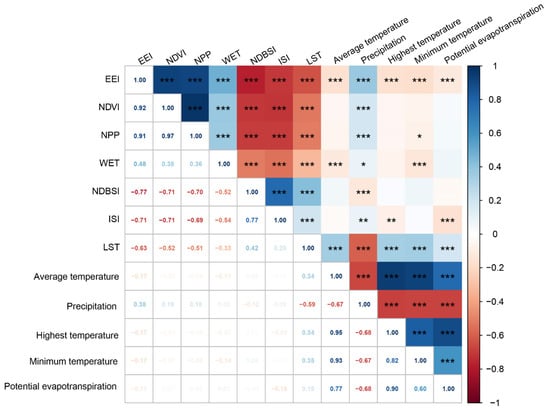
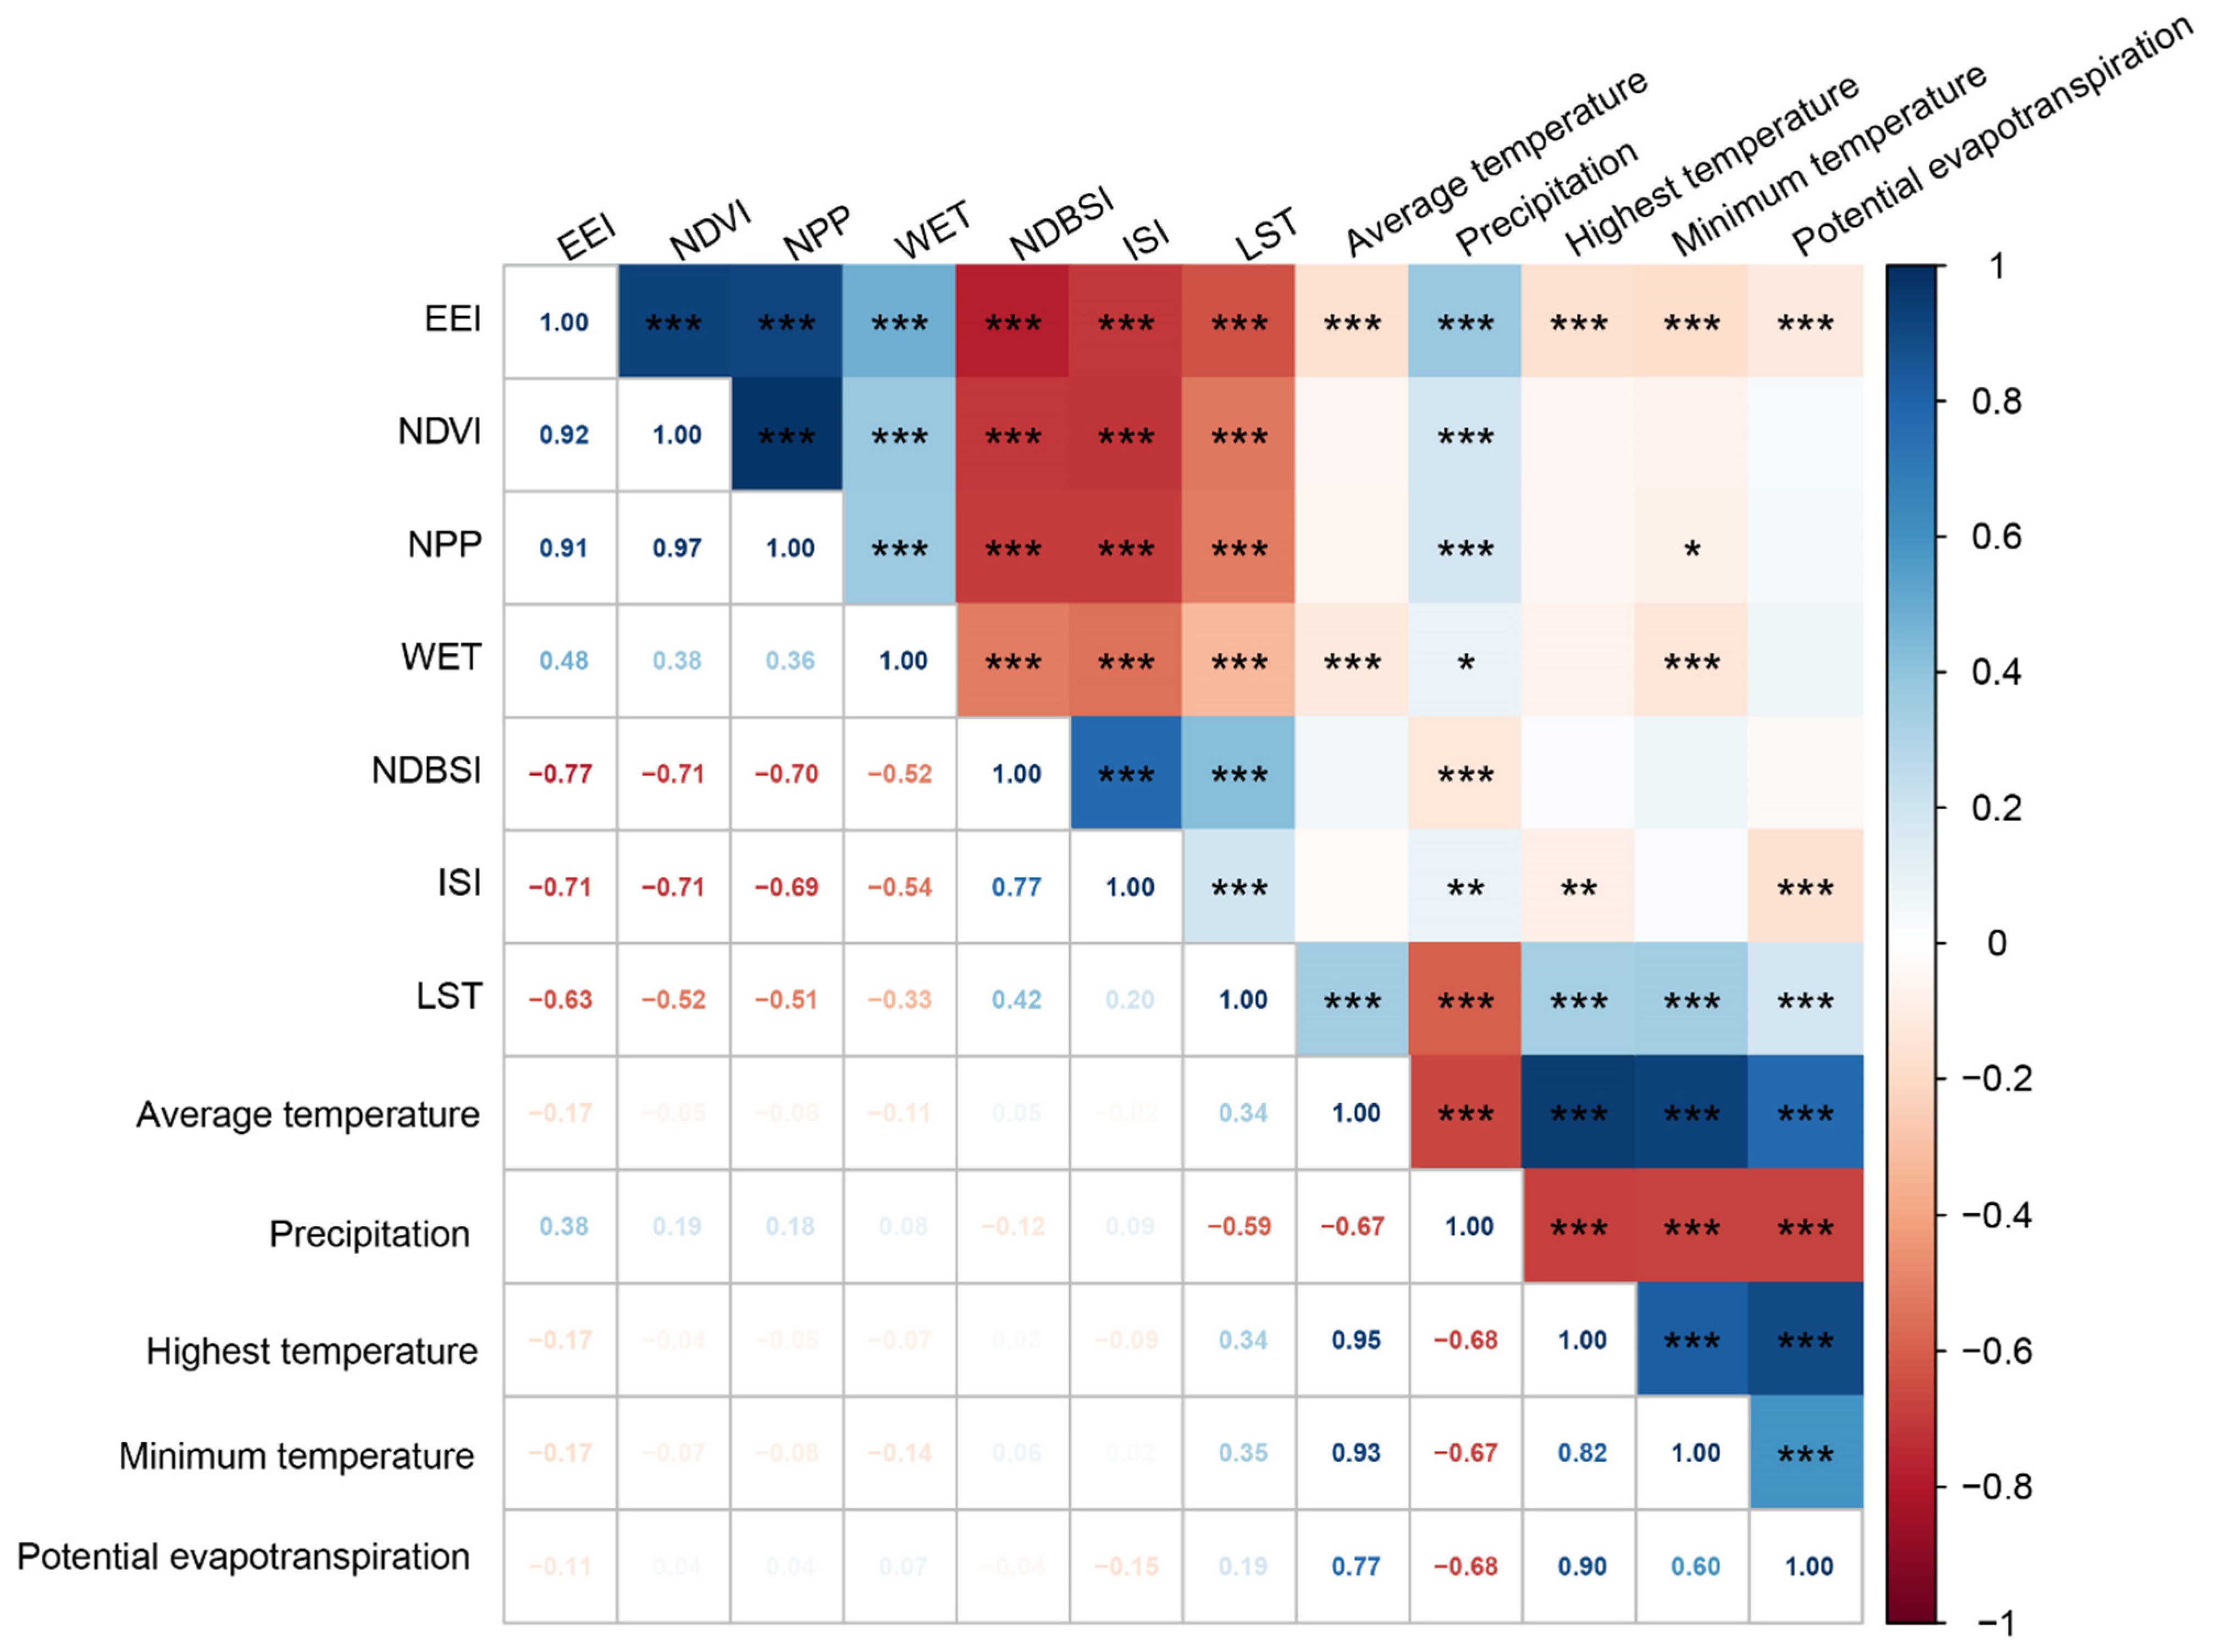
Based on the pooled park–year correlation analysis (n = 1626) between EEI/component indicators and growing season climate variables (Figure 10), the results show that both NDVI (r = 0.189, p < 0.001) and NPP (r = 0.180, p < 0.001) are positively correlated with precipitation. This suggests a positive association between precipitation and vegetation greenness and productivity. WET is significantly negatively correlated with mean air temperature (r = −0.113, p < 0.001) and minimum air temperature (r = −0.139, p < 0.001); NDBSI is negatively correlated with precipitation (r = −0.124, p < 0.001), reflecting that decreased precipitation intensifies surface dryness and the characteristics of built-up/bare soil; ISI is negatively correlated with potential evapotranspiration (r = −0.154, p < 0.001), indicating that enhanced evapotranspiration may inhibit impervious surface characteristics. LST is positively correlated with air temperature (mean, maximum, minimum) and potential evapotranspiration (r = 0.343–0.349, p < 0.001; r = 0.188, p < 0.001), while significantly negatively correlated with precipitation (r = −0.594, p < 0.001), suggesting that LST covaries with both air temperature and precipitation from 2019 to 2024.
Figure 10.
Climatic associations between EEI/component indicators and growing season climate variables (*: p < 0.05, **: p < 0.01, ***: p < 0.001).
In summary, NDVI and NPP show positive interannual covariation with precipitation, whereas WET shows negative covariation with air temperature. LST covaries positively with air temperature and negatively with precipitation from 2019 to 2024. This highlights the importance of climatic variability as a correlate of interannual changes in pocket park eco-environmental indices.
4. Discussion
4.1. Spatial Differentiation of Ecological Benefits and Ecological Functions of Pocket Parks
The results of this study indicate that the pocket parks in the main urban area of Fuzhou are consistently higher than the surrounding buffer zones in terms of vegetation coverage, carbon sequestration capacity, humidity conditions, and surface temperature, with the gaps in most indices showing an expanding trend between 2019 and 2024. This spatial differentiation pattern confirms that pocket parks, as urban green infrastructure, exert positive ecological effects in high-density built-up areas. Such differentiation may stem from two factors: on the one hand, through targeted vegetation configuration and impervious surface minimization design, pocket parks directly enhance vegetation coverage and ecological humidity within the parks [26]; on the other hand, the transpiration and shading effects of the vegetation communities inside the parks jointly reduce surface temperature, forming local “cold islands” [7]. Notably, the NPP of the pocket parks is higher than that of the surrounding areas, with the gap continuously widening. This suggests that despite their limited area, the efficient vegetation configuration and professional maintenance of the pocket parks may promote the optimization of carbon sequestration capacity per unit area. The spatial differentiation of such ecological benefits confirms that even at small scales within cities, the boundary effect of ecological functions remains significant, supporting the theoretical framework of “patchy green infrastructure”—that is, radiating the surrounding areas through point-like ecological nodes to gradually form a networked ecological pattern [27]. The widening contrasts between parks and buffers likely reflect two concurrent processes. Within parks, vegetation establishment, canopy maturation, and routine maintenance can progressively enhance greenness, moisture status, and cooling. In surrounding buffers, continued densification and surface sealing can increase built up signals and thermal load. Under this combination, park improvements can occur together with stagnation or deterioration in the surrounding urban matrix, which increases park buffer differences even when the absolute magnitude of change is moderate.
4.2. Dynamic and Persistence Characteristics of Pocket Park Ecological Benefits
Coefficient of variation (CV) analysis shows that NDVI, NPP, and LST exhibit high temporal stability, while NDBSI and ISI fluctuate significantly. This difference reflects inherent variations in the response mechanisms of different ecological processes to environmental changes. The stability of NDVI and NPP may stem from the relatively stable hydrothermal conditions under Fuzhou’s subtropical monsoon climate, as well as the regular maintenance and management of pocket parks, which ensure the continuous growth of vegetation and carbon sequestration [28]. Notably, the strong temporal consistency of LST may be related to the stability of the urban heat island. Although the temperature inside pocket parks is consistently lower than that of the surrounding areas, the regional climatic background and the nature of the urban underlying surface jointly maintain a relatively stable thermal environment pattern, reflecting the buffering effect of dense vegetation on temperature fluctuations [29]. The high volatility of NDBSI and ISI reveals the strong interference of urban construction activities on surface properties. Land use transformation—specifically the implementation of park renewal projects—is a critical non-climatic driver. The distinct “step increase” in EEI observed around 2022 (Figure 3) likely reflects the municipal government’s intensified “pocket park construction” campaign, which transformed vacant or degraded lands into actively managed green spaces. This indicates that the positive trends are driven not only by natural vegetation maturation but also by anthropogenic land use optimization [30].
Trend analysis combined with the Hurst exponent suggests that the recent (2019–2024) improvements in several eco-environmental indicators are accompanied predominantly by persistent temporal dependence (H > 0.5). Rather than serving as deterministic “future predictions”, the Hurst results are used here to describe whether observed short-term changes tend to be self-consistent (persistent) or may be less self-consistent (anti-persistent) during the study period. The dominance of the “increasing with persistence” class for NDVI, NPP, and WET, together with the “decreasing with persistence” class for LST and NDBSI, is consistent with the policy context of continuous investment and management optimization under Fuzhou’s “City of a Thousand Gardens” initiative. Nevertheless, given the short six-year record, persistence interpretations should be considered conditional on broadly stable climatic and management drivers and should be re-evaluated when longer time series become available [31]. Pocket parks also show a stronger improving tendency in moisture-related conditions than surrounding buffers, which may be associated with targeted management (e.g., irrigation scheduling and plant selection) during the growing season [32]. The step increases in EEI around 2022 merit additional interpretation. A plausible explanation is accelerated construction and upgrading of pocket parks, which can quickly increase vegetation cover and reduce surface temperature once planting is completed. An alternative explanation is interannual climate variability, especially changes in precipitation and cloud conditions during the growing season, which can affect NDVI, WET, and LST simultaneously. Because the present study uses observational remote sensing and correlation-based climate associations, it cannot separate management effects from climatic influences. Future work could integrate project-level construction records, maintenance schedules, or quasi-experimental designs to test whether policy implementation produced a measurable discontinuity in eco-environmental indicators.
4.3. Regulatory Mechanisms of Climatic Factors on the Ecological Benefits of Pocket Parks
The correlation analysis suggests that interannual variability in climatic conditions is associated with changes in the eco-environmental indices of pocket parks. The positive correlations between precipitation and both NDVI and NPP are consistent with the expectation that water availability can constrain vegetation greenness and productivity in subtropical urban environments [33]. The strong correlations of LST with air temperature and precipitation (especially r = −0.594 with precipitation) reveal the complex formation mechanism of the urban thermal environment. On the one hand, air temperature directly determines the thermal environment background; on the other hand, higher precipitation can coincide with lower LST through multiple pathways, including higher evaporative cooling and higher vegetation cover. These pathways are plausible but are not isolated in the present correlation analysis. This pattern suggests that changes in precipitation and temperature may both contribute to interannual LST variability, although their effects cannot be separated from concurrent land cover and management changes [34]. The negative correlations between WET and air temperature suggest that higher temperatures increase atmospheric evaporative demand and may reduce surface and vegetation moisture. Moreover, the response of humidity conditions inside pocket parks to climate change is relatively moderate, which further confirms the climate adaptation function of green infrastructure [35]. The negative correlation between potential evapotranspiration and ISI may reflect covariation in the surface energy balance. Areas with higher evapotranspiration often have more vegetation and less impervious cover. This complex coupling relationship indicates that the climate response mechanism of urban ecosystems is far from a simple causal relationship, but a nonlinear system with multiple factors interacting [36]. The correlation analysis is based on pooled park year observations and describes covariation rather than causation. Repeated measurements for the same park across years can also induce dependence among observations. Future analyses could apply mixed effects models with park-specific random effects, or conduct year-level analyses, to test whether the reported associations are robust under alternative statistical assumptions.
4.4. Limitations and Implications
Our analysis has several limitations. First, although we used downscaling techniques to generate 10 m NPP and LST products, the source thermal data (Landsat, 100 m resampled to 30 m) and productivity data (MODIS, 500 m) are coarse relative to the size of the smallest pocket parks (400 m2). The “mixed pixel” effect cannot be entirely eliminated. Therefore, the absolute values for the smallest parks should be interpreted with caution, and the results are more robust for identifying trends and relative differences than for precise absolute quantification. Due to the lack of in situ measurements within pocket parks, we could not perform ground-truth validation for downscaled NPP and LST. We therefore conducted scale-consistency checks by aggregating the 10 m downscaled products back to the native resolutions of the source datasets (MODIS NPP and Landsat LST) and reporting agreement metrics; nevertheless, uncertainties may remain in absolute values. Second, because Fuzhou’s pocket park program is relatively recent, our analysis covers only 2019–2024 (i.e., six growing seasons). This short temporal span reduces the power of statistical trend tests and limits inference about long-term persistence; accordingly, our conclusions emphasize relative contrasts (pocket parks vs. 500 m buffers) and short-term trend directions rather than long-horizon predictions. The pixel-level trend and Hurst classifications should also be interpreted as descriptive maps of spatial heterogeneity. They can be affected by residual noise in annual composites and by differences between the sensors used for different indicators. In particular, Hurst exponent estimates can be sensitive to short record lengths; therefore, our Hurst-based classifications are presented as exploratory evidence of persistence/anti-persistence in the observed short-term variations, not as long-horizon forecasts. Meanwhile, the dataset contains substantial cross-sectional information—271 pocket parks observed each year (i.e., up to 1626 park–year samples for park-level summaries)—that supports robust spatial comparisons and improves the stability of annual estimates, even though the number of years is limited. Third, the correlation analysis reveals associations with climate, but we could not strictly control for management interventions (irrigation, fertilization) or surrounding urban development. The observed improvements are likely a combined result of vegetation growth, human management, and climatic variability.
Our analysis provided policy implications for territorial spatial ecological planning in high-density cities: (1) Strengthen the networked layout of pocket parks: Priority should be given to the systematic construction of pocket parks in urban “gray” areas with weak ecological benefits. By building a “pearl-stringed” green space system, the overall cold island, carbon sequestration, and humidification effects can be maximized. (2) Implement differentiated management and protection strategies: For areas with high stability of ecological environment quality, further improve their functions through plant community optimization; for areas with high volatility, strengthen drought-resistant emergency management such as irrigation facilities to enhance the climate resilience of parks. For the small number of parks that showed declining EEI, on-site checks are recommended to identify potential causes such as construction disturbance, canopy loss, or irrigation constraints. (3) Incorporate trend–persistence typologies into planning considerations: Provide longer-term protection and consolidation for areas showing sustained improvement signals, and prioritize ecological investment and maintenance in locations with positive trends and predominantly persistent behavior, while monitoring areas characterized by anti-persistence that may be more prone to short-term reversals.
This study extends urban green space assessment to the pocket park scale, which is often underrepresented in city-wide ecological evaluations that emphasize larger parks or broad land cover classes. The consistent park–buffer contrasts and the widespread increase in EEI highlight the potential of distributed micro green spaces to deliver measurable ecological benefits in dense urban environments. These results support planning strategies that integrate pocket parks as complementary nodes within urban green infrastructure networks, especially in areas where land availability constrains the creation of large parks. Furthermore, the evaluation framework proposed in this study—based on open-access remote sensing data (Sentinel-2, Landsat, MODIS) and the GEE cloud platform—possesses high transferability. It can be readily generalized to other high-density cities worldwide to facilitate the rapid, low-cost monitoring of small and micro green spaces, serving as a scalable tool for urban ecological management.
5. Conclusions
Based on multi-source remote sensing data and time series analysis methods from 2019 to 2024, this study systematically explored the spatiotemporal variation characteristics and climatic associations of the ecological environment quality of pocket parks in the main urban area of Fuzhou. The main conclusions are as follows: Pocket parks function as local ecological hotspots, with higher greenness, productivity, and wetness, and a lower land surface temperature than surrounding built-up areas. At the park level, EEI increased in 261 of 271 pocket parks from 2019 to 2024, indicating that the improvement was broadly shared across sites. EEI also showed a step increase around 2022, which temporally coincides with indicator-level improvements and reported greening and upgrading activities, although causal attribution requires additional evidence. Meanwhile, most ecological environment indices show positive improvement trends, indicating an overall positive development of ecological quality in the study area. Furthermore, most of the currently observed positive trends are accompanied by predominantly persistent Hurst characteristics (H > 0.5) within 2019–2024, suggesting that, within 2019–2024, these improvements are accompanied predominantly by persistent temporal dependence rather than purely random interannual fluctuations. However, given the six-year record, any inference about long-term persistence should be treated as conditional and requires longer time series for confirmation. Precipitation and air temperature were consistently associated with interannual variability in several indicators, highlighting the importance of water-related management under climate variability.
Author Contributions
Conceptualization, H.L. and W.S.; methodology, H.L. and C.Q.; validation, H.L. and C.Q.; formal analysis, H.L. and C.Q.; investigation, H.L., C.Q., X.C., and S.W.; writing—original draft preparation, H.L., C.Q., X.C. and S.W.; writing—review and editing, H.L. and W.S.; visualization, H.L., C.Q., X.C. and S.W.; supervision, W.S.; project administration, W.S.; funding acquisition, W.S. All authors have read and agreed to the published version of the manuscript.
Funding
This study was supported by the project “Analysis of the Implementation Effectiveness of Territorial Spatial Planning” from the Department of Natural Resources of Fujian Province.
Data Availability Statement
Data are contained within the article.
Acknowledgments
Thank you for the support of the “Coastal Zone Ecological Environment Big Data and Decision Support University Science and Technology Innovation Team”.
Conflicts of Interest
The authors declare no conflicts of interest.
References
- Wang, Z.B.; Liang, L.W.; Sun, Z.; Wang, X.M. Spatiotemporal differentiation and the factors influencing urbanization and ecological environment synergistic effects within the Beijing-Tianjin-Hebei urban agglomeration. J. Environ. Manag. 2019, 243, 227–239. [Google Scholar] [CrossRef] [Scilit]
- Paudel, S.; States, S.L. Urban green spaces and sustainability: Exploring the ecosystem services and disservices of grassy lawns versus floral meadows. Urban For. Urban Green. 2023, 84, 127932. [Google Scholar] [CrossRef] [Scilit]
- Dong, J.; Guo, R.A.; Guo, F.; Guo, X.M.; Zhang, Z. Pocket parks-a systematic literature review. Environ. Res. Lett. 2023, 18, 083003. [Google Scholar] [CrossRef] [Scilit]
- Rosso, F.; Pioppi, B.; Pisello, A.L. Pocket parks for human-centered urban climate change resilience: Microclimate field tests and multi-domain comfort analysis through portable sensing techniques and citizens’ science. Energy Build. 2022, 260, 111918. [Google Scholar] [CrossRef] [Scilit]
- Motazedian, A.; Coutts, A.M.; Tapper, N.J. The microclimatic interaction of a small urban park in central Melbourne with its surrounding urban environment during heat events. Urban For. Urban Green. 2020, 52, 126688. [Google Scholar] [CrossRef] [Scilit]
- Ma, D.; Wang, Y.; Zhou, D.; Zhu, Z. Cooling effect of the pocket park in the built-up block of a city: A case study in Xi’an, China. Environ. Sci. Pollut. Res. 2022, 30, 23135–23154. [Google Scholar] [CrossRef] [Scilit]
- Jiao, M.; Zhou, W.Q.; Zheng, Z.; Wang, J.; Qian, Y.G. Patch size of trees affects its cooling effectiveness: A perspective from shading and transpiration processes. Agric. For. Meteorol. 2017, 247, 293–299. [Google Scholar] [CrossRef] [Scilit]
- Yao, X. How can urban parks be planned to mitigate urban heat island effect in “Furnace cities” ? An accumulation perspective. J. Clean. Prod. 2022, 330, 129852. [Google Scholar] [CrossRef] [Scilit]
- Wang, L.; Wang, W.J.; Tang, F.; Xu, H.Q. Optimizing urban park cooling effects requires balancing morphological design and landscape structure. Sci. Rep. 2025, 15, 15435. [Google Scholar] [CrossRef] [Scilit]
- Li, J.Y. Exploring the integrating factors and size thresholds affecting cooling effects in urban parks: A diurnal balance perspective. Sustain. Cities Soc. 2025, 126, 106386. [Google Scholar] [CrossRef] [Scilit]
- Chai, Z.Q.; Wen, K.Y.; Fu, H.; Liu, M.X.; Shi, Q. Time-series urban green space mapping and analysis through automatic sample generation and seasonal consistency modification on Sentinel-2 data: A case study of Shanghai, China. Sci. Remote Sens. 2025, 11, 100215. [Google Scholar] [CrossRef] [Scilit]
- Gorelick, N. Google Earth Engine: Planetary-scale geospatial analysis for everyone. Remote Sens. Environ. 2017, 202, 18–27. [Google Scholar] [CrossRef] [Scilit]
- Ding, Y.; Chen, G.Z. Assessment of Ecological Environment Quality and Analysis of Its Driving Forces in the Dabie Mountain Area of Anhui Province Based on the Improved Remote Sensing Ecological Index. Sustainability 2025, 17, 6198. [Google Scholar] [CrossRef] [Scilit]
- Zhang, S.B. Bilateral coupling relationships between vegetation NDVI and multi-depth soil moisture in the Mongolian Plateau. Int. J. Digit. Earth 2025, 18, 2532774. [Google Scholar] [CrossRef] [Scilit]
- Chen, Y.T.; Liu, A.B.; Cheng, X. Landsat-Based Monitoring of Landscape Dynamics in Arctic Permafrost Region. J. Remote Sens. 2022, 2022, 9765087. [Google Scholar] [CrossRef] [Scilit]
- Shi, T.T.; Xu, H.Q. Derivation of Tasseled Cap Transformation Coefficients for Sentinel-2 MSI At-Sensor Reflectance Data. IEEE J. Sel. Top. Appl. Earth Obs. Remote Sens. 2019, 12, 4038–4048. [Google Scholar] [CrossRef] [Scilit]
- Amindin, A. Leveraging GEE and machine learning algorithm in dynamic modeling of eco-environmental quality. Environ. Sustain. Indic. 2025, 27, 100818. [Google Scholar] [CrossRef] [Scilit]
- Qiu, R.H.; Zhan, Q.M.; Tu, S.Q. Long-term global trends and influencing factors of surface urban cool and heat islands. Int. J. Digit. Earth 2025, 18, 2489731. [Google Scholar] [CrossRef] [Scilit]
- He, Y.; Cao, S.P.; Zhu, Q.; Ding, Y.J.; Guo, Y. Assessing spatiotemporal consistency of vegetation productivity indicators (SIF, GPP, NPP) in northwest China: Climate and vegetation perspectives. GIscience Remote Sens. 2025, 62, 2573536. [Google Scholar] [CrossRef] [Scilit]
- Guedouh, M.S.; Youcef, K.; Hadji, R. Public Garden Environmental Factors Impact on Land Surface Temperatures of the Adjacent Urban Areas in an Arid Region. Urban Sci. 2025, 9, 391. [Google Scholar] [CrossRef] [Scilit]
- Samra, R.M.A. How Urban Green Spaces Shape Unequal Cooling in Rapidly Urbanizing Egypt: Insights from Landsat and GEE Analysis. Earth Syst. Environ. 2025, 9, 605–624. [Google Scholar] [CrossRef] [Scilit]
- Onacillová, K. Combining Landsat 8 and Sentinel-2 Data in Google Earth Engine to Derive Higher Resolution Land Surface Temperature Maps in Urban Environment. Remote Sens. 2022, 14, 4076. [Google Scholar] [CrossRef] [Scilit]
- He, J.L. Spatiotemporal dynamics and driving mechanism of eco-environmental quality in piedmont-oasis-desert ecotone based on long-term harmonized remote sensing ecological index- take Korla—Tiemenguan oasis in Xinjiang as an example. Environ. Sustain. Indic. 2025, 26, 100611. [Google Scholar] [CrossRef] [Scilit]
- Li, P.; He, L.; Wang, X.T.; Ding, E.R.; Yu, Q. How reliable are long time-series reanalysis and model-based soil moisture products for agricultural soil water stress monitoring? Insights from a five-dataset evaluation across China. Agric. Water Manag. 2025, 320, 109845. [Google Scholar] [CrossRef] [Scilit]
- Fu, F. Spatiotemporal variations of fractional vegetation cover and its response to topography on the Loess Plateau of China from 1995 to 2024. Geomat. Nat. Hazards Risk 2025, 16, 2543455. [Google Scholar] [CrossRef] [Scilit]
- Pattnaik, N.; Rahman, M.A.; Pauleit, S. Urban vegetation structure and composition influence pedestrian thermal comfort in public spaces: A case study in Munich. Urban For. Urban Green. 2025, 114, 129162. [Google Scholar] [CrossRef] [Scilit]
- Liu, Y.; Kwan, M.P.; Zheng, L.W.; Wang, J.Y. Decomposing discrete effective buffer sizes for residential green space exposure measures: Insights from urban green space fragments. Urban For. Urban Green. 2025, 113, 129122. [Google Scholar] [CrossRef] [Scilit]
- Qi, G.Z. Soil moisture plays an increasingly important role in constraining vegetation productivity in China over the past two decades. Agric. For. Meteorol. 2024, 356, 110193. [Google Scholar] [CrossRef] [Scilit]
- Lin, H. Forests buffer thermal fluctuation better than non-forests. Agric. For. Meteorol. 2020, 288, 107994. [Google Scholar] [CrossRef] [Scilit]
- Elliot, T.; Almenar, J.B.; Rugani, B. Modelling the relationships between urban land cover change and local climate regulation to estimate urban heat island effect. Urban For. Urban Green. 2020, 50, 126650. [Google Scholar] [CrossRef] [Scilit]
- Liu, S. Terrain or climate factor dominates vegetation resilience? Evidence from three national parks across different climatic zones in China. For. Ecosyst. 2024, 11, 100212. [Google Scholar] [CrossRef] [Scilit]
- Biella, P. Biodiversity-friendly practices to support urban nature across ecosystem levels in green areas at different scales. Urban For. Urban Green. 2025, 105, 128682. [Google Scholar] [CrossRef] [Scilit]
- Guidolotti, G. Impact of drought on cooling capacity and carbon sequestration in urban green area. Urban Clim. 2025, 59, 102244. [Google Scholar] [CrossRef] [Scilit]
- Zou, F.L.; Li, H.D.; Hu, Q.W. Responses of vegetation greening and land surface temperature variations to global warming on the Qinghai-Tibetan Plateau, 2001–2016. Ecol. Indic. 2020, 119, 106867. [Google Scholar] [CrossRef] [Scilit]
- Egerer, M. Urban oases: The social-ecological importance of small urban green spaces. Ecosyst. People 2024, 20, 2315991. [Google Scholar] [CrossRef] [Scilit]
- Hong, G.; Liu, S.J.; Liu, W.P.; Wu, X.F. Nonlinear trade-off relationship and critical threshold between ecosystem services and climate resilience for sustainable urban development. Sustain. Cities Soc. 2024, 103, 105253. [Google Scholar] [CrossRef] [Scilit]

Disclaimer/Publisher’s Note: The statements, opinions and data contained in all publications are solely those of the individual author(s) and contributor(s) and not of MDPI and/or the editor(s). MDPI and/or the editor(s) disclaim responsibility for any injury to people or property resulting from any ideas, methods, instructions or products referred to in the content. |
© 2026 by the authors. Licensee MDPI, Basel, Switzerland. This article is an open access article distributed under the terms and conditions of the Creative Commons Attribution (CC BY) license.