Abstract
Old-growth forests provide a key biodiversity reservoir due to their high amount of deadwood and abundance of tree-related microhabitats (TreMs). This research investigates the abundance and diversity of deadwood and TreMs in old-growth Caledonian pine forests located in the Cairngorms National Park, Scotland. The study area is a Scots pine (Pinus sylvestris L.)-dominated forest. A field survey campaign was conducted in 15 sample plots to collect data on stand and deadwood characteristics, and TreMs by category. Within circular plots of 531 m2, the diameter at breast height, height, and insertion height of the canopy of all the living trees were measured, and the three deadwood components (snags, fallen deadwood, and stumps) and TreMs were recorded. The results showed a total deadwood volume of 37.53 ± 32.39 m3 ha−1, mostly in the form of snags (68.9% of total volume) and in the lowest degree of decay (first decay class equals 36.8%). The average number of deadwood elements is 217 ha−1, distributed to 127 snags ha−1, 64 fallen deadwood ha−1, and 26 stumps ha−1. The results showed an average of 89.1 TreMs ha−1 on snags and 26.4 ha−1 on living trees. The abundance and diversity of TreMs are significantly related to the volume of snags (R2 = 0.712), the deadwood diversity (R2 = 0.664), and the degree of decomposition (R2 = 0.416).
1. Introduction
In the literature, many definitions of old-growth forests exist, but the description of the key elements that characterize an old-growth forest is often ambiguous [1]. Several definitions of old-growth forests represent them as complex dynamic systems, using multiple criteria classifiable as structural, successional, and biogeochemical [2]. A common element reported in definitions is that these forests are relatively old and undisturbed by human activity [3] or are characterized by a high degree of naturalness [4]. Old-growth forests are complex ecosystems that differentiate them from other forests by some attributes, such as tree size, age, tree mortality regime, tree species composition, number of canopy layers, complex ecological relationships, high spatial heterogeneity, and amount of deadwood [5]. Based on these attributes, old-growth forests are considered important ecosystems for the conservation of habitat, species, and genetic biodiversity [6].
Considering the presence of deadwood, its abundance alone is not an universal indicator of “pure naturalness”. In many fire-adapted conifer systems, prolonged anthropogenic fire exclusion has interrupted historically frequent, low to moderate severity fire regimes, allowing fuels—and thus deadwood—to accumulate beyond their historic range of variability. A recent continent-scale dendrochronological synthesis demonstrates that, despite recent increases in area burned, a widespread fire deficit persists across diverse North American forests, when compared to pre 1880 baselines. The fire deficit underscores that contemporary deadwood loads in frequent fire systems can reflect suppression legacies rather than intact natural processes [7]. Classic analyses of frequent fire old-growth landscapes similarly highlight fire as a keystone ecological process that maintains open structures, regulates fuel continuity, and sustains habitat heterogeneity—conditions incompatible with chronically high deadwood accumulation [8].
This perspective is particularly relevant to sub-boreal pine forests, where demography and regeneration are tightly coupled to recurrent fire. In these ecosystems, periodic burning historically limited coarse woody debris, promoted cohort establishment, and stabilized nutrient cycling. When fire is systematically excluded, stands become denser, fuel continuity increases, and deadwood accrues to atypically high levels, altering both disturbance behavior and ecosystem function. Collectively, these findings argue that assessments of deadwood in old-growth forests—especially in fire-adapted sub-boreal pine systems—must be interpreted within their historical fire regimes, recognizing that high deadwood volumes may indicate process disruption rather than ecological integrity [7,8].
Many studies have investigated the structural diversity and dynamics of old-growth forests [9,10], while some studies have explored the abundance and diversity of tree-related microhabitats (TreMs) in the European old-growth forests [11,12]. TreMs are key structures for biodiversity and can be defined as structural heterogeneities on tree trunks or branches, such as cavities, tree injuries and exposed wood, crown deadwood, excrescences, fruiting bodies of saproxylic fungi and slime molds, epiphytic, epixylic and parasitic structures, and fresh exudates [13]. TreMs are habitat components usually colonized by specific faunal, floral and/or fungal users and consequently indirect indicators of their presence [13]. In particular, the European Union (EU) nature conservation policy has emphasized that TreMs are one of the key structural attributes used to identify old-growth forests in Europe [14]. TreMs as well as the amount and diversity of deadwood contribute more to determining whether a forest is old growth than the age of the trees [15]. However, despite this theoretical relationship between TreMs and old-growth forests, some studies have shown empirically that there is weak evidence that TreMs can support and enhance biodiversity [16,17].
TreMs density and diversity often decrease as human pressure on forests increases (e.g., managed forests for timber production) because TreMs are sometimes perceived as signs of a reduced longevity or a decrease in wood quality by forest managers [18]. For this reason, old-growth forests are generally expected to be the forest ecosystems characterized by the highest abundance and diversity of deadwood and TreMs [11]. The composition of TreMs and deadwood can vary significantly from one old-growth structure to another because the term “old-growth forest” encompasses a wide variety of changing forest structures [19]. In the literature, some recent studies on TreMs have focused on Canada and the United States [20,21], while in reference to the European context, most of the research has been conducted in central and southern Europe [11,22]. These studies have highlighted that tree species are an influential variable of TreMs abundance and richness. However, a small number of studies have been conducted in boreal and sub-boreal old-growth forests in Europe [23]. It is important to evidence that further research on old-growth boreal and sub-boreal forests is of key importance because they are climax forests [24]. In these forest ecosystems, tree growth is relatively slow, and decomposition is slowed down due to low temperatures, with an accumulation of deadwood and organic matter in the litter and soil [25]. For these reasons, as emphasized by some authors, studies that investigate and monitor the multiple aspects of biodiversity in boreal and sub-boreal old-growth forests are of strategic importance for both the scientific community and decision makers [26,27].
Based on these considerations, our study aimed to investigate the abundance and diversity of tree-microhabitats in an old-growth Caledonian pine forest case study in Scotland, a Scots pine (Pinus sylvestris L.)-dominated forest. Moreover, a focus of the research was to explore the relationship between deadwood volume by component and decay class and abundance of TreMs. Specifically, our objective was to test two hypotheses that might clarify the relationship between deadwood and TreMs in Scots-pine old-growth forests: (H1) The number of TreMs significantly increases with the presence of deadwood (snags, fallen deadwood, stumps); (H2) Deadwood diversity by component and decay class influences the presence of TreMs. To address these hypotheses, a field survey campaign was conducted in September 2024 in a study area in Cairngorms National Park, Scotland.
2. Materials and Methods
2.1. Study Area
The study was performed in an area of old-growth Scots pine forest at the UK Environmental Change Networks Allt a’Mharcaidh long-term monitoring site (https://deims.org/5a04fee1-42aa-47e9-abfc-043a3eda12ac; accessed on 18 November 2025), located in the Invereshie and Inshriach National Nature Reserve, Cairngorms National Park, Scotland (57°20 N, 3°61 W; Figure 1). The site formed part of a large, near-contiguous belt (340 m to 550 m a.s.l.) of old-growth Scots pine forest (Figure 2), approximately 1339 ha in size, which occupied the lower slopes of the Cairngorm massif between Glen Feshie and Gleann Eanaich. The wider Glen Feshie Forest is the largest remaining tract of the ancient Caledonian pine forest that colonized Scotland following the last ice age 10,000 years ago [28]. Pollen counts have been used in conjunction with stomatal counts to explore the process of Pinus colonization and its increase to form woodland. These studies confirm that Pinus is present from 9600 B.P. and dominates woodland from 9150 B.P. [29].
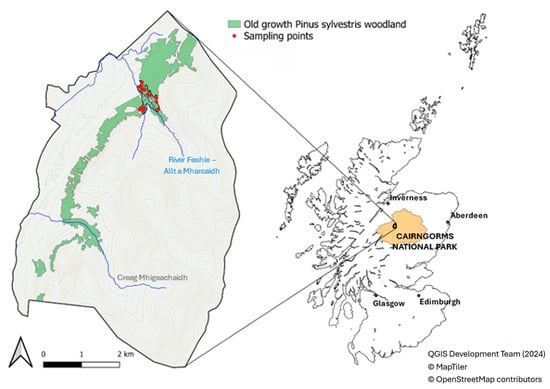
Figure 1.
Sample plot locations within the old-growth Scots pine forest within the Invereshie and Inshriach National Nature Reserve, Cairngorms National Park, Scotland (Contains Scottish Forestry information licensed under the Open Government Licence v3.0). The old-growth forest dataset is derived from the Native Woodland Survey of Scotland (NWSS), showing Pinewood with a mature dominance structure.
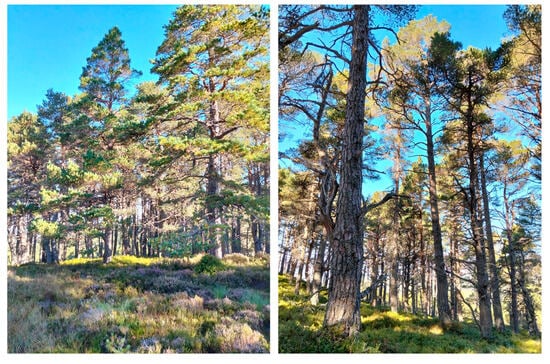
Figure 2.
Images of the study area (Scots pine-dominated forest, in Cairngorms National Park, Scotland).
The underlying soils were mostly thin peaty podzols over glacial deposits, with a bedrock of porphyritic granite. The main forest type is a Scots pine-dominated forest characterized by an average stem density equal to 18.4 stems ha−1 almost entirely made up of Scots pine trees (more than 95% in terms of basal area) with sporadic presence in the more open areas (lower canopy closure) of downy and silver birch (Betula pubescens Ehrh, Betula pendula Roth), and common juniper (Juniperus communis L.). According to the Cairngorms National Park Forest Strategy 2018, the management guidelines plan to continue to protect the ancient forests from further damage and fragmentation and pay particular attention to the ecological significance of Caledonian pine forests [30]. The study area is characterized by a diversity of wildlife, among whose most representative species are capercaillie (Tetrao urogallus L.) and black grouse (Lyrurus tetrix L.) among the birds, the Scottish wildcat (Felis sylvestris Schreber), pine marten (Martes martes L.), red deer (Cervus elaphus L.), and roe deer (Capreolus capreolus L.) among the mammals.
Buffered by mountains to the west and the Cairngorm massif to the south and east, the study area has a cool continental climate, continental compared to the maritime climate dominant in much of the UK. Typical monthly temperatures range from about 30 °F to 66 °F, with July being the warmest month (average highs around 66 °F and lows around 49 °F and January the coldest (average low of 30 °F and high of 41 °F). The probability of wet days (days with ≥ 0.04 inches of precipitation) in the Cairngorms National Park shows seasonal variability, varying between 12 days per month in spring and summer and 16 days in autumn and winter. Rainfall occurs throughout the year, with a total annual precipitation of ~38.7 inches. Spring is the driest period (mean 2.6 inches per month), and winter is the wettest (mean 4.1 inches per month). Snowfall exhibits strong seasonality, with ~66 days of snowfall per year and 44.5 days of lying snow (at 0900 UTC). Only it typically remains frost-free in June–September. The growing season, defined as the longest continuous period with temperatures above freezing (≥32 °F), lasts on average about 4.5 months (approximately 135 days), from around May 20 to around October 2, rarely starting before May 1 or after June 10, and rarely ending before September 7 or after October 27. Heat accumulation, expressed as growing degree days, is relatively low, and based on these values, first spring blooms typically occur in early June, reflecting the cool climatic conditions and short biological growing period characteristic of the Cairngorms upland environment.
2.2. Field Measurements
The data were collected in 15 sample plots randomly located in the old-growth forest established on lower slopes in the Cairngorm massif (Figure 1). The sample plots are representative of a 30.8 ha portion of old-growth Scots pine forest (Figure 2) located in the River Feshie Allt a’Mharacaidh catchment on the border with the managed Scots pine plantations. Sample plot centers were established using the ‘Random points inside polygons’ routine of QGIS 2.18.7 [31] within the borders of the old-growth Scots pine forest study area. A fixed-area sampling method with a circular sample plot of 13 m radius (531 m2) was adopted to collect data on living trees, deadwood, and TreMs. In the literature, studies have used different plot sizes to estimate the volume of all deadwood components, but most of them recommended using plots of approximately 500 m2 [32,33,34], as carried out in the present study. At the central point of the sample plot, the geographical coordinates and the canopy closure were detected. Canopy closure—proportion of sky hemisphere obscured by vegetation when viewed from a single point and, with the maximum expansion’s degree of its angle of view [35]—was measured using a concave spherical densitometer. In each sample plot, one survey point in the center of the circular plot was used. In each survey point, four measurements were taken in the N–W, N–E, S–W, and S–E directions. Canopy closure was then calculated as the mean of these four values.
Within each sample plot, all living trees with a diameter at breast height (DBH) exceeding 4.5 cm were recorded for species, two diameters orthogonally to each other, total height, and height of crown insertion corresponding to the height of the lowest living branch. Total height and height of crown insertion were measured with the Vertex 5 equipped with T4 Transponder (Haglöf Sweden AB, Långsele, Sweden), while the DBH was recorded with the caliper.
All three deadwood components were recorded and measured in the sample plots: (i) fallen deadwood (sound and rotting pieces of wood located on the ground), (ii) snags (with a height greater than 1.3 m), and (iii) stumps (snags truncated or cut to a height of less than 1.3 m). By collecting data for all three deadwood components, it was possible to test the hypothesis that the number of TreMs is related to the amount and diversity of deadwood (H1). As a threshold, the deadwood pieces with a diameter greater than 4.5 cm were recorded and classified, while the fallen deadwood with a diameter less than 4.5 cm was considered part of the litter. In each sample plot, all snags and stumps were recorded by measuring [36]: two perpendicular diameters at DBH for snags and at broken height for stumps, total height or broken height, species, and decay class using a five-class classification system. Deadwood species was assigned if it could be assigned with certainty. The operator simply distinguished between coniferous and broadleaf deadwood. The decay class, as well as the deadwood component, were collected in the field to verify the second research hypothesis (H2). Using a five-decay class classification standard proposed by Næsset (1999) [36], each deadwood element was assigned a decay class. The five-decay class—first class: recently dead, second class: weakly decayed, third class: medium decayed, fourth class: very decayed, and fifth class: almost decomposed—were assigned with visual assessment considering the following characteristics [36]: presence and conditions of bark, presence or absence of small branches, softness of wood, and other visible features (e.g., fungus mycelium, mosses, and lichen). Fallen deadwood in the sample plot was measured using the Line Intersect Sampling (LIS) method [37]. LIS is a sampling method based on the assumption that the cross-sections of fallen deadwood are circular and, therefore, the probability of sampling a deadwood element is proportional to its length [38]. In this study, two transects of 26 m were located within the circular sample plot in direction N–S and E–W, respectively, for a total length of 52 m. For each log intercepted by the transects, the following data were collected: species or, if not recognizable, functional type (conifers or broadleaves), two perpendicular diameters measured in the intersection point of the transect, and decay class using a five-class classification system [33].
Finally, TreMs on both snags and living trees were identified in each sample plot using the catalogue of tree microhabitats developed by Kraus et al. (2016) [39] and modified by Larrieu et al. (2018) [13]. TreMs were recorded for each tree using binoculars to better observe the upper parts of the tree. The classification system of TreMs included 7 forms, 15 groups, and 47 types of TreMs [13]. The forms and groups of TreMs considered in the study are shown in Table 1.

Table 1.
Form and group of the tree-related microhabitats (TreMs) considered for data collection in this study.
2.3. Data Processing
The field data were processed to obtain key descriptive statistics on forest stands (stem density, basal area, and volume ha−1), deadwood (volume by component and decay class ha−1), and TreMs (number by TreMs category ha−1).
Regarding the estimation of the deadwood volume by component, the following three equations were used:
Snags (Vs):
where Vs is the total volume of snags (m3 ha−1), BA is basal area (m2), f is the stem form factor as a relationship between real stem volume and cylinder volume (0.5), and hs is the total height or broken height (m).
Stumps (Vst):
where Vst is the total volume of stumps (m3 ha−1), hmin and hmax are the minimum and maximum height of the stump (m), and D1 and D2 are the two perpendicular diameters (m).
Fallen deadwood (Vl) [40]:
where Vl is the total volume of fallen deadwood (m3 ha−1), L is the length of the transect (m), and di is the mean diameter of the two diameters measured at the intersection point (cm).
The relationship between stand structure and amount of deadwood was first assessed through dead to live wood ratio calculated by dividing the volume of deadwood by the volume of living trees [41,42].
Deadwood and TreMs diversity were quantified using the Shannon diversity index (SH) formula in accordance with [43]:
where pi is the proportion of individuals of the ith (where i can be the TreMs category, deadwood decay class or deadwood component) divided by the total number of individuals.
Deadwood diversity was estimated based on the number of deadwood elements, while TreMs observed on individual trees were averaged to estimate the overall number of TreMs as well as TreMs diversity. The latter was estimated considering the 15 groups of saproxylic and epixylic microhabitats divided into seven forms, as shown in Table 1. TreMs observed on the individual trees were then averaged to estimate the overall number.
Finally, the simple linear regression between standing deadwood volume and number of TreMs (H1) and between deadwood diversity and TreMs diversity (H2) was applied. Based on the assumption that the three independent variables (standing deadwood volume, deadwood diversity by component and by decay class) are presumably correlated with each other, simple linear regressions were used. Linear regressions were used because a linear relationship was assumed between TreMs diversity and other predictors such as tree size, habitat tree, and number of snags, as underlined by other authors [44,45].
3. Results
3.1. Characteristics of Scots Old-Growth Pine Forest Stand
The main stand characteristics are reported in Table 2. The results showed an average basal area of 36.0 ± 17.9 m2 ha−1, with a stem density equal to 18.4 ± 8.3 stems ha−1. In addition, the results highlighted an average volume of 276.6 ± 147.9 m3 ha−1 and an average canopy closure of 82.3%, included in a wide range between 21.6% and 93.5%.
Table 2.
Stand characteristics of the old-growth Scots pine forest considered in the present study.
3.2. Deadwood Volume and Diversity
The results showed a total deadwood volume of 37.53 ± 32.39 m3 ha−1, distributed among the three components, 68.5% in snags (25.84 ± 26.96 m3 ha−1), 26.3% in fallen deadwood (9.94 ± 8.57 m3 ha−1), and 5.2% in stumps (1.97 ± 4.77 m3 ha−1). The average number of deadwood elements is 217 ha−1, thus distributed by component: 127 snags ha−1, 64 fallen deadwood ha−1, and 26 stumps ha−1. As expected, all the stumps recorded were natural stumps and not man-made stumps. Observing the data by decay class, the results highlighted a different volume distribution of the three deadwood components among the five decay classes, as shown in Table 3. For fallen deadwood and stumps, the highest volumes are found in the most decomposed classes (fourth and fifth decay classes). Conversely, for snags, the highest volume is found in the first class (53.6% of the total volume of snags) with a decreasing trend in subsequent decay classes. Overall, deadwood volume showed a decreasing trend among the five decay classes, from 13.91 m3 ha−1 in the first decay class to 4.55 m3 ha−1 in the fifth decay class. Regarding the deadwood diversity by component and decay class, the results showed an average value of the Shannon index by component equal to 0.54 ± 0.34 and by decay class of 0.85 ± 0.47.
Table 3.
Deadwood volume distribution (mean ± SD) by component and decay class (m3 ha−1).
The results highlighted an average deadwood volume/living tree volume ratio of 0.203 ± 0.102, included in a range between 0.069 and 0.453.
3.3. Tree-Related Microhabitats
The results showed an average total number of 89.1 TreMs ha−1 on snags and 26.4 TreMs ha−1 on living trees. These values correspond to 0.70 TreMs for each snag and 0.07 TreMs for each living tree (Figure 3a).
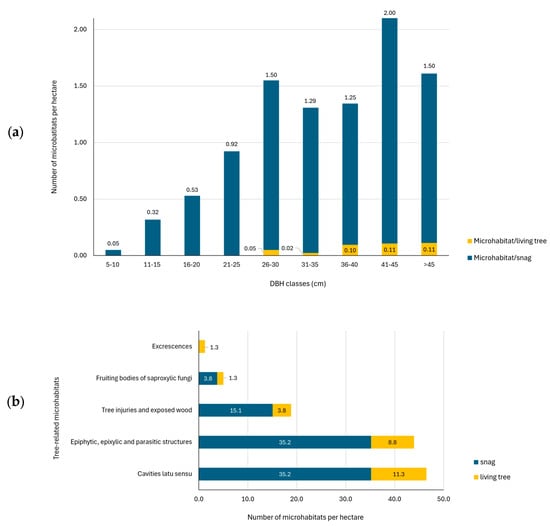
Figure 3.
Number of tree-related microhabitats (TreMs) by DBH class on standing dead and living trees (a) and number of tree-related microhabitats (TreMs) by categories per hectare (b).
Observing the TreMs by category, the results highlighted that the most common TreMs found in the study area (Figure 4) are ‘Cavities latu sensu’ and ‘Epiphytic, epixylic and parasitic structures’ with, respectively, 40% and 38% of total TreMs identified, followed by ‘tree injuries and exposed wood’ (16%) while the remaining 4% includes ‘Fruiting bodies of saproxylic fungi and slime moulds’ and ‘Excrescences’ (Figure 3b).
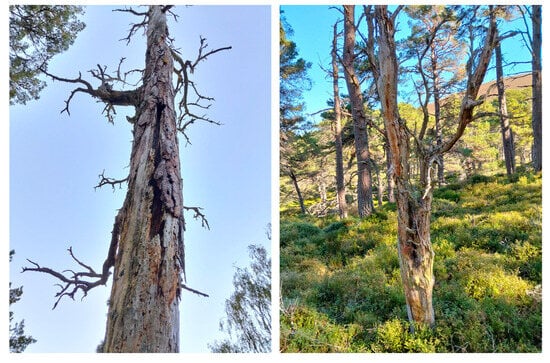
Figure 4.
Examples of TreMs in the study area (Scots pine-dominated forest, in Cairngorms National Park, Scotland).
The results showed that the number of TreMs is related to the DBH and decay class of the snag (Figure 5). In fact, the number of TreMs ranges between 0.05 per snag with a DBH under 10 cm and 2.00 per snag with a DBH of 41–45 cm. Concerning decay class, only the first three decay classes of snags were considered because none were identified for the last two classes (fourth and fifth). The highest abundance of TreMs was found in DBH class 21–35 cm for the first and second decay classes, while for the third decay class, the highest abundance was found for the snag DBH class greater than 40 cm. In addition, the number of TreMs per snag increased with the decay class: 0.35 for the first decay class, 0.95 for the second decay class, and 1.09 for the third decay class, which generally exhibits the highest number of TreMs across all DBH classes.
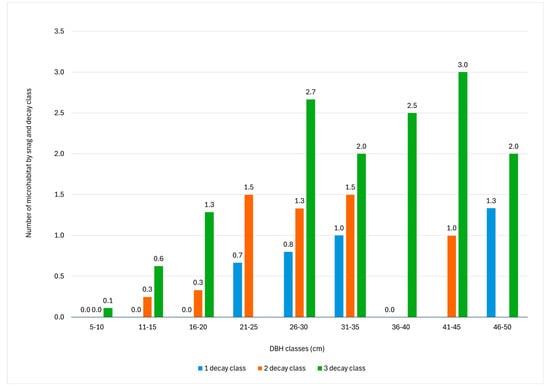
Figure 5.
Number of tree-related microhabitats (TreMs) by DBH class and snag decay class. The absence of values indicates the absence of snags characterized by the given decay class within that diametric range.
The Shannon index for the TreMs diversity highlighted an average value of 0.73 ± 0.45, included in a range between 0.0 (in three plots without TreMs) and 1.56 (in a plot with 10 TreMs distributed across five categories).
The results of the linear regression model showed that the number of TreMs is influenced by the snags volume (R2 = 0.712). Similarly, the other two simple linear regressions highlighted that TreMs diversity is influenced more by deadwood diversity by component (R2 = 0.664) rather than deadwood diversity by decay class (R2 = 0.416). The scatter plots of the multiple regression model of the number of TreMs and the diversity of TreMs are shown in Figure 6.
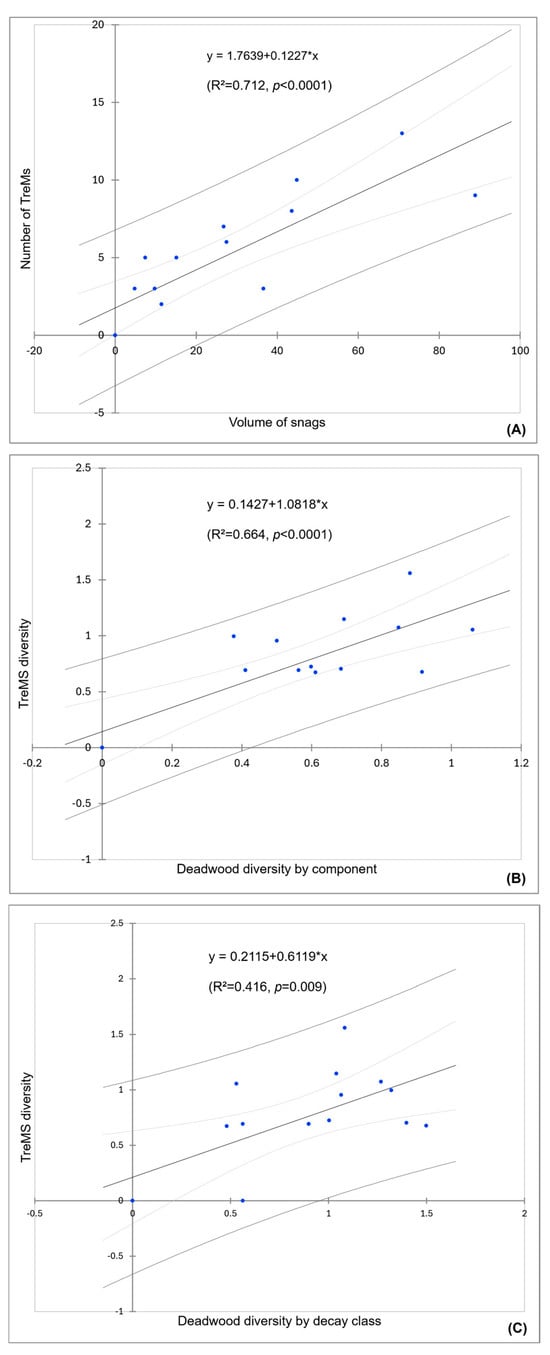
Figure 6.
Scatter plot of the three simple linear regression models between: (A) volume of snags (X) and number of TreMs (Y), (B) deadwood diversity by component (X) and TreMs diversity (Y), and (C) deadwood diversity by decay class (X) and TreMs diversity (Y).
4. Discussion
4.1. Deadwood in Old-Growth Caledonian Pine Forests
Our results highlighted that the old-growth Caledonian pine forests of the Cairngorms National Park are characterized by an average amount of 37.53 m3 ha−1 of deadwood distributed mainly in the early stages of decomposition. In fact, deadwood volumes were found to be between 13.91 m3 ha−1 of the first decay class and 4.56 m3 ha−1 of the fifth decay class. This result is potentially favorable for saproxylic biodiversity because other studies have shown high abundance and number of species of saproxylic beetles during the early decomposition stage of deadwood [46,47].
Considering deadwood components, our results showed that deadwood volume is mainly distributed in the snags with 25.84 m3 ha−1, followed by fallen deadwood (9.94 m3 ha−1) and natural stumps (1.97 m3 ha−1). These results are in accordance with other studies evidencing that deadwood in natural forests is composed largely of snags [48]. The high number and volume of snags are a key aspect of saproxylic biodiversity, as highlighted by some studies. Ozaki et al. (2024) [49] found that large conifer snags are an important habitat for saproxylic beetles (Cerambycidae) in Japan, while Janssen et al. (2011) [50] found no relationship between black spruce (Picea mariana (Mill.) Britton, Sterns and Poggenb.) and balsam fir (Abies balsamea (L.) Mill.) snags and abundance of saproxylic beetles in a Canadian old-growth forest. Conversely, the low number of stumps is a limiting aspect because natural stumps are associated with a richness and abundance of saproxylic beetles in boreal and sub-boreal forests, as emphasized by Jonsell et al. (2004) [51].
Our results are in line with the literature focused on estimating deadwood volume in old-growth forests (see Appendix A). Results closely comparable to ours are reported by Reid et al. (1996) [48], who have examined the native Scottish Caledonian pine forests (Abernethy, Beinn Eighe, Loch Maree) and found a total deadwood volume of approximately 54 m3 ha−1 of which 78% in snag component. Depending on stand characteristics, we observed variability in the total volume of deadwood and its distribution across different components (fallen deadwood vs. standing deadwood). In forests dominated by other conifer species, total deadwood volumes were generally higher. The reported volumes in other European old-growth beech-conifer (silver fir and Norway spruce) forests range widely from 91 to 420 m3 ha−1 [52].
Therefore, we can assert that Caledonian pine-dominated forests typically have lower deadwood volumes per hectare compared to other coniferous forests, with the deadwood being primarily concentrated in snags.
4.2. Tree-Related Microhabitats in Old-Growth Caledonian Pine Forests
A total of 111.2 TreMs ha−1, of which approximately 80% on snags and the remaining 20% on living trees, were identified in our study. These results confirmed our first hypothesis (H1), that increased deadwood would result in an increase in the number of TreMs. As expected, a high volume of snags and deadwood in general is positively correlated with high abundance of TreMs.
The main deadwood variables that influence the abundance of TreMs are size—large snags are more favorable than small snags—and decay class. Regarding the size, we found that the DBH of snags is closely related to TreMs abundance, as large trees support a greater abundance and richness of TreMs across all tree species. Living trees and snags with a size greater than 25 cm are characterized by a quadruple number of TreMs per tree (dead or alive) compared to those with a size between 5 and 25 cm. These results are in line with Bütler et al. (2013) and Asbeck et al. (2022) [53,54]. Furthermore, we found that the main TreMs groups in the large trees are the cavities with a diameter greater than 10 cm and the epiphytic structure. Results of our study confirm that the decay class influences the form of TreMs and, consequently, TreMs diversity. Snags of the first decay class, characterized by the presence of the crown, have a potentially higher number of TreMs, such as the crown deadwood group and the witch broom in the twigs tangles group (Excrescences). Snags of the second decay class, characterized by loose and detached bark, potentially have a higher number of TreMs, such as injuries and exposed wood (e.g., exposed sapwood). In fact, our results confirmed that tree injuries and exposed wood were identified almost exclusively on snags of the second decay class.
Martin et al. (2018) [10] estimated a TreMs density ranging between 27.27 and 133.33 ha−1 in five clusters with different stand and deadwood characteristics in a black spruce (P. mariana Mill.) and balsam fir (A. balsamea (L.) Mill.) old-growth forest in Canada (Quebec). In a study conducted in northeastern Germany, Winter and Möller (2008) [11] found about 250 TreMs ha−1 in a mature lowland beech forest (reference stands unmanaged for more than 100 years), while Jahed et al. (2020) [55] identified an average value of 121.3 TreMs ha−1 in the primeval Hyrcanian beech-dominated forest in Iran and in the Uholka Forest in Ukraine. This is consistent with our results, as old-growth forests provide over 100 TreMs ha−1. However, under a climate change scenario, suitable ecological niches for some species (e.g., lichen epiphytes) could also be threatened due to a reduction in habitat quality [56] and presumably faster decomposition rates of deadwood.
Our results showed a Shannon index by decay class of 0.85 and by component of 0.54, supporting our second hypothesis (H2) that an increase in deadwood diversity by component and decay class consequently also increases the diversity in TreMs (Shannon index by TreMs diversity of 0.73). Pesklevits (2006) [57] found Shannon index values for snags decay classes ranging from 0.5 to 1.3, and for log decay classes, values ranged from 0.6 to 1.5, across various sites in a conifer-dominated old-growth forest in Nova Scotia. More recently, Martin et al. (2018) [10] estimated Shannon index values by decay class in boreal old-growth forests situated in Quebec, Canada. These authors found values equal to 0.52 ± 0.28 to 1.01 ± 0.17 for snags and 1.19 ± 0.29 to 1.32 ± 0.17 for logs for the old-growth forests. In another study conducted in four old-growth forests in Finland, De Meo et al. (2024) [23] found Shannon index values of 0.932 for component diversity and 1.286 for decay class diversity.
4.3. Methodological Considerations and Limitations
From a methodological point of view, the main strength of the study was to have partially filled a knowledge gap in the literature on TreMs in Caledonian pine forests. This study provided new data regarding deadwood and TreMs diversity in an old-growth Scots pine-dominated forest in Scotland. Conversely, the main weakness of the study was the single-site study area (despite being representative of the larger old-growth forest in the region) and the low number of sample plots, which provided only a preliminary picture of deadwood as a biodiversity indicator of these old-growth forests. Another important aspect not investigated in the present study is the actual presence of saproxylic insects based on the identified TreMs, which would be interesting to investigate in future studies on Caledonian pine forests.
5. Conclusions
The results provided by this study evidenced that the key variables related to the diversity in TreMs are the number of snags and the deadwood diversity by component and decay class. These key aspects must be considered to increase the availability of TreMs for saproxylic species based on management objectives. In fact, old-growth forests, such as Caledonian pine forests, should be considered as a biodiversity benchmark in forests. Therefore, maintaining large snags as well as promoting the diversification of deadwood by decay class and component are fundamental aspects that the forest manager must consider in management choices. Our study underlined that, in addition to snags and fallen deadwood of all decay classes, the number and diversity of TreMs are important functional attributes. Passive forest management of TreMs and deadwood involves maintaining those elements in an old-growth forest, while active forest management involves creating new TreMs or deadwood from living trees. The latter approach is suitable for mature forests poor in saproxylic biodiversity, where silvicultural interventions aim to increase the number of saproxylic species in the medium-long term.
The results of this study can be considered a first step in the investigation of TreMs in old-growth Caledonian pine forests. Future steps for the study will be to extend the investigation to other boreal and sub-boreal old-growth forests and contexts to assess broader trends and provide more comprehensive evaluations at a general level.
Author Contributions
Conceptualization, I.D.M. and A.P.; methodology, I.D.M., R.P. and A.P.; software, S.B. and A.P.; validation, J.D. and C.A.; formal analysis, I.D.M. and R.P.; investigation, A.P., I.D.M. and R.P.; resources, J.D. and C.A.; data curation, S.B. and A.P.; writing—original draft preparation, I.D.M., A.P., S.B., J.D. and C.A.; writing—review and editing, I.D.M., A.P., S.B., J.D. and C.A.; visualization, S.B. and R.P.; supervision, I.D.M.; project administration, J.D. and C.A.; funding acquisition, J.D. and C.A. All authors have read and agreed to the published version of the manuscript.
Funding
This research was funded by the International Network for Terrestrial Research and Monitoring in the Arctic (INTERACT; EU Horizon 2020) transnational access programme (grant agreement No. 730938).
Data Availability Statement
The data are available upon request from the authors.
Acknowledgments
This study was conducted in the context of the “Forest and Soil Biodiversity Potential in Different Sub-arctic Forest Systems (FosBis)” project funded by the International Network for Terrestrial Research and Monitoring in the Arctic (INTERACT; EU Horizon 2020) transnational access programme (grant agreement No. 730938).
Conflicts of Interest
The authors declare no conflicts of interest.
Abbreviation
The following abbreviation is used in this manuscript:
| TreMs | Tree-related microhabitats |
Appendix A
Table A1.
Literature about deadwood volume in old-growth forests; if not stated otherwise, average values are given. The highest values between lying and standing deadwood are highlighted in bold.
Table A1.
Literature about deadwood volume in old-growth forests; if not stated otherwise, average values are given. The highest values between lying and standing deadwood are highlighted in bold.
| Source | Location | Forest Type | Threshold | Method | Lying Deadwood Volume | Standing Deadwood Volume | Total Deadwood Volume |
|---|---|---|---|---|---|---|---|
| Reid et al. (1996) [48] | Abernethy, Beinn Eighe, Loch Maree (Scotland) | Caledonian pine forests | Lying: D >5 cm Standing: DBH >5 cm | Fallen deadwood was surveyed using the line intersect sampling (LIS) technique, and its volume was estimated following the formula proposed by Warren and Olsen (1964) [37]. The volume of standing dead wood was calculated using volume–diameter tables provided by the Forestry Commission | 12 m3 ha−1 | 42 m3 ha−1 | 54 m3 ha−1 |
| Šēnhofa et al. (2020) [58] | Latvia | Silver birch-downy birch forests | Lying: length ≥1.0 m), thicker end D ≥ 6.1 cm; Standing: DBH ≥6.1 cm | For standing dead trees (stems and snags), they recorded DBH, height, species, and decay class. In each plot, the length and diameters at both ends of downed deadwood were measured, along with species identity and decay stage at each end. Volume of stumps and standing dead trees was estimated using Huber’s formula and subsequently converted to biomass using density values specific to each decay class. | 37.2 m3 ha−1 | 17.2 m3 ha−1 | 54.4 m3 ha−1 |
| Petritan et al. (2023) [52] | Runcu Grosi Natural Reserve (Romania), | Sessile oak-beech forest | n.a. | All trees taller than 1.5 m were stem-mapped using Field Map® digital forest mapping systems (IFER Ltd., Czech Republic). For everyone, spatial position, diameter at breast height (DBH), total height, crown base height, and crown projection were recorded. The volume of living trees and standing deadwood was estimated using a double-logarithmic regression model. For lying deadwood, volume was calculated using thefrustum of cone formula, considering only the portions lying within the plot boundaries. | 149.47 m3 ha−1 | 90.88 m3 ha−1 | 240.7 m3 ha−1 |
| Petritan et al. (2014) [59] | Southern Carpathians (Sinca forest) | Mixed beech-silver fir forest | Standing: DBH >6 cm Lying: large-end D>15 cm and length >3 m | In each plot, standing dead trees were measured for total height and DBH, species and decay class recorded. For lying deadwood, the species and the decay class were recorded and the diameters at both ends, and the length were measured. The volume of logs was calculated using the truncated-cone formula. Volumes of standing deadwood, as well as lying deadwood, were estimated through a double-logarithmic regression based on DBH and height, using species-specific regression coefficients. | 19.84 ± 3.44 t ha−1 | 14.19 ± 2.96 t ha−1 | 34.03 ± 5.04 t ha−1 134.9 m3 ha−1 |
| Majdanová et al. (2023) [60] | Hrubý Jeseník mountain (Czech Republi), | Norway spruce forest | Lying: D >10 cm at the thicker end, length > 1.5 m Standing: DBH >10 cm | In each plot, standing trees—both living and dead—as well as lying deadwood were recorded using FieldMap® technology. For lying deadwood, diameters at both ends and decay class were recorded. The volume of lying deadwood object was calculated using the truncated-cone volume equation. The volume of standing dead trees was estimated from diameter and height through allometric equations. Height-diameter models developed for each plot separately were applied to derive the theoretical whole-tree volume, which was reduced to an actual volume of snapped trees using the actual height and the reduction coefficient. | 59.2 m3 ha−1 (median) | 55.1 m3 ha−1 (median) | 129.5 m3 ha−1 (median) |
| Rouvinen et al. (2005) [61] | North Karelia (Finland) | Scots pine-Norway spruce forest Scots pine Norway Spruce Birch Aspen Unidentified | Standing: DBH ≥5 cm Lying: DBH ≥5 cm | All stumps were included in the study. Due to time constraints during field work, only a sub-sample of the standing and fallen trees was measured. Four parallel transects of 50 × 500 m were established and subdivided into 50 × 50 m plots to assess standing dead trees and fallen logs. Diameters were recorded for all dead trees, while heights were measured only for broken standing dead trees and for downed logs with a broken stem. Volumes of standing and fallen dead trees were calculated using specific volume equations. Stump volume in decay stages 1–5 was estimated assuming a cylindrical shape, whereas for decay class 6, stump volume was considered as one-quarter of the volume calculated for a whole stump of the same dimensions. | 48.7 m3 ha−1 15.7 m3 ha−1 8.1 m3 ha−1 2.8 m3 ha−1 5.0 m3 ha−1 17.1 m3 ha−1 | 35.5 m3 ha−1 29.7 m3 ha−1 2.5 m3 ha−1 1.2 m3 ha−1 2.1 m3 ha−1 - | 84.2 m3 ha−1 45.4 m3 ha−1 10.6 m3 ha−1 4.0 m3 ha−1 7.1 m3 ha−1 17.1 m3 ha−1 |
| Lõhmus and Kraut (2010) [62] | Estonia | Dry boreal forests (dominated by Scots pine) Meso-eutrophic forests (conifer/deciduous mixtures, with Pine or Norway spruce) Eutrophic boreo-nemoral forests (deciduous trees and spruce) Mobile-water swamp forests (Black alder, Downy birch) | Standing: DBH ≥10 cm Lying: D ≥10 cm | In each study plot, 50-m straight sampling lines were established according to a standard GIS-based procedure. For lying deadwood, diameter and decay class were recorded where the line intersected the item, while for standing trees, DBH was measured, and the height of snags was also recorded. Trunk volumes of living and standing dead tree was calculated using a species-specific volume function commonly applied in Estonian silviculture. Heights of living trees were derived from measured DBH and site quality class using a comprehensive dataset of model trees from across Estonia. The volume of downed wood was calculated assuming circular cross-sections”. | 13.6 ± 11.8 m3 ha−1 98.1 ± 66.3 m3 ha−1 143.1 ± 29.0 m3 ha−1 111.3 ± 87.8 m3 ha− 1 | 64 ± 46 m3 ha−1 76 ± 44 m3 ha−1 84 ± 44 m3 ha−1 107 ± 33 m3 ha−1 |
References
- Wirth, C.; Messier, C.; Bergeron, Y.; Frank, D.; Fankhänel, A. Old-growth forest definitions: A pragmatic view. In Old-Growth Forests; Wirth, C., Gleixner, G., Heimann, M., Eds.; Ecological Studies; Springer: Berlin/Heidelberg, Germany, 2009; pp. 11–33. [Google Scholar]
- Cristea, V.; Leca, Ș.; Ciceu, A.; Chivulescu, Ș.; Badea, O. Structural features of old growth forest from South Eastern Carpathians, Romania. South-East Eur. For. 2019, 10, 159–164. [Google Scholar] [CrossRef]
- Hunter, M.L. What constitutes an old-growth stand? J. For. 1989, 87, 33–35. [Google Scholar] [CrossRef]
- Frelich, L.E.; Reich, P.B. Perspectives on development of definitions and values related to old-growth forests. Environ. Rev. 2003, 11, 9–22. [Google Scholar] [CrossRef]
- Larson, A.J.; Lutz, J.A.; Donato, D.C.; Freund, J.A.; Swanson, M.E.; HilleRisLambers, J.; Sprugel, D.G.; Franklin, J.F. Spatial aspects of tree mortality strongly differ between young and old-growth forests. Ecology 2015, 96, 2855–2861. [Google Scholar] [CrossRef] [PubMed]
- Schulze, E.-D.; Hessenmoeller, D.; Knohl, A.; Luyssaert, S.; Boerner, A.; Grace, J. Temperate and boreal old-growth forests: How do their growth dynamics and biodiversity differ from young stands and managed forests? In Old-Growth Forests; Wirth, C., Gleixner, G., Heimann, M., Eds.; Ecological Studies; Springer: Berlin/Heidelberg, Germany, 2009; pp. 343–366. [Google Scholar]
- Parks, S.A.; Guiterman, C.H.; Margolis, E.Q.; Lonergan, M.; Whitman, E.; Abatzoglou, J.T.; Falk, D.A.; Johnston, J.D.; Daniels, L.D.; Lafon, C.W.; et al. A fire deficit persists across diverse North American forests despite recent increases in area burned. Nat. Commun. 2025, 16, 1493. [Google Scholar] [CrossRef]
- Binkley, D.; Sisk, T.; Chambers, C.; Springer, J.; Block, W. The role of old-growth forests in frequent-fire landscapes. Ecol. Soc. 2007, 12, 18. [Google Scholar] [CrossRef]
- Bauhus, J.; Puettmann, K.; Messier, C. Silviculture for old-growth attributes. For. Ecol. Manag. 2009, 258, 525–537. [Google Scholar] [CrossRef]
- Martin, M.; Fenton, N.J.; Morin, H. Structural diversity and dynamics of boreal old-growth forests case study in Eastern Canada. For. Ecol. Manag. 2018, 422, 125–136. [Google Scholar] [CrossRef]
- Winter, S.; Möller, G.C. Microhabitats in lowland beech forests as monitoring tool for nature conservation. For. Ecol. Manag. 2008, 255, 1251–1261. [Google Scholar] [CrossRef]
- Martin, M.; Fenton, N.J.; Morin, H. Tree-related microhabitats and deadwood dynamics form a diverse and constantly changing mosaic of habitats in boreal old-growth forests. Ecol. Ind. 2021, 128, 107813. [Google Scholar] [CrossRef]
- Larrieu, L.; Paillet, Y.; Winter, S.; Bütler, R.; Kraus, D.; Krumm, F.; Lachat, T.; Michel, A.K.; Regnery, B.; Vandekerkhove, K. Tree related microhabitats in temperate and Mediterranean European forests: A hierarchical typology for inventory standardization. Ecol. Ind. 2018, 84, 194–207. [Google Scholar] [CrossRef]
- Meyer, P.; Aljes, M.; Culmsee, H.; Feldmann, E.; Glatthorn, J.; Leuschner, C.; Schneider, H. Quantifying old-growthness of lowland European beech forests by a multivariate indicator for forest structure. Ecol. Ind. 2021, 125, 107575. [Google Scholar] [CrossRef]
- O’Brien, L.; Schuck, A.; Fraccaroli, C.; Pötzelsberger, E.; Winkel, G.; Lindner, M. Protecting Old-Growth Forests in Europe—A Review of Scientific Evidence to Inform Policy Implementation; Final report; European Forest Institute: Joensuu, Finland, 2021. [Google Scholar] [CrossRef]
- Asbeck, T.; Großmann, J.; Paillet, Y.; Winiger, N.; Bauhus, J. The use of tree-related microhabitats as forest biodiversity indicators and to guide integrated forest management. Curr. For. Rep. 2021, 7, 59–68. [Google Scholar] [CrossRef]
- Dutta, T.; Larrieu, L.; Schuck, A. Who is using tree-related microhabitats (TreMs)? Biol. Conserv. 2025, 307, 111180. [Google Scholar] [CrossRef]
- Martin, M.; Raymond, P. Assessing tree-related microhabitat retention according to a harvest gradient using tree-defect surveys as proxies in eastern Canadian mixedwood forests. For. Chron. 2019, 95, 157–170. [Google Scholar] [CrossRef]
- Kozák, D.; Svitok, M.; Wiezik, M.; Mikoláš, M.; Thorn, S.; Buechling, A.; Hofmeister, J.; Matula, R.; Trotsiuk, V.; Bače, R.; et al. Historical disturbances determine current taxonomic, functional and phylogenetic diversity of saproxylic beetle communities in temperate primary forests. Ecosystems 2021, 24, 37–55. [Google Scholar] [CrossRef]
- Asbeck, T.; Basile, M.; Stitt, J.; Bauhus, J.; Storch, I.; Vierling, K.T. Tree-related microhabitats are similar in mountain forests of Europe and North America and their occurrence may be explained by tree functional groups. Trees—Struct. Funct. 2020, 34, 1453–1466. [Google Scholar] [CrossRef]
- Martin, M.; Raymond, P.; Boucher, Y. Influence of individual tree characteristics, spatial structure and logging history on tree-related microhabitat occurrence in North American hardwood forests. For. Ecosyst. 2021, 8, 27. [Google Scholar] [CrossRef]
- Vuidot, A.; Paillet, Y.; Archaux, F.; Gosselin, F. Influence of tree characteristics and forest management on tree microhabitats. Biol. Conserv. 2011, 144, 441–450. [Google Scholar] [CrossRef]
- De Meo, I.; Paletto, A.; Pastorelli, R.; Vitali, F. Deadwood diversity as an indicator of biodiversity of old-growth forests: An application in Southern Finland. South-East Eur. For. 2024, 15, 141–150. [Google Scholar] [CrossRef]
- Burton, P.J. Exploring complexity in boreal forests. In Managing Forests as Complex Adaptive Systems; Messier, C., Puettmann, K.J., Coates, K.D., Eds.; Routledge: London, UK, 2013; pp. 79–109. [Google Scholar] [CrossRef]
- Venier, L.A.; Thompson, I.D.; Fleming, R.; Malcolm, J.; Aubin, I.; Trofymow, J.A.; Langor, D.; Sturrock, R.; Patry, C.; Outerbridge, R.O.; et al. Effects of natural resource development on the terrestrial biodiversity of Canadian boreal forests. Environ. Rev. 2014, 22, 323–330. [Google Scholar] [CrossRef]
- Aakala, T.; Berninger, F.; Starr, M. The roles of competition and climate in tree growth variation in northern boreal old-growth forests. J. Veg. Sci. 2018, 29, 1040–1051. [Google Scholar] [CrossRef]
- Martin, M.; Shorohova, E.; Fenton, N.J. Embracing the complexity and the richness of boreal old-growth forests: A further step toward their ecosystem management. In Boreal Forests in the Face of Climate Change; Montoro Girona, M., Morin, H., Gauthier, S., Bergeron, Y., Eds.; Springer International Publishing: Cham, Switzerland, 2023; pp. 191–218. [Google Scholar] [CrossRef]
- Dubois, A.D.; Ferguson, D.K. The climatic history of pine in the cairngorms based on radiocarbon dates and stable isotope analysis, with an account of the events leading up to its colonization. Rev. Palaeobot. Palynol. 1985, 46, 55–80. [Google Scholar] [CrossRef]
- Paterson, D. The Holocene History of Pinus Sylvestris Woodland in the Mar Lodge Estate, Cairngorms, Eastern Scotland. Ph.D. Thesis, Institute of Natural Sciences, University of Stirling, Stirling, UK, 2011. [Google Scholar]
- Cairngorms National Park Authority. Cairngorms National Park Forest Strategy 2018; Cairngorms National Park Authority: Cairngorms, UK, 2018. [Google Scholar]
- QGIS Development Team. QGIS Geographic Information System. Open Source Geospatial Foundation Project. 2017. Available online: https://qgis.org/ (accessed on 9 September 2024).
- Ceornea, C.; Drăgoi, M. A new metrics to manage the deadwood in forest stewardship council certified forests. Forestist 2025, 75, 0040. [Google Scholar] [CrossRef]
- Bayraktar, S.; Paletto, A.; Floris, A. Deadwood volume and quality in recreational forests: The case study of the Belgrade forest (Turkey). For. Syst. 2020, 29, 51–64. [Google Scholar] [CrossRef]
- Idol, T.W.; Figler, R.A.; Pope, P.E.; Ponder, F. Characterization of coarse woody debris across a 100 year chronosequence of upland oak-hickory forests. For. Ecol. Manag. 2001, 149, 153–161. [Google Scholar] [CrossRef]
- Korhonen, L.; Korhonen, K.T.; Rautiainen, M.; Stenberg, P. Estimation of forest canopy cover: A comparison of field measurement techniques. Silva Fenn. 2006, 40, 577–588. [Google Scholar] [CrossRef]
- Næsset, E. Relationship between relative wood density of Picea abies logs and simple classification systems of decayed coarse woody debris. Can. J. For. Res. 1999, 14, 454–461. [Google Scholar] [CrossRef]
- Warren, W.G.; Olsen, P.F. A line-intersect technique for assessing logging waste. For. Sci. 1964, 10, 267–276. [Google Scholar] [CrossRef]
- Marshall, P.; Davis, G.; LeMay, V. Using Line Intersect Sampling for Coarse Woody Debris; Forest Research Technical Report: Vancouver, BC, Canada, 2000. [Google Scholar]
- Kraus, D.; Bütler, R.; Krumm, F.; Lachat, T.; Larrieu, L.; Mergner, U.; Paillet, Y.; Rydkvist, T.; Schuck, A.; Winter, S. Catalogue of tree Microhabitats—Reference Field List; Integrate+ Technical Paper; European Forest Institute: Joensuu, Finland, 2016. [Google Scholar]
- Van Wagner, C.E. The line intersect method in forest fuel sampling. For. Sci. 1968, 14, 20–26. [Google Scholar] [CrossRef]
- Bujoczek, L.; Szewczyk, J.; Bujoczek, M. Deadwood volume in strictly protected, natural, and primeval forests in Poland. Eur. J. For. Res. 2018, 137, 401–418. [Google Scholar] [CrossRef]
- Öder, V.; Petritan, A.M.; Schellenberg, J.; Bergmeier, E.; Walentowski, H. Patterns and drivers of deadwood quantity and variation in mid-latitude deciduous forests. For. Ecol. Manag. 2021, 487, 118977. [Google Scholar] [CrossRef]
- Oettel, J.; Lapin, K.; Kindermann, G.; Steiner, H.; Schweinzer, K.-M.; Frank, G.; Essl, F. Patterns and drivers of deadwood volume and composition in different forest types of the Austrian natural forest reserves. For. Ecol. Manag. 2020, 463, 118016. [Google Scholar] [CrossRef]
- Großmann, J.; Schultze, J.; Bauhus, J.; Pyttel, P. Predictors of microhabitat frequency and diversity in mixed mountain forests in South-Western Germany. Forests 2018, 9, 104. [Google Scholar] [CrossRef]
- Asbeck, T.; Pyttel, P.; Frey, J.; Bauhus, J. Predicting abundance and diversity of tree-related microhabitats in Central European montane forests from common forest attributes. For. Ecol. Manag. 2019, 432, 400–408. [Google Scholar] [CrossRef]
- Lettenmaier, L.; Bässler, C.; Decker, O.; Hagge, J.; Heibl, C.; Mamadashvili, G.; Seibold, S.; Thorn, S.; Müller, J. 12 years of assembly patterns in saproxylic beetles suggest early decay wood as ephemeral resource patch. J. Anim. Ecol. 2025. [Google Scholar] [CrossRef] [PubMed]
- Stokland, J.N.; Siitonen, J.; Jonsson, B.G. Biodiversity in Dead Wood; Cambridge University Press: Cambridge, UK, 2012. [Google Scholar]
- Reid, C.M.; Foggo, A.; Speight, M. Dead wood in the Caledonian pine forest. Forestry 1996, 69, 275–279. [Google Scholar] [CrossRef]
- Ozaki, K.; Sayama, K.; Sano, M. Importance of large-diameter conifer snags for saproxylic beetle (Cerambycidae) assemblages in old-growth remnants in Japan. J. For. Res. 2024, 29, 112–122. [Google Scholar] [CrossRef]
- Janssen, P.; Hébert, P.; Fortin, D. Biodiversity conservation in old-growth boreal forest: Black spruce and balsam fir snags harbour distinct assemblages of saproxylic beetles. Biodivers. Conserv. 2011, 20, 2917–2932. [Google Scholar] [CrossRef]
- Jonsell, M.; Nittérus, K.; Stighäll, K. Saproxylic beetles in natural and man-made deciduous high stumps retained for conservation. Biol. Conserv. 2004, 138, 163–173. [Google Scholar] [CrossRef]
- Petritan, I.C.; Mihăilă, V.V.; Yuste, J.C.; Bouriaud, O.; Petritan, A.M. Deadwood density, C stocks and their controlling factors in a beech-silver fir mixed virgin European forest. For. Ecol. Manag. 2023, 539, 121007. [Google Scholar] [CrossRef]
- Bütler, R.; Lachat, T.; Larrieu, L.; Paillet, Y. Habitat trees: Key elements for forest biodiversity. In Integrative Approaches as an Opportunity for the Conservation of Forest Biodiversity; Kraus, D., Krumm, F., Eds.; European Forest Institute: Joensuu, Finland, 2013; pp. 84–91. [Google Scholar]
- Asbeck, T.; Kozák, D.; Spînu, A.P.; Mikoláš, M.; Zemlerová, V.; Svoboda, M. Tree-related microhabitats follow similar patterns but are more diverse in primary compared to managed temperate mountain forests. Ecosystems 2022, 25, 712–726. [Google Scholar] [CrossRef]
- Jahed, R.R.; Kavousi, M.R.; Farashiani, M.E.; Sagheb-Talebi, K.; Babanezhad, M.; Courbaud, B.; Wirtz, R.; Müller, J.; Larrieu, L. A comparison of the formation rates and composition of tree-related microhabitats in beech-dominated primeval Carpathian and Hyrcanian forests. Forests 2020, 11, 144. [Google Scholar] [CrossRef]
- Ellis, C.J. A mechanistic model of climate change risk: Growth rates and microhabitat specificity for conservation priority woodland epiphytes. Perspect. Plant Ecol. Evol. Syst. 2018, 32, 38–48. [Google Scholar] [CrossRef]
- Pesklevits, A.D. Old-Growth Forests: A Conceptual and Empirical Examination. Master’s Thesis, Dalhiusie University, Halifax, NS, Canada, 2006. [Google Scholar]
- Šēnhofa, S.; Jaunslaviete, I.; Šņepsts, G.; Jansons, J.; Liepa, L.; Jansons, A. Deadwood characteristics in mature and old-growth birch stands and their implications for carbon storage. Forests 2020, 11, 536. [Google Scholar] [CrossRef]
- Petritan, I.; Marzano, R.; Petritan, A.M.; Lingua, E. Overstory succession in a mixed Quercus petraea– Fagus sylvatica old growth forest revealed through the spatial pattern of competition and mortality. For. Ecol. Manag. 2014, 326, 9–17. [Google Scholar] [CrossRef]
- Majdanová, L.; Hofmeister, L.; Pouska, V.; Mikoláš, M.; Zíbarová, L.; Vítková, L.; Svoboda, M.; Čada, V. Old-growth forests with long continuity are essential for preserving rare wood-inhabiting fungi. For. Ecol. Manag. 2023, 54, 121055. [Google Scholar] [CrossRef]
- Rouvinen, S.; Rautiainen, A.; Kouki, J. A relation between historical forest use and current dead woody material in a boreal protected old-growth forest in Finland. Silva Fenn 2005, 39, 21–36. [Google Scholar] [CrossRef]
- Lõhmus, A.; Kraut, A. Stand structure of hemiboreal old-growth forests: Characteristic features, variation among site types, and a comparison with FSC-certified mature stands in Estonia. For. Ecol. Manag. 2010, 260, 155–165. [Google Scholar] [CrossRef]


Disclaimer/Publisher’s Note: The statements, opinions and data contained in all publications are solely those of the individual author(s) and contributor(s) and not of MDPI and/or the editor(s). MDPI and/or the editor(s) disclaim responsibility for any injury to people or property resulting from any ideas, methods, instructions or products referred to in the content. |
© 2026 by the authors. Licensee MDPI, Basel, Switzerland. This article is an open access article distributed under the terms and conditions of the Creative Commons Attribution (CC BY) license.