Article

Optimizing Season-Specific MET for Thermal Comfort Under Open and Closed Urban Forest Canopies

1
Department of Forest Environmental Resources, College of Agriculture and Life Sciences, Gyeongsang National University, Jinju-Daero, Jinju 52828, Gyeongsangnam-do, Republic of Korea
2
Department of Forest Science, Kongju National University, 54 Daehak-ro, Yesan-eup, Yesan-gun 32439, Chungcheongnam-do, Republic of Korea
3
Department of Environment & Forest Resources, Chungnam National University, Daejeon 34134, Republic of Korea
*
Authors to whom correspondence should be addressed.
Forests 2025, 16(9), 1424; https://doi.org/10.3390/f16091424
Submission received: 14 August 2025 / Revised: 27 August 2025 / Accepted: 4 September 2025 / Published: 5 September 2025
(This article belongs to the Special Issue Forest and Human Well-Being)

Abstract

Urban heat island conditions increase heat exposure and constrain safe outdoor activities. Urban forests can mitigate thermal loads; however, stand morphology can produce divergent microclimates. We aimed to quantify how stand type (open vs. closed), season (spring, summer, fall), and activity intensity (MET 1.0–6.0) jointly modulate thermal comfort and to identify season-specific optimal MET levels in an urban forest in Daejeon, Republic of Korea. We combined site-specific 3D canopy modeling with hourly Predicted Mean Vote (PMV) simulations driven by AMOS tower data (2023–2024). Comfort was defined as |PMV| ≤ 0.5. Analyses included seasonal means, Cliff’s delta, and generalized estimating equation logistic models to estimate the SITE × SEASON × MET interactions and predict comfort probabilities. Across most seasons and MET levels, C1 was more comfortable than C2. However, at MET 1.0 in summer, the pattern was reversed, which may reflect the canopy shading and associated decreases in mean radiant temperature (MRT) of C2. Comfort peaked at MET 2.0–3.0 and declined sharply at ≥4.5 MET. The three-way SITE × SEASON × MET interaction was significant (p < 0.001). The season-specific optimal MET values under our boundary conditions were 3.0 (spring), 2.0–2.5 (summer), and 3.0 (fall). These simulation-based PMV-centered findings represent model-informed tendencies. Nevertheless, they support actionable guidance: prioritize high-closure stands for low-intensity summer use, leverage open stands for low-to-moderate activities in spring and fall, and avoid high-intensity programs during warm periods. These results inform the programming and design of urban-forest healing and recreation by matching stand type and activity intensity to season to maximize comfortable hours.

1. Introduction

1.1. Motivation and Objectives

Urban heat island (UHI) intensification increases the heat exposure of city dwellers and constrains safe outdoor activities [1,2,3]. Urban forests are increasingly being recognized as a key nature-based infrastructure for modulating thermal loads via shading, evapotranspiration, and wind-flow modification, thereby improving human thermal conditions and supporting heat-resilient public spaces [4,5,6]. Simultaneously, the use of urban forests for forest healing and recreation has also increased [7,8]. Urban forests provide accessible outdoor environments that offer physical and mental health benefits, thus highlighting the need for thermally comfortable urban outdoor spaces that support physical and mental health [9,10,11].
However, urban forests may not provide the same thermal experience. For example, the stand morphology leads to differences in microclimate drivers, mean radiant temperature (MRT), air temperature, humidity, and wind [12,13,14,15]. Open and closed-canopy stands are hypothesized to generate contrasting regimes of radiant exposure, ventilation, and near-surface moisture, which may translate into different probabilities of perceived thermal comfort and thereby modulate the efficacy of forest-healing programs. Despite growth in empirical and modeling work on urban greenery and cooling [16,17,18], systematic comparisons of open versus closed forest morphologies across seasons and standardized activity intensities remain limited. Prior field and modeling studies consistently show that MRT strongly governs outdoor thermal perception [19] and that tree shade substantially reduces MRT [16,20], yet season-resolved and activity-resolved stand morphology comparisons are still scarce. Building on this gap, we posit that stand morphology × season × activity interactions jointly shape comfort in urban forests.
Clarifying why this comparison matters helps bridge the mechanism and application. Resolving morphology × season × activity effects enables actionable guidance—namely, which stand type to program in which season and at which activity intensity—so that design and forest-healing programs align with the dominant thermal drivers rather than work against them. This study aims to contribute in three ways. First, it provides a season-resolved comparison of thermal comfort between an open stand (C1) and a closed-canopy stand (C2) within the same forest. Second, it models three-way interactions (SITE × SEASON × MET) using population-averaged generalized estimating equations (GEE) appropriate for repeated hourly data. Third, it estimates season-specific optimal MET levels to inform programming and design guidance for forest healing and recreation.
Direct human–subject experiments spanning multiple metabolic equivalent of task (MET) levels and seasons face practical and ethical constraints (e.g., standardizing exertion, clothing, and exposure windows). Simulation-based approaches can therefore complement field studies by (1) holding study conditions constant, (2) covering seasonal/activity combinations infeasible in trials, and (3) enabling explicit tests of site × season × activity interactions. Accordingly, we pursue three objectives that operationalize the contributions: we conduct a seasonal comparison of thermal comfort between two contrasting urban forest environments within the same forest (C1: open; C2: closed); we model the interactive effects of season, site, and MET on comfort; and we identify season-specific optimal MET levels.
We advance a mechanism-driven hypothesis that we evaluate using simulations and statistical analyses. Open stands are expected to enhance thermal comfort in cooler or transitional seasons through improved ventilation and greater net radiant heat loss, but they may incur higher radiant loads in warmer seasons due to direct insolation. Conversely, closed canopies are expected to mitigate radiant heat under hot conditions via shading, while potentially elevating humidity and reducing air movement, which may create unfavorable conditions in other seasons. These theoretical foundations underpin the subsequent empirical tests, which will be evaluated against the season-resolved results and interaction models presented in this study.

1.2. Related Work

Urban trees mitigate outdoor heat exposure through shading and evapotranspiration, improving thermal conditions in public spaces; the magnitude of cooling depends on canopy density, spatial configuration, and seasonal context [6,21]. Although this literature is extensive, direct, standardized comparisons between open and closed forest stands across seasons and activity intensities remain scarce, motivating a morphology–season–activity framing for urban forest comfort.
A substantial body of field and modeling work identifies MRT as a dominant term in outdoor heat balance and perception [19], with tree shade reducing radiant load and improving thermal comfort even when air-temperature reductions are modest [22,23]. Recent studies highlight the role of geometric view factors/SVF and surrounding surfaces in shaping MRT and comfort [24,25], reinforcing the expectation that stand morphology materially affects perceived conditions [26].
Standard frameworks (e.g., ASHRAE 55) define comfort criteria and measurement practices, while outdoor comfort studies emphasize the need for methodological standardization [27,28]. Although adaptive indices such as Universal Thermal Climate Index (UTCI) are widely recommended for outdoor assessments [29], Predicted Mean Vote (PMV) remains in use when explicit control of activity (MET) [30] and clothing insulation (clo) is required [17], including urban/forest contexts; its limitations under non-uniform radiation and wind are well noted [18,31]. In line with this practice, the present study employs PMV with a conservative comfort band (|PMV| ≤ 0.5) and interprets results as model-informed tendencies.
Parametric environmental toolchains—Ladybug/Honeybee within Grasshopper—are increasingly adopted to couple site geometry with hourly climate forcing for thermal comfort mapping and scenario testing in architecture, urban climatology, and energy/landscape applications [32,33,34]. Accuracy depends on boundary conditions and inputs; consequently, studies often recommend site-specific microclimate forcing and emphasize the need for in situ validation where feasible [28,35].
Activity intensity is commonly standardized using the Adult Compendium of Physical Activities, enabling reproducible mapping of study tasks to MET levels and facilitating cross-study comparisons with public-health and ergonomics literature [36]. For distribution-robust effect quantification, Cliff’s delta—derived from the Mann–Whitney U framework—provides a non-parametric measure of between-group separation [37,38]. To model repeated hourly observations at the population level, generalized estimating equations (GEE) offer marginal (population-averaged) inference with flexible working correlations suitable for environmental time series [39].

2. Materials and Methods

2.1. Study Sites and Forest Environment Modeling

This study was conducted at the Chungnam National University Academic Forest in Daejeon Metropolitan City, Republic of Korea, with the study site encompassing both an open forest area (C1) and a closed-canopy stand area (C2) for a comparative analysis of thermal comfort. This urban forest in Daejeon, which is popular with local residents, features a 1.75 km walking trail and rest areas. In 2021, it was renovated to create more forest healing and recreational spaces, including wooden decks, benches, and rest areas.
For this study, specific sites were chosen within the forest to ensure representative microclimates: an open forest area (C1) (36°22′26.5″ N 127°20′43.9″ E) characterized by wooden decks, benches, minimal tree cover, and direct solar exposure, and a densely wooded and closed area (C2) (36°22′16.9″ N 127°21′51.9″ E) characterized by a high canopy density offering substantial shade. Figure 1 shows the natural environment of the target sites, including hemispherical photographs and panoramic views of the surrounding areas, acquired on site with an Insta360 One X2 360° camera (Arashi Vision Inc., Shenzhen, Guangdong, China). The results using Gap Light Analyzer [40] showed that the canopy closure of C1 was 55.5% and the leaf area index (LAI) was 0.7, whereas the canopy closure of C2 was 74.9% and the LAI was 1.57. Table 1 summarizes stand structure and composition for C1 and C2. For the study, trees within 50 m diameter circular plots were surveyed. The edge of the study site was also a continuous forest environment, and we confirmed that the forest was continuous for more than twice the distance of the study site. This survey collected data on the orientation, elevation, slope, direction, species, spatial distribution, height, bole height, crown spread, and diameter at breast height.
To model the forest environments, a digital 3D tree-modeling algorithm was developed in Rhino (Robert McNeel & Associates, Seattle, WA, USA; version 7). utilizing the parametric design capabilities of Grasshopper (Robert McNeel & Associates, Seattle, WA, USA, version 1.0.0007). This algorithm, which had separate modules for broadleaf and coniferous species, generates detailed 3D tree models based on extensive field survey data. Figure 1 shows the 3D forest modeling results obtained using this modeling method and the actual site. This sophisticated modeling approach enables precise representation of forest structures, which is crucial for accurate microclimatic simulations. Outdoor thermal comfort conditions can be assessed via thermal comfort indices calculations in different software, such as ENVI-met, RayMan, and Ladybug (Ladybug Tools LLC, Fairfax, VA, USA; version 0.0.68, Grasshopper plug-in), which can be used to assess outdoor thermal comfort. However, ENVI-Met and RayMan are widely used for neighborhood-scale microclimate modeling. We selected Ladybug for its native coupling with detailed 3D stand geometry within Rhino/Grasshopper, which matched our small-plot focus

2.2. Thermal Environment Simulation

The thermal conditions were simulated using the PMV framework implemented using the Ladybug and Honeybee plugins in Grasshopper [32,41]. These software tools implement PMV calculations that are consistent with recognized thermal comfort methodologies [27]. Their widespread application spans various research domains, such as architecture, climate change, urban climatology, and thermal energy analysis, and they are primarily used to assess and optimize outdoor thermal environments [31,35,42]. The climate data inputs essential for the simulations were acquired from the Automatic Mountain Meteorology Observation System. The simulation results were generated as numerical data and subsequently visualized using color gradients on digital 3D forest models, thereby facilitating a clearer understanding of the thermal conditions throughout the study site.
The PMV, which is a widely recognized and comprehensive thermal comfort index, was employed for the thermal environment simulation. Globally, the PMV is one of the most widely applied indicators for assessing outdoor thermal environments [28]. Generally, outdoor thermal comfort indices such as UTCI are recommended, but in this study, PMV was utilized to account for variations in activity level (metabolic rate) and clothing insulation effect (clo). The standard UTCI assumes a fixed “light-walking” metabolic rate (≈2.3 MET; ≈135 W·m−2; ~4 km·h−1 ≈ 1.1 m·s−1) together with an adaptive clothing model, and thus cannot be varied by MET [30]. Nevertheless, UTCI analysis can be performed, and the results in Supplementary Table S6 and Figure S2 can be verified. PMV remains frequently used in the field of forest therapy and recreation [43,44]. It incorporates various meteorological parameters, including air temperature, wind speed, humidity, and mean radiant temperature. By accounting for activity level (metabolic rate (met)) and clothing insulation (clo), the PMV provides a comprehensive evaluation of the thermal comfort experienced by individuals in outdoor settings. The PMV value is evaluated as a comfort range of ±0.5 [27], with higher values indicating discomfort due to heat and lower values indicating discomfort due to cold.
In this experiment, the clothing factor was set to 1.1 clo for spring and fall, and 0.6 clo for summer. Winter was excluded from the study because of safety considerations regarding forest activities in South Korea. We standardized activity using the 2024 Adult Compendium of Physical Activities [36], mapping study tasks to MET 1.0–6.0 to ensure comparability with public health and ergonomics literature. The metabolic rate was set to 1.0 (reclining), 1.3 (sitting), 1.5 (standing), 2.0 (walking slowly), 3.0 (walking), 3.5 (calisthenics), 4.5 (walking at 3.0 mph), and 6.0 (jogging/walking combination) MET based on the latest standards [36]. Detailed explanations of the metabolic rate according to the latest standards are provided in Supplementary Tables S1 and S2.
Microclimate data are essential for analyzing thermal environments. Accurate simulation of the thermal environment requires comprehensive and continuous annual microclimate data. However, obtaining such data in Korea is challenging because of significant diurnal variations and the dynamic nature of forest environments. To address this issue, we utilized real-time forest microclimate data from the Automatic Mountain Meteorology Observation System via a climate measurement tower installed at the study site. AMOS data were provided by the Korea Forest Service. These data are accessible through an online system maintained by the Korea Forest Service. Hourly mountain climate data from 2023 to 2024 were also used in this study.

2.3. Thermal Comfort and Statistical Analyses

To assess thermal comfort variations across environments, seasons, and physical activity intensities, a two-stage statistical analysis was conducted using non-parametric effect size estimation and generalized estimating equation (GEE) modeling. All statistical analyses were performed using R software (version 4.0).

2.3.1. Comparative Analysis of Seasonal Mean PMV and Effect Sizes

To examine the differences in thermal comfort between the two forest environments (C1 and C2), two complementary analytical approaches were employed: comparison of seasonal mean PMV values by site and physical activity intensity, and non-parametric effect size estimation using Cliff’s delta, based on the distribution of PMV values.
For each season (spring, summer, and fall) and MET level (1.0–6.0), the hourly PMV values from the simulation were aggregated to compute the mean PMV scores separately for C1 and C2. These values were used to assess the overall thermal trends at each site under different activity intensities and seasonal microclimatic conditions. This comparison elucidated how the different canopy closures and environmental characteristics of C1 and C2 influenced thermal perception across different physiological demands and climatic periods.
To quantify the difference in thermal comfort between the two sites (C1 and C2), Cliff’s delta was calculated for each combination of season and MET level. This non-parametric effect size measure is robust to non-normal distributions and particularly appropriate for simulation-based or ordinal data [37]. It is derived from the Mann–Whitney U test and interprets the magnitude of group differences as follows: negligible (δ < 0.14), small (0.14 ≤ δ < 0.33), medium (0.33 ≤ δ < 0.47), and large (δ ≥ 0.47) [38]. This method provides a robust measure of the overlap between two distributions, indicating the probability that a randomly selected observation from one group will be larger than that from another.

2.3.2. Modeling Interactive Effects of Season, Site, and MET on Comfort (MET 1.0–1.5)

We used generalized estimating equations (GEE) [39] to examine how forest type, season, and activity intensity jointly affect thermal comfort. GEE was chosen to handle correlation in repeated hourly observations and to estimate population-averaged effects across sites, seasons, and activity levels. The analysis focused on low-intensity activities—MET 1.0 (reclining), 1.3 (sitting), and 1.5 (standing)—where microclimatic differences are most likely to influence perception because endogenous heat production is minimal.
The outcome was binary comfort based on PMV: values between −0.5 and +0.5 were coded as comfortable (1) and otherwise as uncomfortable (0), consistent with ASHRAE 55. Predictors were site (C1 open, C2 closed canopy), season (spring, summer, fall), MET (1.0, 1.3, 1.5), and their full interaction (SITE × SEASON × MET).
We specified a logit link and an AR(1) working correlation. Clusters were defined by site × MET × date, with 24 hourly observations per cluster (one day). Model adequacy and the value of interaction terms were assessed using QIC; statistical significance was evaluated with Wald χ2 tests. We report population-averaged associations and interpret them cautiously.

2.3.3. Estimating Season-Specific Optimal MET Levels Using GEE (MET 1.0–6.0)

To identify season-specific activity intensities that maximize comfort, we fitted an extended GEE over eight MET levels (1.0, 1.3, 1.5, 2.0, 3.0, 3.5, 4.5, 6.0). As stated above, comfort was a binary PMV outcome (|PMV| ≤ 0.5 = 1; otherwise = 0). Main predictors were site (C1, C2), season (spring, summer, fall), MET, and their full interaction (SITE × SEASON × MET). The model used a logit link with AR(1) to account for hourly dependence. Observations were clustered by site × MET × date (24 h per cluster). We computed robust standard errors to mitigate potential misspecification of the correlation structure. Model selection relied on QIC, and we used robust Wald χ2 statistics to test predictors and interactions. Our goal was to estimate, for each season and site, the predicted probability of comfort at each MET and thereby identify the MET associated with the highest comfort probability.

3. Results

3.1. Thermal Comfort Comparison

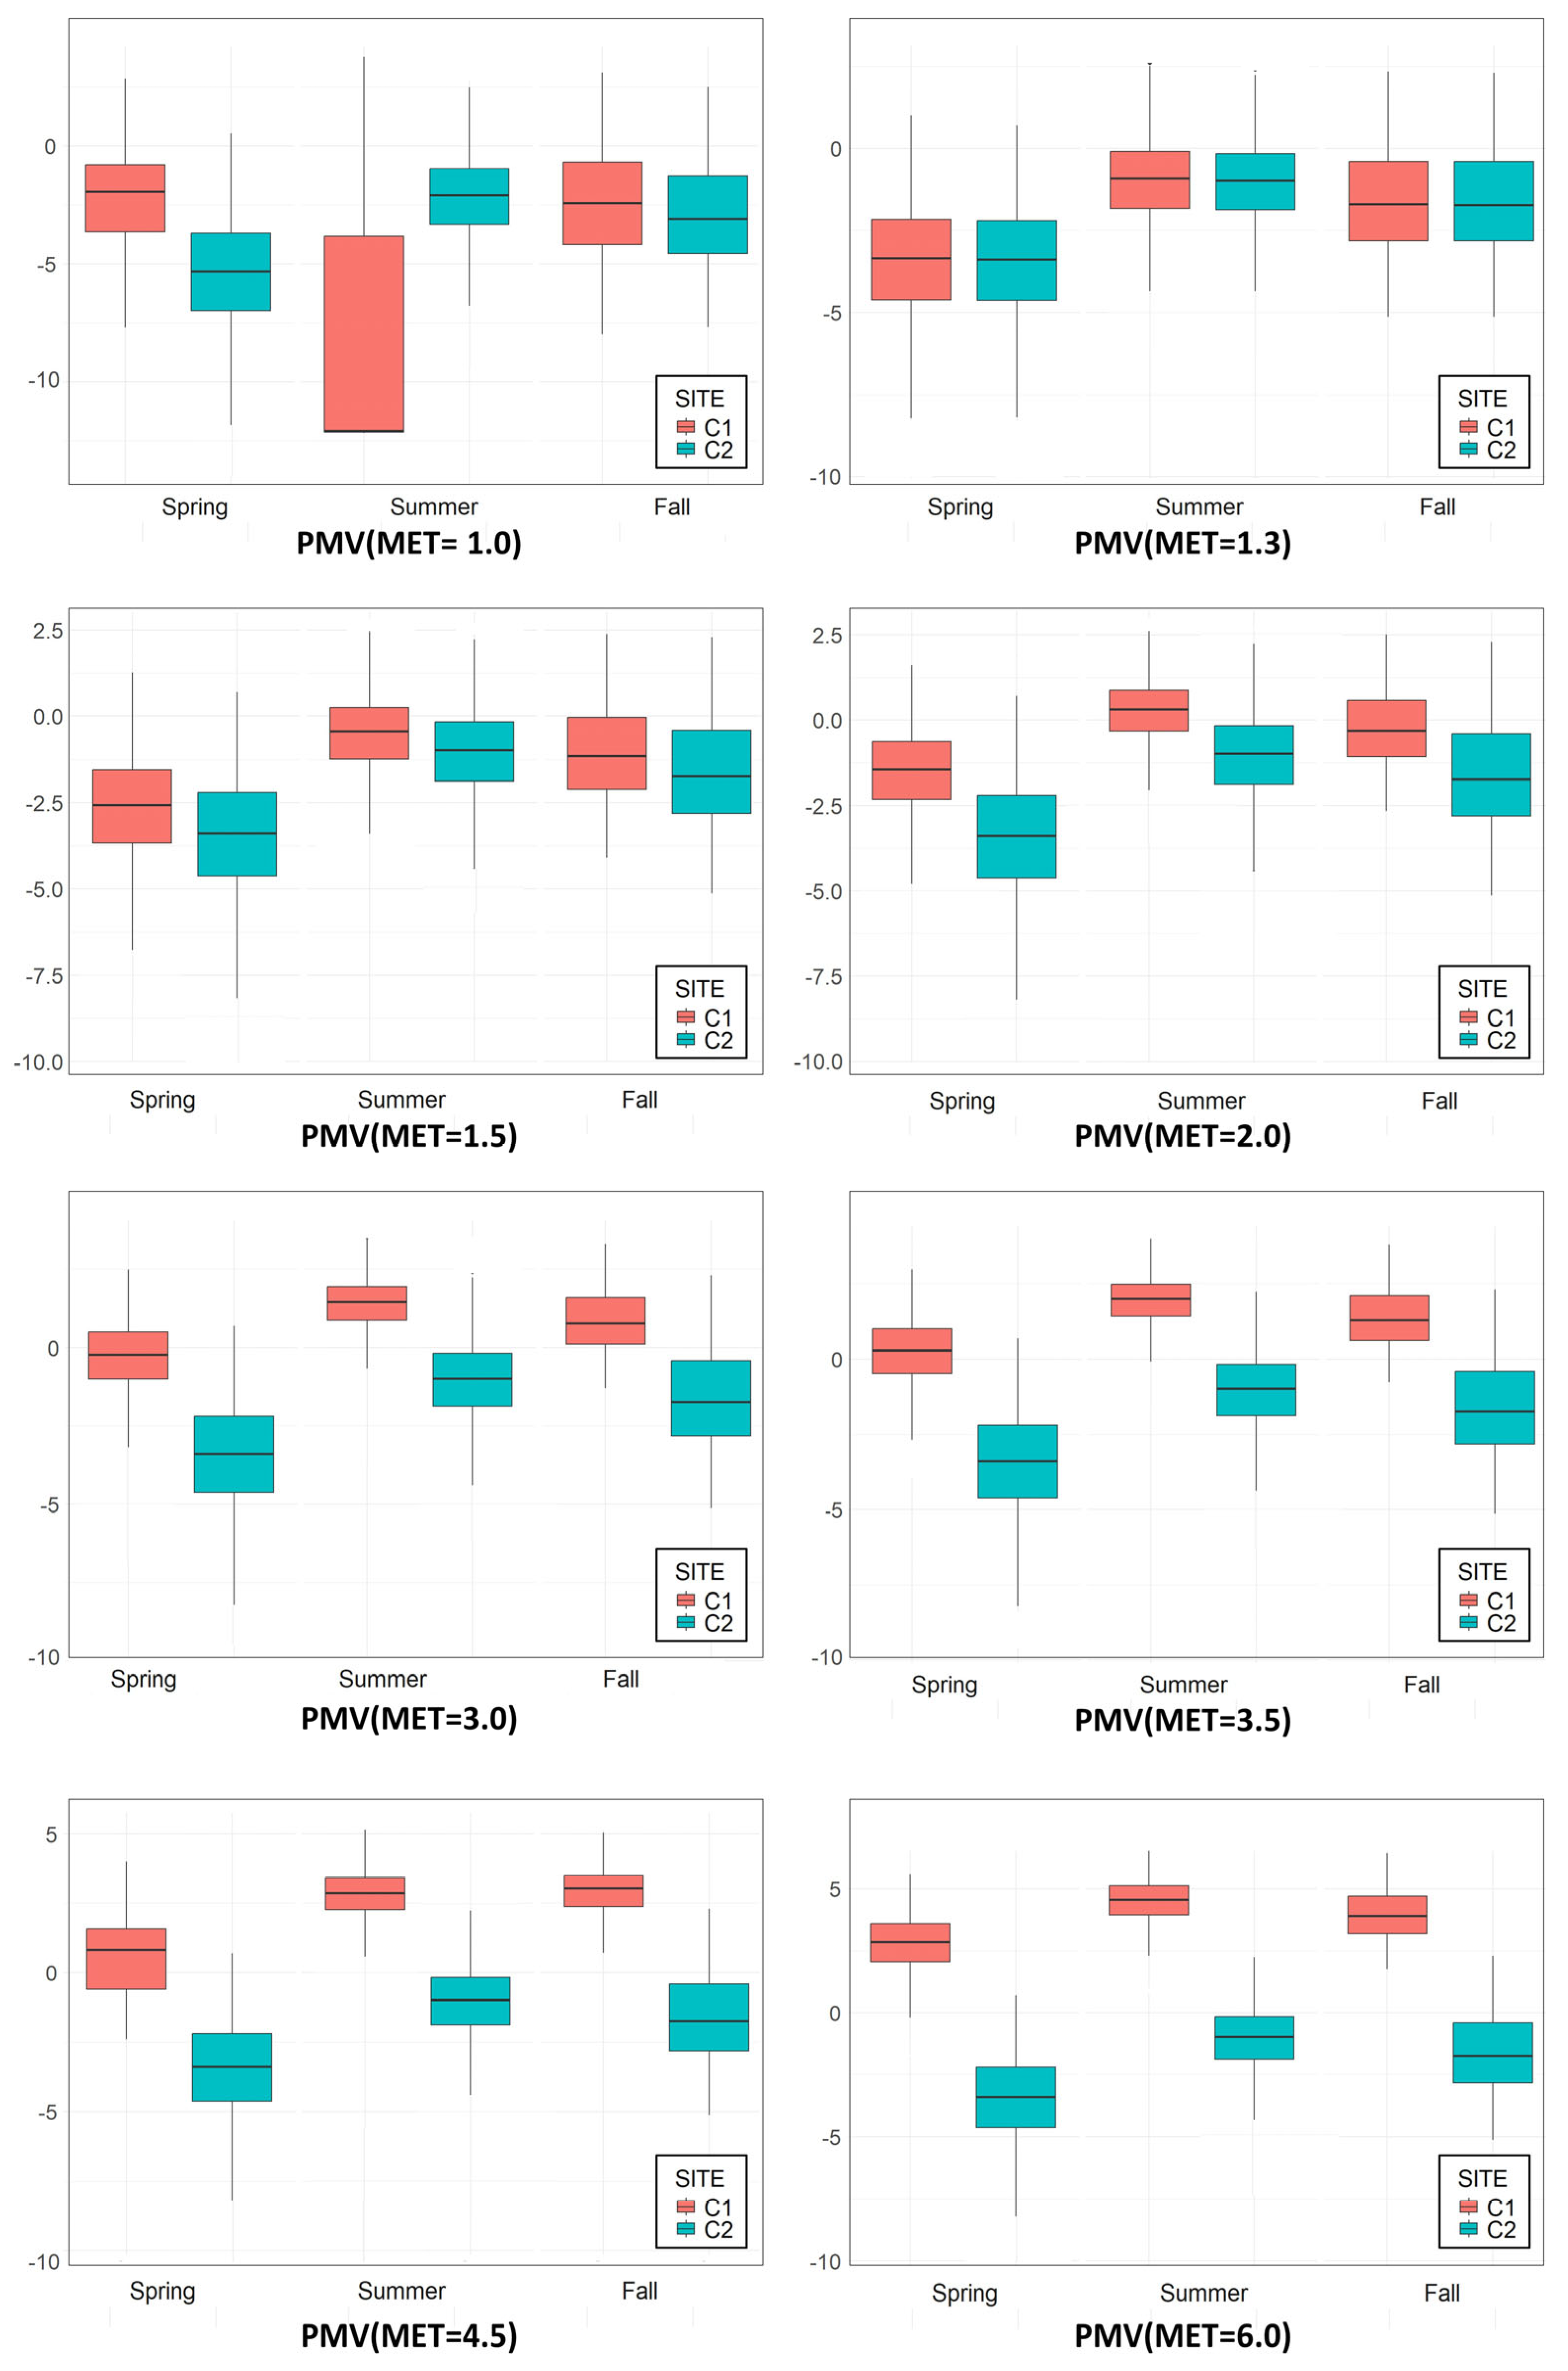
Across seasons, comfort generally increased from MET 1.0 to 2.0–3.0 and then declined at MET ≤ 4.5. The C1–C2 contrast reversed at MET 1.0 in summer but favored C1 otherwise; site differences narrowed as MET increased. Figure 2 summarizes the mean PMV values by season, site, and MET level.
To quantitatively assess the magnitude of these differences, Cliff’s delta effect size was computed for each season and MET level (Table 2). Under most conditions, C1 exceeded C2, with large effects at MET ≤ 2.0. At MET 3.0–6.0, δ > 0.86, indicating a strong probability that a randomly selected observation from C1 would be more thermally comfortable than one from C2.
At lower MET levels (1.0–1.5), the differences were more nuanced. While C1 generally remained more comfortable, an exception was observed at MET 1.0 during summer, where C2 exhibited better comfort outcomes (Cliff’s delta = −0.6693), likely reflecting canopy shading under high insolation. This reversal highlights the buffering effect of the closed canopy during the summer under minimal physical exertion. Conversely, in spring and at MET 1.0, C1 showed large positive effect sizes (δ = 0.6719), suggesting that seasonal context modifies the spatial advantage of open versus closed forest types. At MET 1.3 and 1.5, Cliff’s delta values across all seasons were close to zero and categorized as negligible to small, indicating relatively minor site-based differences in thermal comfort at these low activity levels.
Overall, the combination of visual (Figure 2) and statistical (Table 2) results indicates that C1 generally affords a more thermally comfortable environment than C2, particularly during higher levels of physical activity and—at very low MET—outside summer. The seasonal variability in site performance underscores the importance of accounting for both environmental structure and user activity profiles when performing thermal evaluations of forest recreational spaces.

3.2. Interaction Effects of Season, Site, and MET

To further explore how thermal comfort is influenced by the combined effects of forest structure, seasonal climate, and physical activity level, a GEE model was used, focusing on low-intensity physical activities (MET 1.0–1.5). The model incorporated a full interaction term (SITE × SEASON × MET) and demonstrated a statistically significant interaction effect (Wald χ2 = 48.6, df = 4, p < 0.001), indicating that the thermal comfort response was not independent but rather was shaped by the contextual interplay of space, season, and activity (Table 3). The full model fits better (QIC 25,056 vs. 25,195), supporting the inclusion of the interaction terms.
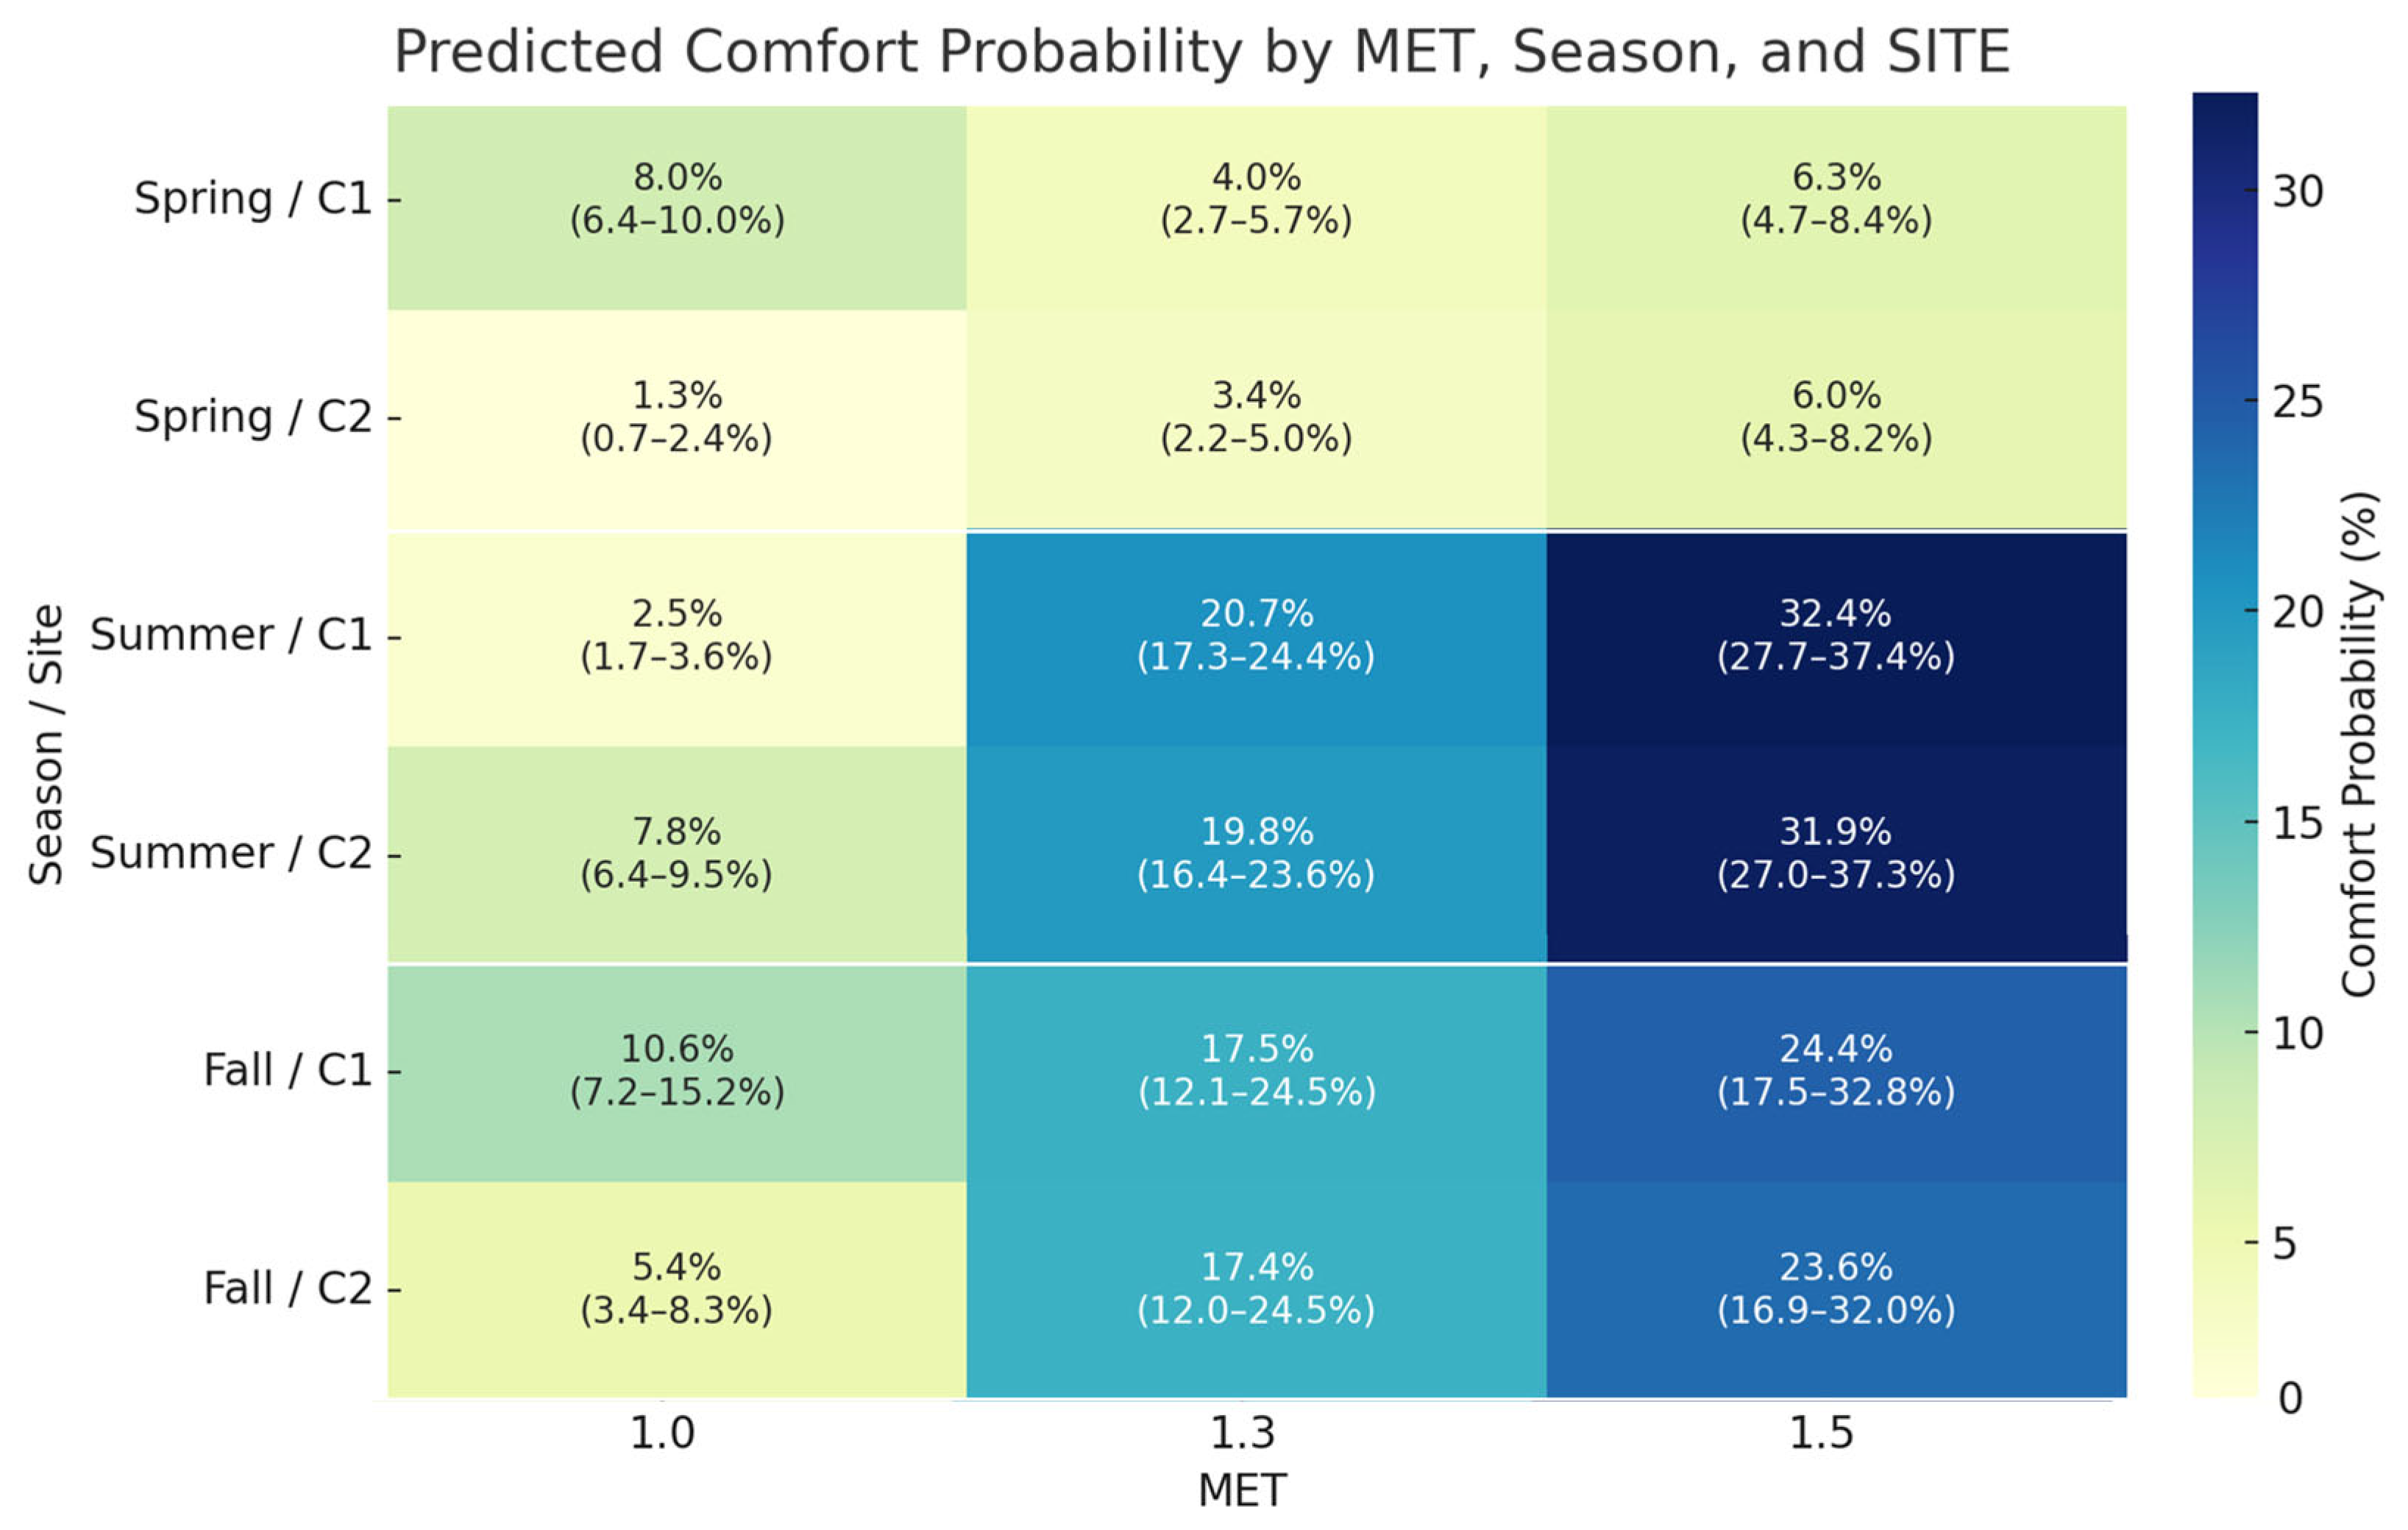
Figure 3 shows the predicted thermal comfort probabilities, with distinct patterns by season and forest type. At MET 1.0, with minimal endogenous heat, clear seasonal differences emerged between the open (C1) and closed (C2) forest environments.
In spring, C1 yielded a significantly higher comfort probability (8.0%) than C2 (1.3%). Similarly, in fall, C1 had a higher comfort probability (10.6%) than C2 (5.4%). However, in summer, this pattern was reversed, with C2 providing greater thermal comfort (7.8%) than C1 (2.5%). This reversal likely reflects the dense canopy of C2, providing shading and MRT buffering under strong insolation.
At MET 1.3–1.5, comfort probabilities increased, but site differences narrowed. While C1 consistently showed slightly higher comfort probabilities in spring and fall, and C2 showed higher values in summer, the differences were smaller than at MET 1.0 and statistically less pronounced.
Overall, the GEE results confirmed that thermal comfort during low-intensity activities was highly sensitive to the interaction between spatial and climatic variables, especially when physiological heat production was minimal. These findings encourage aligning stand characteristics with seasonal use, particularly for activities such as sitting, resting, and low-effort walking, which are common in forest-healing programs.
These results suggest that open forest structures may enhance thermal comfort under colder conditions via solar gains and ventilation. Conversely, in intense heat (e.g., summer), closed canopies offer shading and MRT buffering.

3.3. Optimal MET Selection by Season

To identify the optimal physical activity intensities that maximize thermal comfort in each season and forest environment, an extended GEE logit model was fitted using the full range of simulated MET levels (1.0–6.0). The model included SITE × SEASON × MET interactions and showed a significant overall effect (W = 1586.0, df = 14, p < 0.001; Table 3 and Table 4). This supports that thermal comfort is not solely dependent on individual factors such as season or activity intensity but emerges from their combined influence within specific contexts.
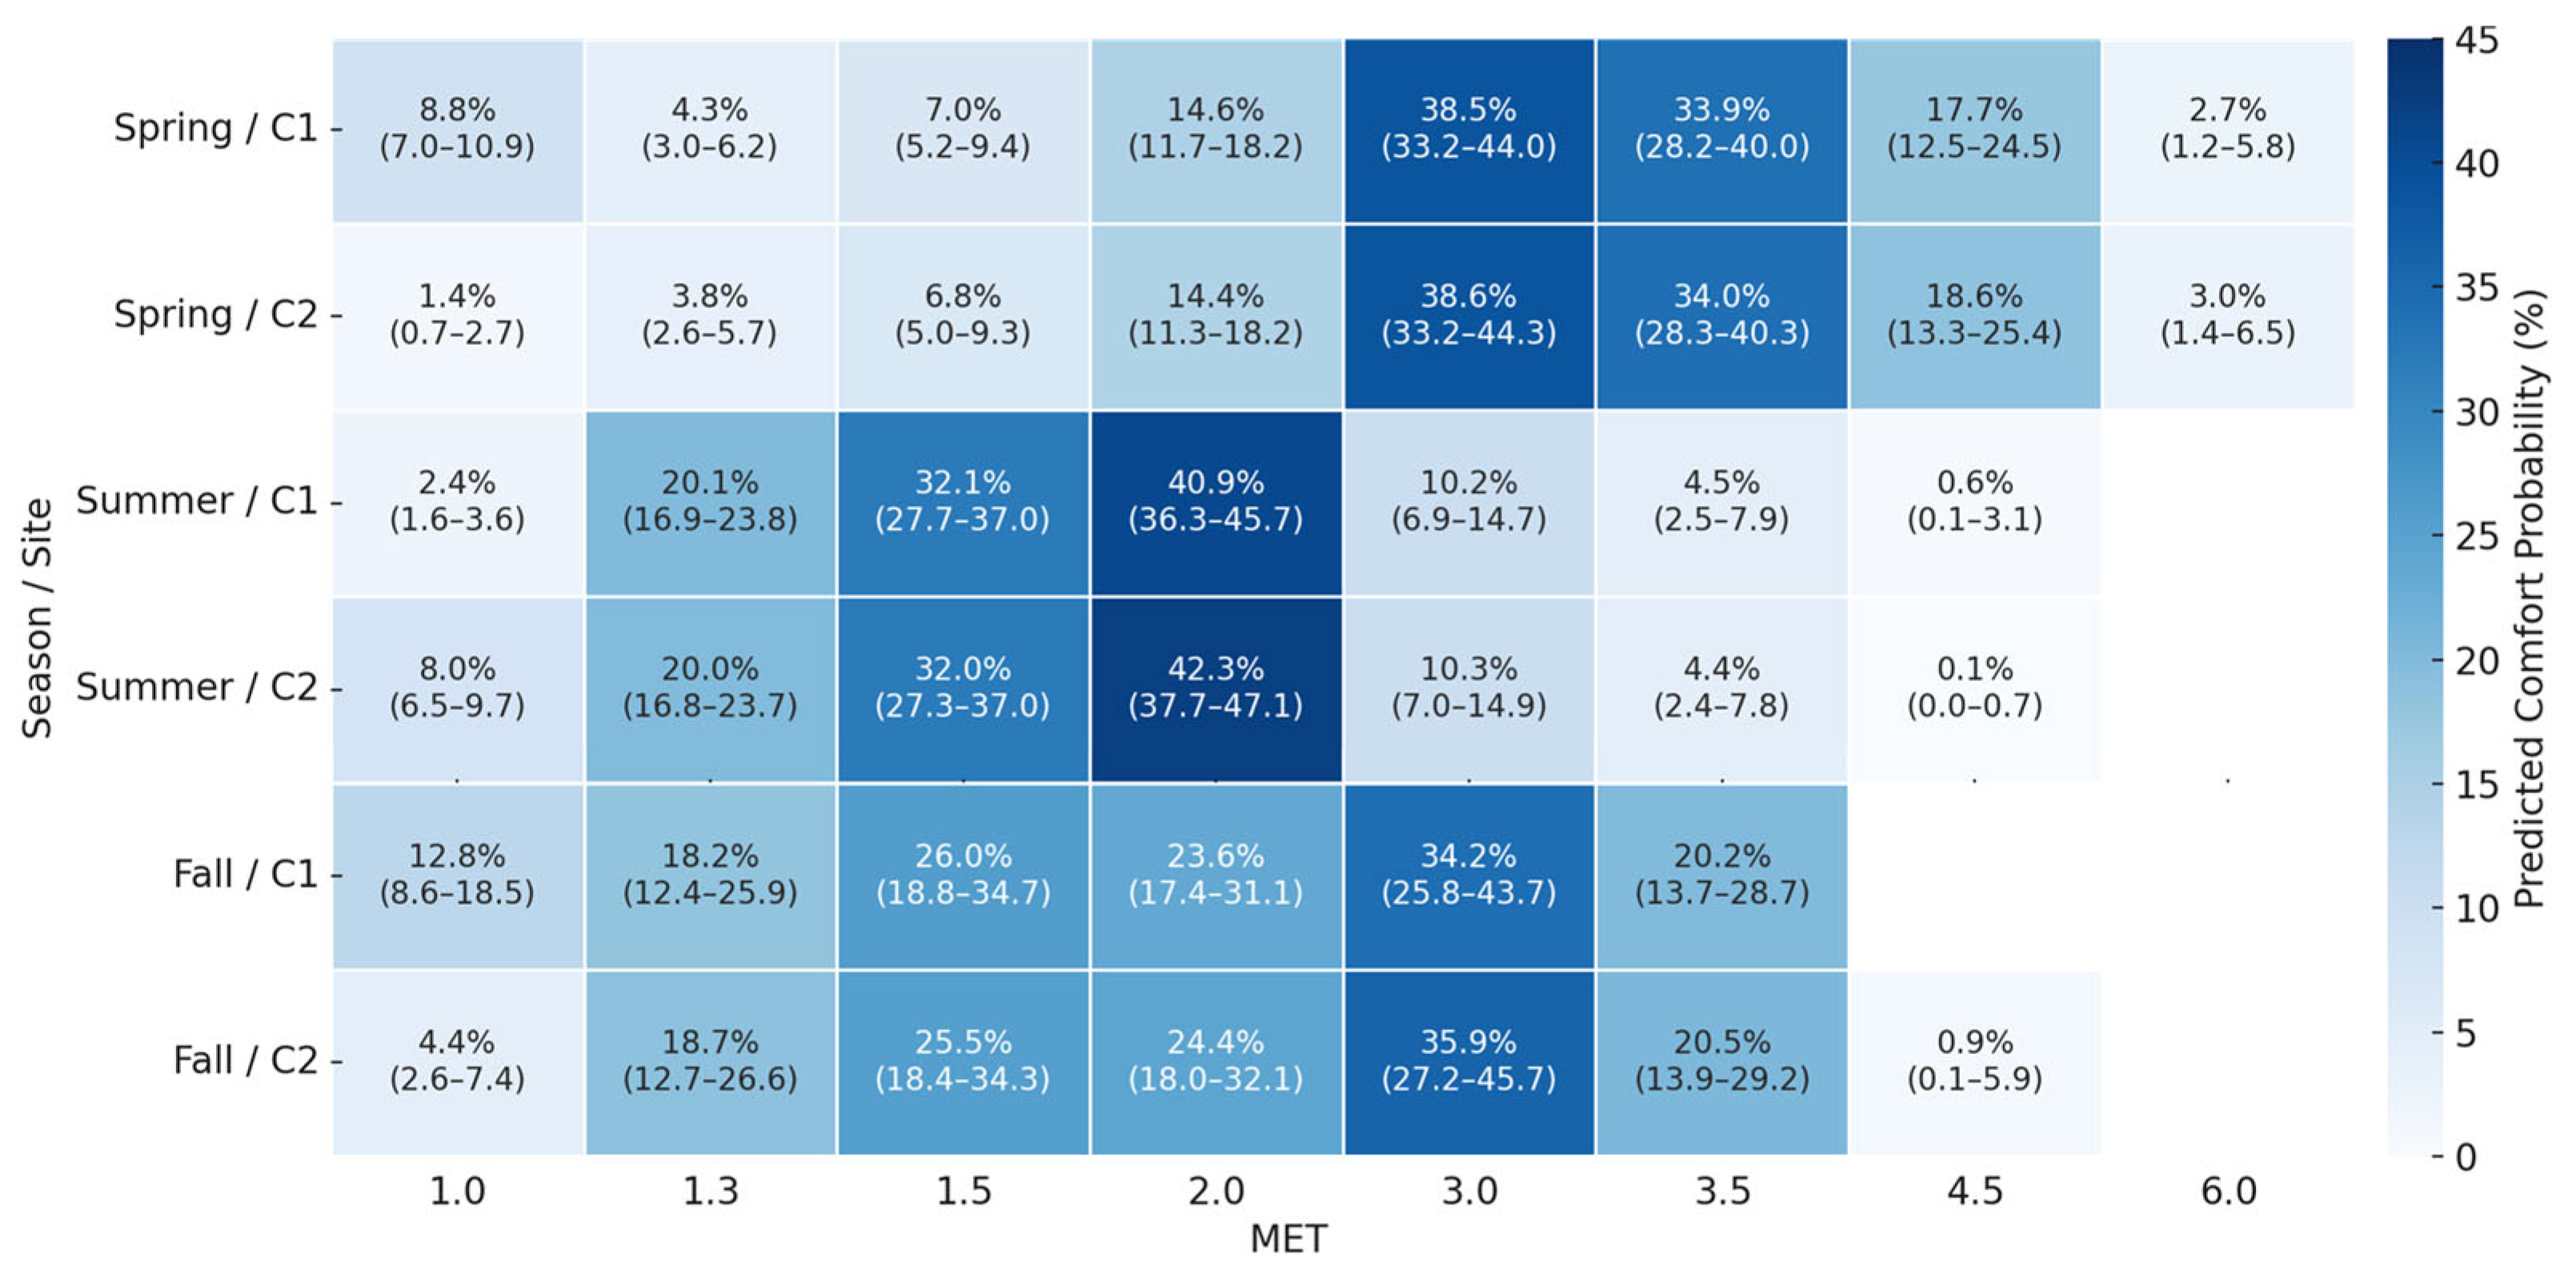
Figure 4 shows the predicted probability of thermal comfort across all combinations of site, season, and MET. In general, comfort probabilities peaked at moderate intensities (MET 2.0–3.0) and then declined sharply at higher intensities (≥4.5), indicating that mid-level exertion provides optimal thermal conditions across most scenarios.
In spring, both sites exhibited increasing comfort probabilities up to MET 3.0, with C1 peaking at 38.5% and C2 peaking at 38.6% (MET 2.0). Given the rapid decline ≥3.5, MET 3.0 was selected as optimal. These modeled predictions align with Supplementary Table S3, which reports the highest comfortable hours at MET 3.0 for both C1 (36.7%) and C2 (37.0%).
In summer, both sites again peaked at MET 2.0, yielding 40.9% (C1) and 42.3% (C2), consistent with Table S3 (observed 40.3% and 41.5%). Predicted probabilities fell <1% at MET ≥ 4.5. Supplementary Table S5 shows significant gains between MET 1.5 and 2.0 (ΔP_pred > 20%, p < 0.001), supporting MET 2.0–2.5 as optimal for summer.
In fall, C1 reached maximum predicted comfort at MET 3.0 (34.2%), while C2 peaked at MET 3.0–3.5 (35.9% and 20.5%). Supplementary Tables S4 and S5 indicate that MET 3.0 yielded significantly greater odds and probabilities of comfort than both lower and higher levels (p < 0.001), affirming MET 3.0 as optimal for fall. The observed comfort percentages in Table S3 are consistent, with the highest comfort rates at MET 3.0 for both C1 (34.4%) and C2 (35.3%).
Across all seasons, very high intensity (MET ≥ 4.5) consistently yielded extremely low comfort probabilities, indicating that such activities may lead to thermal stress and should be avoided, particularly in warmer periods. This is supported by Figure 4 and Table S3, as well as pairwise odds ratios (Table S4) and predicted difference estimates (Table S5). Supplementary Figure S1 offers temporal validation based on hourly PMV distributions: cold stress dominates at low MET (1.0–1.5) in spring/fall, whereas overheating appears at higher MET in summer, confirming that MET 2.0–3.0 balances endogenous heat generation and environmental thermal load.

4. Discussion

This simulation-based investigation systematically analyzed hourly thermal comfort, quantified via the PMV, within two distinct urban forest canopy morphologies (open and closed) across the spring, summer, and fall seasons and a range of activity intensities (MET). Within the limits of the modeled analysis, the four patterns were consistent with our hypotheses. First, the overall comfort was higher in C1 than in C2 across most seasons and MET levels (Figure 2; Table 2). Second, the SITE × SEASON × MET interaction was statistically significant in the GEE framework, underscoring the fact that spatial characteristics, temporal factors, and physical exertion levels exert a combined interdependent influence on thermal comfort (Table 3). Third, when the analysis was restricted to the comfort band (|PMV| ≤ 0.5), low-intensity activity (MET 1.0) showed clear seasonal reversals, with C1 > C2 in spring and fall and C2 > C1 in summer (Figure 3). Lastly, at moderate-to-high intensities (MET 1.3–2.0 and ≥3.0), spatial contrasts became small and comfortable hours declined sharply at the highest intensities (Figure 4). These findings suggest that the relative advantages of open versus closed forest stands are contingent upon both the prevailing season and the intended intensity of physical activity.
Across seasons and activity intensities, the site contrast between C1 and C2 was explained by differences in MRT rather than air temperature. Field and modeling studies have consistently identified MRT as a dominant term in outdoor heat balance and thermal perception because it aggregates shortwave and longwave fluxes incident on the human body [19,25]. In spring and fall, at low-intensity activity (MET 1.0), C1 benefited from enhanced solar gains and improved air circulation, which effectively mitigated the cooler temperatures and moisture loads. Conversely, in summer, at low-intensity activity (MET 1.0), C2 demonstrated benefits from canopy shading, which substantially reduced the shortwave radiation and MRT. Numerous field and street-canyon studies have corroborated that tree shade diminishes radiant heat and enhances outdoor thermal perception even with modest air temperature reductions [20,45]. This result indicates that radiant exposure rather than air temperature alone drives outdoor heat stress [26,46]. Accordingly, a dense canopy can deliver sufficient MRT suppression to overcome the ventilation advantage of open stands at low MET. Subsequently, as MET rises, endogenous heat production dominates, thereby compressing site differences and leading to rapid comfort collapse at ≥4.5.
The significant three-way interaction in the GEE models supports the view that location guidance should be conditional on the season and activity. In practice, prescribing a site type without considering when and how the space will be used may lead to suboptimal comfort outcomes. For programming and design, the following three implications are modest but actionable. First, for summer, low-intensity use (e.g., sitting and gentle strolling typical of forest-healing programs) and high-closure stands (C2-like) are preferable because of their shading and radiant buffering. Second, for spring and fall and for moderate intensities, open stands (C1-like) tend to perform better by combining ventilation with acceptable radiation levels. Third, high-intensity activities (≥4.5 MET) are likely to incur thermal stress, especially in warmer periods, suggesting that scheduling activities outside of warmer periods (e.g., avoiding peak solar hours or indoor program) will lead to greater thermal comfort.
However, this study had certain limitations that should be noted. The findings are simulation-based and hinge on PMV. Although PMV has been widely used, its accuracy degrades under non-uniform radiation and wind typical of outdoor and forested settings. Therefore, the comfort patterns reported here should be interpreted as model-informed rather than as direct observations. Moreover, these simulations depend on AMOS data. However, microsite-AMOS data mismatches (height, exposure, and terrain channeling) can cause residual biases at the pedestrian level. In addition, the results were derived from two plots within one academic forest over three seasons (excluding winters). Species composition, LAI, closure, terrain, urban adjacency, and synoptic regimes differ across forests, and generalizations should be limited to similar biophysical settings until multisite validation is available. Future research should pair in situ microclimate measurements with concurrent thermal sensation votes (TSVs).
Our findings transfer primarily to humid temperate settings with pronounced seasonality and to stand morphologies similar to our sites. As boundary conditions, the study stands exhibited canopy closure ≈ 55.5% (C1) vs. 74.9% (C2) and LAI ≈ 0.7 (C1) vs. 1.57 (C2). We therefore expect highest transferability to urban forests with comparable LAI/closure/SVF and terrain-induced ventilation. Reporting these morphology metrics enables cross-site synthesis independent of the city’s administrative designation.
Future work will add semi-open and multi-layered stands to expand the morphology gradient and sample size.

5. Conclusions

Within the modeled boundary conditions, H1 and H2 were supported (seasonal reversals at low MET consistent with ventilation vs. shading/MRT effects), and H3 was supported with a peak at MET 2.0–3.0 and a sharp decline at MET ≥ 4.5. This study combined site-based 3D forest modeling with hourly PMV simulations and GEE to examine how stand morphology (open vs. closed), season, and MET jointly shape outdoor thermal comfort in an urban forest. Three consistent insights emerged. First, the open stand generally yielded more favorable comfort conditions than the closed-canopy stand across most seasons and MET levels; however, this advantage was reversed at very low intensities in summer, when dense canopy shading reduced radiant load (lower MRT). Second, comfort exhibited a nonmonotonic relationship with activity, peaking at moderate exertion and declining sharply at high intensities. Third, a significant SITE × SEASON × MET interaction indicates that these factors are not mutually independent. These findings appear to be more strongly mediated by MRT than by air temperature alone. Open stands enhance ventilation and net radiant heat loss in cool or transitional seasons, whereas closed canopies buffer shortwave radiation in summer when endogenous heat production is minimal. Within the modeling framework, the optimal MET selections were 3.0 (spring), 2.0–2.5 (summer), and 3.0 (fall), and very high intensities (≥4.5 MET) were consistently unfavorable for comfort.
These results can be translated into actionable programming and design cues for urban forest healing and recreation. In summer, high-closure stands should be prioritized for low-intensity use (sitting and gentle strolling), and vigorous activities should not be scheduled during peak solar hours. In spring and fall, open stands better support low-to-moderate intensities by combining acceptable radiation with ventilation. Across seasons, very high intensities (≥4.5 MET) are likely to cause thermal stress, indicating that either temporal adjustments or alternative venues should be prioritized. Ultimately, this study underscores the need to consider the dynamic interactions between environmental factors, human physiology, and behavioral patterns to optimize thermal comfort in urban green spaces. Practically, our results provide a season–stand–intensity decision rule for practitioners: select high-closure canopies for low-intensity (low-MET) summer programming; favor open stands for MET 2.0–3.0 programming in spring/fall; avoid ≥4.5-MET activities in warm periods; and use measurable canopy targets (e.g., LAI and canopy closure reported here) together with comfort-probability maps to guide site selection, scheduling, and fine-scale design (e.g., seating placement, trail routing) in humid-temperate urban forests with similar morphology.

Supplementary Materials

The following supporting information can be downloaded at https://www.mdpi.com/article/10.3390/f16091424/s1. Table S1: MET Value by 2024 Adult Compendium of Physical Activities. Table S2: Different activities with the same amount of MET Value by 2024 Adult Compendium of Physical Activities. Table S3: Sample size and observed comfort rate by site, season, and MET. Table S4: Pairwise GEE Odds-Ratio Comparisons (Bonferroni). Table S5: Pairwise Differences in Predicted Probability of Comfort (Bonferroni-adjusted). Table S6: Analysis of Thermal Comfort at the Study Site Based on UTCI. Figure S1: Thermal Environment Simulations across Sites and MET. Figure S2: Analysis of Thermal Comfort at the Study Site Based on UTCI.

Author Contributions

Conceptualization, G.K. and D.S.; methodology, G.K.; software, G.K. and D.S.; validation, G.K., D.S., S.K. and M.P.; formal analysis, D.S., S.K. and M.P.; investigation, G.K., D.S., S.K. and C.K.; resources, G.K., D.S. and S.K.; data curation, D.S. and S.K.; writing—original draft preparation, G.K. and D.S.; writing—review and editing, G.K., D.S. and C.S.; visualization, G.K., D.S., S.K. and M.P.; supervision, G.K. and D.J.; project administration, G.K.; funding acquisition, B.-J.P. All authors have read and agreed to the published version of the manuscript.

Funding

This study was carried out with the support of ‘R&D Program for Forest Science Technology (Project No. RS-2024-00403952)’ provided by Korea Forest Service (Korea Forestry Promotion Institute).

Data Availability Statement

The original contributions presented in the study are included in the article/Supplementary Material; further inquiries can be directed to the corresponding author.

Conflicts of Interest

The authors declare no conflicts of interest.

Abbreviations

The following abbreviations are used in this manuscript:
METmetabolic equivalent of task
PMVPredicted Mean Vote
MRTmean radiant temperature
UHIurban heat island
GEEgeneralized estimating equation
QICquasi-likelihood under the independence model criterion

References

  1. Ponraj, M.; Lee, Y.Y.; Din, M.F.M.; Noor, Z.Z.; Iwao, K.; Chelliapan, S. Overview of Urban Heat Island (UHI) Phenomenon Towards Human Thermal Comfort. Environ. Eng. Manag. J. 2017, 1, 2097. [Google Scholar] [CrossRef]
  2. Harlan, S.L.; Brazel, A.J.; Prashad, L.; Stefanov, W.L.; Larsen, L. Neighborhood microclimates and vulnerability to heat stress. Soc. Sci. Med. 2006, 1, 2847. [Google Scholar] [CrossRef]
  3. Heaviside, C.; Macintyre, H.L.; Vardoulakis, S. The Urban Heat Island: Implications for Health in a Changing Environment. Curr. Environ. Health Rep. 2017, 1, 296. [Google Scholar] [CrossRef] [PubMed]
  4. Lai, D.; Lian, Z.; Liu, W.; Guo, C.; Liu, K.; Chen, Q. A comprehensive review of thermal comfort studies in urban open spaces. Sci. Total Environ. 2020, 742, 140092. [Google Scholar] [CrossRef] [PubMed]
  5. Wolf, K.L.; Lam, S.T.; McKeen, J.K.; Richardson, G.R.; Bosch, M.v.D.; Bardekjian, A.C. Urban Trees and Human Health: A Scoping Review. Int. J. Environ. Res. Public Health 2020, 1, 4371. [Google Scholar] [CrossRef]
  6. Endreny, T.A. Strategically growing the urban forest will improve our world. Nat. Commun. 2018, 9, 1–3. [Google Scholar] [CrossRef]
  7. Derks, J.; Giessen, L.; Winkel, G. COVID-19-induced visitor boom reveals the importance of forests as critical infrastructure. For. Policy Econ. 2020, 118, 102253. [Google Scholar] [CrossRef]
  8. Weinbrenner, H.; Breithut, J.; Hebermehl, W.; Kaufmann, A.; Klinger, T.; Palm, T.; Wirth, K. ‘The Forest Has Become Our New Living Room’—The Critical Importance of Urban Forests During the COVID-19 Pandemic. Front. For. Glob. Change 2021, 4, 672909. [Google Scholar] [CrossRef]
  9. Gillerot, L.; Rozario, K.; de Frenne, P.; Oh, R.; Ponette, Q.; Bonn, A.; Chow, W.; Godbold, D.; Steinparzer, M.; Haluza, D.; et al. Forests are chill: The interplay between thermal comfort and mental wellbeing. Landsc. Urban Plan. 2023, 242, 104933. [Google Scholar] [CrossRef]
  10. Zellweger, F.; De Frenne, P.; Lenoir, J.; Vangansbeke, P.; Verheyen, K.; Bernhardt-Römermann, M.; Baeten, L.; Hédl, R.; Berki, I.; Brunet, J.; et al. Forest microclimate dynamics drive plant responses to warming. Science 2020, 368, 772. [Google Scholar] [CrossRef]
  11. Blonder, B.; Both, S.; Coomes, D.A.; Elias, D.; Jucker, T.; Kvasnica, J.; Majalap, N.; Malhi, Y.S.; Milodowski, D.; Riutta, T.; et al. Extreme and Highly Heterogeneous Microclimates in Selectively Logged Tropical Forests. Front. For. Glob. Change 2018, 1, 5. [Google Scholar] [CrossRef]
  12. Frazer, G.W.; Canham, C.D.; Lertzman, K.P. Gap Light Analyzer (GLA); Version 2.0; Imaging Software to Extract Canopy Structure and Gap Light Transmission Indices from True-Colour Fisheye Photographs, Users Manual and Program Documentation; Simon Fraser University: Burnaby, BC, Canada; the Institute of Ecosystem Studies: Millbrook, NY, USA, 1999; Volume 36. [Google Scholar]
  13. Roudsari, M.S.; Pak, M.; Viola, A. Ladybug: A parametric environmental plugin for grasshopper to help designers create an environmentally-conscious design. In Proceedings of the Building Simulation Conference, Chambery, France, 25–28 August 2013; Volume 13, p. 3128. [Google Scholar] [CrossRef]
  14. Ladybug Is an Environmental Plugin for Grasshopper. 2021. Available online: https://github.com/ladybug-tools/ladybug-legacy (accessed on 28 September 2024).
  15. ASHRAE Standard 55; Thermal Environment Conditions for Human Occupancy. ASHRAE: Peachtree Corners, GA, USA, 2023.
  16. ISO 8996:2021; International Organization for Standardization, Ergonomics of the Thermal Environment—Determination of Metabolic Rate. ISO: Geneva, Switzerland, 2021. [CrossRef]
  17. ISO 9920:2007; International Organization for Standardization, Ergonomics of the Thermal Environment—Estimation of Thermal Insulation and Water Vapour Resistance of a Clothing Ensemble. ISO: Geneva, Switzerland, 2007. [CrossRef]
  18. ISO 7730:2005; International Organization for Standardization, Ergonomics of the Thermal Environment—Analytical Determination and Interpretation of Thermal Comfort Using Calculation of the PMV and PPD Indices and Local Thermal Comfort Criteria. ISO: Geneva, Switzerland, 2005. [CrossRef]
  19. Cheela, V.R.S.; John, M.; Biswas, W.K.; Sarker, P.K. Combating Urban Heat Island Effect—A Review of Reflective Pavements and Tree Shading Strategies. Buildings 2021, 1, 93. [Google Scholar] [CrossRef]
  20. Ioannou, L.G.; Foster, J.; Morris, N.B.; Piil, J.F.; Havenith, G.; Mekjavic, I.B.; Kenny, G.P.; Nybo, L.; Flouris, A.D. Occupational heat strain in outdoor workers: A comprehensive review and meta-analysis. Temperature 2022, 1, 67. [Google Scholar] [CrossRef] [PubMed]
  21. Lin, J.; Brown, R.D. Integrating Microclimate into Landscape Architecture for Outdoor Thermal Comfort: A Systematic Review. Land 2021, 10, 196. [Google Scholar] [CrossRef]
  22. Middel, A.; Krayenhoff, E.S. Micrometeorological determinants of pedestrian thermal exposure during record-breaking heat in Tempe, Arizona: Introducing the MaRTy observational platform. Sci. Total Environ. 2019, 687, 137. [Google Scholar] [CrossRef]
  23. Aram, F.; García, E.H.; Solgi, E.; Mansournia, S. Urban green space cooling effect in cities. Heliyon 2019, 5, e01339. [Google Scholar] [CrossRef] [PubMed]
  24. de Abreu-Harbich, L.V.; Labaki, L.C.; Matzarakis, A. Effect of tree planting design and tree species on human thermal comfort in the tropics. Landsc. Urban Plan. 2015, 138, 99. [Google Scholar] [CrossRef]
  25. Du, J.; Liu, L.; Chen, X.; Liu, J. Field Assessment of Neighboring Building and Tree Shading Effects on the 3D Radiant Environment and Human Thermal Comfort in Summer within Urban Settlements in Northeast China. Adv. Meteorol. 2020, 2020, 8843676. [Google Scholar] [CrossRef]
  26. Bröde, P.; Krüger, A.; Rossi, F.; Fiala, D. Deriving the operational procedure for the Universal Thermal Climate Index (UTCI). Int. J. Biometeorol. 2012, 56, 481–494. [Google Scholar] [CrossRef]
  27. Milošević, D.; Bajšanski, I.; Savić, S. Influence of changing trees locations on thermal comfort on street parking lot and footways. Urban For. Urban Green. 2017, 23, 113. [Google Scholar] [CrossRef]
  28. Macbeth, G.; Razumiejczyk, E.; Ledesma, R.D. Cliff’s Delta Calculator: A non-parametric effect size program for two groups of observations. Univ. Psychol. 2010, 1, 545. [Google Scholar] [CrossRef]
  29. Bröde, P.; Krüger, E.; Rossi, F.; Fiala, D. Predicting urban outdoor thermal comfort by the Universal Thermal Climate Index (UTCI)—A case study in Southern Brazil. Int. J. Biometeorol. 2012, 56, 471–480. [Google Scholar] [CrossRef]
  30. ISO 7726:1998; International Organization for Standardization, Ergonomics of the Thermal Environment—Instruments for Measuring Physical Quantities. ISO: Geneva, Switzerland, 1998.
  31. Park, B.; Furuya, K.; Kasetani, T.; Takayama, N.; Kagawa, T.; Miyazaki, Y. Relationship between psychological responses and physical environments in forest settings. Landsc. Urban Plan. 2011, 1, 24. [Google Scholar] [CrossRef]
  32. Rahman, A. Simulation of thermal comfort on public space and buildings around river in Banjarmasin-Indonesia. In IOP Conference Series Materials Science and Engineering; IOP Publishing: Bristol, UK, 2022; Volume 1, p. 12008. [Google Scholar] [CrossRef]
  33. Johansson, E.; Thorsson, S.; Emmanuel, R.; Krüger, E.L. Instruments and methods in outdoor thermal comfort studies—The need for standardization. Urban Clim. 2014, 10, 346. [Google Scholar] [CrossRef]
  34. Salata, F.; Golasi, I.; Vollaro, E.D.L.; Bisegna, F.; Nardecchia, F.; Coppi, M.; Gugliermetti, F.; Vollaro, A.D.L. Evaluation of Different Urban Microclimate Mitigation Strategies through a PMV Analysis. Sustainability 2015, 1, 9012. [Google Scholar] [CrossRef]
  35. Jayathissa, P.; Luzzatto, M.; Schmidli, J.; Hofer, J.; Nagy, Z.; Schlueter, A. Optimising building net energy demand with dynamic BIPV shading. Appl. Energy 2017, 202, 726. [Google Scholar] [CrossRef]
  36. Fang, Z.; Zhang, F.; Guo, Z.; Zheng, Z.; Feng, X. Investigation into the outdoor thermal comfort on different urban underlying surfaces. Urban Clim. 2024, 55, 101911. [Google Scholar] [CrossRef]
  37. Li, L.; Hong, J.; Ma, M.; Fan, C.; Xiu, X.; Pang, Y. Influence of view factors on outdoor thermal comfort of residential areas in hot-humid regions. Int. J. Biometeorol. 2024, 69, 261–274. [Google Scholar] [CrossRef]
  38. Guo, H.; Aviv, D.; Loyola, M.; Teitelbaum, E.; Houchois, N.; Meggers, F. On the understanding of the mean radiant temperature within both the indoor and outdoor environment, a critical review. Renew. Sustain. Energy Rev. 2019, 117, 109207. [Google Scholar] [CrossRef]
  39. Coutts, A.; White, E.C.; Tapper, N.; Beringer, J.; Livesley, S.J. Temperature and human thermal comfort effects of street trees across three contrasting street canyon environments. Theor. Appl. Climatol. 2015, 124, 55. [Google Scholar] [CrossRef]
  40. Song, D.; Park, S.; Lee, Y.H.; Kim, G. Thermal Comfort Simulation-Based Forest Management Scenarios for Forest Healing. Forests 2024, 1, 1859. [Google Scholar] [CrossRef]
  41. Peng, Y.; Feng, T.; Timmermans, H.H. A path analysis of outdoor comfort in urban public spaces. Build. Environ. 2019, 148, 459. [Google Scholar] [CrossRef]
  42. Herrmann, S.D.; Willis, E.A.; Ainsworth, B.E.; Barreira, T.V.; Hastert, M.; Kracht, C.L.; Schuna, J.M.; Cai, Z.; Quan, M.; Tudor-Locke, C.; et al. 2024 Adult Compendium of Physical Activities: A third update of the energy costs of human activities. J. Sport Health Sci. 2024, 1, 6. [Google Scholar] [CrossRef]
  43. Nachar, N. The Mann-Whitney U: A Test for Assessing Whether Two Independent Samples Come from the Same Distribution. Tutor. Quant. Methods Psychol. 2008, 1, 13. [Google Scholar] [CrossRef]
  44. Liang, K.; Zeger, S.L. Longitudinal Data Analysis Using Generalized Linear Models. Biometrika 1986, 1, 13. [Google Scholar] [CrossRef]
  45. Wong, N.H.; Tan, C.L.; Kolokotsa, D.D.; Takebayashi, H. Greenery as a mitigation and adaptation strategy to urban heat. Nat. Rev. Earth Environ. 2021, 2, 166–181. [Google Scholar] [CrossRef]
  46. Ouyang, W.; Morakinyo, T.E.; Ren, C.; Ng, E. The cooling efficiency of variable greenery coverage ratios in different urban densities: A study in a subtropical climate. Build. Environ. 2020, 174, 106772. [Google Scholar] [CrossRef]
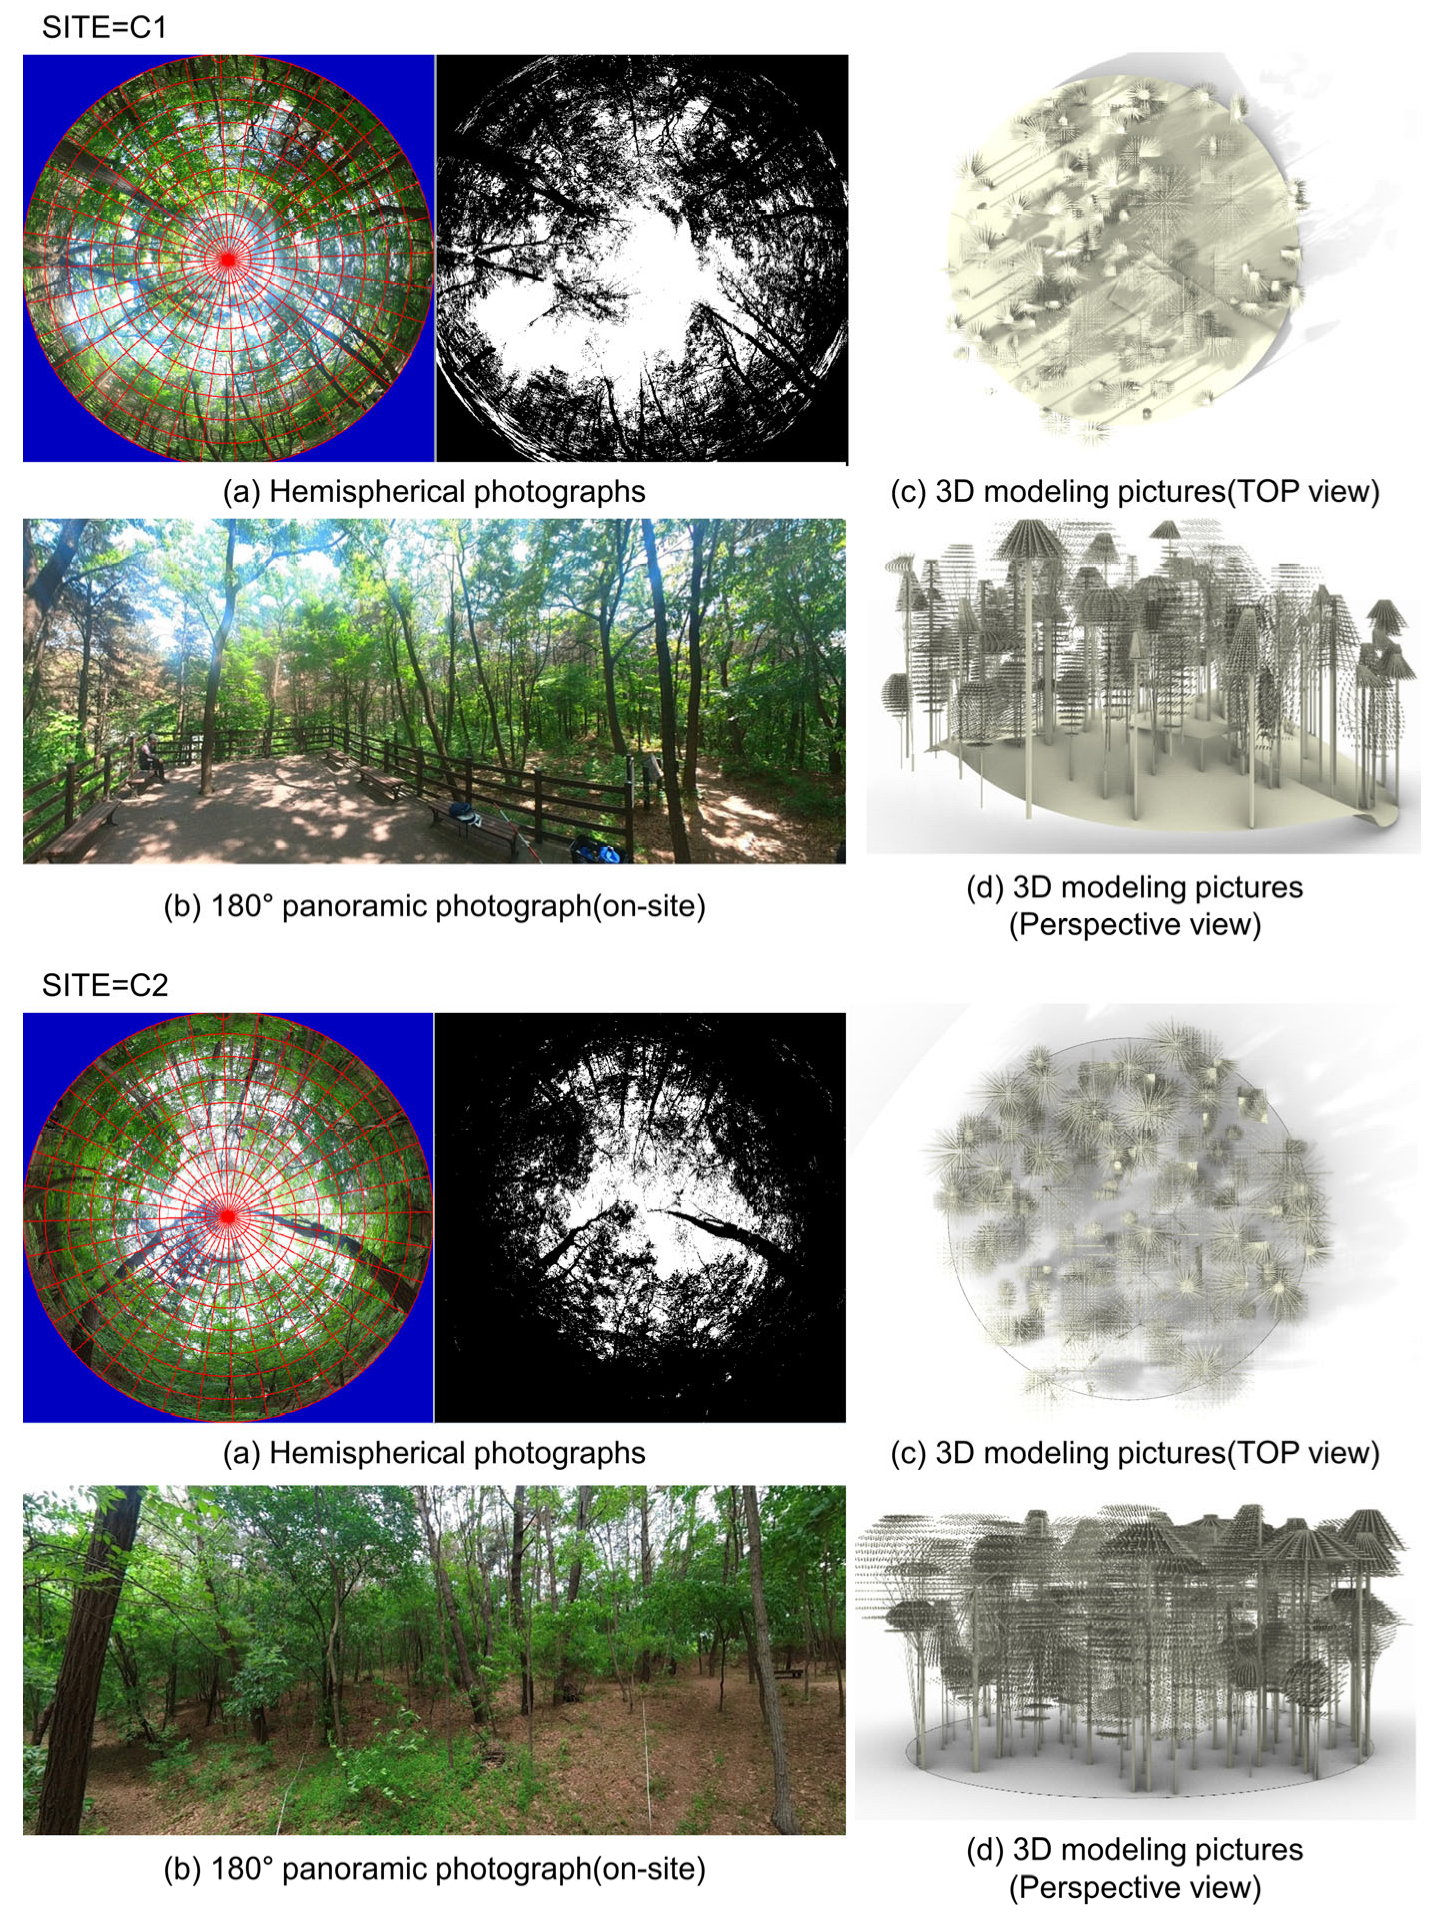
Figure 1. Characterization of the Natural Environment and 3D Modeling of the Study Sites.
Forests 16 01424 g001
Figure 2. Comparison of the Mean Predicted Mean Vote (PMV) by Study Site, Season, and Metabolic Equivalent of Task (MET).
Forests 16 01424 g002
Figure 3. Predicted Thermal Comfort Probability by Season, Site, and MET 1.0–1.5.
Forests 16 01424 g003
Figure 4. Predicted Thermal Comfort Probability by Season, Site, and MET 1.0–6.0.
Forests 16 01424 g004
Table 1. Stand structure and composition of the study plots (mean ± SD).
Site Stand Density
(Trees/ha)
Height
(m)
DBH
(cm)
Bole Height
(m)
Canopy Closure
(%)
LAIConifer Trees
(%)
Broadleaf Trees
(%)
C1
(open)
70315.1 ± 4.522.2 ± 10.62.1 ± 1.655.50.7044.955.1
C2
(closed)
84014.0 ± 3.919.0 ± 12.73.0 ± 1.974.91.5733.366.7
Table 2. Effect sizes (Cliff’s delta) for thermal comfort differences by environment, MET level, and season.
METSeasonMann–Whitney Up-ValueCliffs DeltaInterpretation
1.0 Spring4,075,3670.0000 0.6719 large
Summer806,1170.0000 −0.6693 large
Fall1,207,4020.0000 0.1267 negligible
1.3 Spring2,457,5480.6383 0.0082 negligible
Summer2,498,8160.1487 0.0251 negligible
Fall1,076,9130.8180 0.0049 negligible
1.5 Spring3,062,9530.0000 0.2565 small
Summer3,017,8250.0000 0.2380 small
Fall1,302,1860.0000 0.2151 small
2.0 Spring3,926,0950.0000 0.6106 large
Summer3,838,5670.0000 0.5747 large
Fall1,619,1230.0000 0.5109 large
3.0 Spring4,542,2430.0000 0.8634 large
Summer4,567,2190.0000 0.8736 large
Fall1,938,0750.0000 0.8085 large
3.5 Spring4,682,1910.0000 0.9208 large
Summer4,738,1660.0000 0.9438 large
Fall2,028,3340.0000 0.8927 large
4.5Spring4,654,4170.0000 0.9094 large
Summer4,843,3280.0000 0.9869 large
Fall2,132,1660.0000 0.9896 large
6.0 Spring4,871,5300.0000 0.9985 large
Summer4,874,7500.0000 0.9998 large
Fall2,143,0660.0000 0.9998 large
Table 3. Generalized estimating equation (GEE) logit model specification and global fit indices.
MET RangeOutcomeLinkWorking Corr.Cluster IDWavesClustersMax Sizeα
(AR1)
Scale
(γ)
QIC
(Full)
QIC
(Reduced)
Wald Three-Way
(W, df, p)
1.0, 1.3, 1.5 Comfort
(PMV ± 0.5)
logitAR(1)SITE × MET × dateHour
(0–23)
1488240.6730.91825,05625,19548.6, 4, <0.001
1.0–6.0Comfort
(PMV ± 0.5)
logitAR(1)SITE × MET × dateHour
(0–23)
3936240.7340.98767,54067,7901586.0, 14, <0.001
QIC: quasi-likelihood under the independence model criterion.
Table 4. Omnibus robust Wald tests from the GEE model (reference MET = 1.0).
EffectDfWp
SITE (C1 vs. C2) at MET ref = 1.0241775<0.001
Season main effect at MET ref = 1.0169844<0.001
MET main effect (vs. ref = 1.0)7363<0.001
SITE × Season161631<0.001
SITE × MET211757<0.001
Season × MET2844,075<0.001
SITE × Season × MET141586<0.001
C1, open canopy; C2, closed canopy.
Disclaimer/Publisher’s Note: The statements, opinions and data contained in all publications are solely those of the individual author(s) and contributor(s) and not of MDPI and/or the editor(s). MDPI and/or the editor(s) disclaim responsibility for any injury to people or property resulting from any ideas, methods, instructions or products referred to in the content.