Article

Land-Use Change Impacts on Glomalin-Related Soil Protein and Soil Organic Carbon in Huangshan Mountain Region

1
Changsha Center of Natural Resources Comprehensive Survey, China Geological Survey, Changsha 410600, China
2
Huangshan Observation and Research Station for Land-Water Resources, Huangshan 245400, China
3
Key Laboratory of Coupling Process and Effect of Natural Resources Elements, Ministry of Natural Resources, Beijing 100055, China
4
School of Biology and Food Engineering, Chuzhou University, No 1. Huifeng Road, Chuzhou 239000, China
*
Authors to whom correspondence should be addressed.
Forests 2025, 16(9), 1362; https://doi.org/10.3390/f16091362
Submission received: 20 July 2025 / Revised: 9 August 2025 / Accepted: 20 August 2025 / Published: 22 August 2025
(This article belongs to the Section Forest Soil)

Abstract

The glomalin-related soil protein (GRSP), a class of stable glycoproteins produced by arbuscular mycorrhizal fungi, constitute an important microbial-derived carbon pool in terrestrial ecosystems. However, the response of GRSP accumulation to land-use change and quantitative contribution to soil organic carbon (SOC) pools, as well as the environmental and edaphic factors controlling GRSP dynamics in different land-use systems, require further elucidation. To address these knowledge gaps, we systematically collected surface soil samples (0–20 cm depth) from 72 plots across three land-use types—tea plantations (TP; n = 24), artificial forests (AF; n = 24), and natural forests (NF; n = 24) in China’s Huangshan Mountain region between July and August 2024. GRSP was extracted via autoclaving (121 °C, 20 min) in 20 mM citrate buffer (pH 8.0), fractionated into total GRSP (T-GRSP), and quantified using the Bradford assay. Results revealed distinct patterns in soil carbon storage, with NF exhibiting the highest concentrations of both SOC (33.2 ± 8.69 g kg−1) and total GRSP (T-GRSP: 2.64 ± 0.34 g kg−1), followed by AF (SOC: 14.9 ± 2.55 g kg−1; T-GRSP: 1.42 ± 0.25 g kg−1) and TP (SOC: 7.07 ± 1.72 g kg−1; T-GRSP: 0.58 ± 0.11 g kg−1). Although absolute GRSP concentrations were lowest in TP, its proportional contribution to SOC remained consistent across land uses (TP: 8.72 ± 2.84%; AF: 9.69 ± 1.81%; NF: 8.40 ± 2.79%). Statistical analyses identified dissolved organic carbon and microbial biomass carbon as primary drivers of GRSP accumulation. Structural equation modeling further demonstrated that land-use type influenced SOC through its effects on MBC and fine-root biomass, which subsequently enhanced GRSP production. These findings demonstrate that undisturbed forest ecosystems enhance GRSP-mediated soil carbon sequestration, emphasizing the critical role of natural forest conservation in ecological sustainability.

1. Introduction

Soil organic carbon (SOC) dynamics are influenced by land-use changes, with implications for soil carbon sequestration and climate change mitigation [1,2]. The conversion of natural forest ecosystems to agricultural systems typically reduces SOC stocks by enhancing the decomposition of soil organic matter, driven by altered microbial activity, reduced carbon inputs, and physical disturbance [3], while reforestation generally enhances carbon sequestration [4,5]. In agricultural systems, frequent tillage disrupts fungal networks, potentially reducing plant litter inputs while promoting organo-mineral-associated, microbial necromass formation through enhanced microbial turnover of organic amendments [6]. Conversely, forest soils maintain higher levels of SOC due to undisturbed mycorrhizal networks and diverse plant inputs, though microbial-derived C contributions to SOC may be proportionally lower given the greater abundance of plant-derived C [7]. However, these uncertainties hinder predictions of SOC responses to land-use types, particularly the interactive effects of soil variables and management are understudied.
The glomalin-related soil protein (GRSP), a recalcitrant glycoprotein synthesized by arbuscular mycorrhizal fungi, constitutes a vital microbial-derived carbon pool in terrestrial ecosystems. Recent studies demonstrate that GRSP contributes substantially (5–20%) to SOC stocks, with residence times ranging from 6 to 42 years in various soil systems [8,9]. This persistent fungal byproduct plays dual roles in soil carbon cycling, functioning both as a stable carbon sink and as a key mediator of soil aggregate formation [10,11]. Its accumulation is strongly influenced by land management practices that affect host plant diversity and soil disturbance regimes [12]. The stable nature of glomalin has garnered increasing attention in carbon sequestration research, particularly for its potential role in mitigating CO2 emissions [13]. Total glomalin-related soil protein (T-GRSP) consists of two operationally defined fractions with distinct stability characteristics. The easily extractable fraction (EE-GRSP) corresponds to recently produced, more labile protein pools, while the difficult-to-extract fraction represents older, recalcitrant components bound within soil matrices [14]. Beyond its role as a carbon sink, GRSP critically improves soil aggregate stability by acting as a hydrophobic binding agent, promoting the formation of water-stable macro- and micro-aggregates. These aggregates enhance soil porosity, decrease bulk density, and mitigate erosion susceptibility. Additionally, the gel-like characteristics of GRSP increase the soil’s water retention capacity and promote hygroscopic water absorption, which buffers plants against drought stress and maintains optimal hydraulic conductivity in the rhizosphere. These glycoprotein fractions have been quantitatively detected in various terrestrial and marine ecosystems, demonstrating their ubiquitous distribution in both managed (e.g., croplands and plantations) and natural (e.g., forests, grasslands, and coastal wetlands) environments [12,15,16,17,18]. Current research demonstrates that GRSP exhibits remarkable biochemical resistance through its unique glycoprotein structure, including melanization and disulfide bonds formed by cross-linked glycoproteins [19], as well as chemical complexation mediated by iron/aluminum oxides [13]. Simultaneously, physical protection mechanisms such as microaggregate encapsulation and mineral surface adsorption further enhance its persistence in soils [8]. While numerous studies have established a positive correlation between GRSP and SOC content, the specific mechanisms through which GRSP influences SOC dynamics under varying land-use regimes remain insufficiently understood. This knowledge gap highlights the need for further investigation into how different land management practices affect GRSP-mediated carbon storage processes.
The Huangshan Mountain region represents a unique and ecologically significant component of China’s montane ecosystems, renowned for its granite peak forest landscapes that cover approximately 1200 km2 in Anhui Province [20]. The area’s distinctive granite landforms, formed through Mesozoic magmatic activity and subsequent tectonic uplift, create specialized microhabitats characterized by vertical vegetation zonation from subtropical evergreen broadleaved forests at lower elevations to alpine meadows at summits [21]. This environmental gradient supports high biodiversity and serves as a representative example of subtropical montane ecosystems in eastern China. Furthermore, the region is experiencing increasing land-use pressure, particularly the conversion of forests to tea plantations—a land-use transition that is widespread across southern China due to economic incentives. Despite its ecological prominence, surprisingly little research has investigated SOC dynamics across different land-use regimes in this region, particularly regarding the impacts of anthropogenic conversions between forests and tea plantations. Thus, findings from Huangshan not only contribute to the local understanding of soil carbon sustainability but also offer insights into the broader consequences of agricultural expansion on soil health in similar subtropical, mountainous regions. To address these knowledge gaps, we conducted this study in the Huangshan Mountain region, which features representative land-use systems. The objectives were to investigate the following: (1) variations in SOC and GRSP contents across tea plantations, artificial forests, and natural forests; (2) key biotic and abiotic drivers governing GRSP accumulation in these ecosystems; and (3) the mediating role of GRSP in SOC sequestration under different land-use types. Our findings will enhance understanding of microbe-mediated carbon cycling, providing a scientific basis for developing localized land-use strategies for analogous ecosystems with comparable soil conditions.

2. Materials and Methods

2.1. Study Site and Sampling Approach

The study was conducted in Huangshan City, Anhui Province, located at the junction of Anhui, Zhejiang, and Jiangxi Provinces, covering a total area of 9807 km2. The region is characterized by abundant forest resources, with a forest coverage rate of 73%. The study area experiences a subtropical monsoon climate with distinct humid characteristics, exhibiting consistently mild thermal conditions (mean annual temperature of 15.2 ± 2.1 °C) coupled with substantial atmospheric moisture (mean relative humidity of 78 ± 5%). Precipitation patterns reveal considerable hydrologic inputs, with a 20-year mean annual rainfall of 1663 mm, reflecting the region’s pronounced moisture availability. The terrain is predominantly mountainous and hilly, interspersed with scattered river valleys and basins. The dominant vegetation included slash pine (Pinus elliottii), elm (Ulmus spp.), bamboo (Phyllostachys spp.), pine (Pinus spp.), spruce (Picea spp.), and tea plants (Camellia sinensis). The dominant soil type is red soil, which is acidic (pH 4.5–5.5) and exhibits rapid organic matter decomposition, resulting in relatively low fertility.
The sampling sites spanned an elevational gradient ranging from 195 to 418 m, with complete geospatial coordinates provided in Table S1. Following standardized soil sampling protocols [22], we established 24 independent plots for each land-use type—tea plantation, artificial forest, and natural forest—resulting in a total of 72 plots. Soil samples were collected between July and August 2024. Within each plot, five composite soil samples were collected from the 0 to 20 cm depth layer using a 5 cm diameter soil auger, avoiding areas of recent disturbance. According to the World Reference Base for Soil Resources, the dominant soils are classified as Luvisols. Samples were immediately placed in sterile bags and stored at 4 °C prior to processing.
In the laboratory, soil samples were sieved through a 2 mm mesh to remove stones, roots, and organic debris. Fine root biomass (FRB) was determined by separating roots into live and dead components based on morphological characteristics. Fine root was then oven-dried at 65 °C for 48 h to constant weight and expressed on an area basis (g m−2). All soil samples were air-dried at room temperature (20–25 °C) in a well-ventilated laboratory environment, away from direct sunlight, to preserve sample integrity. After drying, samples were gently ground and passed through a 2 mm sieve before analysis. A subsample of fresh soil was retained at 4 °C for analysis of microbial biomass carbon and nitrogen (MBC and MBN). The remaining soil was air-dried and used for physicochemical characterization.

2.2. Extraction and Quantification of GRSP

Two GRSP fractions were extracted and quantified following the protocol of Wright and Upadhyaya [23], with some modifications. For the easily extractable glomalin-related soil protein (EE-GRSP) fraction, 0.5 g of ground soil was mixed with 4 mL of 20 mM sodium citrate buffer (pH 7.0) and autoclaved at 121 °C for 30 min. After cooling, the supernatant was collected following centrifugation at 10,000 rpm for 10 min. The total glomalin-related soil protein (T-GRSP) fraction was sequentially extracted using 1.0 g of soil with 8 mL of 50 mM sodium citrate buffer (pH 8.0). Each extraction cycle involved autoclaving at 121 °C for 60 min, followed by centrifugation (10,000 rpm for 10 min). This process was repeated six times until the supernatants became nearly colorless. The supernatants from all cycles were pooled to represent the T-GRSP fraction. Both GRSP fractions were quantified using the Bradford assay, with bovine serum albumin as the standard. Absorbance was measured at 595 nm using a UV–Vis spectrophotometer (UV-8900, Shimadzu Corporation, Japan).

2.3. Determination of Soil Variables

Soil physicochemical analyses were performed according to standardized methods [22]. SOC was quantified through dichromate redox titration, and total nitrogen (TN) content was analyzed using continuous flow analysis following H2SO4 digestion. Soil pH was measured potentiometrically (FE20K, Mettler-Toledo, Zurich, Switzerland) in a 2.5:1 (v/w) suspension of deionized water to air-dried soil. For dissolved organic carbon (DOC), samples were extracted with 0.5 M K2SO4 (1:4 w/v) and analyzed using an organic carbon analyzer (Vario TOC Cube, Elementar, Germany). Inorganic N (NH4+-N and NO3-N) were extracted with 2 M KCl and analyzed by flow injection analysis or spectrophotometry (AutoAnalyzer 3, SEAL Analytical, Norderstedt, Germany). Total phosphorus (TP) in soil samples were digested using the H2SO4–H2O2 method and determined by the ascorbic acid–molybdenum blue method at 880 nm. Soluble active phosphorus (SAP) were extracted with 0.5 M NaHCO3 and measured spectrophotometrical procedure (UV-8900, Shimadzu Corporation, Japan). Microbial biomass carbon (MBC) was assessed by chloroform fumigation-extraction, calculated as the DOC difference between fumigated and non-fumigated samples with a 0.45 conversion factor. Exchangeable cations (K, Na, Ca, and Mg) were analyzed following by previous study [24].

2.4. Statistical Analyses

Statistical analyses were performed to examine differences and relationships among soil variables. Differences in GRSP content and its contribution to SOC across land-use types were evaluated using one-way ANOVA followed by Tukey’s HSD post hoc test (p < 0.05). We assessed relationships between GRSP content, its SOC contribution, and soil variables through Mantel analysis implemented in the “vegan” package. Associations between soil biotic and abiotic factors were examined using Spearman’s rank correlation analysis. To determine the relative importance of various soil factors in predicting GRSP fractions, we conducted random forest analysis using the “randomForest” and “rfPermute” packages. The analysis incorporated both biotic (i.e., MBC and MBN) and abiotic (i.e., SOC, pH, NH4+-N, NO3-N, TN, Ca2+, Mg2+, K+, and Na+) factors. Variable importance was quantified as the percentage increase in mean squared error (%IncMSE), with higher values indicating greater predictive importance.
We employed partial least squares structural equation modeling (PLS-SEM) to examine the direct and indirect pathways through which soil variables influence T-GRSP accumulation and SOC content. The model was constructed using variables identified as important in our prior random forest analysis. Implemented in the “plspm” package (R Statistical Environment, version 4.5.0), the analysis used a significance threshold of p < 0.05. Following conventional standards, we included only observed variables with average loadings (>0.70) for latent variables. Model adequacy was assessed using goodness-of-fit indices, with higher values representing superior model performance.

3. Results

3.1. SOC and GRSP Contents in Tea Plantation and Forest Soils

The SOC content differed significantly according to land-use patterns (Table S2). The average SOC content in the tea plantation and artificial and natural forest soils ranged from 4.37 to 9.61 g kg−1 (means ± standard error, 7.07 ± 1.72 g kg−1), 10.4 to 20.9 g kg−1 (14.9 ± 2.55 g kg−1), and 19.3 to 51.5 g kg−1 (33.2 ± 8.69 g kg−1), respectively (Figure S1). Natural forest soils contained 2.2-fold (p < 0.001) SOC more than artificial forest soils and 4.7-fold (p < 0.001) than tea plantation soils. Consistent with the trends in SOC, both content of EE-GRSP and T-GRSP were significantly higher in natural forest soils than that in the artificial forest and tea plantation (Figure 1a). On average, the accumulation of EE-GRSP accounted for 0.241 ± 0.043 g kg−1, 0.339 ±0.061 g kg−1, and 0.385 ± 0.063 g kg−1 in the tea plantation and artificial and natural forest soils, respectively. While the average T-GRSP content in the topsoil was 0.578 ± 0.111 g kg−1, 1.42 ± 0.250 g kg−1, and 2.64 ± 0.339 g kg−1 in the tea plantation and artificial and natural forest soils, respectively. However, the case was inverse for the contribution of GRSP to SOC. The contribution of EE-GRSP to SOC being significantly higher in tea plantation (3.62% ± 1.11%) than in artificial forest (2.35% ± 0.63%; p < 0.01) and natural forests (1.25% ± 0.44%; p < 0.01). The T-GRSP contributed for an average of 8.72% ± 2.84%, 9.69% ± 1.81%, and 8.40% ± 2.79% of the SOC, while there was no significant difference between the three land-use-type soils (Figure 1b). The EE-GRSP/T-GRSP ratios depended on the land-use types, with the ratio in natural forest soils being significantly lower than that in artificial forest soils and tea plantation soils (Figure 1c).

3.2. Relationships Between GRSP and Soil Biotic and Abiotic Factors

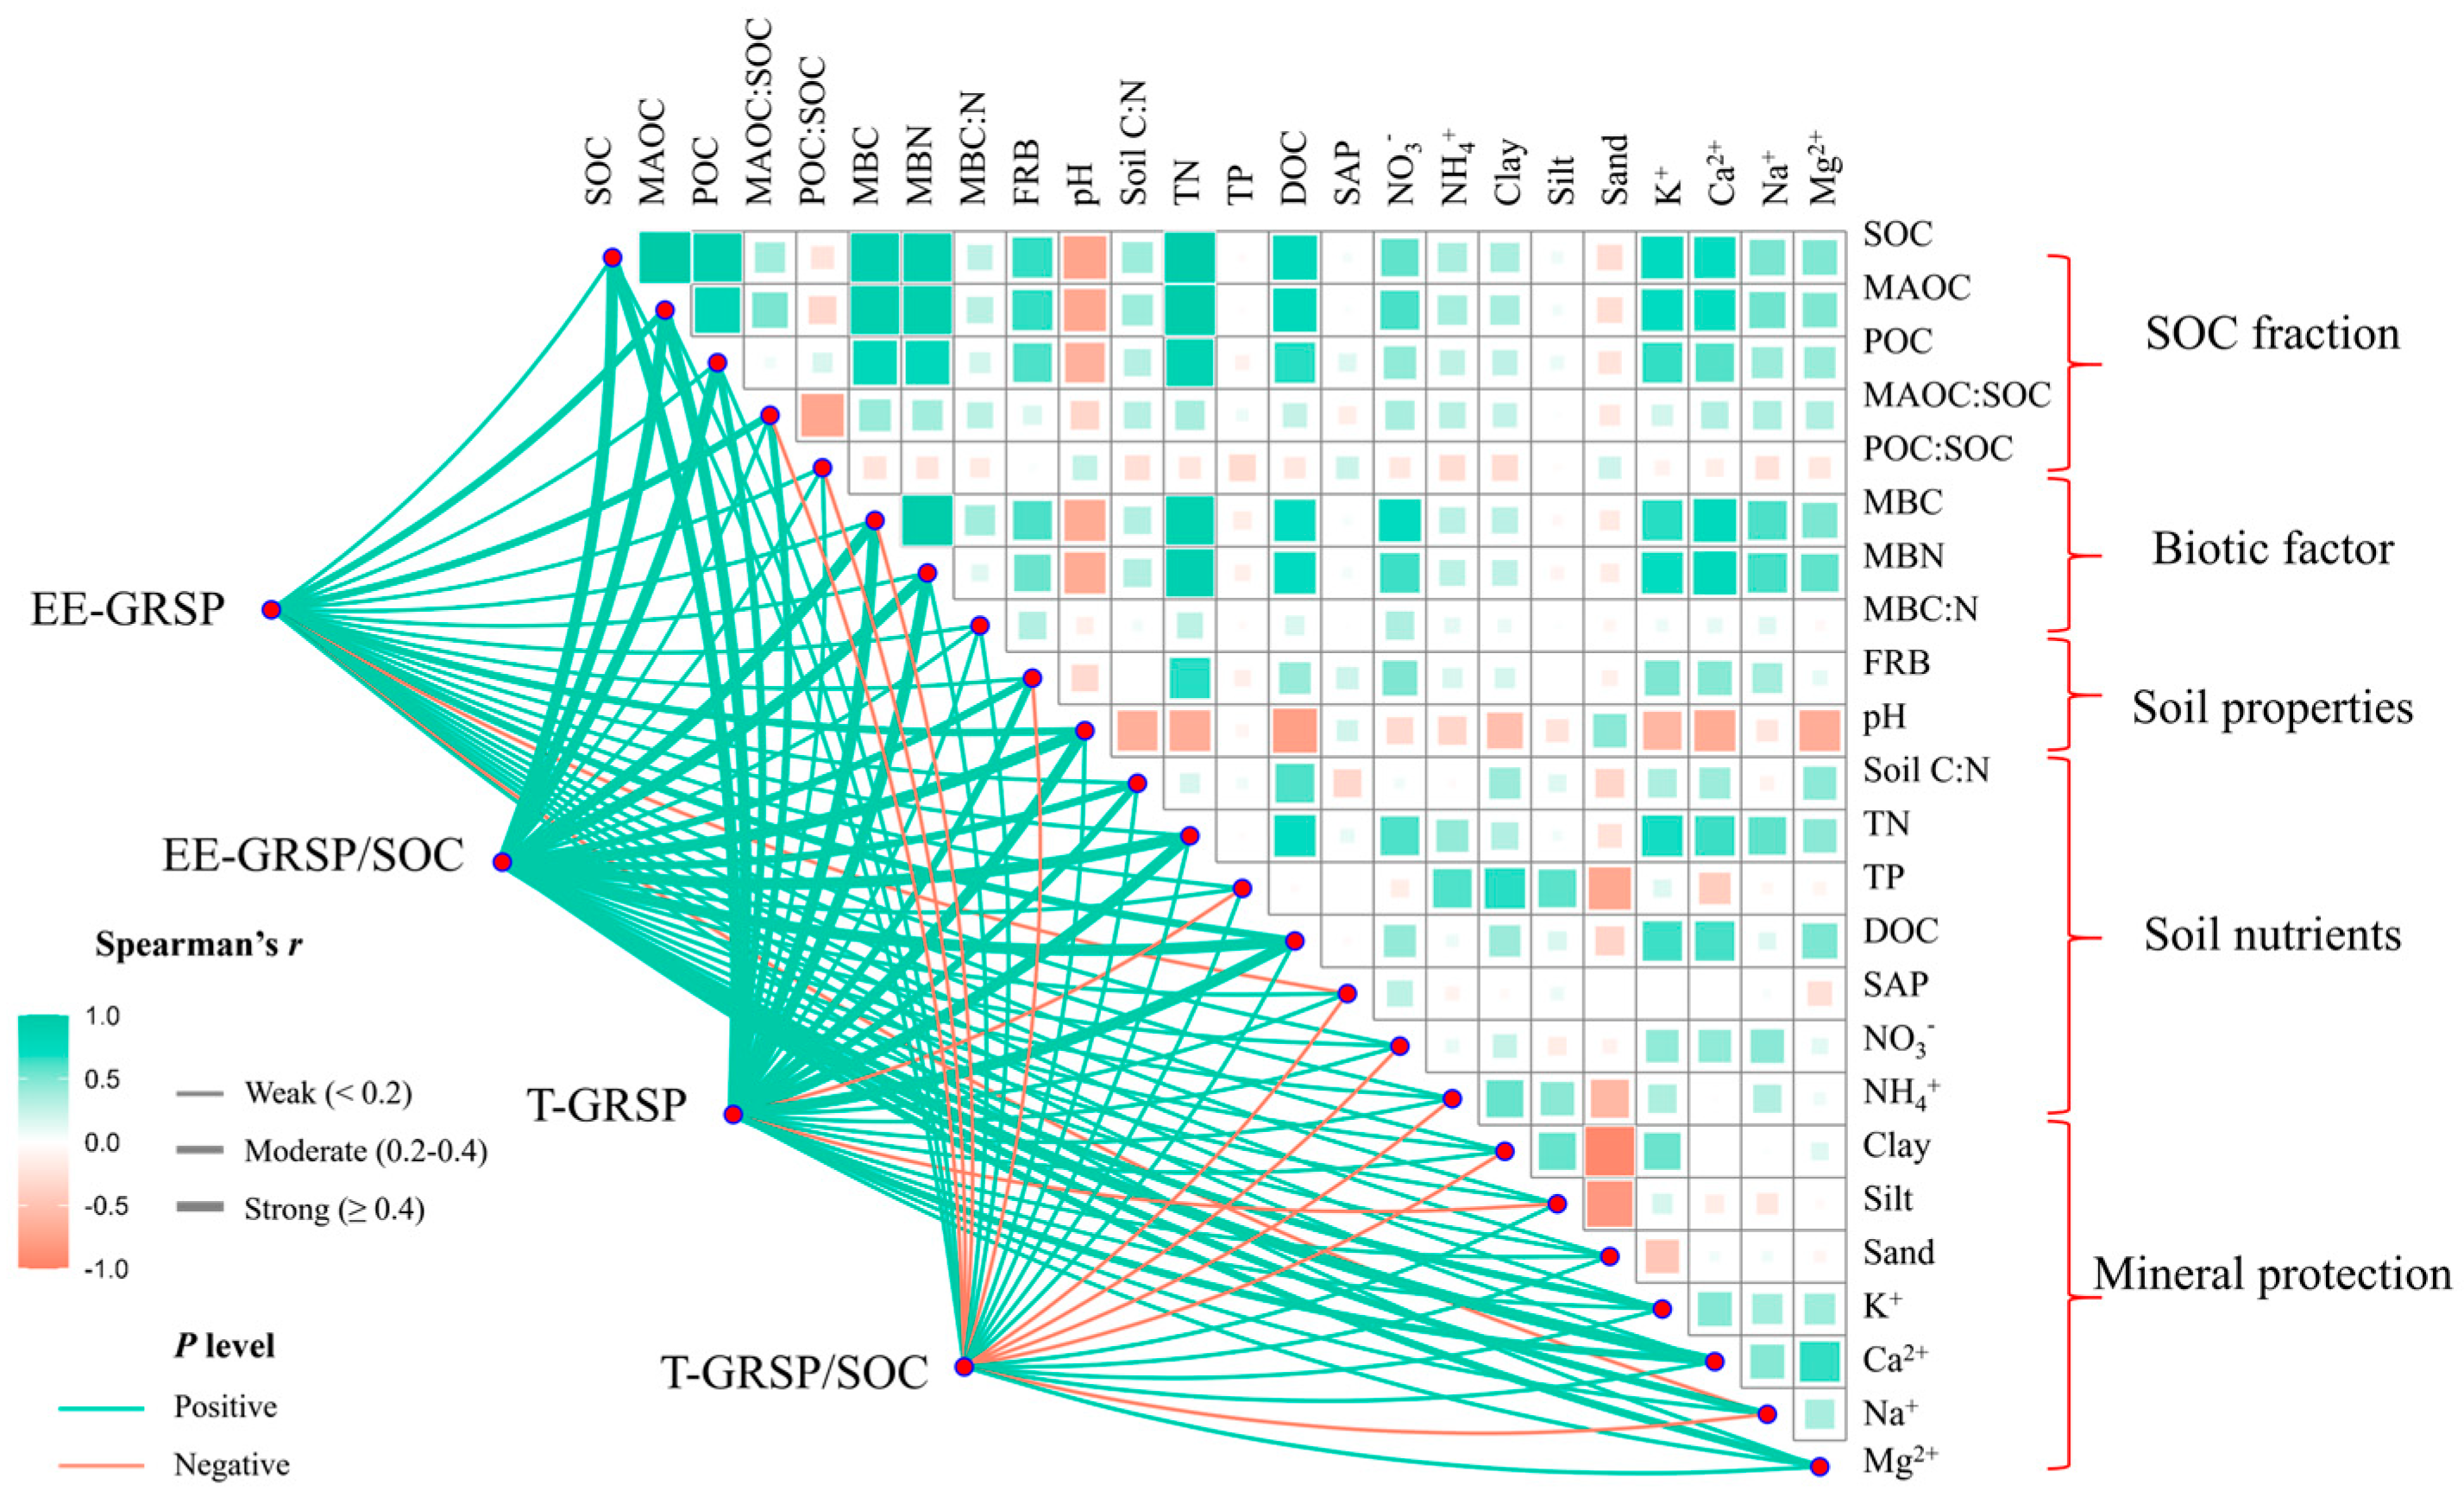
Correlation analysis revealed significant associations between key soil properties and both EE-GRSP and T-GRSP, as well as their relative contributions to SOC (Figure 2). EE-GRSP and T-GRSP were positively correlated (p < 0.05) with FBR, MBC, MBN, soil C/N ratio, total N, DOC, NH4+-N, NO3-N, clay content, and exchangeable cations (K+, Na+, Ca2+, and Mg2+) but negatively correlated with sand content and soil pH. In contrast, the EE-GRSP/SOC ratio was negatively associated with FBR, MBC, MBN, C/N ratio, DOC, NO3-N, and exchangeable cations, while positively correlated with soil pH. Similarly, the T-GRSP/SOC ratio showed a strong negative correlation with MBN, total N, and exchangeable K+ and Ca2+ and a significant positive relationship with pH and total P.

3.3. Controlling Factors on GRSP Accumulation Across Three Land-Use Types

The random forest analysis revealed distinct sets of influential variables governing the variation in different GRSP fractions (Figure 3). For EE-GRSP content, dissolved organic carbon (DOC) emerged as the most important predictor, followed by MBC, soil C/N ratio, pH, fine FBR, NH4+-N, MBN, and Ca2+ collectively explaining 43.8% of the observed variance (Figure 3a). The model identified a different hierarchy of predictors for T-GRSP content, with MBC showing the strongest influence, succeeded by FBR, total nitrogen, MBN, soil C/N ratio, DOC, pH, NO3-N, K+, and Na+, which accounted for 79% of the total variation (Figure 3b). Notably, microbial-related parameters (MBC and MBN) consistently ranked among the major predictors for both GRSP fractions, highlighting the crucial role of soil microbial communities in GRSP dynamics.
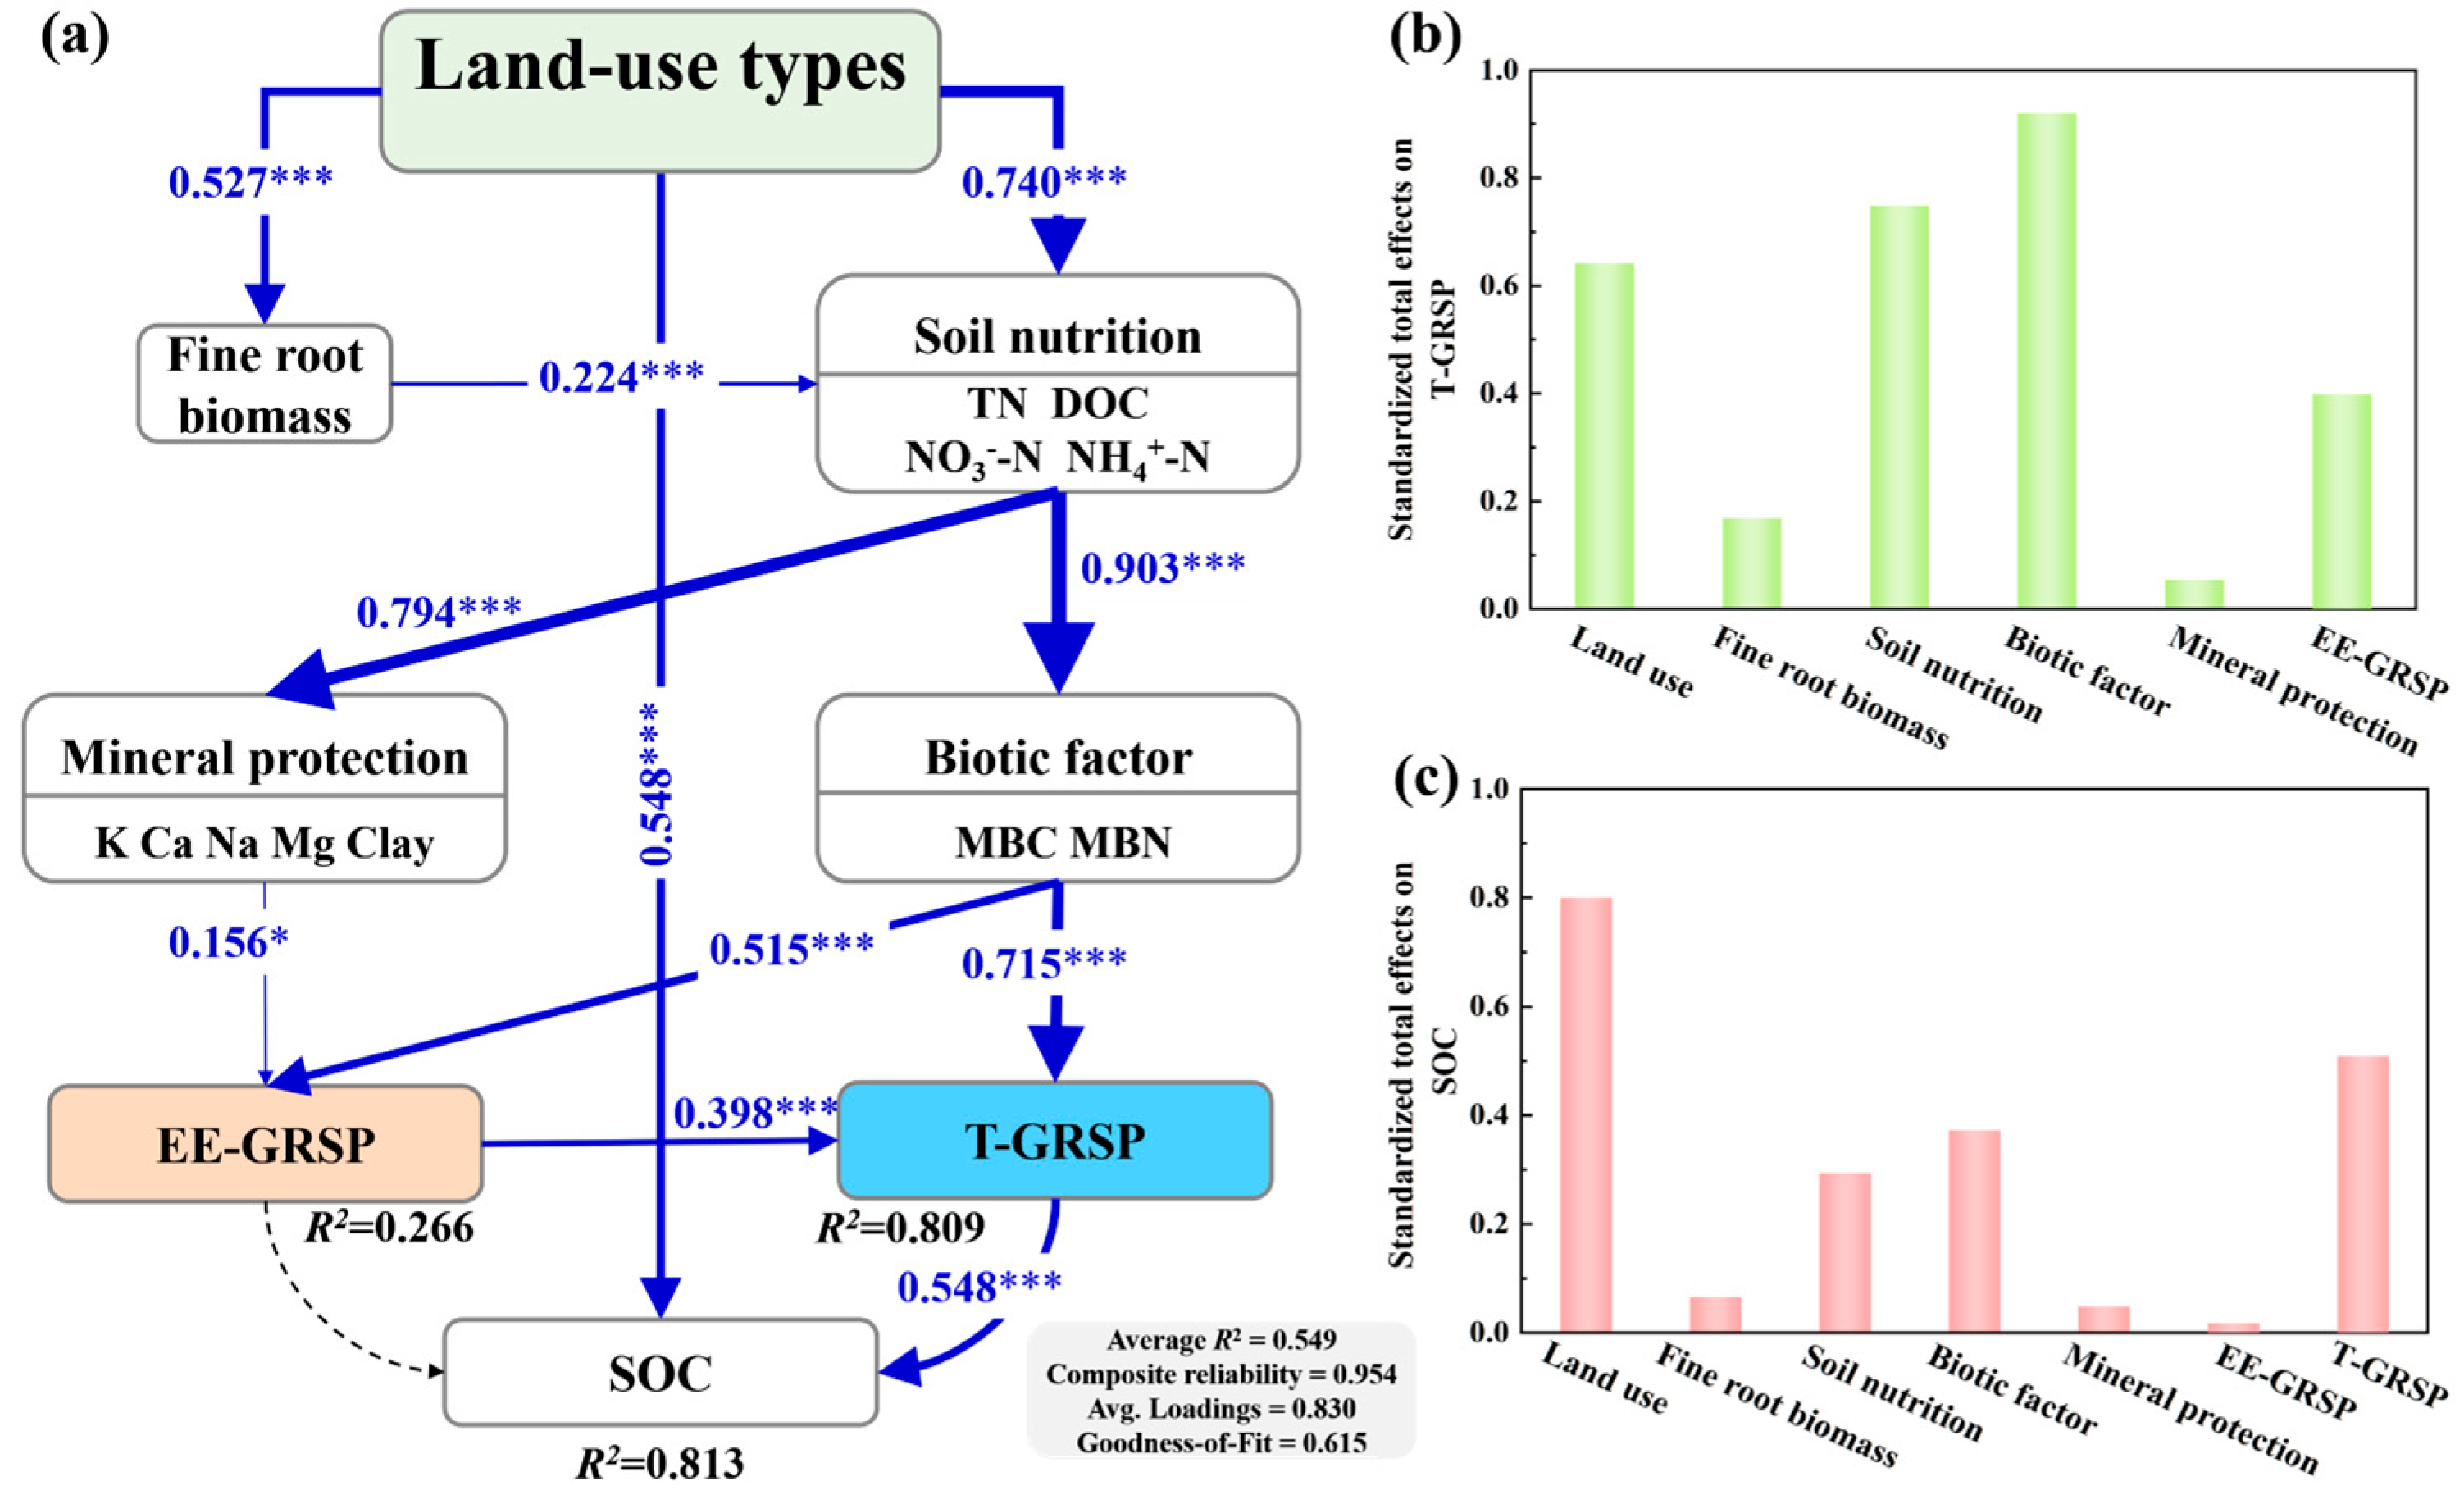
The SEM results demonstrated that the proposed model effectively explained 81.3% and 80.9% of the variation in SOC and T-GRSP contents, respectively (Figure 4). Land-use types directly affected SOC content while also exerting indirect effects on soil biotic factors and mineral protection mechanisms. These indirect effects were mediated through positive influences on fine root biomass and soil nutrient content. Notably, mineral protection showed a direct positive relationship with easily extractable glomalin-related soil protein (EE-GRSP). Meanwhile, soil biotic factors positively influenced both EE-GRSP and T-GRSP. Furthermore, T-GRSP content itself exhibited a direct positive effect on SOC accumulation, establishing a significant pathway for soil carbon sequestration.
The SEM showed satisfactory fit indices (composite reliability = 0.954 > 0.7; goodness-of-fit = 0.615 > 0.6) and substantial explanatory power for both SOC (R2 = 0.813) and T-GRSP (R2 = 0.809), as illustrated in Figure 4. Our analysis identified three key mechanistic pathways through which land-use types influence SOC sequestration; first land-use types showed significant direct impacts on SOC content (standardized path coefficient = 0.548; p < 0.001), likely through vegetation inputs and management practices. Then, land use indirectly affected SOC by altering soil microbial factors, which subsequently enhanced both EE-GRSP (path coefficient = 0.515) and T-GRSP production (path coefficient = 0.715). In addition, land-use changes modified soil nutrient status and fine root biomass, which in turn influenced mineral-associated organic matter stabilization. This pathway showed slight low effects on EE-GRSP accumulation (path coefficient = 0.156; p < 0.05). Notably, the model revealed a dual role of T-GRSP in SOC dynamics, serving as a microbial-derived C contributing to SOC pools (path coefficient = 0.548; p < 0.001).

4. Discussion

4.1. Changes in SOC and GRSP Content Across Three Land-Use Types

SOC storage is governed by the balance between plant litter inputs and decomposition rates, which are strongly influenced by environmental conditions, land-use history, management practices, and vegetation types [12,17]. The higher SOC content observed in natural forests compared to managed systems can be attributed to greater litter inputs from diverse tree species and minimal soil disturbance, which collectively promote the accumulation of plant- and microbe-derived C in stable SOC pools [7]. Our study demonstrates that land-use changes significantly affect GRSP content, with forest soils containing substantially higher levels of both EE-GRSP and T-GRSP fractions than regularly cultivated tea plantations. Specifically, T-GRSP concentrations were 78.1% lower in tea plantations and 46.1% lower in artificial forests compared to natural forests. These pronounced differences reflect the combined effects of the tillage-induced disruption of arbuscular mycorrhizal fungal hyphal networks, reduced host plant diversity, and diminished plant-derived C inputs under monoculture conditions [25,26]. The findings underscore the critical role of conservation-oriented land management in maintaining soil carbon stocks and microbial-derived stabilization mechanisms, with natural forest ecosystems demonstrating superior capacity for both SOC accumulation and GRSP production compared to intensively managed agricultural systems. Natural forest soils exhibit enhanced production of GRSP due to minimal soil disturbance and elevated microbial biomass activity [12,27]. This observation aligns with previous findings demonstrating significantly higher GRSP content in undisturbed ecosystems compared to intensively managed agricultural systems [28]. As a nitrogen-rich glycoprotein containing 3–5 nitrogen atoms per molecule, GRSP serves as both a structural soil component and a potential nitrogen reservoir [29]. In high carbon-input forest ecosystems where microbial nitrogen demand often exceeds supply, the EE-GRSP fraction may undergo microbial decomposition to meet nitrogen requirements, potentially explaining the comparable EE-GRSP levels observed between forest and agricultural soils. This differential response of GRSP fractions to environmental conditions is further supported by studies showing distinct patterns in T-GRSP and EE-GRSP accumulation under varying carbon inputs and soil fertility regimes [17,18]. The contrasting EE-GRSP/T-GRSP ratios across land uses reflect divergent AMF community dynamics. Higher ratios in tea plantations (>0.5) may indicate stress-induced exudation or rapid turnover of active hyphae due to fertilization and disturbance [16], whereas lower ratios in natural forests (<0.3) suggest well-established, stable mycorrhizal networks with large recalcitrant T-GRSP pools [13]. This ratio thus emerges as a sensitive indicator of soil biological health and long-term C stabilization potential.
Despite significantly reducing absolute GRSP concentrations, tea plantation systems exhibited a substantially higher proportional contribution of GRSP to the SOC pool compared to natural ecosystems. This paradoxical finding underscores GRSP’s crucial role in stabilizing soil carbon under low-input agricultural conditions [28]. The elevated relative contribution of GRSP in tea plantations likely stems from two interconnected mechanisms: First, the limited availability of fresh organic inputs in these managed systems increases the relative importance of microbial-derived carbon compounds like GRSP for SOC formation. Second, the physical protection mechanisms become predominant in carbon preservation when biological turnover is constrained. Particularly, EE-GRSP serves as an effective binding agent that coats soil particles and bridges mineral surfaces, thereby enhancing microaggregate formation [30]. These GRSP-mediated aggregates create protective physical barriers that reduce organic matter accessibility to decomposers while simultaneously promoting organo–mineral interactions. The process is further facilitated by the observed positive association between clay content and GRSP accumulation, suggesting that fine mineral particles provide abundant binding sites for GRSP proteins [31], while GRSP contributes disproportionately to SOC stabilization in tea plantations by forming stable complexes with reactive mineral surfaces and encapsulating organic matter within aggregate structures.

4.2. Factors Affecting T-GRSP Accumulation

Both linear regression analysis and structural equation modeling (SEM) consistently demonstrated that dissolved organic carbon (DOC) and microbial biomass carbon (MBC) serve as key drivers positively regulating the accumulation of both EE-GRSP and T-GRSP fractions. Our modeling approaches revealed distinct predictive patterns for the two GRSP fractions: DOC, MBC, and soil C/N ratio collectively explained the majority (43.8%) of EE-GRSP variability, while MBC, fine root biomass (FBR), and total nitrogen emerged as the predominant factors accounting for 79.0% of T-GRSP variation. The significantly higher explanatory power for T-GRSP suggests this more stable fraction shows stronger dependence on measured soil properties, whereas EE-GRSP dynamics appear more susceptible to unmeasured environmental factors or temporal fluctuations. Land-use types were found to indirectly influence GRSP and SOC accumulation through mediation of soil properties, with forest systems particularly promoting enhanced GRSP production and SOC sequestration (Figure 4). The SEM results further reveal a direct pathway from MBC to T-GRSP accumulation, underscoring the central role of microbial turnover in forming stable C pools. This supports the emerging paradigm of the “microbial carbon pump” in soils. Notably, MBC alone explained 15% of T-GRSP variation in random forest models, and SEM confirmed its positive path coefficient, suggesting that land-use practices enhancing microbial activity—such as reduced tillage or cover cropping—could indirectly boost GRSP-mediated C sequestration.
The robust interrelationships among GRSP, DOC, and soil nitrogen pools (i.e., total N, NO3N, and NH4+-N) highlight how improved soil nutrient availability stimulates microbial biomass development, consequently boosting microbial-derived C compounds including GRSP [32]. Both analytical approaches confirmed that elevated soil nutrient levels enhance MBC, which subsequently contribute to GRSP accumulation, with DOC serving as a crucial carbon source for fungal metabolism and thus playing a pivotal role in GRSP turnover dynamics. Nitrogen availability, particularly NO3-N and NH4+-N content, was identified as the most significant predictor of GRSP production, as these inorganic nitrogen forms directly regulate microbial activity [33]. Plant-derived inputs through litterfall and rhizodeposition provide essential nutrient substrates for soil microbial communities, making them particularly responsive to nitrogen availability. These observed patterns likely reflect land-use-mediated changes in primary productivity and root biomass, which subsequently modulate microbial biomass and metabolic activity [34]. Importantly, our analytical results consistently showed T-GRSP content exerts positive effects on SOC accumulation (Figure S2), aligning with numerous previous studies that have established GRSP’s role in soil carbon stabilization through both chemical binding and physical protection mechanisms [12,16,18]. While our study focused on plot-scale mechanisms, the observed GRSP–SOC relationships have regional relevance. Extrapolating our data to Huangshan’s forested area, the 28.5% higher SOC in natural forests suggests potential carbon sequestration losses when converted to tea plantations.
The integrated findings underscore the complex interplay between soil nutrient cycling, microbial activity, and GRSP dynamics in governing SOC sequestration processes across different land-use systems. Our findings indicate that the key drivers of GRSP accumulation may vary across land-use types. By analyzing GRSP dynamics, we can better assess how land-use types influence soil C sequestration potential. Furthermore, such investigations provide insights into the improvements in soil physicochemical properties resulting from forest management practices.

5. Conclusions

Land-use conversion in the Huangshan Mountain region significantly reduces SOC and GRSP accumulation. Natural forests stored 4.7-fold more SOC in the topsoil than tea plantations. Despite lower GRSP under tea cultivation, its relative contribution to SOC increased, suggesting enhanced microbial necromass persistence in low-input systems. Random forest and SEM analyses identified MBC, as key drivers of T-GRSP dynamics, with MBC exerting a direct positive effect. The positive relationship between GRSP and SOC underscores the importance of microbial-derived carbon in long-term soil C sequestration. Preserving plant diversity, minimizing tillage, and promoting belowground carbon inputs are therefore critical for sustaining GRSP-mediated carbon storage in subtropical montane ecosystems.

Supplementary Materials

The following supporting information can be downloaded at https://www.mdpi.com/article/10.3390/f16091362/s1, Figure S1 Soil organic carbon (SOC) content (a) and SOC fractions (b) across three land-use types. Figure S2 Pearson correlation analysis between glomalin-related soil protein (GRSP) fractions (easily extractable GRSP [EE-GRSP] and total GRSP [T-GRSP]) and soil organic carbon (SOC) and SOC fraction. Table S1 Sampling plots coordinate. Table S2 Physicochemical properties of soils under different land-use types.

Author Contributions

Y.Z.: Funding acquisition, Investigation, and Writing–Original draft. Z.Q.: Methodology, Supervision, and Writing–review and editing. B.W.: Project administration. Y.X., W.C.: Investigation and Data curation. All authors have read and agreed to the published version of the manuscript.

Funding

This work was financially supported by the Observation, Monitoring, and Assessment of Natural Resources in Xiaogan, Yangtze River Basin (DD20243178); the Observation, Monitoring, and Assessment of Natural Resources and Surface Regolith in the Jiangnan Hilly Region (DD20230515); and the Geological Survey of Changsha Natural Resources Comprehensive Survey Center, China Geological Survey (2024-226).

Data Availability Statement

Data will be made available on request.

Conflicts of Interest

The authors declare that they have no known competing financial interests or personal relationships that could have appeared to influence the work reported in this paper.

References

  1. Paustian, K.; Lehmann, J.; Ogle, S.; Reay, D.; Robertson, G.P.; Smith, P. Climate-smart soils. Nature 2016, 532, 49–57. [Google Scholar] [CrossRef] [PubMed]
  2. Gao, F.; Sun, G.-X.; Jiang, J. Soil Organic Carbon Responses to Different Land Use Change: A Meta-Analysis. Land Degrad. Dev. 2025. Early View. [Google Scholar] [CrossRef]
  3. Shuai, Q.; Xue, J.; Dai, L.J.; Huang, Y.Y.; Jin, D.H.; Chen, Z.X.; Li, M.W.; Shi, Z.; Chen, S.C. The effects of land use change on soil organic carbon stock in China: A meta-analysis with the empirical modeling approach. Geoderma Reg. 2024, 36, e00774. [Google Scholar] [CrossRef]
  4. Shao, P.S.; Liang, C.; Lynch, L.; Xie, H.T.; Bao, X.L. Reforestation accelerates soil organic carbon accumulation: Evidence from microbial biomarkers. Soil Biol. Biochem. 2019, 131, 182–190. [Google Scholar] [CrossRef]
  5. England, J.R.; Paul, K.I.; Cunningham, S.C.; Madhavan, D.B.; Baker, T.G.; Read, Z.; Wilson, B.R.; Cavagnaro, T.R.; Lewis, T.; Perring, M.P.; et al. Previous land use and climate influence differences in soil organic carbon following refor-estation of agricultural land with mixed-species plantings. Agric. Ecosyst. Environ. 2016, 227, 61–72. [Google Scholar] [CrossRef]
  6. Chen, G.P.; Ma, S.H.; Tian, D.; Xiao, W.; Jiang, L.; Xing, A.J.; Zou, A.L.; Zhou, L.H.; Shen, H.H.; Zheng, C.Y.; et al. Patterns and determinants of soil microbial residues from tropical to boreal forests. Soil Biol. Biochem. 2020, 151, 108059. [Google Scholar] [CrossRef]
  7. Liang, C.; Amelung, W.; Lehmann, J.; Kästner, M. Quantitative assessment of microbial necromass contribution to soil organic matter. Glob. Chang. Biol. 2019, 25, 3578–3590. [Google Scholar] [CrossRef]
  8. Rillig, M.C.; Maestre, F.T.; Lamit, L.J. Microsite differences in fungal hyphal length, glomalin, and soil aggregate stability in semiarid Mediterranean steppes. Soil Biol. Biochem. 2003, 35, 1257–1260. [Google Scholar] [CrossRef]
  9. Singh, G.; Pankaj, U.; Chand, S.; Verma, R.K. Arbuscular Mycorrhizal Fungi-Assisted Phytoextraction of Toxic Metals by Zea mays L. From Tannery Sludge. Soil Sediment. Contam. 2019, 28, 729–746. [Google Scholar] [CrossRef]
  10. Wright, S.F.; FrankeSnyder, M.; Morton, J.B.; Upadhyaya, A. Time-course study and partial characterization of a protein on hyphae of arbuscular mycorrhizal fungi during active colonization of roots. Plant Soil 1996, 181, 193–203. [Google Scholar] [CrossRef]
  11. Rillig, M.C.; Wright, S.F.; Nichols, K.A.; Schmidt, W.F.; Torn, M.S. Large contribution of arbuscular mycorrhizal fungi to soil carbon pools in tropical forest soils. Plant Soil 2001, 233, 167–177. [Google Scholar] [CrossRef]
  12. Li, T.; Yuan, Y.; Mou, Z.; Li, Y.; Kuang, L.; Zhang, J.; Wu, W.; Wang, F.; Wang, J.; Lambers, H.; et al. Faster accumulation and greater contribution of glomalin to the soil organic carbon pool than amino sugars do under tropical coastal forest restoration. Glob. Chang. Biol. 2022, 29, 533–546. [Google Scholar] [CrossRef]
  13. Agnihotri, R.; Sharma, M.P.; Prakash, A.; Ramesh, A.; Bhattacharjya, S.; Patra, A.K.; Manna, M.C.; Kurganova, I.; Kuzyakov, Y. Glycoproteins of arbuscular mycorrhiza for soil carbon sequestration: Review of mechanisms and controls. Sci. Total Environ. 2022, 806, 150571. [Google Scholar] [CrossRef]
  14. Koide, R.T.; Peoples, M.S. Behavior of Bradford-reactive substances is consistent with predictions for glomalin. Appl. Soil Ecol. 2013, 63, 8–14. [Google Scholar] [CrossRef]
  15. Wang, Q.; Lu, H.L.; Chen, J.Y.; Hong, H.L.; Liu, J.C.; Li, J.W.; Yan, C.L. Spatial distribution of glomalin-related soil protein and its relationship with sediment carbon sequestration across a mangrove forest. Sci. Total Environ. 2018, 613–614, 548–556. [Google Scholar] [CrossRef] [PubMed]
  16. Zhang, J.; Li, J.; Ma, L.; He, X.; Liu, Z.; Wang, F.; Chu, G.; Tang, X. Accumulation of glomalin-related soil protein benefits soil carbon sequestration: Tropical coastal forest restoration experiences. Land. Degrad. Dev. 2022, 33, 1541–1551. [Google Scholar] [CrossRef]
  17. Zhang, M.; Che, R.; Cheng, Z.; Zhao, H.; Wu, C.; Hu, J.; Zhang, S.; Liu, D.; Cui, X.; Wu, Y. Decades of reforestation significantly change microbial necromass, glomalin, and their contributions to soil organic carbon. Agric. Ecosyst. Environ. 2023, 346, 108362. [Google Scholar] [CrossRef]
  18. Gu, R.; Xiao, K.; Zhu, Z.; He, X.; Li, D. Afforestation enhances glomalin-related soil protein content but decreases its contri-bution to soil organic carbon in a subtropical karst area. J. Environ. Manag. 2024, 356, 120754. [Google Scholar] [CrossRef]
  19. Holátko, J.; Brtnický, M.; Kučerík, J.; Kotianová, M.; Elbl, J.; Kintl, A.; Kynický, J.; Benada, O.; Datta, R.; Jansa, J. Glomalin—Truths, myths, and the future of this elusive soil glycoprotein. Soil Biol. Biochem. 2021, 153, 108116. [Google Scholar] [CrossRef]
  20. Song, L.; Yang, T.; Xia, S.; Yin, Z.; Liu, X.; Li, S.; Sun, R.; Gao, H.; Chu, H.; Ma, C. Soil depth exerts stronger impact on bacterial community than elevation in subtropical forests of Huangshan Mountain. Sci. Total Environ. 2022, 852, 158438. [Google Scholar] [CrossRef] [PubMed]
  21. Lv, T.; Wang, N.; Xie, L.; Chen, S.; Zhao, R.; Feng, Y.; Li, Y.; Ding, H.; Fang, Y. Environmental Heterogeneity Affecting Commu-nity Assembly Patterns and Phylogenetic Diversity of Three Forest Communities at Mt. Huangshan, China. Forests 2022, 13, 133. [Google Scholar] [CrossRef]
  22. Carter, M.; Gregorich, E. Soil Sampling and Methods of Analysis; Taylor & Francis: London, UK, 2007. [Google Scholar] [CrossRef]
  23. Wright, S.F.; Upadhyaya, A. Extraction of an abundant and unusual protein from soil and comparison with hyphal protein of arbuscular mycorrhizal fungi. Soil Sci. 1996, 161, 575–586. [Google Scholar] [CrossRef]
  24. Qian, Z.; Li, Y.; Du, H.; Wang, K.; Li, D. Increasing plant species diversity enhances microbial necromass carbon content but does not alter its contribution to soil organic carbon pool in a subtropical forest. Soil Biol. Biochem. 2023, 187, 109183. [Google Scholar] [CrossRef]
  25. Soudzilovskaia, N.A.; van Bodegom, P.M.; Terrer, C.; Zelfde, M.V.T.; McCallum, I.; McCormack, M.L.; Fisher, J.B.; Brundrett, M.C.; de Sá, N.C.; Tedersoo, L. Global mycorrhizal plant distribution linked to terrestrial carbon stocks. Nat. Commun. 2019, 10, 1–10. [Google Scholar] [CrossRef] [PubMed]
  26. Huang, B.T.; Zhang, L.; Cao, Y.P.; Yang, Y.R.; Wang, P.; Li, Z.X.; Lin, Y. Effects of land-use type on soil organic carbon and carbon pool management index through arbuscular mycorrhizal fungi pathways. Glob. Ecol. Conserv. 2023, 43, e02432. [Google Scholar] [CrossRef]
  27. Huang, B.B.; Yan, G.Y.; Liu, G.C.; Sun, X.Y.; Wang, X.C.; Xing, Y.J.; Wang, Q.G. Effects of long-term nitrogen addition and precipitation reduction on glomalin-related soil protein and soil aggregate stability in a temperate forest. CATENA 2022, 214, 106284. [Google Scholar] [CrossRef]
  28. Zhu, R.H.; Zheng, Z.C.; Li, T.X.; He, S.Q.; Zhang, X.Z.; Wang, Y.D.; Liu, T. Effect of tea plantation age on the distribution of glomalin-related soil protein in soil water-stable aggregates in southwestern China. Environ. Sci. Pollut. Res. 2018, 26, 1973–1982. [Google Scholar] [CrossRef]
  29. Singh, P.K.; Singh, M.; Tripathi, B.N. Glomalin: An arbuscular mycorrhizal fungal soil protein. Protoplasma 2013, 250, 663–669. [Google Scholar] [CrossRef] [PubMed]
  30. Wu, Q.S.; He, X.H.; Zou, Y.N.; He, K.P.; Sun, Y.H.; Cao, M.Q. Spatial distribution of glomalin-related soil protein and its rela-tionships with root mycorrhization, soil aggregates, carbohydrates, activity of protease and β-glucosidase in the rhizosphere of Citrus unshiu. Soil Biol. Biochem. 2012, 45, 181–183. [Google Scholar] [CrossRef]
  31. Sokol, N.W.; Sanderman, J.; Bradford, M.A. Pathways of mineral-associated soil organic matter formation: Integrating the role of plant carbon source, chemistry, and point of entry. Glob. Change Biol. 2018, 25, 12–24. [Google Scholar] [CrossRef] [PubMed]
  32. Hu, Y.T.; Zheng, Q.; Noll, L.; Zhang, S.S.; Wanek, W. Direct measurement of the in situ decomposition of microbial-derived soil organic matter. Soil Biol. Biochem. 2020, 141, 107660. [Google Scholar] [CrossRef]
  33. Yang, Y.R.; He, C.J.; Huang, L.; Ban, Y.H.; Tang, M. The effects of arbuscular mycorrhizal fungi on glomalin-related soil pro-tein distribution, aggregate stability and their relationships with soil properties at different soil depths in lead-zinc contaminated area. PLoS ONE 2017, 12, e0182264. [Google Scholar] [CrossRef]
  34. Bhople, P.; Keiblinger, K.; Djukic, I.; Liu, D.; Zehetner, F.; Zechmeister-Boltenstern, S.; Joergensen, R.G.; Murugan, R. Micro-bial necromass formation, enzyme activities and community structure in two alpine elevation gradients with different bedrock types. Geoderma 2021, 386, 114922. [Google Scholar] [CrossRef]
Figure 1. The EE-GRSP and T-GRSP content (a), the contributions of GRSP to SOC (b), and the ratio of EE-GRSP to T-GRSP (c) in tea plantation and artificial and natural forest soils. SOC: soil organic carbon; EE-GRSP: easily extractable glomalin-related soil protein; T-GRSP: total glomalin-related soil protein. Boxes represent the central 50% of the data, and the solid line and square in each box represent the median and mean of each dataset, respectively. The upper and lower whisker caps represent the 75% and 25% percentiles, respectively. The different letters indicate significant differences between three land-use types (p < 0.05).
Forests 16 01362 g001
Figure 2. Mantel test of GRSP contents and their contribution to SOC with soil variables. EE-GRSP: easily extractable glomalin-related soil protein; T-GRSP: total glomalin-related soil protein; EE-GRSP/SOC: the contribution of EE-GRSP to SOC; T-GRSP/SOC: the contribution of T-GRSP to SOC. MAOC: mineral-associated organic carbon; POC: particulate organic carbon; MBC: microbial mass carbon; MBN: microbial mass nitrogen; FRB: fine root biomass; TN: total nitrogen; TP: total phosphorus; DOC: dissolved organic carbon; SAP: soil available phosphorus; NO3-N: nitrate nitrogen; NH4+-N: ammonium nitrogen; clay: soil clay content; silt: soil silt content; sand: soil sand content; K+, Ca2+, Na+, and Mg2+: exchangeable cations.
Forests 16 01362 g002
Figure 3. The relative importance of soil variables in predicting EE-GRSP (a) and T-GRSP (b) contents according to Random Forest modeling. Increase in MSE (%) is the percentage increase in the mean square error. Variables are ranked by their relative importance (%IncMSE). Asterisks (* and **) denote statistical significance at p < 0.05 and p < 0.01, respectively. ns denote no significant. The explanatory percentage (R2, %) is the total effect of all variables for EE-GRSP and T-GRSP.
Forests 16 01362 g003
Figure 4. (a) The structural equation model (SEM) depicting the direct and indirect influences of land-use types on the variations of T-GRSP and SOC. (b,c) Total effects of land-use types on T-GRSP and SOC based on the SEM results. The solid arrows indicate the hypothesized direction of causation, with arrow widths proportional to the strength of the effects. Blue arrows signify positive correlations between observed variables and latent variables. The R2 values represent the proportion of variance in the dependent variables explained by the independent variables. The goodness-of-fit (GOF) index assesses the overall model fit. Asterisks (* and ***) denote statistical significance at p < 0.05 and p < 0.001, respectively.
Forests 16 01362 g004
Disclaimer/Publisher’s Note: The statements, opinions and data contained in all publications are solely those of the individual author(s) and contributor(s) and not of MDPI and/or the editor(s). MDPI and/or the editor(s) disclaim responsibility for any injury to people or property resulting from any ideas, methods, instructions or products referred to in the content.