Article

Impacts of Ecological Engineering Interventions on Carbon Sequestration: Spatiotemporal Dynamics and Driving Mechanisms in Karst Rocky Desertification Control

1
School of Karst Science, Guizhou Normal University, Guiyang 550001, China
2
State Engineering Technology Institute for Karst Desertification Control, Guiyang 550001, China
3
Guizhou Karst Mountain Land Ecology and Land Use Observation and Research Station, Ministry of Natural Resources, Anshun 561301, China
*
Author to whom correspondence should be addressed.
Forests 2025, 16(9), 1361; https://doi.org/10.3390/f16091361
Submission received: 10 July 2025 / Revised: 8 August 2025 / Accepted: 19 August 2025 / Published: 22 August 2025
(This article belongs to the Section Forest Ecology and Management)

Abstract

Karst regions, characterized by thin soil layers, severe rocky desertification, and fragile vegetation, hold significant scientific value for achieving China’s “dual-carbon” goals. This study focuses on Zhijin County in Guizhou Province, integrating provincial carbon density data with forest resource inventory data. By constructing a model to adjust aboveground forest carbon density (AGC) estimation parameters and utilizing the InVEST model alongside hotspot analysis, the research systematically examines the spatiotemporal heterogeneity of carbon storage from 2000 to 2020. These findings provide actionable strategies for enhancing carbon sequestration efficiency in ecologically fragile regions, supporting China’s “dual-carbon” policy goals. Key findings include: (1) Carbon storage exhibits a “growth-turning point” two-phase pattern, increasing by 0.46% from 2000 to 2015 but decreasing by 3.31% in 2020 due to construction land expansion. (2) There are significant differences in carbon storage among ecological engineering projects, with the highest carbon storage found in the “Grain-for-Green Program” project area and the lowest in the “National Rocky Desertification Control Program” area. (3) Elevation is the primary controlling factor for carbon storage, with rocky desertification showing notable spatial differentiation. This study provides theoretical support for the precise regulation of ecological programs and the development of high-precision carbon storage models in karst regions.

1. Introduction

China set its “dual-carbon” goals in 2020, clearly stating that it aims to reach peak carbon emissions by 2030 and achieve carbon neutrality by 2060. In this context, improving the carbon sink capacity of ecosystems has become one of the key ways to achieve carbon neutrality, especially in karst areas. Karst regions are characterized by significant human-land conflicts [1], fragmented terrain, low ecological structural stability, and high sensitivity [2], as well as severe soil erosion and exposed bedrock issues [3]. These issues are particularly pronounced in Guizhou Province, where karst topography covers 61.9% of the land area [4], where rocky desertification is extensive, severe, and highly detrimental [5], significantly constraining the sustainable development of the local economy and society [6]. Zhijin County, situated in the plateau region of southwestern China’s Guizhou Province, exhibits fragmented terrain, severe soil erosion, and acute rocky desertification [7]. Under extreme conditions, vegetation is highly susceptible to degradation [8], resulting in poor habitat quality. To address these pressing ecological challenges, the government has spearheaded the implementation of multiple ecological engineering projects to rehabilitate the local environment. Examples include the Natural Forest Protection Program (Implemented in 2001) [9] and the Grain for Green Program (Field research from 2006 to 2007) [10,11].
Currently, the implementation of most ecological engineering projects has a positive impact on carbon storage. For example, Xi and Li [12] used a random forest model to analyze the annual increase in carbon storage in the Yangtze River Basin, which averaged 51.6 TgC; Zhou [13] pointed out that ecological engineering in the Shiyang River Basin contributed up to 103.71% to land use change, with the expansion of forests and grasslands being the primary drivers of carbon storage growth; Zhu [4] combined remote sensing data with ground surveys to demonstrate that vegetation restoration significantly enhanced carbon storage in ecologically fragile karst regions. Scientifically assessing the carbon storage effects of these projects not only provides a basis for optimizing ecological restoration strategies but also offers theoretical support for the precise implementation of regional “dual-carbon” goals [14,15,16]. However, the implementation of certain ecological engineering policies may have blind spots [12], as research primarily focuses on individual projects, exploring the impact of ecological engineering or land-use changes on carbon storage, without a systematic analysis of synergistic effects among multiple projects or differences in carbon storage. For example, in karst regions, Luo [17] used the InVEST model and multi-scale geographic weighted regression (MGWR) method to demonstrate that ecological engineering significantly enhanced the carbon sequestration capacity of karst forests (with carbon storage increasing by 34.82 Mg C/ha from 2001 to 2020) and revealed a significant acceleration trend in carbon storage growth during the later period. However, their study did not explicitly address performance differences among different project types. Additionally, Lin [18] assessed that between 2010 and 2020, carbon storage in Guizhou Province’s terrestrial ecosystems decreased by 1106.68 × 104 Mg C, accompanied by reductions in the area and carbon storage of forest and farmland ecosystems, as well as increases in the area of grasslands and settlements. However, they attributed the decline in carbon storage solely to land-use changes without delving into the specific driving mechanisms.
Forests, as crucial terrestrial ecosystems, play a pivotal role in the global carbon cycle. The carbon sequestration capacity of forests primarily stems from tree growth, which fixes approximately 90% of the carbon dioxide exchanged in terrestrial ecosystems through photosynthesis [19]. Given that the growth of individual trees is regulated by numerous factors, there is an urgent need to investigate the dynamics of forest carbon density and its impact on forest carbon sequestration capacity [20]. Current research primarily explores forest carbon storage patterns from spatial and temporal dimensions: at the spatial scale, Egusa [21] estimated changes in forest carbon storage by constructing age-carbon density functions. Li [22] integrated Sentinel-2 and Synthetic Aperture Radar (SAR) data with machine learning algorithms to map forest structure and estimate carbon storage. On the temporal scale, the carbon sequestration rate of plantation forests in New Zealand exceeds the default threshold set by the Intergovernmental Panel on Climate Change (IPCC) [23], process-oriented restoration strategies can accelerate carbon accumulation in large timber, as demonstrated [24]. Fu [25] revealed that the primary driver of carbon storage growth in the Ili-Tianshan region is the conversion of bare land and grassland to forestland. In contrast, research on forest carbon storage in karst rocky desertification regions remains relatively limited [26]. Methodologically, studies predominantly focus on combining data with remote sensing to analyze carbon storage. For example, Feng [27] assessed the impact of photosynthetically active radiation (PAR) on carbon storage through biomass volume and correlation analysis, while Li and Luo [28] integrated the PLUS-InVEST model to evaluate differences in carbon storage changes. Although remote sensing technology offers advantages such as extensive coverage, high temporal resolution, and non-contact capabilities [29], its resolution limitations and atmospheric interference constrain the capture of small-scale changes [30], making it difficult to precisely depict comprehensive forest conditions. While forest inventory data can provide supplementary validation, they are constrained by long update cycles, high costs, and ecological disturbances [31] Although the InVEST model is convenient [17], its calibration and validation remain challenging in karst vegetation-sparse regions due to the scarcity of field-measured data.
This study took Zhenjin County in Bijie City, Guizhou Province, as the research area. By combining Guizhou Province’s carbon density dataset and forest resource data, the above-ground carbon density (AGC) and below-ground carbon density (BGC) of forests were calibrated. The InVEST model system was then used to assess the spatial and temporal changes in carbon storage of six major ecological engineering projects from 2000 to 2020. This provided empirical evidence to accurately clarify the carbon benefits of various ecological engineering projects.

2. Materials and Methods

2.1. Overview of Ecological Engineering

As of now, six types of ecological engineering projects have been implemented in Zhijin County. Among these, the Natural Forest Conservation Program (TLCP) covers an area of 7684.82 hectares, aiming to curb ecological degradation, protect biodiversity, and promote sustainable socio-economic development. The program was piloted in 1998 and fully launched in October 2000. Its primary measures include the classification and zoning of forest resources, the construction of ecological public welfare forests, the development of commercial forests, industrial transition projects, and personnel redistribution. The Three-North and Yangtze River Shelterbelt Programs (TNSP) cover an area of 560.06 hectares. Initiated in 1989, the programs aim to improve the ecological environment of the Yangtze River Basin through measures such as afforestation, soil and water conservation, ecological restoration, and multi-species forest configuration. These efforts are designed to prevent soil erosion, enhance ecosystem service functions, and contribute significantly to regional ecological security and sustainable development. The Grain-for-Green Program (GFGP) covers an area of 11,974.15 hectares. Implemented since 2002, the program promotes ecological conservation, soil erosion prevention, and socio-economic benefits through comprehensive measures such as converting farmland to forests, forest planting, and monitoring and evaluating ecological benefits. The National Rocky Desertification Control Program (NGCP) covers an area of 35.35 hectares. Initiated in 2005, the program addresses the causes and current status of rocky desertification in Zhijin County by adopting specific vegetation restoration models to promote ecosystem recovery and improvement. The Key Public Welfare Forest Management Program (WFMP) covers an area of 306.57 hectares. Launched before 2014, the program adheres to the principles of “ecological priority, strict protection, hierarchical management, scientific management, and rational utilization”. It clearly defines national-level public welfare forests and implements stringent management, playing a significant role in regional sustainable development and improving residents’ well-being. Other Forestry Programs (OFP) cover an area of 9546.92 hectares. For example, the 3356 Program, launched in 1988 with support from the United Nations World Food Programme, aims to improve the ecological environment, enhance biodiversity, reduce soil erosion, and promote ecological balance as well as socio-economic benefits. Non-engineered areas (NEE) cover an area of 256,465.97 hectares. Forest vegetation information for each ecological project is shown in Table 1.

2.2. Study Area

Zhijin County is located in the west-central part of Guizhou Province and the southeastern part of Bijie City, with geographical coordinates ranging from 105°24′14″ to 106°10′19″ E and 26°21′47″ to 26°57′24″ N. Situated in the transitional zone between the Qianxi Plateau and the Qianzhong Hilly Basin, the terrain generally slopes from high in the west to low in the east. The western region features fragmented topography with intense erosion, overlapping peaks, crisscrossed ravines, and significant karst and water erosion. In contrast, the eastern region exhibits greater topographic variation and open terrain. The northern region exhibits a high degree of rocky desertification, while the southern region shows a lower degree. Karst landforms are prominently developed, with significant regional elevation differences and high rock exposure. The area has strong precipitation infiltration capacity, with water easily permeating into groundwater, while surface water flows rapidly and disperses, leading to high evaporation rates and resulting in poor soil quality. The highest elevation within the county is 2265 m, and the lowest is 859 m, with a maximum relative elevation difference of 1406 m. The region experiences a northern subtropical plateau monsoon humid climate, characterized by warm winters, cool summers, long frost-free periods, abundant rainfall, synchronized water and heat conditions, and distinct seasons. The soil is predominantly yellow earth, with fertile and deep layers and high organic matter content, making it suitable for the normal growth of most subtropical flora and fauna. The rocky desertification area in Bijie City covers 496,761.53 hectares, accounting for 20.11% of the total rocky desertification area in Guizhou Province, making it the prefecture-level city with the largest rocky desertification area in the province. In Zhijin County, the rocky desertification area is 51,504.85 hectares, representing 10.37% of the rocky desertification area in Bijie City (Figure 1).

2.3. Data Sources

The EE data used in the study were obtained from the forest survey data of the county forestry bureau, covering key parameters such as engineering categories, soil layer thickness, tree trunk diameter, vegetation coverage, tree height, forest stand density, and timber volume; the karst desertification data were obtained from the National Karst Desertification Prevention and Control Engineering Technology Research Center (https://sck.gznu.edu.cn). Both forest survey data and karst desertification data have undergone de-classification processing and do not include confidential data such as topography, and are solely used for research purposes. According to research requirements, both types of data were processed using ArcGIS 10.8 to achieve a spatial resolution of 30 m. For specific data sources, please refer to Table 2. Forest inventory data was collected in 2019, desertification data in 2012 and 2016, DEM data in 2020, soil data, terrain roughness, temperature, precipitation, GDP, and POP data in 2020, and land use data from 2000 to 2020.

2.4. Research Methodology

2.4.1. Forest Carbon Storage

Carbon storage refers to the total amount of carbon fixed and stored in the biosphere. The forest vegetation carbon storage calculated in this study excludes the carbon storage of the herbaceous layer and the litter layer. In forest surveys, diameter at breast height (DBH) is the simplest attribute to measure, with high measurement accuracy; however, due to site conditions and tree form, tree height measurement is time-consuming and less accurate, often leading to measurement inaccuracies. This study employs the DBH growth rate method by Qiu [32], using a DBH-tree height conversion model to estimate missing DBH or tree height values, thereby calculating the growth of DBH and tree height. The formula is as follows:
C = r j B
B = p j M + q j
M = 1 j c j d ¯ j g j × H ¯ j f j · N · k j
C a b o v e = C / S
where C represents forest carbon storage (Mg C); B denotes biomass (Mg C/ha); M stands for forest volume (m3/ha); N is the number of trees per hectare; d j ¯ is the average diameter at breast height (cm); H j ¯ is the average tree height (m); Cabove is the aboveground forest carbon density (Mg C/ha); S is the forest area (ha); pj and qj are the conversion parameters for volume and biomass models of tree species j and cj; gj, and fj are the volume parameters for tree species j; kj is the proportion of tree species j; and rj is the carbon coefficient. Parameter values are referenced from Cheng [33], and the carbon coefficient is referenced from Qiu [32] and Huang [34].

2.4.2. Carbon Density Correction

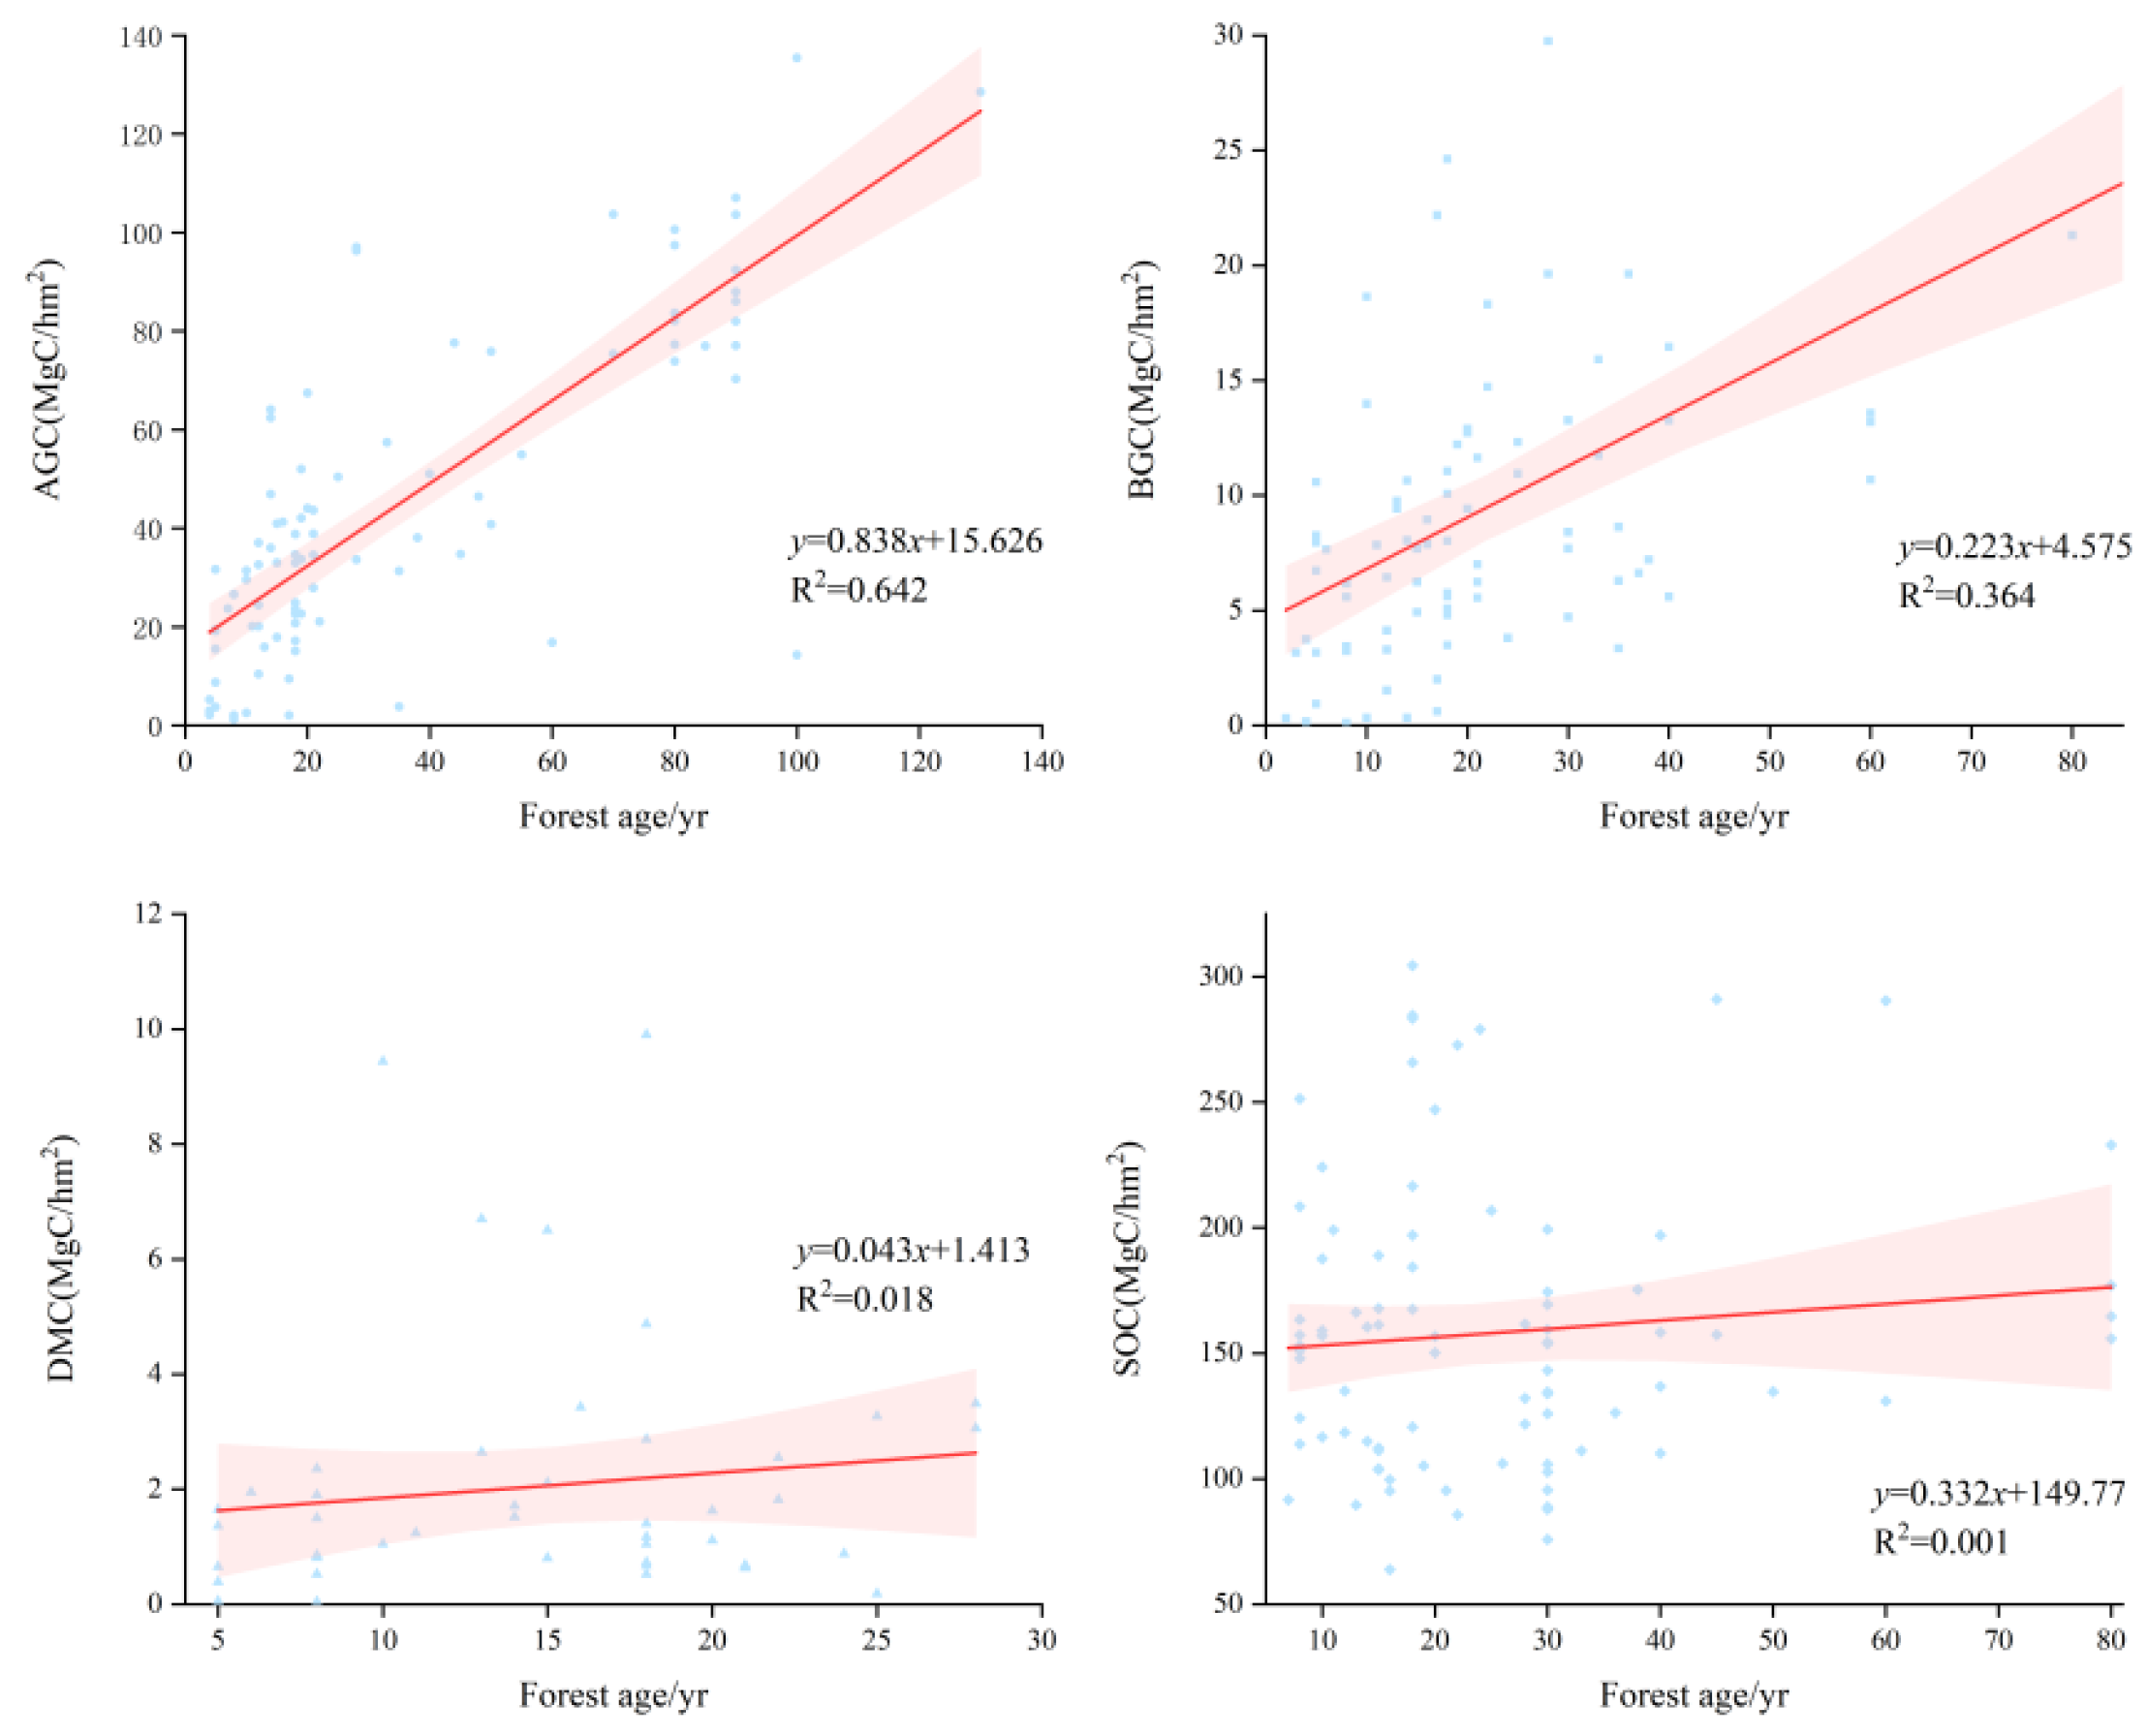
Zhijin County is located in the central-western part of Guizhou Province and belongs to a typical karst landform region. Based on the spatial heterogeneity of forest carbon storage, a carbon density linear regression model was constructed using the carbon density dataset from Guizhou Province (Figure 2). The model was developed using the “2004–2014 China Forest Ecosystem Carbon Density Dataset” Peng and He [35], with initial carbon density data referenced from Luo [17]. A total of 332 (Based on the latitude and longitude of Guizhou Province, select data points within Guizhou Province from the dataset) sample points were obtained, including 93 for AGC (aboveground carbon density), 86 for BGC (belowground carbon density), 55 for DMC (dead organic matter carbon density), and 88 for SOC (soil carbon density). Since water bodies and construction land contribute little to carbon storage, they were ignored and defaulted to 0 (Table 3).
y = K ( a x + b )
K = C 1 / C 2
where y represents carbon density, x denotes tree age, a and b are coefficients, K is the carbon density correction coefficient, C1 is the measured carbon density, and C2 is the model carbon density.
To evaluate model performance, this study calculated the coefficient of determination (R2) and root mean square error (RMSE). The results showed that the R2 value for AGC was 0.64, indicating that the model explained 64% of the variability, a relatively high value suggesting strong explanatory power. The RMSE value was 1.83, indicating a small average difference between the model’s predicted values and the measured values, reflecting high predictive accuracy (p < 0.001). To further validate the model, this study used the average above-ground forest carbon density values from Zijing County in 2020 as measurement data to verify the regression model’s predictive results. Specifically, following Qiu’s [32] carbon stock calculation method, the carbon stocks of dominant tree species in Zhenjin County were calculated using formulas (1–4). Dominant tree species include Huashan pine, cypress, red pine, cypress, oak, paulownia, Chinese toon, white birch, locust, poplar, camphor, and sweetgum. The total carbon storage of these species was calculated and divided by the total area of Zhenjin County to obtain the above-ground forest carbon density (AGC), which is an average value, resulting in an average AGC of 55.25 Mg C/ha. This study uses the aboveground forest carbon density calculated by this method as the measured data. In the measured data, non-dominant plants are not included because the sample size of non-dominant tree species in the forest survey data is too small to be representative; moreover, the number of dominant tree species selected in the article is sufficient to effectively address the issue of limited vegetation sample diversity. The carbon density predicted by tree age regression from the carbon density dataset “2004–2014 China Forest Ecosystem Carbon Density Dataset” is used as the predicted value. The average predicted AGC is 53.42 Mg C/ha. Using Formula 6, the ratio of carbon density for the same year (2020) is calculated, resulting in a correction factor K of 1.034. Due to the difficulties in calculating DMC and SOC using forest resource survey data, and their low R2 values (Figure 2), indicating low accuracy and limited applicability, the study focused solely on correcting AGC and BGC.

2.4.3. InVEST Model

The InVEST model [17], jointly developed by Stanford University, The Nature Conservancy, and the World Wildlife Fund, is characterized by its directness, efficiency, richness in content, and simplicity. It is used to assess the value of spatial ecosystem services. The model divides carbon density into four carbon pools: aboveground vegetation, belowground vegetation, dead organic matter, and soil. It estimates the carbon storage of the entire study area by directly using land use change (LUCC) and carbon density changes. Carbon density is calculated using calibrated carbon density values. The carbon densities presented in Table 3 represent the carbon densities of various components in the study area for the year 2020. Among these, AGC and BGC are dynamic variables (varying by study year), specifically derived by using the study tree age as a proxy for time and applying a regression model to estimate the carbon density for the corresponding years. For detailed descriptions of carbon density calibration, please refer to Section 2.4.2 of this paper. InVEST’s default setting uses the original values of the model. The dynamic information in the study includes changes in carbon density and land use.
C t o t a l = C a b o v e + C b e l o w + C d e a d + C s o i l
where Cabove is the carbon density of above-ground forest, Cbelow is the carbon density of below-ground roots, Cdead is the carbon density of dead organic matter, and Csoil is the carbon density of soil.

2.4.4. Hot Spot Analysis InVEST Model

Hotspot analysis is a local spatial autocorrelation analysis method that can calculate spatial clusters with statistically significant high (or low) values, reflecting the spatial aggregation of carbon storage. In the study area, hotspots in ecosystem carbon storage indicate data points with high values surrounded by similar high-value points, while cold spots indicate data points with low values surrounded by similar low-value points [36]. This study used ArcGIS 10.8 to visualize the hotspot analysis. The year 2020 was selected as the focal analysis year because, by 2020, all ecological engineering projects had been implemented for over five years, ensuring the stability of carbon storage effects; the 2020 forest resources inventory and land use data had the widest coverage; and 2020 was the year China announced its “dual-carbon” goals. The classification of focal points in the study referenced [37] and was adapted to the actual focal point ranges in Zhenjin County.
Z ( G i * ) = j = 1 n w i j x j x ¯ j = 1 n w i j S n j = 1 n w i j 2 ( j = 1 n w i j ) 2 n 1
G i * = j = 1 n w i j x j j = 1 n x j
S = j = 1 n x j 2 n 1 ( x ¯ ) 2
where Z is the normalized agglomeration index, which can represent the spatial agglomeration characteristics, Gi* is the agglomeration index of raster i, wij is the spatial weight between rasters i and j, xj is the carbon stock of raster j, x ¯ is the mean value of all the panels in the space n is the total number of rasters, x with a uniform resolution of 30 m, and S is the standard deviation of the attribute values of all the patches. The spatial clustering characteristics of low values (cold spots) and high values (hot spots) can be determined by the Z value. The cold and hot spot zoning table (Table 4) refers to previous studies [38]. Since there are no extremely significant cold spot areas in the study, they are not listed in the table.

2.4.5. Correlation Analysis

The study was analyzed using the Pearson correlation coefficient r, a measure proposed by Karl Pearson to quantify the degree of linear correlation between two continuous variables, with the value of r ranging from −1 to 1, where 1 indicates a perfect positive correlation, −1 indicates a perfect negative correlation, and 0 indicates no linear correlation. By calculating the Pearson correlation coefficient, the researcher can quantitatively analyze the relationship between the variables, thus providing an important reference for the subsequent research work, and its formula is as follows:
r = i = 1 n ( X i X ¯ ) ( Y i Y ¯ ) i = 1 n ( X i X ¯ ) 2 i = 1 n ( Y i Y ¯ ) 2
where x is the independent variable, including temperature, precipitation, POP, etc., and r is the dependent variable, which is carbon storage.

2.4.6. Moran Index

To further explore the spatial correlation of carbon stocks with each factor, the study quantified the full range of factors using the Moran’s I index to characterize the average degree of correlation of all spatial units with their neighbors over the entire region.
I = n S 0 i = 1 n j = 1 n w i j ( x i x ¯ ) ( x j x ¯ ) i = 1 n ( x i x ¯ ) 2

3. Results

3.1. Spatiotemporal Characteristics of Total Carbon Storage

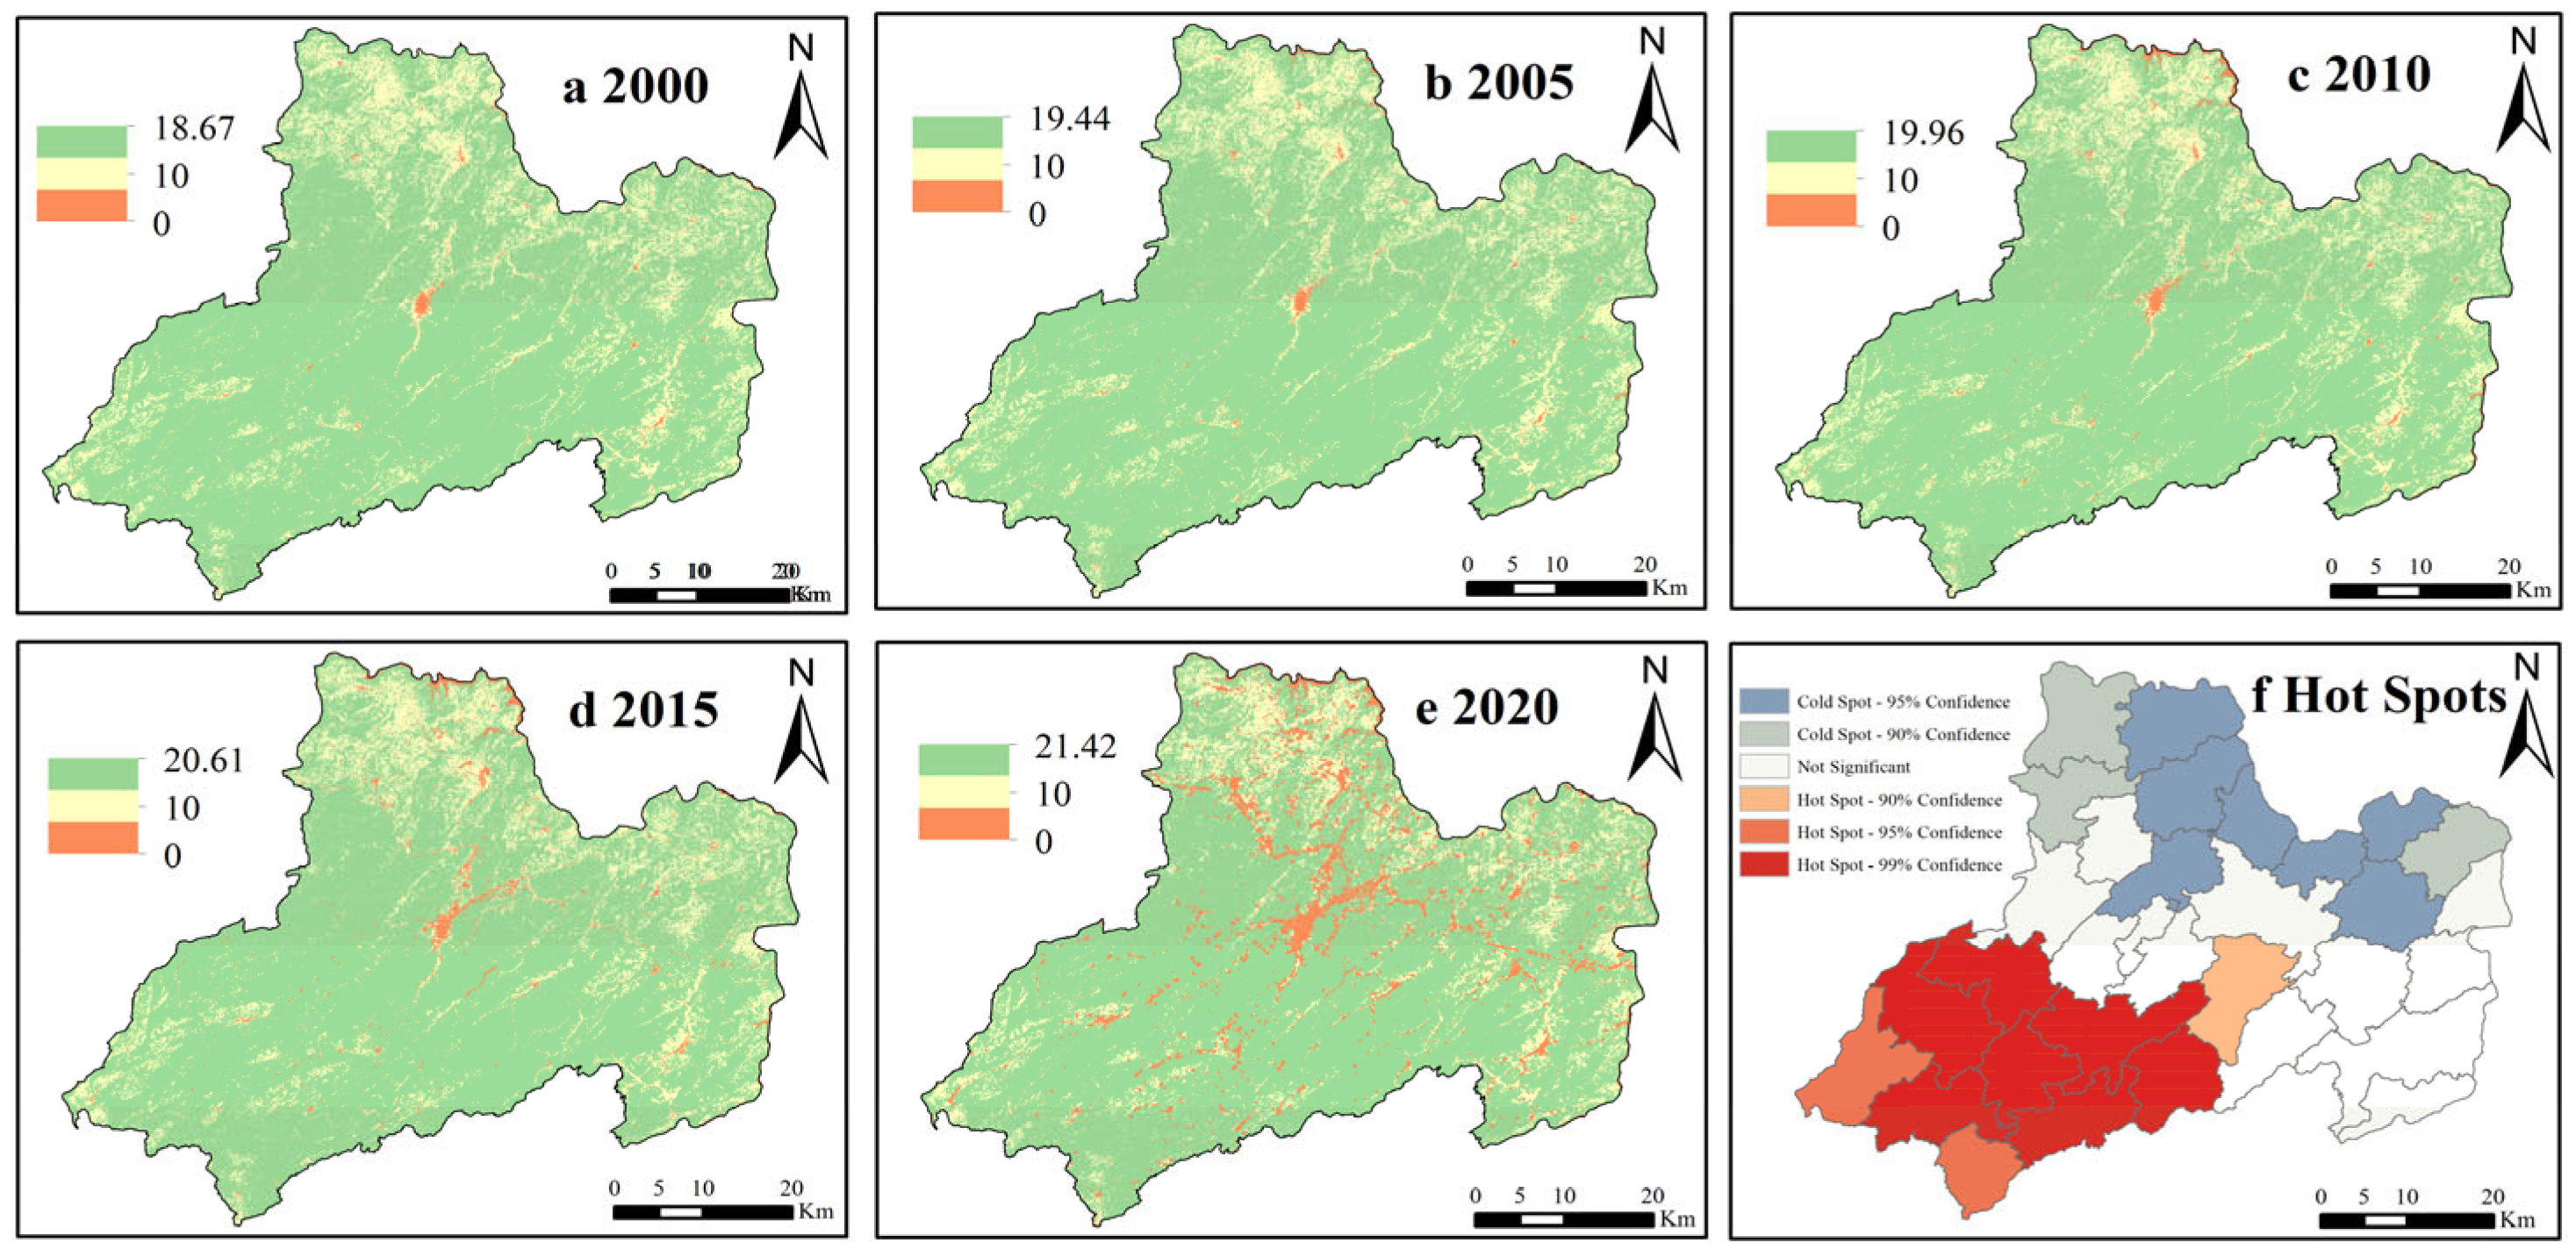
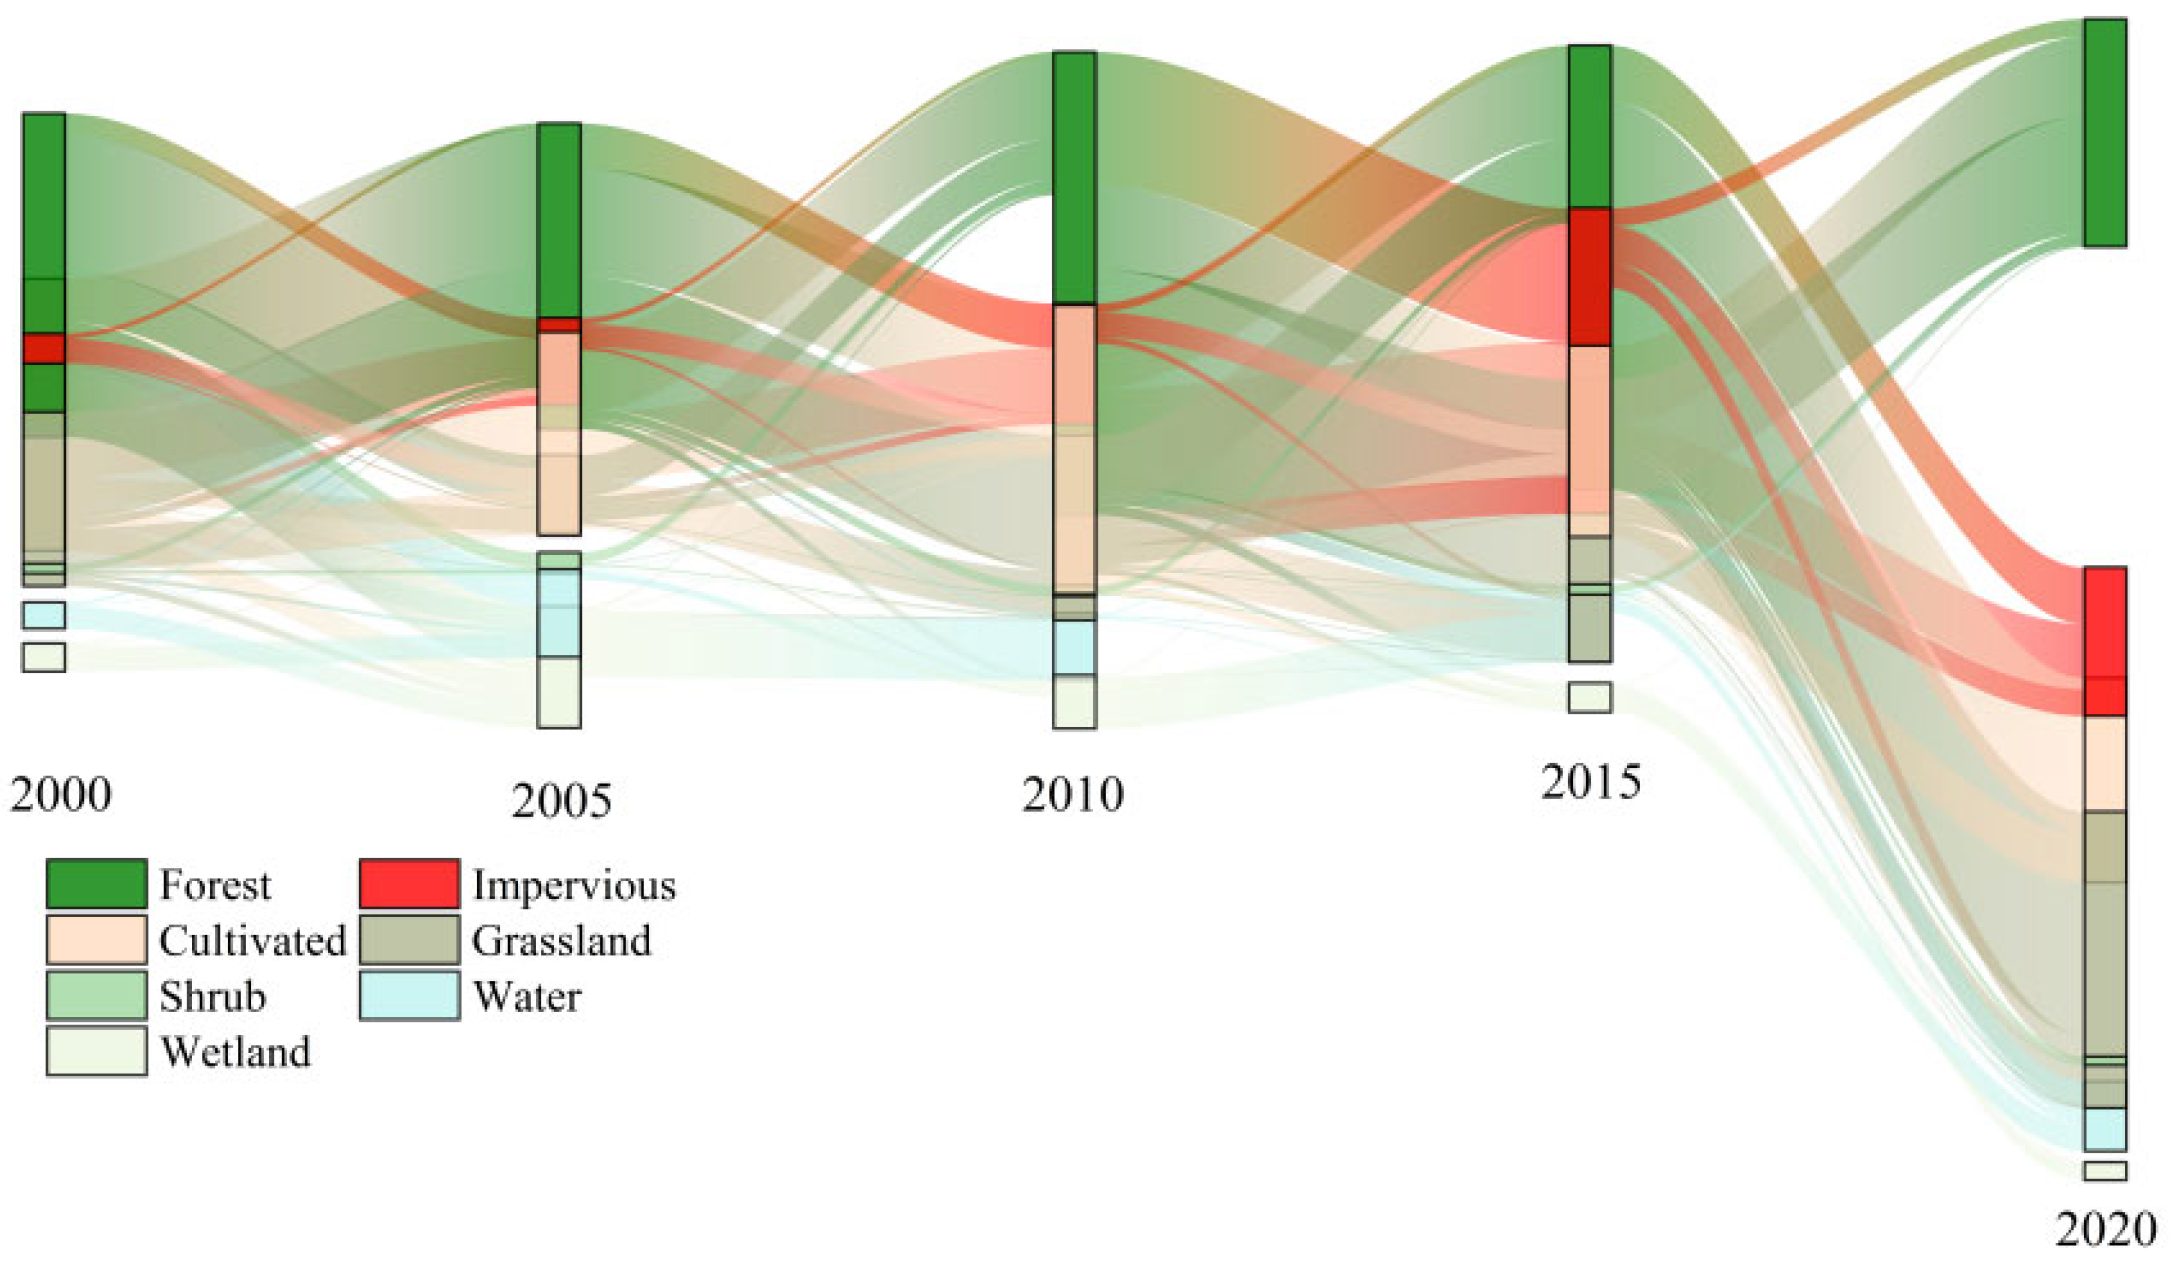
Using the InVEST model, carbon stocks for Zijing County were calculated for the years 2000, 2005, 2010, 2015, and 2020. Carbon stocks include corrected AGC and BGC, as well as uncorrected SMC and SOC. The values are 52.96 × 10⁶ Mg C, 54.73 × 10⁶ Mg C, 55.72 × 10⁶ Mg C, 56.72 × 10⁶ Mg C, and 54.84 × 10⁶ Mg C, respectively. The temporal changes in carbon storage exhibit significant stage characteristics: Between 2000 and 2015, the increase in carbon density resulting from the implementation of ecological engineering (detailed below) drove the overall growth in carbon storage levels. but by 2020, a turning point emerged, with carbon storage decreasing by 3.31% compared to 2015. As clearly shown in Figure 3, compared to 2000, the area with carbon storage approaching zero in 2020 significantly increased. This is due to changes in land use types (LUCC). As illustrated in Figure 4, the areas of construction land and water bodies increased notably. By 2020, the combined area of these two land types increased by approximately 58.66 km2 (compared to 2000), the increase was 161.44%. In this study, the carbon density for these two land types was set to 0, leading to a significant increase in areas with no carbon storage. Although grassland area increased, the extent of this increase was less than the decrease in forest area. This is because forest degradation led to the conversion of forests into grasslands, and since forest carbon storage is higher than that of grasslands, the resulting changes in carbon storage patterns due to this conversion were not significant. By analyzing the changes in carbon storage alongside Figure 3 and Figure 4 and Table 5. It can be concluded that changes in land use types are the main factors affecting carbon stocks. Specifically, forest area decreased by 21.81 km2, a decrease of 5.03%; construction land and water body area increased by 58.66 km2, an increase of 161.44%.
In 2020, the hotspot clusters of carbon storage are mainly concentrated in the southwestern valley area (Z ≥ 2.58), while the cold spot clusters are primarily located in the northeastern region (Z < −1.96). The central and southeastern areas mainly exhibit non-significant characteristics (p > 0.05). This is because the southwestern region has high elevation, frequent surface and groundwater exchange, and a well-developed underground river system, with large areas of forests and other types of natural vegetation that have high carbon storage capacity. In contrast, the northeastern region has vast farmland and severe rock desertification, which easily leads to soil erosion, affecting plant survival and growth, resulting in low vegetation coverage and weak carbon storage capacity in the region. The central region has gentle terrain but frequent human activity, with high levels of urbanization and agricultural activity. The southeastern region has a fragmented terrain, severe soil erosion, uneven distribution of water resources, and frequent droughts. These factors limit the accumulation of carbon reserves, resulting in non-significant characteristics in the central and southeastern regions.

3.2. Analysis of Carbon Storage Under Different Ecological Engineering

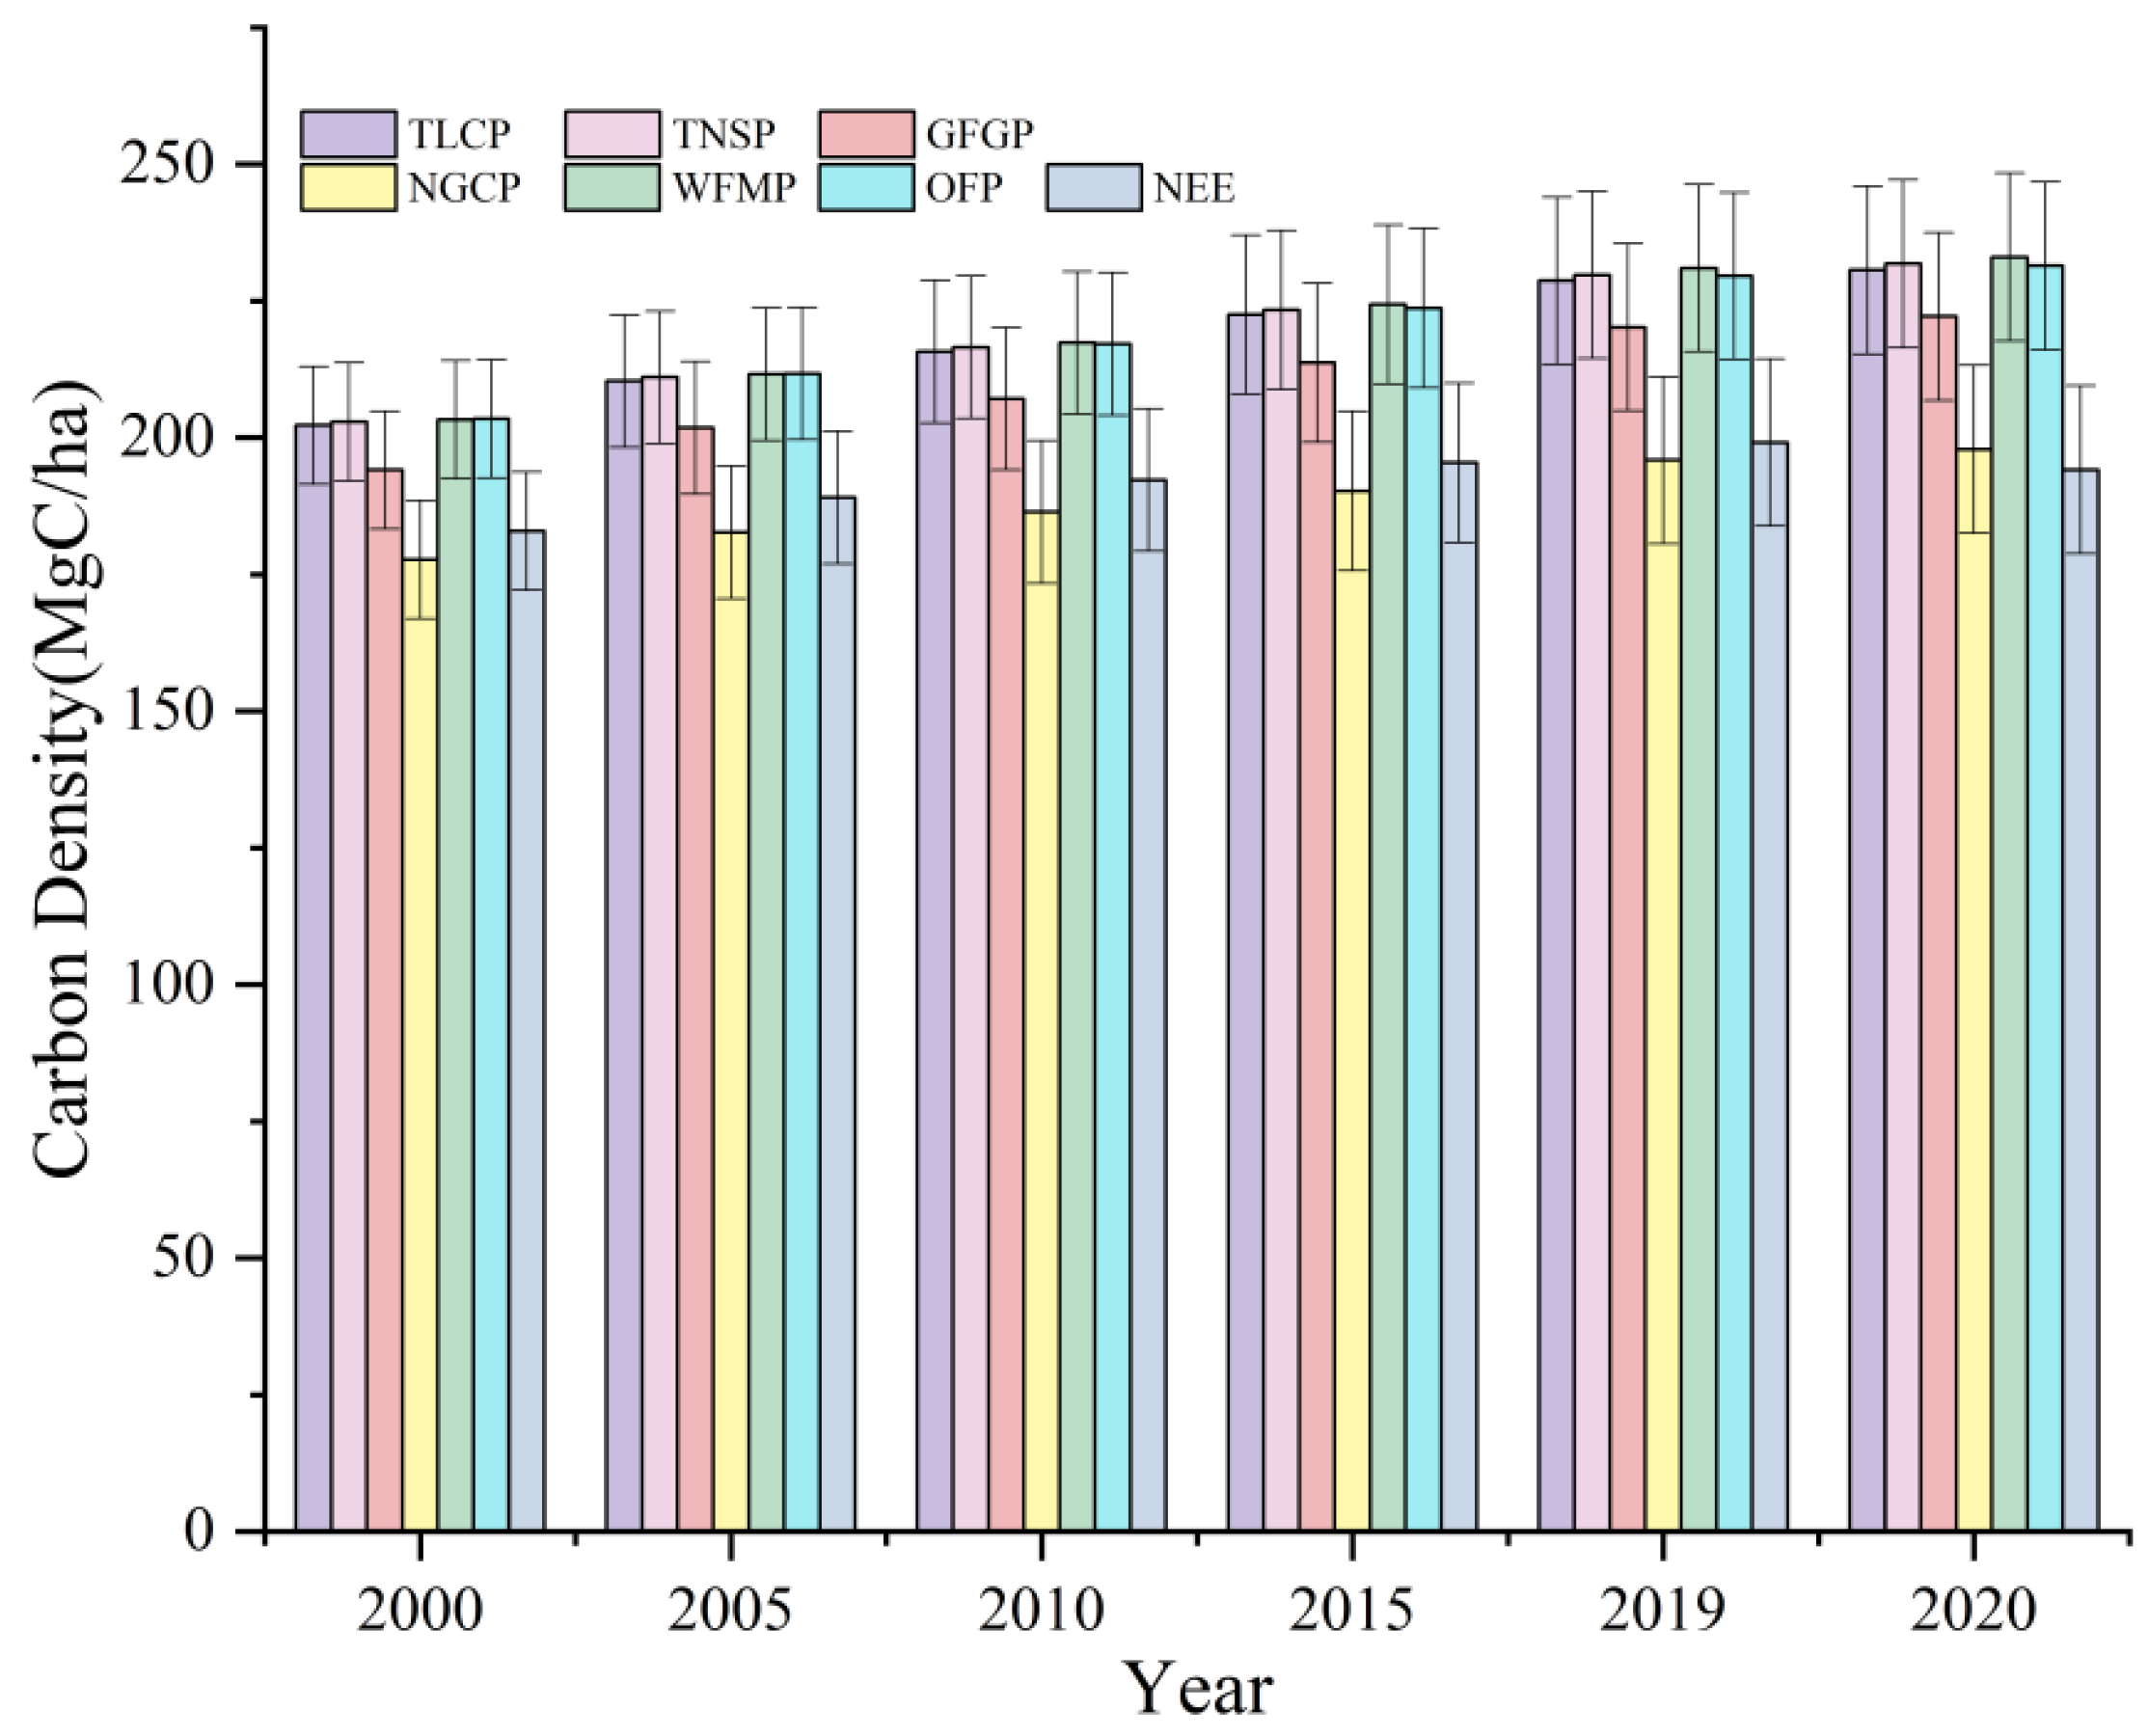
Since the actual years of the various ecological projects recorded in the forest inventory data used are 2019, this study includes an analysis of carbon storage for ecological projects in Zhijin County in 2019. To further analyze the spatial differentiation mechanisms of carbon storage, this study conducted a standardized analysis using carbon density (Mg C/ha): As shown in Figure 5, during the baseline period of 2000, NGCP had the lowest carbon density (177.72 Mg C/ha), followed by NEE (182.92 Mg C/ha), and OFP had the highest (203.48 Mg C/ha). Among them, TLCP (202.25 Mg C/ha), TNSP (202.91 Mg C/ha), WFMP (203.27 Mg C/ha), and OFP all exceeded the 200 Mg C/ha threshold, while GFGP (194.08 Mg C/ha), NGCP, and NEE were below this threshold. By 2020, WFMP had the highest carbon density, rising to 233.02 Mg C/ha, indicating its optimal carbon sequestration efficiency per unit area. Although NGCP still maintained the lowest carbon density level (197.88 Mg C/ha), the difference between it and NEE (200.6 Mg C/ha) decreased from 5.21 in 2000 to 2.72. Time series analysis indicates that the carbon density of all projects showed a significant upward trend, with TLCP (overall annual growth rate of 0.65%), TNSP (0.66%), GFGP (0.67%), WFMP (0.67%), and OFP (0.64%) exhibiting the best growth trends in carbon density. Although NGCP maintained the lowest carbon density level (annual growth rate of 0.54%), the gap between it and NEE (annual growth rate of 0.3%) gradually narrowed, and by 2020, NGCP surpassed NEE (difference of 3.74 Mg C/ha). In contrast, the difference in carbon density between NEE and other ecological projects (except NGCP) continued to widen. These results demonstrate that ecological projects have a significant effect on enhancing regional carbon density, but the carbon storage gain effect of NGCP exhibits noticeable lag.
From Table 6, it can be observed that the growth rate of NGCP follows a “U”-shaped evolution trajectory (annual growth rate change Δ = −0.03% to 0.43%), while NEE exhibits a “decrease-increase-decrease” pattern (Δ = −3.99% to 0.04%). The growth rates of GFGP, OFP, TLCP, TNSP, and WFMP are similar, following a multi-stage fluctuating growth pattern (Δ = −0.06% to 0.31%), showing a periodic oscillation characteristic resembling a “W” shape. Additionally, the growth rate differences among these five ecological project areas are small, with average annual growth rates of 0.69%, 0.65%, 0.67%, 0.68%, and 0.69%, respectively. From 2005 to 2019, the growth rates of various ecological projects were at relatively low levels, while in 2000 and 2020, the growth rates were at higher levels. Among the ecological projects, from 2000 to 2005, NGCP had the lowest growth rate at 0.56%, followed by NEE at 0.67%. However, by 2019–2020, NGCP’s growth rate reached the highest level, jumping to 1.02%, while NEE experienced a negative growth rate (−2.51%). This indicates that the ecological projects have significantly enhanced carbon storage, and the comprehensive effectiveness of NGCP is higher than that of other ecological projects. Engineering design differences explain carbon sequestration efficiency: GFGP’s higher carbon density growth rate (0.67%/yr) correlates with its mixed restoration measures (afforestation + natural regeneration); NGCP’s lagged carbon gains reflect initial challenges in rocky desertification control (e.g., soil erosion limits early-stage biomass accumulation); WFMP’s peak carbon density (233.02 Mg C/ha) results from long-term protected forest management”. There are significant differences in carbon storage among different ecological engineering projects, with the following ranking: Non-Engineered Areas (NEE) > Grain-for-Green Program (GFGP) > Other Forestry Projects > Natural Forest Protection Program (OFP) > Three North and Yangtze River Shelterbelt Program (TNSP) > Welfare Forestry Management Program (WFMP) > National Rock Desertification Control Program (NGCP). The above ranking compares total carbon storage capacity and does not rank efficiency (carbon density). The differences in carbon storage between GFGP, OFP, and TLCP are relatively small. As of 2020, the total carbon storage of NEE was 497.90 × 10⁵ Mg C, significantly higher than that of NGCP (6.99 × 10³ Mg C). This order-of-magnitude difference is primarily attributed to differences in implementation area (NEE covers 2.56 × 10⁵ ha, while NGCP covers only 35.35 ha).
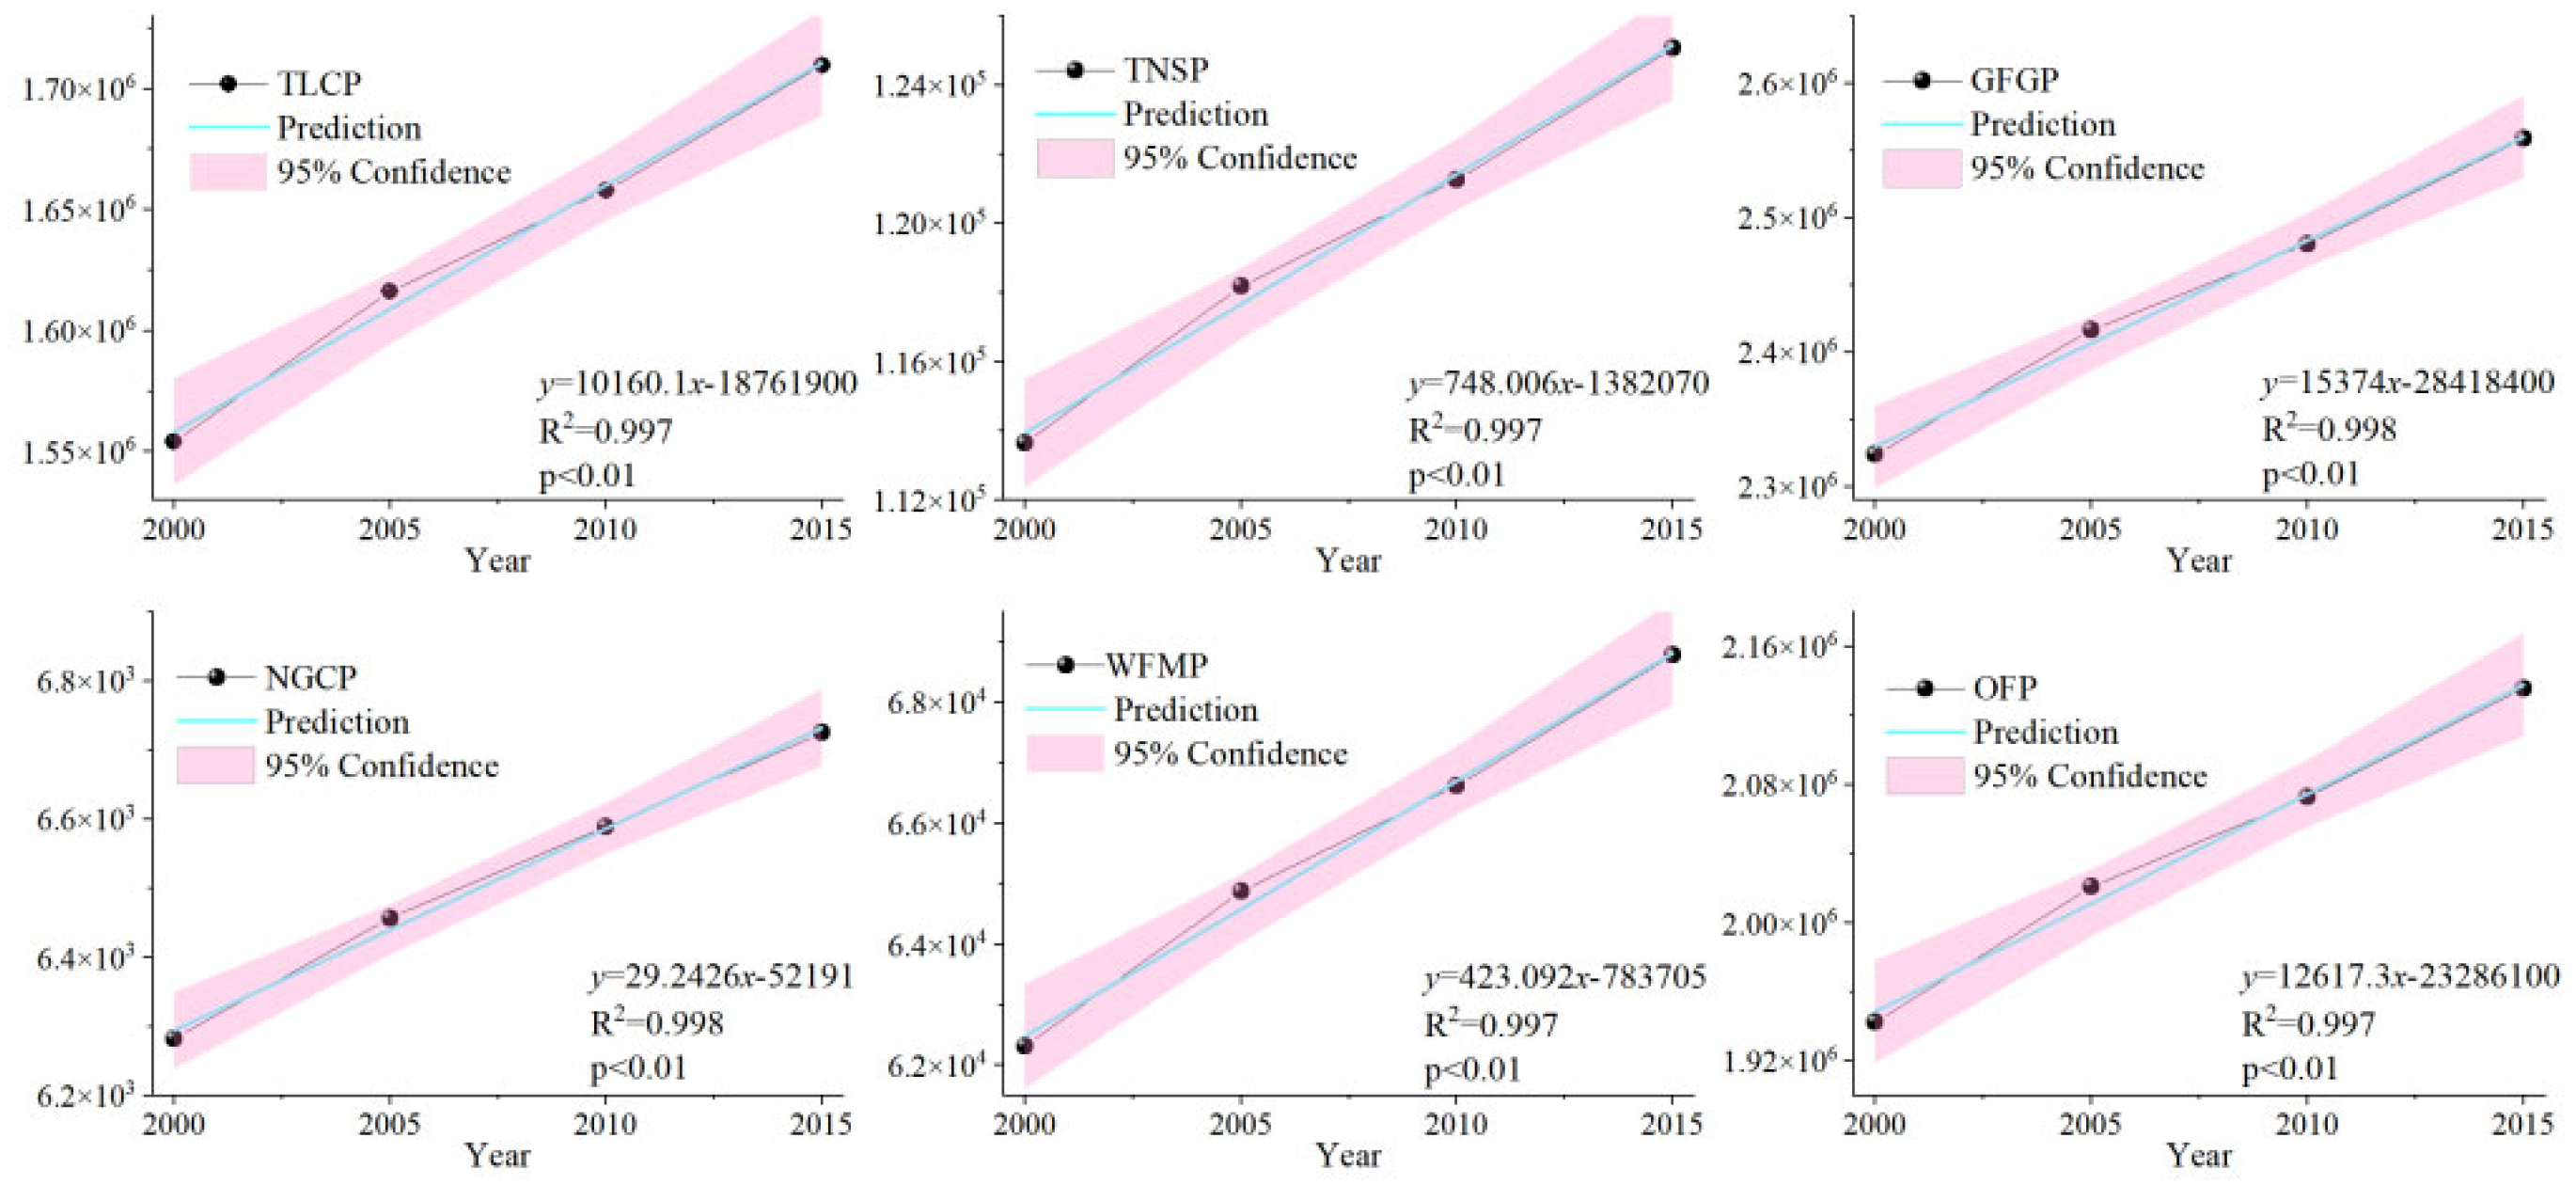
Overall, there is a positive correlation between the carbon storage of ecological projects and time, indicating a clear linear relationship. To further explore the impact benefits of different ecological projects on carbon storage, a linear regression equation was constructed using carbon storage data from 2000 to 2015, as shown in Figure 6. The R2 values for each ecological project were greater than 0.99, with p < 0.01, demonstrating the reliability of the prediction equations. A comparison of the predicted and actual values of carbon storage for ecological projects in 2019 and 2020 (Table 7) revealed that most predicted values were generally lower than the actual values. However, the WFMP predicted values did not show significant differences from the actual values, both being 0.71 × 10⁵ Mg C. In the analysis above, although the carbon storage in Zhijin County in 2020 showed a certain degree of decline compared to the 2015 level (a reduction of 1.88 × 10⁶ Mg C), the actual carbon storage of the ecological projects still exceeded the earlier predicted values even under this declining trend. This indicates that the effectiveness of the ecological projects remains significant. Not only did they partially offset the declining trend, but they also surpassed the initial expected targets to some extent, further highlighting the crucial role of ecological projects in enhancing and maintaining regional carbon storage.

3.3. Analysis of Driving Factors

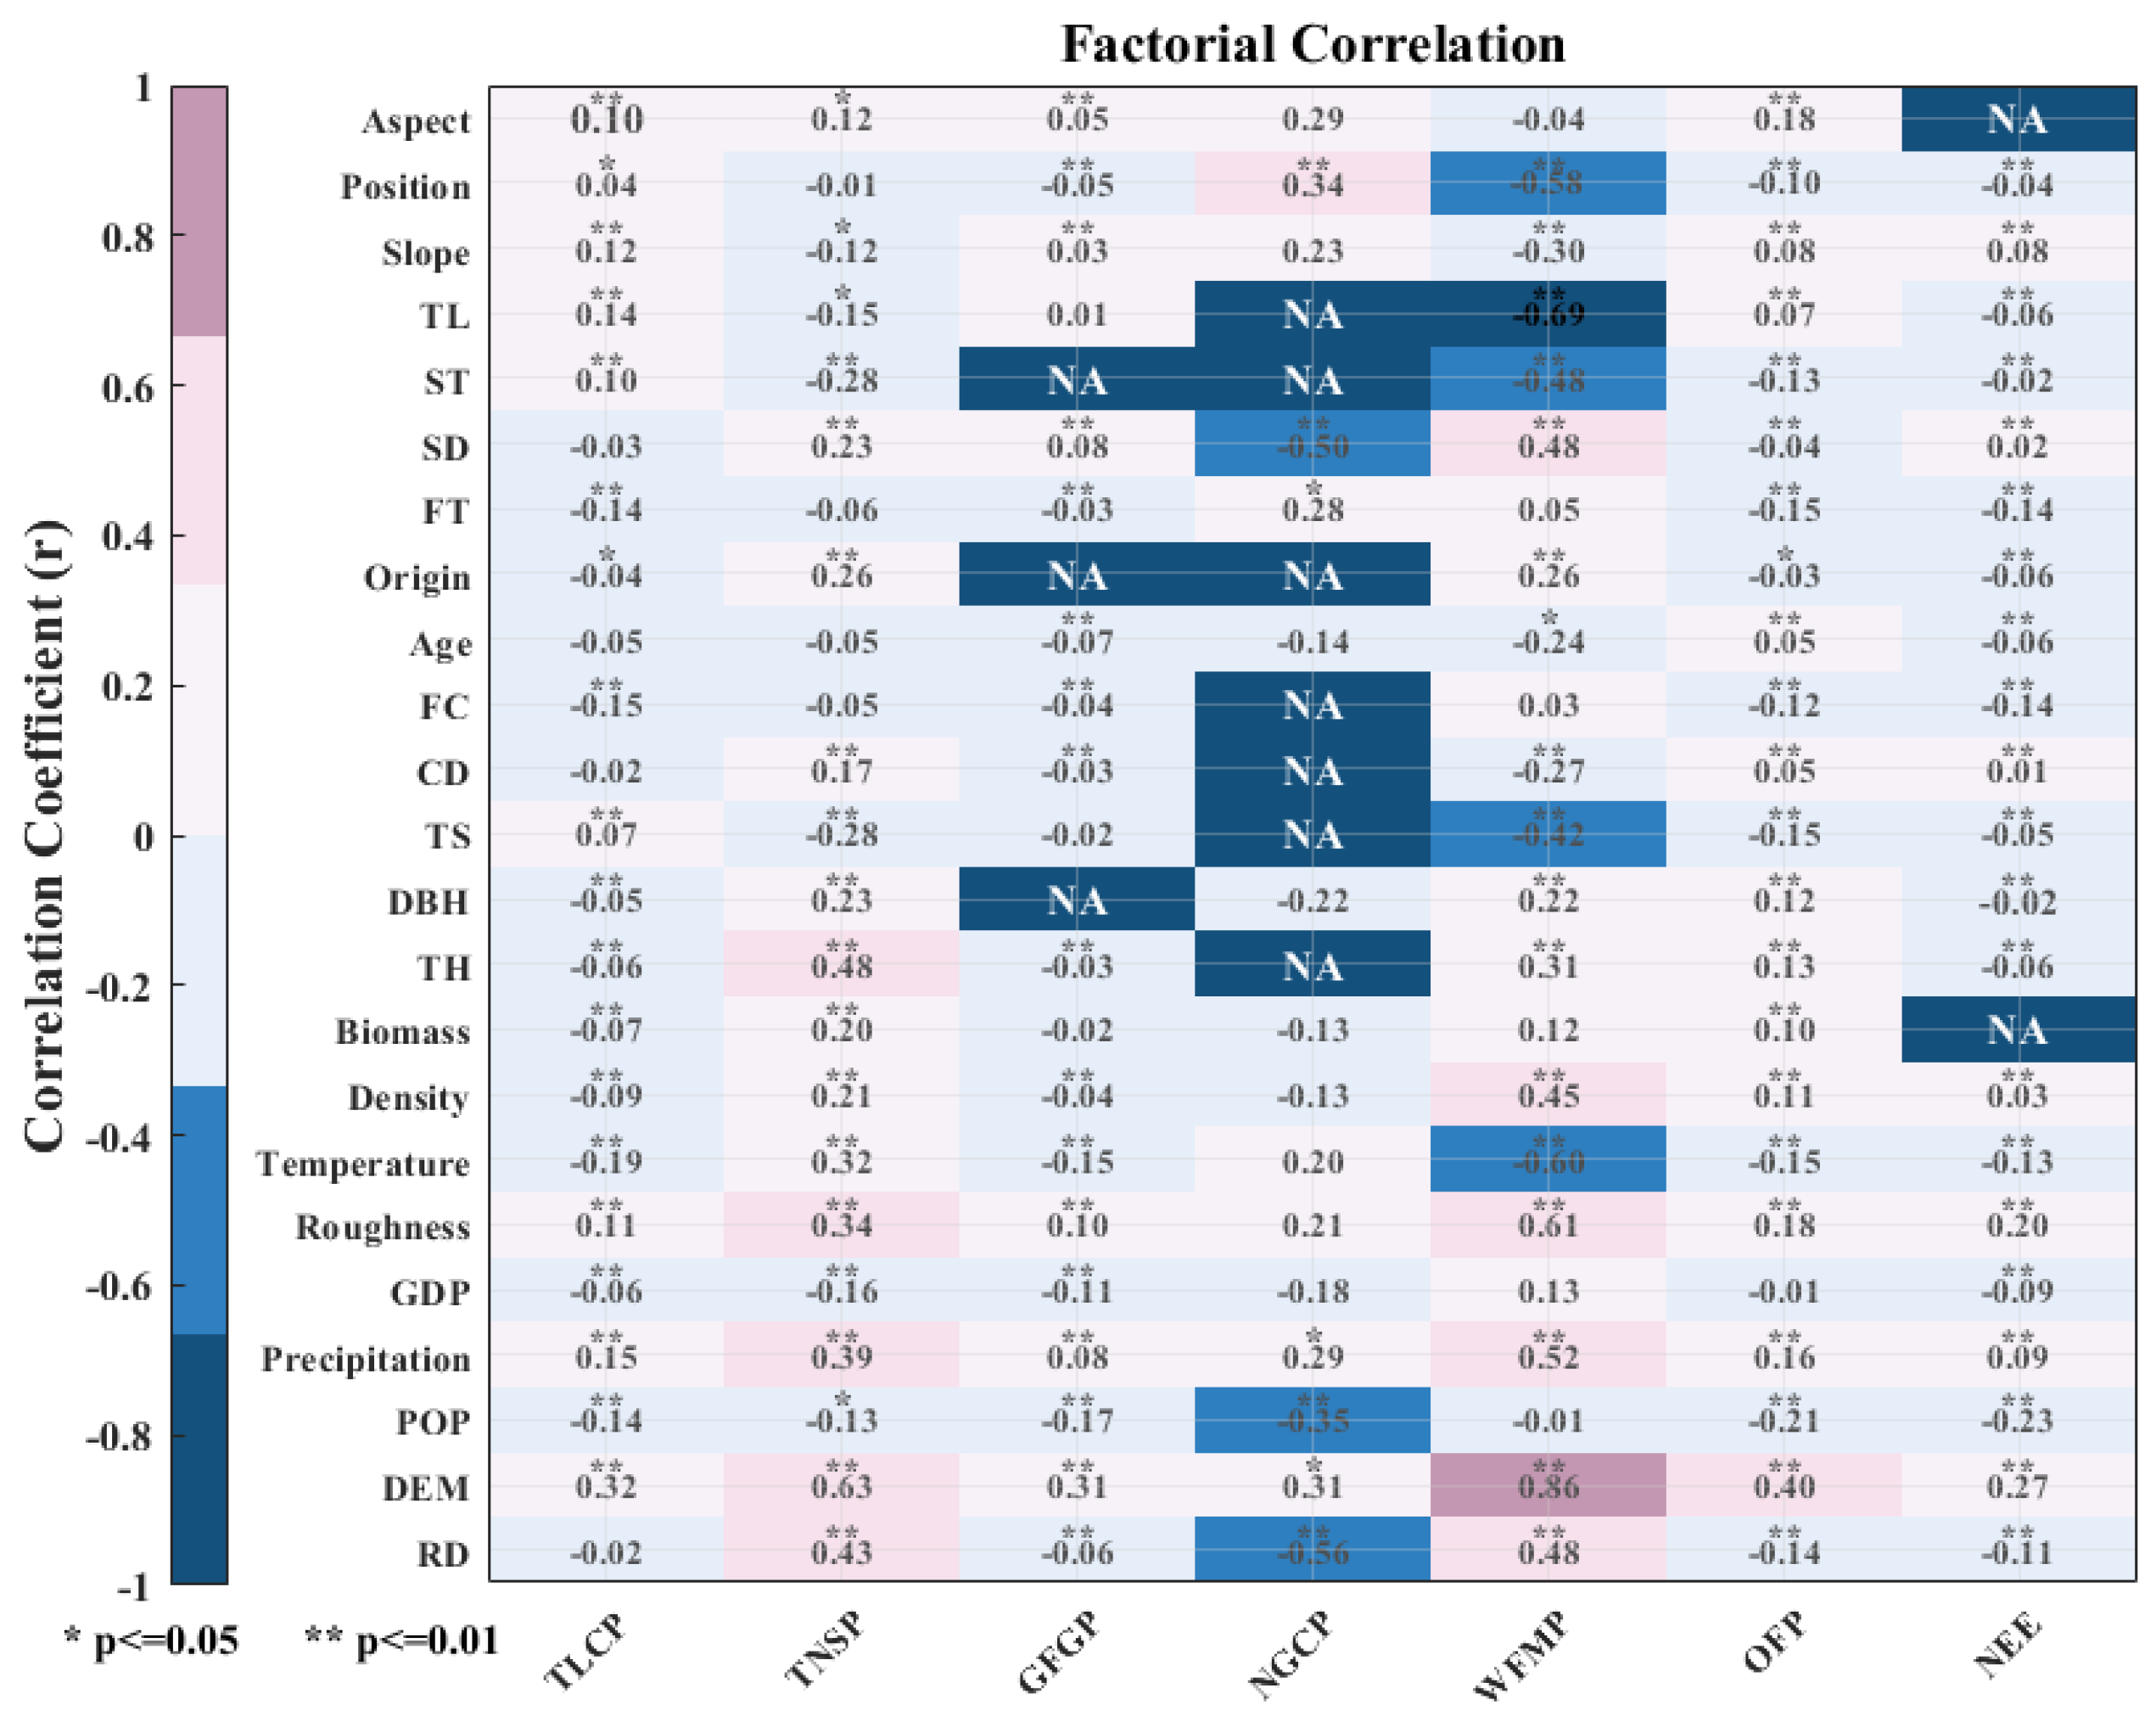
In this study, the Pearson correlation coefficient was employed to explore the driving factors of carbon storage across different ecological projects. The results are presented in Figure 7. The leftmost column lists the following variables: Aspect, Position, Slope, Transportation Location (TL), Soil Type (ST), Soil Depth (SD), Forest Type (FT), Origin, Age, Forest Category (FC), Canopy Density (CD), Tree Species (TS), DBH, Tree Height (TH), Biomass, Density, Temperature, Roughness, Gross Domestic Product (GDP), Precipitation, Population (POP), Digital Elevation Model (DEM), Rocky Desertification (RD), and carbon storage (CS). The analysis indicates that in the GFGP and NEE, POP shows a significant negative correlation with carbon storage, with r values of −0.17 and −0.23, respectively. In the TLCP, carbon storage is primarily negatively regulated by temperature (r = −0.19), while rocky desertification is a key negative influencing factor for the NGCP, with an r value of −0.56. Elevation is a critical driving factor for carbon storage in both ecological project areas and non-project areas, particularly in the WFMP, where the r value is most prominent at 0.86. In current research on the coupling relationship between rocky desertification and carbon storage, rocky desertification generally inhibits carbon storage. However, in karst plateau regions, the coupling relationship between rocky desertification and carbon storage exhibits significant spatial heterogeneity. In the NGCP area, rocky desertification is the main negative driving factor for carbon storage (r = −0.56). In contrast, in the TNSP and WFMP areas, carbon storage shows a significant positive correlation with increasing rocky desertification levels, with r values of 0.43 and 0.48, respectively. This spatial heterogeneity suggests that the mechanisms influencing carbon storage are complex, and changes in carbon storage result from the synergistic effects of multiple factors. The direction (positive or negative) and strength of the influence of a single factor exhibit clear regional dependence.
The impact of climatic factors on carbon storage in ecological engineering projects shows significant variation. Temperature increases generally inhibit carbon accumulation in most engineering projects, with a particularly strong effect in the WFMP region, as high temperatures exacerbate respiratory consumption and drought stress. Precipitation promotes increases in carbon storage, with the most pronounced effect observed in the WFMP region, indicating that water supply directly drives increases in ecosystem carbon storage, and forests can efficiently utilize precipitation to enhance carbon sequestration. NEE exhibits a weak response to climate, suggesting that ecological engineering amplifies the climate-carbon storage association, with the most significant effect observed in the WFMP region. Elevation is closely related to factors such as climate, soil type, and land use. In high-altitude regions, the low-temperature environment significantly slows down the decomposition rate of soil organic matter, which is conducive to the stability of carbon pools. Additionally, vegetation in these areas, primarily consisting of alpine shrubs and coniferous forests, exhibits a significantly higher biomass accumulation rate compared to low-altitude vegetation. Changes in altitude also affect the physical and chemical properties of the soil. Increased soil depth and enhanced water retention capacity provide favorable conditions for the accumulation of carbon storage.

4. Discussion

4.1. Analysis of Carbon Storage in Different Regions

Most studies indicate that ecological restoration can effectively promote regional soil carbon stock growth, enhance ecosystem resilience, and improve sustainable land use capacity, For example, Yang [39] noted that the total carbon stock in the Yellow River Delta showed fluctuating declines but remained generally stable between 2015 and 2020, indicating that implemented ecological restoration projects have achieved positive outcomes. Cross-regional comparisons show that carbon storage in karst regions generally exhibits a declining trend, but with local fluctuations in growth. For example, Zhang [40] noted that carbon storage in Qinglong County initially decreased before increasing, highlighting the significant positive impact of ecological engineering on carbon storage in karst regions. however, potential driving mechanisms have not been thoroughly analyzed [41,42,43]. Due to inconsistencies in the area of each region, direct comparisons of carbon storage were not feasible. Therefore, the study compared carbon storage per unit area (ha) (Table 8). Among similar studies in Guizhou Province, Luo [44] investigated a geographical environment comparable to this study, but the carbon density in this study was approximately 50 Mg C/ha higher. This significant difference indicates that carbon storage can vary considerably even in similar geographical environments. Such variations may result from multiple factors, including but not limited to vegetation type, soil characteristics, climatic conditions, and human activities. The carbon density in karst plateau regions differs markedly from that in other areas, generally being higher. For instance, the northern grassland of the Tibetan Plateau exhibits the lowest carbon density at only 59.1 Mg C/ha, approximately 3.24 times lower than that of the study area and 1.85 times lower than the national average of 103.28 Mg C/ha [45,46]. This demonstrates that the carbon storage capacity of karst plateau regions is relatively high.
Huang [45] revealed that in the grassland ecosystems of the northern Tibetan Plateau, the combination of precipitation, temperature, and soil texture explains 86.47% of the aboveground carbon density, with precipitation contributing the most. It is worth noting that his research shows that SOC accounts for as much as 95%, indicating that soil carbon has a significant advantage in grassland-dominated areas. The study area is dominated by forests, with significant contributions from above-ground biomass. Although SOC and BGC were corrected, the driving factors of SOC in grassland areas (such as seasonal precipitation and plant respiration) were not included in the model. Future research should integrate more soil parameters (such as pH, microbial biomass, and land permeability) to enhance cross-regional comparability. Xi and Li [12] demonstrated that changes in carbon storage in the Yangtze River Basin are jointly driven by human activities (indirectly through vegetation changes) and climate change (directly affecting biophysical processes). This study indicates that carbon storage in karst plateau regions is primarily influenced by elevation, whereas in other regions, forest structure plays a dominant role. This highlights the diversity and complexity of factors influencing carbon storage and underscores the uniqueness of carbon storage mechanisms in karst landscapes. To more accurately assess and predict carbon storage in a region, it is essential to comprehensively consider multiple factors (such as climate, soil type, vegetation distribution, land-use changes, forest management, and environmental protection policies) and implement corresponding scientific research and effective management measures.

4.2. Impact of Different Measures on Ecological Projects

In the aforementioned research findings, NEE > GFGP > OFP > TLCP > TNSP > WFMP > NGCP. This result was explained from an ecological perspective. Given the diversity in design, implementation methods, and target ecosystem characteristics among different ecological engineering projects, it is necessary to explore the impact of the aforementioned behaviors on forest carbon storage and the various factors involved in the implementation process, as well as their interactions. Since NEE serves as the control group without ecological engineering interventions, it lacks representativeness for NEE studies Given the diverse designs, implementation methods, and target ecosystem characteristics of different ecological engineering projects, exploring their impacts on forest carbon storage requires an in-depth analysis of the multiple factors involved in the implementation process and their interactions. The assessment of carbon stocks (carbon stocks for each measure are regional total carbon stocks) continues to use correction parameters for AGC and BGC, as well as unchanged DMC and SOC parameters. Based on the area of ecological engineering, the Grain for Green Program (GFGP) (11,974.15 hectares) and two common ecological restoration measures—afforestation and mountain closure for natural regeneration—were selected to compare changes in carbon storage under different measures. Afforestation rapidly increases forest area through artificial tree planting, while mountain closure for natural regeneration promotes the recovery of natural vegetation and the self-restoration of forest ecosystems by implementing protective measures in specific mountainous areas. Studies indicate that the longer the closure period, the more complete the vegetation recovery, leading to increased forest carbon storage [47]. Notably, soil organic carbon storage may stabilize after 20 years of closure, resulting in a gradual slowdown in its growth rate [48].
As of 2020, the area under the Grain for Green Program (GFGP) with afforestation in Zhijin County was 14,092 ha, with a carbon storage of 41.16 × 10⁵ Mg C, while the area under mountain closure for natural regeneration within GFGP was 2959 ha, with a carbon storage of only 1.46 × 10⁵ Mg C, significantly lower than the former. As shown in Figure 8. As shown in Figure 8, the carbon density of the overlapping areas of Grain for Green and artificial reforestation, the overlapping areas of Grain for Green and mountain closure and reforestation, Grain for Green Project, artificial afforestation, mountain closure and reforestation, and other areas all increased. The average carbon density of the overlapping areas of Grain for Green and artificial reforestation (277.42 Mg C/ha) was significantly higher than that of other regions, followed by Grain for Green Project, mountain closure and reforestation, other areas, and artificial afforestation. The carbon density of the overlapping areas of Grain for Green and mountain closure and reforestation was the lowest. In the areas where mountain closure and natural regeneration were implemented, the carbon density (213.52 Mg C/ha) was lower than that of the areas where only Grain for Green Project was implemented (235.48 Mg C/ha), but its annual growth rate was 0.13% higher than that of Grain for Green Project. The carbon density in GFGP areas with mountain closure for natural regeneration (46.68 Mg C/ha) was significantly lower than in other regions, even below that of the control areas without ecological engineering (185.28 Mg C/ha). This difference may stem from the reliance of mountain closure on natural regeneration processes, where the annual biomass accumulation rate of the tree layer is lower than that of afforestation [49,50]. Additionally, the degree of rocky desertification in mountain closure areas is higher (using a scale of 1–5 to represent potential, mild, moderate, severe, and extremely severe rocky desertification, the quantified values for afforestation and mountain closure are 1.48 and 1.52, respectively). This results in lower water-use efficiency compared to non-rocky desertification areas and reduced soil carbon content relative to afforestation regions. Therefore, although the primary goal of these measures is to enhance forest carbon sequestration capacity, relying solely on mountain closure strategies poses systemic risks. In the future, it is necessary to integrate multiple suitable engineering measures to collectively improve regional carbon storage and carbon sink capacity.
Correlation analysis (Figure 9) reveals that in GFGP areas with afforestation, terrain roughness is the primary influencing factor (r = 0.29, p < 0.01). This is because soil organic carbon storage increases with higher terrain roughness, likely due to the close relationship between terrain roughness and land use. Areas with cropland and grassland exhibit lower terrain roughness, while regions with higher roughness are typically forested [51]. In contrast, in GFGP areas with mountain closure for natural regeneration, elevation is the dominant factor (r = 0.16, p < 0.05), possibly related to vertical climatic zone differentiation in the region. Higher elevations are associated with lower human disturbance intensity and more stable hydrothermal conditions [52], which favor the natural regeneration of secondary forests. Additionally, rocky desertification is a significant negative factor (r = −0.14 in afforestation areas and r = −0.15 in mountain closure areas, p < 0.05). Although the statistical significance of the correlation between certain factors and carbon storage is p > 0.05, the large sample size (e.g., NEE sample size greater than 100,000) may have increased the sensitivity of the test, suggesting that other variables may jointly drive changes in carbon storage. The actual impact needs to be assessed in conjunction with other driving factors. Rocky desertification, accompanied by bedrock exposure, leads to thinner effective soil layers, restricts root space expansion, and causes rapid water loss. This indicates that even within the same ecological engineering project, the factors influencing carbon storage vary significantly across different regions. Such spatial heterogeneity suggests that current management strategies in ecological engineering may reduce the optimization benefits of carbon storage. In order to realize carbon stock enhancement, ecological projects need to be implemented precisely. For example, in high altitude areas: prioritize WFMP + TNSP (slope stabilization) to take full advantage of the altitude-driven carbon gain (r = 0.86); in severe rocky desertification areas: implement NGCP + assisted natural regeneration (e.g., soil improvement) to accelerate early carbon accumulation. Urban fringe areas: Limit GFGP conversion to avoid encroachment on built-up land.

4.3. Limitations and Future Research Directions

In karst plateau regions, the spatiotemporal evolution of carbon storage and its influencing factors constitute a complex and multifaceted scientific issue. To delve deeper into this topic, the research team utilized data from the Guizhou Province carbon density dataset and conducted detailed analysis by constructing linear regression models. During the analytical process, the team calibrated aboveground carbon density (AGC) using field-measured carbon density data to enhance model accuracy. However, current challenges in calibrating soil organic carbon (SOC), belowground carbon (BGC), and dead organic matter carbon (DMC), as well as issues related to land-use data precision, may introduce certain biases in the InVEST model’s evaluation of partial carbon storage. This study estimates carbon storage on an annual scale. However, Zhang [53] demonstrated that in tropical seasonal rainforests in southwestern China, carbon loss during the rainy season and carbon storage during the dry season exhibit significant seasonal variations. Therefore, future research should further investigate the impact of seasonal climate fluctuations on vegetation growth dynamics to refine the carbon storage assessment framework. Additionally, the implementation timelines of ecological engineering projects vary, and the growth and development of vegetation across different projects exhibit considerable diversity. The effectiveness of ecological engineering may be influenced by local climatic conditions and specific project objectives [54], which could also affect the evaluation results of carbon storage.
Given the aforementioned issues, future research should further integrate high-precision remote sensing technologies to analyze the dynamic changes in carbon storage across different seasons. High-accuracy vegetation growth data will contribute to a more precise assessment of the spatiotemporal distribution characteristics of carbon storage [55,56]. Additionally, studies should focus on the regulatory effects of policy-driven initiatives (such as ecological restoration projects and poverty alleviation relocation) on carbon storage. Research indicates that such policies not only promote ecological recovery but also significantly enhance regional carbon sink capacity [15,27]. In forest management, it is essential to prioritize the integration of elevation gradient effects and the spatial heterogeneity of rocky desertification. By optimizing engineering combinations, ecosystem resilience can be improved, providing robust support for carbon cycle research and the scientific implementation of ecological engineering.

5. Conclusions

Taking the karst plateau as the specific research object, by conducting on-site measurements of carbon storage in different ecological projects in the region and combining them with model prediction analysis, it is possible to quickly identify the most suitable areas for afforestation and their reasonable scope. This helps the Zhenjin County Government scientifically plan forest structure and select the optimal geographical environment for afforestation projects. The research findings can provide insights for enhancing the ecosystem service capacity of karst regions, assisting government departments in formulating reasonable environmental protection policies, and addressing the issue of rock desertification in karst plateau areas to some extent. The study was unable to precisely calibrate DMC (dead organic matter carbon density) and SOC (soil carbon density); future research should focus on calibrating DMC and SOC, exploring the coupled benefits of multiple ecological engineering projects, and identifying the optimal ecological restoration models tailored to different geographical and climatic patterns. This study draws three main conclusions:
(1)
Under the positive influence of ecological engineering, carbon storage increased at an annual growth rate of 0.46% from 2000 to 2015; land use changes led to a 3.31% decrease in carbon storage in 2020. In 2019 and 2020, the carbon storage of ecological engineering exceeded the predicted values, demonstrating a more positive effect.
(2)
Among ecological projects, GFGP (Grain-for-Green Program) has the largest area and highest carbon storage; carbon density across all projects has continued to grow, with WFMP (Welfare Forest Management Program) maintaining the highest carbon density due to strict management and protection measures that promote natural restoration.
(3)
Natural factors (such as elevation) primarily drive the concentration of carbon storage hotspots in southwestern valley regions (2020). The impact of rock desertification on carbon storage may vary across different regions.

Author Contributions

Conceptualization, P.Y., S.L. and Z.Z.; Data curation, P.Y. and S.L.; Formal analysis, P.Y., S.L. and Z.Z.; Funding acquisition, P.Y.; Investigation, P.Y. and S.L.; Methodology, P.Y. and S.L.; Project administration, P.Y. and Z.Z.; Resources, P.Y.; Software, P.Y. and S.L.; Supervision, Z.Z.; Validation, P.Y. and S.L.; Visualization, P.Y. and S.L.; Writing—original draft, P.Y. and S.L.; Writing—review & editing, P.Y. and S.L. All authors have read and agreed to the published version of the manuscript.

Funding

This study was supported by Guizhou Provincial 2025 Central Government-Guided Local Science and Technology Development Fund Project, (Qian Ke He Zhong Yin Di [2025] 031); Guizhou Provincial Science and Technology Program (Qian Ke He Ping Tai YWZ [2025] 001); Guizhou Provincial Key Laboratory Construction Project, (Qian Ke He Ping Tai [2025] 014); and Guizhou Normal University Academic Nurturing Seedling Fund (Qian Shi Xin Miao [2022] 09).

Data Availability Statement

The original contributions presented in this study are included in the article. Further inquiries can be directed to the corresponding author.

Acknowledgments

We thank the corresponding authors for their support and the various authors for their cooperation.

Conflicts of Interest

The authors declare no conflicts of interest.

References

  1. Zhang, Y.; Zhang, Z.; Zhang, M.; Yuan, Z. The global situation of karst desertification research based on forest ecology. Forests 2024, 15, 126. [Google Scholar] [CrossRef]
  2. Wen, D.; Huang, Y.; Huang, Y.; Ding, N.; Ni, K.; Wang, H.; Müller, C. Karst rocky desertification restoration increases soil inorganic N supply to reduce plant N limitation. Catena 2024, 241, 108012. [Google Scholar] [CrossRef]
  3. Jiang, Z.; Lian, Y.; Qin, X. Rocky desertification in Southwest China: Impacts, causes, and restoration. Earth-Sci. Rev. 2014, 132, 1–12. [Google Scholar] [CrossRef]
  4. Zhu, M.; Zhou, Z.; Wu, X.; Liu, R.; Zheng, J.; Wang, J.; Wan, J. Response of vegetation carbon sequestration potential to the effectiveness of vegetation restoration in karst ecologically fragile areas in Guizhou, southwest China. Ecol. Indic. 2024, 158, 111495. [Google Scholar] [CrossRef]
  5. Lu, Q.; Zhao, C.; Huang, H. Comparative study on the temporal and spatial evolution of the ecosystem service value of different karst landform types: A case study in Guizhou Province, China. Appl. Sci. 2022, 12, 12801. [Google Scholar] [CrossRef]
  6. Zhang, J.Y.; Dai, M.H.; Wang, L.C.; Zeng, C.F.; Su, W.C. The challenge and future of rocky desertification control in karst areas in southwest China. Solid Earth 2016, 7, 83–91. [Google Scholar] [CrossRef]
  7. Ding, Y.L.; Zhou, Y.C. Study on the coupling relationship between slope, soil thickness, and rock exposure rate in a karst small watershed. Soil Bull. 2019, 50, 1053–1061. (In Chinese) [Google Scholar]
  8. Bussotti, F.; Pollastrini, M. Opportunities and threats of Mediterranean evergreen sclerophyllous woody species subjected to extreme drought events. Appl. Sci. 2020, 10, 8458. [Google Scholar] [CrossRef]
  9. Yin, R.; Yin, G. China’s primary programs of terrestrial ecosystem restoration: Initiation, implementation, and challenges. Environ. Manag. 2010, 45, 429–441. [Google Scholar] [CrossRef]
  10. Zhi, L.; Yang, M.; Qing, X.Y.; Xu, H.L.; Liu, Y.; Zhao, Y.T. Evaluation of the sustainable development capacity of the western returning farmland to forest project: A case study of Heqing County, Yunnan Province, Zhijin County, Guizhou Province, and Chaotian District, Sichuan Province. Sci. Silvae Sin. 2010, 46, 161–168. (In Chinese) [Google Scholar]
  11. Zhang, L.G.; Zhi, L.; Wang, G.Y.; Li, Y. Factors influencing farmers’ satisfaction with the returning farmland to forest project and improvement paths: Based on survey data from Heqing County, Yunnan Province, and Zhijin County, Guizhou Province. Sci. Silvae Sin. 2019, 55, 123–132. (In Chinese) [Google Scholar]
  12. Xi, H.; Li, T. Unveiling the spatiotemporal dynamics and influencing factors of carbon stocks in the Yangtze River Basin over the past two decades. Sci. Total Environ. 2024, 954, 176261. [Google Scholar] [CrossRef] [PubMed]
  13. Zhou, J.; Zhao, Y.; Huang, P.; Zhao, X.; Feng, W.; Li, Q.; Xue, D.; Dou, J.; Shi, W.; Wei, W.; et al. Impacts of ecological restoration projects on the ecosystem carbon storage of inland river basin in arid area, China. Ecol. Indic. 2020, 118, 106803. [Google Scholar] [CrossRef]
  14. Bergen, S.D.; Bolton, S.M.; Fridley, J.L. Design principles for ecological engineering. Ecol. Eng. 2001, 18, 201–210. [Google Scholar] [CrossRef]
  15. Xu, X.; Jiao, F.; Lin, D.; Liu, J.; Zhang, K.; Yang, R.; Zou, C. Carbon sink trends in the karst regions of Southwest China: Impacts of ecological restoration and climate change. Land 2023, 12, 1906. [Google Scholar] [CrossRef]
  16. Xu, X.; Liu, J.; Jiao, F.; Zhang, K.; Ye, X.; Gong, H.; Zou, C. Ecological engineering induced carbon sinks shifting from decreasing to increasing during 1981–2019 in China. Sci. Total Environ. 2023, 864, 161037. [Google Scholar] [CrossRef]
  17. Luo, D.; Zhou, Z.; Zhang, L.; Chen, Q.; Huang, D.; Feng, Q.; Wu, T.; Wu, L. Evolution and driver analysis of forest carbon stocks in karst mountainous areas of southwest China in the context of rocky desertification management. Catena 2024, 246, 108335. [Google Scholar] [CrossRef]
  18. Lin, T.; Wu, D.; Yang, M.; Ma, P.; Liu, Y.; Liu, F.; Gan, Z. Evolution and simulation of terrestrial ecosystem carbon storage and sustainability assessment in Karst Areas: A case study of Guizhou Province. Int. J. Environ. Res. Public Health 2022, 19, 16219. [Google Scholar] [CrossRef]
  19. Pan, Y.D.; Birdsey, R.A.; Fang, J.Y.; Houghton, R.; Kauppi, P.E.; Kurz, W.A.; Phillips, O.L.; Shvidenko, A.; Lewis, S.L.; Canadell, J.G.; et al. A large and persistent carbon sink in the world’s forests. Science 2011, 333, 988–993. [Google Scholar] [CrossRef]
  20. Zhang, H.; Feng, Z.; Shen, C.; Li, Y.; Feng, Z.; Zeng, W.; Huang, G. Relationship between the geographical environment and the forest carbon sink capacity in China based on an individual-tree growth-rate model. Ecol. Indic. 2022, 138, 108814. [Google Scholar] [CrossRef]
  21. Egusa, T.; Nakahata, R.; Neumann, M.; Kumagai, T. Carbon stock projection for four major forest plantation species in Japan. Sci. Total Environ. 2024, 927, 172241. [Google Scholar] [CrossRef]
  22. Li, H.; Hiroshima, T.; Li, X.; Hayashi, M.; Kato, T. High-resolution mapping of forest structure and carbon stock using multi-source remote sensing data in Japan. Remote Sens. Environ. 2024, 312, 114322. [Google Scholar] [CrossRef]
  23. Paul, T.S.H.; Wakelin, S.J. New Zealand’s planted forests-carbon stocks and yield in fast growing exotic tree plantations of the Southern Hemisphere. Trees For. People 2024, 16, 100590. [Google Scholar] [CrossRef]
  24. Clifton, B.; Ghezzehei, T.; Viers, J.H. Carbon stock quantification in a floodplain restoration chronosequence along a Mediterranean-montane riparian corridor. Sci. Total. Environ. 2024, 946, 173829. [Google Scholar] [CrossRef]
  25. Fu, K.; Chen, L.; Yu, X.; Jia, G. How has carbon storage changed in the Yili-Tianshan region over the past three decades and into the future? What has driven it to change? Sci. Total Environ. 2024, 945, 174005. [Google Scholar] [CrossRef]
  26. Ran, T.H.; An, Y.L. Research progress on biomass and carbon storage of karst forests in Southwest China. J. Guizhou Norm. Univ. (Nat. Sci. Ed.) 2013, 31, 117–120. (In Chinese) [Google Scholar]
  27. Feng, Q.; Zhou, Z.; Chen, Q.; Zhu, C.; Zhang, L. Xi carbon storage analysis: Insights from karst regions. Forests 2024, 15, 1006. [Google Scholar] [CrossRef]
  28. Li, Y.; Luo, F.H. Spatio-temporal evolution and multi-scenario simulation of carbon storage in karst regions of central Guizhou Province: Taking Puding County as an example. Huanjing Kexue 2024, 45, 961–973. (In Chinese) [Google Scholar] [PubMed]
  29. Zhang, T.; Zhang, W.; Yang, R.; Liu, Y.; Jafari, M. CO2 capture and storage monitoring based on remote sensing techniques: A review. J. Clean. Prod. 2021, 281, 124409. [Google Scholar] [CrossRef]
  30. Abdelmajeed, A.Y.A.; Juszczak, R. Challenges and limitations of remote sensing applications in northern peatlands: Present and future prospects. Remote Sens. 2024, 16, 591. [Google Scholar] [CrossRef]
  31. Didion, M.; Kupferschmid, A.; Lexer, M.; Rammer, W.; Seidl, R.; Bugmann, H. Potentials and limitations of using large-scale forest inventory data for evaluating forest succession models. Ecol. Model. 2009, 220, 133–147. [Google Scholar] [CrossRef]
  32. Qiu, Z.X. Research on Methods and Applications of Carbon Sink Measurement for Forest Vegetation in China’s Terrestrial Ecosystems. Ph.D. Thesis, Beijing Forestry University, Beijing, China, 2020. (In Chinese). [Google Scholar]
  33. Cheng, W.S. Design and Implementation of a Basic Platform for Forest Resource Management. Ph.D. Thesis, Beijing Forestry University, Beijing, China, 2018. (In Chinese). [Google Scholar]
  34. Huang, C.D.; Zhang, J.; Yang, W.Q.; Tang, X.; Zhang, G. Spatial differentiation characteristics of forest vegetation carbon storage in Sichuan Province. Acta Ecol. Sin. 2009, 29, 5115–5121. (In Chinese) [Google Scholar]
  35. Peng, S.L.; He, N.P. 2004–2014 China Forest Carbon Density Dataset; Institute of Geographic Sciences and Natural Resources Research, Chinese Academy of Sciences: Beijing, China, 2018. (In Chinese)
  36. Liu, H.; Zhu, G.P. Spatial-temporal variation in hotspot and coldspot of Antarctic krill distribution in recent 100 years. Ying Yong Sheng Tai Xue Bao 2020, 31, 1015–1022. (In Chinese) [Google Scholar] [PubMed]
  37. Luo, D. Response of Carbon Storage to Spatiotemporal Changes in Land Use in Karst Mountainous Areas. Ph.D. Thesis, Guizhou Normal University, Guizhou, China, 2024. (In Chinese). [Google Scholar]
  38. Wang, X.; Zhang, X.; Feng, X.; Liu, S.; Yin, L.; Chen, Y. Trade-offs and synergies of ecosystem services in karst area of China driven by grain-for-green program. Chin. Geogr. Sci. 2020, 30, 101–114. [Google Scholar] [CrossRef]
  39. Yang, Y.; Li, H.; Qian, C. Analysis of the implementation effects of ecological restoration projects based on carbon storage and eco-environmental quality: A case study of the Yellow River Delta, China. J. Environ. Manag. 2023, 340, 117929. [Google Scholar] [CrossRef]
  40. Zhang, S.Y.; Bai, X.Y.; Wang, J.; Qin, Y.; Li, P.L.; Luo, G.J.; Li, Y. Spatial distribution patterns and the evolution process of carbon storage in a typical karst canyon area. J. Resour. Ecol. 2015, 6, 199–207. [Google Scholar] [CrossRef]
  41. Qasha, V.; Manyevere, A.; Flynn, T.; Mashamaite, C.V. Assessing the impact of ecological forest restoration on soil carbon stocks in Sub-Saharan Africa: A systematic review. Carbon Manag. 2024, 15, 2404409. [Google Scholar] [CrossRef]
  42. Liu, J.; Gao, W.; Liu, T.; Dai, L.; Wu, L.; Miao, H.; Yang, C. A bibliometric analysis of the impact of ecological restoration on carbon sequestration in ecosystems. Forests 2023, 14, 1442. [Google Scholar] [CrossRef]
  43. Guo, X.; Liu, Y.; Xie, T.; Li, Y.; Liu, H.; Wang, Q. Impact of ecological restoration on carbon sink function in coastal wetlands: A review. Water 2025, 17, 488. [Google Scholar] [CrossRef]
  44. Luo, D.; Zhou, Z.F.; Chen, Q.; Zhang, L.; Wu, L.; Wu, T.Y. Response of carbon storage to land use patterns in karst areas: A case study of the Nanpanjiang and Beipanjiang River basins. Acta Ecol. Sin. 2023, 43, 3500–3516. (In Chinese) [Google Scholar]
  45. Huang, D.; Chen, X.; Shi, M.; Yang, L.; Ou, B.; Yan, D.; Wang, B.; Guo, X.; Li, Z.; Shi, P. The spatial distribution and driving factors of carbon storage in the grassland ecosystems of the northern Tibetan plateau. J. Resour. Ecol. 2023, 14, 893–902. [Google Scholar] [CrossRef]
  46. Xu, L.; Yu, G.; He, N.; Wang, Q.; Gao, Y.; Wen, D.; Ge, J. Carbon storage in China’s terrestrial ecosystems: A synthesis. Sci. Rep. 2018, 8, 2806. [Google Scholar] [CrossRef] [PubMed]
  47. Lu, L.H.; Nong, Y.; Li, H.; Yang, Y.; Ming, A.; Lei, L.; He, R.; Chen, L. Effects of vegetation restoration models on carbon storage in rocky desertification ecosystems. Acta Ecol. Sin. 2019, 39, 7229–7236. (In Chinese) [Google Scholar]
  48. He, N.; Wu, L.; Wang, Y.; Han, X. Changes in carbon and nitrogen in soil particle-size fractions along a grassland restoration chronosequence in northern China. Geoderma 2009, 150, 302–308. [Google Scholar] [CrossRef]
  49. Lewis, S.L.; Wheeler, C.E.; Mitchard, E.T.A.; Koch, A. Restoring natural forests is the best way to remove atmospheric carbon. Nature 2019, 568, 25–28. [Google Scholar] [CrossRef]
  50. Poorter, L.; Bongers, F.; Aide, T.M.; Almeyda Zambrano, A.M.; Balvanera, P.; Becknell, J.M.; Boukili, V.; Brancalion, P.H.; Broadbent, E.N.; Chazdon, R.L.; et al. Biomass resilience of Neotropical secondary forests. Nature 2016, 530, 211–214. [Google Scholar] [CrossRef]
  51. Pei, L. Remote Sensing Inversion of Soil Organic Carbon and Carbon Sink Functional Zoning in the Dali River Basin. Ph.D. Thesis, Xi’an University of Technology, Xi’an, China, 2024. (In Chinese). [Google Scholar]
  52. Körner, C.; Paulsen, J. A world-wide study of high altitude treeline temperatures. J. Biogeogr. 2004, 31, 713–732. [Google Scholar] [CrossRef]
  53. Zhang, Y.; Tan, Z.; Song, Q.; Yu, G.; Sun, X. Respiration controls the unexpected seasonal pattern of carbon flux in an Asian tropical rain forest. Atmos. Environ. 2010, 44, 3886–3893. [Google Scholar] [CrossRef]
  54. Dou, Y.; Tong, X.; Horion, S.; Feng, L.; Fensholt, R.; Shao, Q.; Tian, F. The success of ecological engineering projects on vegetation restoration in China strongly depends on climatic conditions. Sci. Total Environ. 2024, 915, 170041. [Google Scholar] [CrossRef]
  55. Chen, Y.; Guerschman, J.P.; Cheng, Z.; Guo, L. Remote sensing for vegetation monitoring in carbon capture storage regions: A review. Appl. Energy 2019, 240, 312–326. [Google Scholar] [CrossRef]
  56. Li, L.; Xin, X.; Zhao, J.; Yang, A.; Wu, S.; Zhang, H.; Yu, S. Remote sensing monitoring and assessment of global vegetation status and changes during 2016–2020. Sensors 2023, 23, 8452. [Google Scholar] [CrossRef]
Figure 1. Map of the study area.
Forests 16 01361 g001
Figure 2. Carbon density correction model.
Forests 16 01361 g002
Figure 3. Spatial characteristics of carbon storage.
Forests 16 01361 g003
Figure 4. Changes in area of land categories.
Forests 16 01361 g004
Figure 5. Changes in Carbon Density Per Unit Area (Mg C/ha) for Various Ecological Engineering Projects (2000–2020).
Forests 16 01361 g005
Figure 6. Regression prediction of carbon storage.
Forests 16 01361 g006
Figure 7. Factorial Correlation. Note: NA means not applicable.
Forests 16 01361 g007
Figure 8. Changes in total carbon density in overlapping areas.
Forests 16 01361 g008
Figure 9. Correlation heatmap of measure areas.
Forests 16 01361 g009
Table 1. Forest parameters for each ecological project.
EEForest Cover (%)Tree Diameter (cm)Accumulation (m3/ha)Trees per Hectare (n/ha)Tree Height (m)
TLCP0.561.328.02163.522.37
TNSP0.6711.9176.10771.187.49
GFGP0.517.9468.241143.645.93
NGCP0.281.580.41110.071.42
WFMP0.485.0825.93511.144.21
OFP0.459.8166.54942.256.65
Table 2. Data sources.
Date TypeResolutionProcessing MethodSource
Ecological Engineering30 mProcessed with ArcGIS to a resolution of 30 mCounty Forestry Bureau
Bedrock Exposure Rate, Soil Layer Thickness30 mProcessed with ArcGIS to a resolution of 30 mhttps://sck.gznu.edu.cn
DEM Terrain Data30 mDirect acquisitionhttps://www.gscloud.cn
Soil Data30 mKriging interpolation downscaled to study area resolutionhttps://data.casearth.cn
Land Use Data30 mImage interpretation (accuracy ≥ 85%) + spatiotemporal consistency correctionhttps://www.geodata.cn
Terrain Roughness30 mDirect acquisitionhttps://portal.opentopography.org
Temperature30 mKriging interpolation downscaled to study area resolutionhttps://www.ncei.noaa.gov
Precipitation30 mCorrected using the vertical temperature lapse rate to a resolution of 30 mhttps://data.tpdc.ac.cn
GDP, POP100 mData fusion estimationhttps://hub.worldpop.org
Table 3. Carbon density (Mg C/ha) for each land use type in the study area in 2020.
Land Use TypeAGCBGCDMCSOC
Cropland000104.2
Woodland53.4214.633.35164.74
Scrubland15.019.41089.93
Grassland0.9590119.61
Wetland0.650.260190.64
Building land0000
Water0000
Table 4. Hot and cold spot zoning.
Z(Gi*) Range≤−1.96[−1.95, −1.65](−1.65, 1.65)[1.65, 1.95][1.96, 2.58)≧−2.58
PartitionsSignificant cold spotCold spotsNot significantHot spotsSignificant hot spotsVery significant hot spots
Table 5. Changes in land type area (km2).
YearCultivatedForstShrubGrasslandWetlandImperviousWater
2000433.902236.3712.32157.464.3316.356.09
2005428.142231.4413.29149.6411.6821.0911.53
2010424.372218.1813.09159.097.5828.3116.21
2015411.102195.0612.94170.615.7350.2021.19
2020412.102176.9812.81178.674.8355.8325.27
Table 6. Average Annual Growth Rate of Carbon Storage (%).
YearTLCPTNSPGFGPNGCPWFMPOFPNEE
2000–20050.8010.8010.7970.5570.8230.8100.672
2005–20100.5130.5210.5270.4100.5400.5110.342
2010–20150.6250.6290.6340.4130.6460.6050.324
2015–20190.5590.5760.6080.5910.5920.5250.478
2019–20200.8510.8840.8991.0200.8690.807−2.51
Table 7. Carbon storage Changes (Mg C).
YearTLCPTNSPGFGPNGCPWFMPOFPNEE
200015.54 × 1051.14 × 10523.24 × 1056.28 × 1030.62 × 10519.43 × 105469.12 × 105
200516.16 × 1051.18 × 10524.17 × 1056.46 × 1030.65 × 10520.21 × 105484.87 × 105
201016.58 × 1051.21 × 10524.80 × 1056.59 × 1030.67 × 10520.73 × 105493.14 × 105
201517.10 × 1051.25 × 10525.59 × 1056.73 × 1030.69 × 10521.36 × 105501.14 × 105
201917.58 × 1051.29 × 10526.37 × 1056.92 × 1030.71 × 10521.92 × 105510.70 × 105
202017.73 × 1051.30 × 10526.60 × 1056.99 × 1030.71 × 10522.09 × 105497.90 × 105
2019 Forecast17.51 × 1051.28 × 10526.22 × 1056.85 × 1030.71 × 10521.88 × 105-
2020 Forecast17.62 × 1051.29 × 10526.37 × 1056.88 × 1030.71 × 10522.01 × 105-
Table 8. Comparison of Carbon Density.
RegionCarbon Storage
(Mg C)
Carbon Density
(Mg C/ha)
Source
Zhijin County54.84 × 106191.29-
Nanpanjiang and Beipanjiang1174.07 × 106140.69Luo et al., 2023 [44]
Northern Grassland of the Tibetan Plateau4.08 × 10959.10Huang et al., 2023 [45]
China99.15 × 109 103.28Xu et al., 2018 [46]
Yangtze River Basin18.05 × 10999.8Xi and Li, 2024 [12]
Disclaimer/Publisher’s Note: The statements, opinions and data contained in all publications are solely those of the individual author(s) and contributor(s) and not of MDPI and/or the editor(s). MDPI and/or the editor(s) disclaim responsibility for any injury to people or property resulting from any ideas, methods, instructions or products referred to in the content.