Article

Spatial Distribution of Mangrove Forest Carbon Stocks in Marismas Nacionales, Mexico: Contributions to Climate Change Adaptation and Mitigation

by
Carlos Troche-Souza
1,*,
Edgar Villeda-Chávez
1,
Berenice Vázquez-Balderas
1,
Samuel Velázquez-Salazar
1,
Víctor Hugo Vázquez-Morán
2,
Oscar Gerardo Rosas-Aceves
2 and
Francisco Flores-de-Santiago
3,*
1
Coordinación de Geomática, Comisión Nacional para el Conocimiento y Uso de la Biodiversidad (CONABIO), Av. Liga Periférico-Insurgentes Sur 4903, Parques del Pedregal, Mexico City 14010, Mexico
2
Reserva de la Biósfera Marismas Nacionales Nayarit, Comisión Nacional de Áreas Naturales Protegidas (CONANP), Galeana #27 altos, Colonia Centro, Santiago Ixcuintla 63300, Nayarit, Mexico
3
Unidad Académica Procesos Oceánicos y Costeros, Instituto de Ciencias del Mar y Limnología, Universidad Nacional Autónoma de México, Mexico City 04510, Mexico
*
Authors to whom correspondence should be addressed.
Forests 2025, 16(8), 1224; https://doi.org/10.3390/f16081224
Submission received: 17 June 2025 / Revised: 22 July 2025 / Accepted: 23 July 2025 / Published: 25 July 2025

Abstract

Mangrove forests are widely recognized for their effectiveness as carbon sinks and serve as critical ecosystems for mitigating the effects of climate change. Current research lacks comprehensive, large-scale carbon storage datasets for wetland ecosystems, particularly across Mexico and other understudied regions worldwide. Therefore, the objective of this study was to develop a high spatial resolution map of carbon stocks, encompassing both aboveground and belowground components, within the Marismas Nacionales system, which is the largest mangrove complex in northeastern Pacific Mexico. Our approach integrates primary field data collected during 2023–2024 and incorporates some historical plot measurements (2011–present) to enhance spatial coverage. These were combined with contemporary remote sensing data, including Sentinel-1, Sentinel-2, and LiDAR, analyzed using Random Forest algorithms. Our spatial models achieved strong predictive accuracy (R2 = 0.94–0.95), effectively resolving fine-scale variations driven by canopy structure, hydrologic regime, and spectral heterogeneity. The application of Local Indicators of Spatial Association (LISA) revealed the presence of carbon “hotspots,” which encompass 33% of the total area but contribute to 46% of the overall carbon stocks, amounting to 21.5 Tg C. Notably, elevated concentrations of carbon stocks are observed in the central regions, including the Agua Brava Lagoon and at the southern portion of the study area, where pristine mangrove stands thrive. Also, our analysis reveals that 74.6% of these carbon hotspots fall within existing protected areas, demonstrating relatively effective—though incomplete—conservation coverage across the Marismas Nacionales wetlands. We further identified important cold spots and ecotones that represent priority areas for rehabilitation and adaptive management. These findings establish a transferable framework for enhancing national carbon accounting while advancing nature-based solutions that support both climate mitigation and adaptation goals.

Graphical Abstract

1. Introduction

Mangrove forests, composed of halophytic trees and shrubs adapted to tropical and subtropical intertidal zones, are among the most efficient natural carbon sinks [1]. These ecosystems store substantial carbon stocks both aboveground—in biomass (e.g., trunks, foliage, and woody debris)—and belowground within anoxic soils and root networks, where slow anaerobic decomposition promotes long-term carbon retention [2]. Studies demonstrate that mangroves sequester 3–5 times more carbon per hectare (~800 Mg C ha−1) than terrestrial rainforests (~200 Mg C ha−1) [3], underscoring their critical role as blue carbon reservoirs in global climate mitigation [4]. Aboveground carbon (AGC) structures support biodiversity by providing critical habitats for avian, aquatic, and terrestrial species, while their dense root systems—including pneumatophores—stabilize shorelines and reduce erosion [5]. Belowground carbon (BGC) pools—preserved over millennia through fine-root dynamics and sediment trapping—further enhance coastal resilience [6]. Concurrently, biogeochemical processes in mangrove soils regulate the cycle of sulfur, nitrogen, and phosphorus, thereby enhancing the productivity of adjacent coastal (e.g., coral reefs) and terrestrial ecosystems [7].
Mangrove forests are characterized by their unique aboveground root systems and dense canopy structures, which require specialized methods for accurately assessing their aboveground biomass [8]. Traditional forest measurement techniques have been adapted to manage the challenges posed by tidal environments and muddy terrain [9]. For instance, field-based forest inventories rely on allometric measurements, including diameter at breast height, tree height, and canopy dimensions [10], which are collected within designated inventory plots [11]. These spatial plots may include various formats, such as the plotless point-centered quarter technique [12], mobile circular plots at different diameters, and permanent square plots [13]. The goal of these methods is to determine the basal area, stem density, and canopy height within a defined area, thereby estimating biomass and carbon stocks [14]. This process frequently requires the use of additional species-specific allometric equations derived from literature [15].
Regarding BGC estimation, this is a critical variable for climate change mitigation strategies; however, it presents unique challenges due to tidal influences, dense and muddy terrain, anoxic conditions, and complex root architectures [16]. Mangrove forests disproportionately contribute to carbon sequestration, storing up to 10.4 Pg C in their sediments globally [17]. However, regional estimates often overlook fine-scale heterogeneity driven by hydrology, species composition, and distribution history [18]. In Mexico, the Marismas Nacionales System—a Ramsar site spanning Nayarit and Sinaloa—exemplifies this gap, with limited data on spatial carbon distribution despite its vulnerability to major hurricanes (e.g., Willa in 2018 and Roslyn in 2022) and anthropogenic pressures [19].
Quantifying carbon stocks in mangrove forests through traditional field-based methods faces considerable limitations, including high labor intensity, restricted spatial coverage, and logistical constraints imposed by tidal fluctuations and dense root matrices [20]. Field surveys typically rely on allometric equations, which may introduce errors when applied across diverse species or differing geomorphic settings due to site-specific variations in tree architecture and growth patterns [21]. Moreover, in situ plot-scale structural endeavors often lack the spatial component to adequately capture landscape-level heterogeneity, leading to substantial uncertainties when extrapolating carbon stock estimates to larger areas [22]. In contrast, remote sensing technologies offer substantial advantages for assessing carbon stocks in mangrove forests [23]. For instance, Light Detection and Ranging (LiDAR) and unoccupied/unmanned aerial vehicle (UAV) photogrammetry yield high-resolution three-dimensional canopy structure data, facilitating accurate biomass estimation without causing ground disturbance [24]. Furthermore, freely available multispectral space-borne sensors, such as Sentinel-2, enable large-scale monitoring of mangrove ecological conditions and carbon dynamics [25]. Synthetic Aperture Radar (SAR) systems offer additional advantages by penetrating cloud cover, particularly valuable in tropical and subtropical environments where optical data collection is often limited. Geographic Information Systems (GISs) have transformed how we model carbon storage in mangrove ecosystems. Instead of relying solely on slow, expensive field surveys, researchers can now integrate satellite imagery, UAV data, and ground measurements into GIS platforms to create accurate carbon stock maps [26]. Machine learning algorithms further enhance these spatial tools by integrating field data with remote sensing outputs to produce accurate and comprehensive maps of carbon stocks [27]. Ultimately, synergy among these approaches also enables near-real-time monitoring capabilities, providing critical data to guide conservation efforts and climate policies [28].
Mangrove carbon stocks are essential for climate change adaptation and mitigation [29]. For instance, the dense BGC pools of mangrove ecosystems, which constitute over 70% of the total carbon stock, substantially contribute to long-term climate regulation [30]. The aboveground biomass of mangroves also supports biodiversity and enhances coastal primary productivity [31]. Mangrove forests account for 10%–15% of the global Nationally Determined Contributions (NDCs) for nature-based carbon dioxide mitigation [32]. Thus, the protection of existing mangrove carbon stocks and the rehabilitation of degraded mangrove ecosystems have the potential to make a noteworthy contribution on a global scale [33]. Consequently, the ecological assessment of mangrove forests is of utmost importance within international climate policy frameworks, including the Paris Agreement and the REDD+ initiative [34,35].
This study aims to enhance mangrove carbon stock assessments by combining field inventories with multi-sensor remote sensing and machine learning to generate high-resolution spatial models of carbon distribution. By focusing on a critical, warm-temperate northeast Pacific coastal mangrove forest ecosystem, we quantify both AGC and BGC pools and explore their spatial variability in relation to environmental drivers. The approach supports improved reporting for national forest inventories and informs scalable climate strategies for conservation, mitigation, and adaptation.

2. Materials and Methods
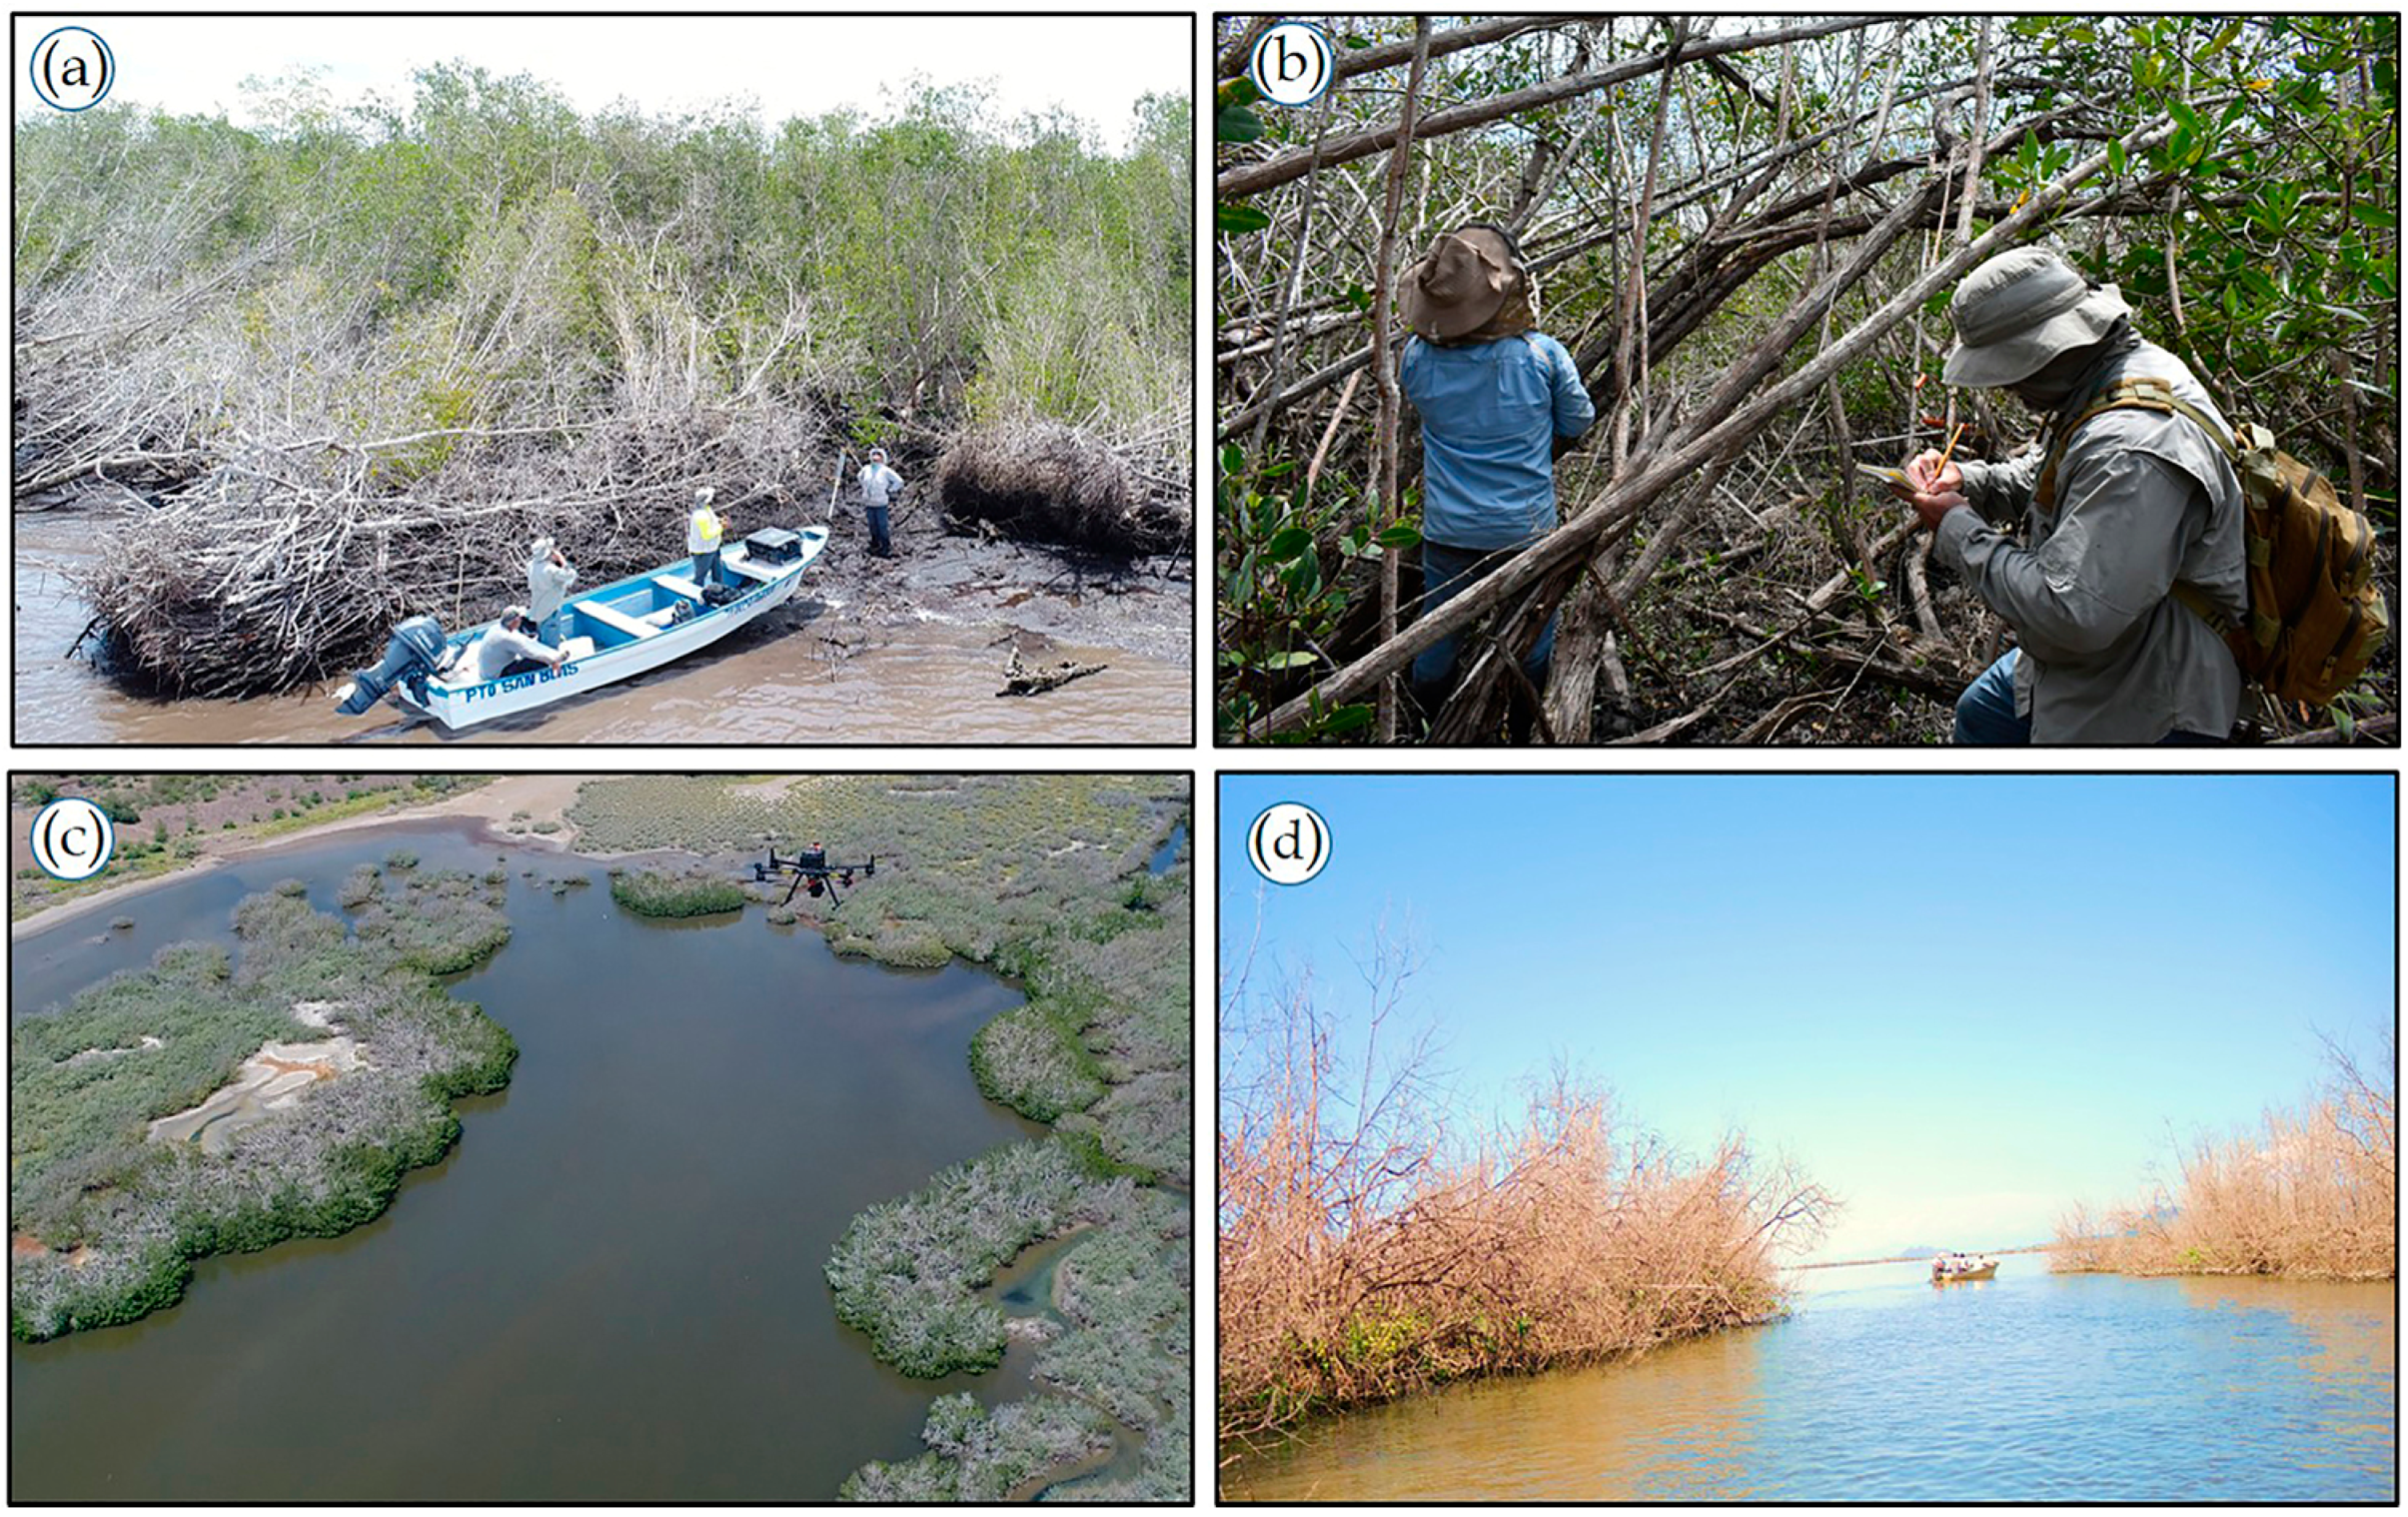
2.1. Study Area

Marismas Nacionales, situated along the Pacific coast of Mexico and encompassing the states of Nayarit and Sinaloa, represents the most extensive and ecologically significant mangrove ecosystem in the warm temperate northeast Pacific Ocean (Figure 1). Moreover, the coastal complex is recognized as a UNESCO Biosphere Reserve [36]. The study area spans 3136 km2, featuring coastal lagoons, estuaries, and dense mangrove forests (755 km2), predominantly characterized by species, such as Rhizophora mangle, Laguncularia racemosa, and Avicennia germinans [37]. Marismas Nacionales exhibits a climatic gradient, with tropical conditions prevailing in the south and subtropical characteristics dominating the northern areas. Rainfall patterns show marked seasonality, with approximately 80% of annual precipitation occurring from June to October [38], coinciding with the Pacific hurricane season [39]. Hydrologically, the system is influenced by a combination of fluvial inputs from the unhampered San Pedro and Acaponeta Rivers, as well as semi-diurnal tidal fluxes from the Pacific Ocean. The latter is particularly modulated by the Teacapán mouth and the Cuautla Canal inlet [40].
As a biodiversity hotspot, Marismas Nacionales safeguards coastlines and supports the livelihoods of nearby communities [41]. Additionally, the mangrove forests within the coastal complex are of utmost importance, as they contribute substantially to climate change mitigation through their high carbon sequestration potential. Studies indicate that carbon sequestration rates in mangrove forests vary strongly according to geomorphological and ecological factors, including hydrologic connectivity and species composition [42], underscoring the need for ecosystem-specific conservation strategies [43]. The degradation of Marismas Nacionales’ mangrove ecosystems, driven by aquaculture expansion, deforestation, and hydrological modifications, has raised considerable concerns about carbon emissions [44]. A critical example is the opening of the Cuautla Canal in 1972, which disrupted the region’s hydrosedimentary regime [45]. This anthropogenic intervention has led to inland saltwater intrusion, resulting in hypersaline soil conditions [46] and subsequent large-scale mangrove dieback in areas distant from primary flood channels [47].

2.2. Data Collection: Field and Laboratory Protocols

We conducted four field campaigns at Marismas Nacionales, Nayarit, from April 2023 to November 2024 (Figure 2), adhering to the established protocols outlined by Kauffman and Donato [48] and the guidelines of the Mexican Mangrove Monitoring System (SMMM) [49]. During the field campaigns conducted in November 2023, April 2024, and November 2024, we reevaluated 19 permanent monitoring plots established by the SMMM between 2021 and 2024 to assess the potential impacts of Hurricane Roslyn, which landed in October 2022. After the hurricane, field assessments showed dramatic ecosystem changes—from tree mortality rates and canopy damage to shifts in sapling regeneration (Figure 3). These on-the-ground surveys did not just document the damage; they also delivered critical data to test and fine-tune our predictive models. All plot locations were geotagged to support long-term monitoring and enable comparisons with remote sensing data.

2.2.1. Aboveground Carbon Assessment

We established four plots, each measuring 20 × 20 m, within representative mangrove areas [12]. We quantified the diameter at breast height (DBH) of all stems with a DBH of 2.5 cm or greater utilizing diametric tapes [11]. Furthermore, we conducted three height measurements for each stem using a handheld laser hypsometer (Laser Geo 2, Haglöf, Långsele, Sweden). We identified the species of all living and deceased individuals recorded within the plots.
The AGC was determined utilizing species-specific allometric equations (Table 1), selected for their relevance to Mexican mangrove ecotypes. The biomass values, expressed in kilograms, were converted to megagrams per hectare (Mg ha−1) and subsequently transformed into carbon stock estimates using a conversion factor of 0.48, as specified by CONAFOR [50] and in alignment with the guidelines provided in the IPCC Wetlands Supplement guidelines [51].

2.2.2. Belowground Carbon Assessment

We assessed BGC stocks by utilizing a combination of sediment core analysis with root biomass estimation techniques. Due to the inherent challenges associated with direct measurements of root systems, we applied indirect allometric methods (Equation (1)) following those outlined by Komiyama et al. [57] for dominant species—Avicennia germinans, Laguncularia racemosa, Conocarpus erectus, and Rhizophora mangle. The results were converted to carbon units using a factor of 0.39 [58].
R b = 0.199 ( ρ 0.899 ) ( D B H 2.22 )
where:
  • Rb = root biomass; ρ = wood density; DBH = Diameter at Breast Height (cm).
For the analysis of soil organic carbon (SOC), three replicate sediment cores were collected from each sampling unit at a depth of 0–100 cm during April 2023, with a deliberate effort to avoid visibly disturbed areas. In accordance with the protocol established by Kauffman and Donato [48], the cores were sectioned into defined depth intervals: 0–15 cm, 15–30 cm, 30–45 cm, and 45–100 cm. In the laboratory, the samples underwent processing through oven-drying at 70 °C until they attained a constant weight. Subsequently, bulk density (g cm−3) was measured utilizing the dry weight-to-volume ratio as described by Flores et al. [59]. The samples were then sieved using a 2 mm mesh to remove roots and plant debris, homogenized with a mortar, and analyzed for carbon content (%C) using an automated elemental analyzer at the Environmental Nanotechnology Laboratory of the Universidad Nacional Autónoma de México.

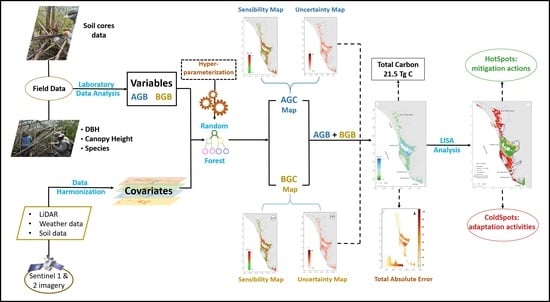
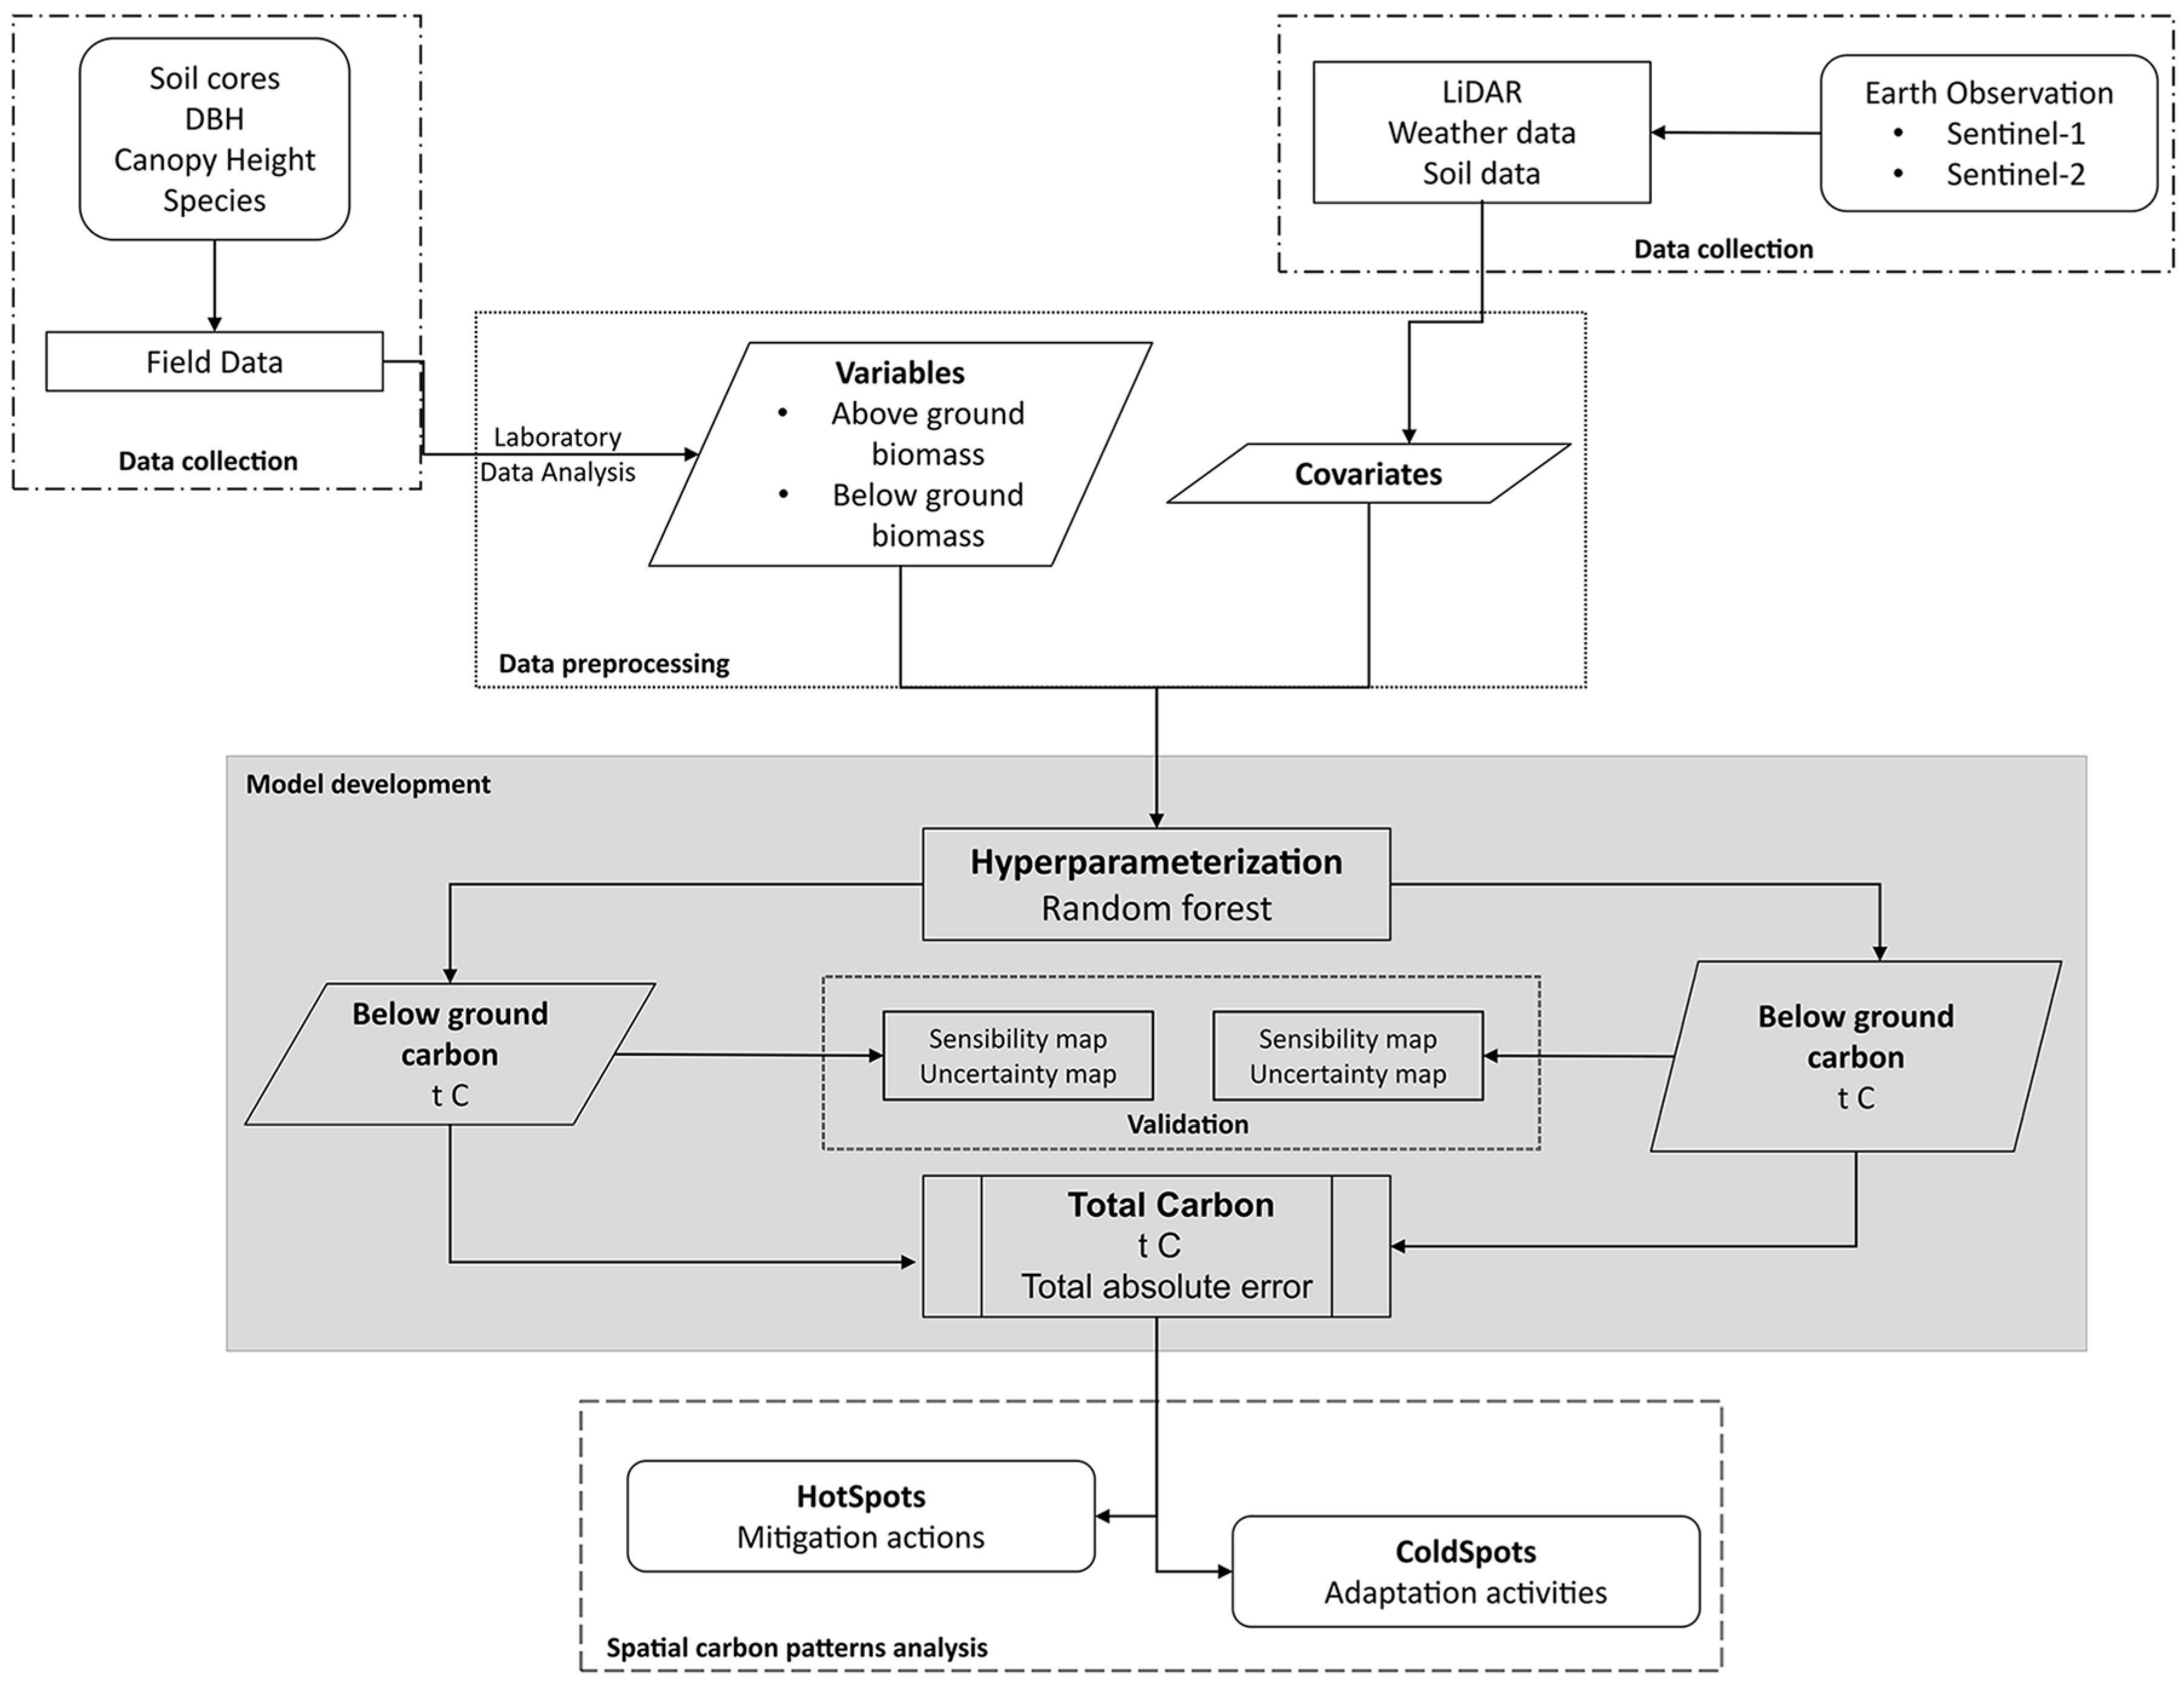
2.3. Data Preprocessing

Our approach integrates original field data inventories collected during 2023–2024 campaigns (Section 2.2) and carefully selected legacy plot measurements from previous monitoring programs, including SMMM datasets (Supplementary Materials Tables S1 and S2). Before analysis, all datasets were carefully harmonized by evaluating the measurement protocols and values obtained in the different sampling periods. Although Random Forest is a non-parametric method and does not require normally distributed data [60], we conducted a skewness analysis as part of our exploratory assessment to evaluate whether data normalization could offer any benefit (skewness values: AGC = 0.4829; BGC = 0.5577, indicating near-symmetric distributions). While such preprocessing is not necessary for Random Forest performance, normalization may improve the efficiency of hyperparameter optimization in multi-sensor feature spaces by reducing scale-related biases during model training [61,62].
This modeling framework integrated field-collected carbon data with four categories of predictor variables: (1) canopy structure metrics derived from GEDI LiDAR, (2) Sentinel-1 radar backscatter data (inclusive of VV and HH polarizations), processed both annually and seasonally for the years 2022 and 2023 (prior to and following Hurricane Roslyn), (3) Sentinel-2 optical data encompassing 15 spectral indices (such as NDVI, GNDVI, and MNDWI) along with band reflectances, and (4) ancillary thematic layers, which include WorldClim bioclimatic variables, INEGI soil properties, and classifications of mangrove geomorphology [63]. In total, 198 potential predictor variables were assessed. Prior to engaging in the modeling phase, we conducted a comprehensive assessment of multicollinearity using variance inflation factors (VIF < 5) and correlation matrices (r < 0.8), in accordance with established practices in ecological modeling [64]. This meticulous process enabled us to refine our predictor set to include only the most pertinent variables, specifically the wet-season vegetation index and canopy height. We performed all spatial processing in QGIS v.3.34.6 for data standardization.

2.4. Model Development

We developed distinct spatial models for AGC and BGC stocks utilizing a multistage approach within Google Earth Engine (GEE). The Random Forest algorithm was implemented utilizing the ee.Classifier.smileRandomForest() function. We selected this algorithm specifically for its ability to capture complex nonlinear relationships while requiring no a priori distributional assumptions [60]. Using the Gini index method [65], we iteratively narrowed down covariates to just the top 20 performers, consistently reducing accuracy when excluded. This process keeps models ecologically meaningful without overcomplicating them [66]. To enhance model performance, we conducted a systematic hyperparameter tuning process, evaluating the number of trees within the range of 10 to 200 in increments of 10, while closely monitoring R2 and RMSE metrics [62,67]. The optimized models utilized 50 and 180 trees for AGC and BGC estimation, respectively, achieving strong predictive performance (R2 = 0.94–0.95) while maintaining computational tractability.

2.5. Validation

Uncertainty quantification was conducted using a jackknife-after-bootstrap approach [68] to generate spatially explicit error estimates. This nonparametric geostatistical framework [69] produces: (1) sensitivity maps of prediction standard deviations and (2) normalized uncertainty maps of mean predictions. This method accounts for both local variability and spatial error propagation without requiring distributional assumptions, making it particularly suitable for mangrove ecosystems with complex environmental gradients. The uncertainty analysis was performed in GEE to exploit cloud computing resources. The complete analytical workflow, from predictor selection to final output generation, was systematically implemented through fully reproducible code (AGC_code (https://code.earthengine.google.com/335499bce2c313888c6a6ff160eeabed?hl=es&noload=true, accessed on 22 July 2025); BGC_code (https://code.earthengine.google.com/e5d151a82c9e3d2cf3821244c88c4016?hl=es&noload=true, accessed on 22 July 2025); Covariates_code (https://code.earthengine.google.com/d8d2cb03dd5c1e3789f09b80a7efacc5?hl=es&noload=true, accessed on 22 July 2025)).

2.6. Spatial Carbon Storage Patterns

To identify detailed spatial patterns in total carbon stocks, we employed the Local Indicators of Spatial Association (LISA) method. This method was implemented through a systematic subsampling approach, which involved extracting data at intervals of 500 pixels. We collected carbon values alongside their corresponding spatial coordinates [70]. Subsequently, we calculated spatial weights based on the inverse distance among points, thereby ensuring that closer points exerted a greater influence on local autocorrelation.
For each data point, we calculated the LISA statistic (Moran’s I) employing 9999 permutations (α = 0.05) to identify spatial clustering in carbon values categorized as high or low. Specifically, we classified all clusters into five distinct categories: high-high (hotspots), low-low (cold spots), high-low, low-high (outliers), and non-significant areas [71]. This approach improves global assessments by identifying local-scale spatial dependencies, enabling more targeted conservation planning, precision restoration, and optimized nature-based climate interventions [72]. We implemented all spatial analyses using the R statistical computing environment.

3. Results

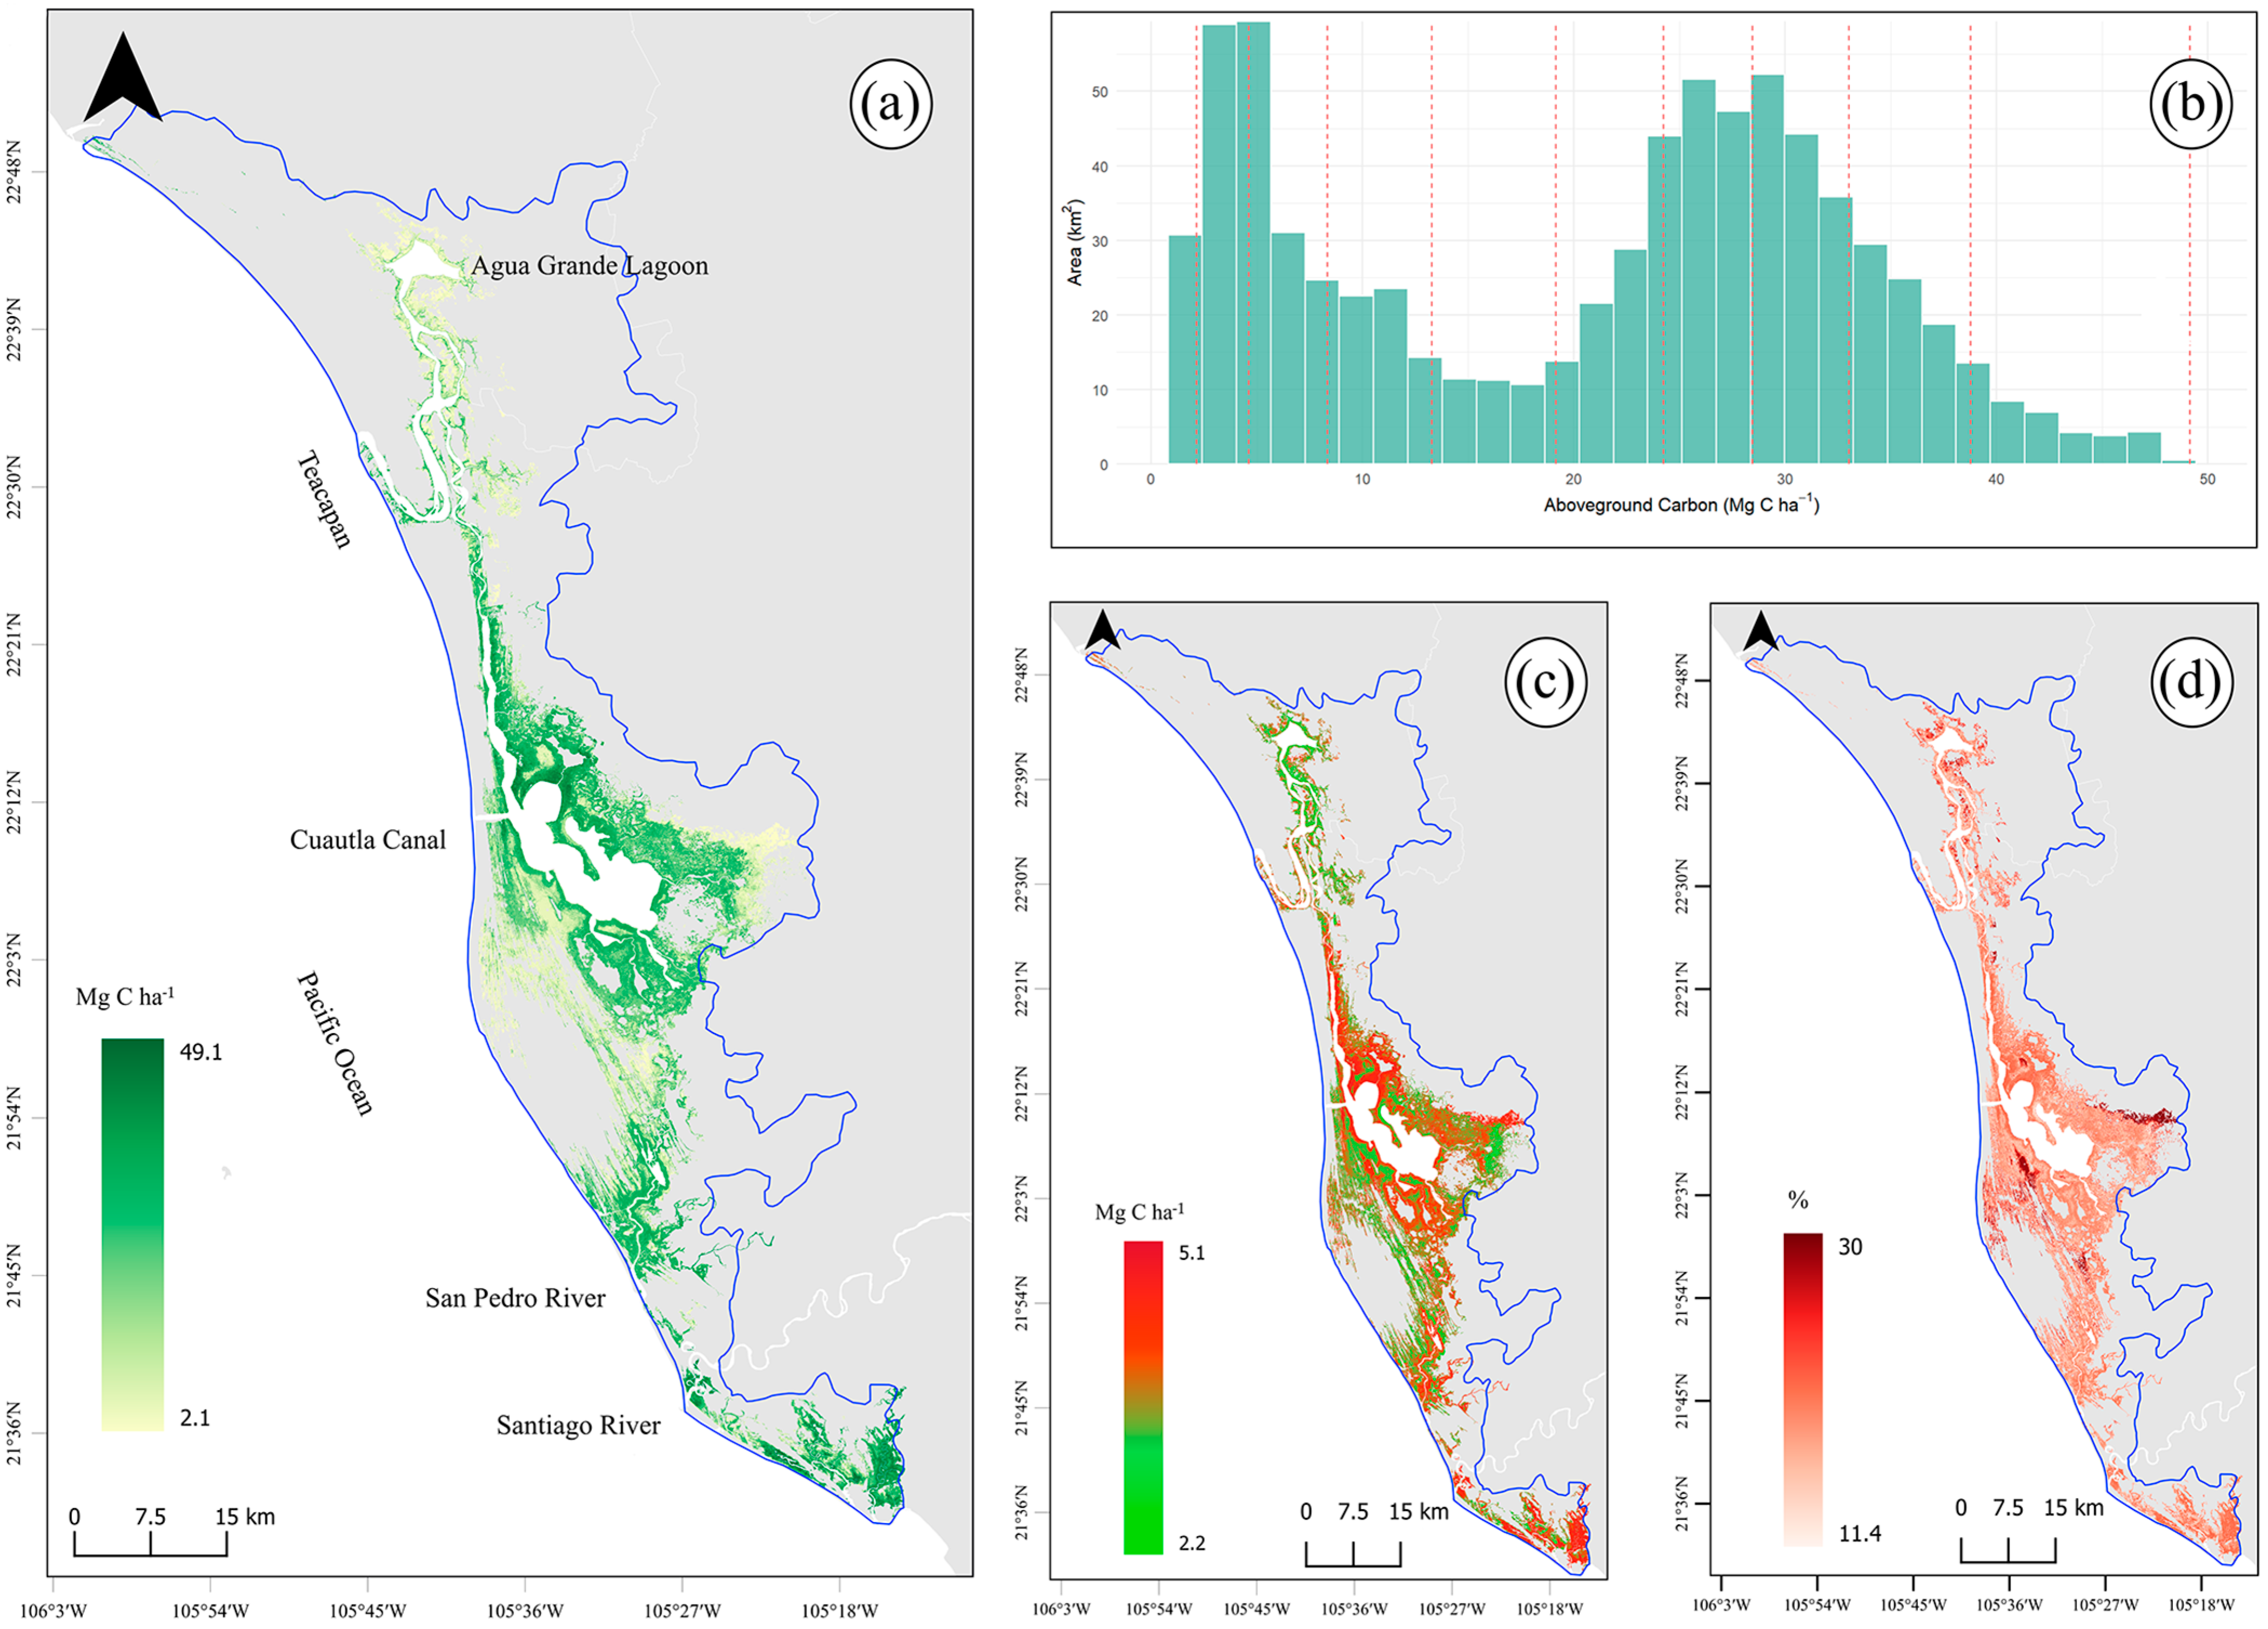
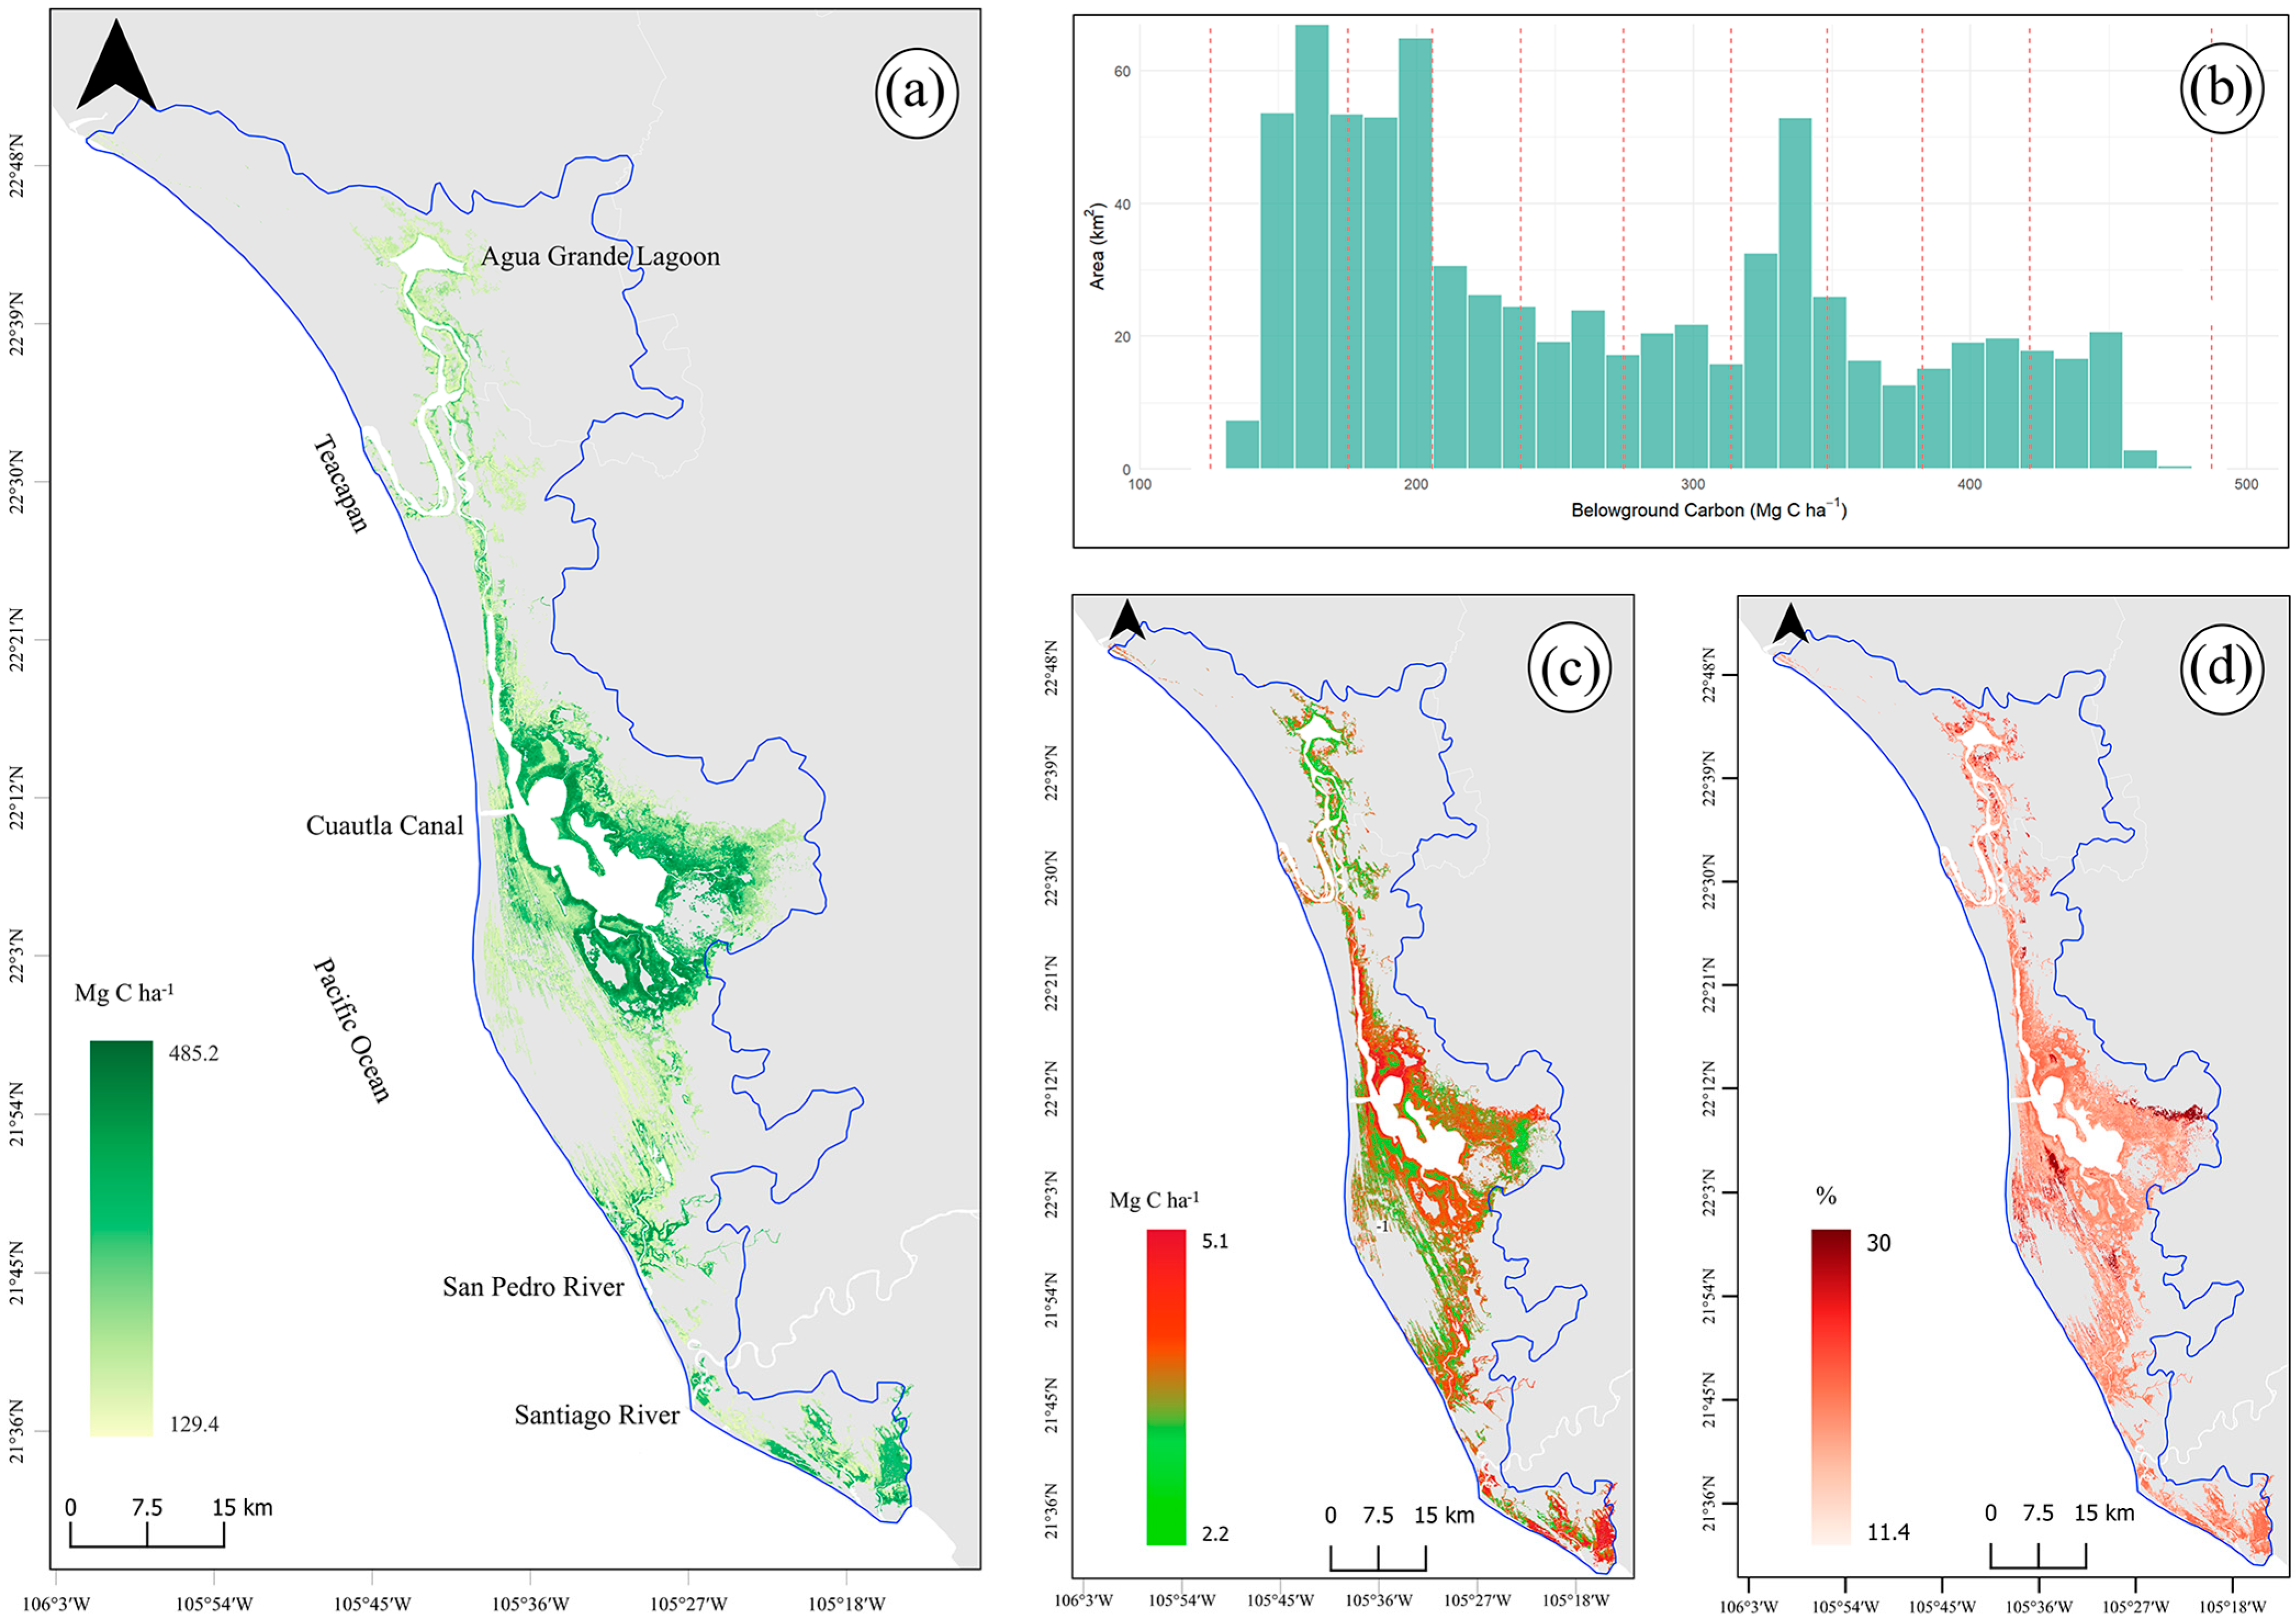
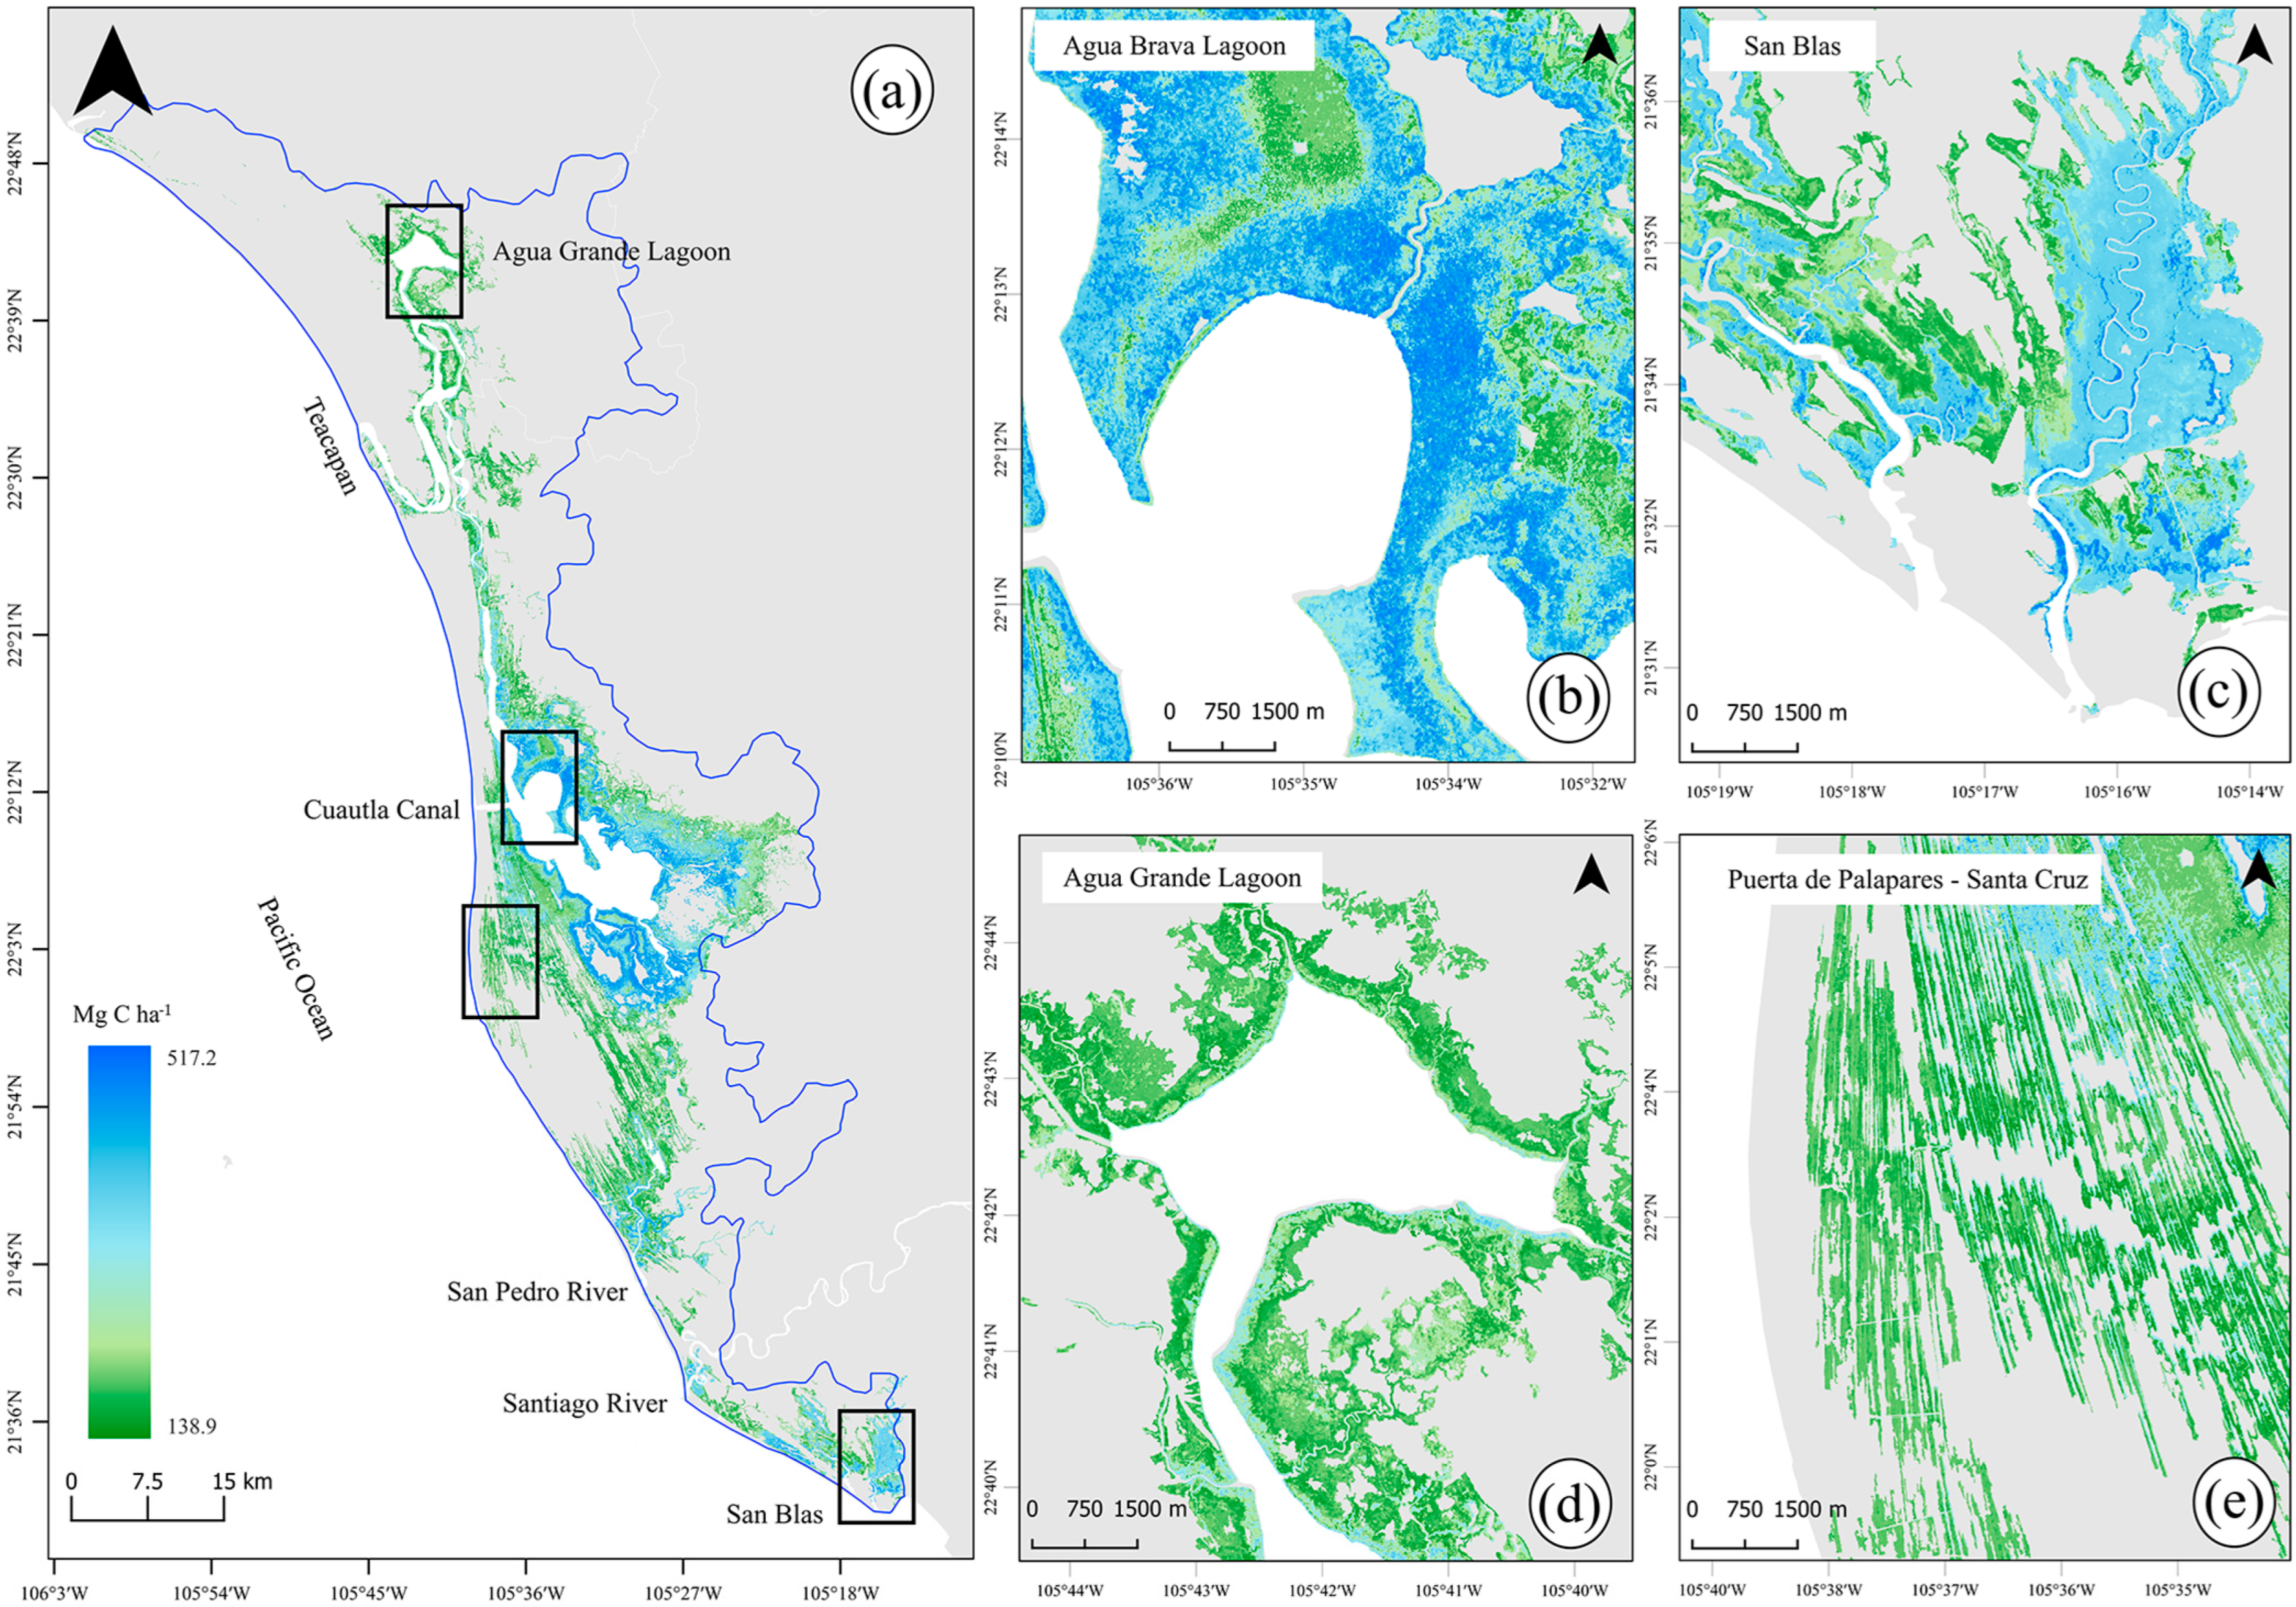
3.1. Above- and Belowground Carbon

Field-collected data on AGC and BGC have been integrated with existing datasets from the SMMM [73,74] monitoring network and the management framework of the Comisión Nacional de Áreas Naturales Protegidas (CONANP) [75]. The resulting compiled dataset comprises 28 sampling units designated for AGC modeling, as well as an additional 30 plots intended for assessing BGC. Complete datasets for all plots are available in Table S1 (AGC) and Table S2 (BGC).
For both the AGC and BGC models, we optimized Random Forest regressions through iterative variable selection (Table S3). The AGC model, which incorporated 14 covariates, achieved a root mean square error (RMSE) of 6.55 Mg C ha−1 and an R2 value of 0.945, with the primary predictors being wet-season optical indices, specifically the Green Normalized Difference Vegetation Index (GNDVI) and the Normalized Difference Snow Index (NDSI), alongside canopy height. Conversely, the BGC model, which consisted of 12 covariates, recorded a higher RMSE of 52.85 Mg C ha−1 while demonstrating comparable explanatory power, as evidenced by an R2 of 0.946. This model predominantly relied on dry-season Sentinel-2 shortwave infrared (SWIR) band B12 and radar texture measures (VV/VH).
It is important to note that the sets of predictors employed in each model were entirely distinct. The AGC model concentrated on vegetation indices, whereas the BGC model incorporated soil moisture-sensitive shortwave infrared (SWIR) metrics [76] and radar backscatter. The pronounced divergence among predictor variables necessitates tailored-modeling frameworks, particularly given the statistically non-significant correlations (r = 0.12–0.24, p > 0.05) between hydrologic parameters (key drivers of subsurface carbon dynamics) and canopy architecture metrics [8].
In the evaluation of AGC, the Random Forest model elucidated 94% of the variance, identifying canopy height and wet-season Green Normalized Difference Vegetation Index (GNDVI) as the primary predictors. The models demonstrated significant spatial variability in AGC within Marismas Nacionales (Figure 4a), with carbon stock levels ranging from 2.15 to 52.5 Mg C ha−1, yielding a mean of 20.76 ± 8.08 Mg C ha−1. Notably, the highest concentrations of carbon were recorded in the central region of the Agua Brava lagoon and the southern area of San Blas. In contrast, hurricane-affected zones exhibited reductions in carbon stocks of up to 62% (for instance, the NABI plot, as detailed in Table S1. Frequency distribution analysis (Figure 4b) indicated that 32% of the study area stored between 24.7 and 33.3 Mg C ha−1, while 26% of the area contained lower carbon stocks, ranging from 2.15 to 8.79 Mg C ha−1.
Model sensitivity, quantified as the standard deviation of predictions (Figure 4c), varies spatially from 2.2 to 5.1 Mg C ha−1, with a margin of error of ±10% relative to the maximum values. The regions exhibiting the highest sensitivity are situated in northern Agua Brava, which has been significantly affected by Hurricane Roslyn, and near San Blas, where the mangroves remain largely untouched. These findings highlight the need for expanded sampling efforts to improve assessment reliability. The uncertainty analysis (Figure 4d) reveals relative errors ranging from 11.4% to 30%, with the highest uncertainty occurring in degraded areas adjacent to Chumbeño Lagoon and in the southern Agua Brava lagoon. These areas were previously delineated in the 2020 mangrove maps produced by CONABIO [77].
In the context of BGC, the Random Forest model accounted for 95% of the variance, identifying dry-season Sentinel-2 SWIR band (B12) and radar backscatter (VV/VH) as significant predictors. The spatial distribution (Figure 5a) demonstrated carbon stocks ranging from 129 to 485 Mg C ha−1, with an average of 264.31 ± 65.2 Mg C ha−1. The highest concentrations of carbon were observed in the Agua Brava Lagoon and the Acaponeta River delta. Frequency analysis (Figure 5b) revealed that 60% of the area contained carbon stocks between 150 and 250 Mg C ha−1. In contrast, riverine and lagoon-fringing mangroves contained the highest carbon stocks (>400 Mg C ha−1), underscoring how geomorphic setting governs sediment deposition and carbon sequestration potential.
The sensitivity analysis of the model demonstrated absolute errors ranging from 46.3 to 65.2 Mg C ha−1, falling within ±10% of the maximum values observed (Figure 5c). The subsequent uncertainty analysis revealed relative errors ranging from 17% to 26.9% (Figure 5d). Notably, the Agua Brava site exhibited the lowest level of uncertainty, attributed to the higher density of field data. In contrast, peripheral regions, including Arenitas, Agua Grande Lagoon (to the north), and Santa Cruz marshes (to the southwest), experienced greater uncertainty, probably due to limited sampling availability.

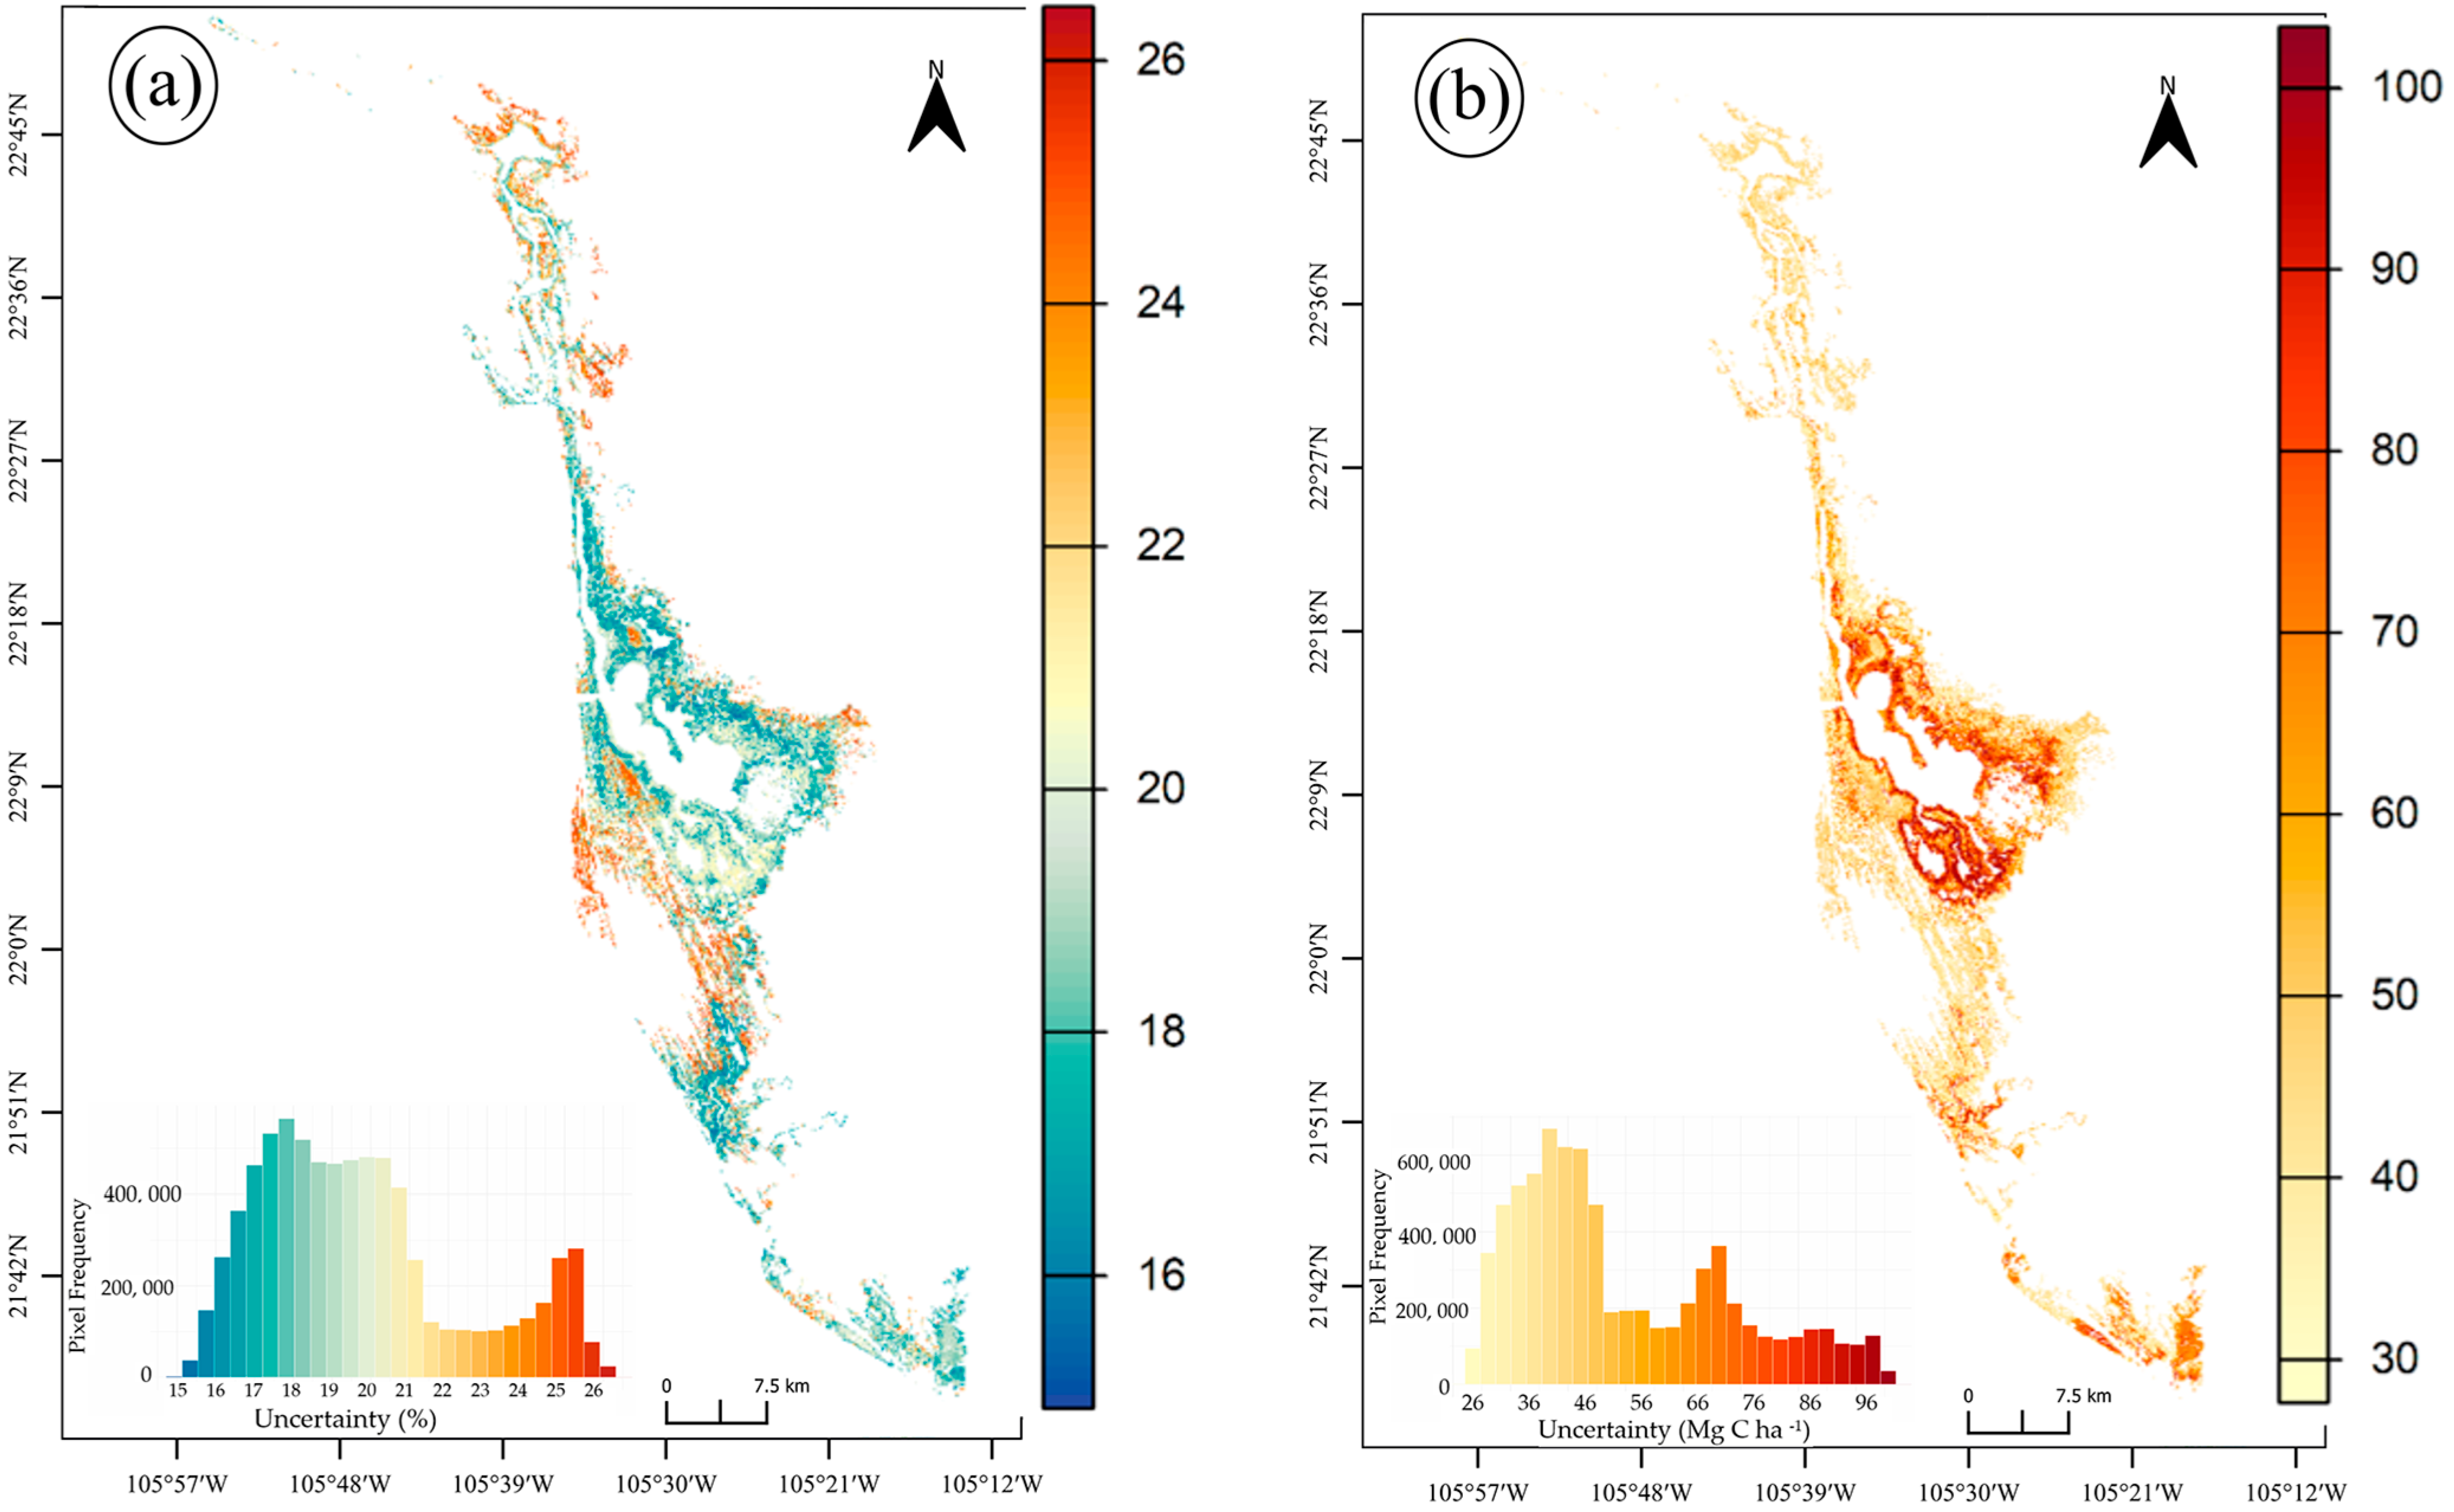
3.2. Total Carbon Stocks and Integrated Uncertainty

The combined carbon stocks, encompassing AGC and BGC, within Marismas Nacionales exhibit distinct spatial patterns (Figure 6a). The average total ecosystem carbon storage is recorded at 285.1 ± 99.03 Mg C ha−1, and the total carbon pool within the mangrove ecosystem is estimated to be 21.46 ± 0.011 Tg C across an area of 755 km2. Elevated carbon concentrations are observed in Agua Brava Lagoon (Figure 6b) and the southern regions, specifically, San Blas (Figure 6c), where mature mangrove forests and organic-rich soils are predominant. Conversely, reduced carbon stocks are noted in the northern region of the study area, particularly at Agua Grande Lagoon (Figure 6d) and within marshes characterized by cordons near the Puerta de Palapares-Santa Cruz region (Figure 6e), which reflects sediment-limited conditions.
The integrated uncertainty assessment identified spatially structured error patterns across Marismas Nacionales (Figure 7a). The relative uncertainty remained moderate, ranging from 15% to 20% across 72% of the study area. However, this uncertainty increased to 24% to 26% in peripheral mangrove areas facing degradation, such as at the Chumeño lagoon, or in regions with limited field data, including the northern marshes. Absolute uncertainty (Figure 7b) peaked in high-carbon zones, such as Agua Brava, with values ranging from ± 89 to 112 Mg C ha−1. This phenomenon reflects both the natural variability inherent in mature stands and the methodological limitations of remote sensing within complex wetland environments. Conversely, low-carbon areas exhibited proportionally higher relative errors but lower absolute uncertainty, with ranges of ±12 to 18 Mg C ha−1. This finding aligns with the characteristics of sediment-starved systems, where minor measurement errors exert a disproportionately significant influence on estimates.

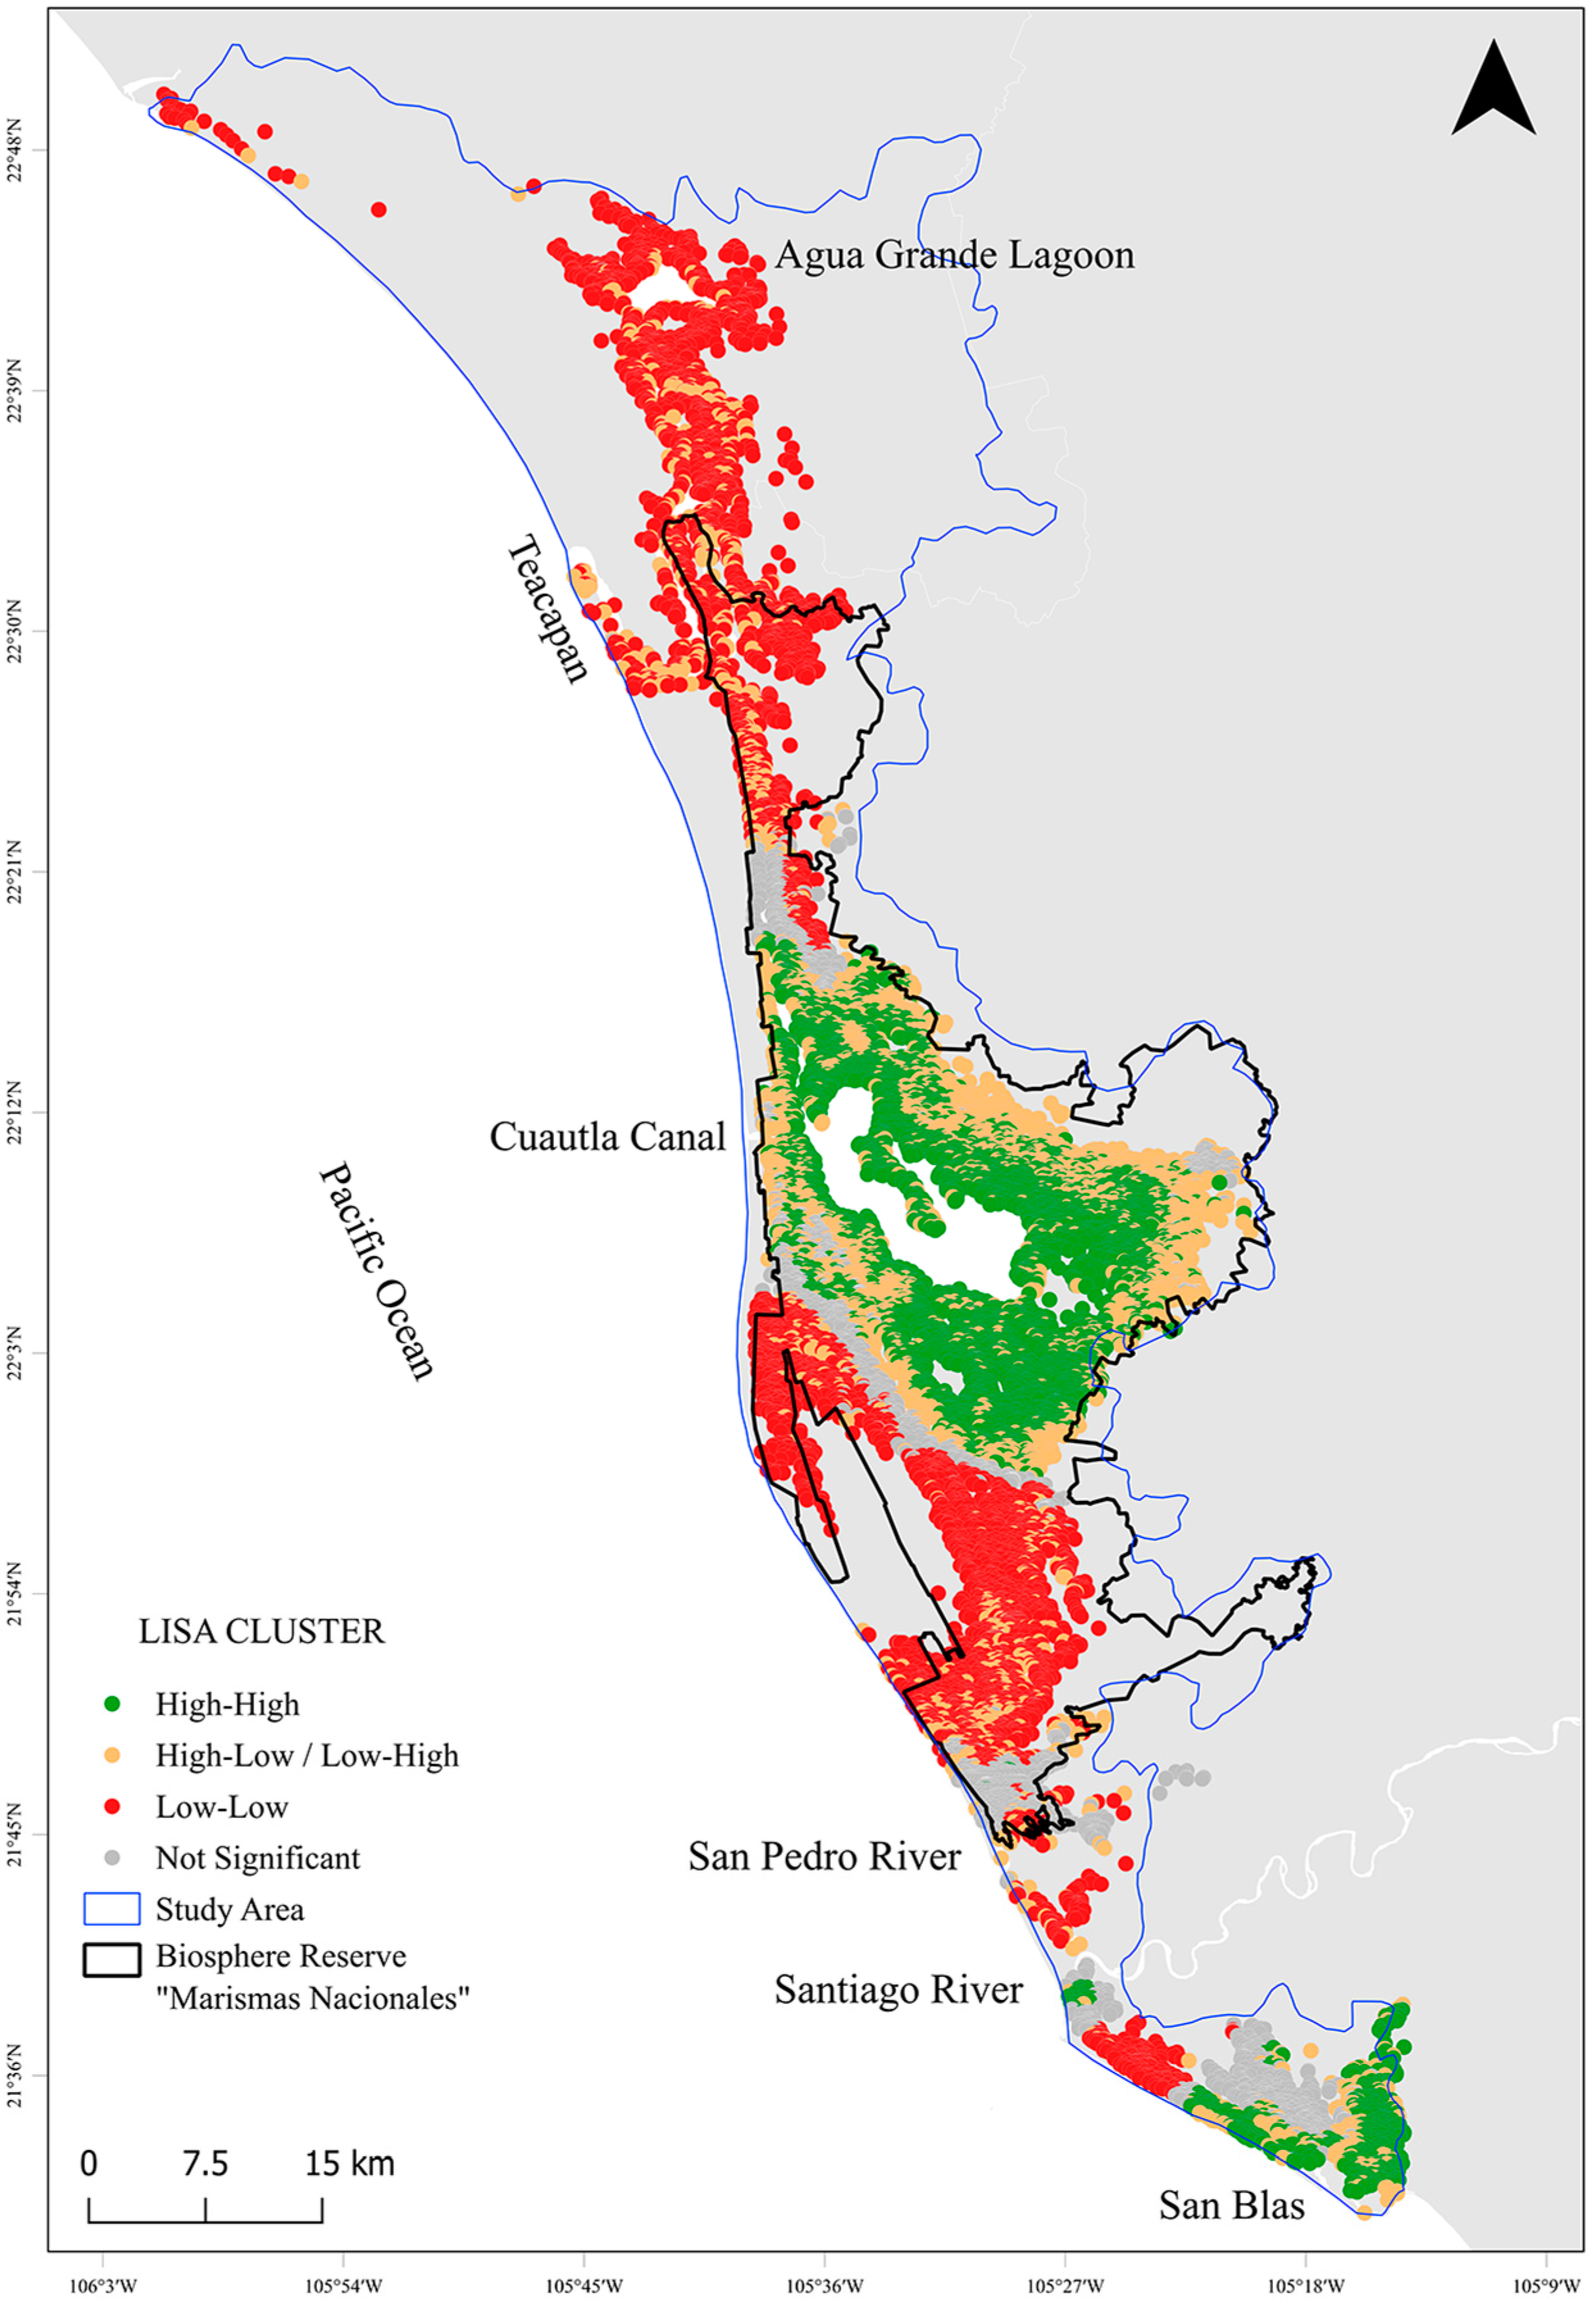
3.3. Mangrove Carbon Hotspots for Targeted Climate Action

The LISA analysis identified distinct spatial patterns in the distribution of mangrove carbon stocks throughout Marismas Nacionales (Figure 8). A total area of 251.7 km2, which constitutes 33.3% of the study area, was classified as hotspots (High-High clusters) characterized by elevated carbon values surrounded by similarly high values (Table 2). These hotspots are primarily situated in the southern and central regions of the system, encompassing locations such as San Blas and the Agua Brava lagoon. They demonstrate a mean carbon stock of 392 ± 56.2 Mg C ha−1, totaling 9.9 Tg C, of which 8.5 Tg C is located within protected areas. The identified Low-Low cold spots (201.3 km2) showed substantially reduced carbon stocks (198 ± 28.5 Mg C ha−1), primarily concentrated in northern areas affected by hydrological alteration. These patterns likely reflect either historical disturbances or diminished ecosystem functioning. Finally, transitional zones (high-low and low-high clusters) covered 201.3 km2 and stored 5.0 Tg C, main functioning as ecotones where carbon dynamics displayed marked spatial variability. These buffer areas exhibited intermediate characteristics between adjacent hotspots and cold spots.
Policy implications emerge from two key findings: (1) high-high clusters contain 46% of total carbon stocks while occupying just 33% of the study area, highlighting their disproportionate climate regulation value, and (2) 74.6% of carbon-rich zones fall within protected areas, demonstrating current conservation measures successfully capture priority carbon landscapes. Nevertheless, the presence of low-low clusters (cold spots) within protected areas, comprising 17.5%, suggests potential opportunities for restoration [78] within current conservation frameworks.

4. Discussion

The methodology employed demonstrated effectiveness in generating detailed maps that illustrate the spatial distribution of carbon stocks, encompassing both AGC and BGC components, within the largest wetland system along the eastern Pacific coast. By integrating active (Sentinel-1) and passive (Sentinel-2) remote sensing data in conjunction with field measurements—such as assessments of forest structure and sediment core analysis—we were able to calibrate the carbon stock results to correspond with the anticipated values for this mangrove forest since this coastal complex is profoundly influenced by both natural factors, including tropical storms and hurricanes, and anthropogenic impacts, such as hydrosedimentary alterations resulting from the construction of canals.
We employed machine learning algorithms, specifically the regression Random Forest model, within GEE to optimize the analysis of large datasets without the need to download individual satellite images. This algorithm, which has been rigorously validated in studies of tropical forest cover, particularly enhanced the robustness and accuracy of our analysis concerning the mangroves of Marismas Nacionales. Moreover, efficient management of large datasets in the cloud has become increasingly feasible for many users [79]. In particular, the application of artificial intelligence algorithms can revolutionize the performance of ecological analysis of mangroves while improving the accuracy of predictions regarding their future degradation or restoration [80]. However, we must recognize the limitations inherent in our study. For instance, the absence of field data in the northern region of Marismas Nacionales and the potential effects of hurricane impacts may have influenced the dataset used for model training [81]. Nevertheless, our findings regarding blue carbon stocks correspond with the anticipated values associated with a subtropical mangrove ecosystem.
The mean AGC content in Marismas Nacionales was recorded at 20.76 ± 8.08 Mg C ha−1, with a range spanning from 2.1 to 52 Mg C ha−1. This value is slightly lower than the previously reported value of 42.1 Mg C ha−1 by Herrera-Silveira et al. [82]. Thus, this discrepancy may be attributed to the effects of Hurricane Roslyn, which occurred in October 2022 and resulted in defoliation and a reduction in biomass within the mangrove ecosystem [83]. In this sense, approximately 94% of the variance in predicting AGC was accounted for by canopy height during the rainy season. These results align with previous studies that demonstrate that canopy height is the primary driver of AGC levels in mangroves [84]. Additionally, litterfall production peaks ~3-fold during the rainy season highlighting its importance in estimating AGC dynamics [85].
The spatial distribution of AGC in Marismas Nacionales exhibits a notable correlation with species composition and various physiognomic classes of mangroves. Specifically, the highest concentrations of carbon, reaching up to 50 Mg C ha−1, were detected in well-developed mangrove areas, particularly adjacent to the Acaponeta River (Agua Brava lagoon), the San Pedro riverbed, and the San Blas region. These areas hold considerable ecological and economic importance, largely due to their engagement in ecotourism activities [86]. In contrast, the region with the lowest AGC values (less than 10 Mg C ha−1) is the Agua Grande lagoon in the northern area, which experienced substantial damage from Hurricane Willa in 2018. Additionally, the alteration of the hydrology due to the opening of the Cabras Canal has led to a reduction in flood volumes by 23,000,000 m3 [45], resulting in extensive dieback of Avicennia germinans. Another area exhibiting low AGC stocks is Chumbeño Lagoon, situated in the eastern sector of the study region, where considerable mortality of Laguncularia racemosa has been documented since the opening of the Cuautla Canal in 1972. This trend has been corroborated by the CONABIO 2020 mangrove mapping efforts [77].
The Random Forest model explained a substantial portion of the variance (95%) in estimating BGC, particularly during the dry season. This high level of effectiveness can be attributed to the complementary interaction between the Sentinel-2 shortwave infrared (SWIR) band and the Sentinel-1 vertical and horizontal (VV/VH) cross-polarization. In this sense, prior research utilizing Synthetic Aperture Radar (SAR) has highlighted the crucial role of cross-polarization in estimating both AGC and BGC because the backscatter of SAR can penetrate the forest canopy, facilitating a more comprehensive characterization of mangrove ecosystems at the base level [87]. The spatial distribution of BGC exhibited a range from 129 to 485 Mg C ha−1, demonstrating the highest concentrations and absolute frequencies in fringe-type mangroves situated along the Agua Brava lagoon and the Acaponeta River delta. This pattern highlights the substantial influence of geomorphological features [88], particularly sediment accumulation [89]. Our findings, which are consistent with prior studies [90], underscore the ecological significance of the few undammed rivers within the Marismas Nacionales region, particularly the Acaponeta and San Pedro Rivers. These rivers have played a fundamental role in sedimentary contributions, maintaining the hydrosedimentary balance, which are critical factors for the development and sustainability of mangroves [91].
Our analysis reveals that carbon hotspots (high-high clusters) store 46% of total carbon while occupying just 33% of the study area, particularly in zones like Agua Brava, where mangroves, before hurricane Roslyn, exceed 25 m height [37]. These findings intersect with Marismas Nacionales’ socio-economic context, where agriculture covers 23% of the territory and artisanal fisheries generate over $4 million annually [92]. The local Climate Adaptation Program already identifies buffer areas (e.g., agricultural lands 10 masl) for compatible practices, like silvopastoral systems in Tecuala (near Acaponeta river) or oyster aquaculture in Boca de Camichin (southern part of the study area). With 37% poverty rates [93], conservation must integrate economic incentives, such as ecotourism (800 tourists/year) or carbon payments in San Blas mangroves [94]. Future work should quantify trade-offs between carbon storage and livelihoods across our mapped polygons, building on Indo-Pacific [95] and Caribbean [32] models.
The overall model exhibited absolute errors ranging from 4 to 64 Mg C ha−1, values consistent with prior blue carbon studies [95]. Uncertainty analyses revealed higher error percentages in the coastal system’s periphery, particularly in the Agua Grande Lagoon (north) and the Santa Cruz marshes (southwest), where field data were limited or inaccessible due to safety constraints, which is a main concern in many coastal regions of the world [96]. These spatial uncertainties, reaching up to 26% in degraded margins, are consistent with Tier 1 uncertainty thresholds established by the IPCC [51] for blue carbon ecosystems. However, our analysis suggests that in conservation-priority zones, uncertainties are consistently below 15%, aligning with Tier 2 requirements. While landscape-scale estimates remain robust, the observed error patterns highlight priority areas where targeted field validation could significantly improve reporting accuracy.
Total blue carbon stocks in Marismas Nacionales average 285.1 ± 99.03 Mg C ha−1, placing them within the lower range of global mangrove stocks (Table S4). These values align closely with other neotropical mangroves experiencing similar disturbance regimes, including Colombia: 237 to 364 Mg C ha−1 [97] and Brazil: 250–320 Mg C ha−1 [95,98] ecosystems. In contrast, Indo-Pacific mangroves frequently exceed 500 Mg C ha−1 [95], reflecting their older standing age, greater sediment accumulation rates, and reduced anthropogenic impacts. Within Mexico, our results fall below the national mean (364 Mg C ha−1) but remain consistent with conserved mangroves in the Gulf of Mexico (200–500 Mg C ha−1) [82]. Several factors may explain these lower values, including: (1) [80] the cumulative effects of recent hurricanes, specifically Willa (2018), Pamela (2021), and Roslyn (2022); (2) the pronounced geomorphological heterogeneity of the region; and (3) ongoing degradation of the estuarine complex [99]. These results contrast sharply with high-carbon mangrove protected areas like Sian Ka’an in the Mexican Caribbean (600 Mg C ha−1), where minimal anthropogenic pressure and stable hydrological conditions maximize carbon storage potential [82].
The aforementioned comparisons should be interpreted as mere indicative for two key reasons: (1) few previous studies have employed the type of comprehensive spatial modeling approach used in our work, and (2) most available literature relies on discrete field measurements that produce reference ranges rather than continuous spatial data. Upon analyzing our field results exclusively, as presented in Supplementary Materials Tables S1 and S2, it is clear that the range identified (93–568 Mg C ha−1) exceeds numerous values documented in the specialized literature.
The total carbon stock for the conservation area of 755 km2 was estimated at 21.46 ± 0.011 Tg C, of which 16.5 Tg C is located within regions protected under federal legislation. The highest concentrations of carbon are found in the Agua Brava Lagoon and the southern regions, particularly around San Blas, which are characterized by mature mangroves and soils rich in organic matter [100]. In contrast, the lowest carbon stocks were measured in marsh-dominated coastal zones and the southern terminus of Cuautla Canal, where inadequate sedimentation limits mangrove establishment [101]. These results highlight sediment supply as a critical control on both hydrologic regulation and productive mangrove growth.
The spatial clustering of carbon stocks, as revealed through LISA analysis, has yielded noteworthy insights for climate action within the mangrove ecosystems of Marismas Nacionales. From a mitigation standpoint, the 9.9 Tg of carbon stored in the 251.7 km2 identified as high-high clusters (hotspots) represents approximately 54% of the annual CO2 emissions generated by the Mexico City Metropolitan Area, which is home to 21 million residents across an expanse of 7866 km2 [102]. Thus, it highlights the substantial climate mitigation potential associated with conserving just one-third of this vital mangrove landscape. The method can also be applied to other sites since it depends on open-access satellite data. That said, local soil sampling remains essential for reliable carbon estimates and prior spatial analysis is required to classify mangrove species and distinguish physiognomic classes, such as fringe, basin, or shrub condition.
Our findings corroborate recent investigations that advocate for the strategic prioritization of high-carbon-density areas within blue carbon finance mechanisms, including REDD+, voluntary carbon markets, and jurisdictional Nationally Determined Contributions (NDC) accounting [98,103]. For instance, stable, high-carbon ecosystems, such as the Agua Brava Lagoon, which is located under strong tidal currents, deliver key coastal protections through shoreline stabilization, sediment trapping, and wave attenuation. These ecosystem services grow increasingly valuable as sea levels continue to rise [104]. Such areas meet the dual criteria of “climate-resilient carbon,” as proposed by Sutton-Gier et al. [105] long-term carbon sequestration is optimized alongside the enhancement of ecosystem services.
These carbon-dense zones align with areas of high ecological-economic value in the San Blas region, where mangroves support both ecotourism and fishery productivity [106]. Their conservation could be optimized through the Climate Adaptation Program’s ridge-to-reef approach [92], which links mangrove protection to watershed management and alternative livelihoods like, or crab farming (8 cooperatives in Nayarit). However, as demonstrated in Indo-Pacific systems [95], such strategies require participatory governance to balance carbon priorities with community needs, critical gaps that our spatial models now help address.
Cold spots, identified in degraded margins and sediment-deficient zones, represent a target of opportunity for ecological rehabilitation endeavors [107]. Specifically, we found that 17.5% of these cold spots are situated within protected areas, highlighting opportunities for targeted intervention within reserves. The recovery of mangroves in these locations could be effectively facilitated by reestablishing hydrological connectivity and mitigating chronic disturbances [108]. It is imperative to recognize that any mangrove rehabilitation initiative—often inaccurately referred to as “restoration”—will encounter limitations if it fails first to address modifications in the hydrosedimentary balance, a critical factor in the functional recovery of mangrove ecosystems [109]. On the contrary, transitional clusters (high-low/low-high) may function as early warning indicators for shifts in carbon stability, particularly in the context of escalating climate variability or anthropogenic disturbances. This concept is supported by studies conducted on temperate mangrove-salt marsh ecotones [110], which reveal that spatial zones displaying structural changes can signal broader ecosystem transitions preemptively under warming scenarios.

5. Conclusions

This study demonstrates that the Marismas Nacionales wetland complex possesses substantial mangrove carbon stocks, with a total estimated storage of 21.5 ± 0.01 Tg C across an area of 755 km2. By integrating multi-source remote sensing data from Sentinel-1, Sentinel-2, and LiDAR products with advanced machine learning algorithms, specifically Random Forest, we achieved highly accurate spatial predictions for both AGC and BGC pools.
Our findings indicate distinct spatial patterns in carbon distribution across the study area. High-carbon zones (500 Mg C ha−1), referred to as hotspots, are predominantly situated within the Agua Brava Lagoon and San Blas, which collectively account for 46% of the total carbon despite comprising only 33% of the overall mangrove area. These regions represent critical targets for climate mitigation strategies under blue carbon financing initiatives. On the other hand, low-carbon zones (i.e., cold spots, 130 Mg C ha−1) are predominantly located across degraded regions and within sediment-poor margins, some of which are designated as protected areas. The existence of these cold spots presents considerable opportunities for future rehabilitation projects. However, we recommend enhancing hydrological conditions, rather than merely planting propagules, to support carbon recovery.
The study highlights the importance of spatially explicit carbon assessments in informing conservation and restoration efforts while also supporting national climate commitments. While landscape-scale estimates demonstrate robustness, the analysis of spatial uncertainty indicates localized regions with relatively high unaccounted variability, particularly in marginal areas in the northern section of the study site. Consequently, it is essential to enhance field sampling in these regions to achieve Tier 2 Intergovernmental Panel on Climate Change (IPCC), which requires an accuracy standard of less than 15%. These findings underscore the importance of prioritizing the protection of high-carbon zones while also strategically restoring degraded areas to enhance ecosystem resilience.

Supplementary Materials

The following supporting information can be downloaded at: https://www.mdpi.com/article/10.3390/f16081224/s1, Table S1: Aboveground carbon stocks data in the study site; Table S2: Belowground carbon stocks data in the study site, Table S3: Random Forest parameters, covariates, and error metrics of AGC and BGC stock models; Table S4: Comparative mangrove carbon stocks across biogeographic regions.

Author Contributions

Conceptualization, C.T.-S. and F.F.-d.-S.; methodology, C.T.-S., E.V.-C., B.V.-B., and O.G.R.-A.; software, C.T.-S. and E.V.-C.; validation, C.T.-S., E.V.-C., B.V.-B., S.V.-S., V.H.V.-M., O.G.R.-A., and F.F.-d.-S.; formal analysis, C.T.-S. and F.F.-d.-S.; investigation, C.T.-S., E.V.-C., S.V.-S., and F.F.-d.-S.; writing—original draft preparation, C.T.-S., E.V.-C., and F.F.-d.-S.; writing—review and editing, C.T.-S., E.V.-C., and S.V.-S.; visualization, E.V.-C., S.V.-S., and F.F.-d.-S.; supervision, V.H.V.-M. and O.G.R.-A. All authors have read and agreed to the published version of the manuscript.

Funding

The World Wildlife Fund (WWF), with support from The Bezos Earth Fund, provided financing through agreement MX13531 ‘Strengthening The Mexico’s Mangrove Monitoring System (SMMM),’ granted to CONABIO.

Data Availability Statement

The original contributions presented in this study are included in the Supplementary Materials. For further inquiries, please contact the corresponding authors.

Acknowledgments

We sincerely thank Francisco Flores-Verdugo (retired) for his invaluable expertise and guidance on the mangrove ecosystems of Marismas Nacionales. We are deeply grateful to Coral Mascote-Maldonado, María Teresa Rodríguez-Zúñiga, and José Alberto Alcántara-Maya for their essential support in field logistics. We also acknowledge José Alberto Alcántara-Maya for providing the photograph used in Figure 3b. This work was made possible through funding and logistical support from WWF-Mexico. We also thank the Comisión Nacional de Áreas Naturales Protegidas for granting the necessary permits to conduct this research within the protected natural area.

Conflicts of Interest

The authors declare no conflicts of interest. The funders had no role in the design of the study; in the collection, analyses, or interpretation of data; in the writing of the manuscript; or in the decision to publish the results.

Abbreviations

The following abbreviations are used in this manuscript:
AGCAboveground carbon
BGCBelowground carbon
LiDARLight Detection and Ranging
UAVUnoccupied/unmanned aerial vehicle
SARSynthetic Aperture Radar
SMMMMexican Mangrove Monitoring System
DBHDiameter at breast height
GEEGoogle Earth Engine
LISALocal indicators of spatial association

References

  1. Beselly, S.M.; Van Der Wegen, M.; Reyns, J.; Grueters, U.; Dijkstra, J.T.; Roelvink, D. Strategic Mangrove Restoration Increases Carbon Stock Capacity Check for Updates. Commun. Earth Environ. 2025, 6, 422. [Google Scholar] [CrossRef]
  2. Abelardo Gonzalez-Ocampo, H.; Parra-Olivas, M.C.; Pérez-González, E.; Rodríguez-Meza, G.D. Rhizophora mangle L. Bioindicator of Environmental Exposure to Heavy Metals in the Navachiste Lagoon Complex, Sinaloa, Mexico. Mar. Pollut. Bull. 2024, 209, 117131. [Google Scholar] [CrossRef]
  3. Alongi, D.M. Carbon Cycling and Storage in Mangrove Forests. Ann. Rev. Mar. Sci. 2014, 6, 195–219. [Google Scholar] [CrossRef]
  4. Fanous, M.; Eden, J.M.; Remesan, R.; Daneshkhah, A. Challenges and Prospects of Climate Change Impact Assessment on Mangrove Environments through Mathematical Models. Environ. Model. Softw. 2023, 162, 105658. [Google Scholar] [CrossRef]
  5. Flores-Verdugo, F.; Zebadua-Penagos, F.; Flores-de-Santiago, F. Assessing the Influence of Artificially Constructed Channels in the Growth of Afforested Black Mangrove (Avicennia germinans) within an Arid Coastal Region. J. Environ. Manag. 2015, 160, 113–120. [Google Scholar] [CrossRef] [PubMed]
  6. Cuellar-Martinez, T.; Ruiz-Fernández, A.C.; Sanchez-Cabeza, J.A.; Pérez-Bernal, L.; López-Mendoza, P.G.; Carnero-Bravo, V.; Agraz-Hernández, C.M.; van Tussenbroek, B.I.; Sandoval-Gil, J.; Cardoso-Mohedano, J.G.; et al. Temporal Records of Organic Carbon Stocks and Burial Rates in Mexican Blue Carbon Coastal Ecosystems throughout the Anthropocene. Glob. Planet. Change 2020, 192, 103215. [Google Scholar] [CrossRef]
  7. Cobacho, S.P.; Janssen, S.A.R.; Brekelmans, M.A.C.P.; van de Leemput, I.A.; Holmgren, M.; Christianen, M.J.A. High Temperature and Eutrophication Alter Biomass Allocation of Black Mangrove (Avicennia germinans L.) Seedlings. Mar. Environ. Res. 2024, 193, 106291. [Google Scholar] [CrossRef]
  8. Ferreira, A.C.; Aurélio, F.; Freire, M.; Vitor, J.; Rodrigues, M.; Bezerra, L.E.A. Mangrove Recovery in Semiarid Coast Shows Increase of Ecological Processes from Biotic and Abiotic Drivers in Response to Hydrological Restoration. Wetlands 2022, 42, 80. [Google Scholar] [CrossRef]
  9. Shih, S.S.; Huang, Z.Z.; Hsu, Y.W. Nature-Based Solutions on Floodplain Restoration with Coupled Propagule Dispersal Simulation and Stepping-Stone Approach to Predict Mangrove Encroachment in an Estuary. Sci. Total Environ. 2022, 851, 158097. [Google Scholar] [CrossRef]
  10. Troche-Souza, C.; Priego-Santander, A.; Equihua, J.; Vázquez-Balderas, B. Spatial Distribution of Carbon Stocks Along Protected and Non-Protected Coastal Wetland Ecosystems in the Gulf of Mexico. Ecosystems 2024, 27, 724–738. [Google Scholar] [CrossRef]
  11. Velasco-Bautista, E.; Gonzalez-Hernandez, A.; Romero-Sanchez, M.E.; Guerra-De La Cruz, V.; Perez-Miranda, R. Does It Matter Whether to Use Circular or Square Plots in Forest Inventories? A Multivariate Comparison. Forests 2024, 15, 1847. [Google Scholar] [CrossRef]
  12. Flores-de-Santiago, F.; Flores-Verdugo, F. A Comparison of Forest Structural Methods of Semiarid Mangrove Species Using a Field-Based Approach. Cienc. Mar. 2024, 50, e3432. [Google Scholar] [CrossRef]
  13. Kovacs, J.M.; Liu, Y.; Zhang, C.; Flores-Verdugo, F.; de Santiago, F.F. A Field Based Statistical Approach for Validating a Remotely Sensed Mangrove Forest Classification Scheme. Wetl. Ecol. Manag. 2011, 19, 409–421. [Google Scholar] [CrossRef]
  14. Sanam, H.; Thomas, A.A.; Kumar, A.P.; Lakshmanan, G. Multi-Sensor Approach for the Estimation of Above-Ground Biomass of Mangroves. J. Indian Soc. Remote Sens. 2024, 52, 903–916. [Google Scholar] [CrossRef]
  15. Ou, G.; Zhang, Y.; Withaningsih, S.; Malik, A.D.; Parikesit, P. Aboveground Spatiotemporal Carbon Storage Model in the Changing Landscape of Jatigede, West Java, Indonesia. Forests 2024, 15, 874. [Google Scholar] [CrossRef]
  16. Peralta-Carreta, C.; Medrano-Pérez, O.R.; Alcudia-Aguilar, A.; Pham, Q.B.; Megia-Vera, H.J. Spatial Distribution of Relict Inland Mangrove (Rhizophora mangle L.) in the San Pedro River Basin: A Transboundary Analysis between Mexico and Guatemala. Estuaries Coasts 2025, 48, 59. [Google Scholar] [CrossRef]
  17. Duarte, C.M.; Losada, I.J.; Hendriks, I.E.; Mazarrasa, I.; Marbà, N. The Role of Coastal Plant Communities for Climate Change Mitigation and Adaptation. Nat. Clim. Chang. 2013, 3, 961–968. [Google Scholar] [CrossRef]
  18. Lovelock, C.E.; Ball, M.C.; Brothers, N.; Pearse, A.; Reef, R. Dynamics of Surface Accretion and Surface Elevation Differ between River and Tide Dominated Settings in Tropical Mangroves. Limnol. Oceanogr. Limnol. Ocean. 2025, 70, 1424–1437. [Google Scholar] [CrossRef]
  19. Valderrama-Landeros, L.H.; López-Portillo, J.; Velázquez-Salazar, S.; Alcántara-Maya, J.A.; Troche-Souza, C.; Rodríguez-Zúñiga, M.T.; Vázquez-Balderas, B.; Villeda-Chávez, E.; Cruz-López, M.I.; Ressl, R. Regional Distribution and Change Dynamics of Mangroves in México between 1970/80 and 2015. Wetlands 2020, 40, 1295–1305. [Google Scholar] [CrossRef]
  20. Hao, Q.; Song, Z.; Zhang, X.; He, D.; Guo, L.; van Zwieten, L.; Yu, C.; Wang, Y.; Wang, W.; Fang, Y.; et al. Organic Blue Carbon Sequestration in Vegetated Coastal Wetlands: Processes and Influencing Factors. Earth Sci. Rev. 2024, 255, 104853. [Google Scholar] [CrossRef]
  21. Zhu, Y.; Myint, S.W.; Liu, K.; Liu, L.; Cao, J. Integration of UAV LiDAR and WorldView-2 Images for Modeling Mangrove Aboveground Biomass with GA-ANN Wrapper. Ecol. Process. 2024, 13, 85. [Google Scholar] [CrossRef]
  22. Wu, Y.; Lu, C.; Wu, K.; Gao, W.; Yang, N.; Lin, J. Advancements and Trends in Mangrove Species Mapping Based on Remote Sensing: A Comprehensive Review and Knowledge Visualization. Glob. Ecol. Conserv. 2025, 57, e03408. [Google Scholar] [CrossRef]
  23. Abu Bakar, N.A.; Wan Mohd Jaafar, W.S.; Abdul Maulud, K.N.; Muhmad Kamarulzaman, A.M.; Saad, S.N.M.; Mohan, M. Monitoring Mangrove-Based Blue Carbon Ecosystems Using UAVs: A Review. Geocarto Int. 2024, 39, 2405123. [Google Scholar] [CrossRef]
  24. Price, C.A.; Papeş, M.; Sgouralis, I.; Schroeder, T.A. Surface Area to Volume Scaling of Alpha Shapes and Convex Hulls Fit to Lidar Derived Mangrove Island Point Clouds. Remote Sens. Lett. 2024, 15, 1259–1269. [Google Scholar] [CrossRef]
  25. Sunkur, R.; Kantamaneni, K.; Bokhoree, C.; Rathnayake, U.; Fernando, M. Mangrove Mapping and Monitoring Using Remote Sensing Techniques towards Climate Change Resilience. Sci. Rep. 2024, 14, 6949. [Google Scholar] [CrossRef] [PubMed]
  26. Pham, T.D.; Yokoya, N.; Bui, D.T.; Yoshino, K.; Friess, D.A. Remote Sensing Approaches for Monitoring Mangrove Species, Structure, and Biomass: Opportunities and Challenges. Remote Sens. 2019, 11, 230. [Google Scholar] [CrossRef]
  27. Shinkarenko, S.S.; Bartalev, S.A. Application of Remote Sensing Data in Large-Scale Monitoring of Wetlands. Sovrem. Probl. Distantsionnogo Zondirovaniya Zemli Iz Kosmosa 2023, 20, S100–S114. [Google Scholar] [CrossRef]
  28. Ávila-Flores, G.; Juárez-Mancilla, J.; Hinojosa-Arango, G.; Cruz-Chávez, P.; López-Vivas, J.M.; Arizpe-Covarrubias, O. A Practical Index to Estimate Mangrove Conservation Status: The Forests from La Paz Bay, Mexico as a Case Study. Sustainability 2020, 12, 858. [Google Scholar] [CrossRef]
  29. Espinoza-Tenorio, A.; Millán-Vásquez, N.I.; Vite-García, N.; Alcalá-Moya, G. People and Blue Carbon: Conservation and Settlements in the Mangrove Forests of Mexico. Hum. Ecol. 2019, 47, 877–892. [Google Scholar] [CrossRef]
  30. Alongi, D.M. Mangrove Forest. In Blue Carbon. SpringerBriefs in Climate Studies; Springer: Cham, Switzerland, 2018. [Google Scholar] [CrossRef]
  31. Bukoski, J.J.; Elwin, A.; Mackenzie, R.A.; Sharma, S.; Purbopuspito, J.; Kopania, B.; Apwong, M.; Poolsiri, R.; Potts, M.D. The Role of Predictive Model Data in Designing Mangrove Forest Carbon Programs. Environ. Res. Lett. 2020, 15, 084019. [Google Scholar] [CrossRef]
  32. Malerba, M.E.; Duarte de Paula Costa, M.; Friess, D.A.; Schuster, L.; Young, M.A.; Lagomasino, D.; Serrano, O.; Hickey, S.M.; York, P.H.; Rasheed, M.; et al. Remote Sensing for Cost-Effective Blue Carbon Accounting. Earth Sci. Rev. 2023, 238, 104337. [Google Scholar] [CrossRef]
  33. Shiau, Y.J.; Chiu, C.Y. Biogeochemical Processes of C and N in the Soil of Mangrove Forest Ecosystems. Forests 2020, 11, 492. [Google Scholar] [CrossRef]
  34. Blanco-Sacristán, J.; Johansen, K.; Elías-Lara, M.; Tu, Y.H.; Duarte, C.M.; McCabe, M.F. Quantifying Mangrove Carbon Assimilation Rates Using UAV Imagery. Sci. Rep. 2024, 14, 4648. [Google Scholar] [CrossRef] [PubMed]
  35. Padonou, E.A.; Avocèvou-Ayisso, C.M.A.; Sewade, C.; Hovozounkou, G.M.; Akakpo, B.A.; Sinsin, B. Plant Diversity, Population Structures and Carbon Stock of Mangrove Ecosystems of Ramsar Site 1017 in Benin. Wetl. Ecol. Manag. 2025, 33, 24. [Google Scholar] [CrossRef]
  36. Blanco y Correa, M.; Flores-Verdugo, F.; Ortiz-Pérez, M.A.; de la Lanza-Espino, G.; López-Portillo, J.; Valdez-Hernández, I. Diagnostico Funcional de Marismas Nacionales; Universidad Autónoma de Nayarit and Secretaría de Medio Ambiente y Recursos Naturales: Nayarit, Mexico, 2011. [Google Scholar]
  37. Berlanga-Robles, C.A. Trends in Mangrove Canopy and Cover in the Teacapan-Agua Brava Lagoon System (Marismas Nacionales) in Mexico: An Approach Using Open-Access Geospatial Data Mapping Mangrove Dynamics in Teacapan-Agua Brava. Wetlands 2025, 45, 1. [Google Scholar] [CrossRef]
  38. Godwyn-Paulson, P.; Jonathan, M.P.; Roy, P.D.; Rodríguez-Espinosa, P.F.; Muthusankar, G.; Muñoz-Sevilla, N.P.; Lakshumanan, C. Evolution of Southern Mexican Pacific Coastline: Responses to Meteo-Oceanographic and Physiographic Conditions. Reg. Stud. Mar. Sci. 2021, 47, 101914. [Google Scholar] [CrossRef]
  39. Serrano-Rubio, J.P.; Ruiz, M.D.M.; Vidal-Espitia, U. Integrating Remote Sensing and Image Processing to Test for Disturbance Effects in a Post-Hurricane Mangrove Ecosystem. Signal Image Video Process 2021, 15, 351–359. [Google Scholar] [CrossRef]
  40. Rodríguez-Sobreyra, R.; Valderrama-Landeros, L.; Flores-Verdugo, F.; Green-Ruiz, C.; Flores-de-Santiago, F. The Influence of Hydrological Variability, Geomorphology, and Salinity Determines the Allocation of Two Dominant Fringe Mangrove Species in Semiarid Coastal Systems. Discov. Conserv. 2025, 2, 10. [Google Scholar] [CrossRef]
  41. Hernández-Guzmán, R.; Ruiz-Luna, A. Combining Multisensor Images and Social Network Data to Assess the Area Flooded by a Hurricane Event. PeerJ 2024, 12, e17319. [Google Scholar] [CrossRef]
  42. Pérez-Ceballos, R.; Echeverría-Ávila, S.; Zaldívar-Jiménez, A.; Zaldívar-Jiménez, T.; Herrera-Silveira, J. Contribution of Microtopography and Hydroperiod to the Natural Regeneration of Avicennia germinans in a Restored Mangrove Forest. Cienc. Mar. 2017, 43, 55–67. [Google Scholar] [CrossRef]
  43. Alvarez-Fuentes, C.J.; Tovar-Ávila, J.; Payan-Alejo, J.; Chávez-Arrenquín, D.A.; Salgado-Ugarte, I.H.; Amezcua, F. Reproductive Ecology of the Chilean Round Ray (Urotrygon chilensis, Günther, 1872) in the Southern Gulf of California. Fishes 2023, 8, 193. [Google Scholar] [CrossRef]
  44. Rodríguez-Veiga, P.; Saatchi, S.; Tansey, K.; Balzter, H. Magnitude, Spatial Distribution and Uncertainty of Forest Biomass Stocks in Mexico. Remote Sens. Environ. 2016, 183, 265–281. [Google Scholar] [CrossRef]
  45. Serrano, D.; Flores-Verdugo, F.; Ramírez-Félix, E.; Kovacs, J.M.; Flores-de-Santiago, F. Modeling Tidal Hydrodynamic Changes Induced by the Opening of an Artificial Inlet within a Subtropical Mangrove Dominated Estuary. Wetl. Ecol. Manag. 2020, 28, 103–118. [Google Scholar] [CrossRef]
  46. Wei, S.; Zhang, H.; Ling, J. A Review of Mangrove Degradation Assessment Using Remote Sensing: Advances, Challenges, and Opportunities. GIsci Remote Sens. 2025, 62, 2491920. [Google Scholar] [CrossRef]
  47. Pranchai, A.; Jenke, M.; Thongmee, J.; Sutthinon, P.; Karuna, S.; Wongkamhaeng, K.; Berger, U. Artificial Macropores Enhance Mangrove Establishment in Hypersaline Environments. Restor. Ecol. 2025, 33, e70015. [Google Scholar] [CrossRef]
  48. Kauffman, J.B.; Donato, D.C. Protocols for the Measurement, Monitoring and Reporting of Structure, Biomass and Carbon Stocks in Mangrove Forests; Working Paper 86; CIFOR: Bogor, Indonesia, 2012. [Google Scholar]
  49. Rodríguez-Zúñiga, M.T.; Troche-Souza, C.; Cruz-López, M.I.; Rivera-Monroy, V.H. Development and Structural Organization of Mexico’s Mangrove Monitoring System (SMMM) as a Foundation for Conservation and Restoration Initiatives: A Hierarchical Approach. Forests 2022, 13, 621. [Google Scholar] [CrossRef]
  50. CONAFOR. Programa Institucional de La Comisión Nacional Forestal 2020–2024; CONAFOR: Mexico City, Mexico, 2021. [Google Scholar]
  51. Hiraishi, T.; Krug, T.; Tanabe, K.; Srivastava, N.; Jamsranjav, B.; Fukuda, M.; Troxler, T. 2013 Supplement to the 2006 IPCC Guidelines for National Greenhouse Gas Inventories: Wetlands; IPCC: Geneva, Switzerland, 2014. [Google Scholar]
  52. Day, J.W.; Conner, W.H.; Ley-Lou, F.; Day, R.H.; Navarro, A.M. The Productivity and Composition of Mangrove Forests, Laguna de Términos, Mexico. Aquat. Bot. 1987, 27, 267–284. [Google Scholar] [CrossRef]
  53. Fromard, F.; Puig, H.; Mougin, E.; Marty, G.; Betoulle, J.L.; Cadamuro, L. Structure, above-Ground Biomass and Dynamics of Mangrove Ecosystems: New Data from French Guiana. Oecologia 1998, 115, 39–53. [Google Scholar] [CrossRef]
  54. Smith, T.J.; Whelan, K.R.T. Development of allometric relations for three mangrove species in South Florida for use in the Greater Everglades Ecosystem restoration. Wetl. Ecol. Manag. 2006, 14, 409–419. [Google Scholar] [CrossRef]
  55. Chave, J.; Andalo, C.; Brown, S.; Cairns, M.A.; Chambers, J.Q.; Eamus, D.; Fölster, H.; Fromard, F.; Higuchi, N.; Kira, T.; et al. Tree Allometry and Improved Estimation of Carbon Stocks and Balance in Tropical Forests. Oecologia 2005, 145, 87–99. [Google Scholar] [CrossRef]
  56. Hughes, R.; Boone Kauffman, J.; Jaramillo, V.J. Biomass, Carbon, and Nutrient Dynamics of Secondary Forests in a Umid Tropical Region of Mexico. Ecology 1999, 80, 1892–1907. [Google Scholar] [CrossRef]
  57. Komiyama, A.; Poungparn, S.; Kato, S. Common Allometric Equations for Estimating the Tree Weight of Mangroves. J. Trop. Ecol. 2005, 21, 471–477. [Google Scholar] [CrossRef]
  58. Howard, J.; Hoyt, S.; Isensee, K.; Pidgeon, E.; Telszewski, M. Coastal Blue Carbon: Methods for Assessing Carbon Stocks and Emissions Factors in Mangroves, Tidal Salt Marshes, and Seagrass Meadows; Conservation International, Intergovernmental Oceanographic Commission of UNESCO, International Union for Conservation of Nature: Arlington, VA, USA, 2014. [Google Scholar]
  59. Flores, L.; Blas, G.; Hernández, G.; Alcalá, R. Distribution and Sequential Extraction of Some Heavy Metals from Soils Irrigated with Wastewater from Mexico City. Water Air Soil. Pollut. 1997, 98, 105–117. [Google Scholar] [CrossRef]
  60. Breiman, L. Random Forests. Mach. Learn. 2001, 45, 5–32. [Google Scholar] [CrossRef]
  61. Hastie, T.; Tibshirani, R.; Friedman, J. The Elements of Statistical Learning, 2nd ed.; Springer: New York, NY, USA, 2009; Volume 27. [Google Scholar]
  62. Probst, P.; Wright, M.N.; Boulesteix, A.-L. Hyperparameters and Tuning Strategies for Random Forest. WIREs Data Min. Knowl. Discov. 2019, 9, e1301. [Google Scholar] [CrossRef]
  63. Beselly, S.M.; Grueters, U.; van Der Wegen, M.; Reyns, J.; Dijkstra, J.; Roelvink, D. Modelling Mangrove-Mudflat Dynamics with a Coupled Individual-Based-Hydro-Morphodynamic Model. Environ. Model. Softw. 2023, 169, 105814. [Google Scholar] [CrossRef]
  64. Dormann, C.F.; Elith, J.; Bacher, S.; Buchmann, C.; Carl, G.; Carré, G.; Marquéz, J.R.G.; Gruber, B.; Lafourcade, B.; Leitão, P.J.; et al. Collinearity: A Review of Methods to Deal with It and a Simulation Study Evaluating Their Performance. Ecography 2013, 36, 27–46. [Google Scholar] [CrossRef]
  65. Louppe, G.; Wehenkel, L.; Sutera, A.; Geurts, P. Understanding Variable Importances in Forests of Randomized Trees. In Proceedings of the Advances in Neural Information Processing Systems; Curran Associates Inc.: Red Hook, NY, USA, 2013. [Google Scholar]
  66. Belgiu, M.; Drăgu, L. Random Forest in Remote Sensing: A Review of Applications and Future Directions. ISPRS J. Photogramm. Remote Sens. 2016, 114, 24–31. [Google Scholar] [CrossRef]
  67. Cavalli, R.M. Remote Data for Mapping and Monitoring Coastal Phenomena and Parameters: A Systematic Review. Remote Sens. 2024, 16, 446. [Google Scholar] [CrossRef]
  68. Efron, B. Jackknife-After-Bootstrap Standard Errors and Influence Functions. J. R. Stat. Soc. Ser. B Stat. Methodol. 1992, 54, 83–111. [Google Scholar] [CrossRef]
  69. Thiesen, S.; Ehret, U. Assessing Local and Spatial Uncertainty with Nonparametric Geostatistics. Stoch. Environ. Res. Risk Assess. 2022, 36, 173–199. [Google Scholar] [CrossRef]
  70. Ayushi, K.; Babu, K.N.; Ayyappan, N.; Nair, J.R.; Kakkara, A.; Reddy, C.S. A Comparative Analysis of Machine Learning Techniques for Aboveground Biomass Estimation: A Case Study of the Western Ghats, India. Ecol. Inf. 2024, 80, 102479. [Google Scholar] [CrossRef]
  71. Ameca, E.I.; Nie, Y.; Wu, R.; Mittermeier, R.A.; Foden, W.; Wei, F. Identifying Protected Areas in Biodiversity Hotspots at Risk from Climate and Human-Induced Compound Events for Conserving Threatened Species. Sci. Total Environ. 2024, 938, 173192. [Google Scholar] [CrossRef] [PubMed]
  72. Dunlop, T.; Glamore, W.; Felder, S. Restoring Estuarine Ecosystems Using Nature-Based Solutions: Towards an Integrated Eco-Engineering Design Guideline. Sci. Total Environ. 2023, 873, 162362. [Google Scholar] [CrossRef]
  73. Manzano Sarabia, M.M.; Aguilar, O.G.M.; Cruz, I.C.; Arredondo, L.E.R.; Murillo, E.V.; Domínguez, M.R.; Oliva, M.A.H.; del P, M. Impacto de la Variabilidad Climática y Actividades Humanas en la Estructura de Manglares de Marismas Nacionales; Universidad Autónoma de Sinaloa. Facultad de Ciencias del Mar: Ciudad de México, México, 2023; Informe final SNIBCONABIO, proyecto No. LM019. [Google Scholar]
  74. Valdés Velarde, E.; Hernández, E.H.; Rodríguez, C.G.S.; Aguilar, J.S.Y.; Jurado, O.G.; Roblero, R.L.S.; Carrillo, C.G. Monitoreo de Carbono azul y Nutrimientos en Agua, Biomasa y Suelo en Manglares de Marismas Nacionales; Universidad Autónoma Chapingo. Centro de Agroforestería para el Desarrollo Sostenible: Ciudad de México, México, 2025; Informe Final SNIBCONABIO, proyectos No. UM002 y LM019. [Google Scholar]
  75. CONANP, CIIIE Mar Bermejo SC. Restauración Hidrológica de Manglares en El Rabón, dentro del ejido Francisco Villa, Municipio Rosamorada, Nayarit. Adaptación de Ecosistemas Costeros al Cambio Climático en Áreas Naturales Protegidas de México, con Énfasis en la Captura y Reducción de Emisiones de Carbono en Humedales; Informe Final Proyecto; Centro de Investigación e Innovación Integral Empresarial Mar Bermejo SC: Ciudad de México, México, 2017. [Google Scholar]
  76. Mutanga, O.; Kumar, L. Google Earth Engine Applications. Remote Sens. 2019, 11, 591. [Google Scholar] [CrossRef]
  77. Velazquez-Salazar, S.; Rodrıguez-Zuniga, M.T.; Alcantara-Maya, J.A.; Villeda-Chavez, E.; Valderrama-Landeros, L.; Troche-Souza, C.; Vazquez-Balderas, B.; Perez-Espinosa, I.; Cruz-López, M.I.; Ressl, R.; et al. Manglares deMexico. In Actualizacion y Analisis De Los Datos 2020; Comision Nacional para el Conocimiento y Uso de la Biodiversidad: Mexico City, Mexico, 2021; p. 168. [Google Scholar]
  78. Fan, C.; Hou, X.; Zhang, Y.; Li, D. Satellite Data Reveal Concerns Regarding Mangrove Restoration Efforts in Southern China. Remote Sens. 2023, 15, 4151. [Google Scholar] [CrossRef]
  79. Valderrama-Landeros, L.; Troche-Souza, C.; Alcántara-Maya, J.A.; Velázquez-Salazar, S.; Vázquez-Balderas, B.; Villeda-Chávez, E.; Cruz-López, M.I.; Ressl, R.; Flores-Verdugo, F.; Flores-De-Santiago, F. An Assessment of Mangrove Forest in Northwestern Mexico Using the Google Earth Engine Cloud Computing Platform. PLoS ONE 2024, 19, e0315181. [Google Scholar] [CrossRef]
  80. Lassalle, G.; Ferreira, M.P.; La Rosa, L.E.C.; de Souza Filho, C.R. Deep Learning-Based Individual Tree Crown Delineation in Mangrove Forests Using Very-High-Resolution Satellite Imagery. ISPRS J. Photogramm. Remote Sens. 2022, 189, 220–235. [Google Scholar] [CrossRef]
  81. Floriano, B.R.O.; Hanson, B.; Bewley, T.; Ishihara, J.Y.; Ferreira, H.C. A Novel Policy for Coordinating a Hurricane Monitoring System Using a Swarm of Buoyancy-Controlled Balloons Trading off Communication and Coverage. Eng. Appl. Artif. Intell. 2025, 139, 109495. [Google Scholar] [CrossRef]
  82. Herrera-Silveira, J.A.; Rico, A.C.-; Pech, E.; Pech, M.; Ramírez, J.R.-; Hernández, C.T. Carbon Dynamics (Stocks and Fluxes) in Mangroves of Mexico. Terra Latinoam. 2016, 34, 61–72. [Google Scholar]
  83. Robles-Archundia, D.A.; López-Vivas, J.M.; León-Cisneros, K.; Vargas-Betancourt, F.; Lara-Uc, M.M.; Hernández-Martínez, L.A.; Hernández-Stefanoni, J.L. Assessment of the Impact of Hurricane Lorena (2019) on the Mangrove Forest of Espiritu Santo Archipelago, Mexico Using Sentinel-2 Imagery. Rev. De. Teledetección 2025, 65, 21747. [Google Scholar] [CrossRef]
  84. Zhang, L.; Fu, H.; Wang, M.; Wang, W. Ordered Mortality of Mangroves under Extreme Flooding in a Tropical Microtidal Estuarine Lagoon in China. Estuar. Coast. Shelf Sci. 2025, 318, 109233. [Google Scholar] [CrossRef]
  85. Carol, E.; del Pilar Alvarez, M.; Candanedo, I.; Saavedra, S.; Arcia, M.; Franco, A. Surface Water–Groundwater Interactions in the Matusagaratí Wetland, Panama. Wetl. Ecol. Manag. 2020, 28, 971–982. [Google Scholar] [CrossRef]
  86. Prados, F.J.; Pérez, M.A.; De la Fuente Roselló, A.L.; MahEng, J.M.; Mosqueda, G. Assessment of the geoecological degradation of the Coastal Plain geosystem of the San Pedro River, Nayarit (Mexico). Rev. De Geogr. Norte Gd. 2025, 91. [Google Scholar] [CrossRef]
  87. Shu, S.; Yang, J.; Jing, W.; Yang, C.; Wu, J. Mangrove Extraction from Compact Polarimetric Synthetic Aperture Radar Images Based on Optimal Feature Combinations. Forests 2024, 15, 2047. [Google Scholar] [CrossRef]
  88. Evagorou, E.; Hasiotis, T.; Petsimeris, I.T.; Monioudi, I.N.; Andreadis, O.P.; Chatzipavlis, A.; Christofi, D.; Kountouri, J.; Stylianou, N.; Mettas, C.; et al. A Holistic High-Resolution Remote Sensing Approach for Mapping Coastal Geomorphology and Marine Habitats. Remote Sens. 2025, 17, 1437. [Google Scholar] [CrossRef]
  89. Tysiąc, P.; Moskalewicz, D.; Janowski, Ł. Development of UAV-Based LiDAR and Multispectral Measurement Techniques for Monitoring Sediment Intrusion in Coastal Wetlands. Measurement 2025, 253, 117459. [Google Scholar] [CrossRef]
  90. Lombard, F.; Soumaré, S.; Andrieu, J.; Josselin, D. Mangrove Zonation Mapping in West Africa, at 10-m Resolution, Optimized for Inter-Annual Monitoring. Ecol. Inf. 2023, 75, 102027. [Google Scholar] [CrossRef]
  91. Valderrama-Landeros, L.; Flores-de-Santiago, F. Assessing Coastal Erosion and Accretion Trends along Two Contrasting Subtropical Rivers Based on Remote Sensing Data. Ocean. Coast. Manag. 2019, 169, 58–67. [Google Scholar] [CrossRef]
  92. Comisión Nacional de Áreas Naturales Protegidas; The Nature Conservancy y Conselva, Costas y Comunidades AC. Programa de Adaptación al Cambio Climático del Complejo Marismas Nacionales, Nayarit y Sinaloa; Secretaría de Medio Ambiente y Recursos Naturales: Ciudad de México, Mexico, 2016. [Google Scholar]
  93. CONANP. Programa de Manejo Reserva de La Biosfera Marismas Nacionales Nayarit; CONANP: Mexico City, Mexico, 2013. [Google Scholar]
  94. Aburto-Oropeza, O.; Ezcurra, E.; Danemann, G.; Valdez, V.; Murray, J.; Sala, E. Mangroves in the Gulf of California Increase Fishery Yields. Proc. Natl. Acad. Sci. USA 2008, 105, 10456–10459. [Google Scholar] [CrossRef]
  95. Kauffman, J.B.; Adame, M.F.; Arifanti, V.B.; Schile-Beers, L.M.; Bernardino, A.F.; Bhomia, R.K.; Donato, D.C.; Feller, I.C.; Ferreira, T.O.; Jesus Garcia, M.d.C.; et al. Total Ecosystem Carbon Stocks of Mangroves across Broad Global Environmental and Physical Gradients. Ecol. Monogr. 2020, 90, e01405. [Google Scholar] [CrossRef]
  96. Chen, C.; Wu, W.; Fan, X.; Zhou, C.; Cui, T.; Wu, T.; Zhao, Q.; Jia, M. Linkage Analysis Between Coastline Change and Both Sides of Coastal Ecological Spaces. Water 2025, 17, 1505. [Google Scholar] [CrossRef]
  97. Peñaranda, P.M.L.; Cantera Kintz, J.R.; Peña Salamanca, E.J. Carbon Stocks in Mangrove Forests of the Colombian Pacific. Estuar. Coast. Shelf Sci. 2019, 227, 106299. [Google Scholar] [CrossRef]
  98. Howard, J.; Sutton-Grier, A.; Herr, D.; Kleypas, J.; Landis, E.; Mcleod, E.; Pidgeon, E.; Simpson, S. Clarifying the Role of Coastal and Marine Systems in Climate Mitigation. Front. Ecol. Environ. 2017, 15, 42–50. [Google Scholar] [CrossRef]
  99. Fan, J.; Kuang, C.; Cong, X.; Gong, L.; Wang, G.; Xing, R. Hydrodynamic Influences on Water Exchange Capacity of a Coastal Lagoon after Phasic Restoration Projects. Estuar. Coast. Shelf Sci. 2024, 299, 108671. [Google Scholar] [CrossRef]
  100. Kovacs, J.M.; Lu, X.X.; Flores-Verdugo, F.; Zhang, C.; Flores de Santiago, F.; Jiao, X. Applications of ALOS PALSAR for Monitoring Biophysical Parameters of a Degraded Black Mangrove (Avicennia germinans) Forest. ISPRS J. Photogramm. Remote Sens. 2013, 82, 102–111. [Google Scholar] [CrossRef]
  101. Valderrama-Landeros, L.; Blanco y Correa, M.; Flores-Verdugo, F.; Álvarez-Sánchez, L.F.; Flores-de-Santiago, F. Spatiotemporal Shoreline Dynamics of Marismas Nacionales, Pacific Coast of Mexico, Based on a Remote Sensing and GIS Mapping Approach. Environ. Monit. Assess. 2020, 192, 123. [Google Scholar] [CrossRef]
  102. García-Burgos, J.; Miquelajauregui, Y.; Vega, E.; Namdeo, A.; Ruíz-Olivares, A.; Mejía-Arangure, J.M.; Resendiz-Martinez, C.G.; Hayes, L.; Bramwell, L.; Jaimes-Palomera, M.; et al. Exploring the Spatial Distribution of Air Pollution and Its Association with Socioeconomic Status Indicators in Mexico City. Sustainability 2022, 14, 15320. [Google Scholar] [CrossRef]
  103. Griscom, B.W.; Adams, J.; Ellis, P.W.; Houghton, R.A.; Lomax, G.; Miteva, D.A.; Schlesinger, W.H.; Shoch, D.; Siikamäki, J.V.; Smith, P.; et al. Natural Climate Solutions. Proc. Natl. Acad. Sci. USA 2017, 114, 11645–11650. [Google Scholar] [CrossRef]
  104. Veneranta, L.; Westerbom, M. Ecology and Evolution Variation in Community Structure and Abundance of Fish in Simple Structured Shallow Sandy Habitats. Ecol. Evol. 2024, 14, e70381. [Google Scholar] [CrossRef]
  105. Sutton-Grier, A.E.; Moore, A. Leveraging Carbon Services of Coastal Ecosystems for Habitat Protection and Restoration. Coast. Manag. 2016, 44, 259–277. [Google Scholar] [CrossRef]
  106. Danemann, G.; Cordero, G.; Cortés, M.; Torrescano, C.; Valdez, V. Valor Económico de Las Pesquerías Generadas Por El Ecosistema de Manglar en Marismas Nacionales, México; Resumen Técnico de Investigación, No Publicado; Pronatura Noroeste AC: Ensenada, México, 2010. [Google Scholar]
  107. Sullivan, J.C.; Wan, Y.; Willis, R.A. Modeling Floodplain Inundation, Circulation, and Residence Time Under Changing Tide and Sea Levels. Estuaries Coasts 2020, 43, 693–707. [Google Scholar] [CrossRef] [PubMed]
  108. Tian, K.; Ma, X.-M.; Yang, W.; Bai, J.; Yin, X.-A.; Zhao, Y.-W. The Connectivity Threshold of the Wetlands Based on Water Environment Response, and a Case Study of China’s Baiyangdian Wetland. J. Hydrol. 2024, 630, 130687. [Google Scholar] [CrossRef]
  109. Flores-de-Santiago, F.; Rodríguez-Sobreyra, R.; Álvarez-Sánchez, L.F.; Valderrama-Landeros, L.; Amezcua, F.; Flores-Verdugo, F. Understanding the Natural Expansion of White Mangrove (Laguncularia racemosa) in an Ephemeral Inlet Based on Geomorphological Analysis and Remote Sensing Data. J. Environ. Manag. 2023, 338, 117820. [Google Scholar] [CrossRef]
  110. Bardou, R.; Osland, M.J.; Scyphers, S.; Shepard, C.; Aerni, K.E.; Alemu I, J.B.; Crimian, R.; Day, R.H.; Enwright, N.M.; Feher, L.C.; et al. Rapidly Changing Range Limits in a Warming World: Critical Data Limitations and Knowledge Gaps for Advancing Understanding of Mangrove Range Dynamics in the Southeastern USA. Estuaries Coasts 2023, 46, 1123–1140. [Google Scholar] [CrossRef]
Figure 1. (a) Northwestern Mexican coastal region showing the state boundaries (beige) and the Marismas Nacionales wetland complex (magenta rectangle). (b) Satellite imagery (near-infrared, red, and green bands) of Marismas Nacionales, acquired by the Sentinel-2 sensor on 28 February 2025. Yellow rectangles indicate detailed close-ups of selected representative wetlands within the complex: (c) Agua Grande Lagoon, (d) the Acaponeta River within Agua Brava Lagoon, and (e) San Blas. Green circles show the locations of the aboveground and belowground surveys.
Forests 16 01224 g001
Figure 2. Flowchart of the methodology for assessing carbon stocks in mangrove within Marismas Nacionales.
Forests 16 01224 g002
Figure 3. Field documentation of post-hurricane impacts on the mangrove structure of the study area. (a) Mangrove fringe with evident tree mortality along the water’s edge in Agua Brava Lagoon; (b) structural measurements within damaged mangrove stands showing leaning and fallen stems; (c) aerial view highlighting upper-canopy defoliation and patch degradation; (d) navigable channel bordered by defoliated and dead fringe mangroves. Photo Credits: (a,c) Francisco Flores de Santiago; (b) Alberto Alcántara Maya; (d) Berenice Vázquez.
Forests 16 01224 g003
Figure 4. Aboveground carbon distribution results. (a) AGC spatial distribution; (b) frequency histogram of AGC in the study area. Dashed red lines show Fisher-Jenks class breaks; (c) sensibility map (Mg C ha−1); and (d) uncertainty map (%).
Forests 16 01224 g004
Figure 5. Belowground carbon distribution results. (a) BGC spatial distribution; (b) frequency histogram of AGC in the study area. Dashed red lines show Fisher-Jenks class breaks; (c) sensibility map (Mg C ha−1); and (d) uncertainty map (%).
Forests 16 01224 g005
Figure 6. Spatial distribution and uncertainty of total carbon stocks in Marismas Nacionales; (a) Map of total carbon stocks (Mg C ha−1), including aboveground and belowground pools, across the mangrove landscape; (b) detail of the discharge zone of Acaponeta River into Agua Brava, showing extensive high carbon areas; (c) Southern San Blas region with high-density mangrove carbon stocks; (d) Agua Grande Lagoon in the northern sector, where carbon stocks are comparatively lower due to structural degradation; (e) Puerta de Palapares-Santa Cruz region near Cuautla Canal, highlighting degraded coastal margins with reduced carbon density.
Forests 16 01224 g006
Figure 7. (a) Spatial distribution of the relative uncertainty (%) associated with total carbon stocks estimates derived from the Random Forest model; (b) map of total absolute uncertainty, highlighting areas with the highest predictive error, particularly in transitional zones and fragmented mangrove patches where performance is less reliable.
Forests 16 01224 g007
Figure 8. Local spatial cluster of total mangrove carbon stocks in Marismas Nacionales.
Forests 16 01224 g008
Table 1. Allometric equations employed for mangrove species in the study area.
SpeciesDBH RangeAllometric EquationabReference SiteReference
Avicennia germinans1–10 log 10 y = a log 10 D B H + b 2.302−1.5852Terminos Lagoon, Mexico[52]
Avicennia germinans>10 y = a   D B H b 0.1402.4Everglades USA[53]
Laguncularia racemosa1–10 log 10 y = a log 10 D B H + b 2.192−1.5919Terminos Lagoon, Mexico[52]
Laguncularia racemosa>10 log 10 y = a log 10 D B H + b 1.930−0.441Everglades USA[54]
Rhizophora mangle1–10 log 10 y = a log 10 D B H + b 2.507−1.5605Terminos Lagoon, Mexico[52]
Rhizophora mangle>10 y = a   D B H b 0.1282.6French Guyana[53]
Conocarpus erectus>1 y = ρ e x p ( b + 1.980 ln D B H
+ 0.207   ( ln D B H ) ) 2   0.0281   ( ln D B H ) 2
-−1.349Asian Southeast[55]
Dead trees- y = π   ( D B H / 2 ) 2   H   ( 0.42 ) --Veracruz, México[56]
Note: DBH = Diameter at Breast Height (cm); H = Height (cm).
Table 2. Spatial autocorrelation (LISA) of mangrove carbon stocks.
LISA ClusterArea (km2)Carbon MetricsImplications
Study AreaProtected 1 (P%) 2Mean ± SD (Mg C ha−1)Total (Tg C)
High-High251.7217.0 (28.7%)392 ± 56.29.9Priority for C projects
Low-Low201.3132.0 (17.5%)198 ± 56.24.0Restoration potential
High-Low/Low-High201.3148.7 (19.7%)281 ± 38.95.0Buffer zone investments
Not Significant100.765.3 (8.7%)262 ± 82.72.6Limited climate leverage
TOTAL755563 (74.6%)-21.5-
1 Area (ha) within Marismas Nacionales; 2 the corresponding percentage of the area.
Disclaimer/Publisher’s Note: The statements, opinions and data contained in all publications are solely those of the individual author(s) and contributor(s) and not of MDPI and/or the editor(s). MDPI and/or the editor(s) disclaim responsibility for any injury to people or property resulting from any ideas, methods, instructions or products referred to in the content.

