Article

Comprehensive Genomic Analysis of GRAS Transcription Factors Reveals Salt-Responsive Expression Profiles in Pecan (Carya illinoinensis)

1
Shanghai Lingang Fengxian Economic Development Co., Ltd., Shanghai 201413, China
2
Institute of Botany, Jiangsu Province and Chinese Academy of Sciences, Nanjing 210014, China
3
Jiangsu Key Laboratory for Conservation and Utilization of Plant Resources, Nanjing 210014, China
4
Jiangsu Engineering Research Center for Germplasm Innovation and Utilization of Pecan, Nanjing 210014, China
*
Author to whom correspondence should be addressed.
Forests 2025, 16(7), 1199; https://doi.org/10.3390/f16071199
Submission received: 26 June 2025 / Revised: 15 July 2025 / Accepted: 18 July 2025 / Published: 21 July 2025
(This article belongs to the Special Issue Abiotic and Biotic Stress Responses in Trees Species)

Abstract

Salt stress severely limits the growth and ornamental value of pecan (Carya illinoinensis) in salinized regions, yet the transcriptional mechanisms underlying its stress adaptation remain unclear. In this study, a comprehensive genomic analysis of the GRAS transcription factor family identified 58 CiGRAS genes in pecan. These genes were classified into 11 subfamilies and showed conserved motifs and gene structures, with variation in promoter cis-elements suggesting diverse regulatory functions. Chromosomal distribution and duplication analysis indicated that whole-genome and dispersed duplication events were the main drivers of CiGRAS expansion. Transcriptome data revealed tissue-specific expression and strong responsiveness to salt and other stresses. Under 0.6% NaCl treatment, several CiGRAS genes were significantly upregulated, especially at 48 h. Gene co-expression analysis further highlighted GRAS-enriched modules associated with redox regulation and stress signaling. qRT-PCR validation confirmed time-specific induction of seven CiGRAS genes under salt stress. These findings provide insights into the evolutionary dynamics and stress-related roles of CiGRAS genes and offer candidate regulators for improving pecan salt tolerance in ecological greening and landscape applications.

1. Introduction

Pecan (Carya illinoinensis), a long-lived deciduous tree native to North America, is widely valued for both its nutritious nuts and high ornamental potential [1,2]. Beyond its role as a commercially important nut crop, pecan exhibits an elegant tree form, dense canopy, and attractive seasonal foliage, making it an ideal candidate for landscape architecture, ecological restoration, and multifunctional urban greening projects [3]. In China, pecan has been successfully introduced into multiple regions, where its dual role as an orchard and landscape tree has been widely adopted [4]. For example, in Jiangsu, Zhejiang, and Anhui provinces, pecan is planted not only for nut production but also in urban parks, roadside plantations, and institutional campuses, where it contributes to esthetic enhancement, shade provision, and biodiversity conservation [5,6]. However, the expansion of pecan in landscaping faces increasing challenges due to soil salinization, particularly in eastern and northern regions where urbanization and intensive irrigation exacerbate salt accumulation [7,8]. Salt stress significantly impairs tree establishment, leaf function, and long-term vitality, thereby reducing the landscape value and ecological service capacity of woody plants [9,10,11]. As a species with moderate sensitivity to salinity, pecan’s adaptability under such conditions is critical for ensuring its sustainability in urban green infrastructure. Despite its ecological and horticultural importance, the molecular basis of salt tolerance in pecan remains poorly understood. In particular, limited information is available regarding the transcriptional regulators involved in stress adaptation. Elucidating these regulatory mechanisms is essential for developing stress-resilient cultivars and optimizing pecan use in landscape and agroforestry systems under saline environments.
The GRAS transcription factor family is a plant-specific group known to regulate diverse physiological and developmental processes, including shoot meristem maintenance, lateral root formation, axillary bud development, and phytohormone signaling crosstalk [12,13,14,15]. The GRAS protein family is characterized by a highly conserved C-terminal GRAS domain and a diverse N-terminal region. The GRAS domain typically comprises five distinct motifs: LHRI, VHIID, LHRII, PFYRE, and SAW, which are associated with protein–protein interactions, transcriptional regulation, and signal transduction [14,16]. These motifs are highly conserved across plant species and serve as the structural basis for classifying GRAS proteins into subfamilies. Subfamily classification based on sequence similarity and phylogeny has revealed multiple lineages such as DELLA, SCL, PAT1, SHR, and SCR, many of which are functionally characterized in model plants [16,17]. These classifications aid in predicting the potential roles of uncharacterized GRAS genes in plants. With the advancement of plant genomics, the GRAS transcription factor family has been comprehensively identified and characterized in a wide range of plant species, including Arabidopsis thaliana [16], Oryza sativa [16,17], Pinus massoniana [18], Avena sativa [19], and Glycine max [20]. Although GRAS gene families have been extensively characterized in model plants and some woody species, such as poplar and citrus, comprehensive functional and evolutionary studies in long-lived nut trees like pecan are still lacking. Given pecan’s perennial nature, high ecological value, and increasing exposure to abiotic stress in cultivation, elucidating the roles of GRAS transcription factors is both timely and essential. The GRAS gene family has undergone lineage-specific expansions across plant taxa, shaped by genome duplication and adaptive evolution.
Functionally, GRAS proteins act as integrators of environmental cues and endogenous signals. They participate in gibberellin and auxin signaling pathways [21,22]. Increasing evidence has also pointed to GRAS family members as critical players in abiotic stress tolerance, particularly under salt, drought, and cold stress [23,24,25]. For instance, AtSCL14 enhances detoxification under oxidative stress [26], and OsGRAS23 in rice confers tolerance to drought and salinity [24]. However, despite the known significance of GRAS transcription factors in stress regulation and development, little is known about this gene family in pecan, a perennial tree with high ecological and agronomic value. Particularly, the expression behavior and regulatory role of GRAS genes under salt stress in pecan remain largely unexplored.
In this study, we conducted a comprehensive genome-wide analysis of the GRAS gene family in pecan based on the high-quality ‘Pawnee’ reference genome. A total of 58 CiGRAS genes were identified and systematically characterized in terms of their phylogenetic relationships, conserved motifs, gene structures, chromosomal distribution, cis-regulatory elements, and gene duplication events. Expression profiles across various tissues and under abiotic and biotic stresses were analyzed using publicly available transcriptomic datasets. To further explore their functional involvement in salt stress response, we employed weighted gene co-expression network analysis (WGCNA) to identify CiGRAS-enriched modules using transcriptome data from salt-treated seedlings. Genes within DEG-enriched modules were subjected to GO enrichment analysis, and representative GRAS genes were selected for qRT-PCR validation under salt stress conditions. Together, our study provides a systematic insight into the evolution, structure, and stress-related expression of GRAS genes in pecan. These findings lay the foundation for future functional characterization and molecular breeding of stress-resilient pecan cultivars.

2. Materials and Methods

2.1. Identification of GRAS Family Genes in Pecan

The genomic and protein sequence data of Carya illinoinensis cultivar ‘Pawnee’ were retrieved from the Phytozome database (https://phytozome-next.jgi.doe.gov, accessed on 5 April 2025) [27]. To comprehensively identify GRAS family members in the pecan genome, a dual approach combining Hidden Markov Model (HMM) domain searches and homology-based sequence comparison was employed. The conserved GRAS domain (PF03514) was obtained from the InterPro database (https://www.ebi.ac.uk/interpro/, accessed on 5 April 2025) and used as a query in HMMER 3.0 to screen the pecan protein dataset with default parameters. Candidate CiGRAS sequences identified through both methods were further verified for the presence of the conserved GRAS domain using Pfam and SMART databases via InterPro. To ensure reliability, we excluded any redundant entries, partial sequences, or proteins with incomplete GRAS domains, as such features may indicate pseudogenes or misannotations. In parallel, a TBLASTN search was performed using 33 representative GRAS protein sequences [16] from Arabidopsis thaliana as queries against the pecan genome, with an E-value cutoff of 1 × 10⁻¹⁰ to ensure stringent homology detection. Candidate CiGRAS sequences identified through both methods were further verified for the presence of the GRAS domain using Pfam and SMART analyses integrated in InterPro. Redundant or truncated sequences were manually filtered out. The physicochemical properties of each predicted GRAS protein, including molecular weight (MW) and theoretical isoelectric point (pI), were calculated using the Sequence Manipulation Suite (SMS 2.0) (http://www.bioinformatics.org/sms2/, accessed on 5 April 2025). Subcellular localization predictions were conducted using the WoLF PSORT server (https://wolfpsort.hgc.jp, accessed on 5 April 2025), aiding in the functional annotation of candidate proteins.

2.2. Phylogenetic and Structural Characterization of CiGRAS Genes

To investigate the evolutionary relationships among GRAS family members in Carya illinoinensis, multiple sequence alignments of full-length CiGRAS protein sequences were performed using MAFFT. A phylogenetic tree was constructed using the maximum likelihood (ML) method implemented in MEGA 7.0 [28], employing the Jones–Taylor–Thornton (JTT) model with 1000 bootstrap replications to ensure statistical robustness. The resulting tree was annotated and visualized using the Interactive Tree of Life (iTOL) platform (https://itol.embl.de/, accessed on 5 April 2025), with subgroup classification based on homology to Arabidopsis thaliana GRAS proteins [16]. To analyze conserved sequence features, MEME Suite v5.5.0 was used to identify recurring motifs among the CiGRAS proteins, with the maximum number of motifs set to 20 and other parameters kept at default. Detected motifs were annotated by comparison to known functional domains using InterProScan v5.57-90.0, which integrates both Pfam and SMART domain databases. The exon–intron structures of CiGRAS genes were determined by aligning genomic and coding sequences extracted from the genome annotation file. Gene structure visualization, including the arrangement of untranslated regions (UTRs), coding sequences (CDS), and introns, was conducted using TBtools v2.225 [29], providing insight into structural conservation within phylogenetic subgroups.

2.3. Promoter Cis-Element Analysis

The 2000 bp upstream sequences of CiGRAS genes were retrieved and analyzed using PlantCARE (http://bioinformatics.psb.ugent.be/webtools/plantcare/html/, accessed on 6 April 2025) for cis-regulatory elements. Identified elements were classified into three functional categories (growth/development, hormone response, stress response). Positional distribution and enrichment patterns were visualized using Tbtools v2.225.

2.4. Chromosomal Distribution and Duplication Analysis

The genomic positions of CiGRAS genes were extracted from the Carya illinoinensis genome annotation file (GFF3 format), and their physical distribution along chromosomes was visualized using the MG2C v2.1 web server (http://mg2c.iask.in/mg2c_v2.1/, accessed on 6 April 2025). Chromosome number, gene ID, and start/end coordinates were used to map the gene loci. To explore the evolutionary origin and duplication history of the CiGRAS gene family, genome-wide collinearity and synteny analyses were conducted. BLASTP searches (E-value < 1 × 10⁻⁵) were first performed among the pecan protein sequences to identify homologous gene pairs, retaining the top five hits. MCScanX v1.0 was then applied to detect collinear blocks and construct intra-genomic synteny relationships [30]. For detailed classification of duplication modes, DupGen_finder v1.0 was utilized to categorize gene pairs into five types: whole-genome duplication (WGD), tandem duplication (TD), proximal duplication (PD), transposed duplication (TRD), and dispersed duplication (DSD) [31]. These categories reflect the mechanisms contributing to gene family expansion.

2.5. Calculating Values of Ka, Ks and Ka/Ks

To further understand the selection pressure acting on duplicated CiGRAS genes, nonsynonymous (Ka) and synonymous (Ks) substitution rates and their ratio (Ka/Ks) were calculated using KaKs_Calculator 2.0. Only gene pairs with valid alignment lengths and sufficient sequence identity were retained for evolutionary rate estimation. Ka/Ks values were used to infer whether gene pairs evolved under purifying (Ka/Ks < 1), or positive selection (Ka/Ks > 1) [32].

2.6. Expression Pattern Analysis in Tissues and Stress Conditions

To characterize the spatial and stress-induced expression patterns of Carya illinoinensis GRAS genes, publicly available RNA-seq datasets were retrieved from the NCBI Sequence Read Archive (SRA). Expression profiles across multiple tissues—including leaf, root, stem, seed, fruit, male flower, and female flower—were obtained from BioProject PRJNA799663 [33]. For stress-related expression analysis, RNA-seq data (PRJNA589673, PRJNA743302, PRJNA767196, and PRJNA894234) from pecan seedlings subjected to salt stress, drought stress, cold treatment, and Colletotrichum fioriniae infection were used [10,33,34]. Raw RNA-seq data were processed following the pipeline described by Wang et al. (2024) [11]. Raw RNA-seq reads were first quality-checked using FastQC v0.11.9 and trimmed using Trimmomatic v0.39 to remove adapters and low-quality bases. Clean reads were then aligned to the Carya illinoinensis reference genome using HISAT2 (v2.2.1) with default parameters. Gene-level counts were calculated with featureCounts v2.0.1, and expression values were normalized as reads per kilobase of transcript per million mapped reads (RPKM). Genes were considered significantly differentially expressed if they met the criteria of |log2 fold change| > 1 and adjusted p-value < 0.05. Each stress condition and tissue type included at least three biological replicates per time point. Genes with low expression (RPKM < 1) were excluded from heatmap visualization. Log2RPKM expression values were used for downstream visualization. Heatmaps and bubble plots were generated using TBtools v2.225 and the Seaborn library in Python v3.9, respectively.

2.7. Weighted Gene Co-Expression Network Analysis (WGCNA)

The gene expression data used for WGCNA were partially retrieved from the NCBI Sequence Read Archive (SRA) database (PRJNA589673) [10]. In brief, pecan seedlings (‘Pawnee’) were cultivated under controlled greenhouse conditions for 45 days and then subjected to 0%, 0.3%, and 0.6% (w/v) NaCl treatments. Each treatment included three biological replicates, and each replicate consisted of 15 uniform seedlings. Fully expanded leaves from five seedlings per replicate were sampled at 8, 24, and 48 h post-treatment for transcriptomic analysis. Transcript abundance was quantified as Transcripts Per Kilobase Million (TPM), and genes with TPM ≥ 2 and median absolute deviation (MAD) ≥ 1 across all samples were retained for network construction. Weighted gene co-expression network analysis was performed using the WGCNA package (v1.71) in R (v4.3.1). A signed, unsigned type network was built with the following parameters: soft-thresholding power: 12; networkType: “unsigned”; TOMType: “unsigned”; minModuleSize: 100; mergeCutHeight: 0.25. Modules were identified through hierarchical clustering and dynamic tree cutting. Genes within the same module exhibit high topological overlap and similar expression patterns. For visualization, heatmaps of key modules were generated using the pheatmap R package after row-wise Z-score normalization. Gene Ontology (GO) annotation was performed based on the reference genome of Carya illinoinensis (cv. Pawnee) using associated GFF and annotation files.

2.8. Quantitative Real-Time PCR (qRT-PCR) Validation

One-year-old ‘Pawnee’ pecan seedlings were grown under standardized chamber conditions (16/8 h light/dark cycle, ~300 μmol m−2 s−1 light intensity, 24 ± 1 °C, 60% humidity) at the Institute of Botany, Jiangsu Province and Chinese Academy of Sciences. At the time of treatment, seedlings were approximately 30–40 cm in height. Seedlings were grown in pots filled with a commercial peat-based substrate (pH ~6.0, EC ~0.5 dS m−1), 200 mM NaCl was applied via nutrient solution to simulate salt stress, and leaves were sampled at 0, 6, 12, and 24 h. Under 200 mM NaCl treatment, visible leaf wilting symptoms appeared after 24 h, confirming that the stress condition was sufficient to induce measurable physiological responses while maintaining overall plant viability for sampling. Total RNA was extracted using the RNAprep Pure Plant Kit (Tiangen Biotech, Beijing, China) following the manufacturer’s protocol. Gene-specific primers were designed for seven CiGRAS genes, and CiACTIN was used as the internal control, based on prior validation of its stable expression in pecan. The primer sequences are listed in Supplementary Table S1. qRT-PCR was performed using a LightCycler 480 (Roche, Basel, Switzerland) and using SYBR Green chemistry with three biological replicates per time point and three technical replicates per gene. The relative expression levels were calculated using the 2−ΔΔCt method. The statistical significance of expression differences was assessed by one-way ANOVA with Tukey’s HSD test (p < 0.05) in SPSS v26. The experimental procedures followed the protocol described by Wang et al. (2025) [35].

3. Results

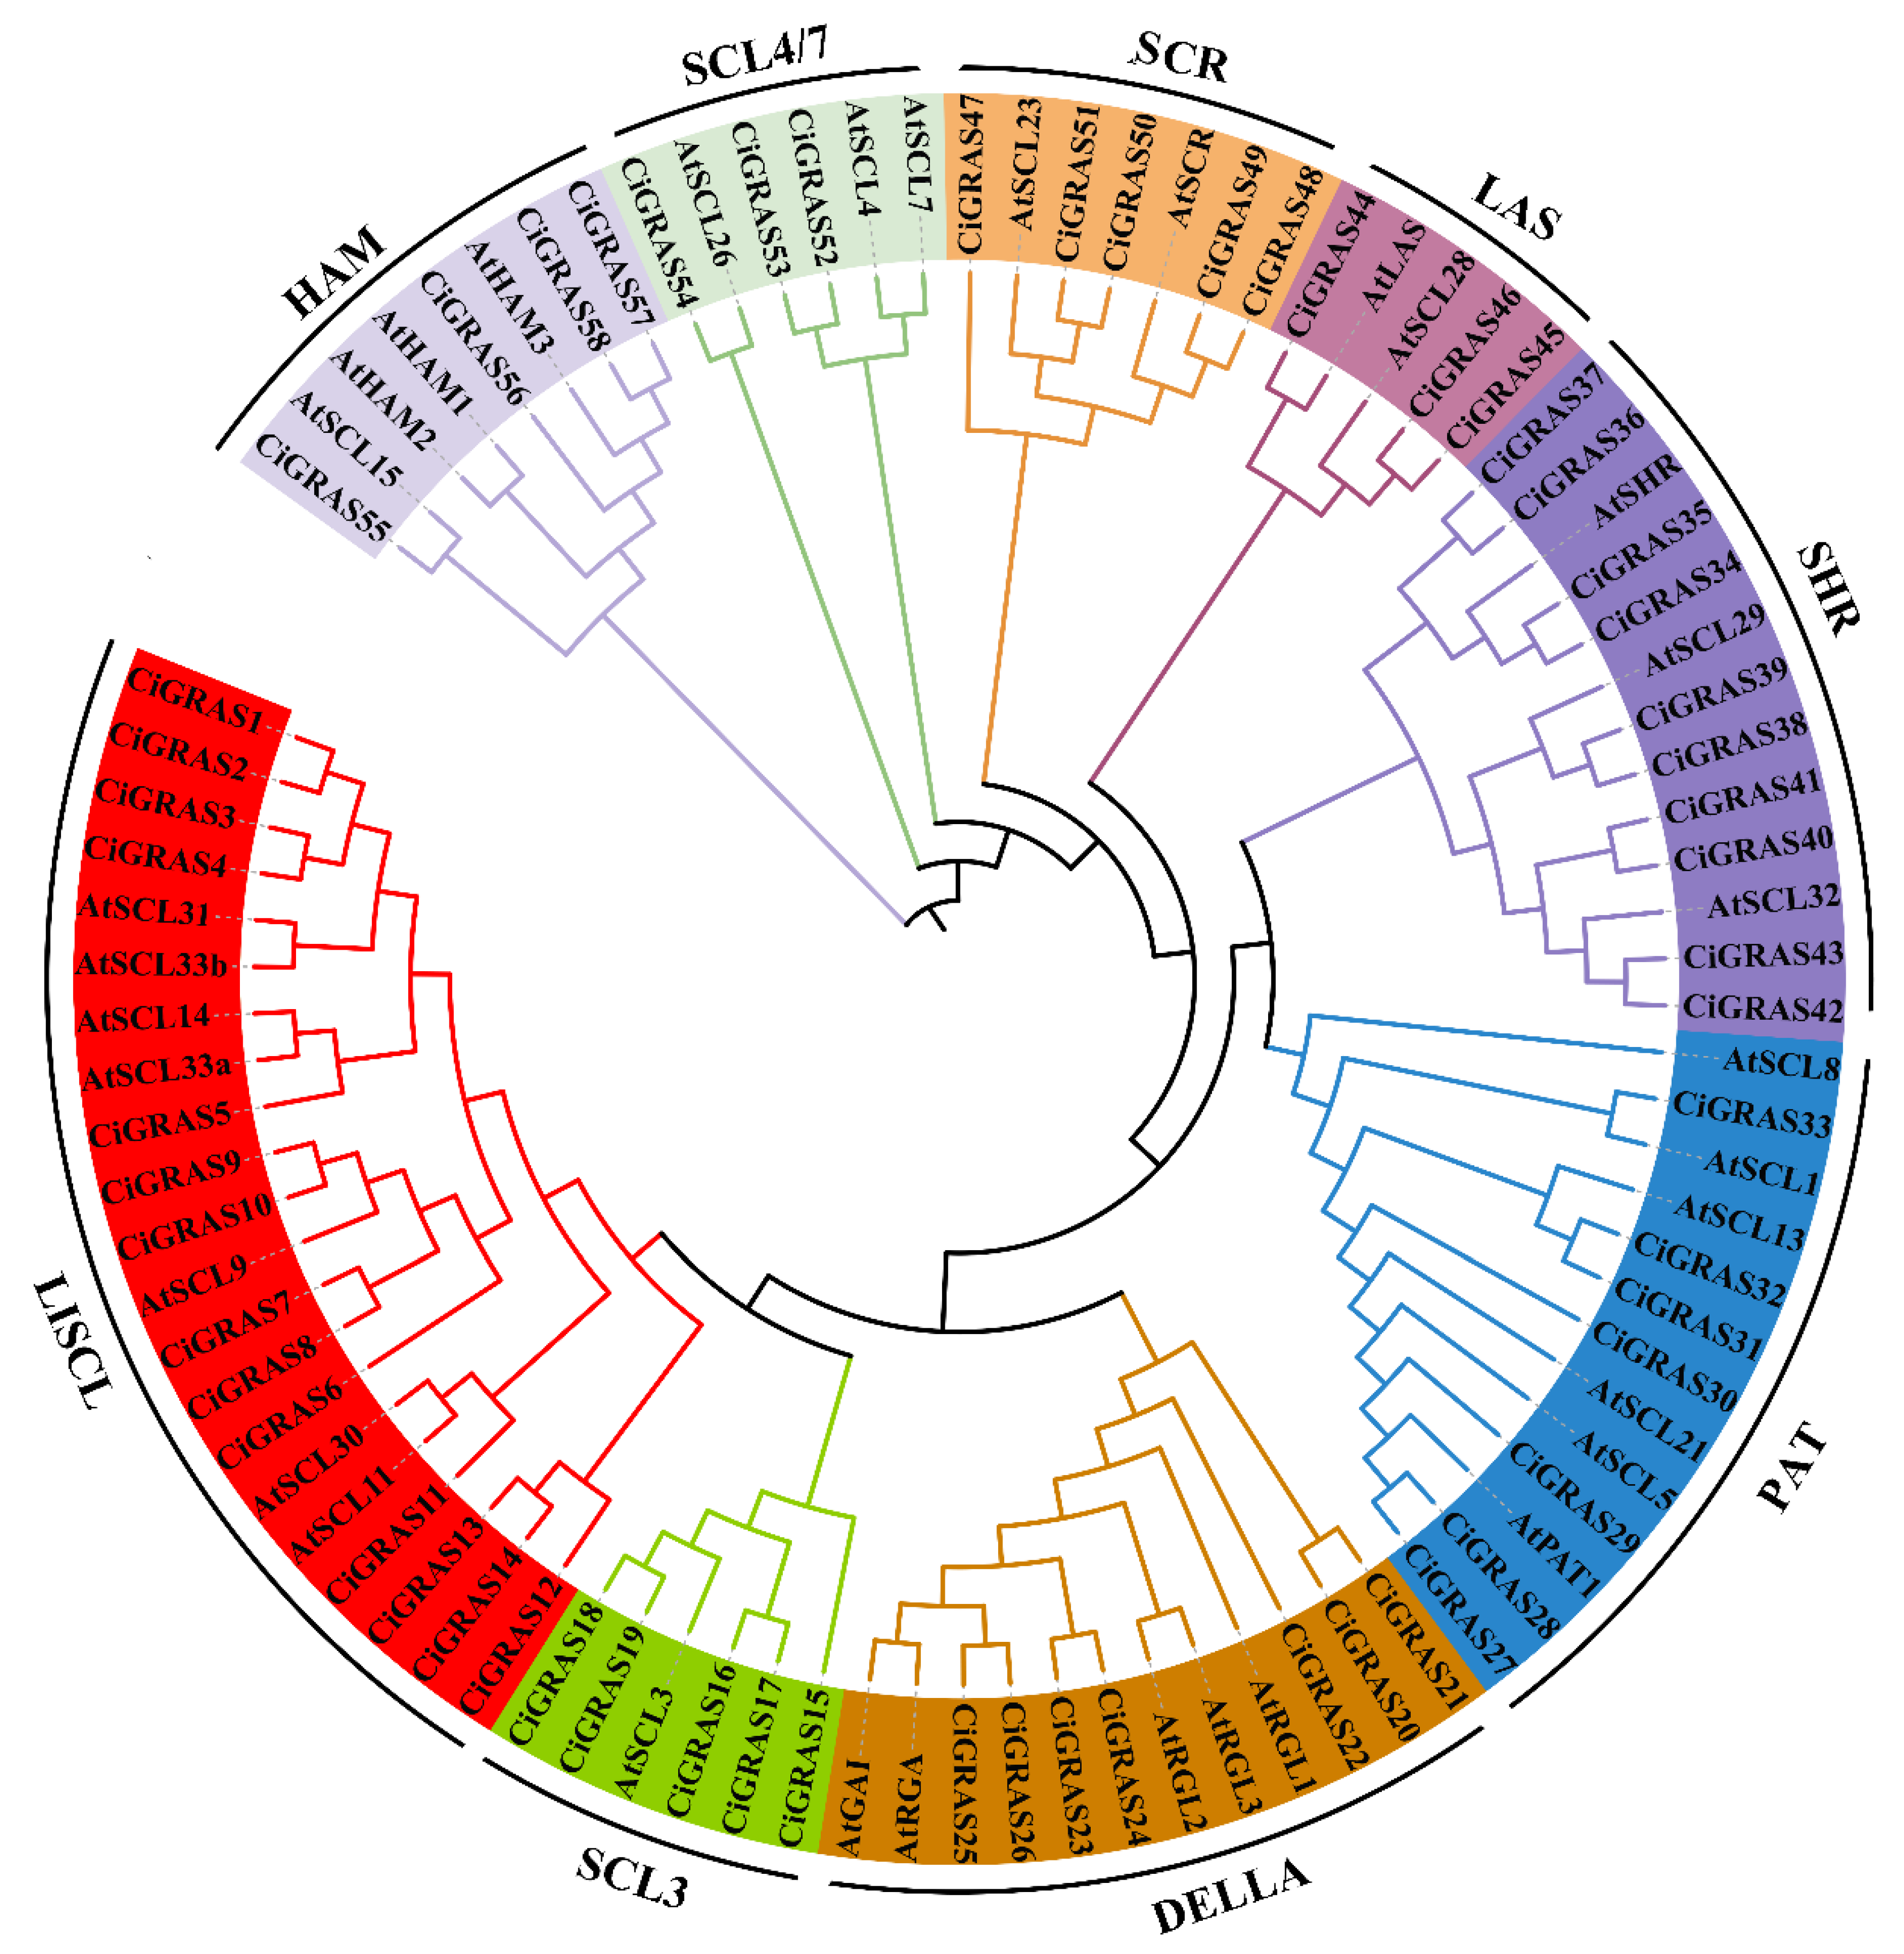
3.1. Identification and Phylogenetic Analysis of Carya illinoinensis GRAS Genes

A total of 58 GRAS genes were identified from the pecan (Carya illinoinensis) reference genome using BLASTP and HMMER-based domain search for the conserved GRAS domain (PF03514). These genes were designated as CiGRAS1 to CiGRAS58 and are listed in Supplementary Table S2. Each gene was annotated with detailed characteristics, including gene ID, subgroup classification, chromosomal location, gene length, isoelectric point (pI), molecular weight (MW), and predicted subcellular localization (Supplementary Table S2). The predicted CiGRAS proteins ranged in size from 43.38 to 88.89 kDa, with isoelectric points (pI) varying between pH 4.61 and pH 8.42. This variation may be associated with differences in amino acid composition and could reflect functional diversity among CiGRAS proteins. Subcellular localization prediction indicated that most CiGRAS proteins are localized to the nucleus, which is consistent with their roles as transcription factors. However, a few members were also predicted to localize to other compartments such as the chloroplast or cytoplasm (Supplementary Table S2), suggesting potential functional diversification beyond canonical nuclear activity. To understand the evolutionary relationships of CiGRAS proteins, a maximum likelihood phylogenetic tree was constructed based on multiple sequence alignment of 58 CiGRAS proteins along with 33 Arabidopsis GRAS proteins. These GRAS members were classified into nine subgroups, namely DELLA, PAT1, LISCL, HAM, SCR, SHR, SCL3, LAS, and DLT (Figure 1), following previously reported classification criteria [16]. Among them, the LISCL subgroup was the largest, containing 14 CiGRAS members, suggesting potential functional expansion in pecan. In contrast, the SCL4/7 subgroup was represented by only three CiGRAS members, indicating limited diversification. These findings lay the foundation for subsequent structural, evolutionary, and functional analyses of CiGRAS genes in pecan.

3.2. Structural and Conserved Motif Analysis of CiGRAS Genes

To further explore the evolutionary conservation and structural features of the GRAS gene family in pecan, a total of 58 CiGRAS genes were analyzed for phylogenetic relationships, conserved domains, motifs, and gene structures (Figure 2). A phylogenetic tree was constructed using full-length amino acid sequences of 58 CiGRAS proteins (Figure 2A). Members of the same subgroup exhibited similar motif compositions and gene structures. PFAM domain analysis revealed that all CiGRAS proteins contained the conserved GRAS domain, while some members harbored additional domain such as DELLA (Figure 2B). MEME analysis identified 20 conserved motifs across CiGRAS proteins (Figure 2C). Most motifs were shared among multiple subgroups, particularly motifs 2, 4, and 7, which were widely distributed across GRAS members, suggesting evolutionary conservation. Although most CiGRAS proteins share a conserved GRAS domain with five common motifs, considerable variability exists in their N-terminal regions, phylogenetic groupings, and expression profiles. These distinctions suggest functional divergence despite structural similarity and likely reflect subfunctionalization or neofunctionalization following gene duplication. Gene structure analysis showed that the majority of CiGRAS genes had few introns, with over half of them being intronless or containing only one intron (Figure 2D). Members within the same subgroup often displayed conserved exon–intron architectures. These results indicate that the CiGRAS gene family is evolutionarily conserved at both the protein and gene structure levels, particularly within subgroups, supporting their potentially conserved functional roles in pecan development and stress response.

3.3. Chromosomal Distribution of CiGRAS Genes

To investigate the genomic distribution of GRAS genes in pecan, the chromosomal locations of all 58 CiGRAS genes were mapped based on their physical positions in the reference genome (Figure 3). The genes were unevenly distributed across 16 chromosomes, indicating possible segmental duplication or evolutionary divergence. The highest number of eight CiGRAS genes was located on Chr01 and Chr13, followed by Chr03, containing seven GRAS genes. In contrast, Chr 5, 7, 8, and 10 harbored only one CiGRAS gene each. No GRAS genes were found on Chr16. These findings provide a basis for further exploring the genomic organization and evolutionary dynamics of CiGRAS genes.

3.4. Promoter Cis-Element Analysis of CiGRAS Genes

To gain insights into the transcriptional regulation potential of CiGRAS genes under stress and hormonal signals, cis-regulatory elements within the 2000 bp upstream promoter regions of all 58 CiGRAS genes were identified and categorized into three major functional groups: growth and development, hormone responsiveness, and stress responsiveness (Figure 4). A heatmap was generated to visualize the abundance of each element category across genes (Figure 4A). The number of elements identified per category is indicated in each cell, with color intensity reflecting their relative abundance. Several CiGRAS genes, such as CiGRAS2, CiGRAS22, and CiGRAS58, contained notably high numbers of hormone- and stress-related elements, suggesting potential roles in abiotic response signaling. Growth-related elements, particularly light-responsive motifs, were widely distributed but varied considerably among genes. Further analysis localized these cis-elements along the 2000 bp upstream promoter regions of each CiGRAS gene (Figure 4B), revealing their non-random positional distribution. Notably, abscisic acid response, MeJA response, low temperature, and wounding were observed in clusters in many promoters, suggesting their potential responsiveness to multiple environmental signals. These findings indicate that CiGRAS genes possess diverse and functionally relevant regulatory motifs, supporting their involvement in hormone-mediated and stress-induced transcriptional pathways.

3.5. Gene Duplication Events and Evolutionary Analysis of CiGRAS Genes

To investigate the evolutionary expansion of the GRAS gene family in pecan, gene duplication events were identified based on collinearity and chromosomal mapping. A total of 94 duplicated CiGRAS gene pairs were classified into four duplication types: 48 pairs resulted from dispersed duplication (DSD), 40 from whole-genome duplication (WGD), five from tandem duplication (TD), and one from transposed duplication (TRD) (Figure 5A and Supplementary Table S3). These results suggest that WGD and DSD mechanisms have contributed to the expansion of the GRAS gene family in pecan. To assess the selective pressure acting on duplicated gene pairs, Ka (nonsynonymous), Ks (synonymous), and Ka/Ks ratios were calculated (Figure 5B). The majority of CiGRAS gene pairs exhibited Ka/Ks values less than 1, indicating that they have mainly undergone purifying selection, preserving their functional integrity during evolution. These results highlight that duplication and divergence have played key roles in shaping the evolution and expansion of GRAS transcription factors in the pecan genome.

3.6. Tissue-Specific Expression Patterns of CiGRAS Genes

To explore the potential functional roles of CiGRAS genes in different developmental contexts, we analyzed their expression profiles in seven pecan tissues using publicly available RNA-seq data. These include leaf, root, stem, seed, fruit, male flower, and female flower (Figure 6 and Supplementary Table S4). The expression data were visualized using a bubble plot, where the size of each bubble represents the gene’s log2(RPKM) expression level and the color intensity indicates the gene’s relative expression within each tissue. This approach enables simultaneous assessment of both absolute and comparative expression patterns. Most CiGRAS genes exhibited broad expression across most tissues indicating their potential involvement in general growth and development. Notably, CiGRAS4 showed strong expression in root and male floral tissue, suggesting dual roles in root development and reproductive function. CiGRAS11 and CiGRAS58 exhibited moderate to high expression in multiple tissues, with particularly high expression in female floral organs, indicating potential roles in flower organogenesis. CiGRAS31 and CiGRAS33 were prominently expressed in seed and stem, respectively, supporting tissue-specific specialization. CiGRAS32 displayed moderate expression across all tissues but did not show clear dominance in any one organ, suggesting it may be regulated in a temporary or stress-inducible manner. Overall, the spatial expression diversity of CiGRAS genes suggests that this family participates in a broad range of developmental and organ-specific functions in pecan.

3.7. Expression Profiles of CiGRAS Genes Under Abiotic and Biotic Stresses

To investigate the potential roles of CiGRAS genes in stress responses, we analyzed their expression patterns under four conditions: salt, drought, cold, and infection by Colletotrichum fioriniae, based on publicly available transcriptome datasets (PRJNA589673, PRJNA743302, PRJNA767196, and PRJNA894234) (Figure 7 and Supplementary Table S5). Under salt stress, Seedlings were treated with either 0.3% or 0.6% NaCl, and leaf tissues were sampled at 8 h, 24 h, and 48 h. 0.3% NaCl treatment induced only subtle transcriptional changes, with no CiGRAS genes showing significant differential expression across the sampled time points (8, 24, and 48 h). Therefore, subsequent expression and network analyses focused on the 0.6% NaCl treatment, which elicited stronger and more consistent gene expression changes. Specifically, 10 CiGRAS genes (CiGRAS2, CiGRAS4, CiGRAS8, CiGRAS11, CiGRAS22, CiGRAS31, CiGRAS32, CiGRAS33, CiGRAS35, and CiGRAS42) were significantly upregulated at 48 h under 0.6% salt stress. Among them, CiGRAS2 showed early upregulation at 8 h, and CiGRAS42 exhibited a peak expression at 24 h, indicating different temporal response patterns. Conversely, 6 genes (CiGRAS45, CiGRAS46, CiGRAS48, CiGRAS49, CiGRAS58, and CiGRAS37) were significantly downregulated at 48 h, suggesting possible negative roles or transcriptional repression under prolonged salt exposure. During drought stress, several CiGRAS genes, including CiGRAS2, CiGRAS11, and CiGRAS31, exhibited progressive upregulation at later stages, implying their roles in sustained water deficit adaptation. In contrast, genes such as CiGRAS45 and CiGRAS58 showed either weak or decreasing expression trends. In response to cold treatment, most CiGRAS genes remained relatively stable, though a few, such as CiGRAS22 and CiGRAS42, displayed modest induction, suggesting involvement in early cold signal transduction. Upon infection with Colletotrichum fioriniae, dynamic and gene-specific responses were observed. CiGRAS8 and CiGRAS35 showed early induction followed by suppression, whereas CiGRAS4 and CiGRAS58 remained consistently downregulated, indicating differential regulatory roles in biotic stress. Collectively, these results demonstrate that CiGRAS genes exhibit distinct and stress-specific transcriptional responses, with certain members showing early activation, while others are tightly suppressed under prolonged or pathogen-induced stress, highlighting their potential involvement in complex stress signaling pathways.

3.8. Co-Expression Network Analysis Reveals GRAS Gene-Enriched Functional Modules

To uncover regulatory modules associated with salt stress responses in pecan, WGCNA was conducted using transcriptomic data from NCBISRA project PRJNA589673. This dataset included six representative treatments (CK-8 h, 0.6%-Salt-8 h, CK-24 h, 0.6%-Salt-24 h, CK-48 h, and 0.6%-Salt-48 h). A total of 13,229 genes (TPM ≥ 2 and MAD ≥ 1) were used to construct a signed co-expression network with a soft-thresholding power of 12. Hierarchical clustering identified 12 modules, among which the green, brown, and red modules were enriched with DEGs (Figure 8A). Notably, 10 CIGRAS genes were found distributed across three modules, namely green module (CiGRAS2, CiGRAS8, CiGRAS11, CiGRAS22, CiGRAS31, CiGRAS32, and CiGRAS33), green module (CiGRAS35 and CiGRAS48), and red module (CiGRAS58). To better visualize the expression dynamics of these DEG-enriched modules, a heatmap was generated showing the expression profiles of genes within the green, brown, and red modules across salt treatment (Figure 8B and Supplemental Table S6). These GRAS genes exhibited distinct expression patterns under salt treatment, suggesting that they participate in coordinated transcriptional responses during early and late salt stress. GO enrichment analysis of these modules revealed predominant functional categories related to oxidation-reduction process, protein phosphorylation, ATP binding, DNA binding, and defense response (Figure 8B and Supplemental Table S6). Among them, the green module harbored the majority of GRAS genes and was enriched in genes related to protein binding, oxidation-reduction process, and transcriptional regulation. The brown and red modules also contained GRAS genes co-expressed with components of signaling, transport, and oxidative stress pathways. These findings indicate that members of the GRAS gene family are not only responsive to salt stress but also potentially serve as regulatory hubs in stress-related transcriptional networks.

3.9. qRT-PCR Validation of Selected Salt-Responsive CiGRAS Genes Under NaCl Treatment

To validate the transcriptomic data and assess the temporal expression dynamics of salt-responsive CiGRAS genes, seven differentially expressed genes (CiGRAS2, CiGRAS8, CiGRAS11, CiGRAS22, CiGRAS31, CiGRAS32, and CiGRAS33) were selected from the green co-expression module for qRT-PCR analysis under NaCl treatment. All seven tested CiGRAS genes exhibited a rapid transcriptional upregulation in response to NaCl treatment, with expression induction observed at different time points (6, 12, or 24 h) (Figure 9), confirming their salt responsiveness observed in RNA-seq analysis. CiGRAS2 was the only gene that did not show significant upregulation at 6 h, indicating a delayed or weaker response to early salt stress. The qRT-PCR results were consistent with the transcriptomic expression patterns, supporting the reliability of the co-expression network analysis and confirming that these blue module GRAS genes are involved in the transcriptional response to salt stress in pecan.

4. Discussion

As pivotal regulators in plants, GRAS transcription factors orchestrate diverse developmental programs and signaling interactions, ranging from meristem identity to hormone-mediated growth control [12,13,14,15]. GRAS proteins typically contain a conserved C-terminal GRAS domain comprising five motifs, which mediate protein–protein interactions, DNA binding, and transcriptional regulation [14,16]. Consistent with previous findings in Arabidopsis, rice, and poplar [16,36], the MEME motif analysis revealed that most CiGRAS members retained these core conserved motifs, supporting their structural and functional conservation (Figure 2). However, variability in the N-terminal region and the absence of certain motifs in some subfamilies suggest potential functional divergence within the family. Gene structure analysis further demonstrated that the majority of CiGRAS genes possess zero or one intron (Figure 2D), a feature widely observed in other plant GRAS families [17,18,19,20]. To explore the transcriptional regulation of CiGRAS genes, we analyzed cis-regulatory elements within the 2000 bp upstream promoter regions. A total of 18 functional categories were identified, mainly associated with growth, hormone response, and abiotic stress (Figure 4A). Notably, stress-responsive elements such as abscisic acid response, MeJA response, low temperature, and wounding response were abundantly enriched in CiGRAS promoters, suggesting their potential responsiveness to multiple environmental signals [23,25]. These findings indicate that CiGRAS genes are likely regulated by a complex network of environmental and endogenous signals and may function as integrative hubs in stress-related transcriptional pathways.
Gene duplication is a fundamental force in plant genome evolution, providing raw genetic material for functional innovation and diversification [31,37]. Several types of duplication, including WGD, DSD, TD, PD, and TRD, have contributed to the expansion of transcription factor families in angiosperms [31,37]. In the current study, we observed that WGD and DSD events were the predominant drivers of the CiGRAS gene family’s expansion in Carya illinoinensis (Figure 5A), which is consistent with duplication patterns reported in other gene family in pecan, such as PYL, PP2C, SnRK, and CDPK [11,35]. Among the 58 identified CiGRAS genes, 48 pairs were derived from DSD and 40 from WGD, while only a few arose from TD and TRD (Figure 5A). These gene duplication events may facilitate functional specialization, allowing certain CiGRAS genes to become more tailored to specific tissues or environmental signals. In perennial tree species like pecan, which must cope with long-term environmental fluctuations, such diversification of regulatory genes could enhance developmental flexibility and stress resilience. This pattern may not be unique to pecan, as similar diversification through duplication is likely common among woody perennials, contributing to their complex adaptive strategies. To further explore the evolutionary pressure on duplicated genes, we calculated the Ka and Ks substitution rates. All gene pairs exhibited Ka/Ks values less than 1 (Figure 5B), indicating that purifying selection has acted to maintain the functional integrity of GRAS proteins following duplication. This pattern is consistent with previous studies showing conserved roles of GRAS members in plant development and stress responses [23,24,25]. Collectively, these findings indicate that the expansion of the CiGRAS gene family in pecan was primarily driven by WGD and DSD events under purifying selection, which has allowed the retention of core GRAS functions while enabling diversification to support pecan’s environmental adaptability.
Tissue-specific expression patterns provide valuable insights into the functional differentiation of gene family members. In this study, expression profiling across six representative tissues—fruits, roots, male flowers, female flowers, leaves, and seeds—revealed that CiGRAS genes exhibit divergent spatial expression, suggesting subfunctionalization or neofunctionalization of duplicated genes (Figure 6). For instance, CiGRAS4 exhibited strong expression in roots and male flowers. This is reminiscent of the functional role of the SHORT-ROOT (SHR) gene in Arabidopsis, which regulates root radial patterning and stem cell maintenance. Similarly, the enriched expression of CiGRAS58 in floral tissues suggests a potential role in reproductive organ development, possibly analogous to GRAS genes involved in floral meristem or gibberellin signaling pathways in other species. Given that pecan is a monoecious species bearing separate male and female flowers on the same individual, the sex-biased expression of certain CiGRAS genes may reflect their involvement in sex-specific floral development. This observation is consistent with reports in other monoecious plants where transcription factors show organ-preferential expression patterns that coordinate distinct floral morphogenesis. Thus, these CiGRAS genes may contribute to pecan’s reproductive strategy by mediating the developmental programming of male and female floral organs. These findings are in line with tissue-specific expression patterns reported in other species like tomato, citrus, and soybean, where GRAS genes participate in organ-specific regulatory programs [20,38,39]. Under abiotic and biotic stresses, the expression of CiGRAS genes displayed strong induction or repression, particularly under salt, drought, cold, and Colletotrichum fioriniae infection (Figure 7). Notably, 10 CiGRAS genes were significantly upregulated in response to 0.6% NaCl, especially at 48 h post-treatment, indicating sustained activation during prolonged salt exposure. Similar stress-responsive behaviors have been observed in GRAS homologs such as OsGRAS23 in rice and AtSCL14 in Arabidopsis, which mediate tolerance to salinity, drought, or oxidative stress through transcriptional reprogramming [24,26]. Furthermore, several CiGRAS genes showed concurrent responsiveness to multiple stress conditions, implying that they may serve as key integrators in cross-stress signaling networks [14,15]. Taken together, these expression data suggest that CiGRAS genes have undergone functional diversification and play pivotal roles in both tissue development and environmental adaptation. Their distinct spatiotemporal expression patterns under stress conditions highlight potential candidates for further functional characterization and breeding of stress-tolerant pecan varieties. Although the transcriptional evidence suggests a potential role for CiGRAS genes in salt stress response, direct functional validation through gene knockout or overexpression remains to be conducted. Due to the technical limitations in stable transformation of woody perennials like pecan, future studies may consider heterologous systems or transient expression assays to confirm the regulatory roles of these genes.
WGCNA has emerged as a powerful approach to identify transcriptional modules responsive to environmental cues, especially under complex stress conditions like salinity [40,41]. In this study, co-expression network construction based on salt-treated transcriptome data revealed modular structures in the pecan transcriptome, reflecting coordinated gene regulation during salt stress adaptation. Although each module contained a variety of enriched GO terms, we highlighted representative biological functions to summarize their core roles, such as ROS-regulation (green), signaling and ion transport (brown), and defense and hormone response (red). Notably, three modules—green, brown, and red—were significantly enriched in differentially expressed genes and harbored multiple CiGRAS genes, indicating that GRAS transcription factors are functionally embedded within core stress-responsive networks. The concentration of seven CiGRAS genes in the green module, in particular, suggests a non-random, possibly conserved regulatory role. The application of WGCNA in pecan has previously been demonstrated as an effective strategy to identify stress-responsive modules and hub genes, as reported in studies on grafting success [42], and drought tolerance [43]. These findings collectively support the robustness of co-expression network analysis in elucidating key regulatory genes in pecan under diverse physiological conditions. GO enrichment analysis revealed green module genes were involved in oxidation–reduction, transcriptional regulation, and protein binding; brown module genes were related to signal transduction and cell wall organization; and red module genes were enriched in defense and hormone signaling (Figure 8). These results suggest that CiGRAS genes participate in modular and coordinated transcriptional responses to salt stress, acting through distinct yet interconnected networks. Together, these results support a model in which CiGRAS genes contribute to stress resilience by participating in distinct but interlinked co-expression modules, thereby coordinating responses across early signaling, transcriptional activation, and downstream physiological adjustments. While our results provide insight into CiGRAS gene expression under salt stress, future work should incorporate physiological and biochemical measurements to comprehensively link gene activity with visible stress phenotypes in pecan. Such insights lay the foundation for selecting key regulators for functional validation and biotechnological enhancement of stress tolerance in pecan and related tree crops. These findings not only expand our understanding of GRAS gene regulation in a woody perennial but also highlight their potential as molecular resources for future breeding and landscape management strategies to enhance pecan resilience in salinity-affected regions. Future studies should prioritize functional assays, including targeted overexpression or CRISPR-based knockout of candidate CiGRAS genes, to directly verify their regulatory roles and clarify causal links between gene activity and stress tolerance mechanisms in pecan. This is consistent with GRAS-mediated pathways described in other crops, suggesting that core GRAS modules could be targeted for breeding programs across diverse species.

5. Conclusions

In summary, this study provides the first comprehensive characterization of the GRAS gene family in pecan, revealing their structural diversity, expansion patterns, and stress-responsive expression profiles. The identification of key salt-responsive CiGRAS candidates, supported by co-expression network analysis and qRT-PCR validation, lays a solid foundation for future functional studies. These insights not only deepen our understanding of the transcriptional regulation underlying pecan’s salt stress adaptation but also offer valuable genetic resources for developing stress-resilient cultivars to support sustainable landscape greening in salinized regions.

Supplementary Materials

The following supporting information can be downloaded at https://www.mdpi.com/article/10.3390/f16071199/s1: Table S1: Primer sequences used for qRT-PCR test; Table S2: Gene features of 58 CiGRAS genes in pecan; Table S3: Gene duplication events identified and Ka, Ks and Ka/Ks analysis in the CiGRAS gene family; Table S4: RPKM data in different tissues of pecan; Table S5: RPKM under various biotic/abiotic stress of pecan seeding; Table S6: Module classification, expression profiles, and GO annotation of selected genes under salt stress.

Author Contributions

M.X. carried out the experimental design and data analysis. G.W. analyzed data and performed the experiments. Y.C. designed the experiment and revised the manuscript. M.X. and G.W. wrote and revised the manuscript and approved the final manuscript. All authors have read and agreed to the published version of the manuscript.

Funding

This work was financially supported by the Open Fund of Jiangsu Key Laboratory for the Research and Utilization of Plant Resources (JSPKLB202307), as well as the Natural Science Foundation of Jiangsu Province, China (BK20230757).

Data Availability Statement

The data presented in this study are available in the graphs and tables provided in the manuscript.

Acknowledgments

The author thanks the lab members for their assistance.

Conflicts of Interest

The authors declare that they have no competing interests. Author Ming Xu was employed by the company Shanghai Lingang Fengxian Economic Development Co., Ltd.

Abbreviations

AbbreviationFull Term
ABAAbscisic Acid
bpBase Pairs
CDSCoding Sequence
CiGRASCarya illinoinensis GRAS Gene
DEGDifferentially Expressed Gene
DSDDispersed Duplication
GAGibberellin
GOGene Ontology
HMMHidden Markov Model
Ka/KsNonsynonymous/Synonymous Substitution Ratio
MEMEMultiple EM for Motif Elicitation
NaClSodium Chloride
NCBINational Center for Biotechnology Information
PDProximal Duplication
qRT-PCRQuantitative Real-Time Polymerase Chain Reaction
RPKMReads Per Kilobase per Million Mapped Reads
ROSReactive Oxygen Species
TFTranscription Factor
TDTandem Duplication
TPMTranscripts Per Million
TRDTransposed Duplication
UTRUntranslated Region
WGCNAWeighted Gene Co-expression Network Analysis
WGDWhole-Genome Duplication

References

  1. Atanasov, A.G.; Sabharanjak, S.M.; Zengin, G.; Mollica, A.; Szostak, A.; Simirgiotis, M.; Huminiecki, Ł.; Horbanczuk, O.K.; Nabavi, S.M.; Mocan, A. Pecan nuts: A review of reported bioactivities and health effects. Trends Food Sci. Technol. 2018, 71, 246–257. [Google Scholar] [CrossRef]
  2. McWilliams, J. The Pecan: A History of America’s Native Nut; University of Texas Press: Austin, TX, USA, 2013. [Google Scholar]
  3. Hand, L.C.; Foshee III, W.G.; Monday, T.A.; Sibley, J.L. Long-term weed control for landscape pecan (Carya illinoinensis) trees. J. Environ. Hortic. 2018, 36, 82–84. [Google Scholar] [CrossRef]
  4. Wang, X.; Stein, L.; Black, M.; Kubenka, K.; Randall, J.; Ding, C. Phenotypic diversity and population structure of pecan (Carya illinoinensis) collections reveals geographic patterns. Sci. Rep. 2024, 14, 18592. [Google Scholar] [CrossRef] [PubMed]
  5. Zhang, R.; Peng, F.; Li, Y. Pecan production in China. Sci. Hortic. 2015, 197, 719–727. [Google Scholar] [CrossRef]
  6. Jia, X.; Luo, H.; Xu, M.; Wang, G.; Xuan, J.; Guo, Z. Investigation of nut qualities of pecan cultivars grown in China. J. Plant Sci. 2019, 7, 117–124. [Google Scholar]
  7. Huang, C.; Wang, Z.; Ren, X.; Ma, X.; Zhou, M.; Ge, X.; Liu, H.; Fu, S. Evaluation of soil quality in a composite pecan orchard agroforestry system based on the smallest data set. Sustainability 2022, 14, 10665. [Google Scholar] [CrossRef]
  8. Wang, L.; Sun, X.; Li, S.; Zhang, T.; Zhang, W.; Zhai, P. Application of organic amendments to a coastal saline soil in North China: Effects on soil physical and chemical properties and tree growth. PLoS ONE 2014, 9, e89185. [Google Scholar] [CrossRef] [PubMed]
  9. Hua, J.F.; Du, L.J.; Wang, X.F.; Han, L.W.; Xiong, Y.W.; Yin, Y.L. Effect of mixed salt stress on growth of common greening species in coastal area of Jiangsu Province and evaluation of their salt tolerance. Sci. Agric. Sin. 2015, 48, 2385–2395. [Google Scholar]
  10. Zhang, J.; Jiao, Y.; Sharma, A.; Shen, D.; Wei, B.; Hong, C.; Zheng, B.; Pan, C. Transcriptomic analysis reveals potential pathways associated with salt resistance in pecan (Carya illinoensis K. Koch). J. Biotechnol. 2021, 330, 17–26. [Google Scholar] [CrossRef] [PubMed]
  11. Wang, G.; Xu, Y.; Guan, S.L.; Zhang, J.; Jia, Z.; Hu, L.; Zhai, M.; Mo, Z.; Xuan, J. Comprehensive genomic analysis of CiPawPYL-PP2C-SnRK family genes in pecan (Carya illinoinensis) and functional characterization of CiPawSnRK2.1 under salt stress responses. Int. J. Biol. Macromol. 2024, 279, 135366. [Google Scholar] [CrossRef] [PubMed]
  12. Jaiswal, V.; Kakkar, M.; Kumari, P.; Zinta, G.; Gahlaut, V.; Kumar, S. Multifaceted roles of GRAS transcription factors in growth and stress responses in plants. iScience 2022, 25, 105026. [Google Scholar] [CrossRef] [PubMed]
  13. Hirsch, S.; Oldroyd, G.E. GRAS-domain transcription factors that regulate plant development. Plant Signal. Behav. 2009, 4, 698–700. [Google Scholar] [CrossRef] [PubMed]
  14. Bolle, C. The role of GRAS proteins in plant signal transduction and development. Planta 2004, 218, 683–692. [Google Scholar] [CrossRef] [PubMed]
  15. Khan, Y.; Xiong, Z.; Zhang, H.; Liu, S.; Yaseen, T.; Hui, T. Expression and roles of GRAS gene family in plant growth, signal transduction, biotic and abiotic stress resistance and symbiosis formation—A review. Plant Biol. 2022, 24, 404–416. [Google Scholar] [CrossRef] [PubMed]
  16. Tian, C.; Wan, P.; Sun, S.; Li, J.; Chen, M. Genome-wide analysis of the GRAS gene family in rice and Arabidopsis. Plant Mol. Biol. 2004, 54, 519–532. [Google Scholar] [CrossRef] [PubMed]
  17. Chen, W.; Hu, X.; Hu, L.; Hou, X.; Xu, Z.; Yang, F.; Yuan, M.; Chen, F.; Wang, Y.; Tu, B. Wide Grain 3, a GRAS protein, interacts with DLT to regulate grain size and brassinosteroid signaling in rice. Rice 2022, 15, 55. [Google Scholar] [CrossRef] [PubMed]
  18. Yang, Y.; Agassin, R.H.; Ji, K. Transcriptome-wide identification of the GRAS transcription factor family in Pinus massoniana and its role in regulating development and stress response. Int. J. Mol. Sci. 2023, 24, 10690. [Google Scholar] [CrossRef] [PubMed]
  19. Ling, L.; Li, M.; Chen, N.; Ren, G.; Qu, L.; Yue, H.; Wu, X.; Zhao, J. Genome-wide analysis and expression of the GRAS transcription factor family in Avena sativa. Genes 2023, 14, 164. [Google Scholar] [CrossRef] [PubMed]
  20. Wang, L.; Ding, X.; Gao, Y.; Yang, S. Genome-wide identification and characterization of GRAS genes in soybean (Glycine max). BMC Plant Biol. 2020, 20, 415. [Google Scholar] [CrossRef] [PubMed]
  21. Cenci, A.; Rouard, M. Evolutionary analyses of GRAS transcription factors in angiosperms. Front. Plant Sci. 2017, 8, 273. [Google Scholar] [CrossRef] [PubMed]
  22. Vera-Sirera, F.; Gomez, M.D.; Perez-Amador, M.A. DELLA proteins, a group of GRAS transcription regulators that mediate gibberellin signaling. In Plant Transcription Factors; Elsevier: Amsterdam, The Netherlands, 2016; pp. 313–328. [Google Scholar]
  23. Waseem, M.; Nkurikiyimfura, O.; Niyitanga, S.; Jakada, B.H.; Shaheen, I.; Aslam, M.M. GRAS transcription factors: Emerging regulators in plant growth, development, and multiple stresses. Mol. Biol. Rep. 2022, 49, 9673–9685. [Google Scholar] [CrossRef] [PubMed]
  24. Xu, K.; Chen, S.; Li, T.; Ma, X.; Liang, X.; Ding, X.; Liu, H.; Luo, L. OsGRAS23, a rice GRAS transcription factor gene, is involved in drought stress response through regulating expression of stress-responsive genes. BMC Plant Biol. 2015, 15, 141. [Google Scholar] [CrossRef] [PubMed]
  25. Zhang, H.; Liu, X.; Wang, X.; Sun, M.; Song, R.; Mao, P.; Jia, S. Genome-wide identification of GRAS gene family and their responses to abiotic stress in Medicago sativa. Int. J. Mol. Sci. 2021, 22, 7729. [Google Scholar] [CrossRef] [PubMed]
  26. Fode, B.; Siemsen, T.; Thurow, C.; Weigel, R.; Gatz, C. The Arabidopsis GRAS protein SCL14 interacts with class II TGA transcription factors and is essential for the activation of stress-inducible promoters. Plant Cell 2008, 20, 3122–3135. [Google Scholar] [CrossRef] [PubMed]
  27. Lovell, J.T.; Bentley, N.B.; Bhattarai, G.; Jenkins, J.W.; Sreedasyam, A.; Alarcon, Y.; Bock, C.; Boston, L.B.; Carlson, J.; Cervantes, K.; et al. Four chromosome-scale genomes and a pan-genome annotation to accelerate pecan tree breeding. Nat. Commun. 2021, 12, 4125. [Google Scholar] [CrossRef] [PubMed]
  28. Kumar, S.; Stecher, G.; Tamura, K. MEGA7: Molecular evolutionary genetics analysis version 7.0 for bigger datasets. Mol. Biol. Evol. 2016, 33, 1870–1874. [Google Scholar] [CrossRef] [PubMed]
  29. Chen, C.; Chen, H.; Zhang, Y.; Thomas, H.R.; Frank, M.H.; He, Y.; Xia, R. TBtools: An integrative toolkit developed for interactive analyses of big biological data. Mol. Plant 2020, 13, 1194–1202. [Google Scholar] [CrossRef] [PubMed]
  30. Wang, Y.; Tang, H.; DeBarry, J.D.; Tan, X.; Li, J.; Wang, X.; Lee, T.-H.; Jin, H.; Marler, B.; Guo, H. MCScanX: A toolkit for detection and evolutionary analysis of gene synteny and collinearity. Nucleic Acids Res. 2012, 40, e49. [Google Scholar] [CrossRef] [PubMed]
  31. Qiao, X.; Li, Q.; Yin, H.; Qi, K.; Li, L.; Wang, R.; Zhang, S.; Paterson, A.H. Gene duplication and evolution in recurring polyploidization–diploidization cycles in plants. Genome Biol. 2019, 20, 38. [Google Scholar] [CrossRef] [PubMed]
  32. Wang, D.; Zhang, Y.; Zhang, Z.; Zhu, J.; Yu, J. KaKs_Calculator 2.0: A toolkit incorporating gamma-series methods and sliding window strategies. Genom. Proteom. Bioinform. 2010, 8, 77–80. [Google Scholar] [CrossRef] [PubMed]
  33. Zhu, K.; Fan, P.; Liu, H.; Tan, P.; Ma, W.; Mo, Z.; Zhao, J.; Chu, G.; Peng, F. Insight into the CBL and CIPK gene families in pecan (Carya illinoinensis): Identification, evolution and expression patterns in drought response. BMC Plant Biol. 2022, 22, 221. [Google Scholar] [CrossRef] [PubMed]
  34. Chang, J.; Wang, K.; Zhang, C.; Han, X.; Zhang, X.; Ren, H.; Yao, X. Transcriptome analysis of resistant and susceptible pecan (Carya illinoinensis) reveals the mechanism of resistance to black spot disease (Colletotrichum fioriniae). J. Agric. Food Chem. 2023, 71, 5812–5822. [Google Scholar] [CrossRef] [PubMed]
  35. Wang, G.; Hu, L.; Zhang, J.; Zhai, M.; Jia, Z.; Mo, Z.; Xuan, J. Comprehensive genomic analysis of the CDPK gene family in pecan (Carya illinoinensis) and their potential roles in salt stress response. Plants 2025, 14, 540. [Google Scholar] [CrossRef] [PubMed]
  36. Liu, X.; Widmer, A. Genome-wide comparative analysis of the GRAS gene family in Populus, Arabidopsis and rice. Plant Mol. Biol. Rep. 2014, 32, 1129–1145. [Google Scholar] [CrossRef]
  37. Qiao, X.; Yin, H.; Li, L.; Wang, R.; Wu, J.; Wu, J.; Zhang, S. Different modes of gene duplication show divergent evolutionary patterns and contribute differently to the expansion of gene families involved in important fruit traits in pear (Pyrus bretschneideri). Front. Plant Sci. 2018, 9, 161. [Google Scholar] [CrossRef] [PubMed]
  38. Zhang, H.; Mi, L.; Xu, L.; Yu, C.; Li, C.; Chen, C. Genome-wide identification, characterization, interaction network and expression profile of GRAS gene family in sweet orange (Citrus sinensis). Sci. Rep. 2019, 9, 2156. [Google Scholar] [CrossRef] [PubMed]
  39. Huang, W.; Xian, Z.; Kang, X.; Tang, N.; Li, Z. Genome-wide identification, phylogeny and expression analysis of GRAS gene family in tomato. BMC Plant Biol. 2015, 15, 209. [Google Scholar] [CrossRef] [PubMed]
  40. Chen, J.; Zhang, L.; Liu, Y.; Shen, X.; Guo, Y.; Ma, X.; Zhang, X.; Li, X.; Cheng, T.; Wen, H. RNA-Seq-based WGCNA and association analysis reveal the key regulatory module and genes responding to salt stress in wheat roots. Plants 2024, 13, 274. [Google Scholar] [CrossRef] [PubMed]
  41. Ma, L.; Zhang, M.; Chen, J.; Qing, C.; He, S.; Zou, C.; Yuan, G.; Yang, C.; Peng, H.; Pan, G. GWAS and WGCNA uncover hub genes controlling salt tolerance in maize (Zea mays L.) seedlings. Theor. Appl. Genet. 2021, 134, 3305–3318. [Google Scholar] [CrossRef] [PubMed]
  42. Mo, Z.; Jiang, X.; Zhang, Y.; Zhai, M.; Hu, L.; Xuan, J. Weighted gene co-expression network analysis reveals key pathways and hub genes associated with successful grafting in pecan (Carya illinoinensis). Forests 2023, 14, 835. [Google Scholar] [CrossRef]
  43. Hou, M.; Li, Y.; Xuan, J.; Zhang, Y.; Wang, T.; Zhai, M.; Wang, G.; Hu, L.; Mo, Z. Weighted gene co-expression network analysis uncovers core drought responsive genes in pecan (Carya illinoinensis). Plants 2025, 14, 833. [Google Scholar] [CrossRef] [PubMed]
Figure 1. Phylogenetic tree of GRAS proteins in pecan (Carya illinoinensis) and Arabidopsis thaliana. A maximum likelihood tree was constructed using full-length GRAS protein sequences from pecan (58 CiGRASs) and Arabidopsis thaliana (33 AtGRASs).
Forests 16 01199 g001
Figure 2. Phylogenetic relationships, conserved domains, motifs, and gene structures of CiGRAS proteins. (A) Phylogenetic tree of 58 CiGRAS proteins constructed using the maximum likelihood method. (B) Conserved domain organization of CiGRAS proteins predicted by PFAM, showing the distribution of GRAS domains and other associated motifs. (C) Distribution of 20 conserved motifs in CiGRAS proteins identified using MEME Suite. Each motif is represented by a colored box. (D) Exon–intron organization of CiGRAS genes. The lue boxes represent exons, the black lines represent introns, and the yellow boxes represent untranslated regions (UTRs).
Forests 16 01199 g002
Figure 3. Chromosomal distribution of 58 CiGRAS genes in the pecan genome.
Forests 16 01199 g003
Figure 4. Cis-element analysis in the promoters of CiGRAS genes. (A) Heatmap showing the abundance of cis-regulatory elements associated with three functional categories: growth and development, hormone responsiveness, and stress responsiveness. The rows represent individual CiGRAS genes, and the columns represent different element categories. The number in each cell indicates the count of cis-elements in that category, and color intensity corresponds to abundance. (B) Positional distribution of cis-elements in the 2000 bp upstream promoter regions of 58 CiGRAS genes. Each color bar represents a specific cis-element type.
Forests 16 01199 g004
Figure 5. Gene duplication patterns and evolutionary rates of the CiGRAS gene family in pecan. (A) Syntenic relationships among duplicated CiGRAS genes mapped on pecan chromosomes. A total of 48 dispersed duplications (DSD) is shown as yellow lines, 40 whole-genome duplications (WGD) as green lines, 5 tandem duplications (TD) as red lines, and 1 transposed duplication (TRD) as green. (B) Boxplots of Ka, Ks, and Ka/Ks values calculated for all duplicated CiGRAS gene pairs.
Forests 16 01199 g005
Figure 6. Tissue-specific expression profiles of CiGRAS genes in pecan based on RNA-seq data. Bubble plot showing the expression patterns of 58 CiGRAS genes across seven tissues: leaf, root, stem, seed, fruit, male flower, and female flower. The size of each bubble reflects the absolute expression level (log2RPKM), while the color intensity represents relative expression within each tissue.
Forests 16 01199 g006
Figure 7. Expression profiles of CiGRAS genes under abiotic and biotic stresses. Heatmap showing the expression patterns of CiGRAS genes under different stress conditions, including salt (0.3% and 0.6% NaCl), drought, cold, and Colletotrichum fioriniae infection. Expression values (RPKM) were log2-transformed.
Forests 16 01199 g007
Figure 8. WGCNA-based module expression patterns and functional annotation. (A) Hierarchical clustering dendrogram of genes based on topological overlap matrix (TOM), constructed from 13,229 high-quality genes (TPM ≥ 2, MAD ≥ 1) across six conditions (CK-8 h, 0.6%-Salt-8 h, CK-24 h, 0.6%-Salt-24 h, CK-48 h, 0.6%-Salt-48 h). Co-expression modules were identified using dynamic tree cutting and are represented as colored branches. Modules with high expression correlation were merged based on eigengene similarity (mergeCutHeight = 0.25). (B) Heatmap of gene expression profiles from three key modules (green, brown, and red) enriched for DEGs. Representative GO terms are listed on the right, and the corresponding numbers indicate the term frequency within each module. To facilitate interpretation, functional labels were assigned to key modules (green as ROS-regulation, brown as signaling/ion transport, red as defense/hormone response) based on their most significantly enriched GO terms.
Forests 16 01199 g008
Figure 9. qRT-PCR validation of selected salt-responsive CiGRAS genes under NaCl treatment. The expression values were normalized to the internal control gene, and fold changes were calculated using the 2−ΔΔCt method. The error bars represent standard deviations (SDs) from three biological replicates. Standard errors and ANOVA were calculated by applying Student’s t-test. Single and double stars stand for the levels of significant difference (p < 0.05 and p < 0.01, respectively).
Forests 16 01199 g009
Disclaimer/Publisher’s Note: The statements, opinions and data contained in all publications are solely those of the individual author(s) and contributor(s) and not of MDPI and/or the editor(s). MDPI and/or the editor(s) disclaim responsibility for any injury to people or property resulting from any ideas, methods, instructions or products referred to in the content.

