1. Introduction
Cold stress has a serious impact on plant growth and development and significantly affects productivity. Plants have developed various adaptive mechanisms at both physiological and molecular levels to cope with cold stress [
1]. Cold stress, including chilling (0–15 °C) and freezing (<0 °C), is a major abiotic factor that adversely influences plant growth and agricultural productivity [
2,
3]. Among these, chilling stress typically restricts enzymatic activity and membrane function, whereas freezing can cause irreversible physical damage such as ice crystal formation and membrane rupture. Therefore, understanding and evaluating plant responses to both types of cold stress is critical for ensuring agricultural resilience under climate variability.
Methods for evaluating cold tolerance include visual inspection [
4], electrolyte leakage [
5,
6], and the triphenyl tetrazolium chloride (TTC) method [
7]. However, there is still a need to develop more accurate and reliable testing methods. Visual inspection assesses freezing damage by observing leaf curling and browning. Electrolyte leakage measures the amount of electrolyte released due to increased membrane permeability at low temperatures [
6]. The TTC method evaluates living cell respiration through the intensity of color reactions [
8]. However, these methods primarily assess damage in a cell-free state, necessitating clearer and more precise techniques. Moreover, many of these techniques provide indirect or post-damage indicators, limiting their applicability in early screening of tolerant genotypes.
Each method for evaluating cold tolerance has reliability issues. The electrolyte leakage method tends to overestimate cold tolerance [
9], while the TTC method can yield inconsistent results due to bacterial contamination, high variability across tissues, low reproducibility, and poor alignment with other methods like electrolyte leakage in woody species and grapevines [
8,
10,
11]. To enhance the reliability of cold tolerance evaluations, it is recommended to apply multiple methods concurrently [
12]. Such multimodal approaches not only improve diagnostic accuracy but also provide a more holistic understanding of plant responses to cold stress. Additionally, using mathematical models such as nonlinear regression offers a more accurate means to predict cold tolerance [
13]. In particular, logistic models can capture the sigmoidal response curve typical of electrolyte leakage patterns, enabling precise determination of LT
50 values.
Previous studies typically employed 2–5 methods to evaluate plant cold tolerance. Despite this, evaluations can often be overestimated or underestimated. To address this, it is crucial to incorporate histological, biochemical, and tissue-level assessments. Predicting lethal temperatures using nonlinear regression equations derived from evaluation results is also highly effective for assessing plant cold tolerance [
14]. The integration of anatomical staining (e.g., Evans blue), membrane integrity analysis, and metabolic indicators (e.g., proline, MDA) allows for improved cross-validation and reduced uncertainty in tolerance assessment.
The tea plant (
Camellia sinensis (L.) Kuntze) and
Camellia (
Camellia japonica L.) are species of the Theaceae family distributed in southern Korea, valued for their ornamental and economic significance [
15,
16].
C. sinensis leaf extract is widely consumed due to its health benefits, with antiviral, antioxidant, and anti-inflammatory properties [
17,
18].
C. japonica is used in horticulture, with its seeds utilized for edible oil and cosmetic products and its stems for high-quality charcoal. Camellia leaves have pharmacological effects, including treatment for psoriasis, sore throats, burns, antibacterial, antispasmodic actions, and alcohol absorption inhibition [
19,
20,
21].
The tea plant is a subtropical evergreen species. However, in Korean winters, temperatures drop below −10 °C, limiting its cultivation [
22]. Extreme weather events, such as low temperatures, heavy rain, and drought, are becoming more frequent due to climate change. In 2011, temperatures below −10 °C persisted for over 10 days, delaying green tea harvests by more than 10 days and reducing yields by over 50%, significantly affecting stable production [
16]. Camellia trees in Korean urban green spaces also suffered frost damage, with brown leaf damage rates reaching 59.6%, higher than other evergreen broadleaf trees [
15]. These vulnerabilities underscore the need for cold-tolerant cultivar development and reliable screening protocols.
Evergreen broad-leaved trees native to Korea are now expanding their growth range northward [
23,
24]. Research on temperate species is necessary to conserve plant resources and maintain biodiversity [
25]. Additionally, studies on cold resistance aim to assess the potential of these species in central Korea [
26]. Climate change is expected to shift the resource utilization of these species as plant growth migrates northward [
15]. Although various studies have assessed plant cold resistance in Korea, research on Theaceae plants remains limited. Expanding the scope of cold tolerance studies to include both functional traits and ecophysiological indicators is vital to support adaptive cultivation strategies in temperate and transitional zones.
Understanding the cold tolerance mechanisms of Camellia species holds broader ecological and practical significance for temperate forest systems. As climate warming drives northward expansion of evergreen broad-leaved trees such as C. sinensis and C. japonica, insights into their freezing tolerance help predict vegetation shifts and guide the selection of resilient species for restoration and urban greening. Moreover, because these species are also valued for tea and cosmetic oil production, clarifying their low-temperature adaptability is essential for ensuring stable raw material supply and expanding cultivation zones under changing climatic conditions. In addition, field observations in Korea indicate frequent frost injury in C. japonica in urban plantings, whereas C. sinensis generally exhibits comparatively greater freezing tolerance in managed plantations; together, this species represents a practical tolerance spectrum for quantitative comparison.
Therefore, this study aimed to establish an integrated and quantitative framework for evaluating cold tolerance in C. sinensis and C. japonica. Considering their ecological distribution, C. sinensis was assumed to possess greater membrane stability and physiological adaptability to freezing temperatures than C. japonica. To verify this assumption, visual scoring, electrolyte leakage (EL) measurement, and Evans blue staining were employed to assess cold-induced injury. In addition, nonlinear regression modeling was applied to estimate lethal temperature indices (LT50 and ELTemp50), and biochemical indicators were analyzed to elucidate species-specific physiological responses. This integrative approach was designed to provide a reproducible framework for predicting and comparing cold tolerance in Camellia species under variable climatic conditions.
2. Materials and Methods
2.1. Plant Materials
Seedlings of C. sinensis and C. japonica used in the experiment were provided by the Gyeongsangnam-do Forest Environment Research Institute. Seedlings were cultivated in a controlled environment using artificial soil composed of peat moss, perlite, and vermiculite (1:1:1, v/v/v), and grown in uniform pots (top diameter: 16 cm, bottom diameter: 11 cm, height: 17 cm) to ensure consistency across treatments. The 3-year-old seedlings, each with fewer than 10 leaves, were acclimatized in a growth room for 3 months to promote a stable physiological condition for cold stress evaluation.
Watering was conducted every 3 days prior to cold treatment, and then withheld 7 days before the experiment. Environmental conditions were maintained at 70% relative humidity under a photoperiod of 16 h light/8 h dark, with light intensity at 50 µmol m−2 s−1.
The average plant height was 16.4 ± 2.77 cm, root collar diameter was 0.8 ± 0.1 cm, and average leaf area was 6.73 ± 0.52 cm2. Five seedlings of similar size were selected per treatment to minimize experimental variability.
2.2. Cold Treatment and Visual Inspection
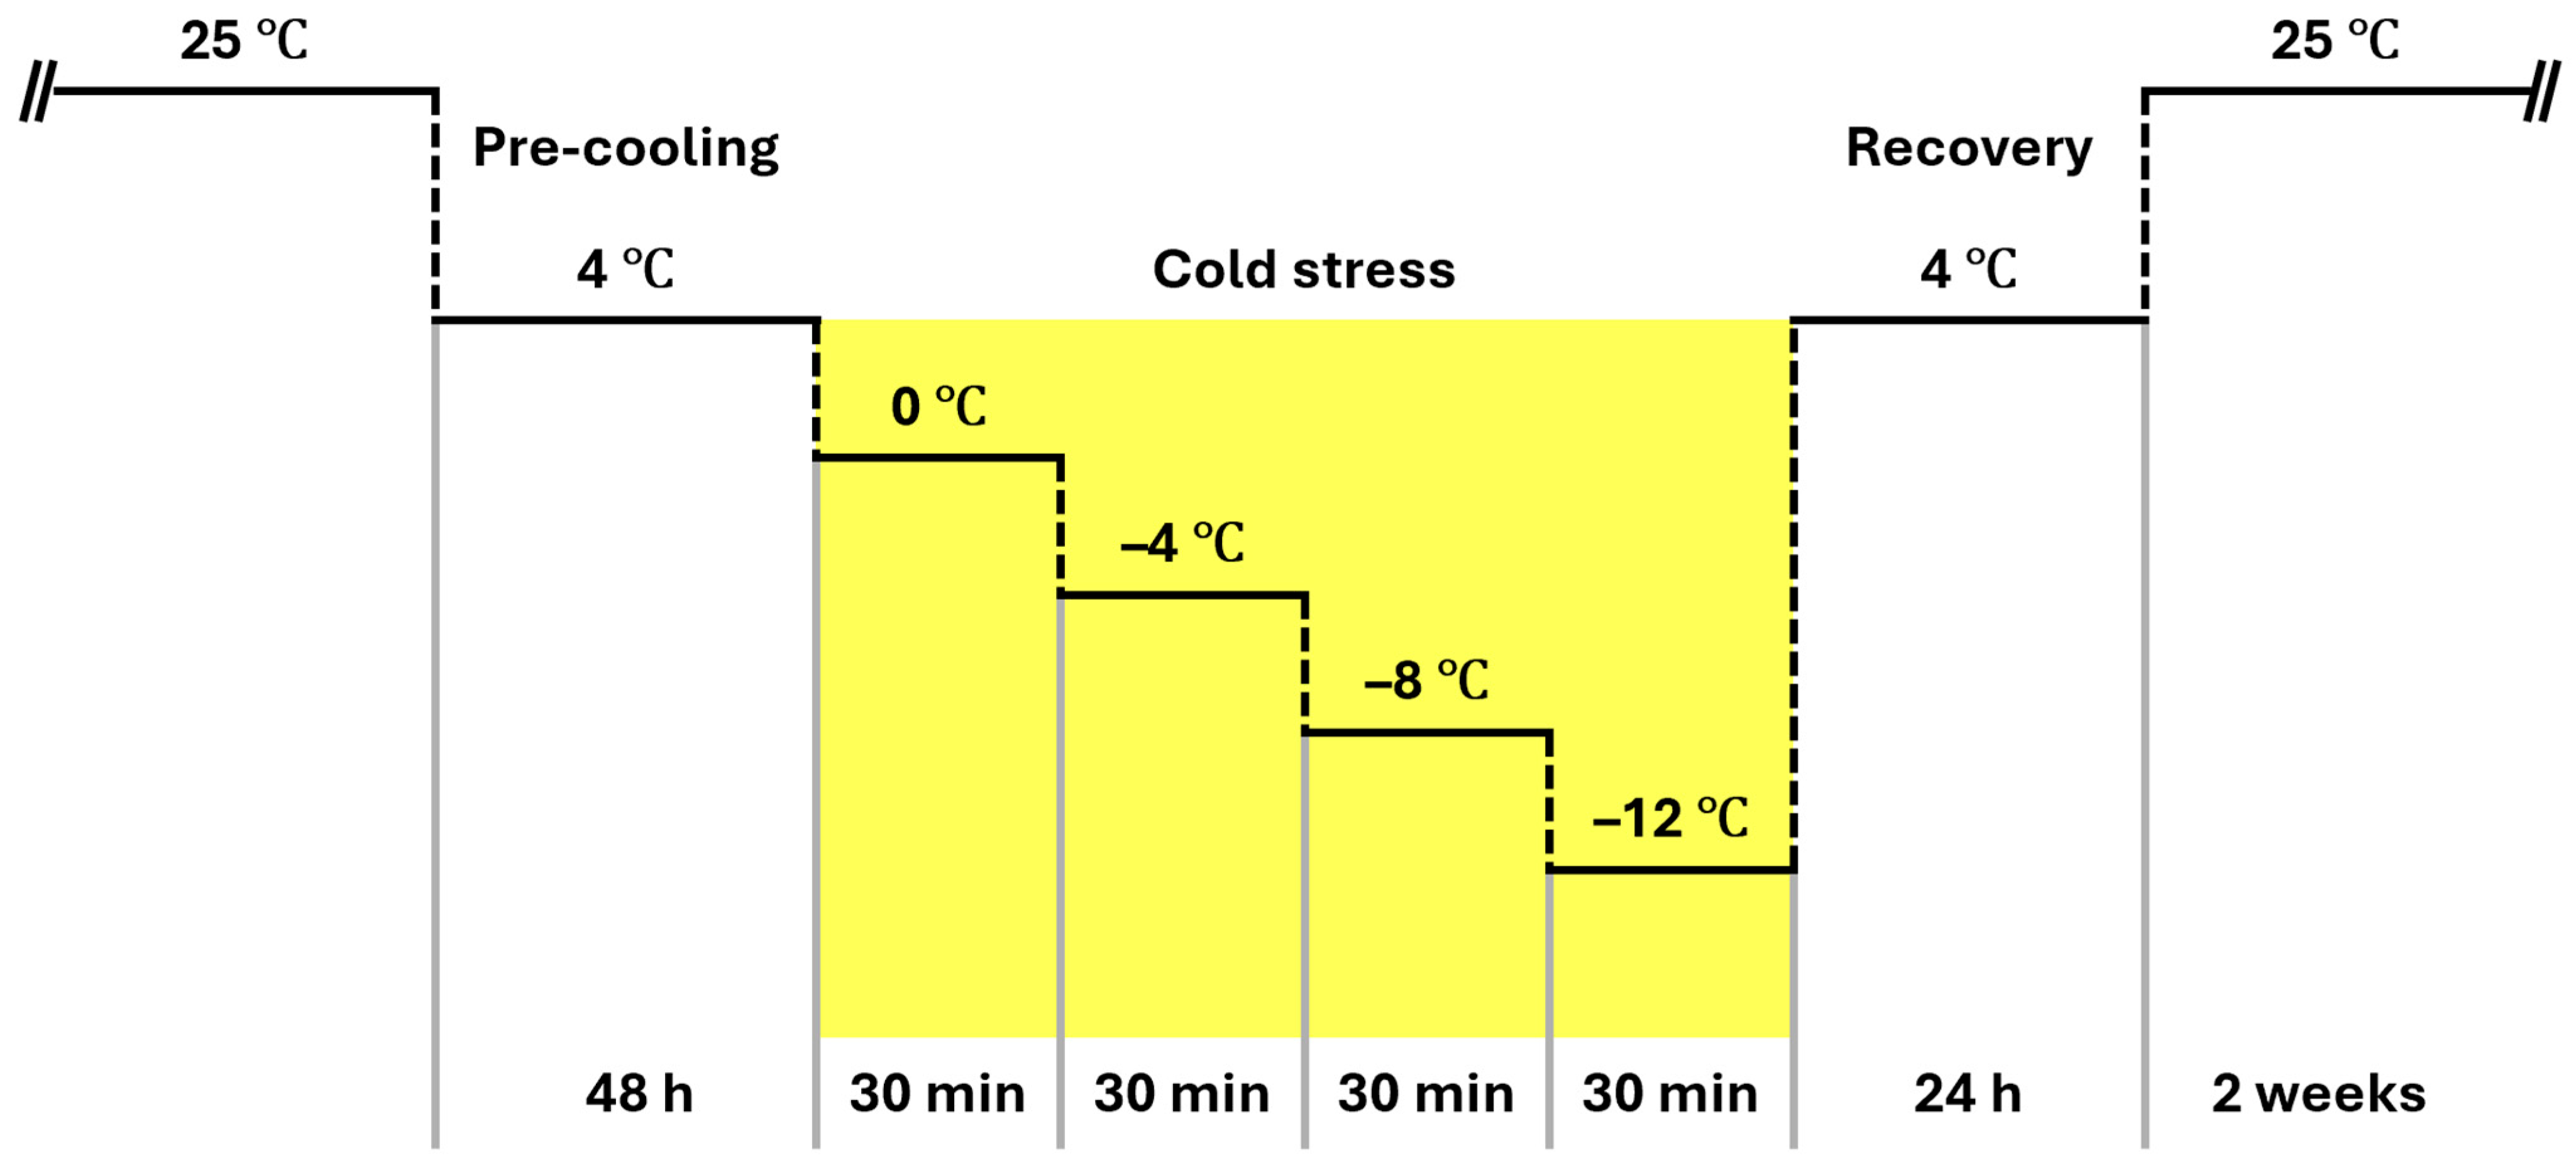
Cold treatment was carried out in a laboratory freezer (SH-75BS, Seyoung Scientific Co., Bucheon, Republic of Korea). To induce cold acclimation, all plants were pre-cooled at 4 °C for 48 h. After preconditioning, plants used for temperature–response assays (electrolyte leakage and Evans blue) were subjected to a stepwise cooling protocol (
Figure 1), in which they were exposed sequentially to 0 °C, −4 °C, −8 °C, and −12 °C, each step maintained for 30 min, followed by transfer to 4 °C for 24 h for recovery and subsequently maintained at 25 °C for 2 weeks before further analysis.
For visual injury scoring, a separate time-course exposure was performed at a single sublethal temperature (−6 °C) for 12, 24, 36, or 48 h after the same 4 °C precooling. A single temperature was chosen based on preliminary trials showing that 0 to −4 °C produced minimal visible change, whereas −8 to −12 °C caused rapid saturation of scores, reducing discrimination between species. The −6 °C condition yielded a graded progression on the 0–5 scale without immediate lethality, allowing repeated, non-destructive scoring of the same individuals and minimizing between-plant variability. Leaf damage was evaluated at each time point using the method of Walker et al. [
4] on a five-point scale: 0, no damage; 1, <10% bleached or necrotic tissue; 2, 11%–50% damage; 3, 51%–90% damage; 4, >90% damage; 5, complete leaf death. Each species × time treatment used
n = 3 biological replicates. Technical measurements were taken in triplicate and averaged per individual (α = 0.05).
2.3. Measurement of Electrolyte Leakage and Nonlinear Modeling
After low-temperature treatment, leaf samples were cut and immersed (5 g tissue in 5 mL distilled water) and shaken for 6 h. Electrical conductivity before heating (
Lt) was measured with a conductivity meter (VE 4810, Korea Scientifics, Seoul, Republic of Korea). Samples were then autoclaved at 121 °C for 15 min to release all electrolytes, and the final conductivity (
Ltm) was recorded. Relative electrolyte leakage (Rt, %) was calculated as in Equation (1) [
27]:
where
Lt = conductivity before autoclaving, and
Ltm = conductivity after autoclaving.
The resulting electrolyte-leakage data were applied to a logistic regression model to estimate LT
50, the temperature at which 50% of cells are lethally damaged [
28]. Previous studies have demonstrated that the relationship between temperature and electrolyte leakage follows a sigmoidal curve, and the inflection point of this curve represents LT
50.
Our research group previously developed a nonlinear regression framework for Brassica napus [
14], evaluating models including a 3-parameter logistic, a baseline logistic, and a 4-parameter logistic (4PL) curve. Based on parameter stability and low standard errors, we selected the 4PL and a reduced (3–1)-parameter Gompertz model for this study. For completeness, the canonical logistic link and the temperature-response form used here (Equations (2) and (3)) are shown below:
where
z = baseline level of electrolyte leakage (%),
Tm = temperature at the inflection point (°C),
k = function of slope at the inflection point,
T = treatment temperature (°C),
e = 2.718 (natural constant).
In practice, the temperature (°C)–electrolyte leakage (%) relationship was fitted with a four-parameter logistic (4PL) model (Equation (4)):
where
A is the lower asymptote (baseline leakage, numerically corresponding to
z),
K is the upper asymptote (fixed to 100%),
M is the inflection point (the 4PL estimate of LT
50), and
B is the slope parameter (corresponding to
k). Parameters were estimated by nonlinear least squares (PROC NLIN, SAS 9.3), and standard errors and 95% confidence intervals (CI) were obtained from the model covariance matrix.
Because the inflection point
M does not necessarily coincide with exactly 50% leakage when
A ≠ 0 (i.e., when baseline leakage is non-zero), we additionally computed the ELTemp
50, defined as the exact temperature at which the fitted leakage equals 50%. ELTemp
50 was derived analytically from the 4PL as in Equation (5):
Graphical 95% prediction intervals (PI) around the fitted curves were obtained via parametric bootstrap (1000 replicates) by resampling from the fitted 4PL with Gaussian residuals, refitting the model to each replicate, and taking the 2.5th–97.5th percentiles of the predicted responses at each temperature. Each species × temperature treatment used n = 3 biological replicates. Technical measurements were taken in triplicate and averaged per individual (α = 0.05).
2.4. Measurement of Cell Death by Evans Blue Staining
Seedlings were pre-cooled at 4 °C for 24 h and then treated at temperatures ranging from 4 °C to –12 °C, at 1 °C intervals, with each treatment lasting 30 min. The Evans blue staining protocol was slightly modified from Gonzalez-Mendoza et al. [
29]. Leaves were immersed in 1% (
w/
v) Evans blue solution, gently shaken, and rinsed with distilled water until no blue residue remained. Then, microscopic images were taken at 200× magnification (BH, Olympus, Tokyo, Japan).
Quantification of cell death was conducted by incubating stained leaves in 50 mL of 2% sodium dodecyl sulfate (SDS) (
w/
v) in ethanol at 60 °C for 30 min, followed by absorbance measurement at 500 nm. Additional samples were heated at 80 °C for 5 h to determine maximum absorbance (positive control) or non-treated (negative control) prior to the Evans blue staining. The cell death rate was calculated using the following Equation (6):
where
AbsH: absorbance value of the cold-stressed sample,
AbsNC: absorbance value of negative control,
AbsPC: absorbance value of positive control. Each species × temperature treatment used
n = 3 biological replicates. Technical measurements were taken in triplicate and averaged per individual (α = 0.05).
2.5. Relationship Between Electrolyte Leakage and Cell Death
Before determining lethal temperatures, Pearson’s correlation coefficient (R2) was used to analyze the relationship between electrolyte leakage and cell death. This allowed us to evaluate the strength and direction of the linear relationship between the two indicators of cold damage.
2.6. Analysis of Biochemical Indicators Under Low-Temperature Treatment
To characterize physiological changes under low-temperature treatment in C. sinensis and C. japonica, we analyzed five leaf biochemical indicators: chlorophyll content, DPPH antioxidant activity, proline content, malondialdehyde (MDA), and reducing sugar content, as described below. Each indicator was measured in technical triplicate per individual and averaged; biological replication was n = 3 per treatment.
2.6.1. Chlorophyll Content
Chlorophyll content was measured using a SPAD-502 chlorophyll meter (Konica Minolta, Tokyo, Japan). Five measurements were taken per leaf, focused on the center, between 11:00 a.m. and 2:00 p.m., every 6 days over 4 weeks.
2.6.2. Proline Content
Proline content was determined according to Bates et al. [
30] by homogenizing 0.5 g of fresh leaf tissue in 5 mL of 3% sulfosalicylic acid, reacting the extract with ninhydrin and acetic acid solution at 100 °C for 1 h, followed by cooling, addition of 4 mL of toluene, and measuring the absorbance at 520 nm. The proline content (mg/g fresh weight) was determined from a standard curve.
2.6.3. DPPH Radical Scavenging Activity
DPPH(2,2-diphenyl-1-picrylhydrazyl) radical scavenging activity was determined by incubating 0.1 g of fresh leaf tissue with 3 mL of 120 µM DPPH solution in darkness for 10 min, followed by measuring the absorbance at 517 nm and calculating the antioxidant capacity (Equation (7)):
2.6.4. Lipid Peroxidation Assay (MDA)
MDA (Malondialdehyde) was measured using the Heath and Packer [
31] method. 0.1 g of leaf tissue was extracted in 0.1% trichloroacetic acid (TCA), then reacted with 20% TCA containing 0.5% thiobarbituric acid (TBA) at 95 °C for 15 min. Absorbance was measured at 532 nm and 600 nm. The MDA content was calculated using Equation (8):
2.6.5. Reducing Sugar Content (DNS ASSAY)
Reducing sugars were determined by the dinitrosalicylic acid (DNS) method [
32]. Fresh leaf tissue (0.10 g) was extracted in 5 mL distilled water; 1.0 mL extract was mixed with 3.0 mL DNS reagent, boiled for 5 min, cooled, and the absorbance was read at 565 nm against a reagent blank. Glucose standards were used to construct a calibration curve. The reducing sugar content was calculated using Equation (9):
where
a and
b are the slope and intercept of the glucose calibration;
Vextract is extract volume (mL);
D is the dilution factor; FW is fresh mass (g).
2.7. Statistical Analysis
Analyses used biological replicates (n = 3) as the unit; technical replicates were averaged within individuals (α = 0.05). All data were statistically analyzed using ANOVA and Student’s t-test (SAS version 9.3, SAS Institute Inc., Cary, NC, USA). Duncan’s multiple range test was applied to determine significant differences at α = 0.05. All data used in the ANOVA met the assumptions of normality and homogeneity of variance. Logistic regression analysis was conducted to estimate LT50 values from electrolyte leakage data. Nonlinear regressions were fitted in SAS 9.3 (PROC NLIN), and model fit was evaluated using R2 and AIC.
3. Results
3.1. Visual Inspection of Cold-Treated Plants
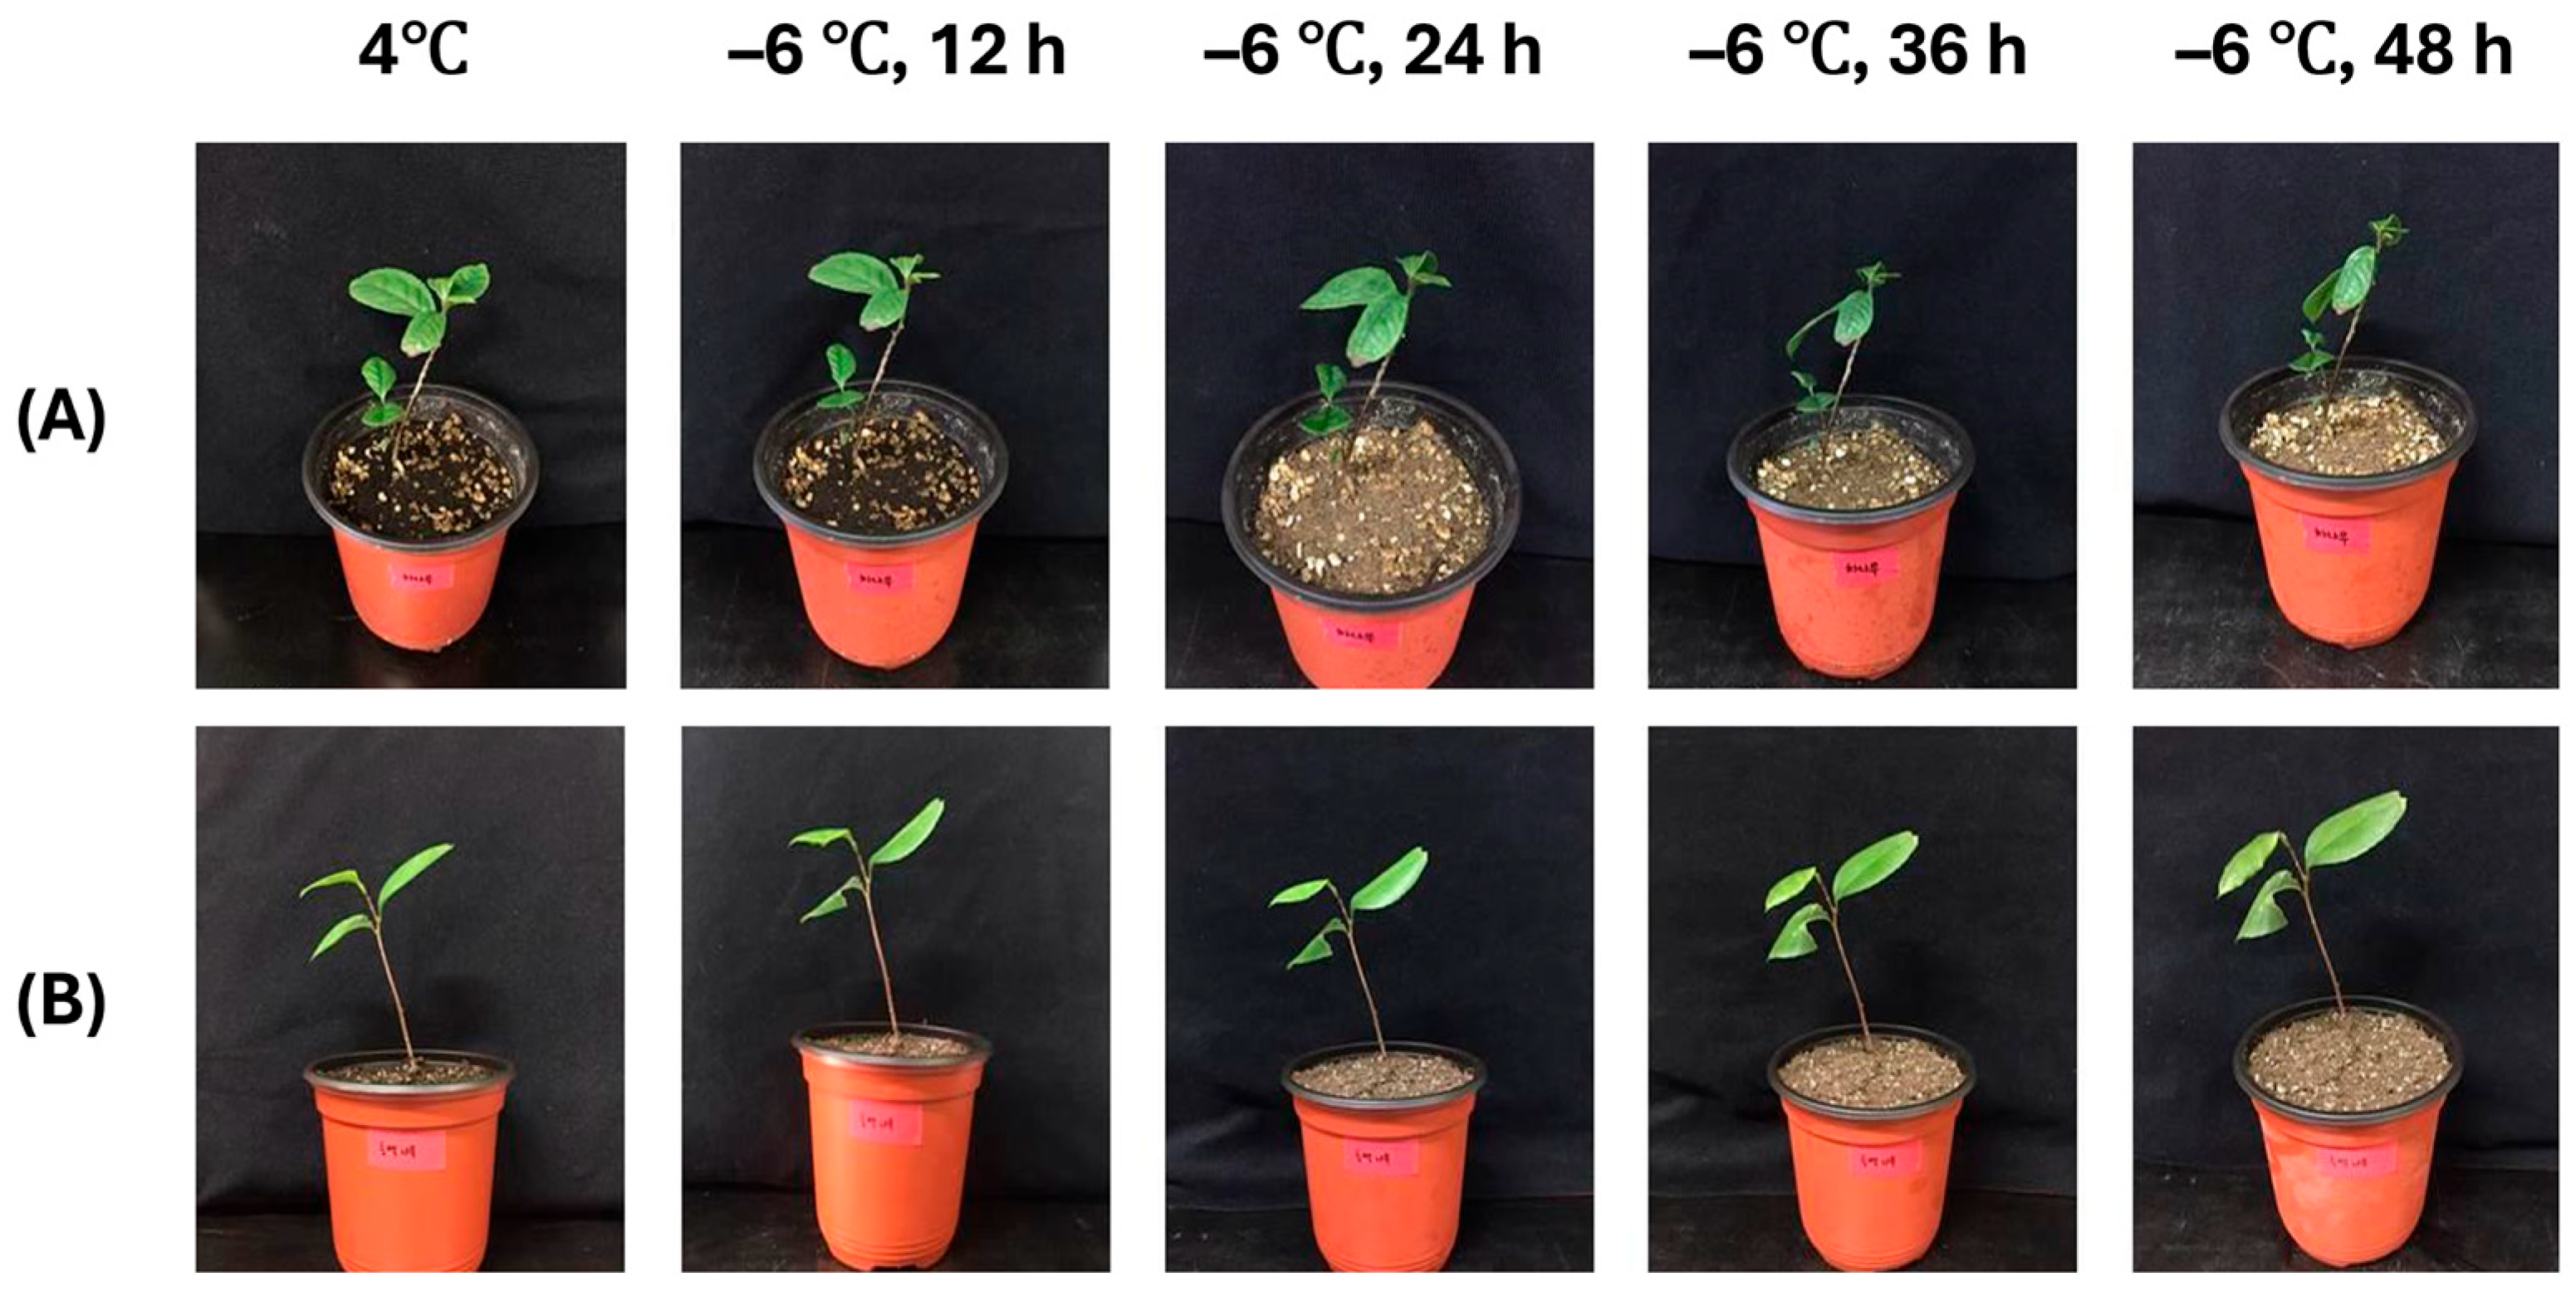
After precooling at 4 °C, both
C. sinensis and
C. japonica showed no noticeable changes compared to their pre-treatment condition (
Figure 2). However, following exposure to −6 °C for 12 h,
C. sinensis maintained its appearance, while
C. japonica exhibited slight curling at the leaf edges. After 24 h, darkening along the leaf veins became visible in both species and progressively intensified up to 36 h. After 48 h of exposure, over 50% of
C. sinensis leaves showed severe darkening and gradual wilting, whereas
C. japonica demonstrated pronounced vein darkening and the most significant curling. These results indicate that maximum visual cold damage occurs after 48 h of exposure at −6 °C.
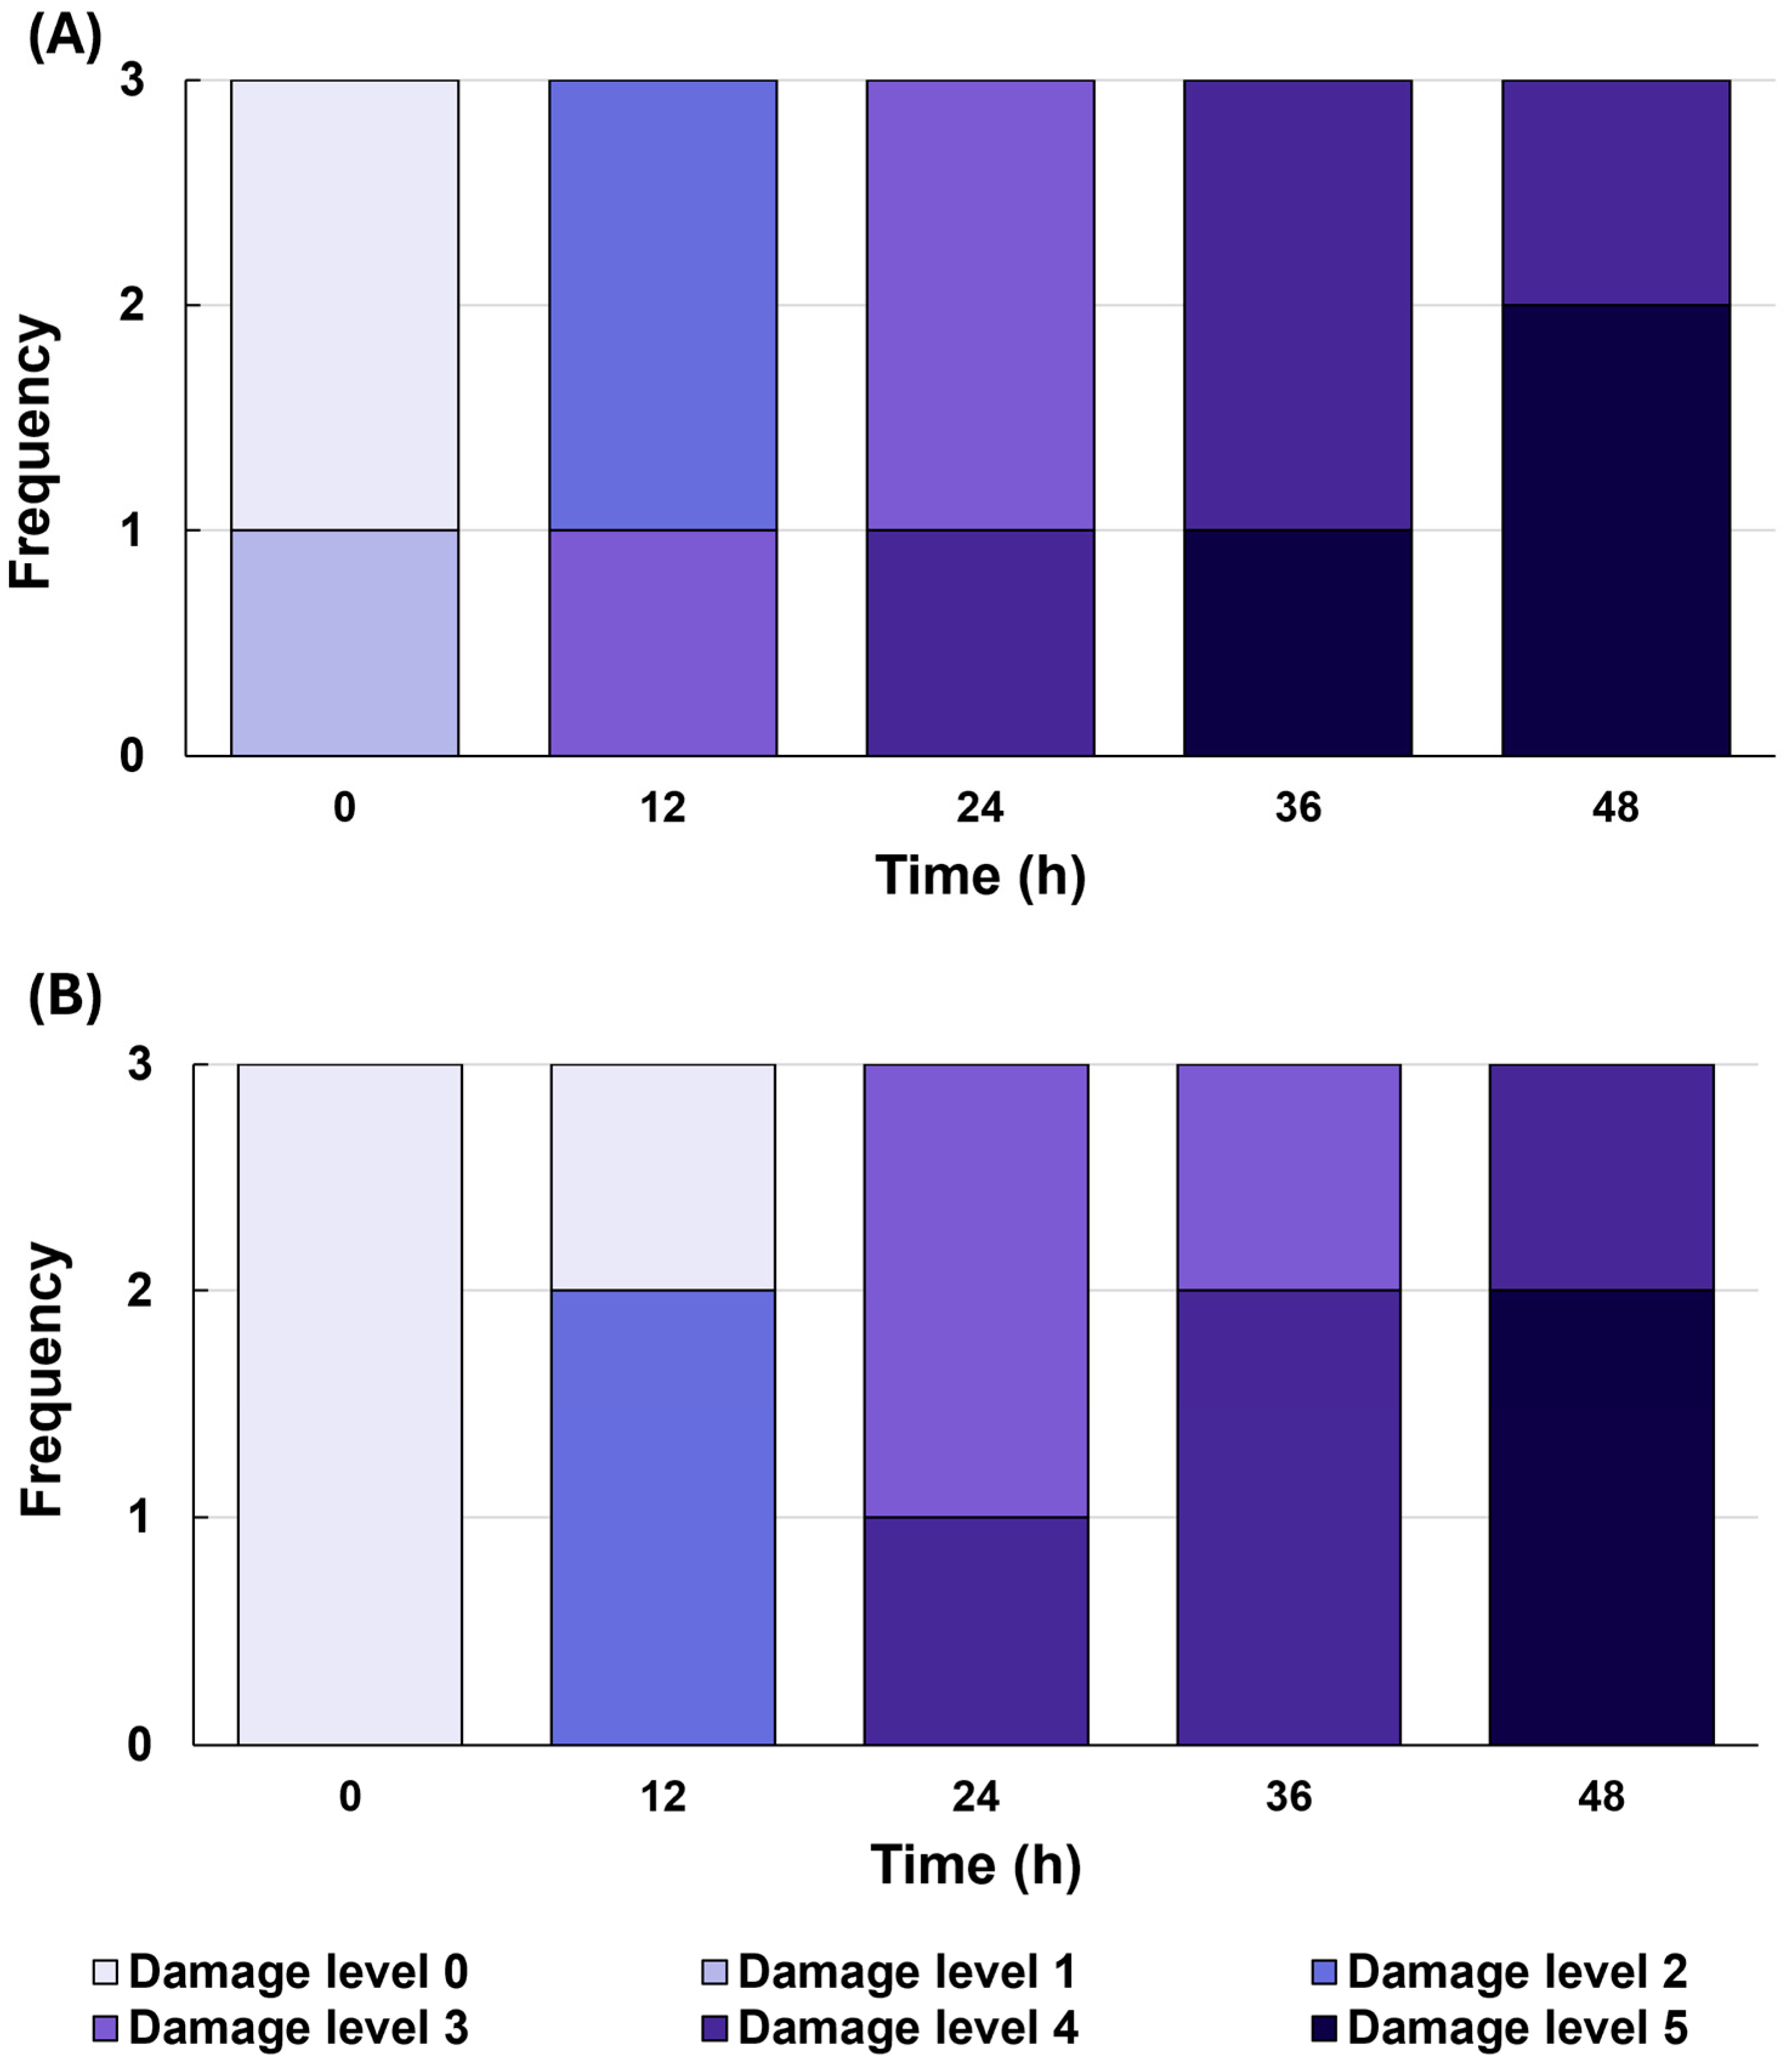
Visual scoring further supported these findings (
Figure 3). At 0 h (end of precooling), a small fraction of
C. sinensis leaves already showed minor damage (levels 1), whereas
C. japonica showed no visible damage.
C. japonica began to exhibit symptoms after 12 h of cold treatment. Both species showed increasing damage from 24 h onward, culminating in significant leaf injury by 48 h. Overall, mean damage scores of
C. sinensis were higher than those of
C. japonica, indicating that
C. sinensis exhibited relatively more cold damage.
3.2. Electrolyte Leakage Measurement and Mortality Temperature Prediction Under Low Temperature Stress
As shown in
Table 1, electrolyte leakage increased in both species as the temperature decreased. At 4 °C and 0 °C,
C. japonica showed lower leakage values (5.3% and 5.8%, respectively) compared to
C. sinensis, which exhibited 14.2% at both temperatures. At −4 °C, electrolyte leakage was 8.9% in
C. japonica and 17.7% in
C. sinensis. At −8 °C,
C. japonica recorded 31.6%, while
C. sinensis showed 20.9%. The highest leakage values were observed at −12 °C, with
C. japonica at 87.3% and
C. sinensis at 75.8%.
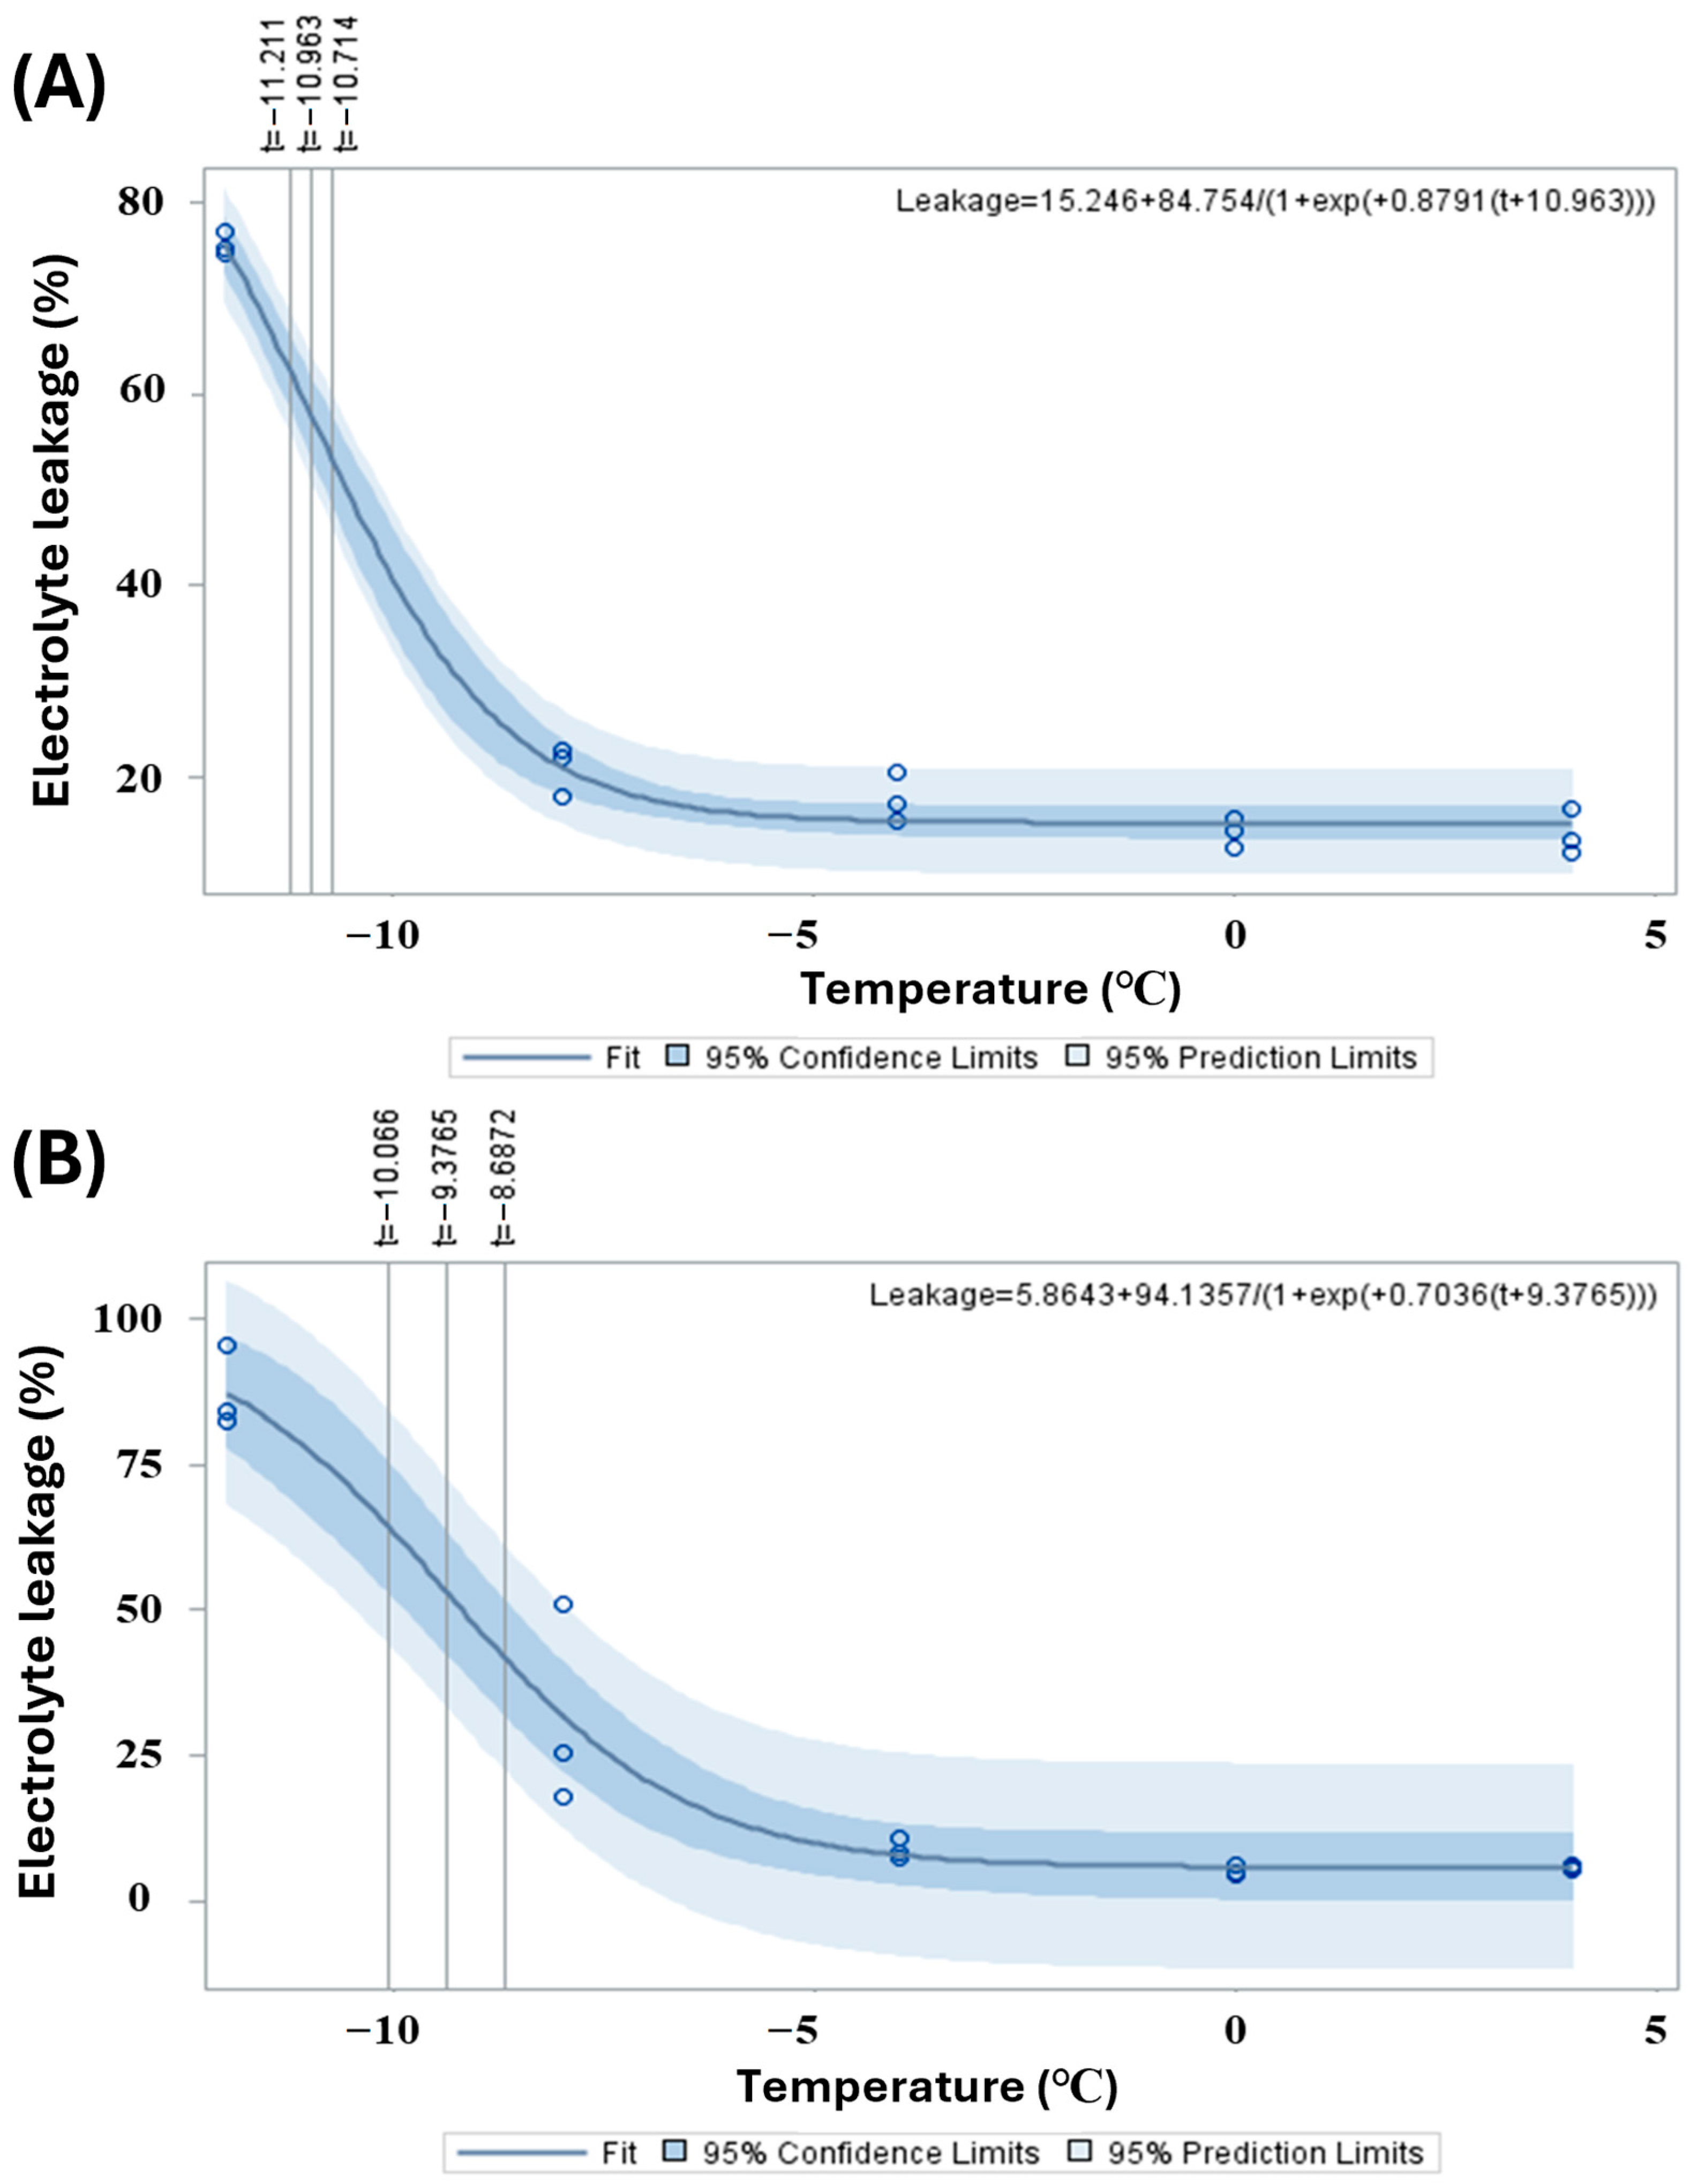
Scatter plots and fitted logistic regression curves for electrolyte leakage in
C. sinensis and
C. japonica in response to low-temperature treatments showed similar patterns (
Figure 4). In
Figure 4A,
C. japonica exhibits a progressive increase in electrolyte leakage as the temperature decreases, which is described by the logistic equation Leakage = 5.8643 + 94.1537/[1 + exp(0.7036 × (
T + 9.3765))]. The leakage rate remains relatively low above −4 °C, then increases sharply, surpassing 70% around −10 °C. The dark blue region indicates the 95% confidence interval, while the light blue region represents the 95% prediction interval, suggesting a consistent and predictable response to cold stress with relatively low variability among samples.
In
Figure 4B,
C. sinensis follows a similar overall trend, but electrolyte leakage begins to increase more slowly and at a slightly lower temperature. The fitted equation for
C. sinensis is Leakage = 15.246 + 84.754/[1 + exp(0.8791 × (
T + 10.963))]. Leakage exceeds 70% near −11 °C, reflecting less severe membrane damage than in
C. japonica. The steeper slope of the curve, combined with broader 95% confidence and prediction intervals, indicates higher sensitivity to cold stress and greater variability in physiological responses across samples.
Table 2 summarizes the estimated LT
50 values—defined as the temperatures at which 50% electrolyte leakage occurs—for
C. sinensis and
C. japonica, providing a quantitative indicator of cold tolerance. For
C. sinensis, the LT
50 was determined to be −10.96 ± 0.114 °C, with a 95% confidence interval ranging from −11.21 °C to −10.71 °C, based on the logistic regression model.
Additionally, the ELTemp50—defined as the exact temperature at which 50% electrolyte leakage is observed from the fitted curve—was calculated as −9.59 °C for C. sinensis, suggesting a higher degree of cold tolerance, as significant membrane damage only occurs at lower temperatures. In contrast, C. japonica exhibited a higher LT50 of −9.38 ± 0.316 °C, with a 95% confidence interval between −10.07 °C and −8.69 °C, as derived from the logistic equation.
The corresponding ELTemp50 for C. japonica was estimated at −8.97 °C, indicating that this species initiates significant membrane leakage and damage at comparatively higher temperatures, reflecting a lower cold tolerance than C. sinensis.
3.3. Degree of Cell Death in Cold-Treated Plants
C. japonica and
C. sinensis leaves exhibited different degrees of cell death following cold treatments, as assessed by Evans blue staining (
Figure 5).
Figure 5A displays the results for
C. japonica, while
Figure 5B shows those for
C. sinensis. In this staining method, dead cells absorb Evans blue dye, resulting in dark blue coloration, whereas living cells remain unstained and retain a greenish hue.
At 4 °C and 0 °C, both species showed minimal staining, with leaf tissues appearing predominantly green, indicating low levels of cell death and suggesting that cell membranes remained intact under these mild cold stress conditions. However, at −4 °C, slight blue staining began to appear, particularly in C. japonica, suggesting the onset of membrane damage and early-stage cell death in some leaf areas.
As the temperature dropped to −8 °C, the staining became more prominent in both species, but the intensity and spread of blue coloration were noticeably greater in C. sinensis. This indicates that C. sinensis experienced a higher degree of membrane damage and cell death under this level of cold stress. In contrast, C. japonica still exhibited relatively less staining, suggesting greater membrane stability and enhanced tolerance to cold stress.
At −12 °C, both species exhibited extensive dark blue staining across the leaf tissues, indicating severe cold-induced membrane disruption and widespread cell death. However, the severity was still greater in C. sinensis, which showed more intense and uniform blue coloration throughout the leaf. C. japonica, on the other hand, retained more green-colored regions, reflecting relatively lower levels of membrane damage and better cold resistance.
For reference, the images at 80 °C were included as a negative control. Under this extreme heat treatment, both species displayed uniformly intense dark blue staining, confirming complete loss of membrane integrity and total cell death. This control validates the effectiveness of the Evans blue staining method in distinguishing living from dead cells under thermal stress conditions.
To quantify the amount of Evans blue dye, absorbance was measured and the cell death rate was calculated (
Figure 6). The absorbance of dyed leaves and the calculated cell death rates were higher in
C. sinensis than in
C. japonica within the temperature range of −8 to 4 °C, consistent with the visual assessment. However, at −12 °C, the absorbance and cell death rate of
C. japonica increased rapidly and slightly exceeded those of
C. sinensis.
3.4. Linear Regression Between Electrolyte Leakage and Cell Death Rate
A strong relationship between electrolyte leakage and cell death was observed in
C. sinensis and
C. japonica, with cell death assessed via Evans blue staining (
Figure 7).
In
Figure 7A,
C. sinensis shows a linear regression model described by the equation y = 0.8160x + 4.7882, indicating a strong positive correlation between electrolyte leakage and cell death. The data points are distributed in two distinct clusters: Group 1 represents samples with low electrolyte leakage (0%–30%) and minimal cell death, while Group 2 corresponds to samples with high leakage (above 55%) that exhibit a steep increase in cell death. This distribution pattern suggests that
C. sinensis undergoes relatively gradual cell damage under cold stress, with marked cell death occurring only after substantial membrane injury, as reflected by elevated leakage values.
Figure 7B illustrates the regression analysis for
C. japonica, with the equation y = 1.002x + 6.938. This regression line has a steeper slope than that of
C. sinensis, implying a nearly one-to-one relationship between electrolyte leakage and cell death. The data points for
C. japonica are grouped into three distinct clusters: Group 1 (low leakage and minimal cell death), Group 2 (intermediate leakage with a moderate rise in cell death), and Group 3 (high leakage with a sharp increase in cell death). A noticeable sharp rise in cell death is observed once leakage exceeds 55%, indicating that
C. japonica is more susceptible to cold-induced membrane damage and exhibits a more immediate cell death response. Furthermore, the broader confidence and prediction intervals for
C. japonica suggest greater variability and less consistency in physiological responses to cold stress compared to
C. sinensis.
3.5. Biochemical Analysis According to Cold Treatment
Under low temperature stress,
C. sinensis and
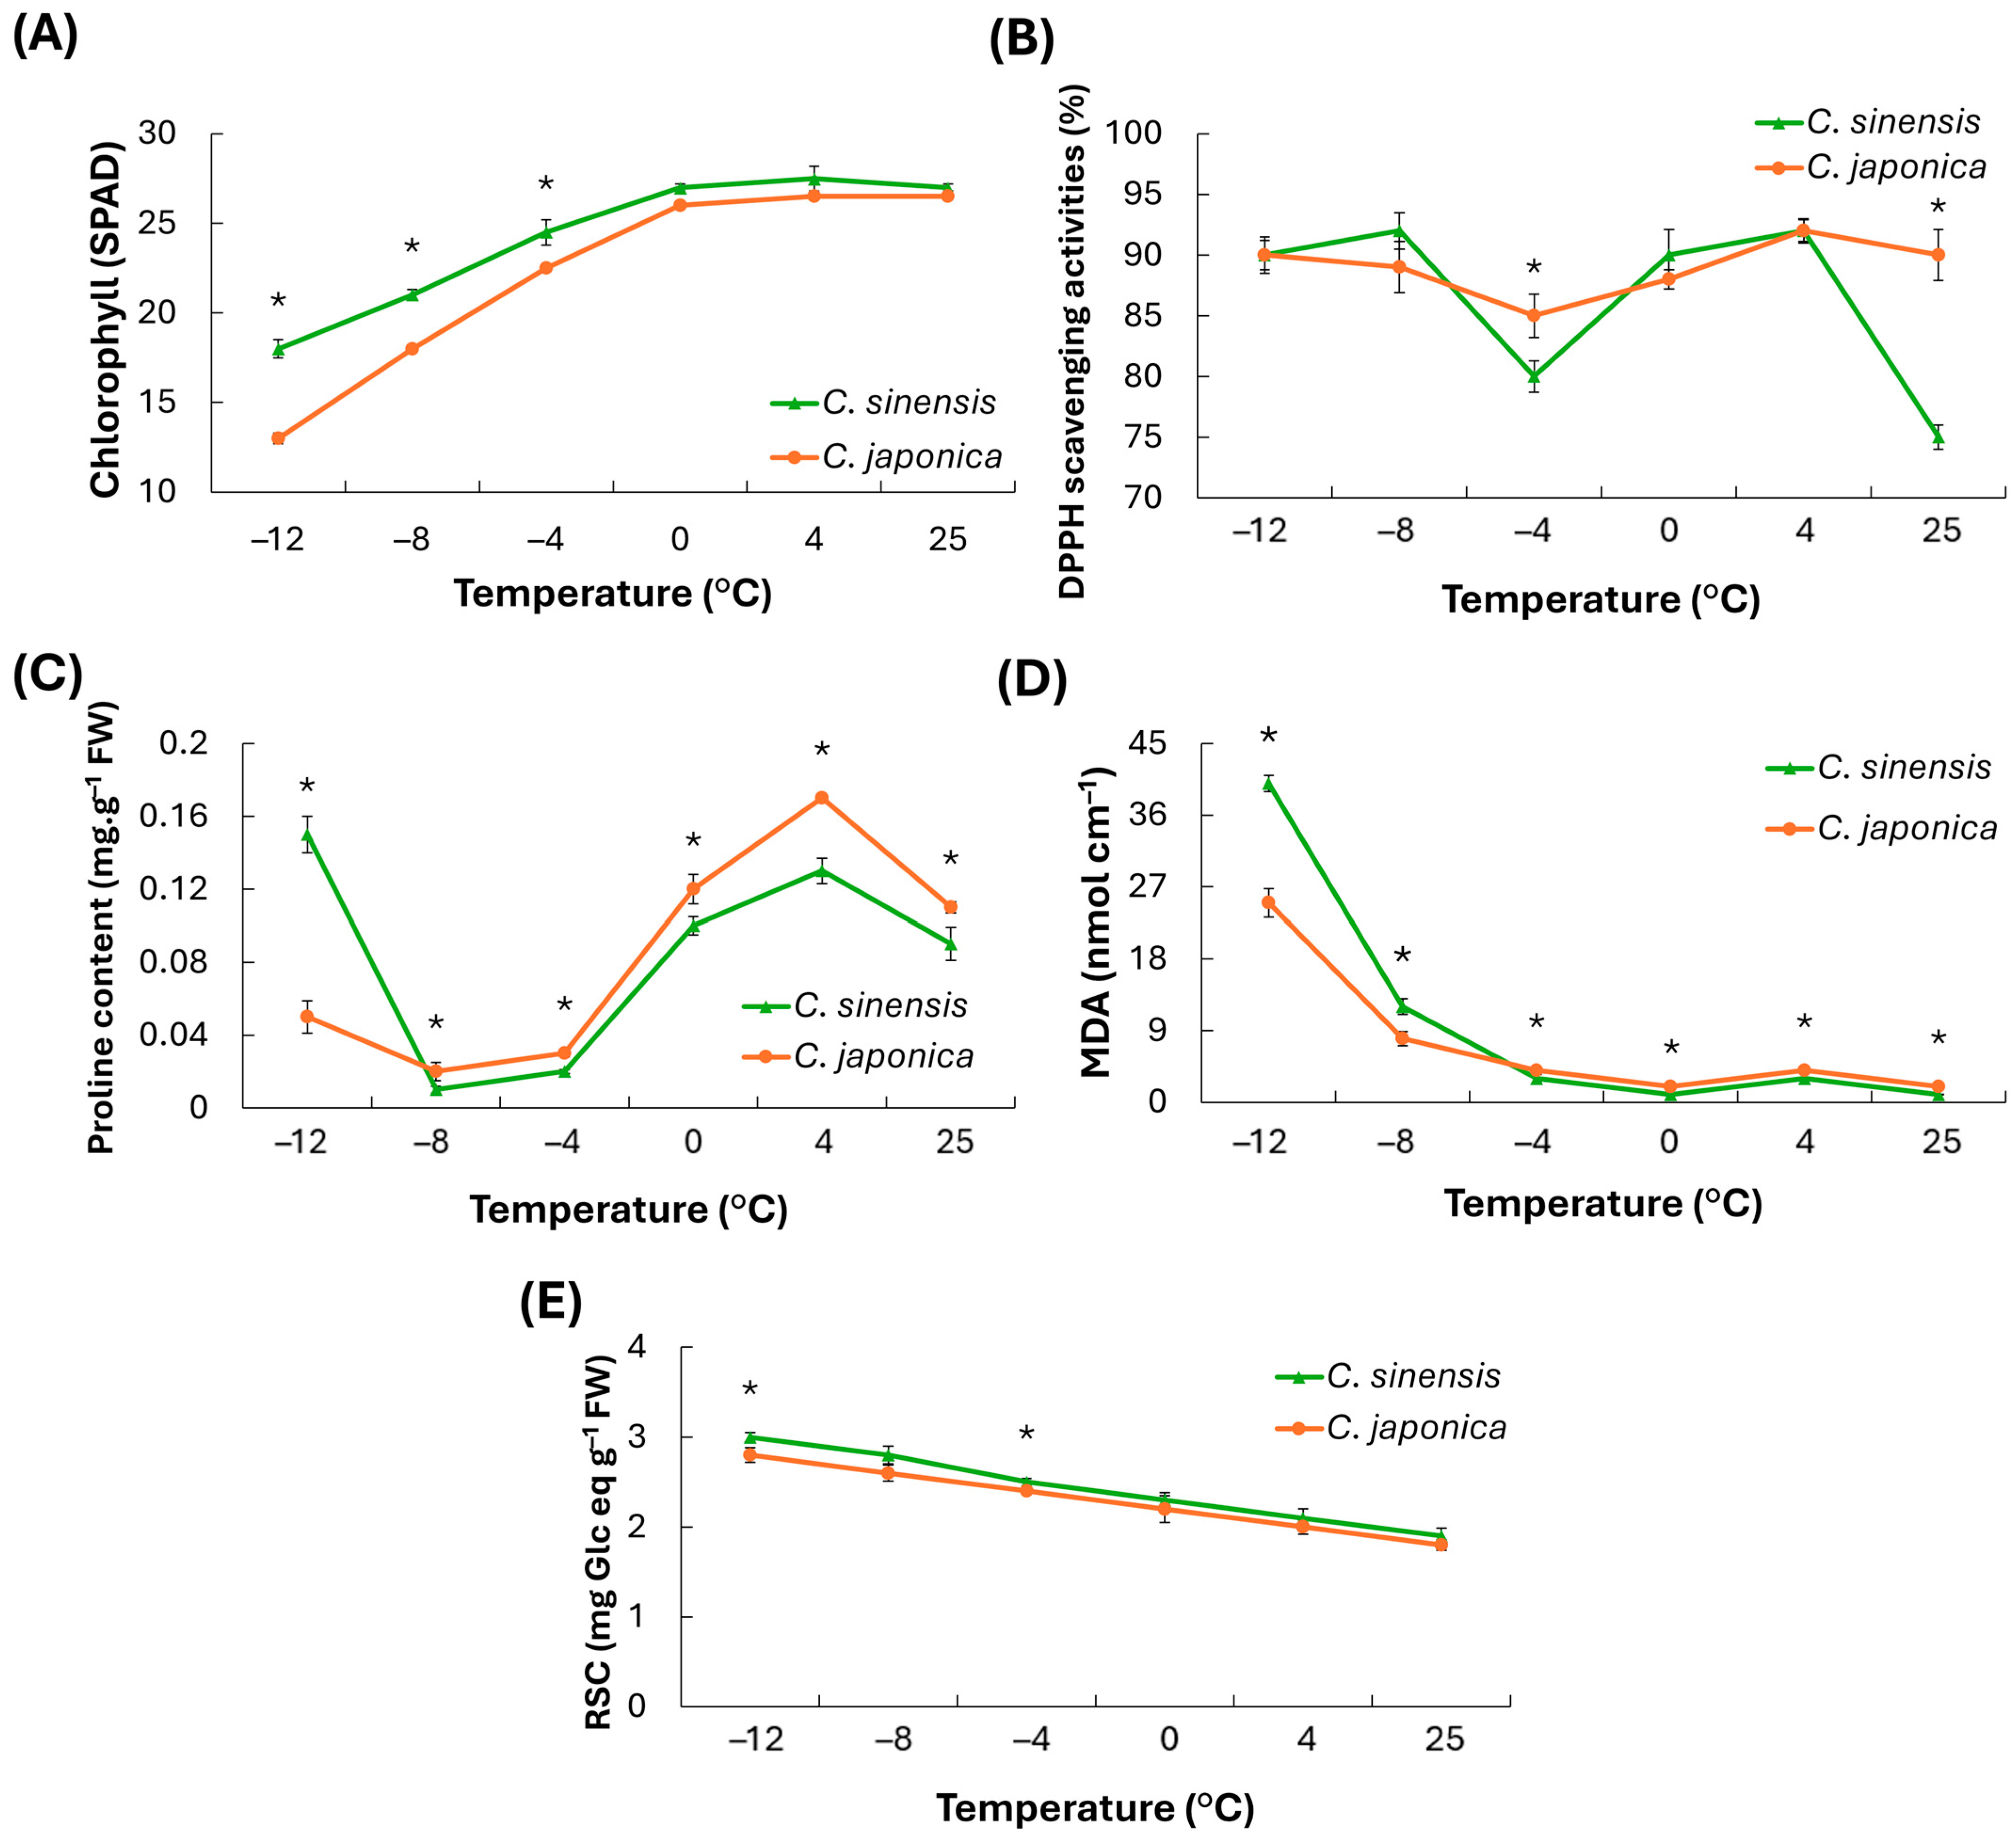
C. japonica showed distinct biochemical response profiles across the five indicators (
Figure 8).
Chlorophyll content decreased as temperature declined and increased gradually during recovery. Across all temperatures, C. sinensis consistently maintained higher values than C. japonica.
DPPH radical-scavenging activity remained generally high but showed a transient decline around −4 to 0 °C, followed by recovery between 4 and 25 °C. At most temperatures, C. sinensis exhibited slightly higher activity or a smaller decrease than C. japonica, except at −4 °C.
Proline content was low at −12 to −8 °C, peaked at 0–4 °C, and then decreased at 25 °C. Across the entire temperature range, C. japonica accumulated more proline than C. sinensis, with the largest species difference at 0–4 °C.
MDA (a marker of membrane lipid peroxidation) was highest at −12 °C and declined sharply as temperature increased, remaining low at 4–25 °C. At −12 and −8 °C, C. sinensis exhibited higher MDA than C. japonica, but showed slightly lower values at higher temperatures. These findings suggest that lipid peroxidation and associated membrane damage is temperature-dependent and more pronounced under cold conditions.
The reducing sugar content was higher at lower temperatures and decreased approximately linearly as temperature increased. Throughout the range, C. sinensis maintained a higher value than C. japonica, suggesting greater sugar accumulation (osmoprotection) under cold stress.
In summary, protective indicators (chlorophyll, DPPH, reducing sugars) were maintained at relatively higher levels in C. sinensis, whereas stress/damage indicators (proline, MDA) were higher in C. japonica. Overall, C. sinensis exhibited a more stable physiological status and greater cold tolerance.
3.6. Temperature-Dependent Physiological Responses Under Cold Stress
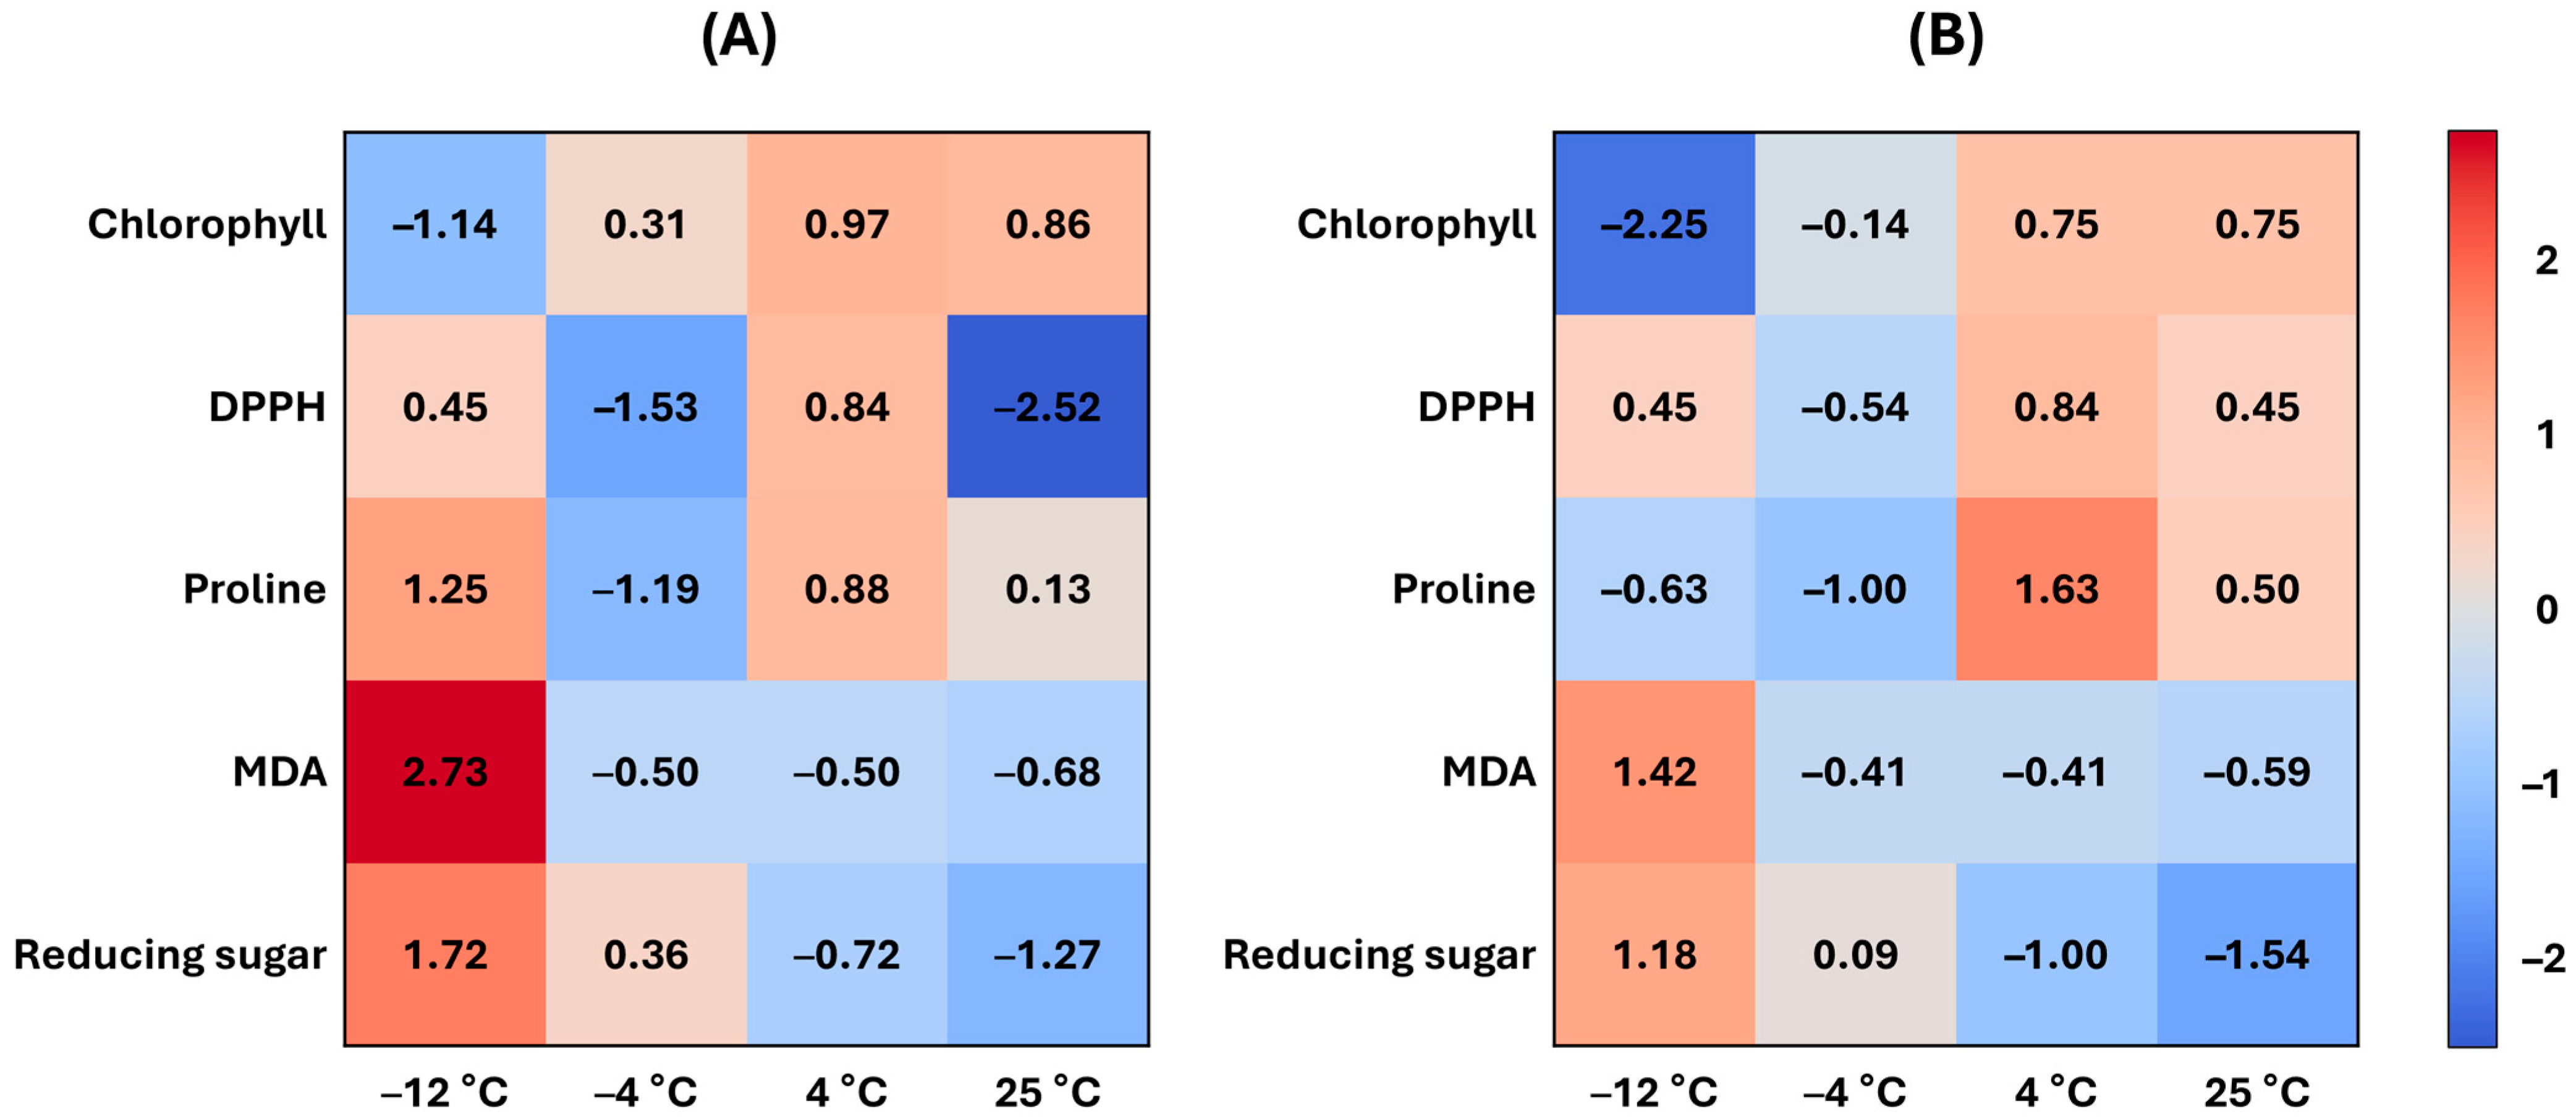
Heat maps of five biochemical indicators (chlorophyll content, DPPH antioxidant activity, proline content, MDA accumulation, and reducing sugar index) revealed distinct differences between
C. sinensis (
Figure 9A) and
C. japonica (
Figure 9B) across 25 °C, 4 °C, −4 °C, and −12 °C. The color intensity represents relative magnitude. Values are standardized within each indicator, and temperature labels are shown on both panels for direct comparison. Absolute trajectories are provided in
Figure 8.
As temperature decreased, both species showed reductions in chlorophyll and antioxidant activity, with C. sinensis maintaining relatively higher levels of chlorophyll, but lower levels of antioxidant activity compared to C. japonica. Proline and MDA increased with decreasing temperature, with C. japonica showing higher values that indicate a stronger stress response and more severe membrane damage. The reducing sugar index increased more in C. sinensis, reflecting a greater capacity for osmotic adjustment. Across indicators, C. sinensis showed more stable responses, whereas C. japonica showed more sensitive physiological changes.
4. Discussion
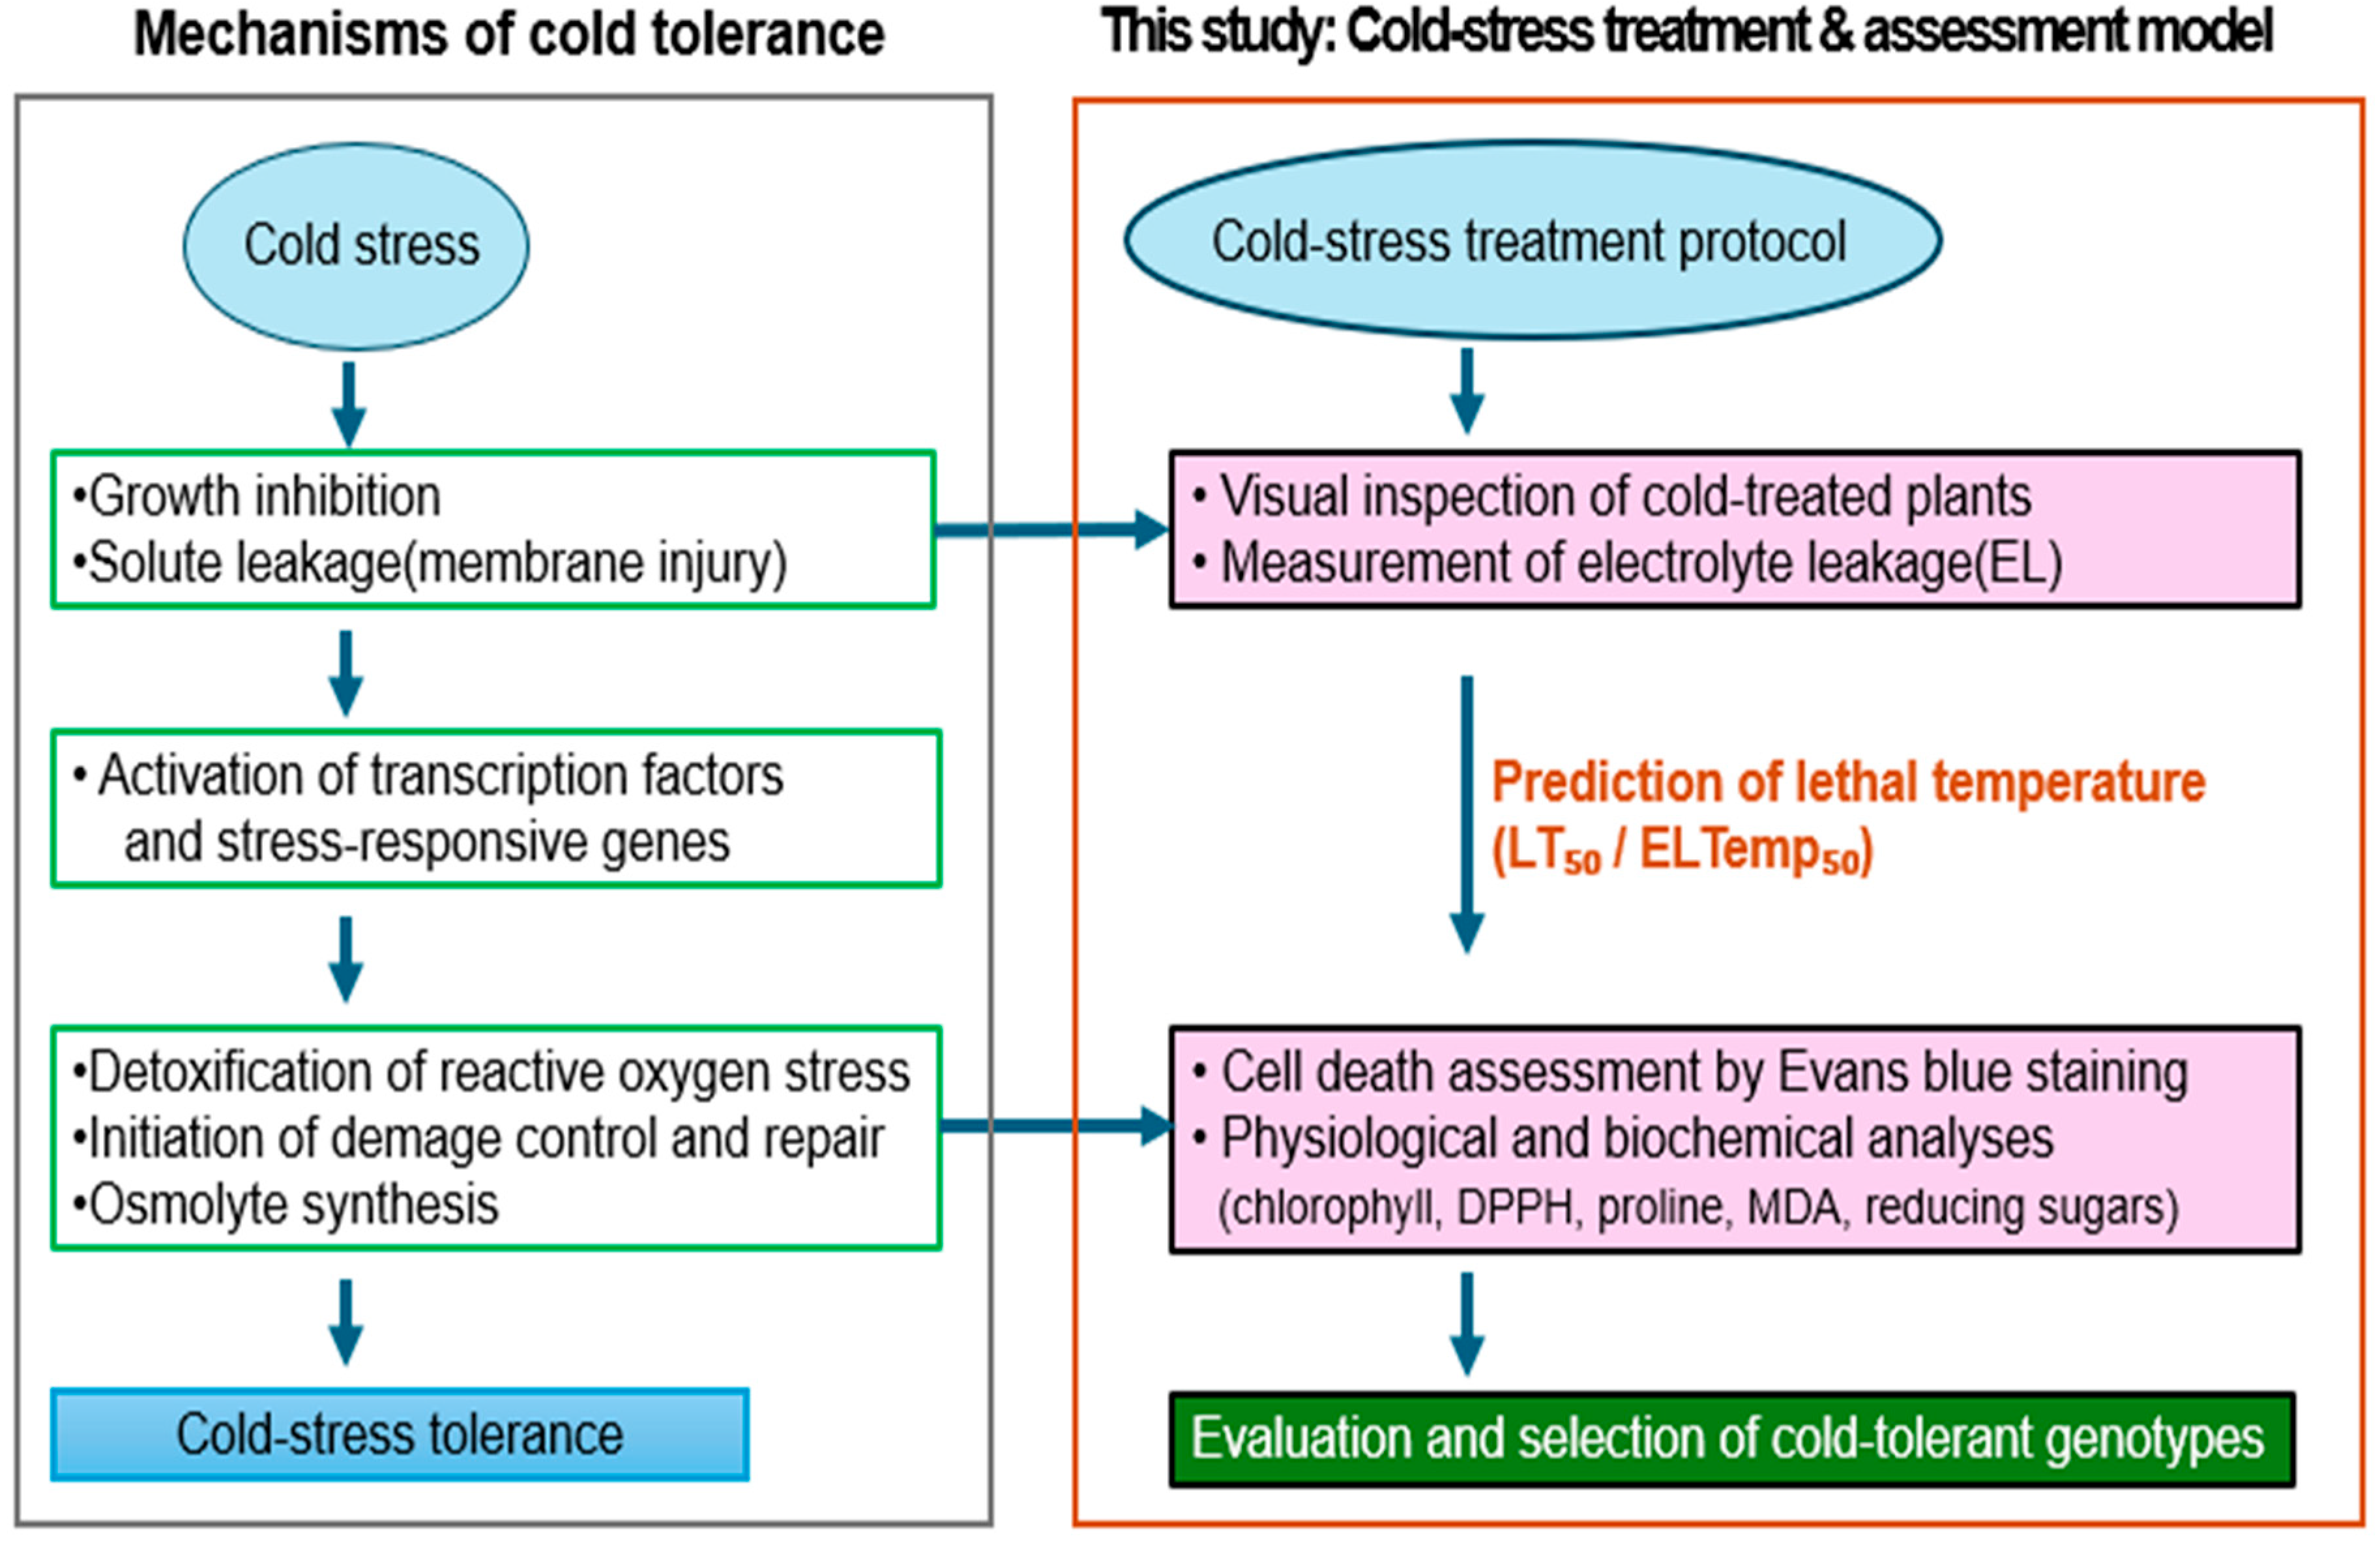
In this study, we evaluated cold tolerance using a combination of visual observation, electrolyte leakage, and cell death measurement via Evans blue staining (
Figure 10).
Visual observation is one of the easiest ways to assess plant damage. If applied accurately, it can be a very effective method. However, it has limitations in precisely quantifying cold-induced damage, making it more suitable for comparing differences between plant species [
33,
34]. Furthermore, it relies on the observer’s empirical knowledge, so it cannot be considered an entirely objective judgment. Despite these limitations, visual observation has been effectively used in many studies for preliminary assessment of plant stress responses [
35,
36]. Yet, visual observation is considered a good method for initial cold tolerance assessment, especially when combined with more quantitative methods.
In this study, we confirmed that electrolyte leakage values and the degree of cell death correlated significantly with leaf discoloration after cold stress was applied [
37]. This observation is consistent with previous findings where visual symptoms, such as leaf discoloration and wilting, correlated with physiological damage under cold stress [
38,
39]. Furthermore, studies by Steponkus [
40] and Pearce [
41] emphasized that visual symptoms often align with increased membrane permeability and cell death, validating the use of visual assessment in early stress detection. Therefore, while visual inspection alone may lack precision, its value is significantly enhanced when used in conjunction with physiological measurements.
The degree of cell death was analyzed to more accurately confirm damage caused by low temperatures. Evans blue dye is widely used in cell membrane permeability studies; it’s non-toxic and serves as a vital stain [
42]. This method is based on staining dead cells, allowing for accurate stress evaluation without the need for high-temperature treatments. Evans blue dye binds to protein in cells with compromised membranes, making it a reliable indicator of cell viability [
43]. However, previous studies have demonstrated the effectiveness of Evans blue staining in detecting membrane damage induced by stress such as drought and heat in the roots and leaves of plants. Nevertheless, examples analyzing plant responses to cold stress using this method are scarce, with the exception of a study on Liliaceae species by Yang et al. [
44].
While various methods exist for immediate stress monitoring, such as trypan blue and fluorescein diacetate staining, the Evans blue method was chosen for this study due to its simplicity and accuracy [
45,
46]. Compared to other staining methods, Evans blue provides more consistent results without the need for additional enzymatic reactions or complex procedures [
47]. This method is highly effective for assessing cell death or membrane damage [
45,
48]. Evans blue is an acidic dye that stains dead and damaged cells, making it particularly suitable for evaluating cold stress-induced damage [
49]. Research by Campos et al. [
50] and Zhang et al. [
51] further validated the accuracy and reproducibility of Evans blue staining for assessing cellular damage under abiotic stress conditions.
This method allows for accurate stress evaluation without heat treatment, minimizing additional stress artifacts during analysis [
43,
49]. Visualizing stressed plants using Evans blue staining has been shown to effectively measure tolerance to various abiotic stresses, including drought, salinity, and temperature extremes [
52,
53]. The method used in this study is highly reproducible and can be a valuable tool for precisely diagnosing plant conditions. This aligns with findings by Jansen et al. [
54], who reported that Evans blue staining provides consistent and repeatable results across different experimental setups. Overall, the use of Evans blue in this study provides a reliable and validated approach for quantifying cell death due to cold stress, complementing other physiological and biochemical assessments.
4.1. Electrolyte Leakage and LT50 Analysis
Another analytical approach involved examining the correlation between electrolyte leakage and cell death. Regression analysis is a widely used statistical technique that models the relationship between independent and dependent variables, providing insights into how changes in one variable influence another [
55]. While correlation analysis and basic linear regression are employed to infer relationships between two variables, they cannot capture nonlinear relationships. Advanced statistical models, such as polynomial regression and non-parametric methods, have been proposed for better capturing complex biological interactions [
56]. Nevertheless, correlation and regression analyses are commonly used in many studies to determine the relationship between two variables [
57]. However, relying solely on the R
2 value from correlation analysis to understand the relationship can be risky. Even with high R
2 values, the presence of outliers or non-linear trends within the data can be misleading [
58].
Consequently, in both species, electrolyte leakage exceeding 55% resulted in cell death surpassing 50%. Therefore, electrolyte leakage measurement, while not a complete substitute for cell death measurement, can serve as complementary data. Combining both methods allows for a more comprehensive understanding of plant responses to cold stress and enhances the accuracy of damage assessment [
59]. Electrolyte leakage is one of the most widely used methods to estimate plant damage due to low temperatures [
33]. This method quantitatively assesses cell membrane stability under stress conditions and is considered a standard technique in cold tolerance research [
60]. It is employed to evaluate cell membrane permeability loss caused by environmental stress, growth, and development [
61]. Measuring electrolyte leakage due to cell membrane permeability loss has been utilized to assess plant cold tolerance [
62]. A similar approach has been successfully applied in various plant species to evaluate freezing damage and analyze its correlation with survival [
50,
63].
To quantify temperature-induced differences between species, we estimated LT
50 values from logistic fits to the electrolyte leakage data, as LT
50 is commonly used to compare cold tolerance among plants [
6,
64,
65]. However, we found that the Y-axis value corresponding to the inflection point on the X-axis of the logistic curve was not exactly 50%, indicating that this value did not fully reflect the cold tolerance between species. This inconsistency aligns with previous observations that LT
50 values tend to overestimate lethal temperatures due to limitations in curve fitting [
41]. The temperature at which electrolyte leakage reaches exactly 50% should therefore be computed directly from the fitted function. For this reason, we designated the temperature at which electrolyte leakage precisely reached 50% as EL Temp
50 (Electrolyte Leakage Temperature 50). Thus, at exactly 50% electrolyte leakage, the EL Temp
50 values for
C. sinensis and
C. japonica were approximately −9.59 °C and −8.97 °C, respectively. This adjusted indicator addresses the limitations of LT
50-based assessments and more accurately reflects plant cold tolerance [
66].
Many prior studies comparing predicted LT
50 values with actual survival and regeneration temperatures have also shown a tendency to overestimate the true lethal temperature. This overestimation is a well-known limitation of LT
50, which may not fully reflect partial damage or recovery potential [
41,
63]. Several factors contribute to the overestimation of electrolyte leakage [
26]. One factor is that the inflection point value is the midpoint between the initial value (z) and 100% electrolyte leakage. Therefore, the actual electrolyte leakage is not precisely 50%, nor is it strictly the midpoint between 0% and 100%. These methodological constraints affect the accuracy of evaluating the true cold damage threshold [
66]. Consequently, this limitation can hinder the precise determination of cold tolerance. As EL Temp
50 has lower values than LT
50, it is expected to overcome the disadvantage of overestimating the actual temperature. EL Temp
50 directly reflects membrane stability under freezing stress, allowing for a more accurate estimation of cold tolerance [
67].
Biologically, LT50 marks the inflection where freezing injury accelerates (maximum slope), whereas EL Temp50 pinpoints the exact temperature at which membrane leakage reaches 50%. The gap between these metrics (LT50 − ELTemp50), together with the slope parameter, separates the onset from the rate of membrane failure: smaller gaps and shallower slopes indicate greater membrane stability and buffering capacity. In our data, C. sinensis showed lower LT50 and ELTemp50 with a more gradual slope, consistent with delayed onset and slower progression of injury relative to C. japonica.
Furthermore, Kim et al. [
65] reported that cold-tolerant species exhibit a more gradual slope in their response curve, whereas sensitive species show a steeper slope. These results are consistent with observations that a more gradual response curve in cold-tolerant plants is associated with increased adaptability and cell membrane stability [
34,
68]. The slopes of the response curves for
C. sinensis and
C. japonica were 0.88 and 0.70, respectively, with
C. sinensis showing a more gradual slope than
C. japonica. Comparing the LT
50 values of the two species,
C. sinensis demonstrated higher cold tolerance. This result aligns with previous findings that species with a more gradual electrolyte leakage curve, indicating slower progression of membrane damage, possess superior cold tolerance [
59].
4.2. Biochemical Analysis of Cold-Treated Plants
Cold stress induces cellular dysfunction. Cold-induced damage disrupts various physiological and biochemical pathways, negatively impacting cell function and overall plant health [
34,
68]. Plant cold tolerance is known to involve preventing cellular damage through changes in gene expression and the accumulation of antioxidants and osmolytes [
69]. These adaptive mechanisms include the activation of cold-responsive (COR) genes and the synthesis of protective proteins and metabolites [
70].
The biochemical and physiological responses of the two species under cold treatment were investigated. Cold treatment decreased chlorophyll content. This reduction is due to the degradation of chlorophyll molecules and the inhibition of their biosynthesis, which is a common phenomenon under cold stress [
71]. Chlorophyll biosynthesis can be reduced by the inhibition of biosynthetic enzyme activity [
72,
73].
In our dataset, DPPH radical scavenging ability decreased toward lower temperatures in both species; however,
C. sinensis generally maintained higher activity than
C. japonica. Although activity temporarily declined at −4 °C, with
C. japonica exhibiting higher levels than
C. sinensis, this likely reflects a chilling-to-incipient-freezing transition accompanied by short-lived rebalancing of soluble antioxidants. This downward trend likely reflects cold-induced oxidative pressure and partial depletion or reduced efficiency of non-enzymatic antioxidant pools at low temperature, even as antioxidant defenses are mobilized under stress. Consistent with the literature, cold stress typically triggers activation of ROS-scavenging systems, including enzymatic components such as superoxide dismutase (SOD) and peroxidase (POD), as well as non-enzymatic antioxidants like phenolic compounds [
73,
74,
75]. Enhanced activity of these enzymes has been observed in plants exposed to cold stress, indicating their protective role [
76,
77]. Plants with higher expression or activity of SOD, CAT, and POD exhibit better cold tolerance, maintaining cellular integrity and photosynthetic efficiency under stress [
78,
79]. Thus, while measured DPPH activity declined with temperature in this study, the overall antioxidant response is still expected to be engaged under cold stress, with species-level differences favoring
C. sinensis.
Cold treatment also increased proline content. Proline acts not only as an osmolyte but also as a molecular chaperone that stabilizes proteins and cell membranes under stress [
80]. Proline accumulates in response to various abiotic stresses and functions in osmoregulation and as a cell wall component [
81]. Different cultivars exhibit varying levels of proline accumulation under cold stress, and highly cold-tolerant plants tend to accumulate more proline, resulting in less oxidative damage [
82].
Cold stress also increased MDA content, indicating cell membrane damage. MDA is a reliable indicator of lipid peroxidation and oxidative stress [
83]. Generally,
C. sinensis showed lower MDA levels compared to
C. japonica, suggesting higher membrane stability and greater resistance to oxidative stress in the more cold-tolerant species [
83]. However,
C. japonica exhibited lower MDA levels at extreme cold stress, indicating that MDA measurements may not always accurately reflect membrane damage in all species. While MDA is a reliable indicator of lipid peroxidation, its levels can be influenced by species-specific metabolic responses, potentially leading to under- or overestimation of oxidative stress.
Reducing sugar content, essential for freezing tolerance, was higher in
C. sinensis than in
C. japonica. This result is consistent with previous research [
84]. Reducing sugars act as osmoprotectants and stabilize cellular structures during freezing stress, thereby increasing cold tolerance [
85].
5. Conclusions
This study establishes and validates an integrated, quantitative framework for assessing cold tolerance in C. sinensis and C. japonica. By combining visual scoring, electrolyte-leakage (EL) measurements with four-parameter logistic modeling, Evans blue-based cell-death assessment, and a panel of biochemical indicators, the approach overcomes limitations of single-method evaluations and yields precise, reproducible estimates of cold injury. A central contribution is the EL Temp50 metric, which complements the conventional LT50 by reporting the exact temperature at which EL reaches 50%, thereby reducing bias from inflection-point approximations and sharpening interspecific comparisons. The strong correspondence between Evans blue and EL confirms that both capture membrane integrity under cold stress, while measurements of chlorophyll, proline, malondialdehyde, reducing sugars, and antioxidant activity provide physiological context that strengthens interpretability. Collectively, this framework offers a robust basis for ranking cold tolerance and supports the selection and breeding of cold-tolerant Camellia genotypes and the design of adaptive cultivation strategies under climate change. Future RT-qPCR/RNA-seq of key cold-responsive genes in both species will validate and refine these physiological inferences.
This multimethod, quantitative framework is readily transferable to other woody and ornamental species and can be integrated into predictive screening pipelines for germplasm improvement and resource management, enabling reproducible cross-taxon assessment of cold tolerance.
