Article

Integrated Analysis of Phenotypic, Physiological, and Biochemical Traits in Betula platyphylla Sukaczev Under Cold Stress Conditions

1
State Key Laboratory of Tree Genetics and Breeding, Northeast Forestry University, Hexing Road, Harbin 150040, China
2
Faculty of Forestry, Universitas Sumatera Utara, USU 2 Bekala Campus, Pancurbatu, Deli Serdang 20355, Indonesia
3
Center of Excellence for Mangrove, Universitas Sumatera Utara, Medan 20155, Indonesia
4
Center of Excellence for Bamboo, Universitas Sumatera Utara, Medan 20155, Indonesia
5
Department of Biochemistry and Molecular Science, Tulane University, New Orleans, LA 70112, USA
6
Major of Forestry, Faculty of Agriculture, Universitas Khairun, Campus II Gambesi, Jl. Jusuf Abdulrahman, Ternate 97719, North Maluku, Indonesia
7
Forestry Department, Faculty of Agriculture, Universitas Riau, Pekanbaru-Riau, Indonesia
*
Author to whom correspondence should be addressed.
Forests 2025, 16(7), 1176; https://doi.org/10.3390/f16071176
Submission received: 18 June 2025 / Revised: 4 July 2025 / Accepted: 15 July 2025 / Published: 16 July 2025
(This article belongs to the Section Forest Ecophysiology and Biology)

Abstract

Betula platyphylla Sukaczev (white birch) is a cold-tolerant tree species native to northeastern Asia, valued for its ecological adaptability and economic utility. While its responses to various abiotic stresses have been studied, the physiological and biochemical mechanisms underlying its cold stress tolerance remain insufficiently explored. In this study, we investigated the effects of prolonged cold exposure (6 °C for up to 27 days) on key physiological and biochemical traits of B. platyphylla seedlings, including plant height, chlorophyll content, electrolyte leakage (EL), malondialdehyde (MDA), proline levels, and antioxidant enzyme activities (SOD, CAT, POD). Cold stress resulted in visible phenotypic changes, reduced growth, and significant declines in chlorophyll content, suggesting inhibited photosynthesis. EL and MDA levels increased with exposure duration, indicating progressive membrane damage and oxidative stress. In response, antioxidant enzyme activities and proline accumulation were significantly enhanced, reflecting a coordinated defense strategy. Correlation analyses further revealed strong associations among antioxidant enzymes, MDA, proline, and EL under cold stress. These findings advance our understanding of the adaptive responses of B. platyphylla to low-temperature stress and provide a physiological and biochemical basis for future breeding programs aimed at improving cold tolerance.

1. Introduction

White birch (Betula platyphylla Sukaczev) is a key deciduous tree species naturally distributed across northeastern and northern China, Korea, Japan, Mongolia, and parts of eastern Russia, including Siberia. It represents one of the dominant broadleaf pioneer species in boreal and temperate mixed forests [1]. B. platyphylla is treated lately as a synonym of Betula pendula subsp. Mandshurica [2]. In China, B. platyphylla is considered one of the most ecologically and economically significant forest species due to its rapid growth rate, superior wood properties, high adaptability, and broad applications in industries such as furniture manufacturing, medicinal use, and urban landscaping [3,4]. Its strong environmental adaptability also makes it a model species for studying abiotic stress tolerance [4]. B. platyphylla is widely used in afforestation and reforestation programs due to its high tolerance to cold, drought, and poor soils. It is capable of withstanding winter temperatures as low as −40 °C, making it suitable for cultivation in cold temperate regions [5]. In recent years, various studies have investigated the responses of B. platyphylla to different abiotic stress conditions, including drought, salinity, ozone, heat, and cold [6,7]. However, despite its known tolerance to cold environments, the physiological and biochemical mechanisms underlying its cold stress responses remain insufficiently understood.
Cold stress is among the most critical limiting factors for plant growth and survival, particularly in temperate and boreal regions [8]. Exposure to low temperatures can disrupt cellular homeostasis, damage membranes, inhibit photosynthesis, and lead to oxidative stress through the overproduction of reactive oxygen species (ROS) [9]. Cold acclimation (CA), a physiological process triggered by exposure to low but non-freezing temperatures, enhances plant resistance to subsequent freezing conditions [10]. Research on cold stress responses in woody plants has been widely conducted, particularly in species such as Populus tremula L. × P. tremuloides Michaux [11], B. pendula [12], and Eucalyptus benthamii [13]. These studies have explored various physiological and molecular mechanisms related to cold tolerance, including antioxidant activity, osmolyte accumulation, and gene expression. Over the past decade, increased interest in cold tolerance mechanisms has highlighted the importance of investigating molecular, physiological, and biochemical responses in plants during cold stress [14,15,16]. It is well documented that parameters including chlorophyll concentration, electrolyte leakage (EL), malondialdehyde (MDA), antioxidant enzyme activity, and proline accumulation are closely associated with cold stress tolerance [17,18,19]. For example, elevated EL reflects membrane damage under cold stress, often accompanied by increased ROS production, which may trigger programmed cell death. Meanwhile, antioxidant defense systems, including enzymes such as SOD, POD, and CAT, play a vital role in mitigating oxidative damage [20]. Additionally, proline acts as an osmoprotectant and molecular chaperone, stabilizing proteins and membranes under stress.
Despite these insights, specific responses of B. platyphylla to cold stress at varying temperature regimes and time points remain underexplored. Therefore, a comprehensive evaluation of phenotypic, physiological, and biochemical traits under cold stress is necessary to better understand the adaptive strategies of these organisms. In this study, we aimed to investigate the cold stress responses of B. platyphylla by measuring key physiological and biochemical indicators, including EL, chlorophyll content, malondialdehyde (MDA) concentration, antioxidant enzyme activities, and proline content. This study provides a deeper understanding of how B. platyphylla copes with cold exposure, offering a scientific basis for improving cold tolerance in future breeding and conservation programs.

2. Materials and Methods

White birch (Betula platyphylla Sukaczev) wild-type (WT) seedlings were initially cultivated in tissue culture bottles containing solid agar medium based on woody plant medium (WPM), with 0.8 mg L−1 6-benzylaminopurine (BA) and 0.02 mg L−1 naphthaleneacetic acid (NAA) added as supplements. Once adventitious buds developed, plantlets were excised and transferred to a 1/2-strength Murashige and Skoog (1/2 MS) medium with the addition of 0.2 mg L−1 NAA, 1% sucrose, and 0.75% agar (pH 6.0), subjected to a 16:8 h light–dark cycle under controlled conditions. At one month of age, seedlings were transplanted into 45-plug trays (3 cm diameter × 3 cm height) containing a substrate composed of black soil, perlite, and vermiculite in a 4:2:2 (v/v) ratio. These were maintained in a growth chamber at 24 ± 1 °C with the same photoperiod.
After one month in the plug trays, seedlings were transferred to an artificial climate chamber to undergo temperature treatments. Five groups were established: one served as a control, maintained at 24 ± 1 °C throughout the experiment, while the remaining four groups were subjected to low-temperature (LT) stress. Each treatment was replicated three times. LT treatments involved transferring the seedlings to 6 °C for durations of 7, 11, 15, 19, 23, and 27 days all under the same light and photoperiod conditions. Upon completion of the treatments, the first to fourth true leaves were collected, immediately frozen in liquid nitrogen, and stored at –80 °C for subsequent analyses. For each treatment condition, three independent biological replicates were collected, each replicate consisted of ten plants.

2.1. Electrolyte Leakage

Electrolyte leakage was assessed using the following procedure: three fresh leaf discs (1 cm2 each) were transferred into beakers containing 30 mL of deionized water. The beakers were then subjected to vacuum shaking for 30 min to promote the release of electrolytes from the tissues. Initial conductivity (denoted as S1) was quantified using a TDS 3060 conductivity meter (Shenzhen Kedida Electronics Co., Ltd.). Subsequently, to ensure full cellular breakdown, the samples were boiled at 100 °C for 20 min, and the final conductivity (S2) was subsequently recorded. All physiological measurements were conducted with four independent biological replicates per time point. The percentage of EL was calculated according to the following equation:
E L = S 1 S 2 × 100 %

2.2. Chlorophyll Pigment Content

Chlorophyll and carotenoid contents in fresh leaves from both control and low-temperature-treated plants were quantified following the method described by Lichtenthaler [21]. Approximately 0.05 g of fresh leaf tissue was placed in a dark tube and extracted using a solvent mixture composed of 2.5 mL of 100% acetone and 2.5 mL of 100% ethanol. Absorbance readings at 470, 649, and 665 nm were obtained using a spectrophotometer (Spectrum Instruments, Shanghai, China) after 24 h of incubation in the dark. Chlorophyll a (Chl a), chlorophyll b (Chl b), and carotenoid (Car) concentrations were then calculated from the measured absorbance values.
Chl a = 13.95A665 − 6.88A649
Chl b = 24.96A649 − 7.32A665
C ar = 1000 A 470 2.05 C a 114.8 C b 245

2.3. Antioxidant Enzymes

The activities of peroxidase (POD), superoxide dismutase (SOD), and catalase (CAT) were determined using respective assay kits (Suzhou Comin Biotechnology Co., Ltd., China) in accordance with the manufacturer’s instructions. For each assay, 0.1 g of plant tissue powder was used per test tube. POD activity was evaluated by measuring the absorbance increase at 470 nm, indicating the formation of guaiacol oxidation products [22]. The POD value was calculated using the following method:
Δ A = A 2 A 1
P O D   U / g = 2000 × Δ A ÷ w
Activities of POD and SOD were assessed using a spectrophotometer (Spectrum Instruments, Shanghai, China), with SOD absorbance measured at 560 nm. The SOD activity was then determined using the following formula:
C = ( A B ) ÷ A
S O D U / g = 11.4 × C ÷ ( 1 C ) ÷ w
  • A: control test tube value;
  • B: real test tube value.
CAT activity was measured using a spectrophotometer (PerkinElmer, Singapore) by recording absorbance at 240 nm (denoted as A1), followed by a second reading after 60 s (denoted as A2). CAT activity was calculated as follows:
Δ A = A 2 A 1
C A T n m o l / m i n / g = 678 × Δ A ÷   w

2.4. Determination of MDA and Proline Levels

Malondialdehyde (MDA) and proline contents were quantified using commercial assay kits (Suzhou Comin Biotechnology Co., Ltd., China), following the manufacturer’s protocols. Each physiological measurement was performed with three independent biological replicates per time point. The absorbance of MDA was assessed at 532 nm and 600 nm, whereas proline absorbance was evaluated at 520 nm utilizing a spectrophotometer (Spectrum Instruments, Shanghai, China). The concentration of MDA was determined using the following formulas:
Δ A = A 532 A 600
M D A   n m o l / g = 25.8 × Δ A : w
Proline concentration was calculated as follows:
P R O μ g / g = 19.2 × ( A + 0.0021 ) ÷ w × 2

2.5. Statistical Analysis

Statistical analyses were conducted using Microsoft Excel 2017 and SPSS 25 statistical software. A one-way analysis of variance (ANOVA) of factorial design was conducted to assess the impact of cold stress duration on physiological and biochemical parameters at various time points. The Shapiro–Wilk test was employed to assess normality, and Duncan’s multiple range test was utilized for treatment comparisons. All data were presented as mean ± standard error (SE). Furthermore, to evaluate significant changes between treatments, we employed a t-test, with p < 0.05 being significant at 6 °C. The heatmap was created using http://www.ehbio.com/html, accessed on 2 June 2022 while the correlogram and PCA were plotted with R 3.5.1 software.

3. Results

3.1. Differential Impact of Cold Stress on B. platyphylla Phenotype

Low temperatures (LTs) had a differential effect on plant phenotype. Moreover, LT is well known to cause cell death. To examine the effect of LT treatment in B. platyphylla, we tested some physiological measurements. Additionally, we observed the phenotype, or visible appearance, of all treatments (Figure 1). The result showed that cold stress and prolonged cold stress significantly affect the phenotype of B. platyphylla seedlings. However, control plants presented a significantly higher height than the cold stress plants (Figure 1). Contrastingly, the prolonged cold stress plants presented the shortest height (27th day). In addition, cold-stress-treated B. platyphylla showed red stems, yellow leaves (chlorosis), and stunting.

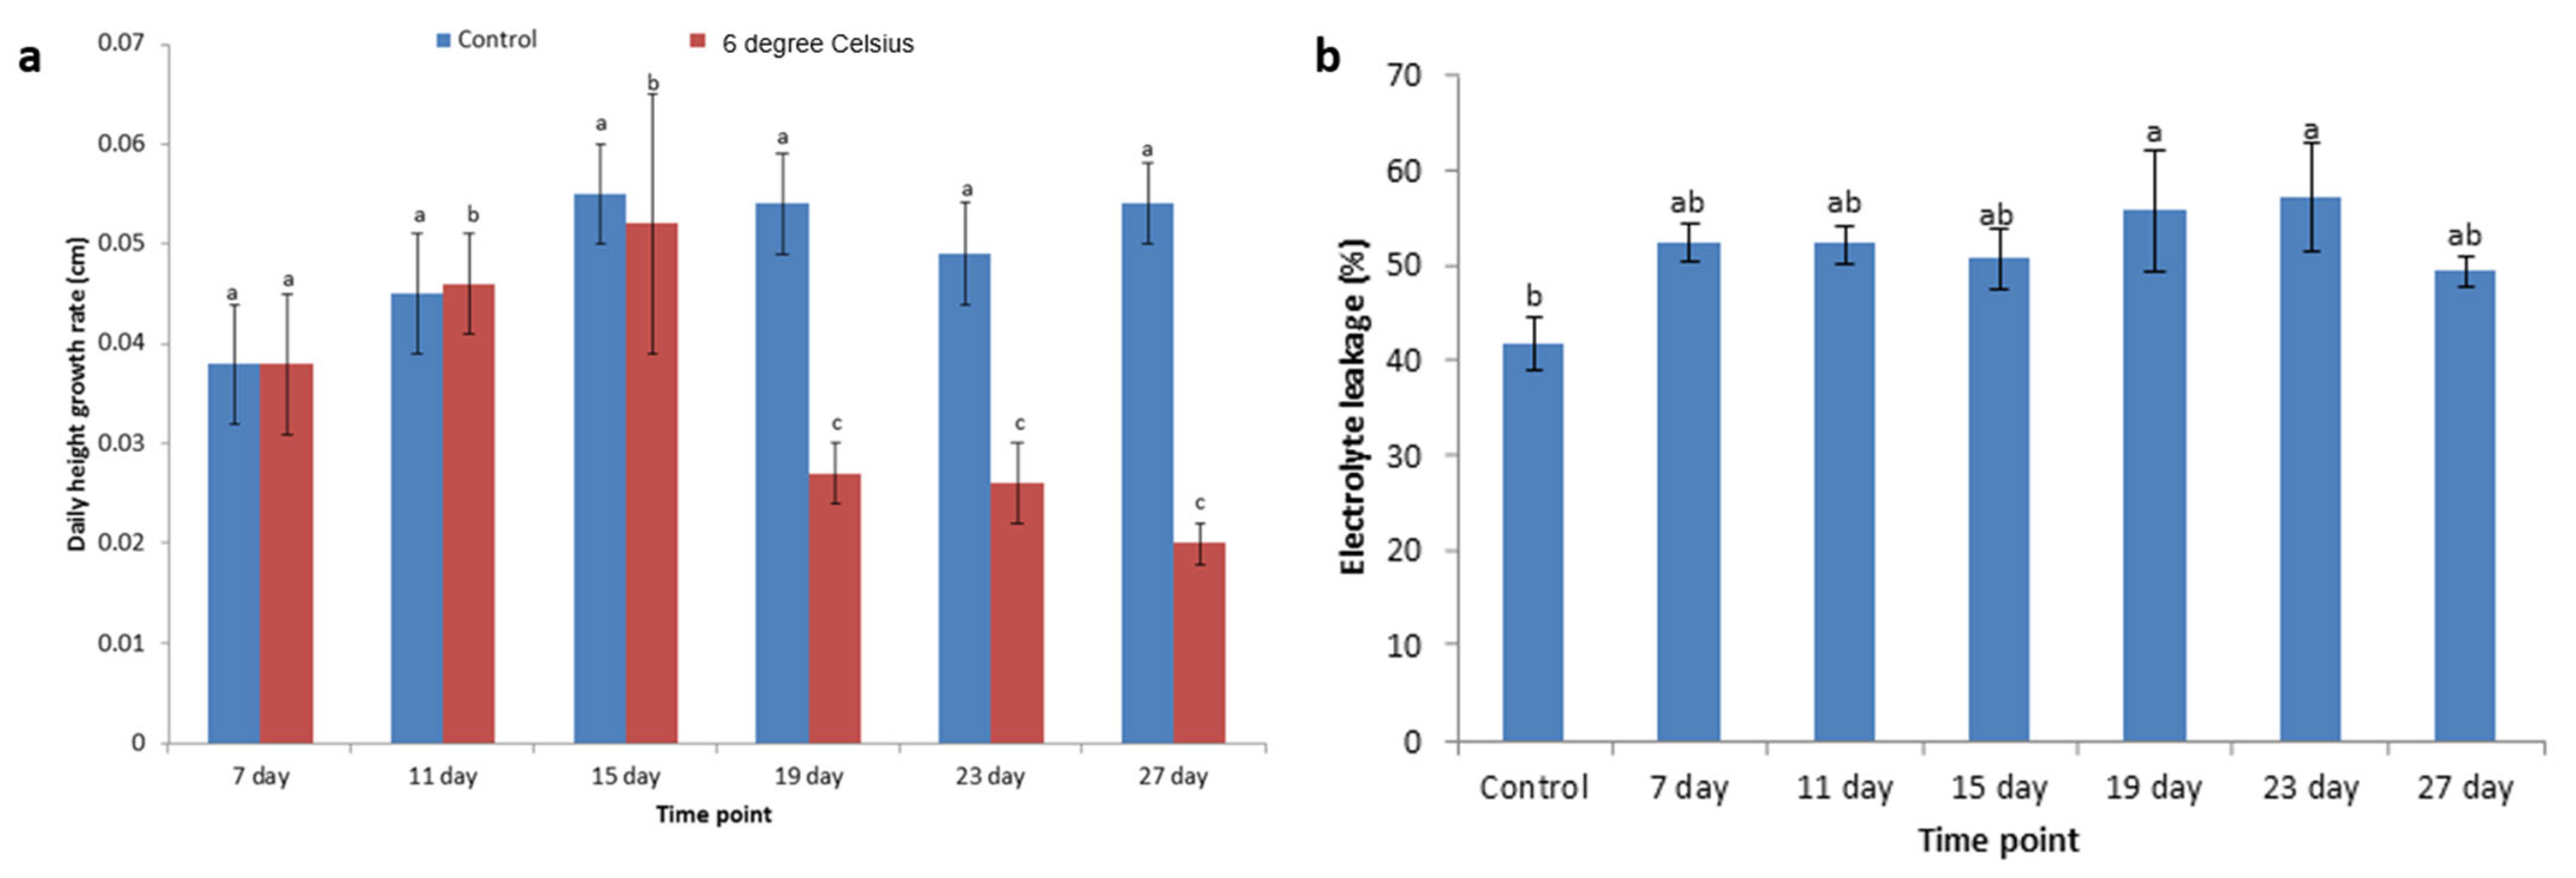
3.2. Changing the Height Growth Rate

Regarding cold conditions, there were differences in daily height growth in cold-stress-treated seedlings, but no differences were observed in control seedlings (Figure 2a). The daily height growth was measured every four days for 27 days. The current study revealed that the daily height growth of B. platyphylla seedlings was significantly affected by cold treatment. The daily height growth of the control seedlings was 0.038–0.054 cm. The daily height growth of cold-stress-treated seedlings was significantly reduced compared to control seedlings. In Figure 2a, it is shown that the reduced daily height growth of cold-stress-treated seedlings started from the 19th day (0.027 ± 0.003) and continued until the 27th day (0.020 ± 0.002).

3.3. Electrolyte Leakage Changes Under Cold Stress

To evaluate the physiological alterations in plants due to cold exposure, the effects of 6 °C for 27 days on EL were analyzed systematically (Figure 2b). EL analysis showed that EL significantly increased after 7 days of cold stress. On the 27th day, values of cold-stress-treated seedlings (49.49 ± 1.60) were slightly reduced in contrast to 19th-day and 23rd-day cold-stress-treated seedlings (55.83 ± 6.42 and 57.22 ± 5.71, respectively). The current study showed that the highest EL value was observed in the 23rd-day cold-stress-treated seedlings, indicating that the cell membrane was damaged more severely on the 23rd day than on any other day. Meanwhile, the highest EL value was 1.37-fold higher than the control value (41.81 ± 2.66).

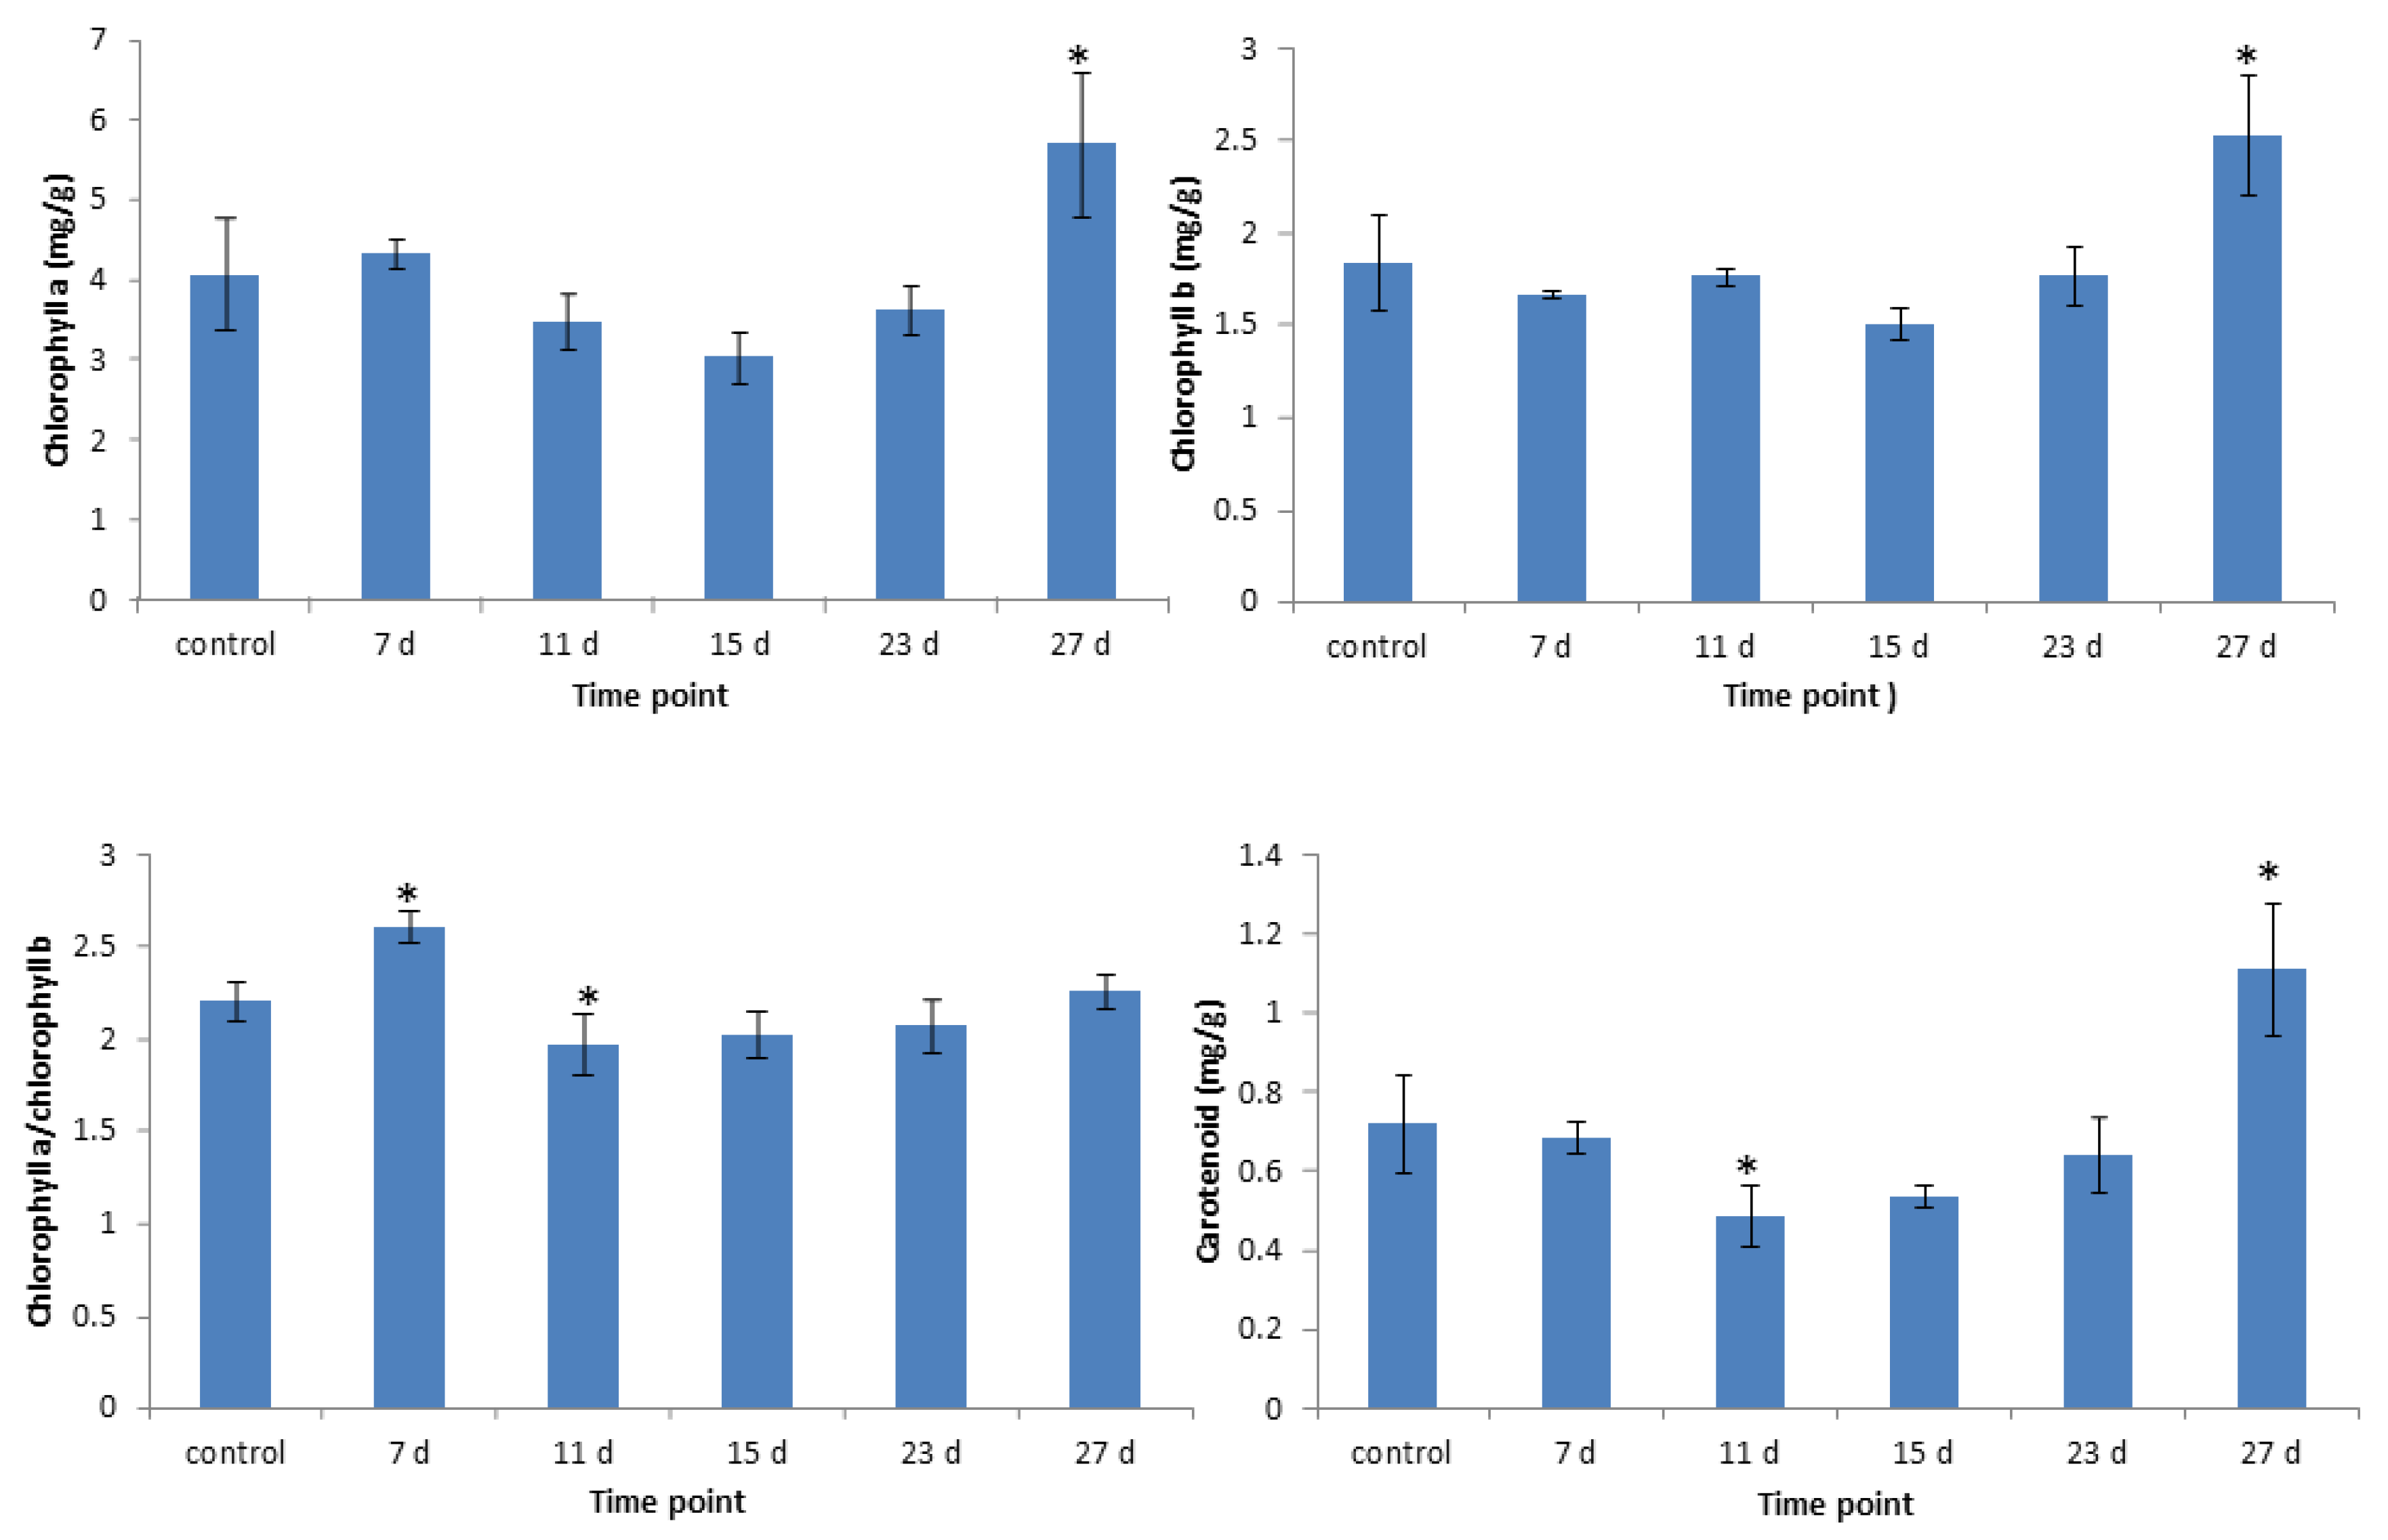
3.4. Changes in Chlorophyll Contents

As shown in Figure 3, the chlorophyll a (Chl a) content exhibited an initial decrease followed by an increase after cold treatment at 6 °C. There was a significant difference in Chl a between 27th-day cold-stress-treated seedlings and the control. The Chl a of 27th-day cold-stress-treated seedlings was the highest (5.6 mg/g) and was 1.4-fold higher than the control value. However, no substantial change existed in the Chl a of 7th-day, 11th-day, 15th-day, and 23rd-day cold-stress-treated seedlings compared to the control value. For chlorophyll b (Chl b), the initial decrease was shown by the 7th-day treatment (1.66 mg/g) and then increased (1.76 mg/g) 1.06-fold compared to the 7th-day treatment value. The lowest value of Chl b was observed in the 15th-day treatment (1.50 mg/g), which was 0.80-fold higher than the control value. The trend was similar to that of Chl a, where there were both increased and decreased values among the treatments. However, the highest Chl b value was 2.52 mg/g (the 27th day), 1.37-fold higher than the control value. There was only one significant difference between the 27th day and control. For carotenoids (Car), the 7th-day value was decreased (0.68 mg/g) compared to the control (0.71 mg/g), representing a 0.96-fold decrease from the control value. The trend decreased and then increased until reaching the 27th day. The highest Car value was 1.11 mg/g (the 27th day), which was 1.54-fold higher than the control value. Our findings demonstrated that B. platyphylla has intraspecific variation to respond specific stress. In addition, there were two significant differences compared with the 11th-day and 27th-day cold-stress-treated seedlings and the control.

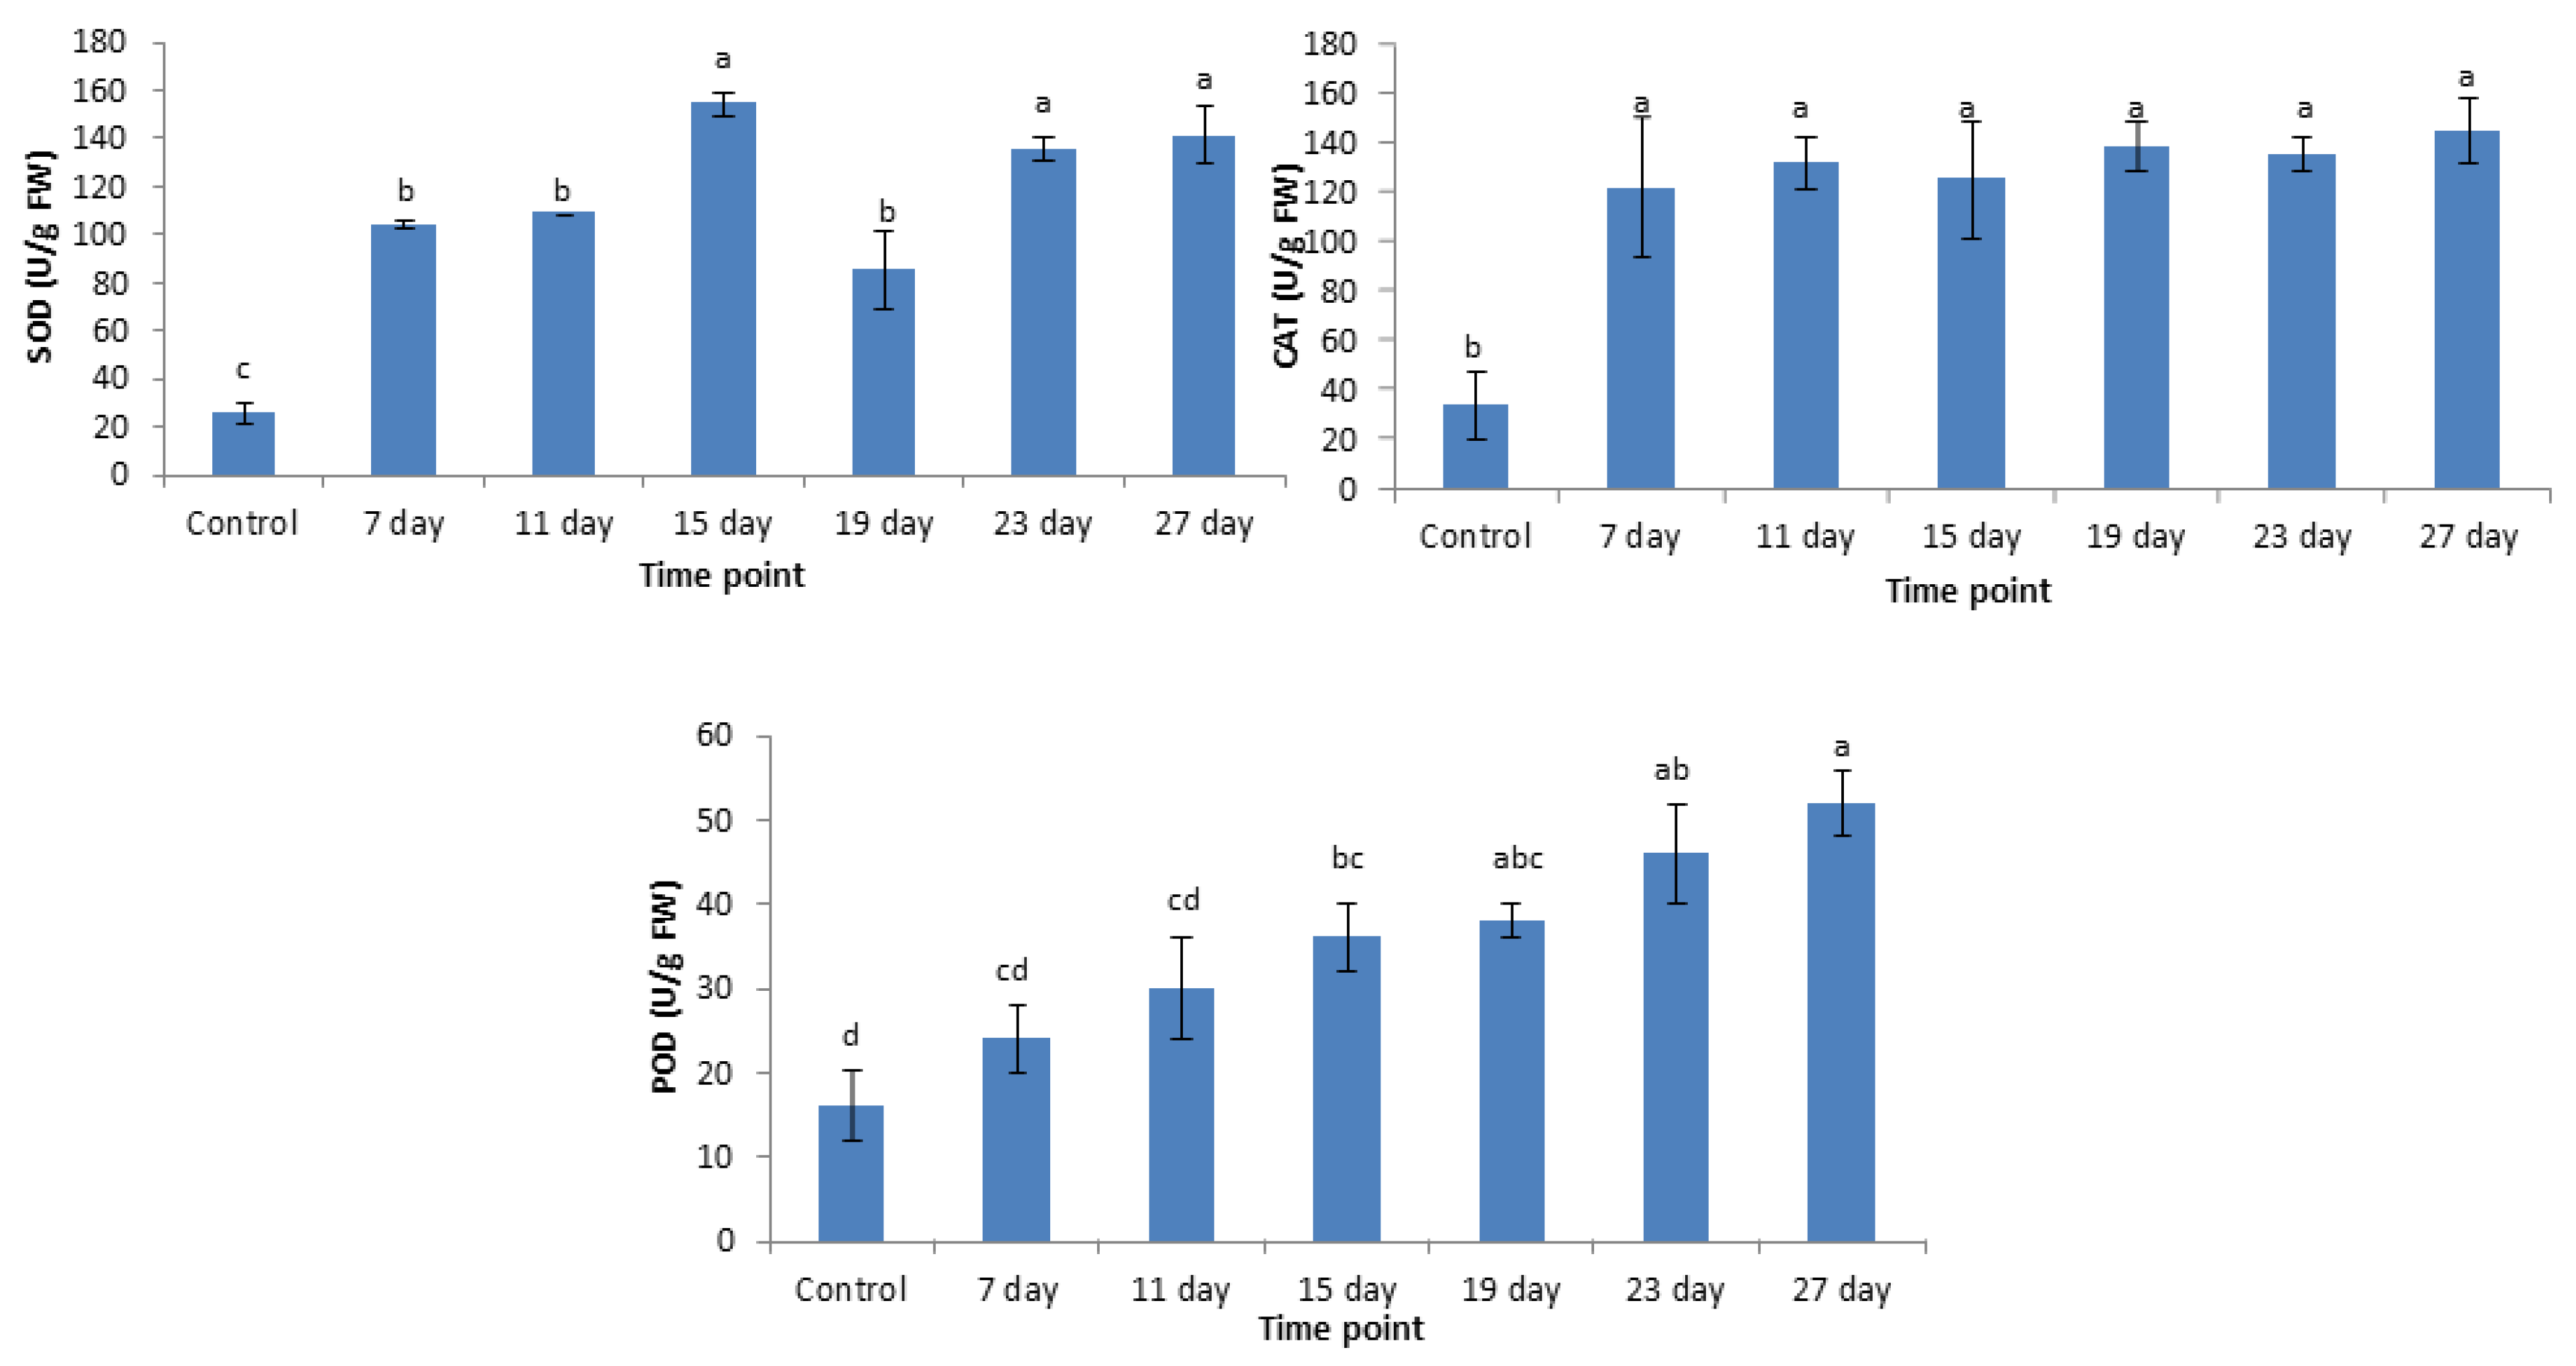
3.5. Antioxidant Enzyme Activities

Variations in antioxidant enzyme activity at different exposure time points at 6 °C are shown in Figure 4. Analysis of variance (ANOVA) revealed that B. platyphylla seedlings and cold stress were prominent factors, as well as the interaction between B. platyphylla seedlings and cold stress with antioxidant enzymes. The current study shows that the antioxidant enzymes (SOD, CAT, and POD) were significantly enhanced after the 7th day of cold stress (407.02%, 360%, and 150%, respectively), with the highest enhancement identified for SOD activity (4.07-fold higher than the control value). Compared to all treated seedlings, the highest SOD activity was observed in 15th-day cold stress seedlings (154.39 ± 5.02), six-fold higher than the control value. Significant differences between 7th-, 11th-, 15th-, 23rd-, and 27th-day cold-stress-treated seedlings and the SOD control value were found. Meanwhile, the lowest SOD activity was observed on the 19th day of cold stress treatment, demonstrating that ROS concentration reduced by the 19th day of cold stress treatment. The increases and decreases in SOD activity were assumed to be protective mechanisms of antioxidants to change the ROS concentration.
The CAT activity of cold-stress-treated seedlings was significantly different from that of control seedlings. The highest CAT value was 144.64 ± 12.58 U/g (the 27th day), 4.27-fold higher than the control value. Meanwhile, the lowest CAT value was found on the 7th day of cold stress treatment (122.04 ± 28.09 U/g), which was 3.6-fold higher than the control value. The current study found a significant difference between 7th-, 11th-, 19th-, 23rd-, and 27th-day cold-stress-treated seedlings with the CAT control value. Similar to CAT activity, POD activity continued to increase with the long period of cold treatment. POD content started to increase rapidly on the 7th day (24 ± 4 U/g) until the 27th day of cold stress (52 ± 4 U/g). Compared to the control value, the highest POD value (27th day of cold stress treatment) was 3.25-fold higher than the control value while the lowest POD value (7th day of cold stress treatment) was 1.5-fold higher than the control value. The significance of those values is shown in Figure 3, Figure 4 and Figure 5. All time points except the 7th and 11th days were significant compared to the control.

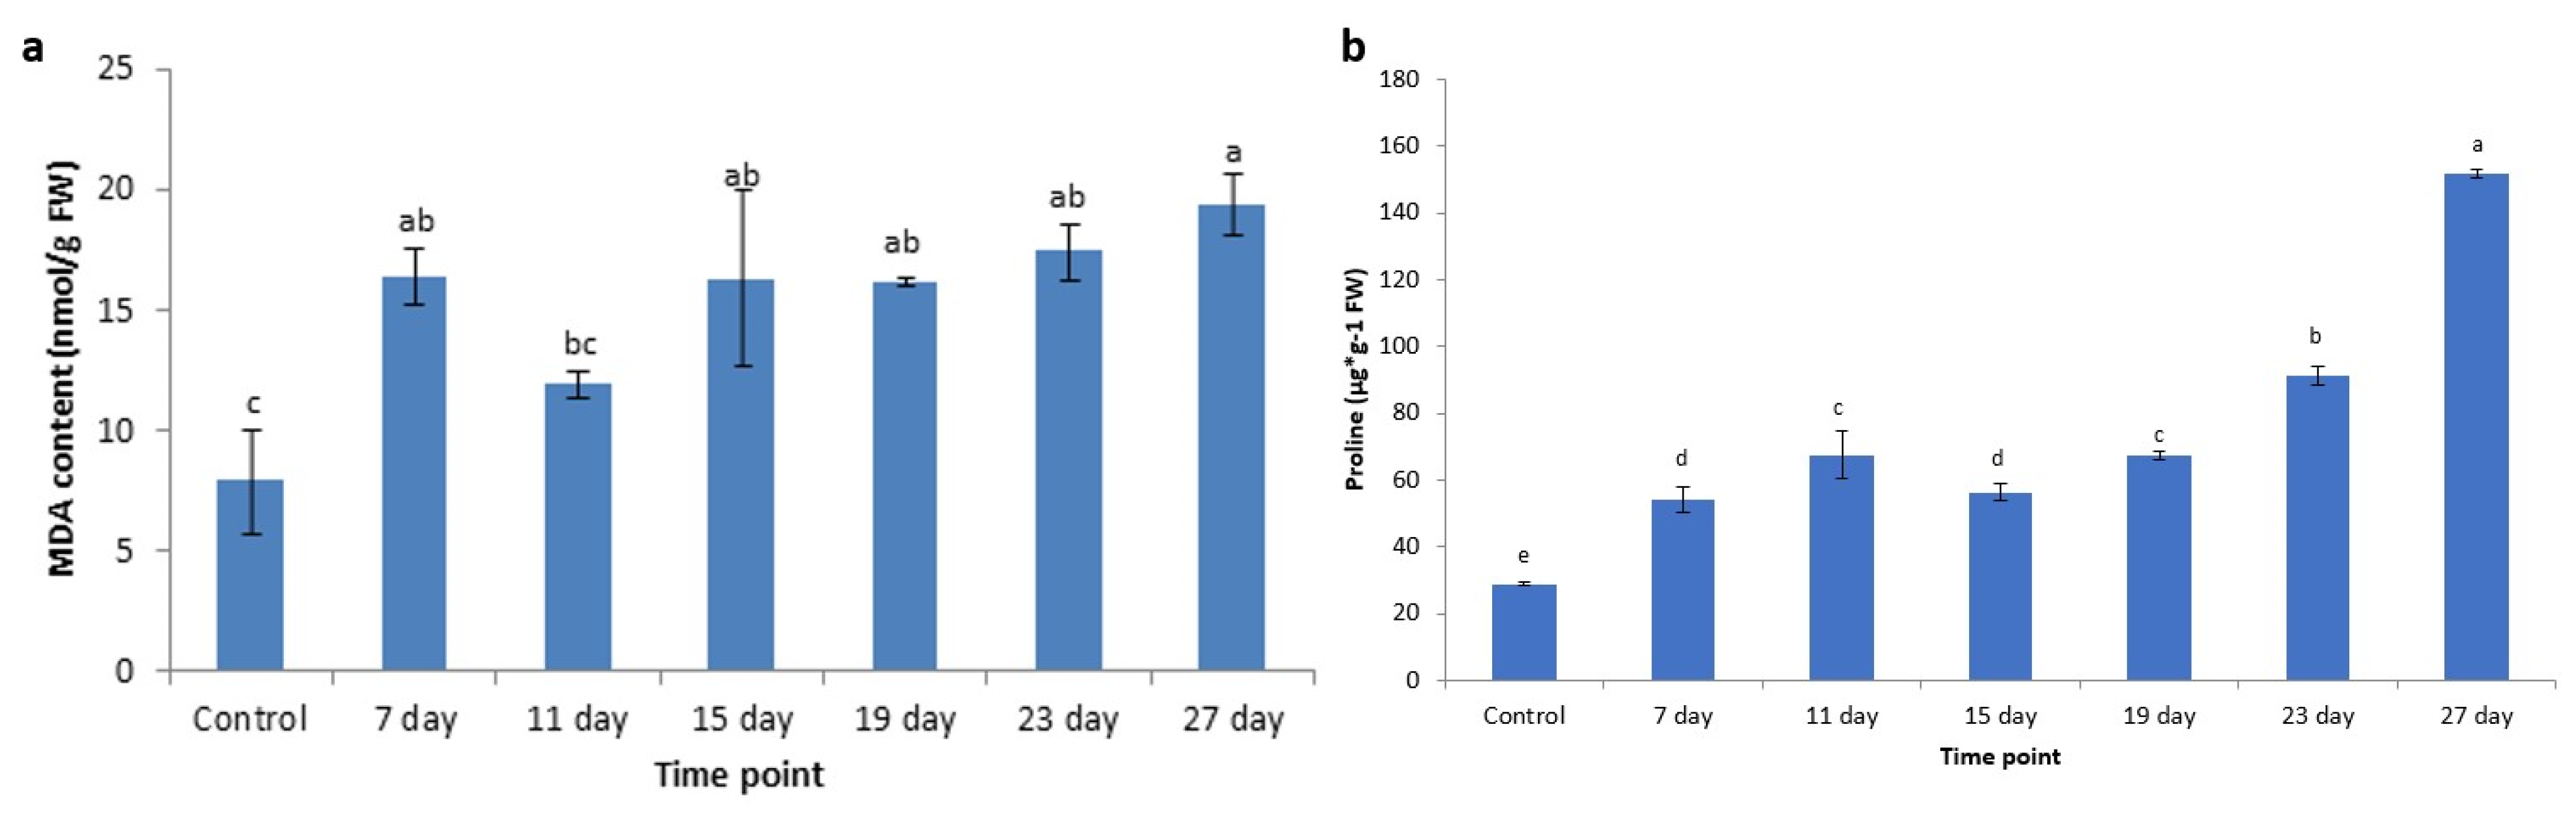
3.6. Changes of MDA Content Under Cold Stress

Levels of MDA were significantly elevated at various time points of cold stress compared to control seedlings. According to the ANOVA result, the temperature and the interactions of various time points were significant. The highest MDA content was identified in the 27th-day cold-stress-treated seedlings (19.35 nmol/g), which was 2.45 times the control values. MDA value increased significantly on the 7th day of treatment (16.383 nmol/g). Interestingly, the MDA value decreased on the 11th day of cold stress (11.868 nmol/g) and then increased again from the 15th day until the 27th day (Figure 5a), illustrating the inhibitory effect on MDA content. However, MDA values were significantly different among time points of cold stress.

3.7. Changes of Proline Content Under Cold Stress

The proline content increased gradually under cold stress, as shown in Figure 5b. The present study showed that the trend of proline content is similar to that of other physiological activities such as EL, SOD, POD, and CAT. Proline content initially increased on the 7th day of cold stress (1.87-fold higher than the control value) and then decreased on the 15th day and reached the maximum value on the 27th day of cold stress (151.59 ± 1.22 μg/g), which was 5.25-fold higher than the control value. The enhancement and reduction of proline content in response to cold stress illustrate that the inhibitory effect is also involved in regulating proline content. Significant differences were found among time points.

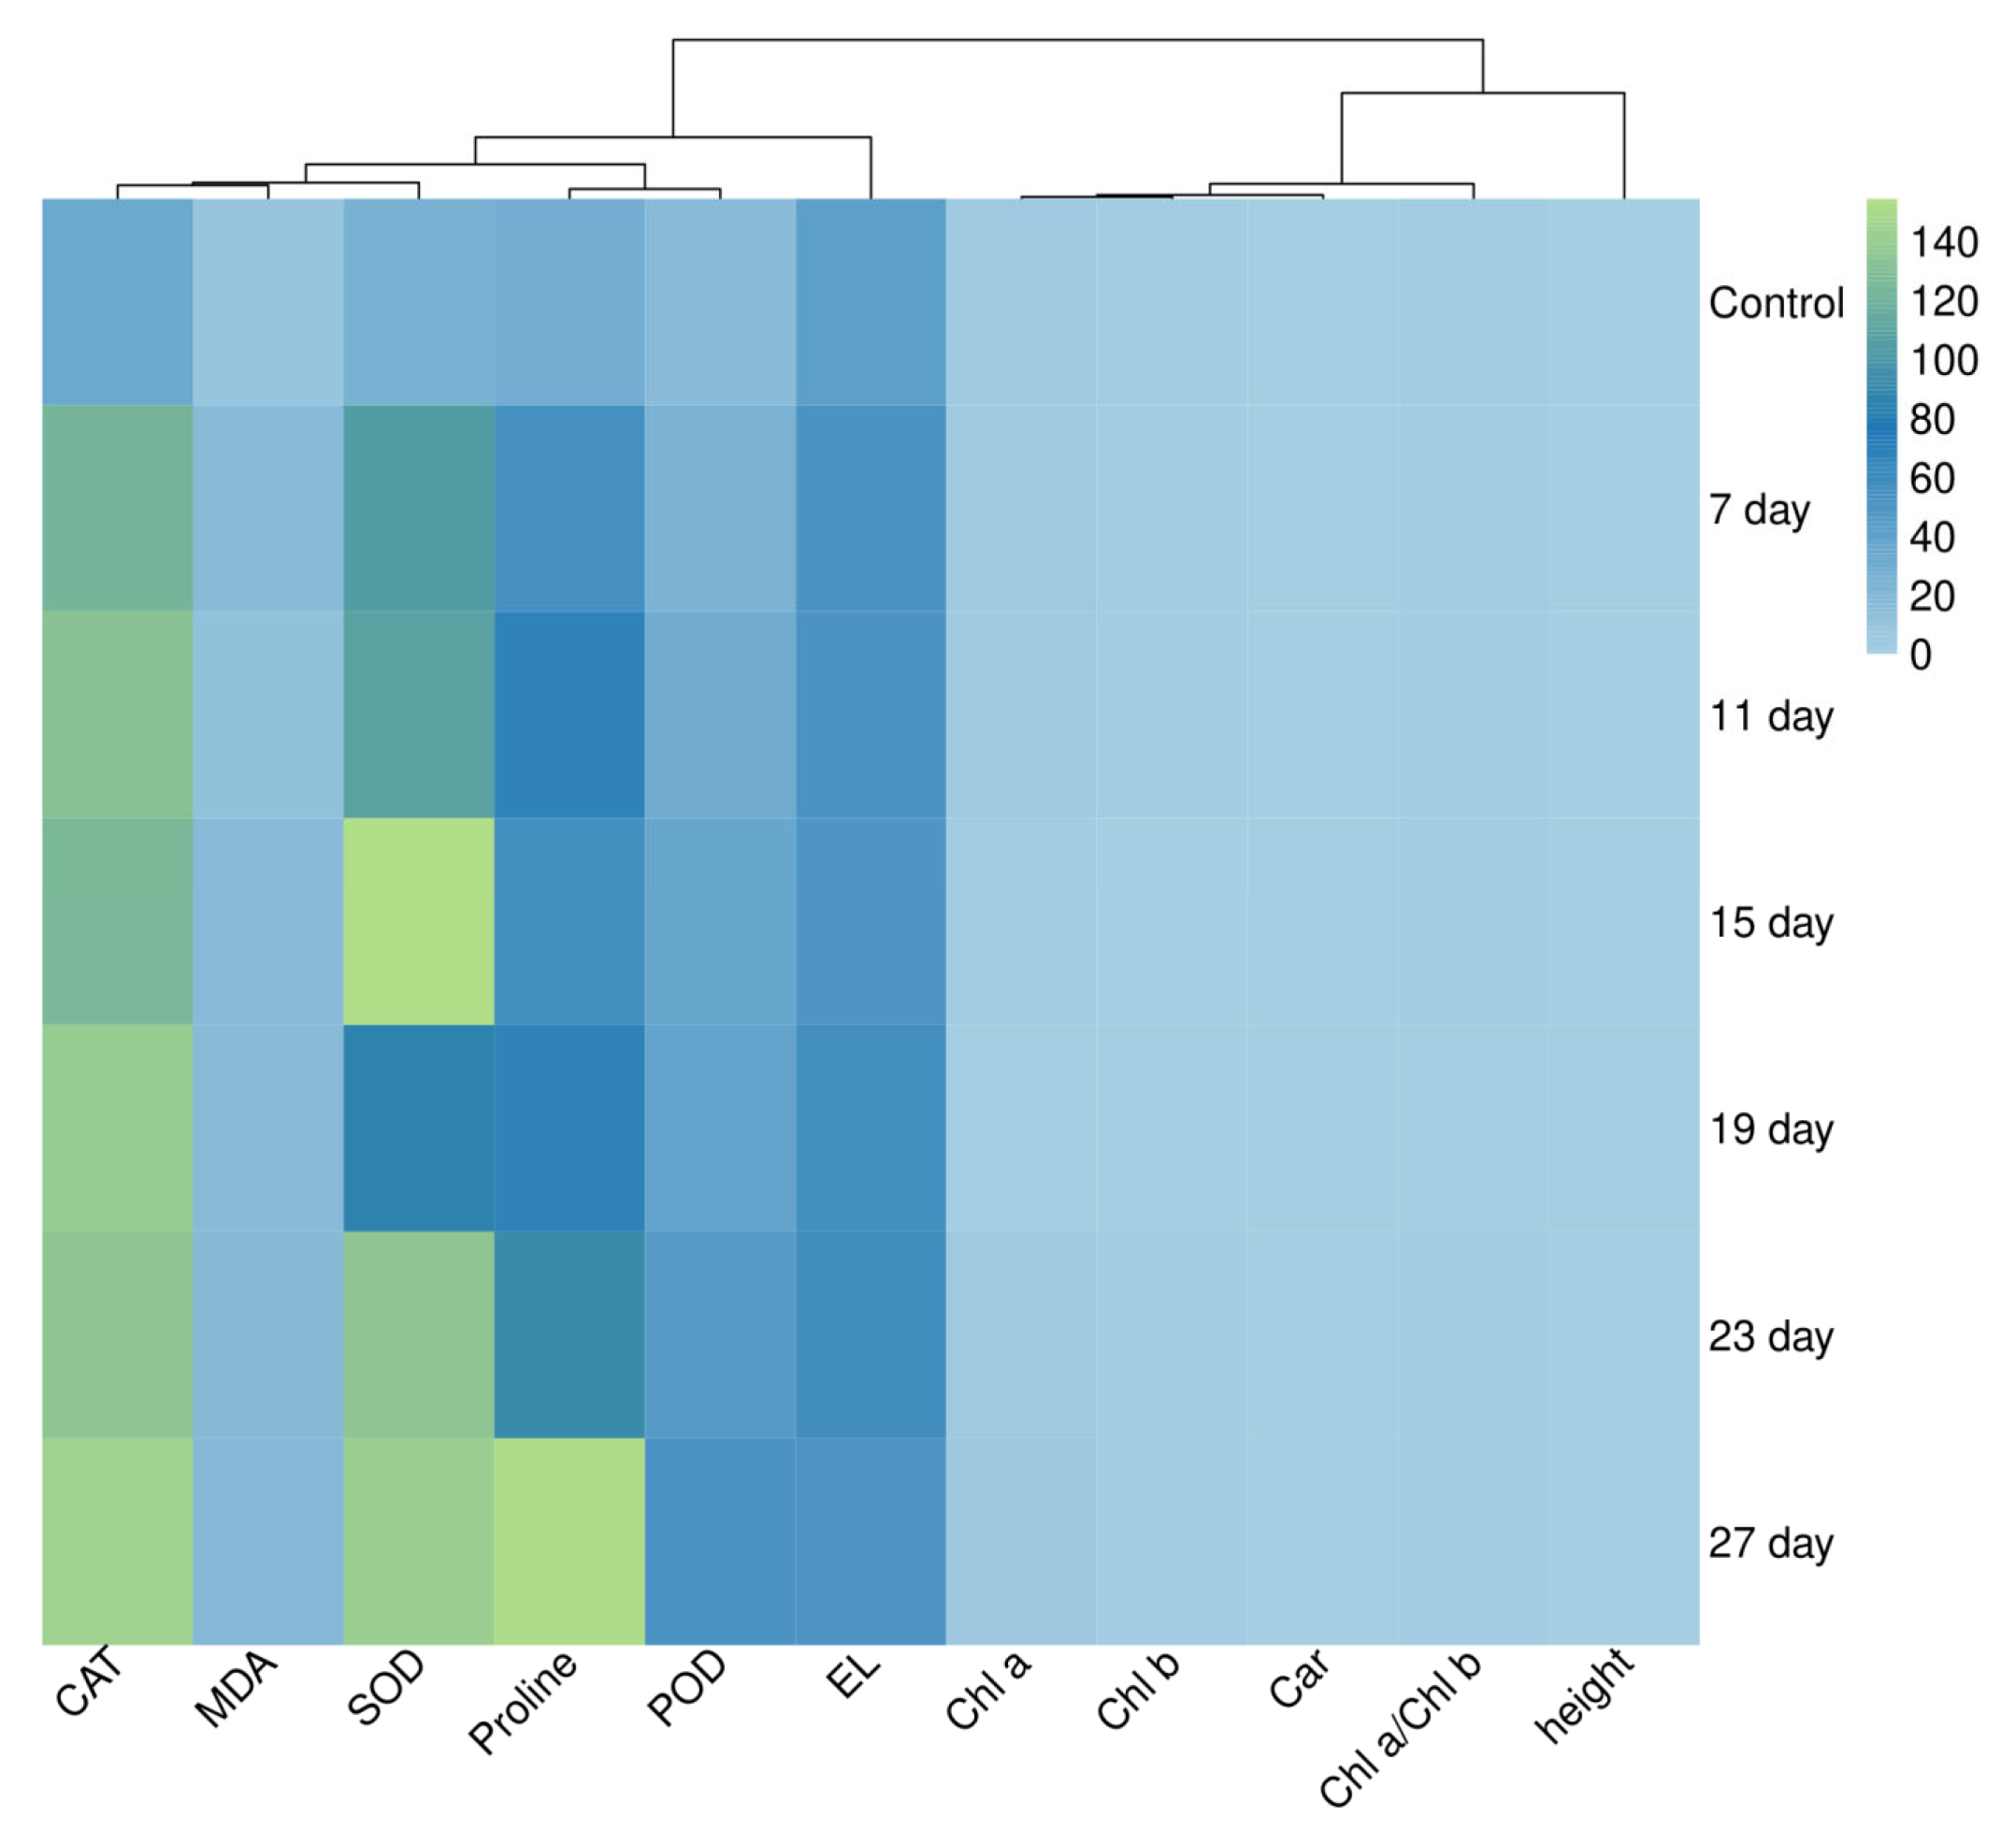
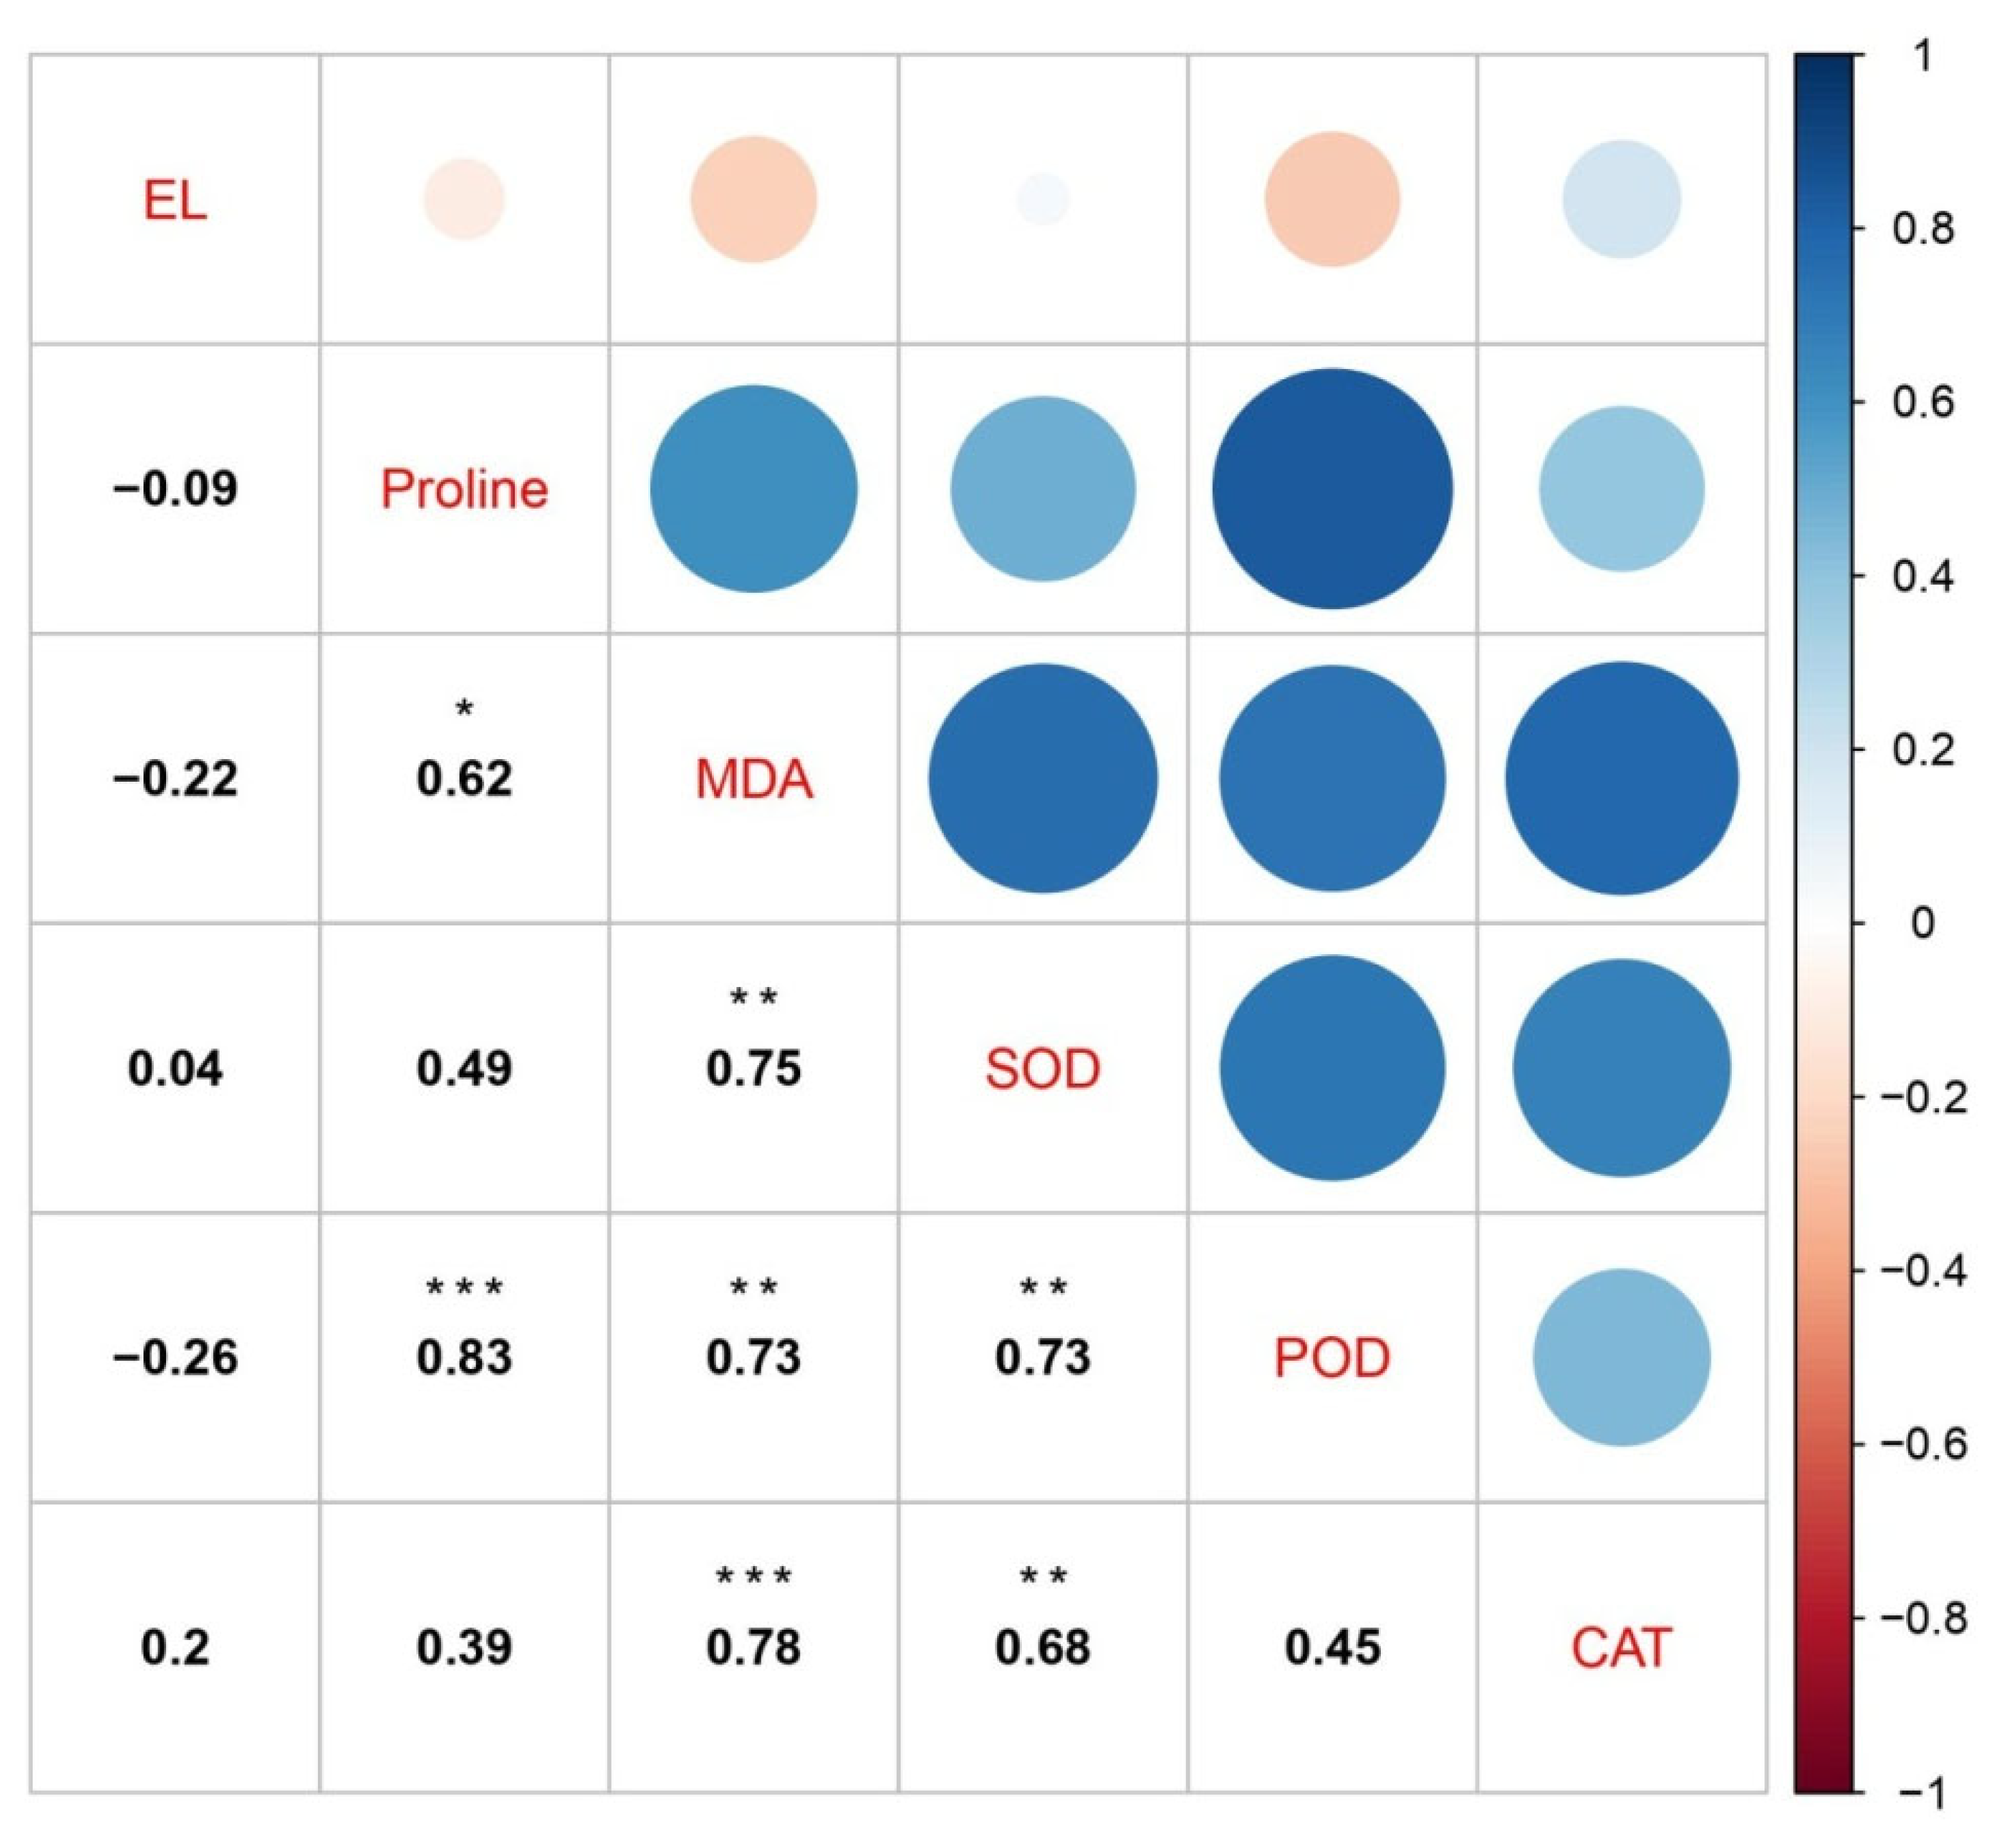
3.8. Plant Physiological and Biochemical Index Relationship

After cold stress treatment, it was found that the duration of cold stress significantly affects the physiological and biochemical traits of B. platyphylla. It was confirmed that the activity of antioxidant enzymes was more closely related to EL, MDA, and proline content compared to daily height growth and chlorophyll content (Figure 6), illustrating that proline, MDA, and antioxidant enzymes might play an important role in mitigating the detrimental effects induced by cold stress. While EL is considered a symptom, not a mitigating mechanism, it reflects membrane damage due to stress, especially oxidative damage, but it does not actively help the plant resist or adapt to stress. However, a close correlation was identified between height and chlorophyll content, demonstrating that the reductions in height growth and chlorophyll content were positively correlated under cold exposure. More importantly, significant positive correlations were observed among antioxidant enzymes or between other physiological and biochemical traits including POD and SOD, MDA and antioxidant enzymes, POD and proline, and MDA and proline content (Figure 7). Interestingly, POD, MDA, and proline showed a negative correlation with EL.

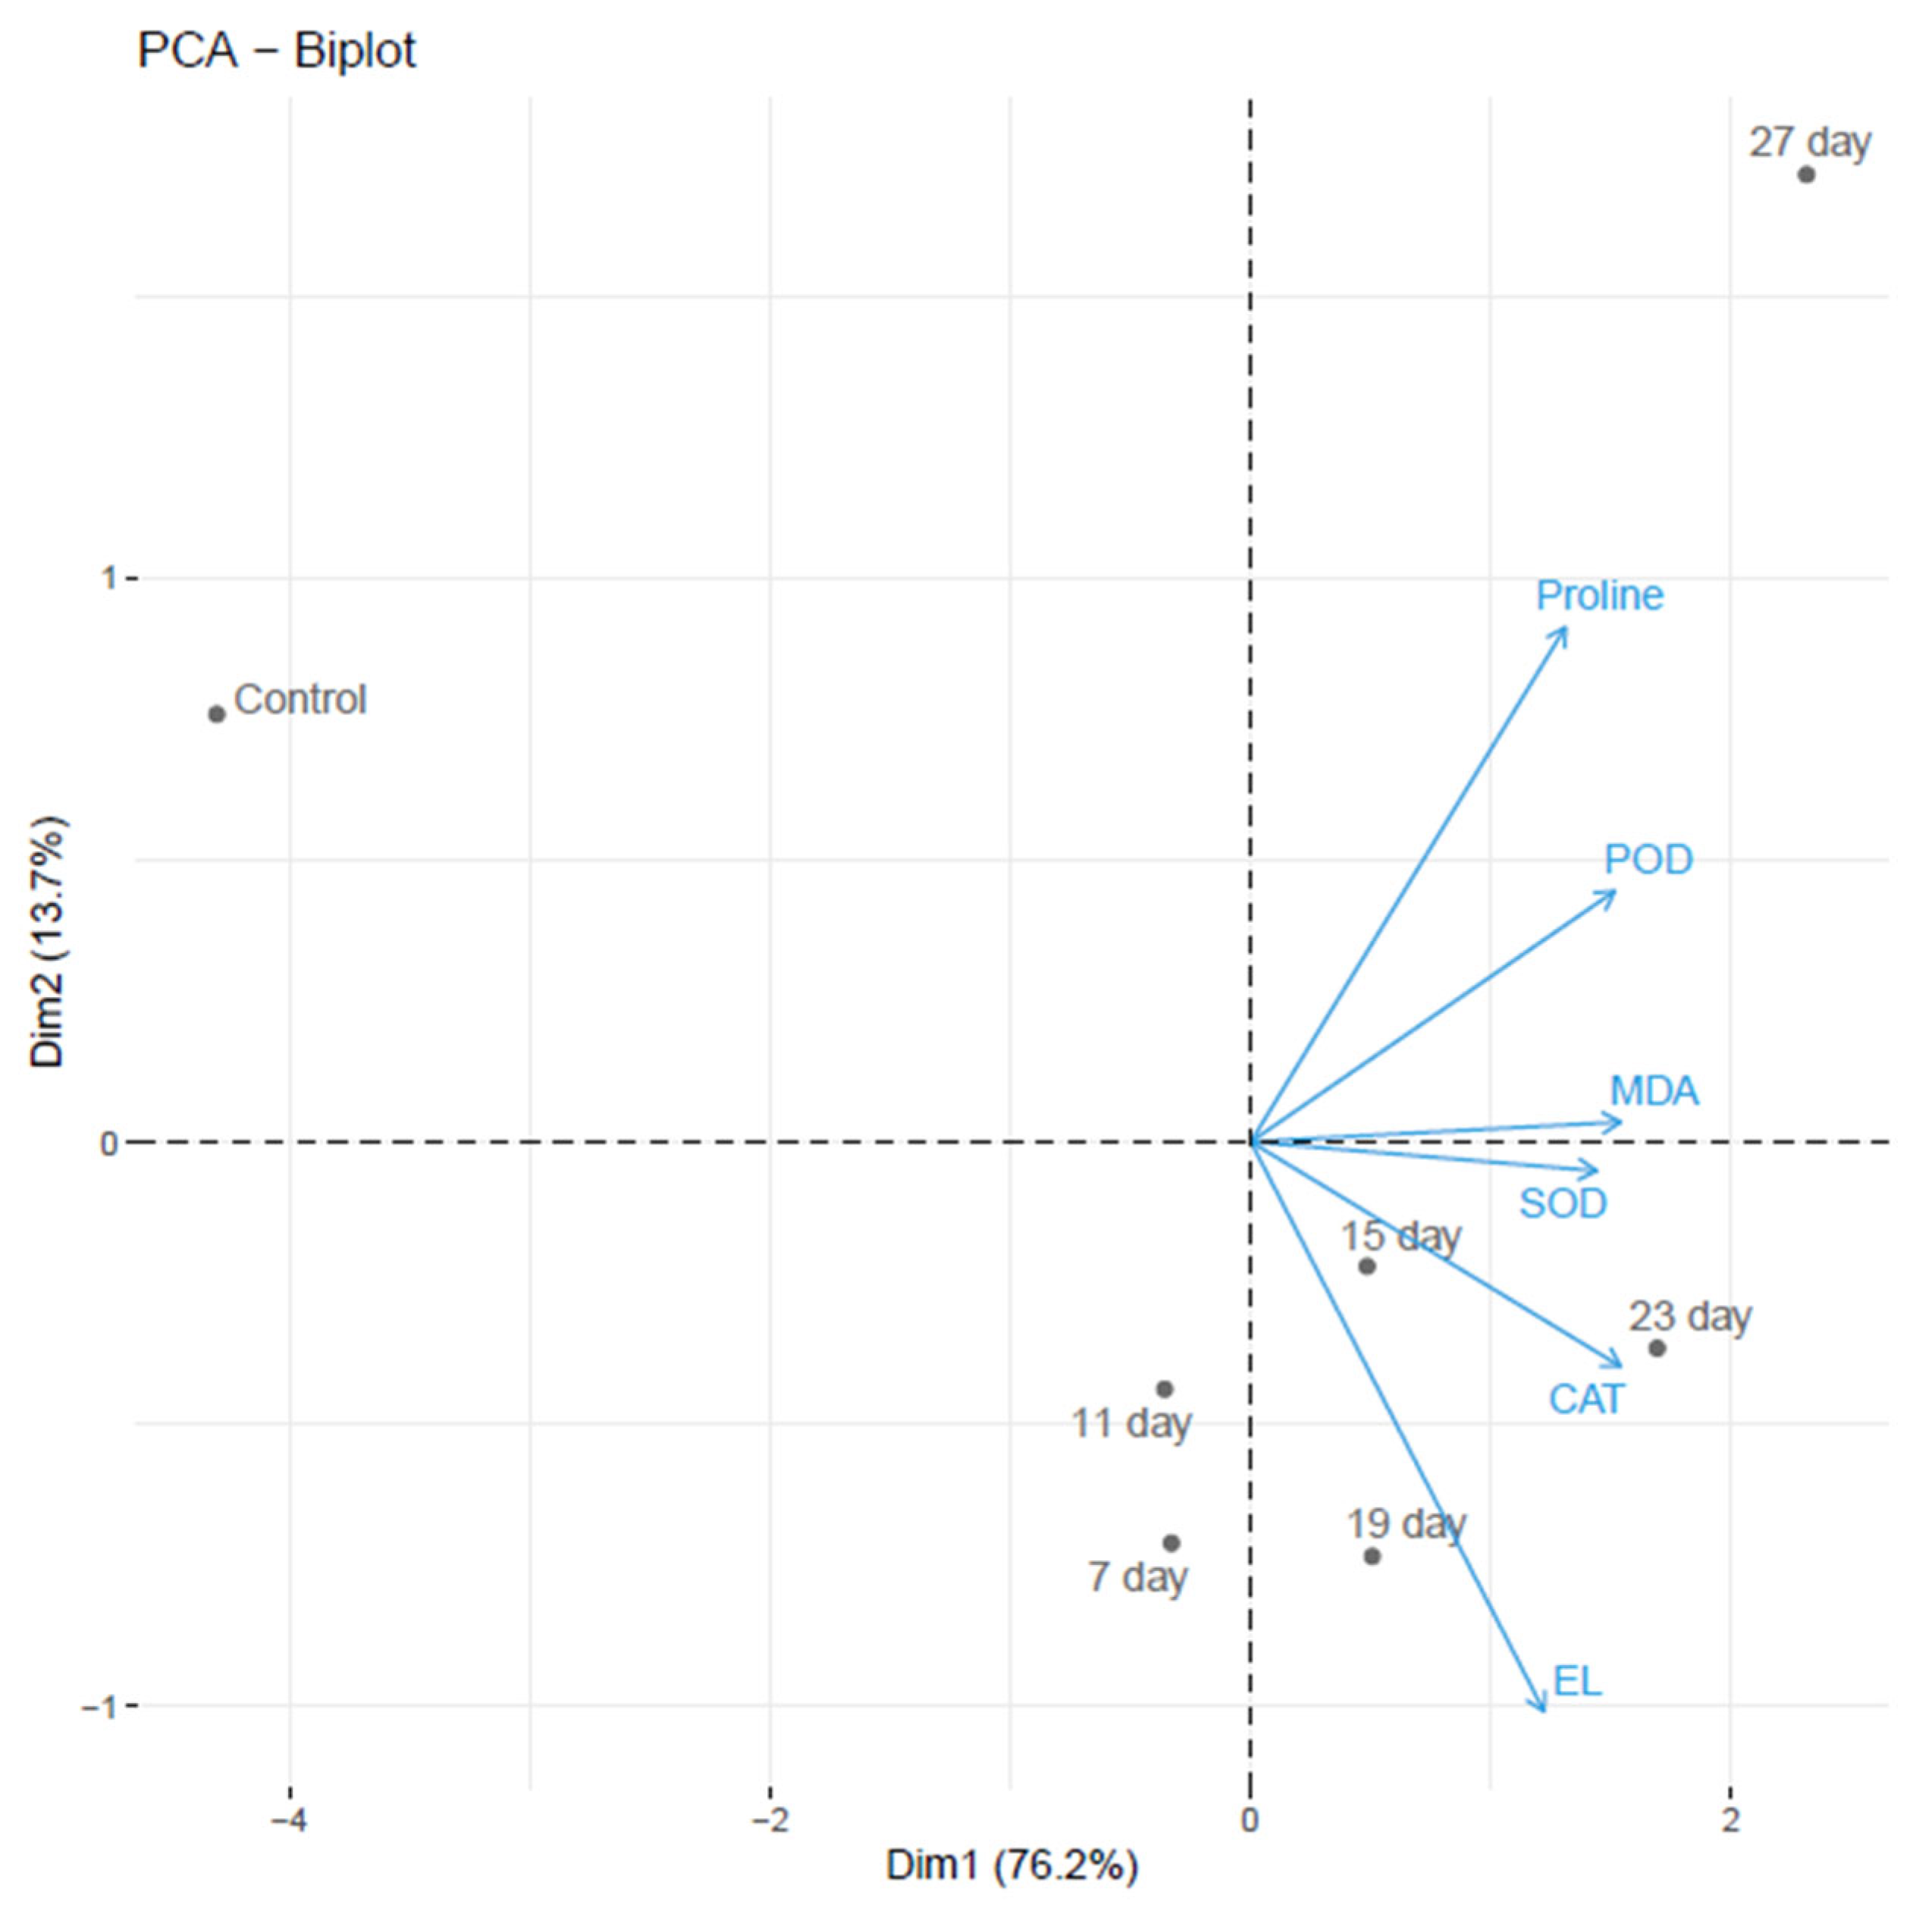
3.9. Bi-Plot Analysis of B. platyphylla Seedlings

Principal component analysis (PCA) was conducted on six dependent variables across seven time points of cold stress. PCA was applied to the correlation matrix based on the mean of trait values to identify similarities among variables with the studied factors. According to Figure 8, it is clearly shown that most of the variation is represented by PC1 (76.2%), while PC2 accounts for 13.7% of the total variation under cold stress. According to the bi-plot, all dependent variables are loaded in PC1, appearing on the positive side. Furthermore, PC1 separated the data points on the 15th day, 19th day, 23rd day, and 27th day, which were positioned on the positive side, while the control points on the 7th day and 11th day were positioned on the negative side (upper and lower directions). PC1 values were assumed to indicate higher cold tolerance compared to control.

4. Discussion

Betula platyphylla is known for its complex mechanism to reach cold resistance. The effect of cold stress disrupts many aspects of plant cellular functions. However, it has been presented that B. platyphylla growth and development are associated with environmental conditions, including drought, cold, and heat stress [20,23]. However, reports concerning duration of cold stress (6 °C), such as 7, 11, 15, 19, 23, and 27 days, are limited. Understanding the unique physiological and biochemical mechanisms will help provide information for further breeding experiments.
The present study showed significant variation in phenotype, physiological, and biochemical traits induced by environmental conditions. B. platyphylla seedlings exhibited a noticeable decline in daily height growth and chlorophyll content (Chl a, Chl b, and Car). Moreover, the changes in leaf and stem color are noticeable between control seedlings and cold-stress-treated seedlings, which become yellow and red, respectively (Figure 3). In addition to the confirmed destructive effects of cold stress on plant height and development several studies have reported [24,25], research on the effect of cold stress on phenotype, physiological, and biochemical traits has been conducted in other plants such as pistachio rootstocks [19], Solanum lycopersicum L. [26], and Santalum album [27].
We also identified a significant reduction in B. platyphylla chlorophyll content, which is similar to numerous studies that have recorded a reduction in chlorophyll content under cold stress [10,20,28,29]. Chl a, Chl b, and Car are found in the leaf tissue and known as the main pigments that snare light energy. The reduction in chlorophyll content was caused by the effect of chlorophyll degradation [30]. The reduction in chlorophyll content after cold exposure was considered an adaptive mechanism of B. platyphylla under cold stress.
EL is a cold stress indicator that leads to plasma membrane damage. Consistent with earlier research, the current study demonstrated that B. platyphylla has some tolerance to maintain the cell membrane by preventing cold damage and its impact on the 15th day. After the 15th day, the cell membrane was presumed to sustain more damage, resulting in a progressive elevation of the EL value (55.77%, 52.98%, and 56.82%, respectively). Our results support similar studies on EL enhancement under cold stress including Avena nuda, pistachio, and Lolium perenne [19,29,31]. However, a higher value of EL was not regarded as a sign of damaged plasma membrane in several abiotic stress cases [32].
The reduction of chlorophyll content is associated with the photosynthesis process, and the reduction of this process is often correlated with ROS accumulation under temperature stress [33]. ROS are detoxified by antioxidant enzymes [34]. The enhanced activity of antioxidant enzymes suggests a protective role in mitigating oxidative stress by detoxifying excessive ROS, thereby helping to maintain cellular homeostasis under prolonged cold stress. The current investigation revealed a considerable increase in the activities of superoxide dismutase (SOD), catalase (CAT), and peroxidase (POD) in B. platyphylla seedlings subjected to cold stress. Our result was consistent with a previous study which stated that antioxidant enzymes of tomatoes increased under cold stress exposure [35]. This finding was also reinforced by Demecsová et al. [36], who reported that SOD activity increased in Hordeum vulgare under cadmium stress. SOD is commonly used as biomarker of oxidative stress due to its essential role [37]. The reduction of superoxide to H2O2 by SOD and the rapid conversion of H2O2 into O2 and H2O by CAT and POD are the protective mechanisms of the antioxidant system in plants [38,39]. While CATs are found in peroxisomes, their function in decomposing H2O2 involves releasing them from peroxisomal oxidases, including glycolate oxidase, which is involved in photorespiration [40].
Furthermore, it was confirmed that CAT activity was mediated by the disintegration of H2O2 by CAT, resulting in a reduction of H2O2. The reduction of H2O2 accumulation can be attributed to enzyme activity in stressed cells [41]. Furthermore, Wang et al. [42] stated that POD activity was also increased with decreasing temperature in apple rootstocks. Our findings demonstrate that the increased duration of cold exposure positively enhances the antioxidant enzyme activities of B. platyphylla in response to cold stress. However, the antioxidant enzymes might not significantly reduce ROS concentration but rather increase the ROS concentration [43].
It was shown that the MDA value and proline content had a similar trend to antioxidant enzymes and EL. MDA is a marker of lipid peroxidation and acts as an important indicator of free radicals in plants [19]. MDA measurement determines lipid peroxidation in plant tissues [44]. A previous study in Arabidopsis thaliana has shown that cold stress is accompanied by an increase in MDA content [45]. It was assumed that the increased amount of MDA was an indicator of the formation of free radicals under cold stress in B. platyphylla. Meanwhile, proline is known as one of the most prominent core physiological parameters to reflect abiotic stresses [22,46]. Proline often accumulates in plants as a response to abiotic stresses [47]. Proline also could elevate the osmotic potential of the cell and mitigate cell disruptions under abiotic stresses [48]. In our research, the proline content reached a maximum value on the 27th day of cold stress, indicating that the duration of cold stress had a significant impact on proline content. Also, it was confirmed that proline content has positive correlation with stress tolerance [44]. This result was consistent with previous studies in B. platyphylla and Capsicum annuum under cold and freezing stress [10,49].
A close correlation was observed among the physiological and biochemical traits of B. platyphylla under cold stress at different time points, as shown in Figure 6, Figure 7 and Figure 8. Figure 6 shows a close correlation between chlorophyll content and height, as well as among antioxidant enzymes and proline and MDA content. The result demonstrates that physiological and biochemical traits employ different mechanisms and strategies in response to cold stress conditions. This correlation is reinforced in Figure 7. This finding was consistent with a previous study that reported a positive correlation between antioxidant enzymes, proline, and MDA [50].
In Figure 8, close associations among time points of cold stress are represented. The PCA bi-plot clearly demonstrates that cold stress induces progressive biochemical changes over time. The 27-day treatment is distinctly separated along PC1 (Dim1) and strongly associated with elevated levels of stress-related metabolites and enzymes (proline, POD, MDA, SOD, CAT, EL). This indicates that 27 days of exposure is sufficient to elicit a full stress response and thus justifies its selection for deeper physiological and molecular analysis. Earlier time points (7–19 days) show relatively moderate responses, suggesting acclimation processes are cumulative and become more evident over extended exposure. Dai et al. [51] confirmed that the duration of cold stress significantly affected the physiological and biochemical traits of barley. Similarly, the associations of antioxidant enzymes, proline, EL, and MDA are illustrated in Figure 3, Figure 4, Figure 5, Figure 6, Figure 7 and Figure 8. Our findings have been previously reported in studies [19,50]. The level of EL was found positively correlated to MDA, proline, or antioxidant enzymes under cold stress [10], demonstrating that B. platyphylla has enables cold tolerance by increasing antioxidant enzymes to avoid membrane damage in cells.
The physiological and biochemical responses observed in this study such as elevated antioxidant enzyme activities (SOD, CAT, POD), increased proline accumulation, and progressive electrolyte leakage provide valuable indicators of B. platyphylla’s response to prolonged cold stress. These stress-related traits can serve as potential selection markers for identifying cold-tolerant genotypes in future breeding programs. Moreover, understanding the timing and magnitude of these responses (e.g., the sharp increase in EL and antioxidant activity after 23–27 days) offers insight into critical stress thresholds, which can guide the timing of molecular sampling for transcriptomic or proteomic studies. Ultimately, the data presented here lay a physiological foundation for future work aimed at the genetic improvement of cold tolerance, including the identification of cold-responsive genes, regulatory elements, and metabolic pathways that could be targeted through marker-assisted selection or genetic engineering.

5. Conclusions

This study reveals that prolonged cold stress notably alters the phenotypic, physiological, and biochemical responses of B. platyphylla. Extended low-temperature exposure reduced chlorophyll content and plant growth, increased ROS accumulation, and triggered oxidative stress, as shown by elevated MDA, EL, and antioxidant enzyme activities. Additionally, significant increases in proline levels suggest an adaptive osmoprotective response. The distinct physiological and biochemical changes observed across different cold exposure durations highlight B. platyphylla’s capacity for cold tolerance. These findings offer valuable insights into cold stress adaptation mechanisms and may serve as a reference for selecting critical time points in future omics-based studies.

Author Contributions

Conceptualization, F.N.R.; methodology, F.N.R.; validation, F.N.R.; formal analysis, F.N.R.; investigation, S.A.S., L.I., N.A. and P.; data curation, F.N.R. and S.C.; writing—original draft preparation, F.N.R.; writing—review and editing, F.N.R. and S.C.; visualization, F.N.R. and S.A.S.; supervision, S.C. All authors have read and agreed to the published version of the manuscript.

Funding

This research received no external funding.

Data Availability Statement

The original contributions presented in this study are included in the article. Further inquiries can be directed to the corresponding author.

Conflicts of Interest

The authors declare no conflicts of interest.

References

  1. Yan, S.; Zhang, D.W.; Chen, S.; Chen, S. Transcriptome Sequencing Analysis of Birch (Betula platyphylla Sukaczev) under Low-Temperature Stress. Forests 2020, 11, 970. [Google Scholar] [CrossRef]
  2. WCSP World Checklist of Selected Plant Families. Available online: http://apps.kew.org/wcsp/ (accessed on 14 July 2025).
  3. Chen, T.Y.; Lou, A.R. Phylogeography and paleodistribution models of a widespread birch (Betula platyphylla Suk.) across East Asia: Multiple refugia, multidirectional expansion, and heterogeneous genetic pattern. Ecol. Evol. 2019, 9, 7792–7807. [Google Scholar] [CrossRef] [PubMed]
  4. Keinänen, M.; Julkunen-Tiitto, R.; Mutikainen, P.; Walls, M.; Ovaska, J.; Vapaavuori, E. Trade-offs in phenolic metabolism of silver birch: Effects of fertilization, defoliation, and genotype. Ecology 1999, 80, 1970–1986. [Google Scholar] [CrossRef]
  5. Gradel, A.; Haensch, C.; Ganbaatar, B.; Dovdondemberel, B.; Nadaldorj, O.; Günther, B. Response of white birch (Betula platyphylla Sukaczev) to temperature and precipitation in the mountain forest steppe and taiga of northern Mongolia. Dendrochronologia 2017, 41, 24–33. [Google Scholar] [CrossRef]
  6. Wen, X.; Ding, Y.; Tan, Z.; Wang, J.; Zhang, D.; Wang, Y. Identification and characterization of cadmium stress-related LncRNAs from Betula platyphylla. Plant Sci. 2020, 299, 110601. [Google Scholar] [CrossRef]
  7. Liu, Z.; Wang, P.; Zhang, T.; Li, Y.; Wang, Y.; Gao, C. Comprehensive analysis of BpHSP genes and their expression under heat stresses in Betula platyphylla. Environ. Exp. Bot. 2018, 152, 167–176. [Google Scholar] [CrossRef]
  8. Longo, V.; Janmohammadi, M.; Zolla, L.; Rinalducci, S. What Can Small Molecules Tell Us About Cold Stress Tolerance in Plants? In Cold Tolerance in Plants; Springer: Berlin/Heidelberg, Germany, 2018; pp. 127–157. [Google Scholar]
  9. Ritonga, F.N.; Chen, S. Physiological and Molecular Mechanism Involved in Cold Stress Tolerance in Plants. Plants 2020, 9, 560. [Google Scholar] [CrossRef]
  10. Ritonga, F.N.; Yan, S.; Chen, S.; Slamet, S.A.; Irmayanti, L.; Song, R.; Lin, X.; Jing, Y.; Farooq, U.; Khoso, M.A.; et al. Cold Acclimation Affects Physiological and Biochemical Characteristics of Betula platyphylla S. under Freezing Stress. Forests 2021, 12, 1777. [Google Scholar] [CrossRef]
  11. Renaut, J.; Lutts, S.; Hoffmann, L.; Hausman, J.-F. Responses of poplar to chilling temperatures: Proteomic and physiological aspects. Plant Biol. 2004, 7, 81–90. [Google Scholar] [CrossRef]
  12. Li, C.; Junttila, O.; Heino, P.; Palva, E.T. Low temperature sensing in silver birch (Betula pendula Roth) ecotypes. Plant Sci. 2004, 167, 165–171. [Google Scholar] [CrossRef]
  13. Oberschelp, G.P.J.; Morales, L.L.; Montecchiarini, M.L.; Harrand, L.; Podestá, F.E.; Margarit, E. Harder, better, faster, stronger: Frost tolerance of Eucalyptus benthamii under cold acclimation. Plant Physiol. Biochem. 2022, 186, 64–75. [Google Scholar] [CrossRef] [PubMed]
  14. Yang, X.; Zhao, T.; Rao, P.; Gao, K.; Yang, X.; Chen, Z.; An, X. Transcriptome profiling of Populus tomentosa under cold stress. Ind. Crops Prod. 2019, 135, 283–293. [Google Scholar] [CrossRef]
  15. Liu, X.; Lan, J.; Huang, Y.; Cao, P.; Zhou, C.; Ren, Y.; He, N.; Liu, S.; Tian, Y.; Nguyen, T. WSL5, a pentatricopeptide repeat protein, is essential for chloroplast biogenesis in rice under cold stress. J. Exp. Bot. 2018, 69, 3949–3961. [Google Scholar] [CrossRef]
  16. Çetinbaş-Genç, A.; Cai, G.; Del Duca, S. Treatment with spermidine alleviates the effects of concomitantly applied cold stress by modulating Ca2+, pH and ROS homeostasis, actin filament organization and cell wall deposition in pollen tubes of Camellia sinensis. Plant Physiol. Biochem. 2020, 156, 578–590. [Google Scholar] [CrossRef]
  17. Li, Y.; Liu, C.; Zhang, J.; Yang, H.; Xu, L.; Wang, Q.; Sack, L.; Wu, X.; Hou, J.; He, N. Variation in leaf chlorophyll concentration from tropical to cold-temperate forests: Association with gross primary productivity. Ecol. Indic. 2018, 85, 383–389. [Google Scholar] [CrossRef]
  18. Nischal, P.; Sharma, A.D. Stomatal and pollen dependant metabolic changes as a metric of stress tolerance and invasive potential of invasive plant—Lantana camara (L.) growing under abiotic stress like conditions. S. Afr. J. Bot. 2020, 131, 406–420. [Google Scholar] [CrossRef]
  19. Jamshidi Goharrizi, K.; Meru, G.; Ghotbzadeh Kermani, S.; Heidarinezhad, A.; Salehi, F. Short-term cold stress affects physiological and biochemical traits of pistachio rootstocks. S. Afr. J. Bot. 2021, 141, 90–98. [Google Scholar] [CrossRef]
  20. Ritonga, F.N.; Ngatia, J.N.; Song, R.X.; Farooq, U.; Somadona, S.; Andi, T.L.; Chen, S. Abiotic stresses induced physiological, biochemical, and molecular changes in Betula platyphylla: A review. Silva Fenn. 2021, 55, 10516. [Google Scholar] [CrossRef]
  21. Lichtenthaler, H.K.; Wellburn, A.R. Determinations of total carotenoids and chlorophylls a and b of leaf extracts in different solvents. Biochem. Soc. Trans. 1983, 11, 591–592. [Google Scholar] [CrossRef]
  22. Yue, Y.; Jiang, H.; Du, J.; Shi, L.; Bin, Q.; Yang, X.; Wang, L. Variations in physiological response and expression profiles of proline metabolism-related genes and heat shock transcription factor genes in petunia subjected to heat stress. Sci. Hortic. 2019, 258, 108811. [Google Scholar] [CrossRef]
  23. Lv, J.; Li, Y.; Liu, Z.; Li, X.; Lei, X.; Gao, C. Response of BpBZR genes to abiotic stress and hormone treatment in Betula platyphylla. Plant Physiol. Biochem. 2020, 151, 157–165. [Google Scholar] [CrossRef]
  24. Cai, X.; Magwanga, R.O.; Xu, Y.; Zhou, Z.; Wang, X.; Hou, Y.; Wang, Y.; Zhang, Y.; Liu, F.; Wang, K. Comparative transcriptome, physiological and biochemical analyses reveal response mechanism mediated by CBF4 and ICE2 in enhancing cold stress tolerance in Gossypium thurberi. AoB Plants 2019, 11, plz045. [Google Scholar] [CrossRef]
  25. Primo-Capella, A.; Martínez-Cuenca, M.-R.; Forner-Giner, M.Á. Cold Stress in Citrus: A Molecular, Physiological and Biochemical Perspective. Horticulturae 2021, 7, 340. [Google Scholar] [CrossRef]
  26. Mesa, T.; Polo, J.; Arabia, A.; Caselles, V.; Munné-Bosch, S. Differential physiological response to heat and cold stress of tomato plants and its implication on fruit quality. J. Plant Physiol. 2022, 268, 153581. [Google Scholar] [CrossRef] [PubMed]
  27. Zhang, X.; Da Silva, J.A.T.; Niu, M.; Li, M.; He, C.; Zhao, J.; Zeng, S.; Duan, J.; Ma, G. Physiological and transcriptomic analyses reveal a response mechanism to cold stress in Santalum album L. leaves. Sci. Rep. 2017, 7, 42165. [Google Scholar] [CrossRef] [PubMed]
  28. Zhao, Y.; Han, Q.; Ding, C.; Huang, Y.; Liao, J.; Chen, T.; Feng, S.; Zhou, L.; Zhang, Z.; Chen, Y.; et al. Effect of low temperature on chlorophyll biosynthesis and chloroplast biogenesis of rice seedlings during greening. Int. J. Mol. Sci. 2020, 21, 1390. [Google Scholar] [CrossRef] [PubMed]
  29. Liu, W.; Yu, K.; He, T.; Li, F.; Zhang, D.; Liu, J. The low temperature induced physiological responses of Avena nuda L., a cold-tolerant plant species. Sci. World J. 2013, 2013, 658793. [Google Scholar] [CrossRef]
  30. Ommen, O.E.; Donnelly, A.; Vanhoutvin, S.; Van Oijen, M.; Manderscheid, R. Chlorophyll content of spring wheat flag leaves grown under elevated CO2 concentrations and other environmental stresses within the ‘ESPACE-wheat’project. Eur. J. Agron. 1999, 10, 197–203. [Google Scholar] [CrossRef]
  31. Bocian, A.; Kosmala, A.; Rapacz, M.; Jurczyk, B.; Marczak, Ł.; Zwierzykowski, Z. Differences in leaf proteome response to cold acclimation between Lolium perenne plants with distinct levels of frost tolerance. J. Plant Physiol. 2011, 168, 1271–1279. [Google Scholar] [CrossRef]
  32. Hniličková, H.; Hnilička, F.; Orsák, M.; Hejnák, V. Effect of salt stress on growth, electrolyte leakage, Na+ and K+ content in selected plant species. Plant Soil Environ. 2019, 65, 90–96. [Google Scholar] [CrossRef]
  33. Pospíšil, P. Production of Reactive Oxygen Species by Photosystem II as a Response to Light and Temperature Stress. Front. Plant Sci. 2016, 7, 1950. [Google Scholar] [CrossRef]
  34. Larson, R.A. The antioxidants of higher plants. Phytochemistry 1988, 27, 969–978. [Google Scholar] [CrossRef]
  35. Amini, S.; Maali-Amiri, R.; Kazemi-Shahandashti, S.S.; López-Gómez, M.; Sadeghzadeh, B.; Sobhani-Najafabadi, A.; Kariman, K. Effect of cold stress on polyamine metabolism and antioxidant responses in chickpea. J. Plant Physiol. 2021, 258–259, 153387. [Google Scholar] [CrossRef]
  36. Demecsová, L.; Bočová, B.; Zelinová, V.; Tamás, L. Enhanced nitric oxide generation mitigates cadmium toxicity via superoxide scavenging leading to the formation of peroxynitrite in barley root tip. J. Plant Physiol. 2019, 238, 20–28. [Google Scholar] [CrossRef] [PubMed]
  37. Kim, B.M.; Lee, J.W.; Seo, J.S.; Shin, K.H.; Rhee, J.S.; Lee, J.S. Modulated expression and enzymatic activity of the monogonont rotifer Brachionus koreanus Cu/Zn-and Mn-superoxide dismutase (SOD) in response to environmental biocides. Chemosphere 2015, 120, 470–478. [Google Scholar] [CrossRef] [PubMed]
  38. Kaouthar, F.; Ameny, F.K.; Yosra, K.; Walid, S.; Ali, G.; Faical, B. Responses of transgenic Arabidopsis plants and recombinant yeast cells expressing a novel durum wheat manganese superoxide dismutase TdMnSOD to various abiotic stresses. J. Plant Physiol. 2016, 198, 56–68. [Google Scholar] [CrossRef] [PubMed]
  39. Ueda, Y.; Uehara, N.; Sasaki, H.; Kobayashi, K.; Yamakawa, T. Impacts of acute ozone stress on superoxide dismutase (SOD) expression and reactive oxygen species (ROS) formation in rice leaves. Plant Physiol. Biochem. 2013, 70, 396–402. [Google Scholar] [CrossRef]
  40. Dreyer, A.; Dietz, K.-J. Reactive oxygen species and the redox-regulatory network in cold stress acclimation. Antioxidants 2018, 7, 169. [Google Scholar] [CrossRef]
  41. Omara, R.I.; El-Kot, G.A.; Fadel, F.M.; Abdelaal, K.A.; Saleh, E.M. Efficacy of certain bioagents on patho-physiological characters of wheat plants under wheat leaf rust stress. Physiol. Mol. Plant Pathol. 2019, 106, 102–108. [Google Scholar] [CrossRef]
  42. Wang, Y.X.; Hu, Y.; Chen, B.H.; Zhu, Y.F.; Mohammed, M.D.; Sofkova, S. Physiological mechanisms of resistance to cold stress associated with 10 elite apple rootstocks. J. Integr. Agric. 2018, 17, 857–866. [Google Scholar] [CrossRef]
  43. Arrigoni, O.; De Tullio, M.C. Ascorbic acid: Much more than just an antioxidant. Biochim. Biophys. Acta (BBA)—Gen. Subj. 2002, 1569, 1–9. [Google Scholar] [CrossRef]
  44. Toscano, S.; Farieri, E.; Ferrante, A.; Romano, D. Physiological and Biochemical Responses in Two Ornamental Shrubs to Drought Stress. Front. Plant Sci. 2016, 7, 645. [Google Scholar] [CrossRef]
  45. Distelbarth, H.; Nägele, T.; Heyer, A.G. Responses of antioxidant enzymes to cold and high light are not correlated to freezing tolerance in natural accessions of Arabidopsis thaliana. Plant Biol. 2013, 15, 982–990. [Google Scholar] [CrossRef] [PubMed]
  46. Chen, J.; Cui, Y.; Yan, J.; Jiang, J.; Cao, X.; Gao, J. Molecular characterization of elongase of very long-chain fatty acids 6 (elovl6) genes in Misgurnus anguillicaudatus and their potential roles in adaptation to cold temperature. Gene 2018, 666, 134–144. [Google Scholar] [CrossRef] [PubMed]
  47. Demirel, U.; Morris, W.L.; Ducreux, L.J.M.; Yavuz, C.; Asim, A.; Tindas, I.; Campbell, R.; Morris, J.A.; Verrall, S.R.; Hedley, P.E.; et al. Physiological, Biochemical, and Transcriptional Responses to Single and Combined Abiotic Stress in Stress-Tolerant and Stress-Sensitive Potato Genotypes. Front. Plant Sci. 2020, 11, 169. [Google Scholar] [CrossRef]
  48. Anjum, S.A.; Xie, X.-Y.; Wang, L.-C.; Saleem, M.F.; Man, C.; Lei, W. Morphological, physiological and biochemical responses of plants to drought stress. Afr. J. Agric. Res. 2011, 6, 2026–2032. [Google Scholar]
  49. Singh, R.; Rathore, D. Oxidative stress defence responses of wheat (Triticum aestivum L.) and chilli (Capsicum annum L.) cultivars grown under textile effluent fertilization. Plant Physiol. Biochem. 2018, 123, 342–358. [Google Scholar] [CrossRef]
  50. Abid, M.; Zhang, Y.J.; Li, Z.; Bai, D.F.; Zhong, Y.P.; Fang, J.B. Effect of salt stress on growth, physiological and biochemical characters of four kiwifruit genotypes. Sci. Hortic. 2020, 271, 109473. [Google Scholar] [CrossRef]
  51. Dai, F.; Huang, Y.; Zhou, M.; Zhang, G. The influence of cold acclimation on antioxidative enzymes and antioxidants in sensitive and tolerant barley cultivars. Biol. Plant. 2009, 53, 257–262. [Google Scholar] [CrossRef]
Figure 1. (a) Growth condition of control and cold-stress-treated B. platyphylla seedlings. Several symptoms were found in the visible appearance of cold-treated seedlings, such as stunted/dwarfism, red stems, and yellow leaves (b). B. platyphylla control leaves (c) showed red stems under cold stress.
Forests 16 01176 g001
Figure 2. (a) Development of daily height growth rate and (b) electrolyte leakage of B. platyphylla seedlings under 6 °C exposure in comparison with control temperature (25 °C) for 27 days. Each value represents the mean value ± SE from measurements. Different letters indicate a significant difference between 6 °C and 25 °C conditions at p < 0.05 according to Duncan’s multiple range test.
Forests 16 01176 g002
Figure 3. Photosynthesis pigment value of B. platyphylla leaves under 6 °C exposure in comparison with control temperature (25 °C) for 27 days. Each value represents the mean value ± SE from measurements. “*” demonstrates a significant difference between 6 °C and 25 °C conditions at p < 0.05 according to Duncan’s multiple range test.
Forests 16 01176 g003
Figure 4. Changes in SOD, CAT, and POD activity under 6 °C exposure in comparison with control temperature (25 °C) for 27 days. Each value represents the mean value ± SE from measurements. Different letters indicate a significant difference between 6 °C and 25 °C conditions at p < 0.05 according to Duncan’s multiple range test.
Forests 16 01176 g004
Figure 5. (a) Changes in MDA content and (b) proline under 6 °C exposure in comparison with control temperature (25 °C) for 27 days. Each value represents the mean value ± SE from measurements. Different letters indicate a significant difference between 6 °C and 25 °C conditions at p < 0.05 according to Duncan’s multiple range test.
Forests 16 01176 g005
Figure 6. Heatmap of physiological and biochemical traits of B. platyphylla under 6 °C at different time points. Blue indicates a relatively low content, while green indicates a relatively high content. The values presented in the heatmap were normalized from the original data.
Forests 16 01176 g006
Figure 7. Correlation between several physiological and biochemical parameters recorded in B. platyphylla at 6 °C during a duration of 27 days. The diameter of the solid circles signifies the degree of connection, with blue denoting positive correlation and red indicating negative correlation. * means significant at the 5% level, ** means significant at the 1% level and *** means significant at the 0.1% level.
Forests 16 01176 g007
Figure 8. PCA of six evaluated traits of B. platyphylla under 6 °C cold stress at different time points. EL, electrolyte leakage; MDA, malondialdehyde; SOD, superoxide dismutase; POD, peroxidase; CAT, catalase.
Forests 16 01176 g008
Disclaimer/Publisher’s Note: The statements, opinions and data contained in all publications are solely those of the individual author(s) and contributor(s) and not of MDPI and/or the editor(s). MDPI and/or the editor(s) disclaim responsibility for any injury to people or property resulting from any ideas, methods, instructions or products referred to in the content.

