Article

The Impact of Compound Drought and Heatwave Events on the Gross Primary Productivity of Rubber Plantations

by
Qinggele Bao
1,
Ziqin Wang
1 and
Zhongyi Sun
1,2,3,*
1
School of Ecology, Hainan University, Haikou 570228, China
2
Key Laboratory of Agro-Forestry Environmental Processes and Ecological Regulation of Hainan Province, Haikou 570228, China
3
Sanya Tropical Ecosystem Carbon Source and Sink Field Scientific Observation and Research Station, Sanya 572000, China
*
Author to whom correspondence should be addressed.
Forests 2025, 16(7), 1146; https://doi.org/10.3390/f16071146
Submission received: 5 June 2025 / Revised: 30 June 2025 / Accepted: 9 July 2025 / Published: 11 July 2025
(This article belongs to the Section Forest Meteorology and Climate Change)

Abstract

Global climate change has increased the frequency of compound drought–heatwave events (CDHEs), seriously threatening tropical forest ecosystems. However, due to the complex structure of natural tropical forests, related research remains limited. To address this, we focused on rubber plantations on Hainan Island, which have simpler structures, to explore the impacts of CDHEs on their primary productivity. We used Pearson and Spearman correlation analyses to select the optimal combination of drought and heatwave indices. Then, we constructed a Compound Drought–Heatwave Index (CDHI) using Copula functions to describe the temporal patterns of CDHEs. Finally, we applied a Bayes–Copula conditional probability model to estimate the probability of GPP loss under CDHE conditions. The main findings are as follows: (1) The Standardized Precipitation Evapotranspiration Index (SPEI-3) and Standardized Temperature Index (STI-1) formed the best index combination. (2) The CDHI successfully identified typical CDHEs in 2001, 2003–2005, 2010, 2015–2016, and 2020. (3) Temporally, CDHEs significantly increased the probability of GPP loss in April and May (0.58 and 0.64, respectively), while the rainy season showed a reverse trend due to water buffering (lowest in October, at 0.19). (4) Spatially, the northwest region showed higher GPP loss probabilities, likely due to topographic uplift. This study reveals how tropical plantations respond to compound climate extremes and provides theoretical support for the monitoring and management of tropical ecosystems.

1. Introduction

With the intensification of global warming, compound drought and heatwave events (CDHEs) are becoming increasingly frequent and intense on a global scale [1,2], causing severe impacts on ecosystems and human societies [3]. Global economic losses caused by droughts and heatwaves show a significant upward trend. Drought losses alone increased from USD 17.3 billion in 1980–2009 to USD 23.1 billion in 2010–2017 [4]. Meanwhile, losses due to heatwaves between 1992 and 2013 were estimated to reach as high as USD 1.6–5.0 trillion [5]. Compared to single drought or heatwave events, CDHEs cause even more severe economic losses. For example, three CDHEs in the United States from 2011 to 2013 resulted in losses of about USD 60 billion [6]. Similarly, a CDHE in Europe in 2018 caused economic losses of approximately EUR 3.3 billion [7]. Even tropical forests with the richest biodiversity and authenticity are not immune to these impacts and may even be more severely affected [8]. In order to address these increasing losses, it has become crucial to study how to effectively reduce and mitigate the impacts of droughts and heatwaves. Particularly for tropical forests, a deep understanding of the mechanisms by which CDHEs affect them not only helps reveal the response and adaptation processes of ecosystems to extreme climate events but also aids in better understanding the dynamic role of tropical forests in global carbon balance. This provides key parameters for improving ecosystem models and predicting climate change scenarios [9,10].
There is now some consensus on the definition and quantification methods for CDHEs. The IPCC’s SREX (the Intergovernmental Panel on Climate Change, Special Report on Managing the Risks of Extreme Events and Disasters to Advance Climate Change Adaptation) report proposed three definitions for compound events [11]: (1) two or more extreme events occurring simultaneously or successively; (2) combinations of extreme events with underlying conditions that amplify their impact; or (3) combinations of events that are not themselves extremes but lead to an extreme event or impact when combined. Most current CDHEs studies are primarily based on definition (1), viewing them as events where droughts and heatwaves occur simultaneously or successively [12,13,14]. Based on this consensus, researchers mainly use two approaches to identify and quantify CDHEs. One is the threshold method [15,16,17,18,19], and the other is constructing a comprehensive Compound Drought Heatwave Index (CDHI) using drought indices and heatwave indices [20,21].
Regarding the impact of CDHEs on vegetation, some studies mainly used the Normalized Difference Vegetation Index (NDVI), Enhanced Vegetation Index (EVI), or Gross Primary Productivity (GPP) as evaluation indicators [22,23]. Among them, GPP is the core driving force of ecosystem material cycling and energy flow, capable of rapidly and effectively reflecting ecosystem responses to environmental disturbances, and is a key indicator for assessing ecosystem health [24,25]. Due to its relatively mature monitoring and assessment methods, GPP has become an ideal choice for studying the impacts of CDHEs. However, traditional analysis methods, such as calculating Pearson correlation coefficients between drought indices, heatwave indices, and GPP, struggle to accurately capture the tail dependency between extreme events and GPP [26]. Even when the overall correlation between two variables is not significant, they may still have strong associations in extreme cases. This is an important consideration when studying extreme events [27,28]. In order to overcome this limitation, researchers have begun using more complex statistical methods to capture the actual impact of extreme events on GPP. For example, using Copula functions to construct models for assessing the probability of GPP loss under droughts, heatwaves, and CDHEs can better evaluate the impacts of different types of extreme events [29]. The advantage of Copula functions is their ability to flexibly handle dependency structures between multiple variables, especially in cases of nonlinear relationships or tail dependencies [30]. This method allows researchers to more accurately quantify the probability of GPP loss under different combinations of extreme events, leading to a better assessment of CDHEs’ impacts on ecosystems.
Despite the increasing number of studies on the impact of CDHEs on GPP [31,32,33], research focusing on tropical forests remains insufficient. This is mainly because the species diversity, structural complexity, and environmental heterogeneity of tropical forests make such studies challenging. In this context, rubber plantations, as a type of artificial tropical forest ecosystem, can serve as a unique entry point for research. Compared to natural tropical forests, rubber plantations are often even-aged monocultures with simpler structures. This makes the effects of CDHEs easier to observe and quantify, showing distinct response characteristics. Rubber trees exhibit clear physiological responses to CDHEs. Heatwave promotes leaf transpiration, leading to stomatal closure, which limits CO2 absorption and reduces photosynthetic rates. It also decreases the efficiency of photosynthetic enzymes, further reducing GPP. Under drought conditions, water uptake by roots is restricted, affecting nutrient absorption and transport. As water is a key component in photosynthesis, its shortage also limits GPP. Due to their unique latex production physiology, rubber trees are sensitive to water stress. The effects of cutting rubber activities and the tropical water pump phenomenon intensify drought stress [34]. Due to the systemic effects of compound factors, heatwave accelerates water evaporation, increasing drought severity. Drought leads to a decrease in the overall specific heat of the ecosystem, exacerbating the severity and duration of hot weather. Hainan Island, ranking as the second-largest natural rubber planting area in China, is located at the northern edge of the tropics. With frequent heatwave and drought events [35,36], it provides an ideal natural setting for studying the impacts of CDHEs.
Given the relative lack of research on the impact of CDHEs on tropical forest GPP, this study uses rubber plantations on Hainan Island as a starting point. It aims to diagnose the mechanisms by which CDHEs affect rubber tree GPP and to quantify the productivity response to compound drought and heatwave events. The objectives of this study were (1) to identify the optimal combination of drought and heatwave indices by calculating Pearson and Spearman correlation coefficients between the Standardized Temperature Index at 1-month time scale (STI-1) (heatwave index) and multiple drought indices (Standardized Precipitation Evapotranspiration Index (SPEI), Standardized Precipitation Index (SPI), Standardized Relative Humidity Index (SRHI), and Standardized Soil Moisture Index (SSMI)) at 1-, 3-, 6-, 9-, and 12-month time scales, where the optimal combination was defined as the drought index and time scale that showed the strongest and most significant negative correlation with STI-1, indicating a higher likelihood of co-occurrence and providing a robust basis for constructing the CDHI; (2) to construct a CDHI using Copula functions based on the selected optimal index combination, to capture the characteristics of CDHEs experienced by rubber plantations; and (3) to construct a Bayes–Copula conditional probability model between the CDHI and rubber plantation ecosystem GPP to quantitatively assess the impact of CDHEs on rubber plantation GPP and reveal potential losses. This study combines the quantification of CDHEs with probability assessment of GPP responses, providing a methodological framework for studying CDHEs impact on tropical forests. The results help improve our understanding of how tropical forest ecosystems respond to climate change and provide scientific evidence for developing regional climate change strategies.

2. Materials and Methods

2.1. Study Area

Hainan Island, situated between 108°03′–111°03′ E and 18°10′–20°10′ N, borders the Beibu Gulf to the west and the South China Sea to the east. As China’s second-largest island, it covers approximately 35,400 km2. The island experiences a tropical monsoon climate, with a mean annual temperature of 25 ± 1 °C and annual precipitation exceeding 1600 mm. Although rainfall is abundant, it is unevenly distributed: over 80% of the annual total occurs during the rainy season (from May to October), while the dry season contributes only 10%–30% [37,38]. Topographically, the terrain is dominated by Mount Wuzhi and Mount Limu at its center, descending in a series of steps toward the periphery and resulting in pronounced relief (Figure 1b). In terms of soil properties, Hainan Island is mainly covered by lateritic red soils, which are relatively shallow in depth, compact in structure, with low porosity, and poor in both aeration and water-holding capacity. Forest cover on Hainan Island is 53.5%, of which rubber plantations—an important plantation ecosystem—occupied 7270 km2 in 2020 (Figure 1c), accounting for roughly 20% of the island and occurring primarily in the northwest, north, and central-eastern regions (Figure 1c) [39].

2.2. Data

2.2.1. The Rubber Plantations Distribution Data

In this study, we utilized the 2000–2020 dataset of natural rubber plantation distribution changes on Hainan Island. This high-accuracy product was generated by Bao et al. [40] through the integration of 1998–2022 Landsat TM/OLI imagery with field survey observations and the Third National Land Survey Report using a multi-feature random forest classifier. The resulting map achieves an overall classification accuracy of 96.93%, ensuring reliable delineation of rubber plantation extents. To align with the spatial resolution of our meteorological inputs, we overlaid a 1 km analysis grid onto Hainan Island and identified 1910 grid cells in which rubber plantation cover exceeded 90.0%, designating these as pure rubber plantation sites for subsequent analyses.

2.2.2. The Environmental Data

In this study, we used environmental data from the National Earth System Science Data Center (NESSDC). The data included the monthly maximum temperature (Tmax), precipitation (Pre), potential evapotranspiration (PET), relative humidity (RH), and soil moisture (SM). For Tmax, we used the dataset constructed by He et al. [41] using machine learning methods. This dataset, based on meteorological station observations and considering terrain and geographical factors, covered the period from 1954 to 2020 with a spatial resolution of 1 km. Compared to commonly used temperature datasets such as Terra Climate, ERA5, and FLDAS (Famine Early Warning Systems Network Land Data Assimilation System), this dataset showed significant advantages in terms of accuracy and spatial detail. For Pre, we used the dataset developed by Peng et al. [42]. This study generated monthly Pre data at 1 km resolution for China from 1901 to 2022, using the Delta spatial downscaling scheme based on global 0.5° climate data from CRU (Climatic Research Unit) and high-resolution climate data from World Clim. For PET, we employed the dataset from Peng et al. [43], which provided monthly PET data at 1 km resolution for China from 1901 to 2022, calculated using the Hargreaves formula [44], which estimates PET based on monthly mean, maximum, and minimum temperatures. For RH, we utilized the dataset created by Jing et al. [45,46]. They produced monthly RH data at 1 km resolution for China from 2000 to 2020 through spatial downscaling of reanalysis climate data. For SM, we adopted the dataset from Li et al. [47]. They generated a daily SM dataset at 1 km resolution for 10 soil layers (10–100 cm depth, at 10 cm intervals) from 2000 to 2020. This dataset was produced using machine learning methods, with observations from 1648 stations provided by the China Meteorological Administration (CMA) as a benchmark. ERA5_Land meteorological forcing data, leaf area index, land cover type, terrain, and soil characteristics were used as covariates. In this study, we mainly focused on the surface layer (0–10 cm) of SM. We aggregated the daily data into monthly values to obtain monthly SM data.

2.2.3. The GPP Data

In this study, we selected the 2001–2020 MODIS (Moderate Resolution Imaging Spectroradiometer) product MOD17A2HV006, a Level-4 standard GPP dataset generated by a light-use efficiency model at a 500 m resolution with 8-day composites [48,49]. We aggregated the 8-day GPP values into monthly totals based on the proportion of days and then resampled them to a 1 km resolution using the mean method for subsequent analysis.

2.3. Methods

2.3.1. Heatwave and Drought Indices

In this study, we adopted the non-parametric Gringorton empirical frequency formula [50] to estimate marginal distributions in order to calculate standardized indices while avoiding parametric assumptions about data distribution. This formula, proposed by Gringorten et al. [51], was developed under the assumption of a double exponential distribution and aims to optimize the fit of extreme values, making it widely used for probability estimation of extreme events. Based on this, we calculated SPI, SPEI, SRHI, and SSMI for different time scales (1, 3, 6, 9, and 12 months). These four indices have different meanings. The SPI mainly evaluates meteorological drought based on precipitation amounts. The SPEI, building upon the SPI, considers the impact of evapotranspiration caused by temperature and radiation. The SRHI primarily reflects atmospheric water demand by evaluating anomalies in relative humidity, making it sensitive to evaporative stress conditions. The SSMI quantifies drought by standardizing soil moisture anomalies, effectively capturing agricultural and eco-hydrological drought stress in the root zone [52,53,54,55]. Several factors complicate the assessment of drought in the rubber plantations of Hainan Island. Firstly, precipitation on the island mainly comes from thermal thunderstorms and typhoon rains. Secondly, strong radiation leads to intense evapotranspiration. Third, the varied topography of the island results in diverse moisture conditions. Consequently, it is necessary to determine the most suitable drought index for rubber plantations on Hainan Island by considering multiple water sources. We assessed heatwave events using the STI, which estimates the severity and impacts of heatwaves based on Tmax data [13]. Due to the rapid occurrence of heatwave events, we only calculated the STI at a 1-month scale. The specific calculation formula is shown in Equation (1):
G ( x ) = i 0.44 n + 0.12
where G(x) is the estimate of the marginal distribution function; i is the rank of value x in the sample data (i = 1, 2, 3, …, n), ordered from smallest to largest; and n is the total number of sample data.
Then, the SI value is obtained by inverse normalization of G(x). The specific calculation formula is shown in Equation (2):
S I = Φ 1 ( G ( x ) )
where Φ−1 is the inverse function of the standard normal distribution.
According to the classification standards of the SPEI, SPI, SRHI, and SSMI, we categorized the numerical ranges for mild, moderate, severe, and extreme drought as (−1, −0.5], (−1.5, −1.0], (−2.0, −1.5], and (−∞, −2.0], respectively. Similarly, according to the STI classification standard, we categorized the numerical ranges for mild, moderate, severe, and extreme heatwaves as [0.5, 1.0), [1.0, 1.5), [1.5, 2.0), and [2.0, +∞), respectively.

2.3.2. Standardized Anomaly of GPP

The Standardized Anomaly of GPP (SAGPP) reflects the fluctuations in sample data. Among them, positive and negative anomalies indicate increases and decreases in the sample, reflecting the response to long-term average conditions, respectively [29]. Because of the impacts of long-term trends and seasonal factors, in this study, we decomposed the GPP time series into three components: trend, seasonal, and residual terms. We assumed that the residual term represented the variations in GPP caused by changes in water and heat conditions. We then standardized the GPP residuals to obtain the SAGPP.

2.3.3. CDHI

Copula functions, with their flexible construction and strong adaptability, are widely used to construct bivariate and multivariate joint distributions [56]. There are many types of Copula functions. Among them, the commonly used ones include elliptical Copulas and Archimedean Copulas (Table 1). Elliptical Copulas, such as the Gaussian Copula and T Copula, can describe both positive and negative multivariate relationships. They are suitable for modeling multivariate positive and negative correlations. Archimedean Copulas, such as the Clayton Copula, Frank Copula, and Gumbel Copula, are primarily used to depict the dependence relationships between bivariate variables. Among them, the Frank Copula can describe both positively and negatively correlated variables. However, other types mainly describe positively correlated variables [57].
In order to construct the CDHI, we first conducted Pearson correlation analysis to assess the correlations between the SPEI, SPI, SRHI, SSMI, and STI-1 at different time scales (1, 3, 6, 9, and 12 months), where stronger negative correlations indicate a higher co-occurrence of droughts and heatwaves, suggesting a greater likelihood of CDHEs. Then, we selected the drought index with the strongest negative correlation with STI-1 as the drought indicator for CDHEs.
After selecting the drought and heatwave indicators, we designated the Standardized Drought Index (SDI) and heatwave index as SDI and STI, respectively. Then, we defined CDHEs as instances where the variable SDI is less than or equal to a threshold (sdi), while simultaneously, the variable STI is greater than or equal to another threshold (sti). Based on this definition, we calculated the joint probability of CDHEs. The specific calculation formula is shown in Equation (3):
P = P ( SDI s d i , STI s t i ) = P ( SDI s d i ) P ( SDI s d i , STI s t i ) = F ( s d i ) C ( F ( s d i ) , F ( s t i ) )
where F is the marginal distribution function, and C is the Copula function.
Unlike marginal probabilities in univariate cases, joint probabilities may not be uniformly distributed. Therefore, we fitted the Gringorten empirical frequency distribution to the joint probability [58]. Meanwhile, in order to facilitate the expression and quantification of the severity of CDHEs, we standardized P to obtain the CDHI. In this study, we adopted the same classification standards as those for drought indices such as the SPEI to define the levels of the CDHI. The specific calculation formula is shown in Equation (4):
C D H I = Φ 1 ( G ( P ) )
where Φ−1 is the inverse function of the standard normal distribution, and G is the Gringorten empirical frequency distribution.
In order to select the optimal Copula function for constructing the CDHI, we used the squared Euclidean distance to evaluate the goodness of fit for each Copula function [59]. The specific calculation formula is shown in Equation (5):
d = i = 1 n C e m p ( u , v ) C k ( u , v ) 2
where Cemp(u,v) denotes the cumulative probability of the sample value calculated by an empirical Copula, and Ck(u,v) denotes the cumulative probability of the sample value calculated by a theoretical Copula.

2.3.4. Bayes–Copula Conditional Probability Model

In order to quantitatively assess the impact of CDHEs on rubber plantations GPP and to reveal its potential loss, we constructed a Bayes–Copula conditional probability model between the CDHI and GPP loss in rubber plantation ecosystems. The probability of GPP loss refers to the possibility that, under specific compound drought and heatwave scenarios, the SAGPP of rubber plantation ecosystems is less than or equal to the loss threshold sagpp. Firstly, we used Pearson correlation analysis to determine the correlations between the optimal index combinations and selected appropriate Copula functions from Table 1. Secondly, we applied the kernel density estimation method to determine the marginal distributions of the CDHI and SAGPP. Finally, we constructed a conditional probability model between the CDHI and SAGPP and evaluated the goodness of fit for each Copula function using the squared Euclidean distance. Taking the mild compound drought and heatwave scenario as an example, the specific calculation formula is shown in Equation (6):
P ( SAGPP s a g p p | 0.5 CDHI 1 ) = C ( F CDHI ( 0.5 ) , F SAGPP ( 0 ) ) F CDHI ( 0.5 ) C ( F CDHI ( 1.0 ) , F SAGPP ( 0 ) ) F CDHI ( 1.0 )
where F is the marginal distribution function, and C is the Copula function.

2.3.5. Correlation Analysis

In order to select the optimal combination of drought and heatwave indices for constructing the CDHI for rubber plantations on Hainan Island, we employed two correlation analysis methods—Pearson and Spearman correlations [60,61]—and selected the drought index that exhibited the strongest and most significant negative correlation with STI-1 as the drought component of the CDHI.

3. Results

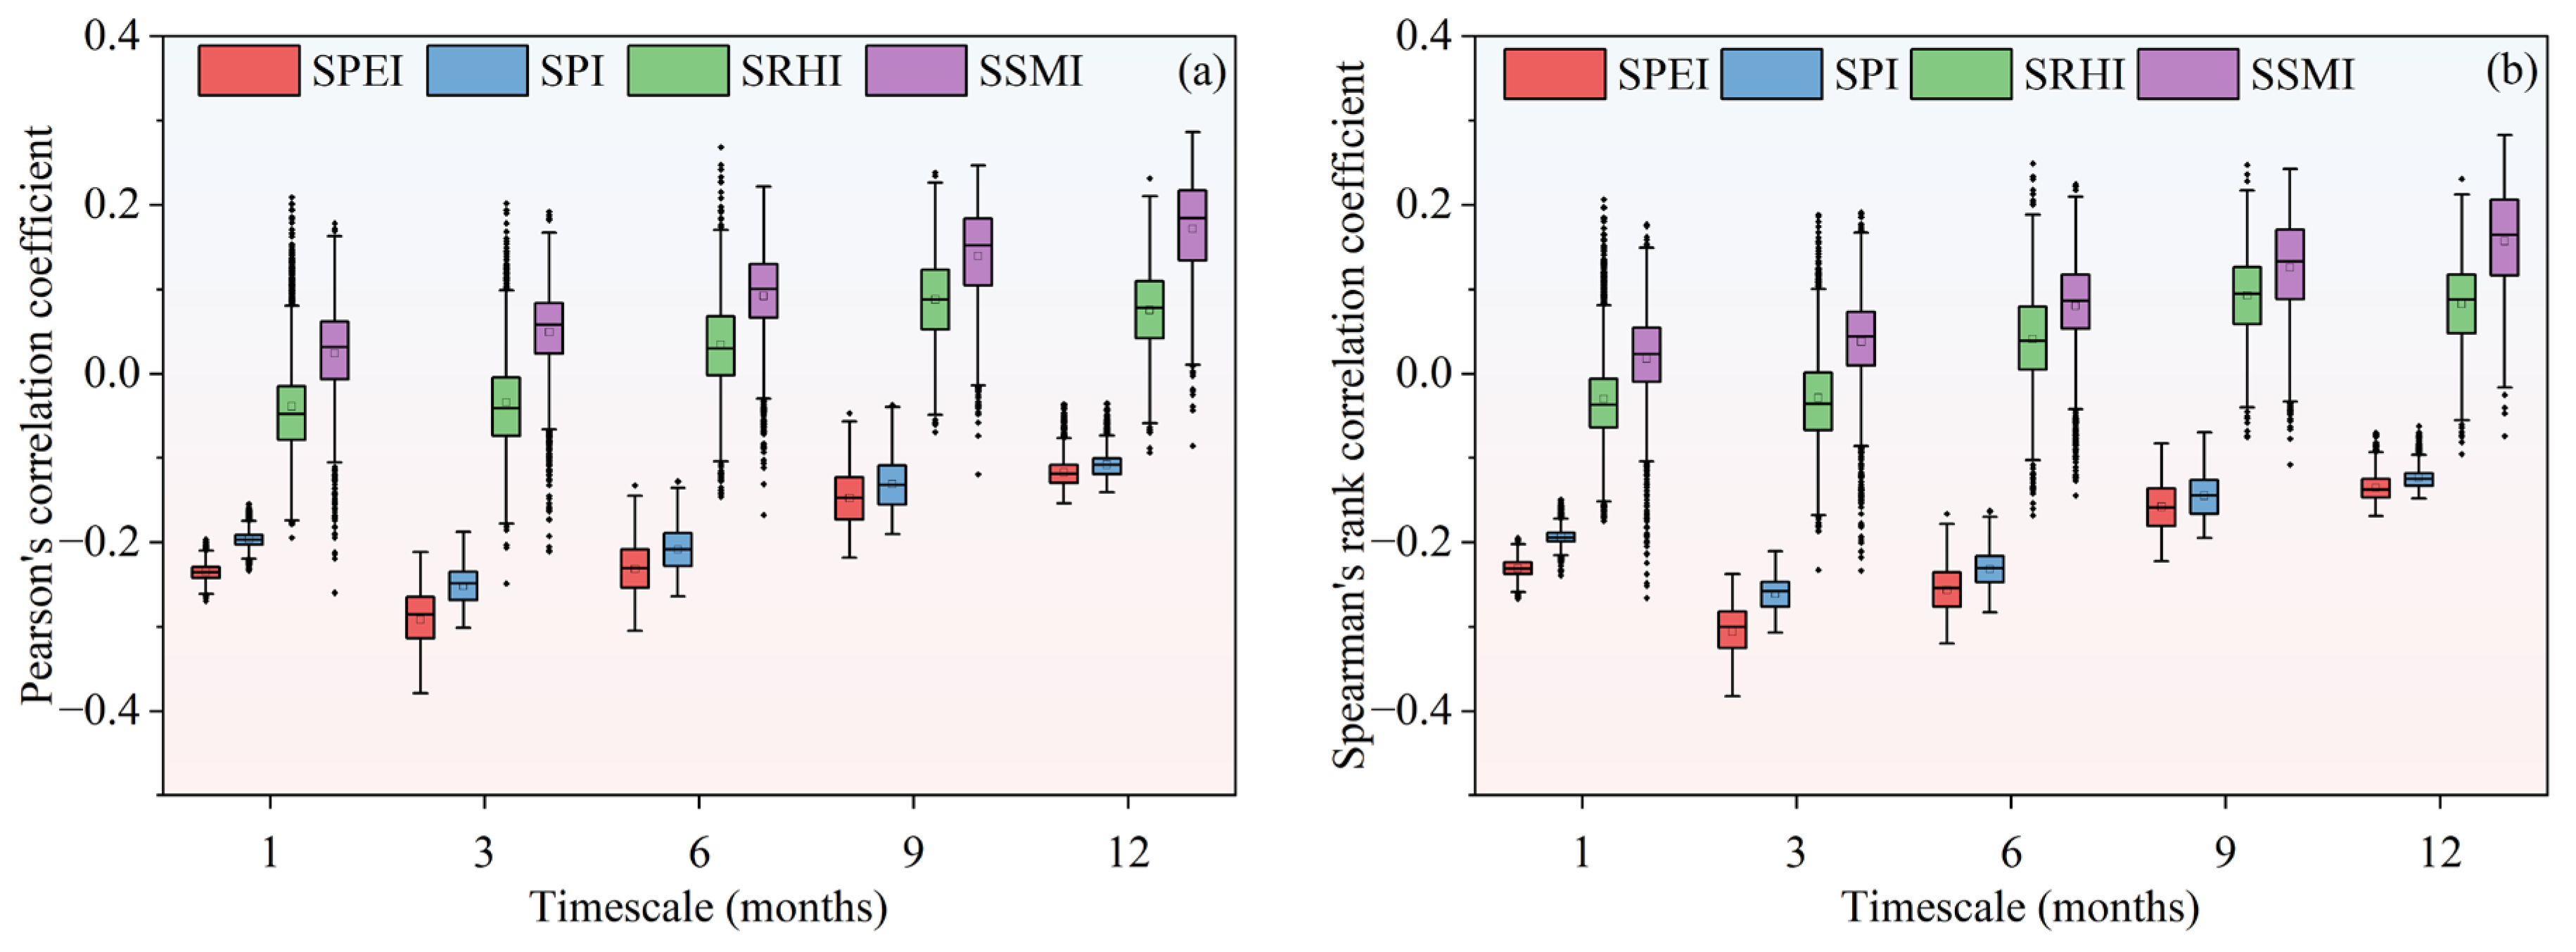
3.1. Selection of the Optimal Standardized Drought Index

As shown in Figure 2a,b, pixel-wise Pearson and Spearman correlation analyses were conducted between four drought indices at different time scales and STI-1. Among these indices, SPEI-3 exhibited the strongest negative correlation with STI-1 in both correlation methods. Therefore, this study selected SPEI-3 as the key drought indicator for CDHEs. As shown in Figure S1a–b, SPEI-3 and STI-1 demonstrated a significant negative correlation (p < 0.05) across all rubber plantation pixels. Spatially, the negative correlation between SPEI-3 and STI-1 in the rubber plantations of northwestern Hainan Island was significantly stronger than in other regions of the island.

3.2. Copula-Based Joint Distribution Optimization

Table 2 presents the goodness-of-fit evaluation results for the bivariate Copula functions fitted to SPEI-3 and STI-1. Based on the criterion that a smaller squared Euclidean distance indicates a better fit; the Gaussian Copula function demonstrates the optimal performance with the lowest value of 0.1422. Therefore, the Gaussian Copula was selected to construct the CDHI.

3.3. The Application of the CDHI in Rubber Plantations on Hainan Island

Figure 3 shows the time series of the CDHI for rubber plantations in Hainan Island from January 2001 to December 2020. During this period, several severe CDHEs occurred in 2001, 2003–2005, 2010, 2015–2016, and 2020. Among these events, the CDHI values dropped to −2.11, −2.41, −2.10, and −2.71 in 2003, 2005, 2010, and 2020, respectively, indicating the occurrence of extreme CDHEs. The shaded areas in the figure corresponded to historical typical drought and heatwave events in Hainan Island, as recorded in the “Yearbook of Meteorological Disasters in China”. These events covered the years 2003, 2004, 2005, 2010, 2015, 2016, and 2020. As shown in Figure S2, the frequency of CDHEs varied by month throughout the year. Mild events were most common in November and December, each accounting for 23%; moderate events mainly occurred in April and May, accounting for 15% and 14% respectively; severe events often happened in July and August, each accounting for 9%; while extreme events typically occurred in June, also accounting for 9%.

3.4. The Impact of CDHEs on GPP in Rubber Plantations

As shown in Figure 4, the trend of the probability of GPP loss for rubber plantations in Hainan Island under different compound drought and heatwave scenarios from April to November. As CDHEs intensified, the probability of GPP loss in rubber plantations increased significantly in April and May. In contrast, the trend of the probability of GPP loss from June to November was completely opposite to that of April and May, decreasing progressively from mild to extreme events. The probability of GPP loss peaked in May, reaching 0.554, 0.585, 0.612, and 0.645 under mild compound drought and heatwave (MCDH), moderate compound drought and heatwave (ModCDH), severe compound drought and heatwave (SCDH), and extreme compound drought and heatwave (ECDH) scenarios, respectively. In contrast, October showed the lowest probability, with values of 0.388, 0.320, 0.265, and 0.198 for the same scenarios.

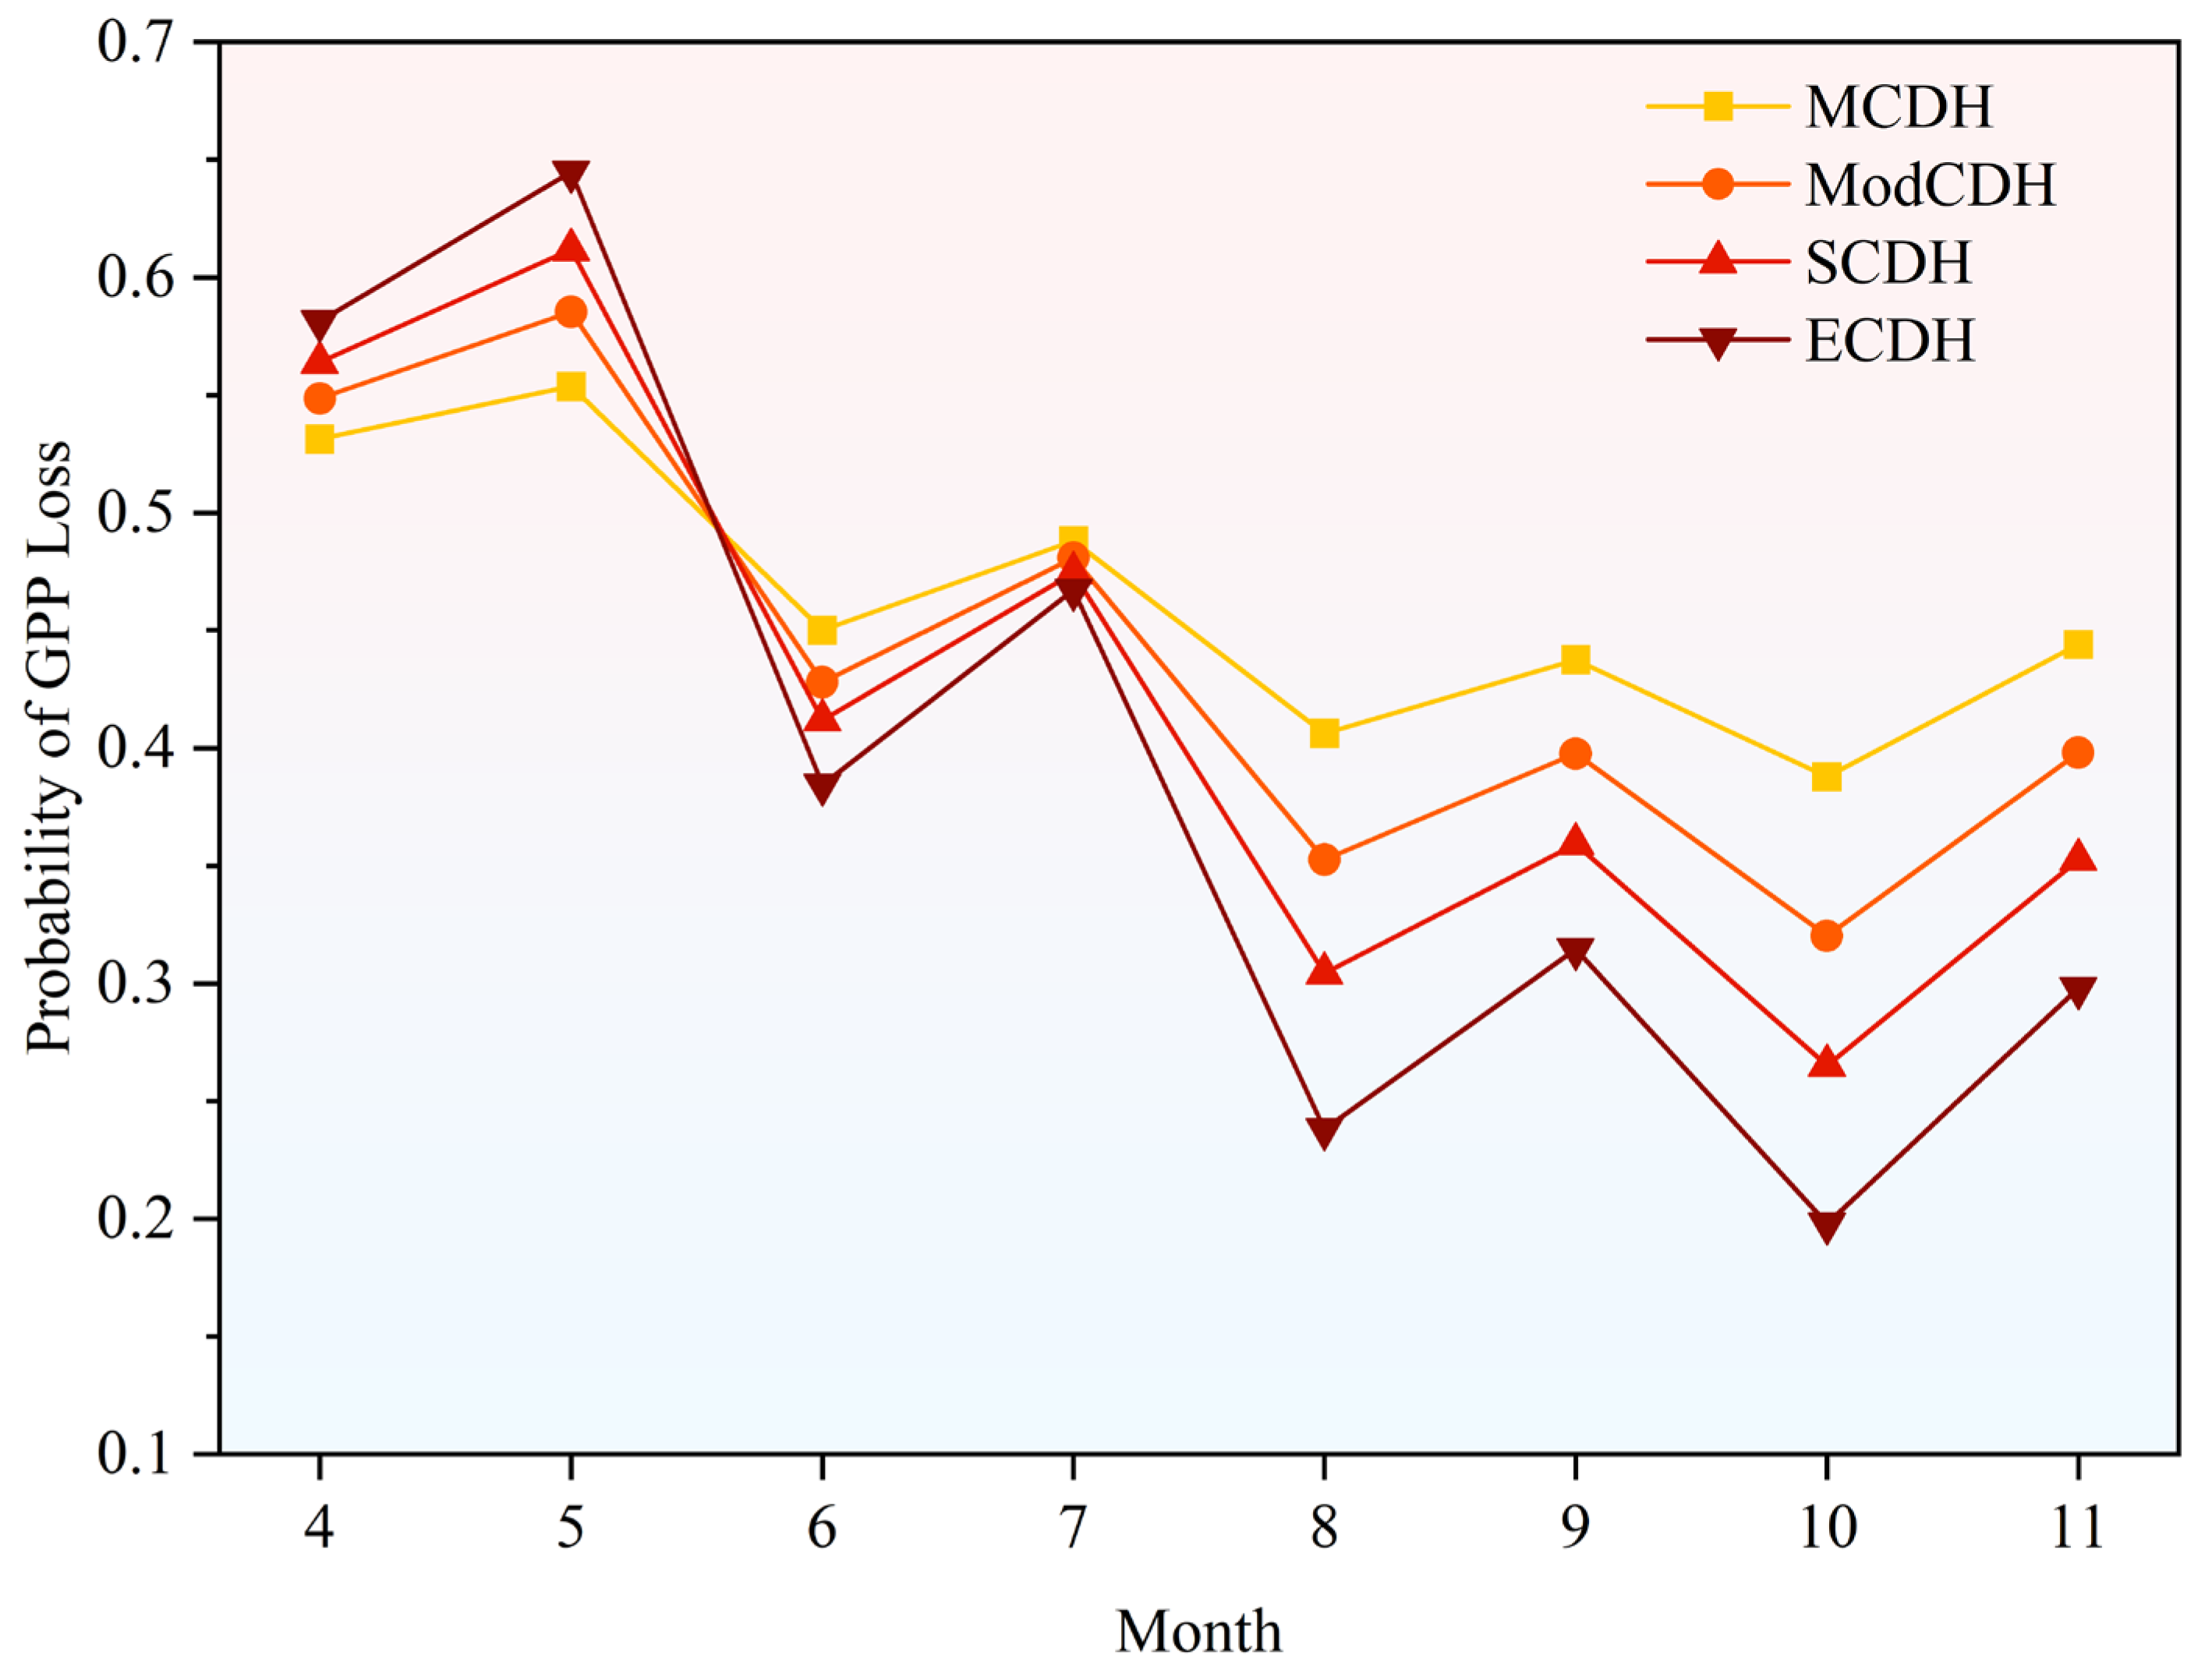
3.5. The Probability of GPP Loss Under Different Scenarios of Drought, Heatwave, and Compound Drought and Heatwave

As shown in Figure 5, the probability of GPP loss in rubber plantations varied under different scenarios of heatwaves, drought, and compound drought and heatwaves from April to November. As shown in Figure 5a, the median probability of GPP loss was 0.549, 0.529, and 0.553 under mild heatwave (MH), mild drought (MD), and MCDH scenarios, respectively, in May. In July, these probabilities were 0.444, 0.460, and 0.487 for the same scenarios. These results indicate that the probability of GPP loss under the MCDH scenario was higher than under either the MH or MD scenario alone in May and July. However, this pattern was reversed in other months. As shown in Figure 5a–c, the probability of GPP loss in rubber plantations increased as the intensity of heatwaves increased in April, May, June, August, and October, while it decreased in other months. Similarly, droughts led to an increase in the probability of GPP loss in April, May, and November, while it decreased from June to October. Overall, the median probability of GPP loss under the severe heatwave (SH) scenario reached its highest value (0.719) in April among all SH scenarios from April to November. Similarly, the severe drought (SD) scenario showed its peak (0.638) in April, while the SCDH scenario peaked in May (0.612), when compared to their respective scenarios over the same period.

4. Discussion

4.1. The Applicability of the CDHI

The frequent occurrence of CDHEs has severely impacted ecosystems and human societies, attracting widespread attention from scholars worldwide [62]. In the context of global climate change, China, especially its tropical regions, faces an increasingly severe threat from CDHEs, with both the frequency and intensity of these events significantly increasing in recent years [63]. In order to effectively capture the temporal characteristics of CDHEs experienced by the rubber plantations on Hainan Island, we constructed a CDHI for these plantations. As heatwaves are weather disasters occurring on a relatively short time scale [64], this study selected STI-1 as the heatwave indicator for CDHEs. Among the four drought indices, SPEI-3 showed a relatively strong negative correlation with STI-1, proving to be the most suitable for monitoring drought conditions in the rubber plantations on Hainan Island. This indicates that evapotranspiration is the main cause of drought in this region, consistent with the findings of [65,66]. Studies have shown that SPEI-3 can capture short-term changes in water balance, which aligns with the rapid response of vegetation to soil moisture changes, thus significantly affecting soil humidity and vegetation growth [67]. Therefore, this study selected SPEI-3 as the drought indicator for CDHEs. Although SPEI-3 and STI-1 exhibited a statistically significant negative correlation (p < 0.05) across rubber plantation areas, the overall correlation coefficient remained relatively low. This reflects fundamental differences in their construction logic and underlying stress mechanisms. Specifically, the two indices represent distinct environmental stress pathways: SPEI-3 characterizes drought stress, while STI-1 captures heat stress. As a result, they differ in both temporal scale and variable composition. Moreover, compound drought and heat events are inherently nonlinear in nature, and drought and heatwaves do not necessarily occur simultaneously. Therefore, a strong statistical correlation between the two indices should not be expected. Similar findings of “significant yet limited correlation” have also been reported in previous studies [68].
According to the temporal trend of the constructed CDHI, from January 2001 to December 2020, the CDHI decreased at a rate of 0.0004 per month (Figure 3), indicating a gradual increase in the severity of CDHEs experienced by the rubber plantations on Hainan Island. This trend is consistent with existing research findings that show a significant increase in the frequency and intensity of CDHEs in China’s tropical regions [69]. Furthermore, the constructed CDHI effectively captured severe CDHEs in Hainan’s rubber plantations in 2001, 2003–2005, 2010, 2012, 2015–2016, and 2020, which largely aligns with the historical drought and heatwave events recorded in the “Yearbook of Meteorological Disasters in China” for Hainan Island. This indicates that the CDHI has strong applicability for Hainan’s rubber plantations.

4.2. Comparison of the Probability of GPP Loss Under Different Scenarios

Heatwaves, droughts, and CDHEs all lead to GPP losses in rubber plantations, but the probability of loss varies due to differences in monthly temperature and hydrological characteristics. As shown in Figure 5, under compound drought and heatwave scenarios, the probability of GPP loss in rubber plantations is not always higher than in single drought or heatwave scenarios and is sometimes even lower than both.
In May and July, the probability of GPP loss in rubber plantations under compound drought and heatwave scenarios is higher than in single drought or heatwave scenarios. As shown in Figure S3, May marks the beginning of the rainy season on Hainan Island. Rainfall increases to 164 mm, and temperatures reach up to 36.1 °C. Although rainfall increases in May, the newly grown leaves of young rubber trees struggle to offset the heat stress from heatwaves. At the same time, there is not enough shade cover for the soil, leading to intense soil evaporation. This situation is similar to the phenomenon observed under meteorological drought conditions, where high temperatures and increased solar radiation can lead to reduced water availability for vegetation [25]. In June, rubber tree leaves are almost fully open, but their protective organs are not fully formed. High temperatures increase leaf water loss, making June more sensitive to heatwaves. August to October is the rainy season, with high rainfall in rubber plantations. Despite high temperatures, plenty of rain greatly reduces the negative effects of heatwaves. Studies showed that atmospheric dryness usually slows down photosynthesis, lowering GPP. However, when the soil has enough water, atmospheric dryness can help photosynthesis and increase GPP [70].
In July, rainfall significantly increases to 264 mm. However, continuous high temperatures cause rapid water evaporation. Rubber plantations still face significant water shortages and heatwave stress during the hottest parts of the day. The dual pressure of high temperatures and temporarily insufficient rainfall results in a high probability of GPP loss. Additionally, during the rainy season, rubber plantations act as “water pumps”. They absorb large amounts of water from the soil and release it into the air through their leaves [34,71].
From August to October, despite heatwaves increasing atmospheric dryness, abundant rainfall and soil moisture still contribute to increased GPP. April and November are part of the dry season. In April, rubber trees have not finished growing their leaves, while in November, they are losing their leaves. However, the rainfall during these months is still more than what rubber trees need. So, even though heatwaves increase the chance of GPP loss in rubber trees, there is enough water to help reduce this loss. This phenomenon is similar to research findings in energy-limited ecosystems such as tropical rainforests, where GPP may still increase even as soil moisture decreases [72,73,74].
Spatially, as shown in Figure S4, regardless of the month or compound drought-heat scenario, the probability of GPP loss in rubber plantations in northwestern Hainan Island is always higher than in other regions. This is because the central mountainous area, affected by the terrain uplift effect, blocks the humid sea breeze from the southeast, resulting in less precipitation in the northwest, making this area more prone to drought. Less cloud cover and precipitation mean more direct sunlight and reduced evaporative cooling, further leading to heatwaves [75].

4.3. The Limitations of This Study

This study established a GPP loss probability assessment model under different heatwave, drought, and compound drought and heatwave scenarios. The model is based on the construction of a CDHI for rubber plantations on Hainan Island, using a two-dimensional Copula function. It analyzes the response of rubber plantations to various events from a statistical perspective. However, this study still has some limitations. Firstly, we only used five common Copula functions to construct the CDHI and conditional probability models. Although these Copula functions provide flexible methods for describing dependencies between variables, their assumptions and applicability are limited, especially in dealing with tail risks and complex multivariate dependency structures. Therefore, future research should consider more Copula functions to construct a CDHI and conditional probability models. Secondly, the GPP data used in this study come from the MODIS product from NASA, MOD17A2H. Although these data are widely used in ecological and climate research, the MODIS GPP algorithm has structural errors, such as the inability to accurately identify the contribution of leaf illumination and shading positions to total GPP [76,77]. Therefore, future research should consider using other GPP data products to improve data accuracy.
Additionally, the drought and heatwave indices used in this study are relative indices rather than absolute indices. The heatwave events indicated by the STI are only high temperatures relative to the multi-year average, not high temperatures specific to rubber tree growth. The drought indicated by the SPEI may also not cause water stress for rubber tree growth, meaning that meteorological heatwaves and droughts may not directly lead to ecological losses in rubber trees. This point can be seen from the inverse relationship between the probability of GPP loss and the intensity of CDHEs during the rainy season (June-October) in Figure 4. During the rainy season, excessive water resources exceed the ecological water demand for rubber trees, and the dry periods identified by the SPEI may instead promote photosynthetic production in rubber plantations due to more suitable moisture conditions. Similarly, even the high temperatures identified by the STI may be below the optimal temperature for rubber trees. Therefore, future research should focus on specific species and conduct quantitative studies on the impact of CDHEs based on ecological amplitude.

5. Conclusions

In this study, we used the Copula functions to construct a CDHI for rubber plantations on Hainan Island and assessed the probability of GPP loss under compound drought and heatwave scenarios. The results showed that the negative correlation between SPEI-3 and STI-1 was the strongest. The constructed CDHI accurately identified severe CDHEs in rubber plantations on Hainan Island in 2001, 2003–2005, 2010, 2015–2016, and 2020. Temporally, in April and May, as CDHEs intensified, the probability of GPP loss in rubber plantations increased significantly, while the opposite was true from June to November. Spatially, the probability of GPP loss in rubber plantations in northwestern Hainan Island was significantly higher than in other regions. These results provide a scientific basis for assessing the adaptation mechanisms of tropical forests under climate change.

Supplementary Materials

The following supporting information can be downloaded at: https://www.mdpi.com/article/10.3390/f16071146/s1, Figure S1: Spatial distribution of the significance of the correlation between SPEI-3 and STI-1 in rubber plantations on Hainan Island: (a) Pearson correlation; (b) Spearman correlation; Figure S2: The occurrence probability percentage of CDHEs of different intensities in different months. No: No compound drought and heatwave. MCDH: Mild compound drought and heatwave. ModCDH: Moderate compound drought and heatwave. SCDH: Severe compound drought and heatwave. ECDH: Extreme compound drought and heatwave; Figure S3: The variation in precipitation and maximum temperature from April to November in the rubber plantations of Hainan Island; Figure S4: Probability of GPP loss in rubber plantations from April to November under mild, moderate, severe, and extreme compound drought and heatwave scenarios.

Author Contributions

Conceptualization, Q.B. and Z.S.; methodology, Q.B.; software, Q.B.; validation, Q.B. and Z.W.; formal analysis, Q.B.; data curation, Q.B. and Z.S.; writing—original draft preparation, Q.B.; writing—review and editing, Z.S.; visualization, Q.B.; supervision, Z.S.; project administration, Z.S.; funding acquisition, Z.S. All authors have read and agreed to the published version of the manuscript.

Funding

This study was funded by the National Key Research and Development Program of China (Grant No. 2021YFD2200404), the Hainan Province Science and Technology Innovation Talent Platform Project (Grant No. NHXXRCXM202303), the National Natural Science Foundation of China (Grant No. 32160320), Supported by Hainan Province Science and Technology Special Fund (Grant No. ZDYF2024SHFZ078) and the Sanya Science and Technology Special Fund (2022KJCX04).

Institutional Review Board Statement

Not applicable.

Informed Consent Statement

Not applicable.

Data Availability Statement

The dataset of natural rubber plantation distribution changes on Hainan Island was acquired from China Scientific Data (http://csdata.org/ (accessed on 5 May 2025)), the environmental data are available from the NESSDC (http://www.geodata.cn (accessed on 5 May 2025)), and the GPP data were obtained from NASA (https://lpdaac.usgs.gov (accessed on 5 May 2025)).

Acknowledgments

The authors would like to thank China Scientific Data, the National Earth System Science Data Center, and the National Aeronautics and Space Administration for providing valuable data. We also express our gratitude to the respected editor and anonymous reviewers for their valuable comments and suggestions, which will further improve the quality of this study.

Conflicts of Interest

The authors declare no conflicts of interest.

Abbreviations

The following abbreviations are used in this manuscript:
CDHEsCompound Drought and Heatwave Events
CDHICompound Drought and Heatwave Index
GPPGross Primary Productivity
SAGPPStandardized Anomaly of GPP
STIStandardized Temperature Index
SPEIStandardized Precipitation Evapotranspiration Index
SPIStandardized Precipitation Index
SRHIStandardized Relative Humidity Index
SSMIStandardized Soil Moisture Index
TmaxMaximum Temperature
PrePrecipitation
PETPotential Evapotranspiration
RHRelative Humidity
SMSoil Moisture
MHMild Heatwave
ModHModerate Heatwave
SHSevere Heatwave
MDMild Drought
ModDModerate Drought
SDSevere Drought
MCDHMild Compound Drought and Heatwave
ModCDHModerate Compound Drought and Heatwave
SCDHSevere Compound Drought and Heatwave
ECDHExtreme Compound Drought and Heatwave

References

  1. Hao, Z.; Hao, F.; Xia, Y.; Feng, S.; Sun, C.; Zhang, X.; Fu, Y.; Hao, Y.; Zhang, Y.; Meng, Y. Compound droughts and hot extremes: Characteristics, drivers, changes, and impacts. Earth-Sci. Rev. 2022, 235, 104241. [Google Scholar] [CrossRef]
  2. Mukherjee, S.; Mishra, A.K. Increase in compound drought and heatwaves in a warming world. Geophys. Res. Lett. 2021, 48, e2020GL090617. [Google Scholar] [CrossRef]
  3. Yin, J.; Slater, L. Understanding heatwave-drought compound hazards and impacts on socio-ecosystems. Innov. Geosci. 2023, 1, 100042. [Google Scholar] [CrossRef]
  4. Su, B.; Huang, J.; Fischer, T.; Wang, Y.; Kundzewicz, Z.W.; Zhai, J.; Sun, H.; Wang, A.; Zeng, X.; Wang, G.; et al. Drought losses in China might double between the 1.5 °C and 2.0 °C warming. Proc. Natl. Acad. Sci. USA 2018, 115, 10600–10605. [Google Scholar] [CrossRef]
  5. Callahan, C.W.; Mankin, J.S. Globally unequal effect of extreme heat on economic growth. Sci. Adv. 2022, 8, eadd3726. [Google Scholar] [CrossRef]
  6. Alizadeh, M.R.; Adamowski, J.; Nikoo, M.R.; AghaKouchak, A.; Dennison, P.; Sadegh, M. A century of observations reveals increasing likelihood of continental-scale compound dry-hot extremes. Sci. Adv. 2020, 6, eaaz4571. [Google Scholar] [CrossRef]
  7. Ionita, M.; Nagavciuc, V.; Kumar, R.; Rakovec, O. On the curious case of the recent decade, mid-spring precipitation deficit in central Europe. Npj Clim. Atmos. Sci. 2020, 3, 49. [Google Scholar] [CrossRef]
  8. Jimenez, J.C.; Barichivich, J.; Mattar, C.; Takahashi, K.; Santamaría-Artigas, A.; Sobrino, J.A.; Malhi, Y. Spatio-temporal patterns of thermal anomalies and drought over tropical forests driven by recent extreme climatic anomalies. Philos. Trans. R. Soc. B Biol. Sci. 2018, 373, 20170300. [Google Scholar] [CrossRef]
  9. Toomey, M.; Roberts, D.A.; Still, C.; Goulden, M.L.; McFadden, J.P. Remotely sensed heat anomalies linked with Amazonian forest biomass declines. Geophys. Res. Lett. 2011, 38, L19704. [Google Scholar] [CrossRef]
  10. Gatti, L.V.; Gloor, M.; Miller, J.B.; Doughty, C.E.; Malhi, Y.; Domingues, L.G.; Basso, L.S.; Martinewski, A.; Correia, C.S.C.; Borges, V.F.; et al. Drought sensitivity of Amazonian carbon balance revealed by atmospheric measurements. Nature 2014, 506, 76–80. [Google Scholar] [CrossRef]
  11. Field, C.B. (Ed.) Managing the Risks of Extreme Events and Disasters to Advance Climate Change Adaptation: Special Report of the Intergovernmental Panel on Climate Change; Cambridge University Press: Cambridge, UK, 2012. [Google Scholar]
  12. Tripathy, K.P.; Mukherjee, S.; Mishra, A.K.; Mann, M.E.; Williams, A.P. Climate change will accelerate the high-end risk of compound drought and heatwave events. Proc. Natl. Acad. Sci. USA 2023, 120, e2219825120. [Google Scholar] [CrossRef] [PubMed]
  13. Zhao, L.; Li, X.; Zhang, Z.; Yuan, M.; Sun, S.; Qu, S.; Hou, M.; Lu, D.; Zhou, Y.; Lin, A. Developing a novel framework to re-examine half a century of compound drought and heatwave events in mainland China. Sci. Total Environ. 2023, 874, 162366. [Google Scholar] [CrossRef]
  14. Wang, C.; Li, Z.; Chen, Y.; Ouyang, L.; Li, Y.; Sun, F.; Liu, Y.; Zhu, J. Drought-heatwave compound events are stronger in drylands. Weather Clim. Extrem. 2023, 42, 100632. [Google Scholar] [CrossRef]
  15. Bevacqua, E.; Zappa, G.; Lehner, F.; Zscheischler, J. Precipitation trends determine future occurrences of compound hot–dry events. Nat. Clim. Change 2022, 12, 350–355. [Google Scholar] [CrossRef]
  16. Chiang, F.; Greve, P.; Mazdiyasni, O.; Wada, Y.; AghaKouchak, A. Intensified likelihood of concurrent warm and dry months attributed to anthropogenic climate change. Water Resour. Res. 2022, 58, e2021WR030411. [Google Scholar] [CrossRef]
  17. Ghanbari, M.; Arabi, M.; Georgescu, M.; Broadbent, A.M. The role of climate change and urban development on compound dry-hot extremes across US cities. Nat. Commun. 2023, 14, 3509. [Google Scholar] [CrossRef]
  18. De Luca, P.; Donat, M.G. Projected changes in hot, dry, and compound hot-dry extremes over global land regions. Geophys. Res. Lett. 2023, 50, e2022GL102493. [Google Scholar] [CrossRef]
  19. Zhang, Q.; Yu, X.; Qiu, R.; Liu, Z.; Yang, Z. Evolution, severity, and spatial extent of compound drought and heat events in north China based on copula model. Agric. Water Manag. 2022, 273, 107918. [Google Scholar] [CrossRef]
  20. Kang, Y.; Guo, E.; Wang, Y.; Bao, Y.; Bao, Y.; Mandula, N.; Runa, A.; Gu, X.; Jin, L. Characterisation of compound dry and hot events in Inner Mongolia and their relationship with large-scale circulation patterns. J. Hydrol. 2022, 612, 128296. [Google Scholar] [CrossRef]
  21. Wang, A.; Tao, H.; Ding, G.; Zhang, B.; Huang, J.; Wu, Q. Global cropland exposure to extreme compound drought heatwave events under future climate change. Weather Clim. Extrem. 2023, 40, 100559. [Google Scholar] [CrossRef]
  22. Hao, Y.; Hao, Z.; Fu, Y.; Feng, S.; Zhang, X.; Wu, X.; Hao, F. Probabilistic assessments of the impacts of compound dry and hot events on global vegetation during growing seasons. Environ. Res. Lett. 2021, 16, 074055. [Google Scholar] [CrossRef]
  23. Zhang, G.; Zhang, S.; Wang, H.; Gan, T.Y.; Fang, H.; Su, X.; Song, S.; Feng, K.; Jiang, T.; Huang, J.; et al. Biodiversity and wetting of climate alleviate vegetation vulnerability under compound drought-hot extremes. Geophys. Res. Lett. 2024, 51, e2024GL108396. [Google Scholar] [CrossRef]
  24. Shao, X.; Zhang, Y.; Ma, N.; Zhang, X.; Tian, J.; Xu, Z.; Liu, C. Drought-induced ecosystem resistance and recovery observed at 118 flux tower stations across the globe. Agric. For. Meteorol. 2024, 356, 110170. [Google Scholar] [CrossRef]
  25. Xu, H.; Xiao, J.; Zhang, Z. Heatwave effects on gross primary production of northern mid-latitude ecosystems. Environ. Res. Lett. 2020, 15, 074027. [Google Scholar] [CrossRef]
  26. Liu, L.; Gudmundsson, L.; Hauser, M.; Qin, D.; Li, S.; Seneviratne, S.I. Soil moisture dominates dryness stress on ecosystem production globally. Nat. Commun. 2020, 11, 4892. [Google Scholar] [CrossRef]
  27. Aas, K.; Czado, C.; Frigessi, A.; Bakken, H. Pair-copula constructions of multiple dependence. Insur. Math. Econ. 2009, 44, 182–198. [Google Scholar] [CrossRef]
  28. Haff, I.H.; Aas, K.; Frigessi, A. On the simplified pair-copula construction—Simply useful or too simplistic? J. Multivar. Anal. 2010, 101, 1296–1310. [Google Scholar] [CrossRef]
  29. Zhu, X.; Zhang, S.; Liu, T.; Liu, Y. Impacts of heat and drought on gross primary productivity in China. Remote Sens. 2021, 13, 378. [Google Scholar] [CrossRef]
  30. Tootoonchi, F.; Sadegh, M.; Haerter, J.O.; Räty, O.; Grabs, T.; Teutschbein, C. Copulas for hydroclimatic analysis: A practice-oriented overview. WIREs Water 2022, 9, e1579. [Google Scholar] [CrossRef]
  31. Kang, J.; Yu, M.; Xia, Y.; Sun, S.; Zhou, B. Impacts of compound hot–dry events on vegetation productivity over northern East Asia. Forests 2024, 15, 549. [Google Scholar] [CrossRef]
  32. Zhao, D.; Zhang, Z.; Zhang, Y. Soil moisture dominates the forest productivity decline during the 2022 China compound drought-heatwave event. Geophys. Res. Lett. 2023, 50, e2023GL104539. [Google Scholar] [CrossRef]
  33. Li, J.; Bevacqua, E.; Chen, C.; Wang, Z.; Chen, X.; Myneni, R.B.; Wu, X.; Xu, C.-Y.; Zhang, Z.; Zscheischler, J. Regional asymmetry in the response of global vegetation growth to springtime compound climate events. Commun. Earth Environ. 2022, 3, 123. [Google Scholar] [CrossRef]
  34. Tan, Z.; Zhang, Y.; Song, Q.; Liu, W.; Deng, X.; Tang, J.; Liang, N. Rubber plantations act as water pumps in tropical China. Geophys. Res. Lett. 2011, 38, L24406. [Google Scholar] [CrossRef]
  35. Huang, K.; Wu, J.; Fu, Z.; Du, J. Comparative analysis of drought indices in the tropical zones of China. Sci. Total Environ. 2024, 947, 174530. [Google Scholar] [CrossRef]
  36. Ren, Y.; Liu, J.; Zhang, T.; Shalamzari, M.J.; Arshad, A.; Liu, T.; Wang, T. Identification and analysis of heatwave events considering temporal continuity and spatial dynamics. Remote Sens. 2023, 15, 1369. [Google Scholar] [CrossRef]
  37. An, Y.; Wu, Z.; Wang, Y.; Zhang, R.; Wu, L.; Liu, W.; Sun, Z. Spatiotemporal dynamics and underlying mechanisms of ecosystem respiration in rubber plantations: A case study in Hainan Island. J. Rubber Res. 2024, 27, 283–298. [Google Scholar] [CrossRef]
  38. Cui, W.; Xiong, Q.; Zheng, Y.; Zhao, J.; Nie, T.; Wu, L.; Sun, Z. A study on the vulnerability of the gross primary production of rubber plantations to regional short-term flash drought over Hainan Island. Forests 2022, 13, 893. [Google Scholar] [CrossRef]
  39. Kong, J.; An, Y.; Shi, X.; Sun, Z.; Wu, L.; Cui, W. Meteorological-data-driven rubber tree powdery mildew model and its application on spatiotemporal patterns: A case study of Hainan Island. Sustainability 2023, 15, 12119. [Google Scholar] [CrossRef]
  40. Bao, Q.; Zhang, R.; Wang, Y.; Cui, W.; Zhao, J.; Wu, L.; Sun, Z. A dataset of distribution changes of natural rubber plantations in Hainan Island from 2000 to 2020. China Sci. Data 2023, 8, 364–375. (In Chinese) [Google Scholar] [CrossRef]
  41. He, Q.; Wang, M.; Liu, K.; Li, K.; Jiang, Z. GPRChinaTemp1km: A high-resolution monthly air temperature data set for China (1951–2020) based on machine learning. Earth Syst. Sci. Data 2022, 14, 3273–3292. [Google Scholar] [CrossRef]
  42. Peng, S.; Ding, Y.; Liu, W.; Li, Z. 1 km monthly temperature and precipitation dataset for China from 1901 to 2017. Earth Syst. Sci. Data 2019, 11, 1931–1946. [Google Scholar] [CrossRef]
  43. Peng, S.; Ding, Y.; Wen, Z.; Chen, Y.; Cao, Y.; Ren, J. Spatiotemporal change and trend analysis of potential evapotranspiration over the Loess Plateau of China during 2011–2100. Agric. For. Meteorol. 2017, 233, 183–194. [Google Scholar] [CrossRef]
  44. Hargreaves, G.H.; Samani, Z.A. Reference crop evapotranspiration from temperature. Appl. Eng. Agric. 1985, 1, 96–99. [Google Scholar] [CrossRef]
  45. Jing, W.L.; Feng, M.; Yang, Y.P. A statistical downscaling approach of NCEP/NCAR reanalysis temperature data. J. Geo-Inf. Sci. 2013, 15, 819–828. (In Chinese) [Google Scholar] [CrossRef]
  46. Jing, W.; Yang, Y.; Yue, X.; Zhao, X. A spatial downscaling algorithm for satellite-based precipitation over the Tibetan Plateau based on NDVI, DEM, and land surface temperature. Remote Sens. 2016, 8, 655. [Google Scholar] [CrossRef]
  47. Li, Q.; Shi, G.; Shangguan, W.; Nourani, V.; Li, J.; Li, L.; Dai, Y. A 1 km daily soil moisture dataset over China using in situ measurement and machine learning. Earth Syst. Sci. Data 2022, 14, 5267–5286. [Google Scholar] [CrossRef]
  48. Running, S.W.; Zhao, M. Daily GPP and annual NPP (MOD17A2/A3) products NASA Earth Observing System MODIS land algorithm. MOD17 User’s Guide 2015, 2015, 1–28. [Google Scholar]
  49. Li, Y.; Zhang, Y.; Lv, J. Interannual variations in GPP in forest ecosystems in Southwest China and regional differences in the climatic contributions. Ecol. Inform. 2022, 69, 101591. [Google Scholar] [CrossRef]
  50. Wang, Y.; Yang, J.; Chen, Y.; Su, Z.; Li, B.; Guo, H.; De Maeyer, P. Monitoring and predicting drought based on multiple indicators in an arid area, China. Remote Sens. 2020, 12, 2298. [Google Scholar] [CrossRef]
  51. Gringorten, I.I. A Plotting Rule for Extreme Probability Paper. J. Geophys. Res. 1963, 68, 813–814. [Google Scholar] [CrossRef]
  52. Vicente-Serrano, S.M.; Beguería, S.; López-Moreno, J.I. A multiscalar drought index sensitive to global warming: The standardized precipitation evapotranspiration index. J. Clim. 2010, 23, 1696–1718. [Google Scholar] [CrossRef]
  53. McKee, T.B.; Doesken, N.J.; Kleist, J. The relationship of drought frequency and duration to time scales. In Proceedings of the 8th Conference on Applied Climatology, Anaheim, CA, USA, 17–22 January 1993; pp. 179–183. [Google Scholar]
  54. Xu, Y.; Wang, L.; Ross, K.W.; Liu, C.; Berry, K. Standardized soil moisture index for drought monitoring based on soil moisture active passive observations and 36 years of North American land data assimilation system data: A case study in the southeast United States. Remote Sens. 2018, 10, 301. [Google Scholar] [CrossRef] [PubMed]
  55. Farahmand, A.; AghaKouchak, A.; Teixeira, J. A vantage from space can detect earlier drought onset: An approach using relative humidity. Sci. Rep. 2015, 5, 8553. [Google Scholar] [CrossRef] [PubMed]
  56. Wang, H.; Huang, S.; Fang, W.; Hou, B.; Leng, G.; Huang, Q.; Zhao, J.; Han, Z. Multivariable flood risk and its dynamics considering project reasonable service life in a changing environment. J. Hydrol. 2020, 590, 125524. [Google Scholar] [CrossRef]
  57. Zhang, L.; Singh, V.P. Copulas and Their Applications in Water Resources Engineering; Cambridge University Press: Cambridge, UK, 2019. [Google Scholar]
  58. Cheng, Y.; Zhang, K. Compound Dry–Hot Events on Qinghai–Tibet Plateau and Their Effects on Vegetation. Water Resour. Prot. 2023, 39, 52–58. (In Chinese) [Google Scholar]
  59. Guo, Y.; Huang, S.; Huang, Q.; Wang, H.; Wang, L.; Fang, W. Copulas-based bivariate socioeconomic drought dynamic risk assessment in a changing environment. J. Hydrol. 2019, 575, 1052–1064. [Google Scholar] [CrossRef]
  60. Pearson, K. Mathematical Contributions to the Theory of Evolution. III. Regression, Heredity and Panmixia. Philos. Trans. R. Soc. Lond. A 1896, 187, 253–318. [Google Scholar]
  61. Spearman, C. The Proof and Measurement of Association between Two Things. Am. J. Psychol. 1961, 15, 72–101. [Google Scholar] [CrossRef]
  62. Zscheischler, J.; Westra, S.; Van Den Hurk, B.J.J.M.; Seneviratne, S.I.; Ward, P.J.; Pitman, A.; AghaKouchak, A.; Bresch, D.N.; Leonard, M.; Wahl, T.; et al. Future Climate Risk from Compound Events. Nat. Clim. Change 2018, 8, 469–477. [Google Scholar] [CrossRef]
  63. Fan, X.; Miao, C.; Wu, Y.; Mishra, V.; Chai, Y. Comparative assessment of dry-and humid-heat extremes in a warming climate: Frequency, intensity, and seasonal timing. Weather Clim. Extrem. 2024, 45, 100698. [Google Scholar] [CrossRef]
  64. Deng, Z.; Zhang, Q.; Xu, J. Comparative studies on the harm characteristic of hot-dry wind and high temperature heat waves. Adv. Earth Sci. 2009, 24, 865. (In Chinese) [Google Scholar]
  65. Li, W.; Hou, M.; Chen, H.; Chen, X. Study on drought trend in South China based on standardized precipitation evapotranspiration index. J. Nat. Disasters 2012, 21, 84–90. (In Chinese) [Google Scholar]
  66. Li, W.; Zhang, J.; Liu, S.; Che, X.; Chen, X.; Zou, H. Meteorological characteristics and monitoring index of drought in Hainan Island. J. Trop. Biol. 2022, 13, 324–330. (In Chinese) [Google Scholar]
  67. Wu, M.; Manzoni, S.; Vico, G.; Bastos, A.; de Vries, F.T.; Messori, G. Drought legacy in sub-seasonal vegetation state and sensitivity to climate over the Northern Hemisphere. Geophys. Res. Lett. 2022, 49, e2022GL098700. [Google Scholar] [CrossRef]
  68. Mavromatis, T. Use of Drought Indices in Climate Change Impact Assessment Studies: An Application to Greece. Int. J. Climatol. 2010, 30, 1336–1348. [Google Scholar] [CrossRef]
  69. Wu, X.; Hao, Z.; Zhang, X.; Li, C.; Hao, F. Evaluation of severity changes of compound dry and hot events in China based on a multivariate multi-index approach. J. Hydrol. 2020, 583, 124580. [Google Scholar] [CrossRef]
  70. Fu, Z.; Ciais, P.; Prentice, I.C.; Gentine, P.; Makowski, D.; Bastos, A.; Luo, X.; Green, J.K.; Stoy, P.C.; Yang, H.; et al. Atmospheric dryness reduces photosynthesis along a large range of soil water deficits. Nat. Commun. 2022, 13, 989. [Google Scholar] [CrossRef]
  71. Li, Y.; Shao, X.; Wu, Z.; Sun, Z.; Li, M.; Jiang, L.; Wang, P. Response of land surface temperature to heatwave-induced bio-geophysical changes in tropical forests on Hainan Island from 2010 to 2022. Water 2024, 16, 752. [Google Scholar] [CrossRef]
  72. Walther, S.; Duveiller, G.; Jung, M.; Guanter, L.; Cescatti, A.; Camps-Valls, G. Satellite observations of the contrasting response of trees and grasses to variations in water availability. Geophys. Res. Lett. 2019, 46, 1429–1440. [Google Scholar] [CrossRef]
  73. Gentine, P.; Massmann, A.; Lintner, B.R.; Alemohammad, S.H.; Fu, R.; Green, J.K.; Kennedy, D.; Vilà-Guerau de Arellano, J. Land–atmosphere interactions in the tropics—A review. Hydrol. Earth Syst. Sci. 2019, 23, 4171–4197. [Google Scholar] [CrossRef]
  74. Guan, K.; Pan, M.; Li, H.; Wolf, A.; Wu, J.; Medvigy, D.; Caylor, K.K.; Sheffield, J.; Wood, E.F.; Malhi, Y.; et al. Photosynthetic seasonality of global tropical forests constrained by hydroclimate. Nat. Geosci. 2015, 8, 284–289. [Google Scholar] [CrossRef]
  75. Ye, C.; Zou, Y.; He, Y.; Lin, Y.; Li, D.; Zhu, L. Temporal and spatial distribution characteristics of drought and flood considering the influence of underlying surface in Hainan Island, tropical areas of China. Theor. Appl. Climatol. 2022, 150, 507–520. [Google Scholar] [CrossRef]
  76. Wang, L.; Zhu, H.; Lin, A.; Zou, L.; Qin, W.; Du, Q. Evaluation of the latest MODIS GPP products across multiple biomes using global eddy covariance flux data. Remote Sens. 2017, 9, 418. [Google Scholar] [CrossRef]
  77. Zhang, F.; Chen, J.M.; Chen, J.; Gough, C.M.; Martin, T.A.; Dragoni, D. Evaluating spatial and temporal patterns of MODIS GPP over the conterminous US against flux measurements and a process model. Remote Sens. Environ. 2012, 124, 717–729. [Google Scholar] [CrossRef]
Figure 1. Study area: (a) geographical location of Hainan Island; (b) elevation; (c) distribution of rubber plantations.
Forests 16 01146 g001
Figure 2. (a) Pearson correlation between different drought indices and STI-1; (b) Spearman correlation between different drought indices and STI-1.
Forests 16 01146 g002
Figure 3. Time series of the monthly CDHI. The shaded areas in the background represent real drought and heatwave events. The dashed line represents the CDHE threshold (CDHI = −0.5).
Forests 16 01146 g003
Figure 4. The centroid movement curve of the probability of GPP loss in rubber plantations on Hainan Island from April to November under different compound drought and heatwave scenarios. MCDH: mild compound drought and heatwave; ModCDH: moderate compound drought and heatwave; SCDH: severe compound drought and heatwave; ECDH: extreme compound drought and heatwave.
Forests 16 01146 g004
Figure 5. Probability of GPP loss in rubber plantations under (a) mild, (b) moderate, and (c) severe heatwave, drought, and compound drought and heatwave scenarios. Statistical differences among scenarios were assessed using the Mann–Whitney U test with Bonferroni correction. Asterisks indicate significance levels: * p < 0.05, ** p < 0.01, and *** p < 0.001; ns indicates no significant difference.
Forests 16 01146 g005
Table 1. Expressions for 5 Copula functions.
CopulaDisplay FormulaParameter α
Gumbel C ( u , v ) = exp ( ln u ) a + ( ln v ) a 1 a [1,∞]
Clayton C ( u , v ) = max u a + v a 1 1 a , 0 (−1, 0)∪(0, ∞)
Frank C ( u , v ) = 1 a ln 1 + ( e a u 1 ) ( e a v 1 ) e a 1 (−∞, 0)∪(0, ∞)
Gaussian C ( u , v , a ) = Φ 1 ( u ) Φ 1 ( v ) 1 2 π 1 a 2 exp [ s 2 2 a s t + t 2 2 ( 1 a 2 ) ] d s d t (−1, 1)
T C ( u , v , a ) = t k 1 t k 1 1 2 π 1 a 2 [ 1 + s 2 2 a s t + t 2 k ( 1 a 2 ) ] k + 2 2 d s d t (−1, 1), k≠0
Note: In all Copula expressions, u and v represent the cumulative distribution function (CDF) values of the two standardized marginal variables, i.e., u = FX(x) and v = FY(y), ranging from 0 to 1. α is the dependence parameter of the Copula, which reflects the strength and structure of the dependence. Φ−1 refers to the inverse of the standard normal CDF. s and t are integration variables used in Gaussian and T-Copulas. k is the degrees of freedom in the T Copula, controlling the heaviness of the tails.
Table 2. Goodness-of-fit evaluation results for SPEI-3 and STI-1.
CopulaSquared Euclidean Distance (d)
Gumbel0.1521
Clayton0.1521
Frank0.1806
Gaussian0.1422
T0.1754
Disclaimer/Publisher’s Note: The statements, opinions and data contained in all publications are solely those of the individual author(s) and contributor(s) and not of MDPI and/or the editor(s). MDPI and/or the editor(s) disclaim responsibility for any injury to people or property resulting from any ideas, methods, instructions or products referred to in the content.

