Article

The Effects of Tree Species on Soil Organic Carbon Mineralization in Reservoir Water-Level Drawdown Zones

College of Life Sciences, Jiangxi Normal University, Nanchang 330022, China
*
Author to whom correspondence should be addressed.
Forests 2025, 16(7), 1145; https://doi.org/10.3390/f16071145
Submission received: 11 April 2025 / Revised: 27 June 2025 / Accepted: 30 June 2025 / Published: 11 July 2025

Abstract

Soil organic carbon (SOC) mineralization is the conversion of SOC to inorganic forms of carbon (C) by microbial decomposition and conversion. It plays an important role in global C cycling. Currently, most of the studies investigating the effects of different tree species on SOC mineralization focus on forest ecosystems, and few have focused on reservoir water-level drawdown zones. In this study, we used an indoor incubation method to investigate SOC mineralization in the plantation soils of Glyptostrobus pensilis, Taxodium Zhongshanshan, Taxodium distichum and CK (unplanted plantation) in the reservoir water-level drawdown zones. We aimed to explore the effects of different tree species on the process of SOC mineralization in the reservoir water-level drawdown zones by considering both the biological and chemical processes of the soil. The results showed that the rates of SOC mineralization in the G. pensilis and T. Zhongshanshan plantations were 47% and 37%, respectively, higher than those in CK (p < 0.05), whereas the rate of SOC mineralization in T. distichum soils did not differ from that in CK. The structural equation model’s results showed microbial biomass carbon (MBC) is a key driver of SOC mineralization, while SOC and dissolved organic carbon (DOC) concentrations are also important factors that affect SOC mineralization and follow MBC. Compared to soil biochemical properties, the bacterial community composition has relatively little effect on SOC mineralization. Planted forests can, to a degree, change the biochemical properties of the soil in the reservoir water-level drawdown zones, effectively improving soil pH, and significantly increasing the amount of potential soil C mineralization, the content of SOC and the diversity of the soil bacteria (p < 0.05).

1. Introduction

Soil is the second largest C pool on the earth, holding about 2000 Pg C in the form of SOC and playing an important role in the global C cycle [1]. SOC is a key component and the fertility foundation of soil, constituting a huge organic carbon pool and playing an important regulatory role in climate change. Soil organic carbon mineralization refers to the conversion of SOC into a stable form of inorganic C after microbial decomposition and conversion. Its product is mainly released back into the atmosphere in the form of CO2, and global warming will accelerate this process [2]. Afforestation or vegetation restoration can not only restore the function of natural ecosystems and soil characteristics but also affect the dynamics of underground microbial communities, which represent one of the effective measures to mitigate global warming [3,4]. Soil organic carbon mineralization is usually employed to reflect the stability and turnover rate of SOC [5]. All of the processes of SOC mineralization, mineralization rate, and SOC storage are related to tree species’ characteristics [6,7]. The C inputs of plants are the primary source of soil organic matter (SOM). Firstly, via the difference in litter input types, different tree species mainly affect the chemical composition of SOM, resulting in the differences in SOC mineralization [8,9]. Secondly, through the differences in the chemical composition of root exudates, tree species can also affect the available C in the soil, further influencing the composition of OC and altering the status of SOC mineralization [10,11].
Reservoirs, like general inland aquatic systems, are sources of global greenhouse gases. However, reservoirs possess the ability to gather organic matter from river basins and lakes, making their C burial rates higher than those of natural lakes and making them an important C sink [12,13]. The area around a reservoir that experiences a temporary dry period due to the seasonal fluctuation in the water level is specifically designated as the reservoir water-level drawdown zone. In fact, the CO2 emissions from the reservoir water-level drawdown zone are substantially higher than those from the reservoir water surfaces, thereby accounting for the lion’s share of the annual CO2 emissions of reservoirs and even offsetting C burial within the sediments [14]. Nevertheless, so far, the calculations regarding the greenhouse gas emissions of reservoirs have been solely based on the area of the reservoir water surfaces, with the role of the water-level drawdown zones remaining unaccounted for in both the reservoir C budget and the global-scale C balance inventory.
Furthermore, studies on the effects of different tree species on SOC mineralization were mostly concentrated in forest ecosystems [15,16]. There is little research on the impact of different forest types on SOC mineralization in the reservoir drawdown zone [12,14]. Therefore, understanding the impact of this special high-capacity C pool on C mineralization under the influence of different tree plantation species is an indispensable part of accurately assessing the global SOC dynamics. On this basis, in the present research, three flood-tolerant tree species, Glyptostrobus pensilis, Taxodium Zhongshanshan and Taxodium distichum, were selected for cultivation to explore the specific effects of different tree species on SOC mineralization in the reservoir water-level drawdown zones, in an attempt to reveal the key driving factors affecting SOC mineralization and provide a scientific basis for afforestation in the reservoir water-level drawdown zones to mitigate CO2 emissions.

2. Materials and Methods
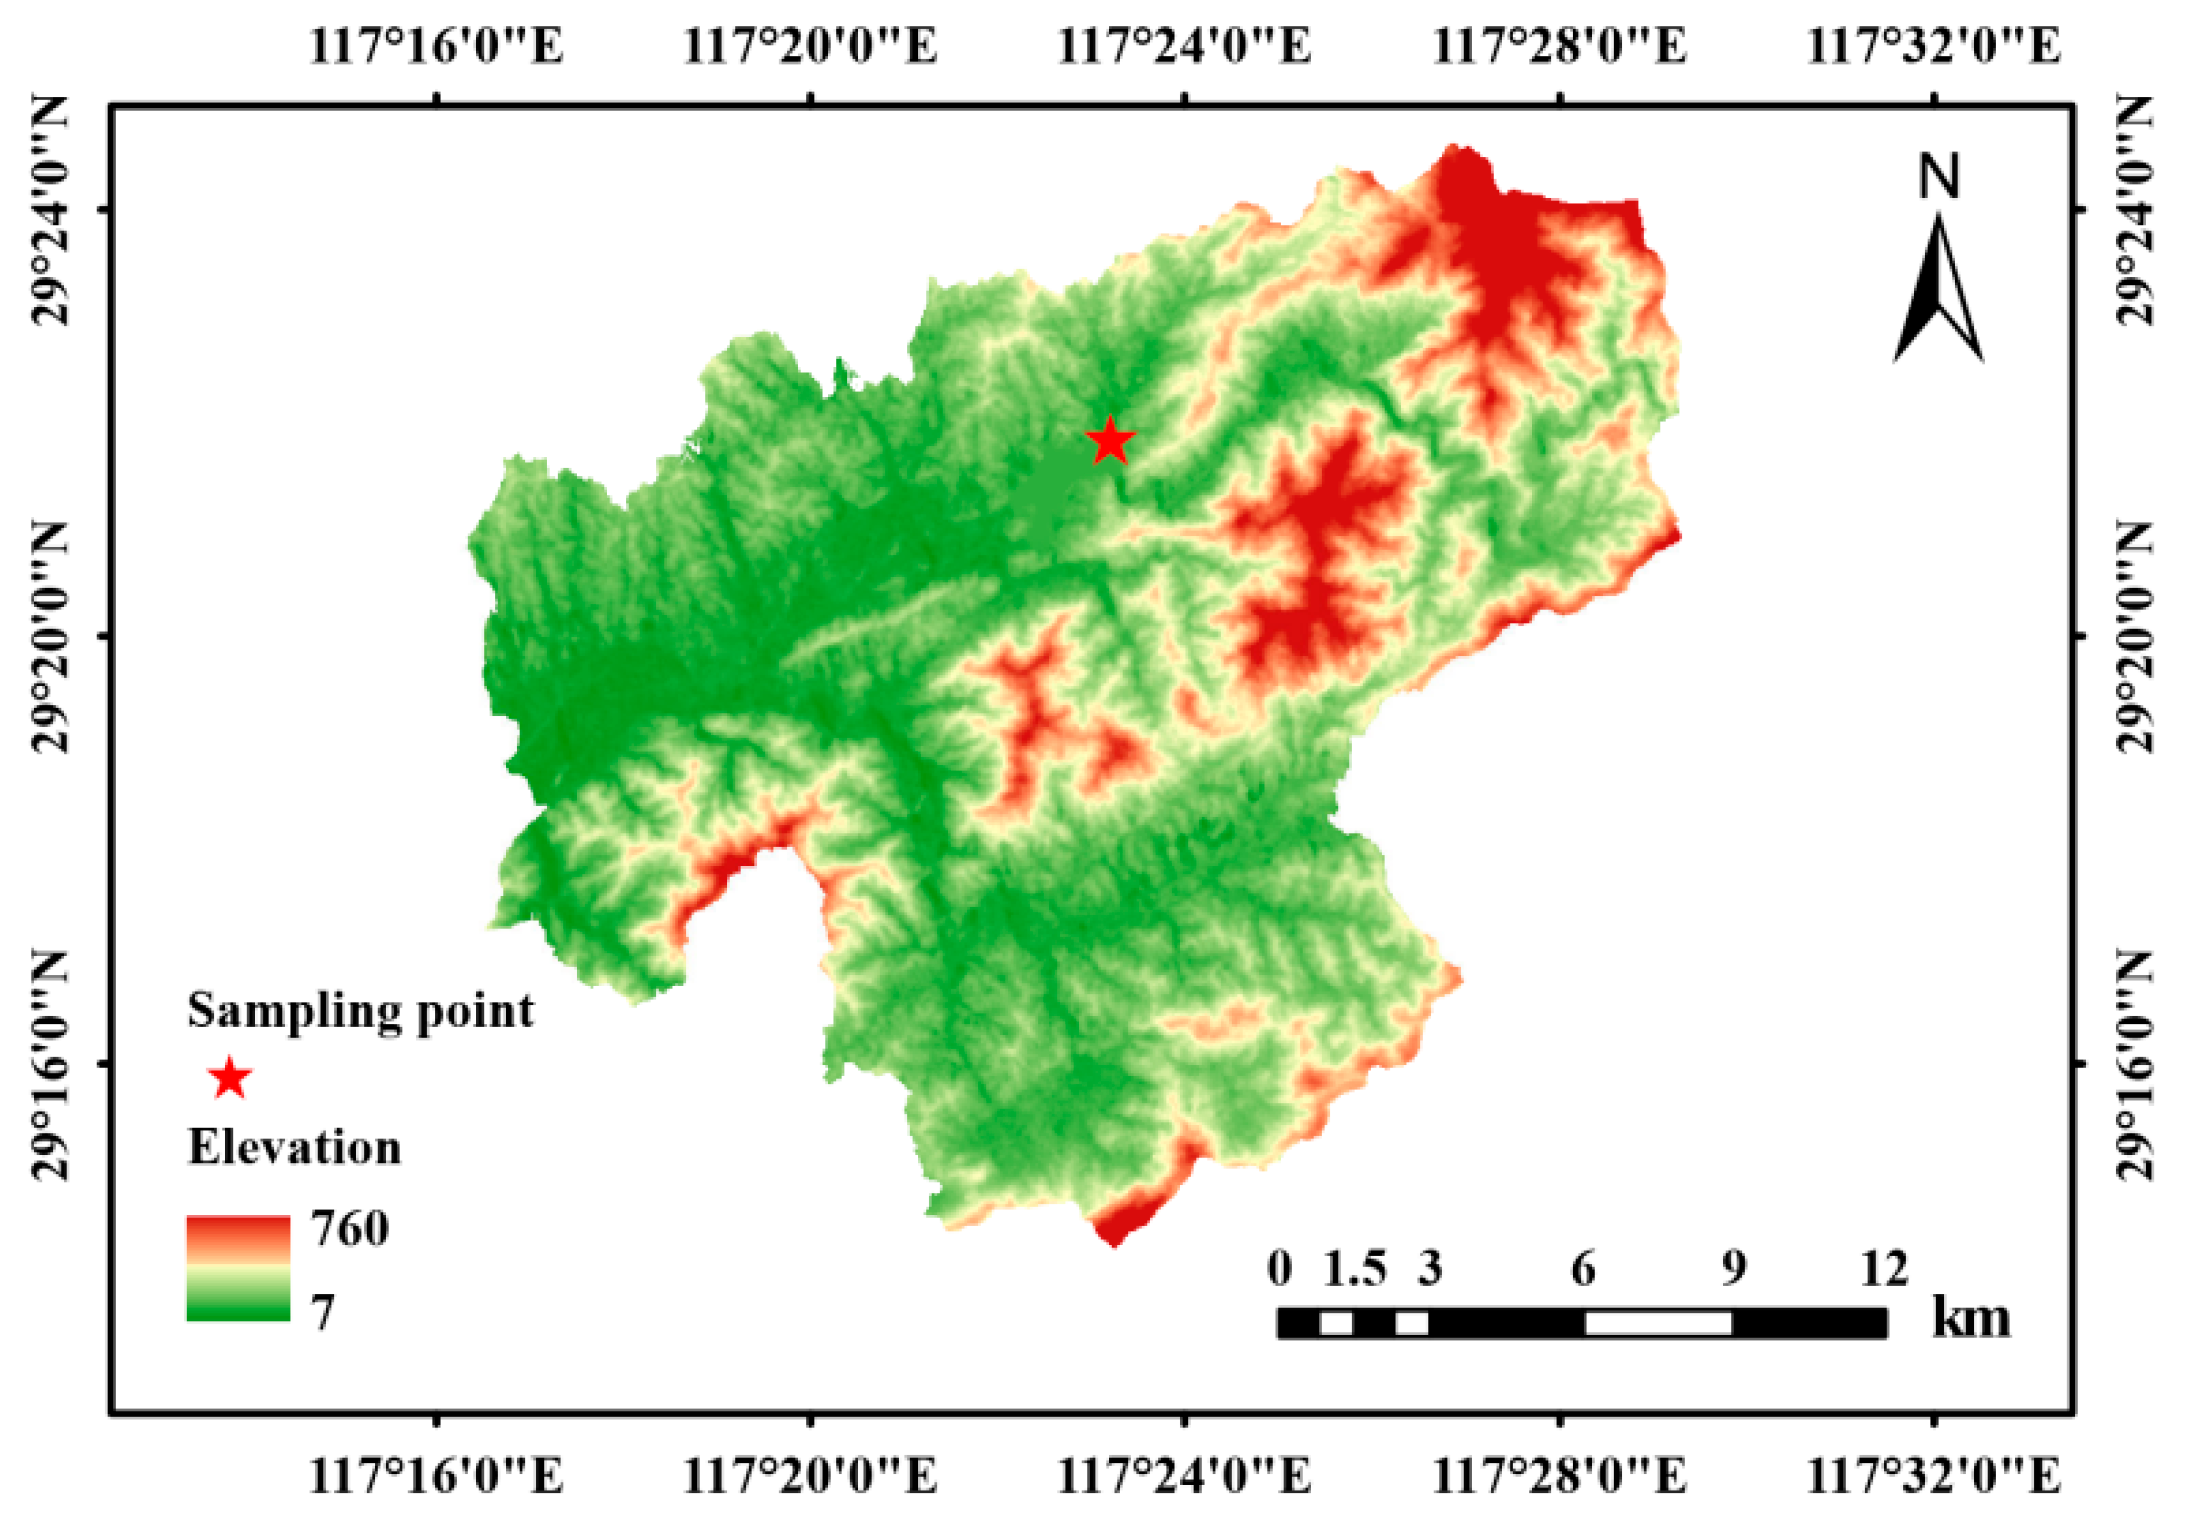
2.1. Study Site

The Yutian Reservoir’s water-level drawdown zone is located in Fuliang County, Jingdezhen City, Jiangxi Province (29°36′ N, 117°38′ E), in the upper reaches of the Changjiang River, which is part of the Poyang Lake system (Figure 1). It serves as a restoration and reconstruction zone covering an area of 0.183 square kilometers. Climatically, it has a subtropical monsoon climate, characterized by hot summers and cold winters, with a multi-year average annual temperature of 17 °C, an annual sunshine duration of up to 2010. 8 h, and an average annual rainfall of 1814 mm. The rainy season occurs from April to June, with a relatively high average evaporation rate. The soils are primarily composed of argillaceous rock giving yellow soil and yellow-red soil, which are acidic. Natural vegetation is mainly composed of herbaceous plants, such as Lobelia chinensis, Lysimachia candida, Mazus pumilus, Persicaria criopolitana, Sedum bulbiferum, and Galium spurium.

2.2. Experimental Design

In December 2020, in the area of the Yutian Reservoir’s water-level drawdown zone, with basically the same soil texture, fertility conditions, slope gradient, and altitude, plantations of G. pensilis, T. Zhongshanshan, and T. distichum were planted. The height of each tree was about 4 m, the DBH (diameter breast height) was about 5 cm, and there were about 30 plants per 100 square meters. The periodic flooding-exposure process in the study area was in a flooded state from April to August and in an exposed state from September to March of the next year. Having undergone multiple flooding-exposure processes, all the native arbor and shrub species in the study area had died out. Randomly, three standard quadrats with an area of 10 m by 10 m were set up in different forestlands. Meanwhile, land with only natural herbaceous vegetation but without plantation under the same background was selected as the control plot (CK).

2.3. Sampling

In December 2022, five points were selected in an S-shaped pattern within each quadrat. Subsequently, soil samples were collected from the 0 to 20 cm layer of the soil surface using a soil auger with a diameter of 7.5 cm. Finally, the soil samples from the five collection points were mixed together to form a single sample. After that, the freshly collected single soil samples were passed through a 2 mm sieve to eliminate impurities. One portion of the sieved samples was stored in a refrigerator at 4 °C for subsequent use in indoor cultivation and determination of soil physicochemical and biological activities. The other portion was bagged, placed on dry ice, promptly sent to the laboratory for storage at −80 °C and reserved for microbial analysis purposes.

2.4. Methods

Biochemical indicators: The water-to-soil ratio was set at 2.5:1, the soil pH value was measured using a pH meter. The Walkley–Black method (low-temperature external heat dichromate oxidation-spectrophotometric method) was used to quantify soil organic carbon (SOC). The Kjeldahl method was utilized to measure soil total nitrogen (TN). The acid molybdate–antimony spectrophotometric method was employed to assess soil total phosphorus (TP) [17]. The high-temperature catalytic oxidation method was adopted to determine soil dissolved organic carbon and nitrogen (DOC, DON), with the instrument being a SHIMADZU TOC-VCPH/CPN (Kyoto, Japan) analyzer. The flow injection analyzer was applied to determine ammonium nitrogen and nitrate nitrogen (NO3-N, NH4+-N) [18]. The chloroform fumigation method was used to determine soil microbial biomass carbon and nitrogen (MBC, MBN), with the instrument being a SHIMADZU TOC-VCPH/CPN [19,20].
The cultivation method of SOC mineralization [21] is as follows: 30 g of fresh soil was weighed in a 70 mL plastic bottle, and the water content was adjusted to 60% of the field water holding capacity and then placed in a 1 L sealed tank, which would be sent into a constant temperature incubator at 25 °C for 49 days for cultivation. Determination of CO2 emission was made by the lye absorption method: 0.1 mol/L NaOH was added to a 70 mL capped plastic bottle as a CO2 absorption device, and 5 control experiments were carried out (only lye was placed) at the same time. On the 1st, 3rd, 7th, 14th, 21st, 28th, 35th, 42nd, and 49th day of incubation, respectively, the absorption bottle containing 0.1 mol/L NaOH was taken out. Subsequently, 1 mol/L BaCl2 was added to precipitate the carbonates emitted from the soil in the form of carbonate precipitates. After adding phenolphthalein indicator, the mixture was stirred, and the remaining NaOH was titrated with 0.05 mol/L HCl.
DNA determination [22] was achieved using the MoBio Powersoil DNA extraction kit (MoBio, Carlsbad, CA, USA). The DNA of soil samples was extracted using a DNA extraction kit. Primers (5′-ACTCCTACGGGAGGCAGCAG-3′) and 806R (5′-GGACTACHVGGGTWTCTAAT-3′) were employed to amplify the V3-V4 region of bacterial 16SrDNA. PCR amplification method was as follows: pre-denaturation at 95 °C for 3 min; denaturation at 95 °C for 30 s; annealing at 50 °C for 30 s; extension at 72 °C for 45 s; amplification for 30 cycles; extension at 72 °C for 10 min. Illumina MiSeq sequencing: the MiSeq PE library was constructed and sequenced using the Illumina MiSeq2500 (San Diego, CA, USA) sequencing platform.

2.5. Statistical Analyses

The first-order kinetic equation was adopted to fit the cumulative mineralization of SOC.
Ct = C0(1 − exp−kt)
In the equation, Ct is the cumulative carbon emission of soil after t time, C0 is the maximum value of soil C emission, k is a constant, and t is the culture time. The potential maximum C emission is calculated adopting this formula [23].
Experimental data were analyzed using SPSS 25.0 software for one-way ANOVA, and the LSD method was employed for significance testing. Pearson correlation analysis was performed by Origin to assess the relationship between the cumulative amount of SOC mineralization and its chemical and biological properties. Subsequently, at the significance level of p < 0.05, factors significantly correlated with the amount of SOC mineralization were selected. Substrate carbon (SOC, DOC) and substrate nitrogen (TN, NO3-N) were subjected to PCA analysis to extract the first principal component and create new indicators. Furthermore, structural equation modeling and variance decomposition analysis were performed using Amos 17.0 and R (4.0.0). The alpha diversity of 16S rRNA gene sequences was analyzed using mothur (version v.1.30.2), and the R vegan package (version 2.4.3) was used to analyze species composition and sample grouping.

3. Results

3.1. Soil Biochemical Properties of Different Tree Species

One-way ANOVA (Table 1) showed that there were significant differences (p < 0.05) in the soil pH, total nitrogen (TN), total phosphorus (TP), microbial biomass carbon and nitrogen (MBC, MBN), soil organic carbon (SOC), dissolved organic carbon and nitrogen (DOC, DON), ammonium nitrogen (NH4+-N), nitrate nitrogen (NO3-N), and C/N between the different tree species. The SOC content of G. pensilis forest land was the highest of the three species, and was 33.0% higher than that of T. distichum forest land (p < 0.05); but there was no significant difference between that of CK and T. Zhongshanshan forest land. Similarly, the MBC content in G. pensilis forest land was the highest, which was significantly higher than that in T. distichum forest land and CK soil (p < 0.05), but was not significantly different from that in T. Zhongshanshan forest land. Compared with CK soil, G. pensilis and T. Zhongshanshan forest had a significantly higher content of DOC, while T. distichum had lower DOC content. Therefore, SOC content and its components in G. pensilis and T. Zhongshanshan forest land were generally higher than those in CK and T. distichum forest land. Compared with CK soil, all three tree species had higher soil pH, and there were significant differences between the different tree species (p < 0.01). However, for soil NH4+-N and NO3-N, the soil of G. pensilis and T. Zhongshanshan forests had significantly lower soil NH4+-N and NO3-N contents compared to CK (p < 0.05). In general, the contents of TP, TN, SOC, MBC, and DOC in the soil of G. pensilis and T. Zhongshanshan forest land were higher than those of the T. distichum forest land and CK soil, and the difference between T. distichum forest land and CK soil was not significant.

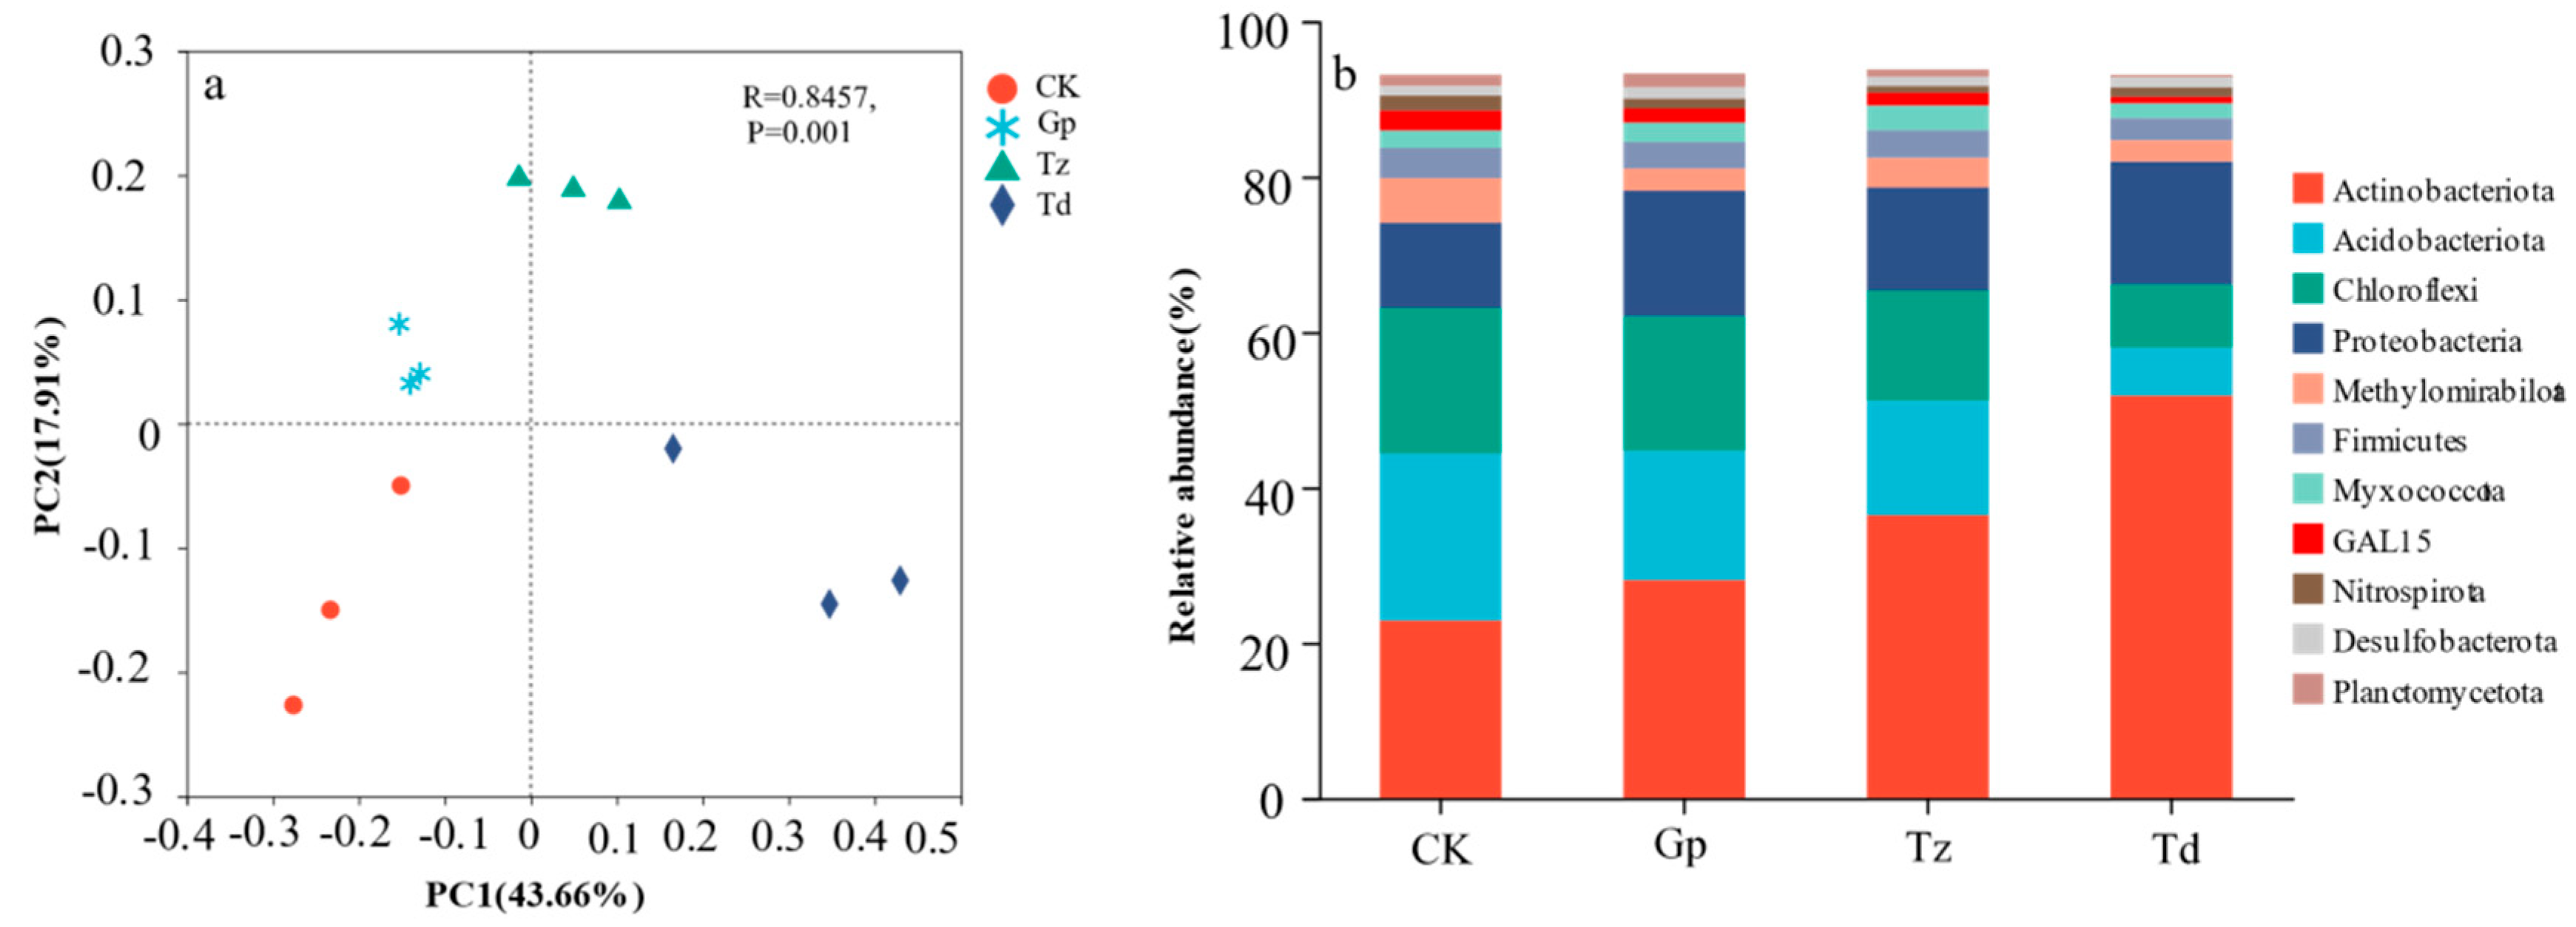
3.2. Characteristics of Soil Bacterial Community in Different Tree Species

As shown in Table 2, all the bacterial coverage rates in the soil samples were greater than 97.8%, indicating that the sequencing was reasonable and could reflect the real situation of soil bacterial species and communities in different tree species. Under different tree species, the abundance of bacterial OTUs was significantly different (p < 0.05). The abundance of OTUs and Chao in the three forest soils was higher than that in CK soil, and the abundance of OTUs and Chao in the soil of G. pensilis forest was 16.8% and 16.0% higher than the in CK soil, respectively. The Shannon index was significantly different between the different tree species. The Shannon index of soil bacteria in the T. distichum forest was significantly lower than that for the other tree species, and its value was only 77.7% of that of the soil in the G. pensilis forest.
As shown in Figure 2a, PCoA was used to analyze the overall composition of the soil bacterial communities for the different tree species. The contribution rates of the PCoA1 axis and PCoA2 axis were 43.66% and 17.91%, and the cumulative contribution rate was 61.57%. The results showed that different tree species had significant effects on the characteristics of the bacterial community structure (ANOSIM, R = 0.8457, p = 0.001). As shown in Figure 2b, the bacterial community composition is related to the tree species. In all samples, the bacterial community was dominated by Actinobacteriota, Acidobacteriota, Chloroflexi, and Proteobacteria (accounting for about 80% of all bacterial sequences). Different tree species had significant effects on the relative abundances of Actinobacteria, Chloroflexi, and Acidobacteria (p < 0.05). Regarding the abundance of Actinobacteria, the pattern exhibited by different tree species was as follows: CK < G. pensilis < T. Zhongshanshan < T. distichum; while when it came to Acidobacteriota and Chloroflexi, it showed the opposite pattern.

3.3. Characteristics of SOC Mineralization of Different Tree Species

The results showed that different tree species had significant effects on the amount and rate of SOC mineralization (Figure 3, p < 0.05). The cumulative amount and rate of SOC mineralization in G. pensilis and T. Zhongshanshan forests were significantly higher than CK (p < 0.05), which were 47% and 37% higher than CK, respectively; whereas there was no significant difference between T. distichum and CK. The rate of SOC mineralization in different tree species continued to decline throughout the incubation period.
The fitting data of the kinetic model showed that the values of C0, K, and R2 in different tree species were significantly different (p < 0.05). The C0 of soil potential C emissions in G. pensilis and T. Zhongshanshan forest land was significantly higher than that in CK and T. distichum forest land (p < 0.05). This was consistent with the performance of soil cumulative C emissions and rates. The potential C emission of the soil in G. pensilis forest land was 2.71 times that of the soil in T. distichum forest land (Table 3).

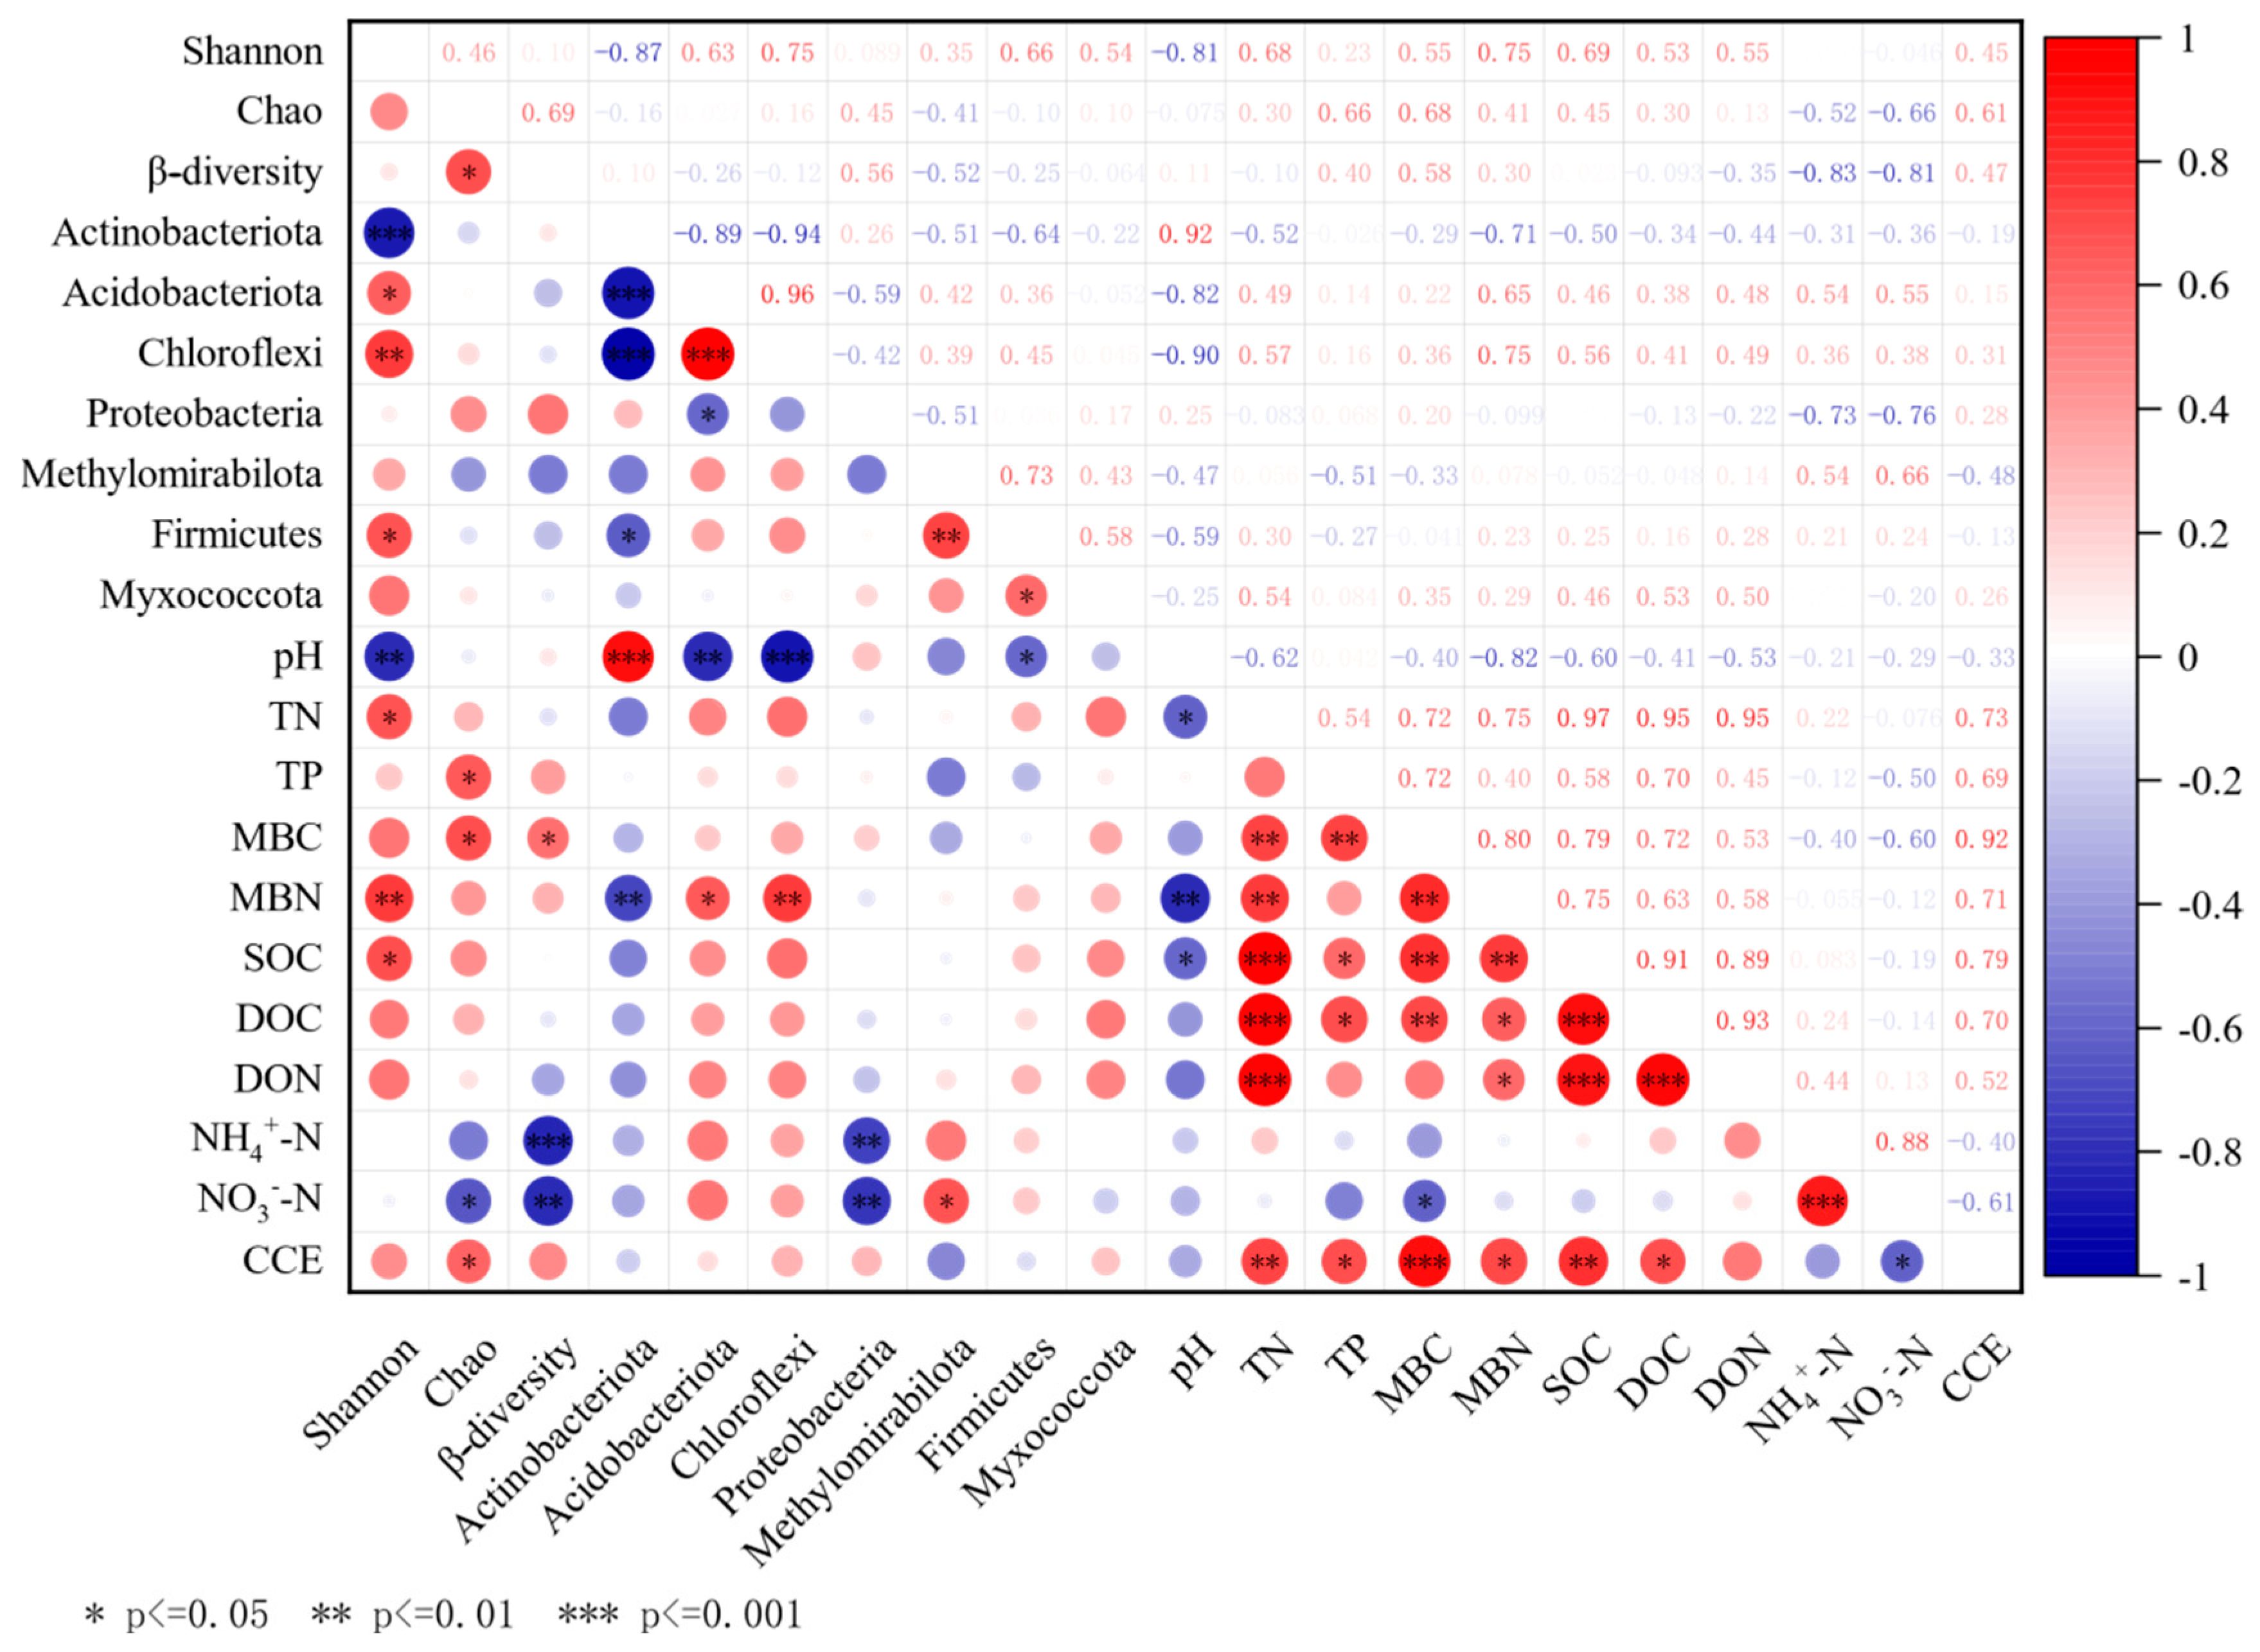
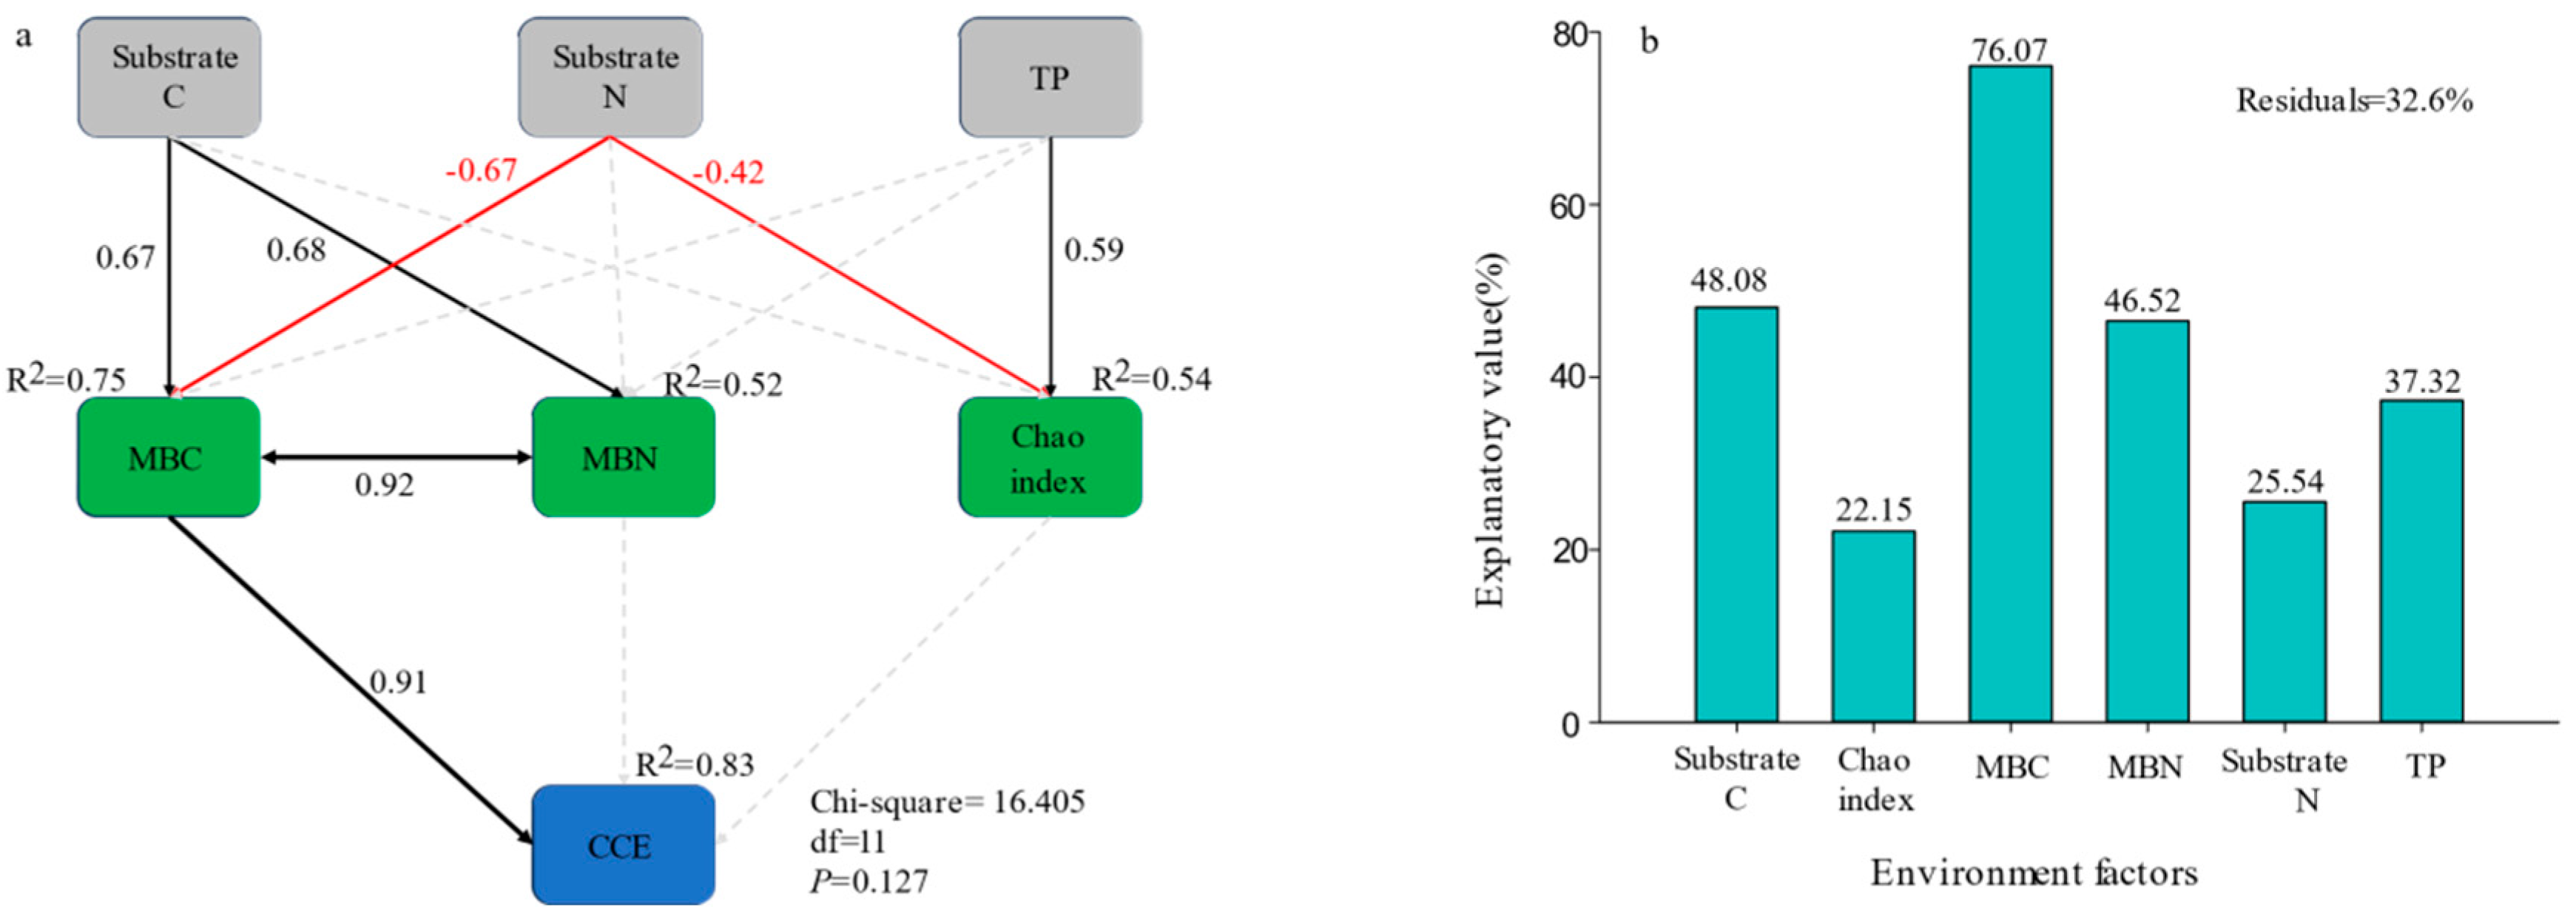
3.4. Factors Affecting SOC Mineralization in Different Tree Species

As shown in Figure 4, according to the results of Pearson correlation analysis, the cumulative CO2 emissions were extremely significantly positively correlated with TN, MBC, and SOC, significantly correlated with TP, MBN, DOC, and the abundance of Chao, while significantly negatively correlated with NO3-N.
The structural equation models can explain 83.0% of the variation in SOC mineralization (Figure 5a). Soil MBC can directly affect the cumulative mineralization of SOC, and the effect is the most significant. Substrate carbon (SOC, DOC) indirectly affects the cumulative mineralization of SOC by affecting MBC. Substrate nitrogen (TN, NO3-N) is negatively correlated with soil MBC and microbial Chao index. Variation partitioning analysis showed that the residual interpretation was 32.6% (Figure 5b), and environmental factors could explain 67.4% of the variation in SOC mineralization accumulation. From the individual interpretation of environmental factors on SOC mineralization, MBC had the highest interpretation of SOC mineralization accumulation, which was consistent with the results of the structural equation model, followed by substrate C and MBN.

4. Discussion

4.1. The Effects of Different Tree Species on Soil Biochemical Properties and Microorganisms

Soil biochemical properties are directly or indirectly affected by various factors such as vegetation root exudates, litter, aboveground biomass, and vegetation growth characteristics [24,25]. Soil pH regulates soil biochemical processes and has an important impact on the structure and function of terrestrial ecosystems. Afforestation can neutralize the soil by changing the balance of soil hydrogen ion production and consumption in the nutrient cycle; that is, the pH value of acidic soil increases while that of alkaline soil decreases after afforestation [26]. The results of this study show that the pH values of plantation soil have increased compared to those of the extremely acidic soil of the CK. Previous studies have demonstrated the phenomenon of soil pH neutralization in the Three Gorges Reservoir, with soil pH values approaching neutrality from alkalinity [27]. In regions with low SOC content, afforestation is likely to boost the SOC content, particularly the SOC content of the surface soil [28]. Due to the different litter qualities and soil biochemical properties in different tree species, planting different tree species could lead to variations in SOC between the different tree species [29]. In this study, the results showed that there were significant differences in the SOC between the different tree species, with the SOC content of the G. pensilis forest significantly higher than that of the T. distichum forest. Soil MBC and DOC are the typical active components of the soil organic carbon pool [30]. Therefore, different tree species have significant effects on soil MBC and DOC, which further change the SOC. Correlation analysis shows that SOC is significantly positively correlated with MBC and DOC, which further indicates that the contents of MBC and DOC are closely associated with SOC content.
The distribution and spatial variation in soil nutrients in different tree species are not the same, and the nutrient absorption strategies are also different [11]. Soil inorganic N, an important indicator of soil quality and plant growth status [31,32], is mainly absorbed by plants in the form of NH4+-N and NO3-N. This study showed that different tree species significantly affected the content of NH4+-N and NO3-N in soil. Specifically, the content of NH4+-N and NO3-N in the soil of the three plantations were significantly lower compared with CK, which was consistent with the results of previous studies [33]. The lower soil inorganic N content indicated that the absorption and utilization of soil inorganic N by the plantations were higher than those of CK, especially the content of NO3-N. Previous studies also have shown that NO3-N can promote the growth of plant roots [33]. For the plantation in the reservoir water-level drawdown zones that is in its infancy and with strong vitality, a large amount of NO3-N is needed to promote root growth and meet its own growth needs [32]. As an important nutrient for plant growth and development, phosphorus (P) plays an important catalytic role in plant photosynthesis and participates in the synthesis of DNA and RNA. Therefore, P is involved in various biological and biochemical processes in plants [34]. The results of this study showed that the soil TP content of the three plantations was higher than that of CK soil. This may be due to the fact that G. pensilis, T. Zhongshanshan, and T. distichum are woody plants with deeper roots compared to herbaceous plants. They could absorb P from the deeper soil layers and return to surface soil through litter input, thereby increasing the P content in surface soil [35].
After vegetation changes, the species, quantity, and root exudates of litter have a selective effect on the growth and reproduction of soil microorganisms, thus affecting the characteristics of microbial communities [36]. Studies have shown that afforestation increases soil microbial diversity, shapes microbial community structure, and repairs the soil [37,38]. The results of this study showed that the OTUs and Chao abundance of the three plantations increased compared to CK. Changes in soil physicochemical properties caused by different tree species will directly affect the living environment of soil microorganisms, leading to changes in microbial communities [39], especially the change in soil pH [40]. For example, in this study, the abundance of Actinobacteria in the T. distichum bacterial community far exceeded that in the communities of the other tree species, because its pH was significantly higher than that of the other tree species, and Actinobacteria grow better in neutral to alkaline environments [41]. Vegetation effectively increased the carbon input, which was conducive to the accumulation of SOC [42]. This improvement in nutrient resources can change microbial ecological strategies, reducing oligotrophic bacteria and increasing symbiotic bacteria [43]. In this study, compared with CK, the plantation significantly increased the relative abundance of symbiotic bacteria (such as Actinobacteria and Proteobacteria) in the dominant phylum, and decreased the relative abundance of oligotrophic bacteria (Acidobacteria and Chloroflexi).

4.2. Factors Affecting SOC Mineralization in Different Tree Species

The results of this study demonstrated that SOC mineralization of different tree species was significantly different in the reservoir water-level drawdown zones (p < 0.05). Specifically, the G. pensilis and T. Zhongshanshan forestlands exhibited relatively larger cumulative mineralization amounts, mineralization rates, and potential C mineralization amounts of SOC. In contrast, the mineralization activity of SOC in T. distichum forest land and CK was relatively feeble. The structural equation model and variation partitioning analysis suggested that the main reason for the difference in SOC mineralization in different types of plantations was the difference in soil biochemical properties. Soil biochemical properties are directly or indirectly affected by many factors, such as vegetation root exudates, litter, aboveground biomass, and vegetation growth characteristics [24,25]. The different soil biochemical properties will further alter soil microbial species, quantities, and metabolic activity, thereby affecting SOC mineralization rate [44]. Adequate substrate supply can assist microorganisms in maintaining a relatively high activity, leading to a faster rate of conversion of SOC to MBC, and further enhancing SOC mineralization [45]. The contents of substrates such as SOC, DOC, and MBC in the soil of G. pensilis and T. Zhongshanshan were relatively higher, and the accumulation of SOC mineralization was also greater. In addition, previous studies have shown that MBC can better predict changes in SOC mineralization accumulation than SOC content [46], which is consistent with the results of this study. Soil organic carbon mineralization is a process of microbial-mediated respiration, and MBC, the C content of microbial cells in a unit of dry soil, is directly related to microorganisms. Not only is MBC the product of microbial metabolism but also the substrate of microorganisms [43,47]. Although MBC only accounts for 1% of the SOC pool, it is the most active part of the soil C pool and the main driving force of the soil C cycle. Therefore, SOC mineralization is more sensitive to the change in MBC [48].
In this study, the soil communities of different plantations were significantly different, and the change in microbial community composition had little effect on C mineralization. The reason for this phenomenon may be that the functional redundancy of microorganisms played a role [49,50]. Despite the significant differences in biochemical properties and community composition between the different tree species, each metabolic function (such as C metabolism) can be jointly accomplished by a variety of coexisting organisms with different taxonomic meanings [51].

5. Conclusions

(1) The tree species of the plantations in the reservoir water-level drawdown zones had a significant impact on SOC mineralization. Compared with CK soil, the forestlands of G. pensilis and T. Zhongshanshan significantly increased the cumulative amount of SOC mineralization and the potential C mineralization amount, indicating an improvement in soil quality, while there was no significant change in the T. distichum forestland.
(2) The key factor affecting SOC mineralization in the forest land of the reservoir water-level drawdown zones is soil MBC, with SOC and DOC also important factors affecting SOC mineralization. Furthermore, compared with bacterial composition, the number of bacteria has a greater impact on SOC mineralization. In contrast to the CK soil, the two plantations of G. pensilis and T. Zhongshanshan had significant promoting effects on the soil’s content of SOC, the content of active carbon components and microbial diversity. They also regulated soil pH, making it more suitable for microbial growth, while the promoting effect of T. distichum was not obvious.
(3) Owing to the relatively young age of the plantations at the time of sampling, it is expected that long-term monitoring should be carried out at a later stage to study the impact of different growth stages of the plantations on SOC mineralization and C sequestration effects.

Author Contributions

All author contributors conceived and designed the experiments. J.Z. and Y.Z. (Yanjie Zhang) wrote the original draft. J.Z. wrote the paper. F.W., J.Y. and Y.Z. (Yanting Zhang) performed the experiments and made contributions to methodology and software. L.Q., Z.C. and X.W. analyzed the data. T.Z., S.L. (Songzhe Li), J.T. and S.L. (Shunbao Lu) contributed to data curation/writing—review and editing/materials. Y.Z. (Yanjie Zhang) contributed to funding acquisition. All authors have read and agreed to the published version of the manuscript.

Funding

The work was funded by National Natural Science Foundation of China (32260297), Natural Science Foundation of Jiangxi Province (20224ACB205003). The authors take this opportunity to thank all for the support extended for the research.

Data Availability Statement

The original data of the MS can be obtained from corresponding author Yanjie Zhang.

Conflicts of Interest

The authors declare no conflicts of interest regarding the publication of this paper.

References

  1. Wu, H.W.; Cui, H.L.; Fu, C.X.; Li, R.; Qi, F.Y.; Liu, Z.L.; Yang, G.; Xiao, K.Q.; Qiao, M. Unveiling the crucial role of soil microorganisms in carbon cycling: A review. Sci. Total Environ. 2024, 909, 168627. [Google Scholar] [CrossRef] [PubMed]
  2. Wang, C.; Morrissey, E.M.; Mau, R.L.; Hayer, M.; Piñeiro, J.; Mack, M.; Marks, J.; Bell, S.; Miller, S.; Schwartz, E.; et al. The temperature sensitivity of soil: Microbial biodiversity, growth, and carbon mineralization. ISME J. 2021, 15, 2738–2747. [Google Scholar] [CrossRef] [PubMed]
  3. Morrien, E.; Hannula, S.E.; Snoek, L.B.; Helmsing, N.R.; Zweers, H.; de Hollander, M. Soil networks become more connected and take up more carbon as nature restoration progresses. Nat. Commun. 2017, 8, 14349. [Google Scholar] [CrossRef] [PubMed]
  4. Deng, L.; Liu, S.G.; Kim, D.G.; Peng, C.; Sweeney, S.; Shangguan, Z. Past and future carbon sequestration benefits of China’s grain for green program. Glob. Environ. Change 2017, 47, 13–20. [Google Scholar] [CrossRef]
  5. Wu, J.G.; Zhang, X.Q.; Xu, D.Y. The mineralization of soil organic carbon under different land uses in the liupan mountain forest zone. Acta Phytoecol. Sin. 2004, 28, 530–538. [Google Scholar]
  6. Ladegaard-Pedersen, P.; Elberling, B.; Vesterdal, L. Soil carbon stocks, mineralization rates, and CO2 effluxes under 10 tree species on contrasting soil types. Can. J. For. Res. 2005, 35, 1277–1284. [Google Scholar] [CrossRef]
  7. Fang, T.; Li, Y.C.; Yao, Z.X.; Yu, Y.F. Effects of planting broadleaf trees and Moso bamboo on soil carbon mineralization and microbial community structure. Chin. J. Appl. Ecol. 2021, 32, 82–92. [Google Scholar]
  8. Thoms, C.; Gattinger, A.; Jacob, M.; Thomas, F.M.; Gleixner, G. Direct and indirect effects of tree diversity drive soil microbial diversity in temperate deciduous forest. Soil Biol. Biochem. 2010, 42, 1558–1565. [Google Scholar] [CrossRef]
  9. Segura, J.H.; Nilsson, M.B.; Sparrman, T.; Serk, H.; Öquist, M.G. Boreal tree species affect soil organic matter composition and saprotrophic mineralization rates. Plant Soil 2019, 441, 173–190. [Google Scholar] [CrossRef]
  10. Drake, J.E.; Darby, B.A.; Giasson, M.A.; Kramer, M.A.; Finzi, A.C. Stoichiometry constrains microbial response to root exudation- insights from a model and a field experiment in a temperate forest. Biogeosciences 2013, 10, 821–838. [Google Scholar] [CrossRef]
  11. Wang, Q.K.; Zhong, M.C. Composition and mineralization of soil organic carbon pools in four single-tree species forest soils. J. For. Res. 2016, 27, 1277–1285. [Google Scholar] [CrossRef]
  12. Deemer, B.R.; Harrison, J.A.; Li, S.Y.; Beaulieu, J.J.; Delsontro, T.; Barros, N.; José, F.B.N.; Powers, S.M.; dos Santos, M.A.; Vonk, J.A. Greenhouse gas emissions from reservoir water surfaces: A new global synthesis. Bioscience 2016, 66, 949–964. [Google Scholar] [CrossRef] [PubMed]
  13. Mendonca, R.; Muller, R.A.; Clow, D.; Verpoorter, C.; Sobek, S. Organic carbon burial in global lakes and reservoirs. Nat. Commun. 2017, 8, 1694. [Google Scholar] [CrossRef] [PubMed]
  14. Jin, H.J.; Yoon, T.K.; Lee, S.H.; Kang, H.; Park, J.H. Enhanced greenhouse gas emission from exposed sediments along a hydroelectric reservoir during an extreme drought event. Environ. Res. Lett. 2016, 11, 124003. [Google Scholar] [CrossRef]
  15. Zhao, Y.H.; Zhang, Y.J.; Yan, Y.; Liu, Y.H.; Xu, Y.; Liu, Y.Q.; Guo, X.M.; Lou, Y.L.; Lu, S.B. Response to different temperatures under forest recovery types on soil organic carbon mineralization in subtropics. Acta Ecol. Sin. 2018, 38, 5056–5066. [Google Scholar]
  16. Xu, X.C.; Zhang, Q.Q.; Teng, Q.M.; Zhao, M.S.; Li, Y.C. Rhizosphere effects of moso bamboo and dominant tree species of secondary broadleaved forest on soil organic carbon mineralization. Chin. J. Appl. Ecol. 2023, 34, 2374–2382. [Google Scholar]
  17. Lu, R.K. Soil Agrochemical Analysis Methods; China Agricultural Science and Technology Press: Beijing, China, 2000. [Google Scholar]
  18. Chen, C.R.; Xu, Z.H.; Keay, P.; Zhang, S.L. Total soluble nitrogen in forest soils as determined by persulfate oxidation and by high temperature catalytic oxidation. Aust. J. Soil Res. 2005, 43, 515–523. [Google Scholar] [CrossRef]
  19. Vance, E.D.; Brookes, P.C.; Jenkinson, D.S. An extraction method for measuring soil microbial biomass C. Soil Biol. Biochem. 1987, 19, 703–707. [Google Scholar] [CrossRef]
  20. Brookes, P.C.; Landman, A.; Pruden, G.; Jenkinson, D.S. Chloroform fumigation and the release of soil nitrogen:the effects of fumigation time and temperature. Soil Biol. Biochem. 1985, 17, 837–842. [Google Scholar] [CrossRef]
  21. Chen, C.R.; Xu, Z.H.; Mathers, N.J. Soil carbon pools in adjacent natural and plantation forests of subtropical Australia. Soil Sci. Soc. Am. J. 2004, 68, 282–291. [Google Scholar] [CrossRef]
  22. Ran, K.; Wang, Z.J.; Li, P. Response difference of bacterial and fungal structure and diversity in rhizosphere soil of typical urban tree along urban-rural environmental gradient. Acta Ecol. Sin. 2023, 43, 9758–9769. [Google Scholar]
  23. Smith, J.L.; Schobel, R.R.; Mcneal, B.L.; Campbell, G.S. Potential errors in the first-order model for estimating soil nitrogen mineralization potentials. Soil Sci. Soc. Am. J. 1980, 44, 996–1000. [Google Scholar] [CrossRef]
  24. Lü, D.; Yang, Y.H.; Zhao, W.H.; Lei, S.Y.; Zhang, X.P. Fine root biomass distribution and coupling to soil physicochemical properties under different restored vegetation types. Acta Ecol. Sin. 2018, 38, 3979–3987. [Google Scholar]
  25. Li, J.W.; Li, M.Y.; Dong, L.B.; Wang, K.B.; Liu, Y.L.; Hai, X.Y.; Pan, Y.Y.; Lv, W.W.; Wang, X.Z.; Shangguan, Z.P.; et al. Plant productivity and microbial composition drive soil carbon and nitrogen sequestrations following cropland abandonment. Sci. Total Environ. 2020, 744, 140802. [Google Scholar] [CrossRef]
  26. Hong, S.B.; Piao, S.L.; Chen, A.P.; Liu, Y.W.; Peng, L.L. Afforestation neutralizes soil pH. Nat. Commun. 2018, 9, 520. [Google Scholar] [CrossRef]
  27. Mei, Y.; Huang, P.; Wang, P.; Zhu, K. Effects of water level fluctuations and vegetation restoration on soil prokaryotic microbial community structure in the riparian zone of the three Gorges reservoir. Environ. Sci. 2024, 45, 2715–2726. [Google Scholar]
  28. Hong, S.B.; Yin, G.D.; Piao, S.L.; Dybzinski, R.; Cong, N.; Li, X.Y.; Wang, K.; Peñuelas, J.; Zeng, H.; Chen, A.P. Divergent responses of soil organic carbon to afforestation. Nat. Sustain. 2020, 3, 694–700. [Google Scholar] [CrossRef]
  29. Kuzyakov, Y.; Friedel, J.K.; Stahr, K. Review of mechanisms and quantification of priming effects. Soil Biol. Biochem. 2000, 32, 1485–1498. [Google Scholar] [CrossRef]
  30. Hang, Z.Q.; Wang, G.X.; Liu, J.E.; Wang, G.; Wang, H. Characterization of soil organic carbon fractions at Spartina alterniflora saltmarsh in North Jiangsu. Acta Ecol. Sin. 2014, 34, 4175–4182. [Google Scholar]
  31. Li, Y.; Li, Z.; Cui, S.; Liang, G.P.; Zhang, Q.P. Microbial-derived carbon components are critical for enhancing soil organic carbon in no-tillage croplands: A global perspective. Soil Tillage Res. 2021, 205, 104758. [Google Scholar] [CrossRef]
  32. Zhang, Y.D.; Bai, S.B. Effects of nitrogen forms on nutrient uptake and growth of trees. Chin. J. Appl. Ecol. 2003, 14, 2044–2048. [Google Scholar]
  33. Li, Z.L.; Zeng, Z.Q.; Tian, D.H.; Wang, J.S.; Wang, B.X.; Han, Y.H.; Chen, Q.Q.; Chen, W.N.; Yang, J.L.; Meng, C.; et al. Global variations and controlling factors of soil nitrogen turnover rate. Earth-Sci. Rev. 2020, 207, 103250. [Google Scholar] [CrossRef]
  34. Han, X.; Yuan, C.Y.; Li, J.H.; Hong, Z.W.; Liu, X.; Du, T.; Li, H.; You, C.M.; Tan, B.; Zhu, P.; et al. Effects of tree species and soil layers on soil extractable nitrogen content. Ecol. Environ. Sci. 2022, 31, 2143–2151. [Google Scholar]
  35. Zhu, S.-G.; Tao, H.-Y.; Li, W.-B.; Zhou, R.; Gui, Y.-W.; Zhu, L.; Zhang, X.-L.; Wang, W.; Wang, B.-Z.; Mei, F.-J.; et al. Phosphorus availability mediates plant–plant interaction and field productivity in maize-grass pea intercropping system: Field experiment and its global validation. Agric. Syst. 2023, 205, 103584. [Google Scholar] [CrossRef]
  36. Chen, X.L.; Chen, H.Y.H.; Chang, S.X. Meta-analysis shows that plant mixtures increase soil phosphorus availability and plant productivity in diverse ecosystems. Nat. Ecol. Evol. 2022, 6, 1112–1121. [Google Scholar] [CrossRef]
  37. Fang, X.H.; Zhang, J.C.; Meng, M.J.; Guo, X.P.; Wu, Y.W.; Liu, X.; Zhao, K.L.; Ding, L.Z.; Shao, Y.F.; Fu, W.J. Forest-type shift and subsequent intensive management affected soil organic carbon and microbial community in southeastern China. Eur. J. For. Res. 2017, 136, 689–697. [Google Scholar] [CrossRef]
  38. Lange, M.; Eisenhauer, N.; Sierra, C.A.; Bessler, H.; Engels, C.; Griffiths, R.I.; Mellado-Vázquez, P.G.; Malik, A.A.; Roy, J.; Scheu, S. Plant diversity increases soil microbial activity and soil carbon storage. Nat. Commun. 2015, 6, 6707. [Google Scholar] [CrossRef]
  39. Jiao, S.; Chen, W.M.; Wang, J.L.; Du, N.N.; Li, Q.P.; Wei, G. Soil microbiomes with distinct assemblies through vertical soil profiles drive the cycling of multiple nutrients in reforested ecosystems. Microbiome 2018, 6, 146. [Google Scholar] [CrossRef]
  40. Liu, X.S.; Siemann, E.; Cui, C.; Liu, Y.Q.; Guo, X.M.; Zhang, L. Moso bamboo (Phyllostachys edulis) invasion effects on litter, soil and microbial PLFA characteristics depend on sites and invaded forests. Plant Soil 2019, 79, 439–449. [Google Scholar] [CrossRef]
  41. Philippot, L.; Chenu, C.; Kappler, A.; Rillig, M.C.; Fierer, N. The interplay between microbial communities and soil properties. Nat. Rev. Microbiol. 2024, 22, 226–239. [Google Scholar] [CrossRef]
  42. Zhang, Z.J.; Yang, Y.K.; Zou, Y.; Zou, Y.; DIlida, Y.; Zhai, C.; Sun, D.; Li, M.; Li, Y.; Liu, P. cultivable symbiotic actinomycetes of dictyostelid cellular slime molds in different regions. J. Fungal Res. 2023, 21, 131–142. [Google Scholar]
  43. Yang, Y.; Dou, Y.X.; Wang, B.R.; Wang, Y.Q.; Liang, C.; An, S.S.; Soromotin, A.; Kuzyakov, Y. Increasing contribution of microbial residues to soil organic carbon in grassland restoration chronosequence. Soil Biol. Biochem. 2022, 170, 108688. [Google Scholar] [CrossRef]
  44. Yin, S.; Bai, J.H.; Wang, W.; Zhang, G.L.; Jia, J.; Cui, B.S.; Liu, X.H. Effects of soil moisture on carbon mineralization in floodplain wetlands with different flooding frequencies. J. Hydrol. 2019, 574, 1074–1084. [Google Scholar] [CrossRef]
  45. Wei, Z.Q.; Wu, S.H.; Zhou, S.L.; Lin, C. Installation of impervious surface in urban areas affects microbial biomass, activity (potential C mineralisation), and functional diversity of the fine earth. Soil Res. 2013, 51, 59–67. [Google Scholar] [CrossRef]
  46. Zhou, J.; Sun, T.T.; Shi, L.L.; Kurganova, I.; Lopes de Gerenyu, V.; Kalinina, O.; Giani, L.; Kuzyakov, Y. Organic carbon accumulation and microbial activities in arable soils after abandonment: A chronosequence study. Geoderma 2023, 435, 116496. [Google Scholar] [CrossRef]
  47. Shu, X.Y.; Hu, Y.F.; Liu, W.J.; Xia, L.; Zhang, Y.; Zhou, W.; Liu, W.; Zhang, Y. Linking between soil properties, bacterial communities, enzyme activities, and soil organic carbon mineralization under ecological restoration in an alpine degraded grassland. Front. Microbiol. 2023, 14, 1131836. [Google Scholar] [CrossRef]
  48. Yang, H.; Cao, J.H.; Zhang, L.K.; Hou, Y.L.; Mao, L.F. Pool sizes and turnover of soil organic carbon of farmland soil in Karst area of Guilin. J. Northeast Agric. Univ. (Engl. Ed.) 2011, 18, 39–45. [Google Scholar] [CrossRef]
  49. Patoine, G.L.; Eisenhauer, N.; Cesarz, S.; Phillips, H.R.P.; Guerra, C.A.; Xu, X.F.; Zhang, L.H. Drivers and trends of global soil microbial carbon over two decades. Nat. Commun. 2022, 13, 4195. [Google Scholar] [CrossRef]
  50. Guo, Z.; Han, J.C.; Li, J.; Xu, Y.; Wang, X.L.; Li, Y. Effects of long-term fertilization on soil organic carbon mineralization and microbial community structure. PLoS ONE 2019, 14, e0211163. [Google Scholar] [CrossRef]
  51. Kemmitt, S.J.; Lanyon, C.V.; Waite, I.S.; Wen, Q.; Addiscott, T.M.; Bird, N.R.A.; O’Donnell, A.G.; Brookes, P.C. Mineralization of native soil organic matter is not regulated by the size, activity or composition of the soil microbial biomass-a new perspective. Soil Biol. Biochem. 2008, 40, 61–73. [Google Scholar] [CrossRef]
Figure 1. Sampling location in Yutian Reservoir in Fuliang County, Jingdezhen City, Jiangxi Province.
Forests 16 01145 g001
Figure 2. PCoA analysis (a) classification and composition (b) of soil bacteria community under different tree species.
Forests 16 01145 g002
Figure 3. The cumulative mineralization amounts (a) and mineralization rates (b) of soil organic carbon of the three tree species and CK. Note: different letters a and b indicate significant differences between different treatments (p < 0.05, mean ± SE); GP: G. pensilis; Tz: T. Zhongshanshan; Td: T. distichum; Same below.
Forests 16 01145 g003
Figure 4. The Pearson correlation of cumulative CO2 emission and soil properties under different tree species. Note: CCE refers to: cumulative CO2 emission, the same below.
Forests 16 01145 g004
Figure 5. Drivers of soil organic carbon mineralization in structural equation modeling (a) and variation partitioning (b) analysis.
Forests 16 01145 g005
Table 1. Basic properties of soil samples under different tree species.
ItemCKG. pensilisT. ZhongshanshanT. distichum
pH4.35 ± 0.02 c4.55 ± 0.05 c4.89 ± 0.07 b5.63 ± 0.08 a
TP (g·kg−1)0.34 ± 0.02 c0.42 ± 0.02 ab0.43 ± 0.02 a0.37 ± 0.01 bc
TN (g·kg−1)1.08 ± 0.069 ab1.20 ± 0.08 a1.21 ± 0.22 a0.72 ± 0.01 b
SOC (g·kg−1)6.507 ± 0.66 ab7.99 ± 0.15 a7.64 ± 1.17 ab5.36 ± 0.20 b
MBC (mg·kg−1)149.40 ± 15.62 bc207.45 ± 5.14 a173.36 ± 14.78 ab131.42 ± 5.06 c
MBN (mg·kg−1)11.24 ± 1.75 ab13.16 ± 1.35 a11.18 ± 0.67 ab7.16 ± 1.09 b
DOC (mg·kg−1)57.171 ± 0.98 c72.25 ± 2.52 b96.35 ± 5.32 a39.40 ± 1.58 d
DON (mg·kg−1)8.49 ± 0.42 b7.85 ± 0.28 b12.41 ± 1.11 a3.98 ± 0.01 c
NH4+-N (mg·kg−1)120.151 ± 9.52 a85.36 ± 4.11 c115.90 ± 4.28 ab98.12 ± 2.03 bc
NO3-N (mg·kg−1)2.86 ± 0.32 a0.92 ± 0.11 c1.73 ± 0.12 b1.56 ± 0.14 bc
CK: unforested land, the same below; different letters a, b, c, and d in the same row indicate significant differences in soil biochemical properties between different treatments (p < 0.05, mean ± SE).
Table 2. Soil bacteria abundance and α diversity index under different tree species.
SpeciesOTU RichnessShannon IndexChao RichnessCoverage/%
CK2630 ± 53 b6.03 ± 0.06 a3337 ± 75 b98.03 ± 0.00 a
G. pensilis3159 ± 112 a6.31 ± 0.09 a3974 ± 149 a97.65 ± 0.00 b
T. Zhongshanshan2843 ± 117 ab5.95 ± 0.08 a3607 ± 190 ab97.87 ± 0.00 ab
T. distichum2718 ± 146 b4.90 ± 0.51 b3530 ± 184 ab97.80 ± 0.00 ab
Note: different letters a and b in the same column indicate significant differences between different treatments (p < 0.05, mean ± SE).
Table 3. Model parameters and coefficients of determination (R2) estimated using the first-order exponential model fitted to the cumulative C mineralized data from the different tree species.
SpeciesPotentially Carbon Mineralizable (C0) (mg·kg−1)Constant (K)Relation Coefficient (R2)
CK281.468 ± 41.174 b0.023 ± 0.002 b0.997 ± 0.001 ab
G. pensilis614.831 ± 89.932 a0.018 ± 0.002 b0.999 ± 0.000 a
T. Zhongshanshan513.859 ± 59.407 a0.017 ± 0.003 b0.999 ± 0.001 a
T. distichum227.177 ± 24.311 b0.031 ± 0.003 a0.994 ± 0.002 b
Note: different letters a and b in the same column indicate significant differences between different treatments (p < 0.05, mean ± SE).
Disclaimer/Publisher’s Note: The statements, opinions and data contained in all publications are solely those of the individual author(s) and contributor(s) and not of MDPI and/or the editor(s). MDPI and/or the editor(s) disclaim responsibility for any injury to people or property resulting from any ideas, methods, instructions or products referred to in the content.

