

Relationship Between Urban Forest Structure and Seasonal Variation in Vegetation Cover in Jinhua City, China


Abstract
1. Introduction
2. Materials and Methods
2.1. Materials
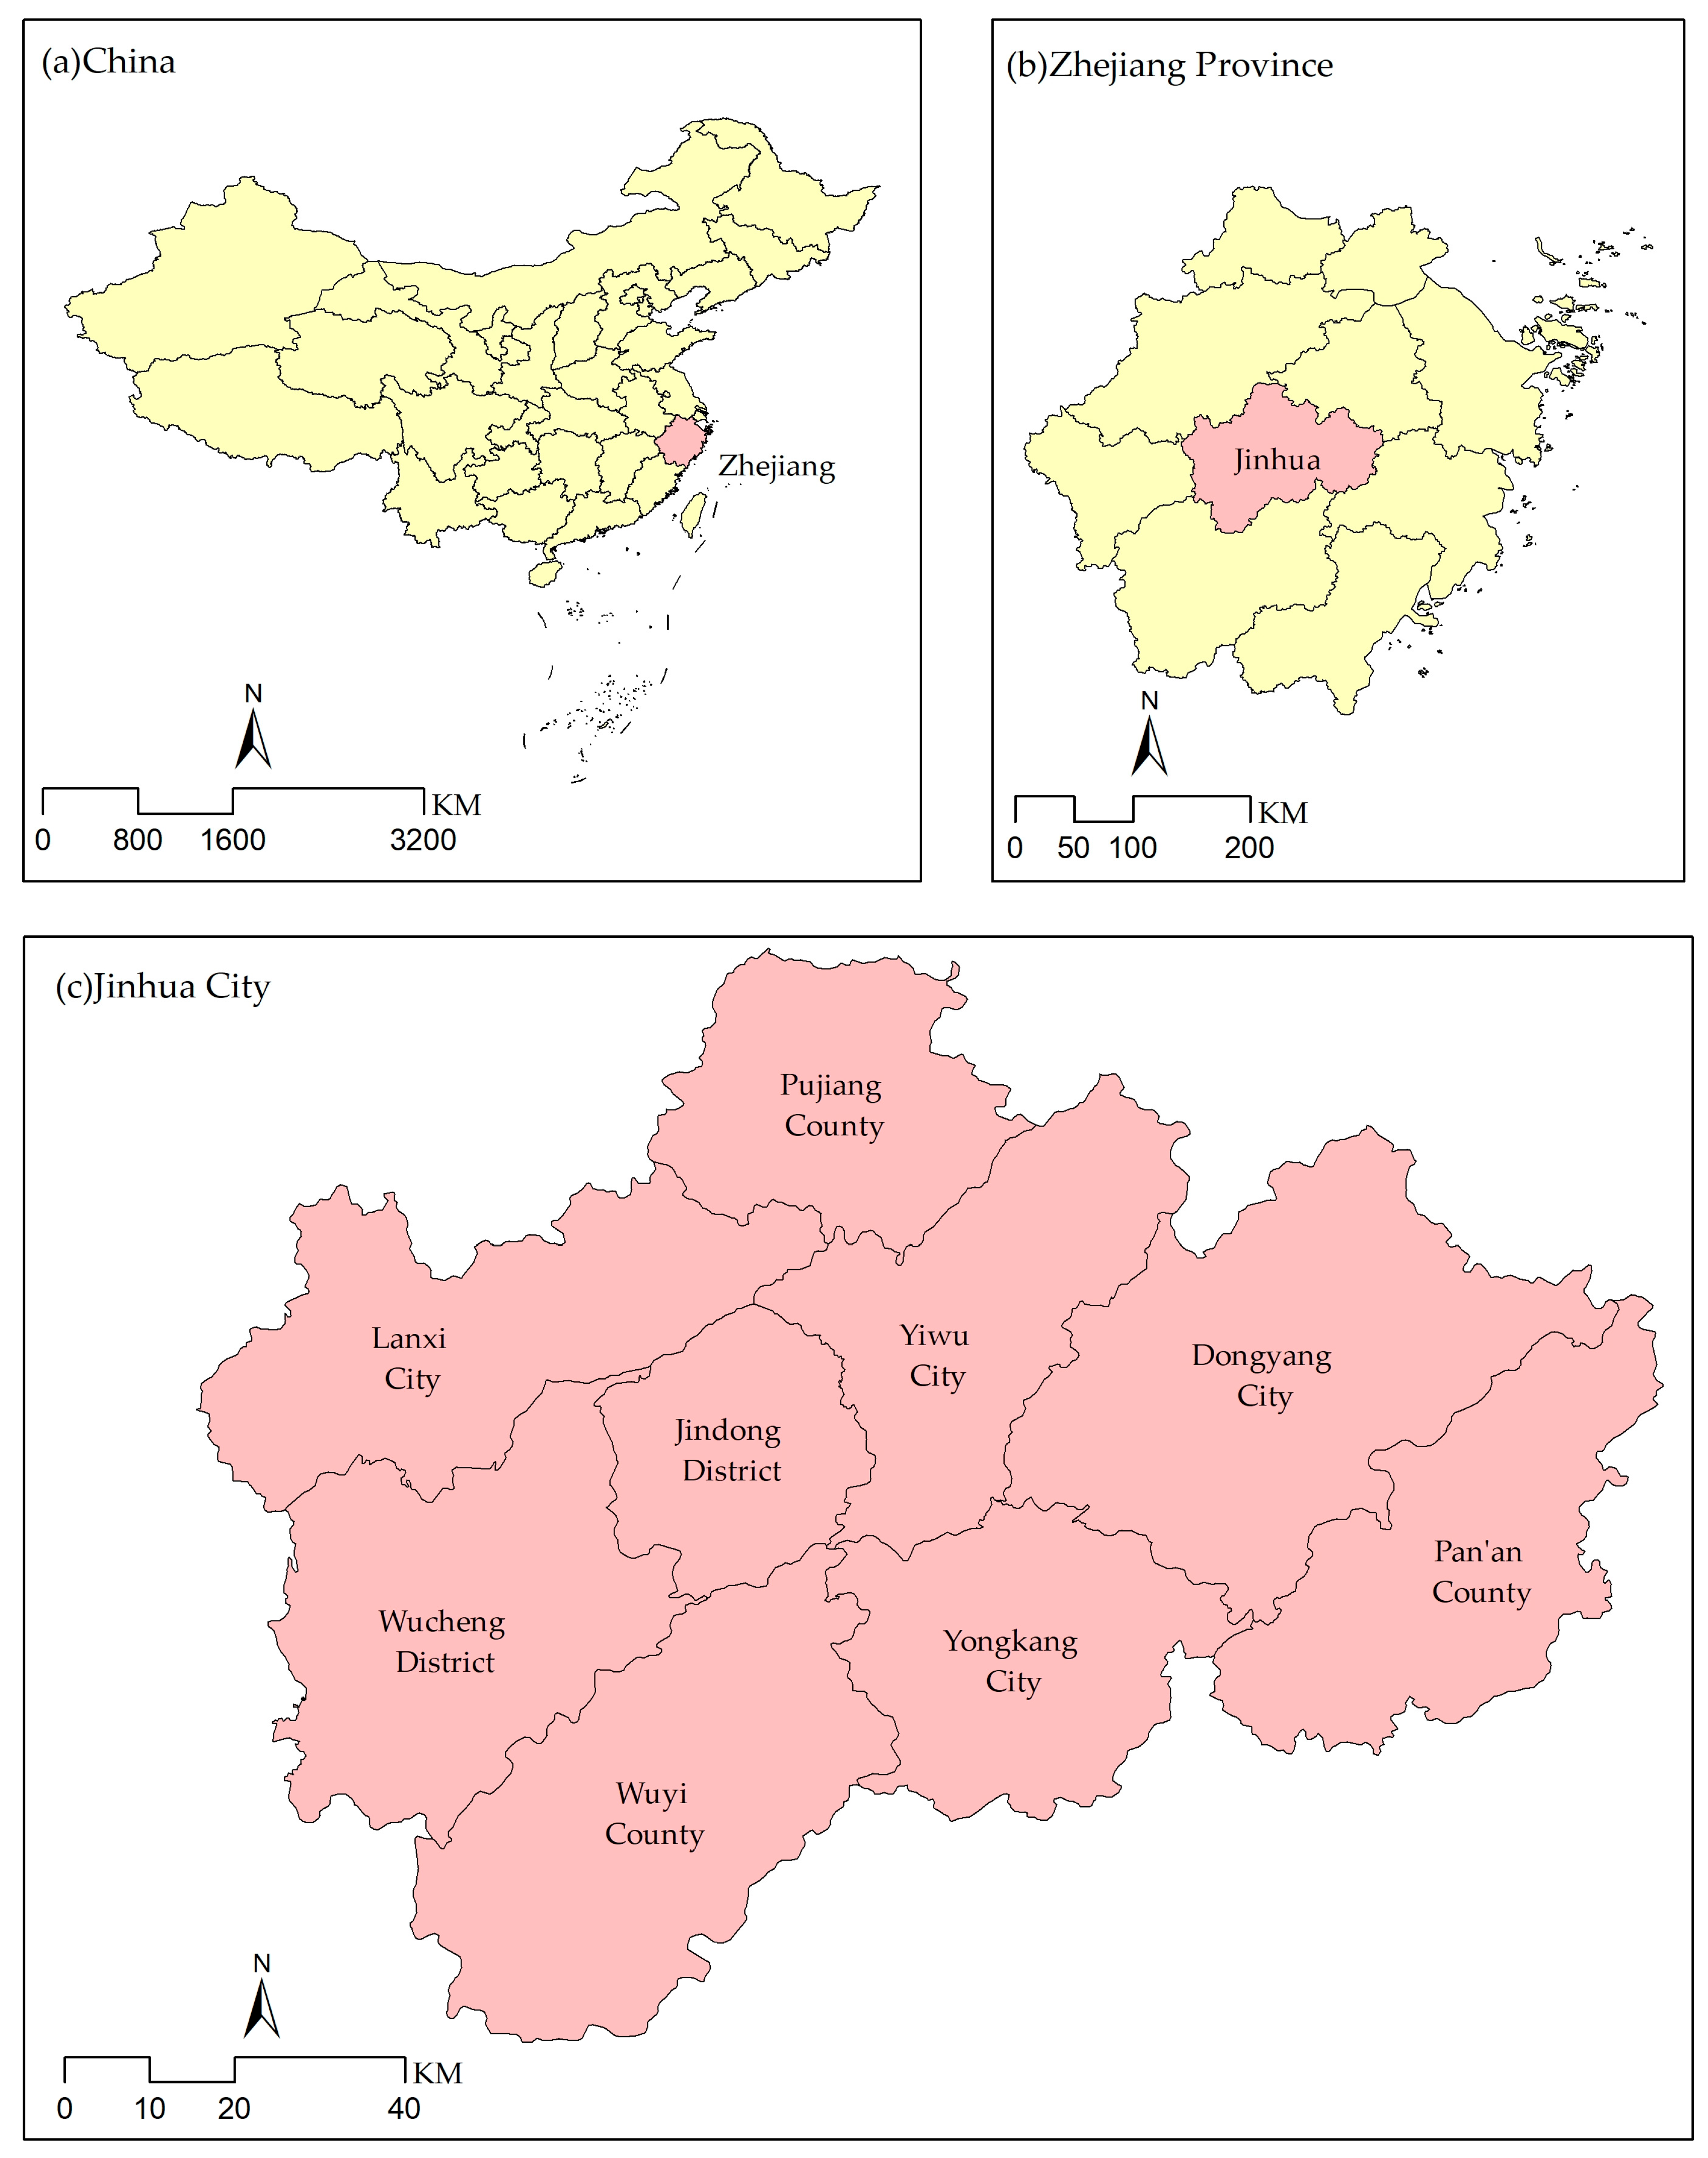
2.1.1. Study Area
2.1.2. Data Sources
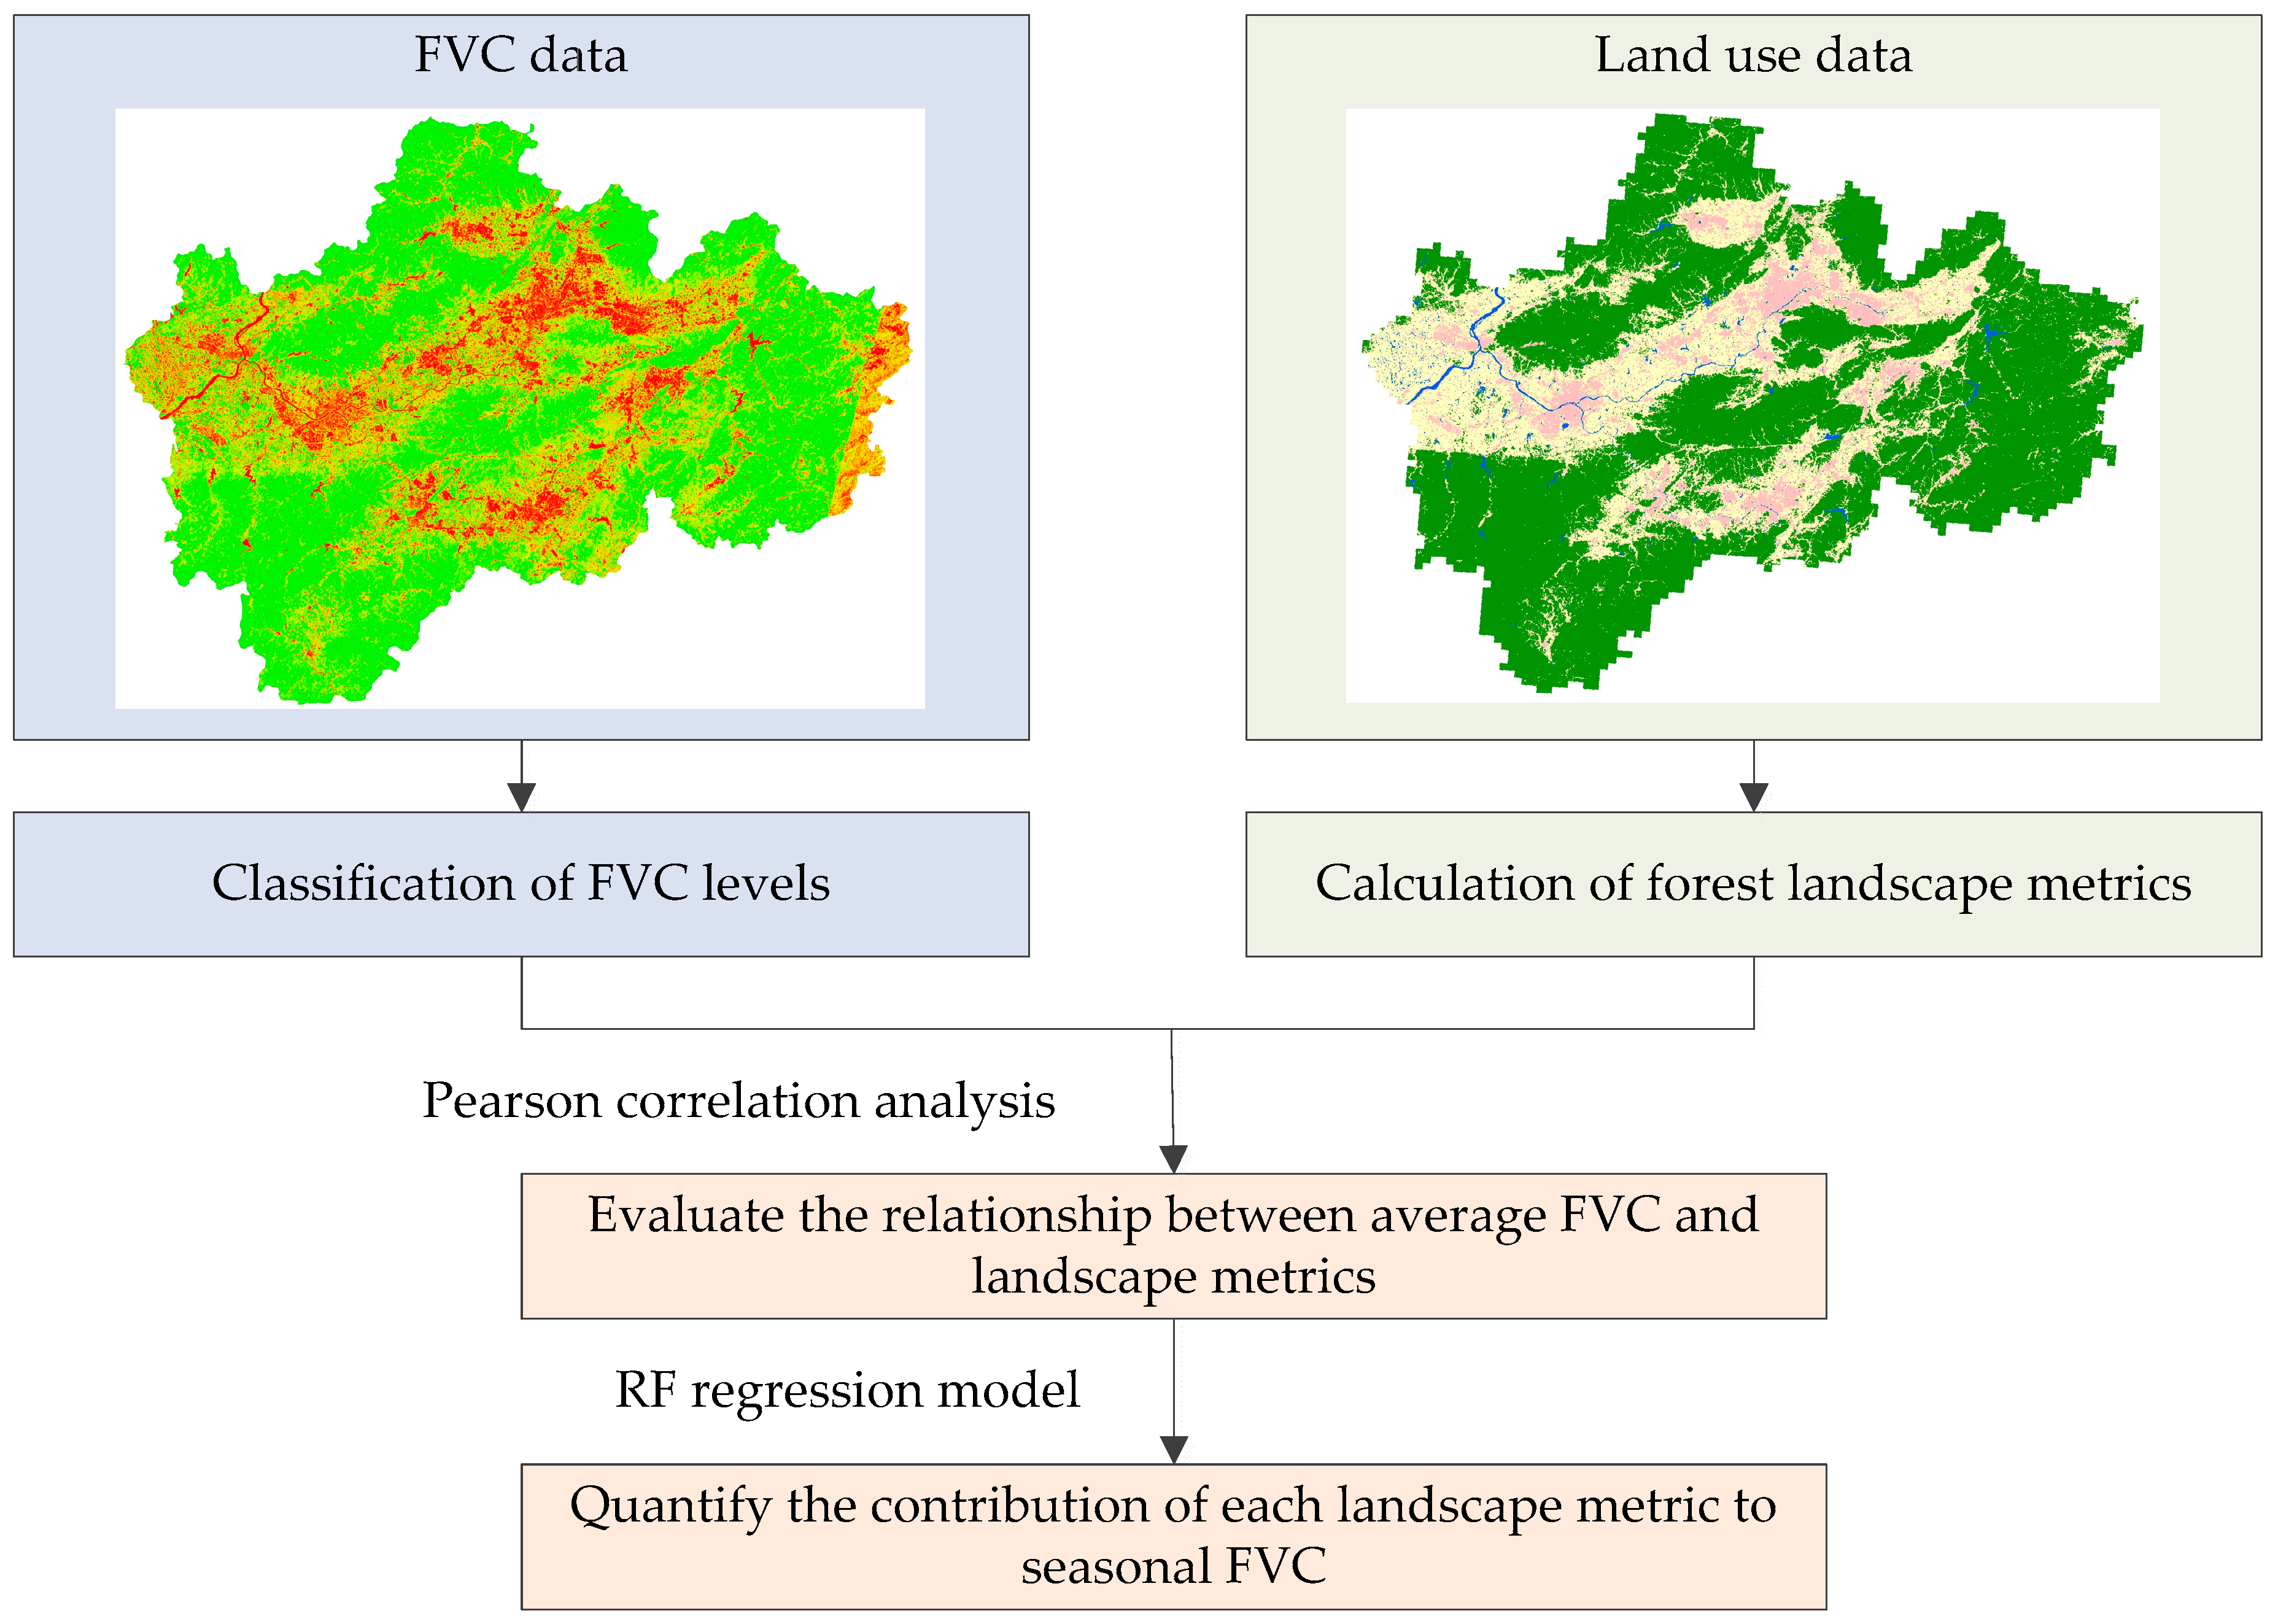
2.2. Methods
2.2.1. Classification of FVC Levels
2.2.2. Calculation of Landscape Metrics
2.2.3. Pearson Correlation Analysis
2.2.4. RF Regression Model
3. Results
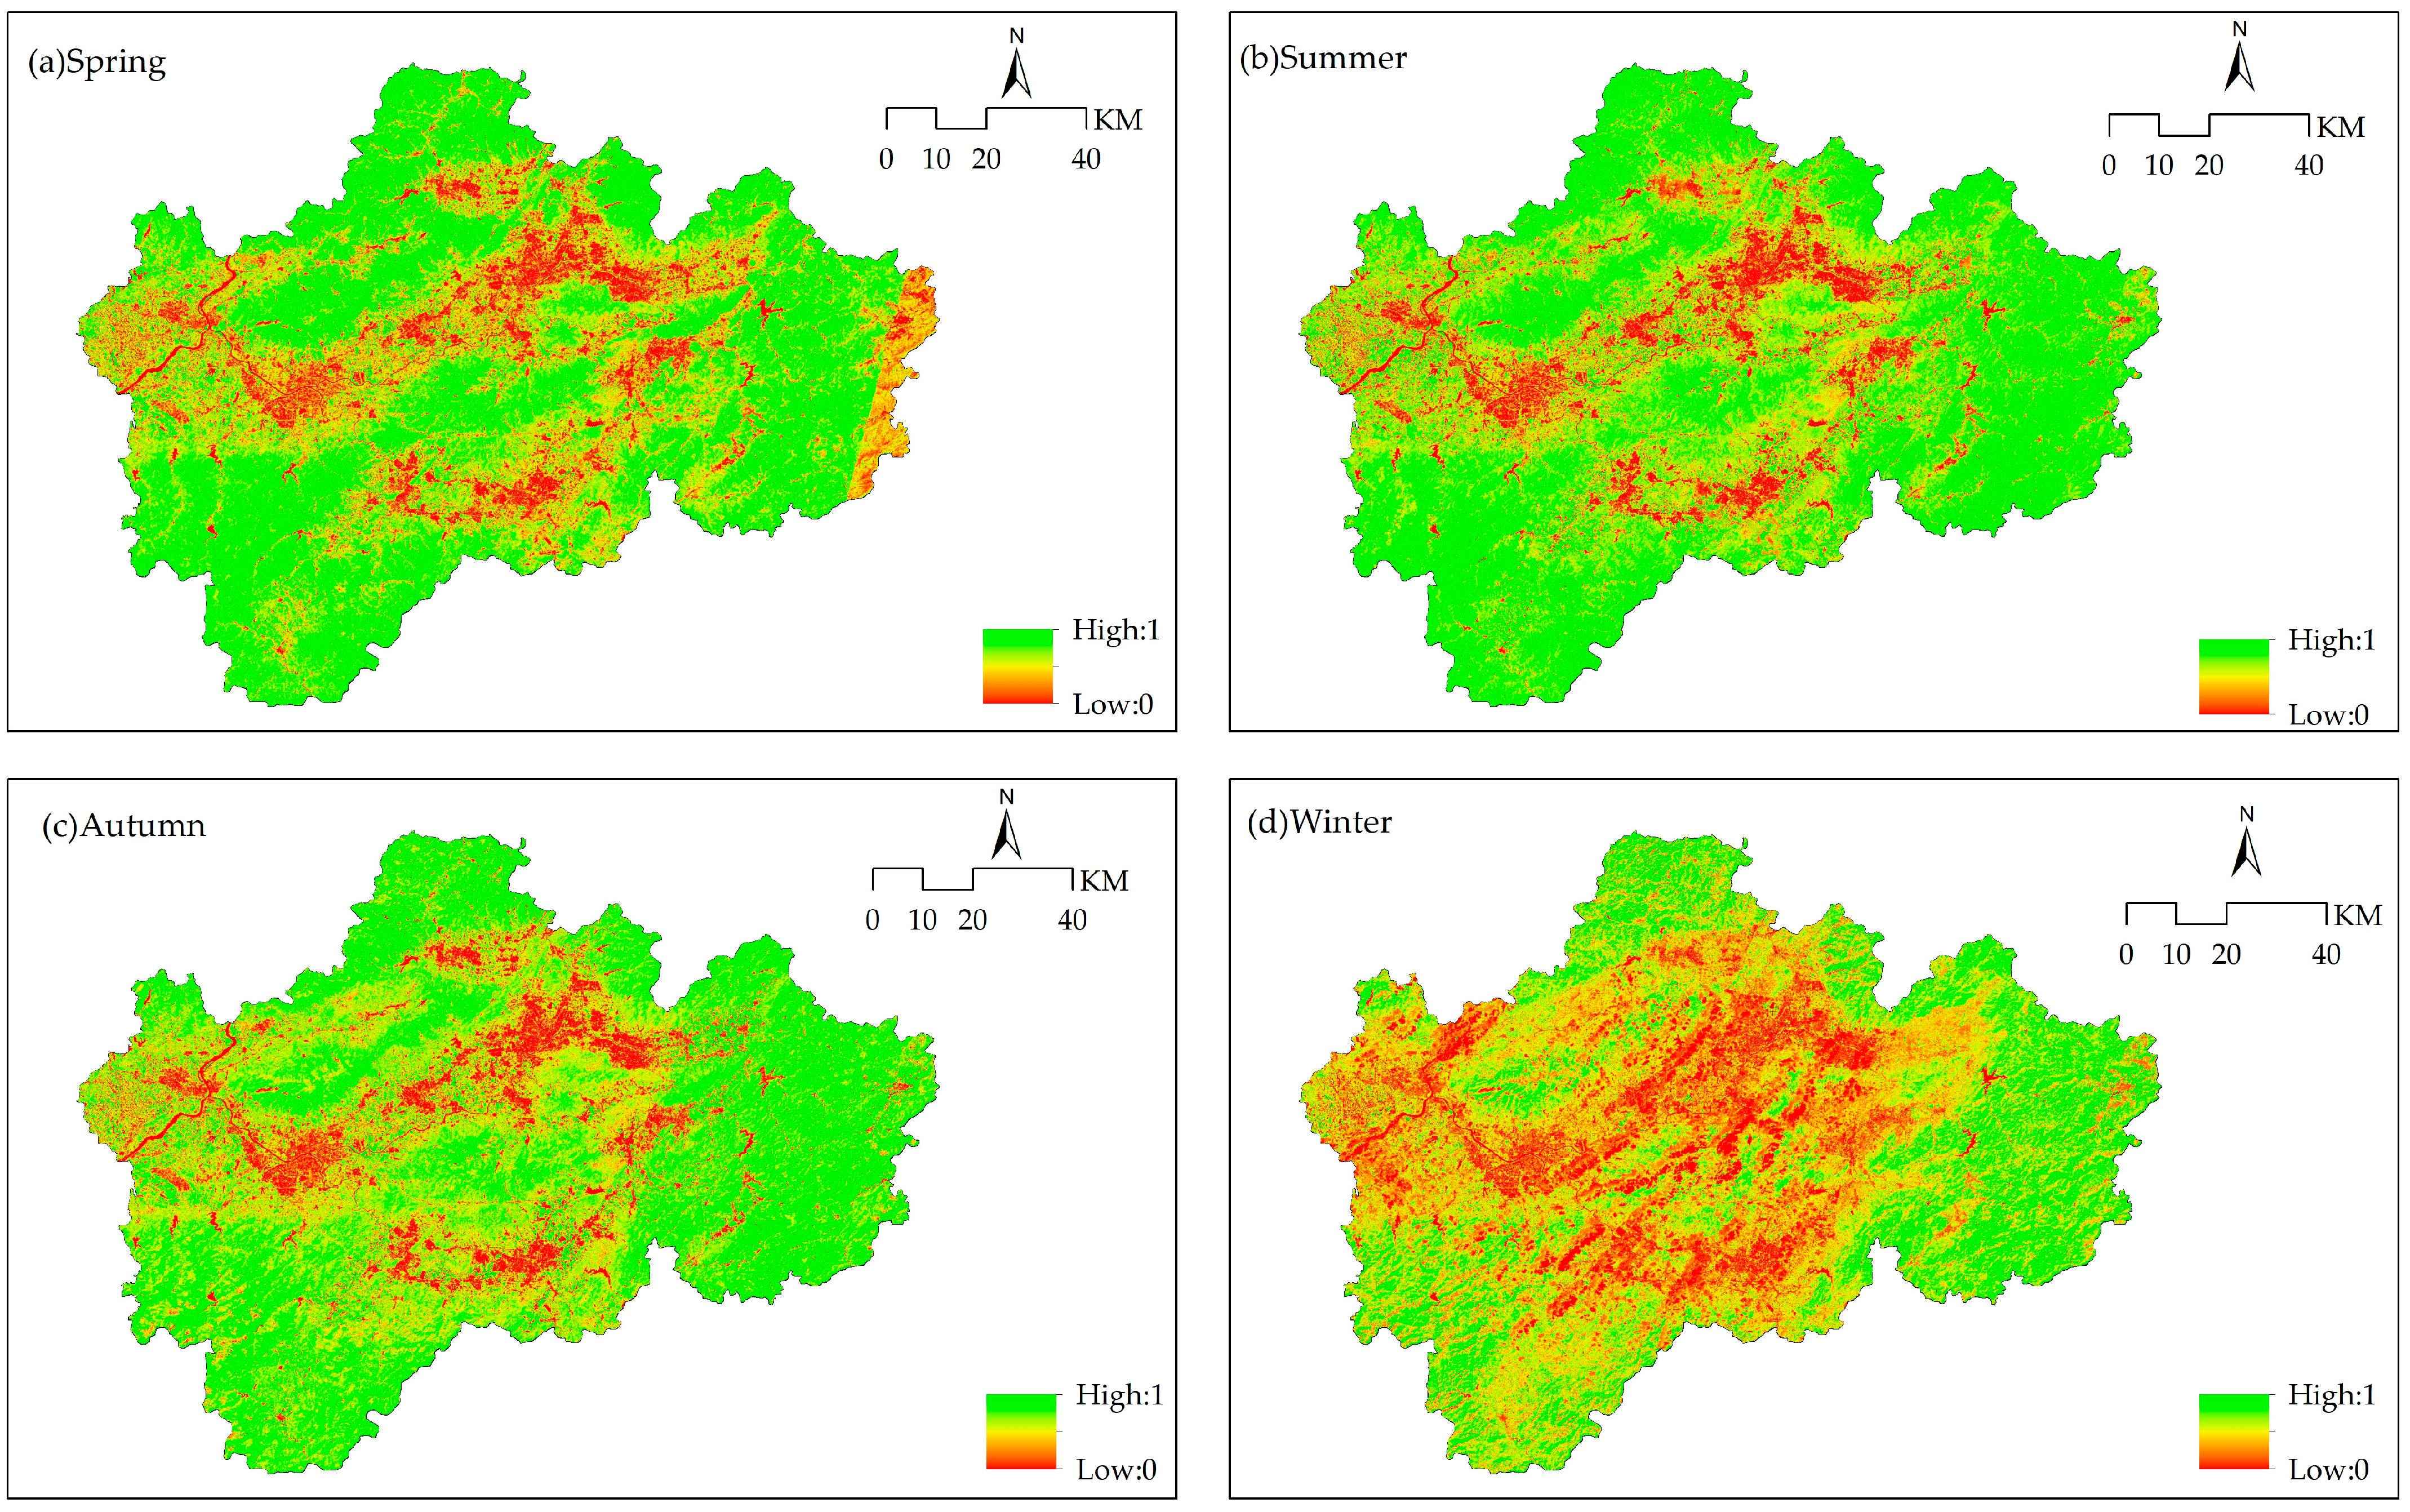
3.1. Spatiotemporal Distribution of FVC
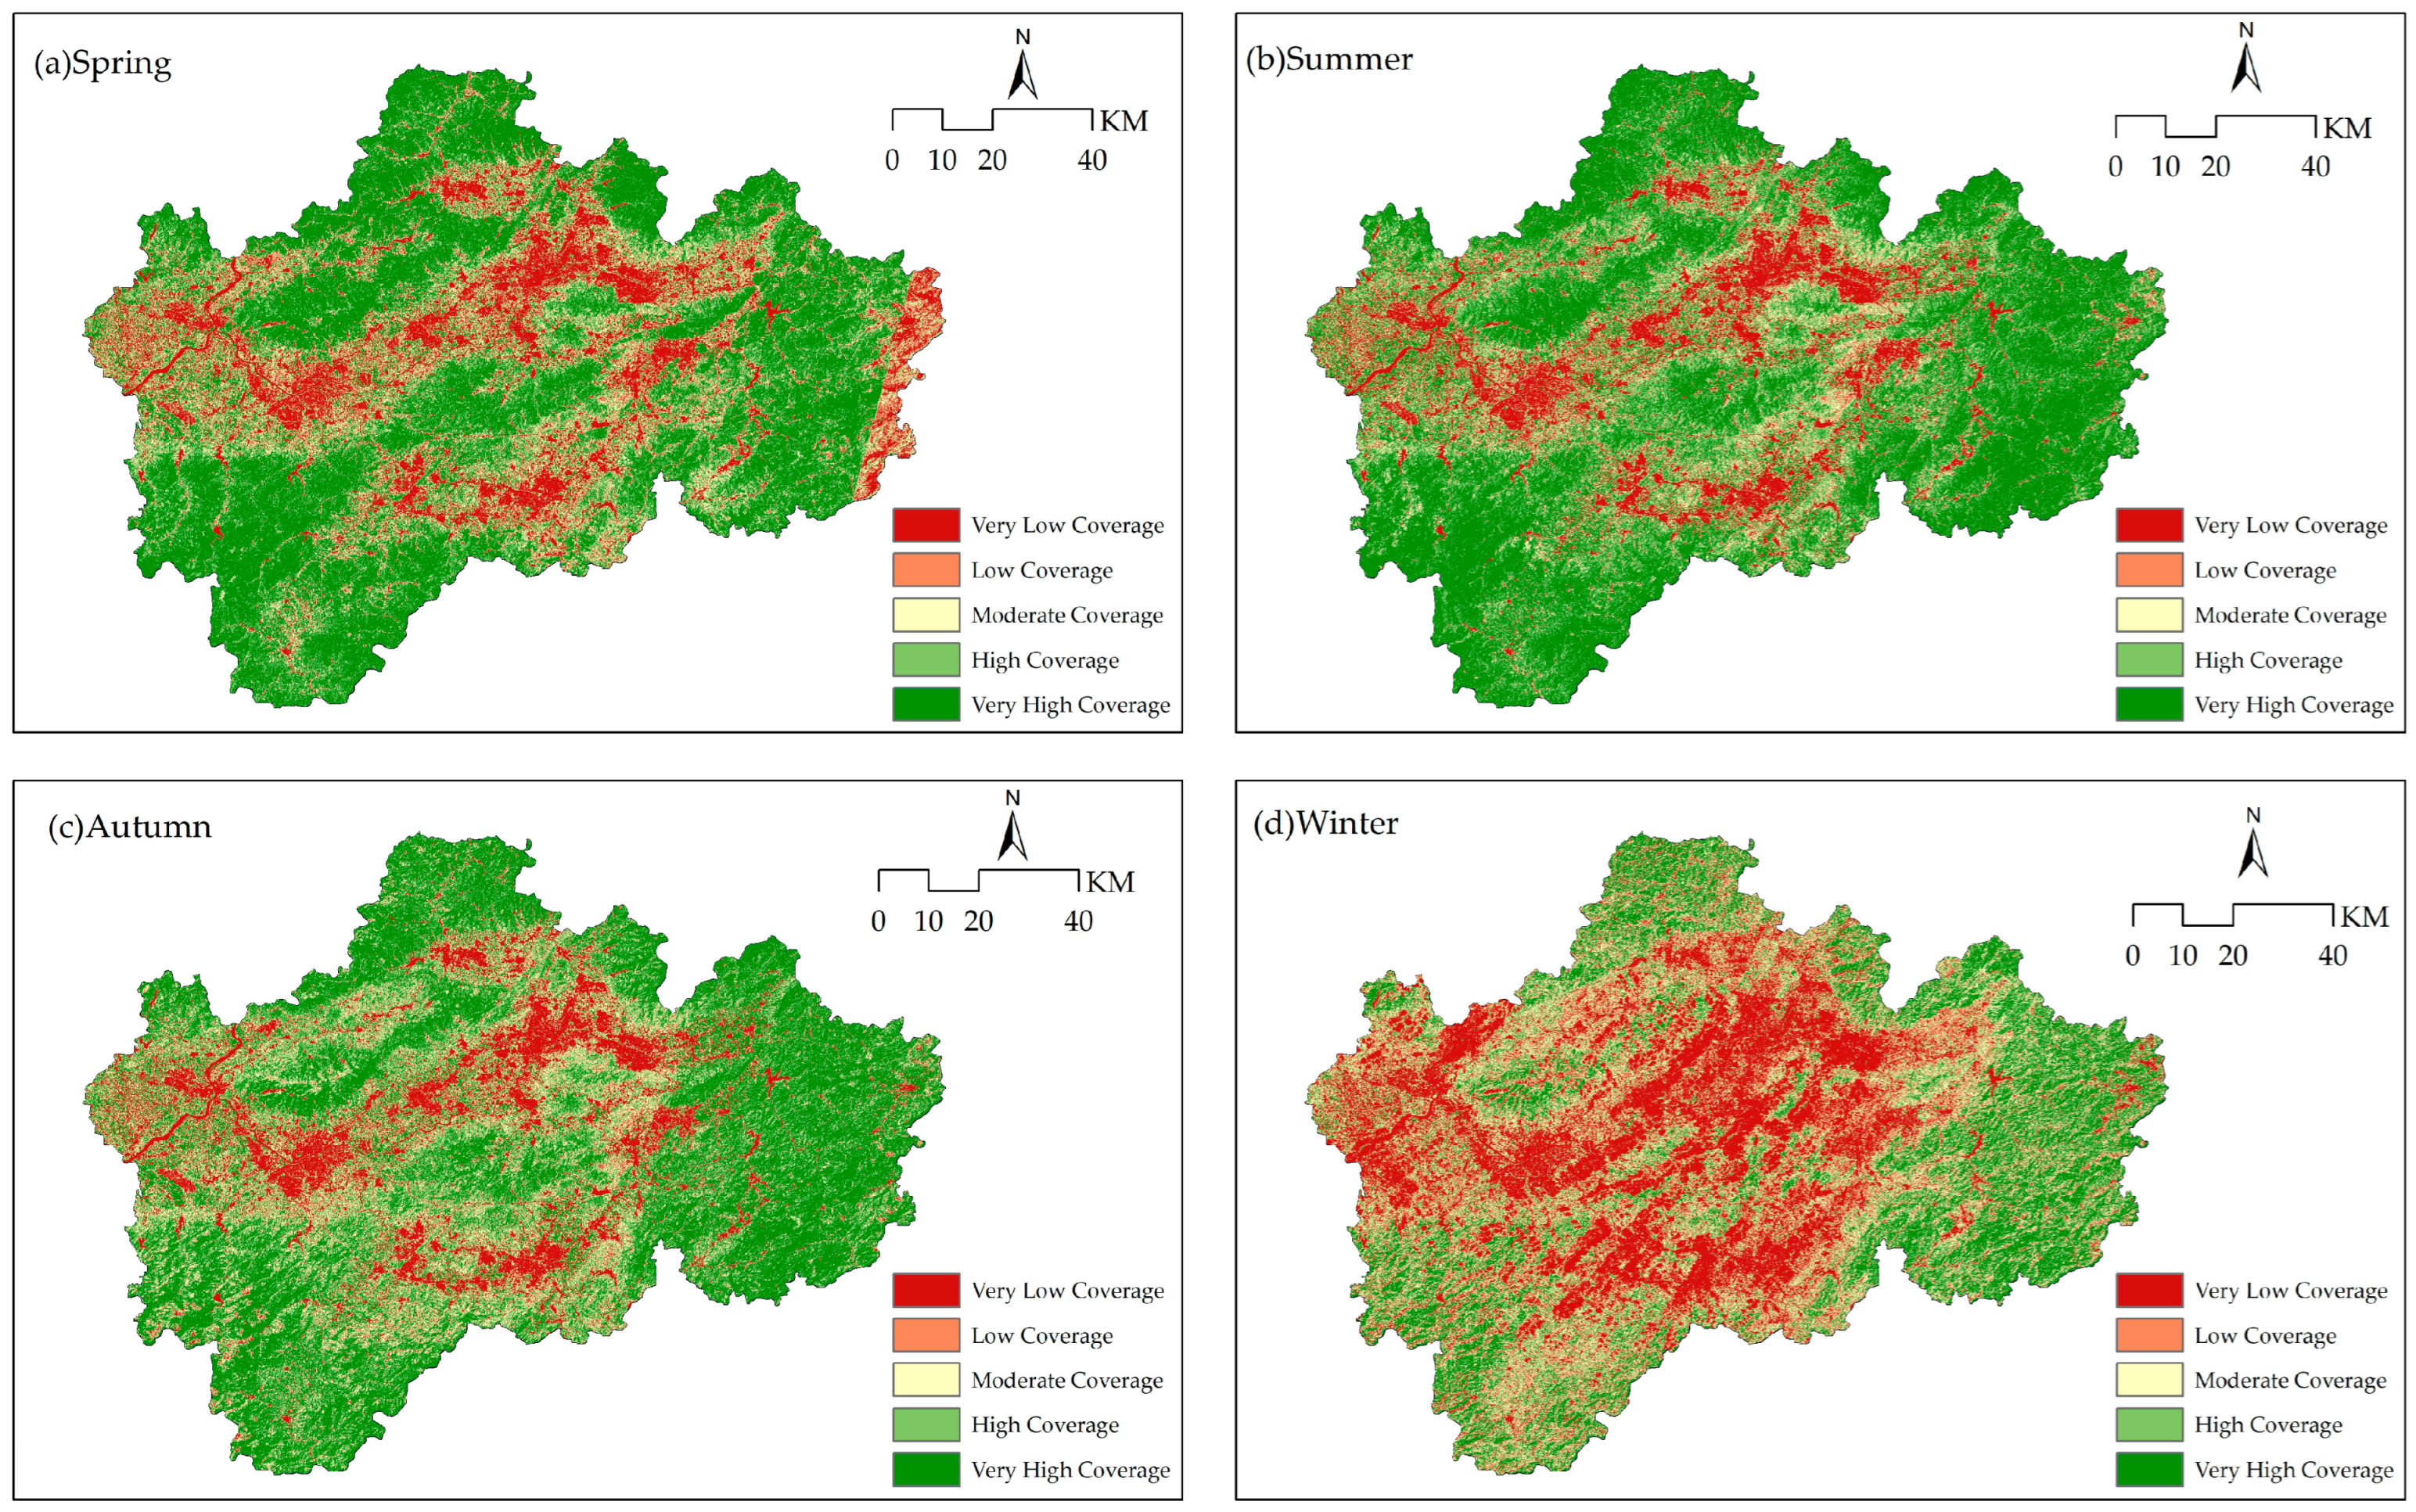
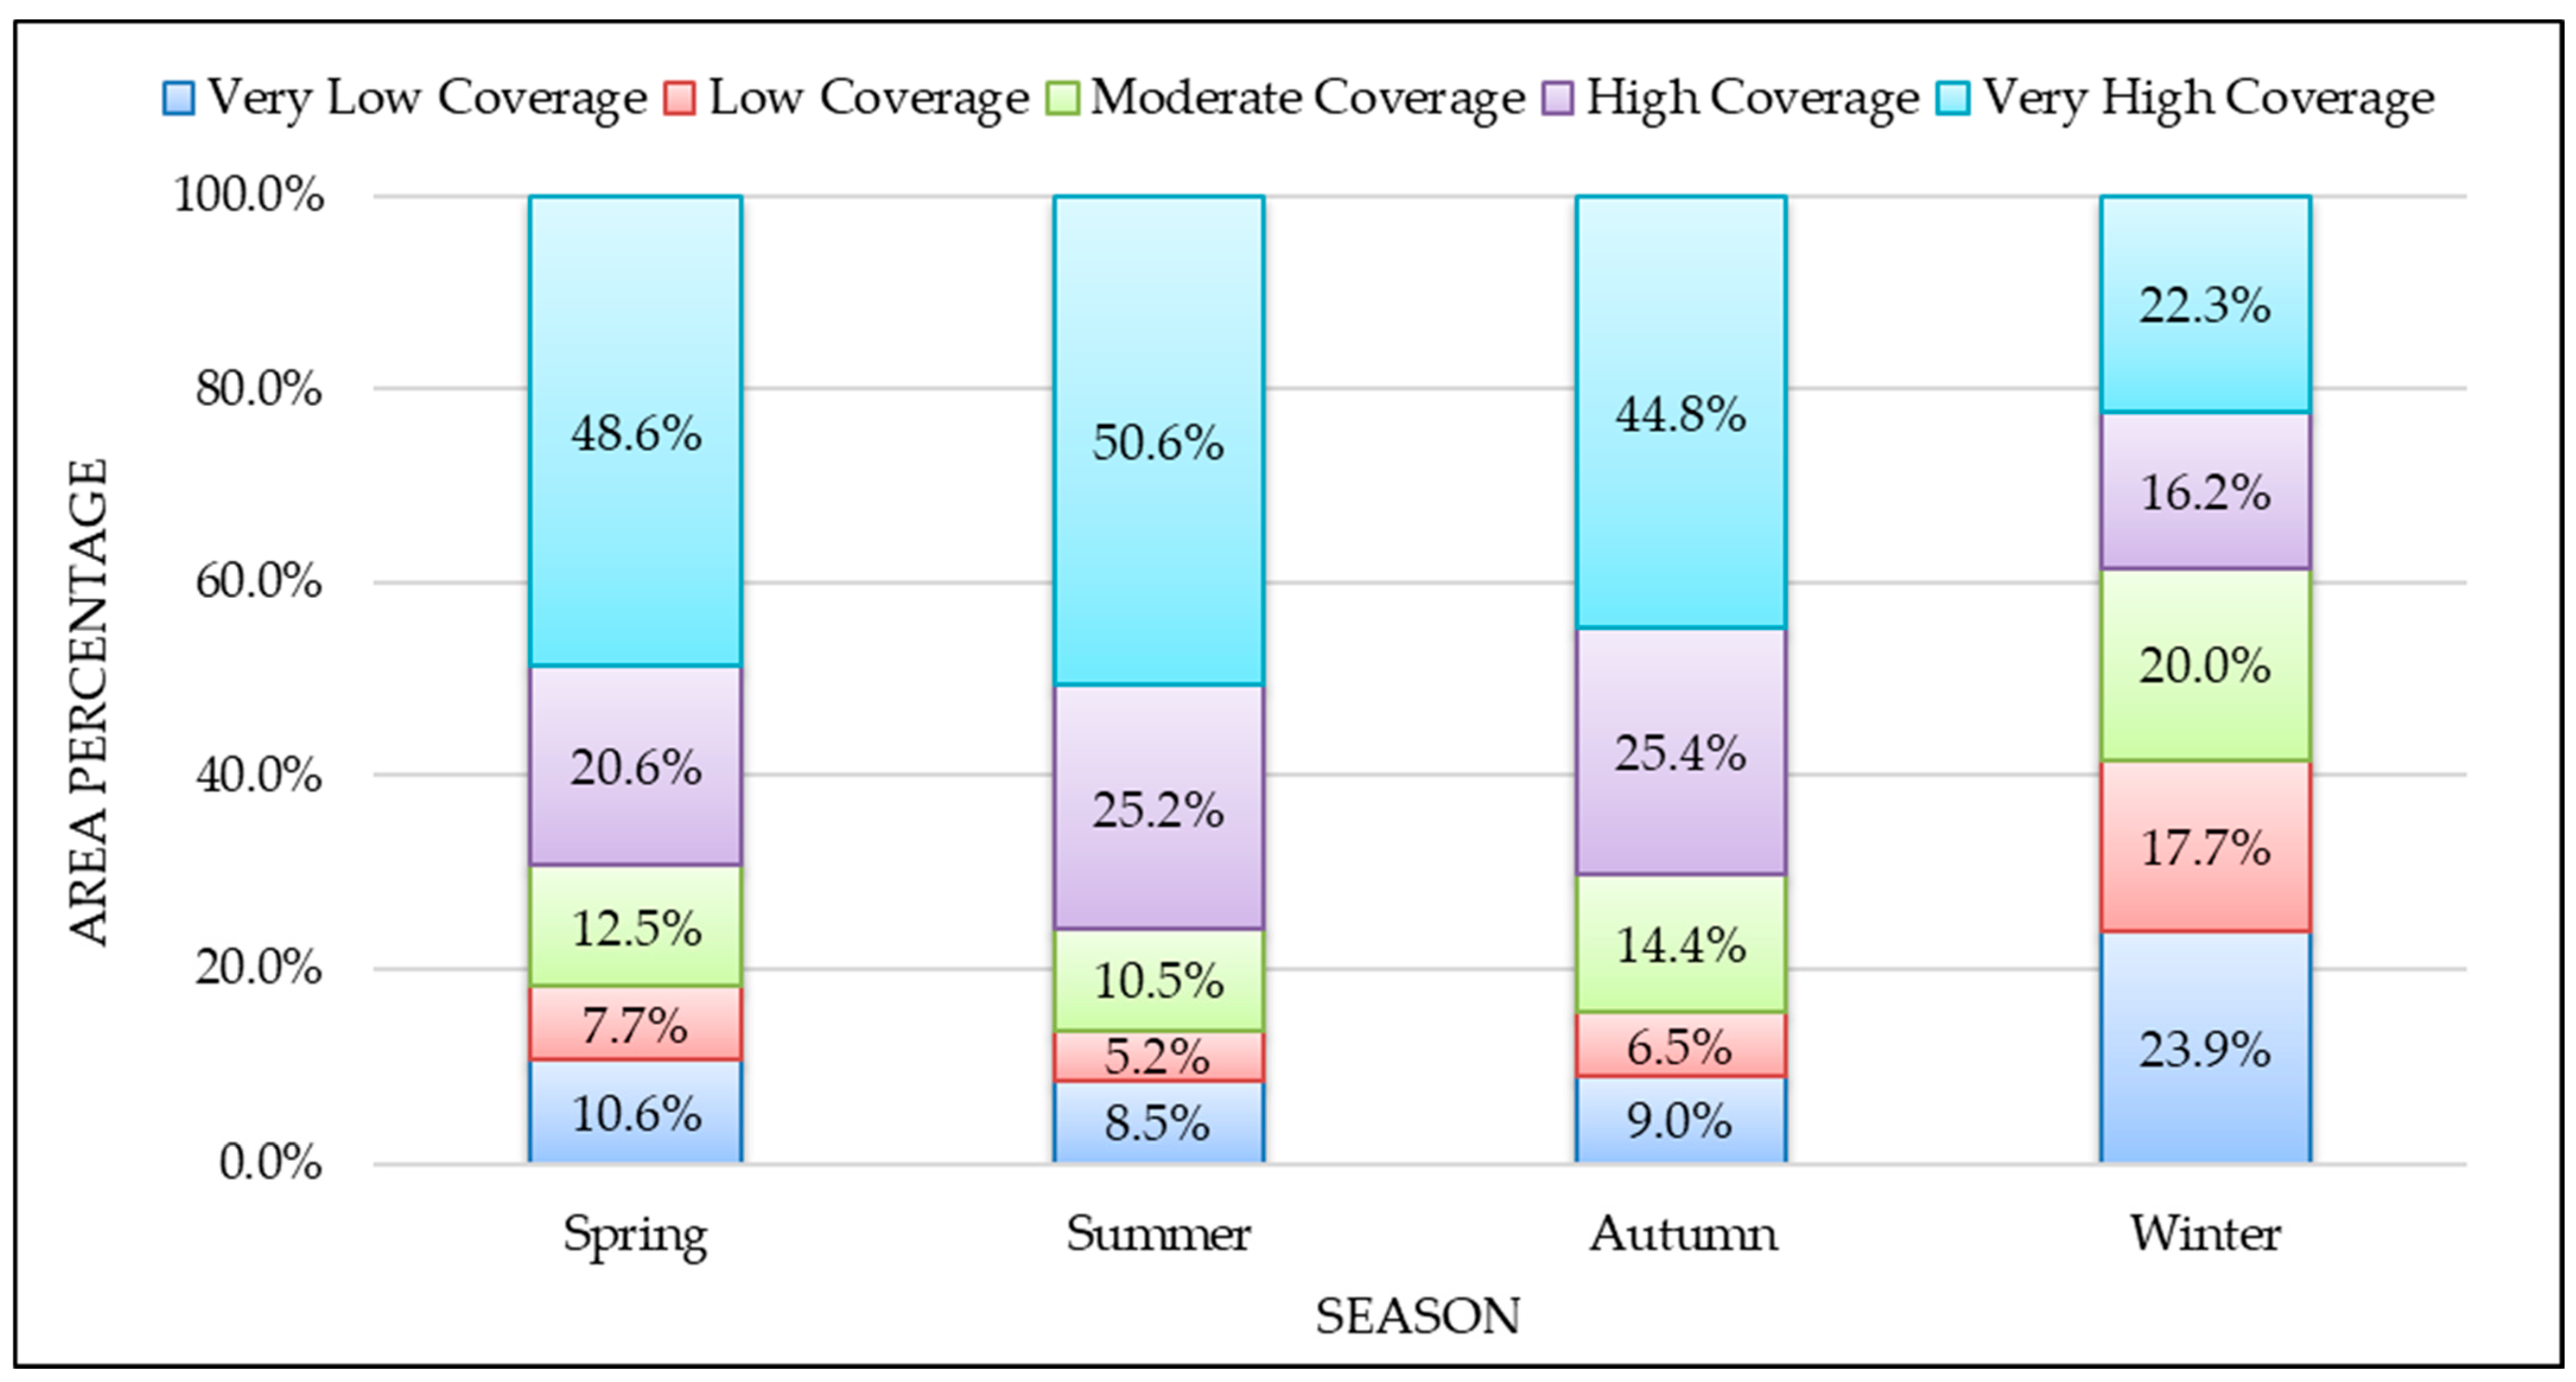
3.2. Classification of FVC
3.3. Pearson Correlation Analysis of Seasonal FVC and Landscape Metrics
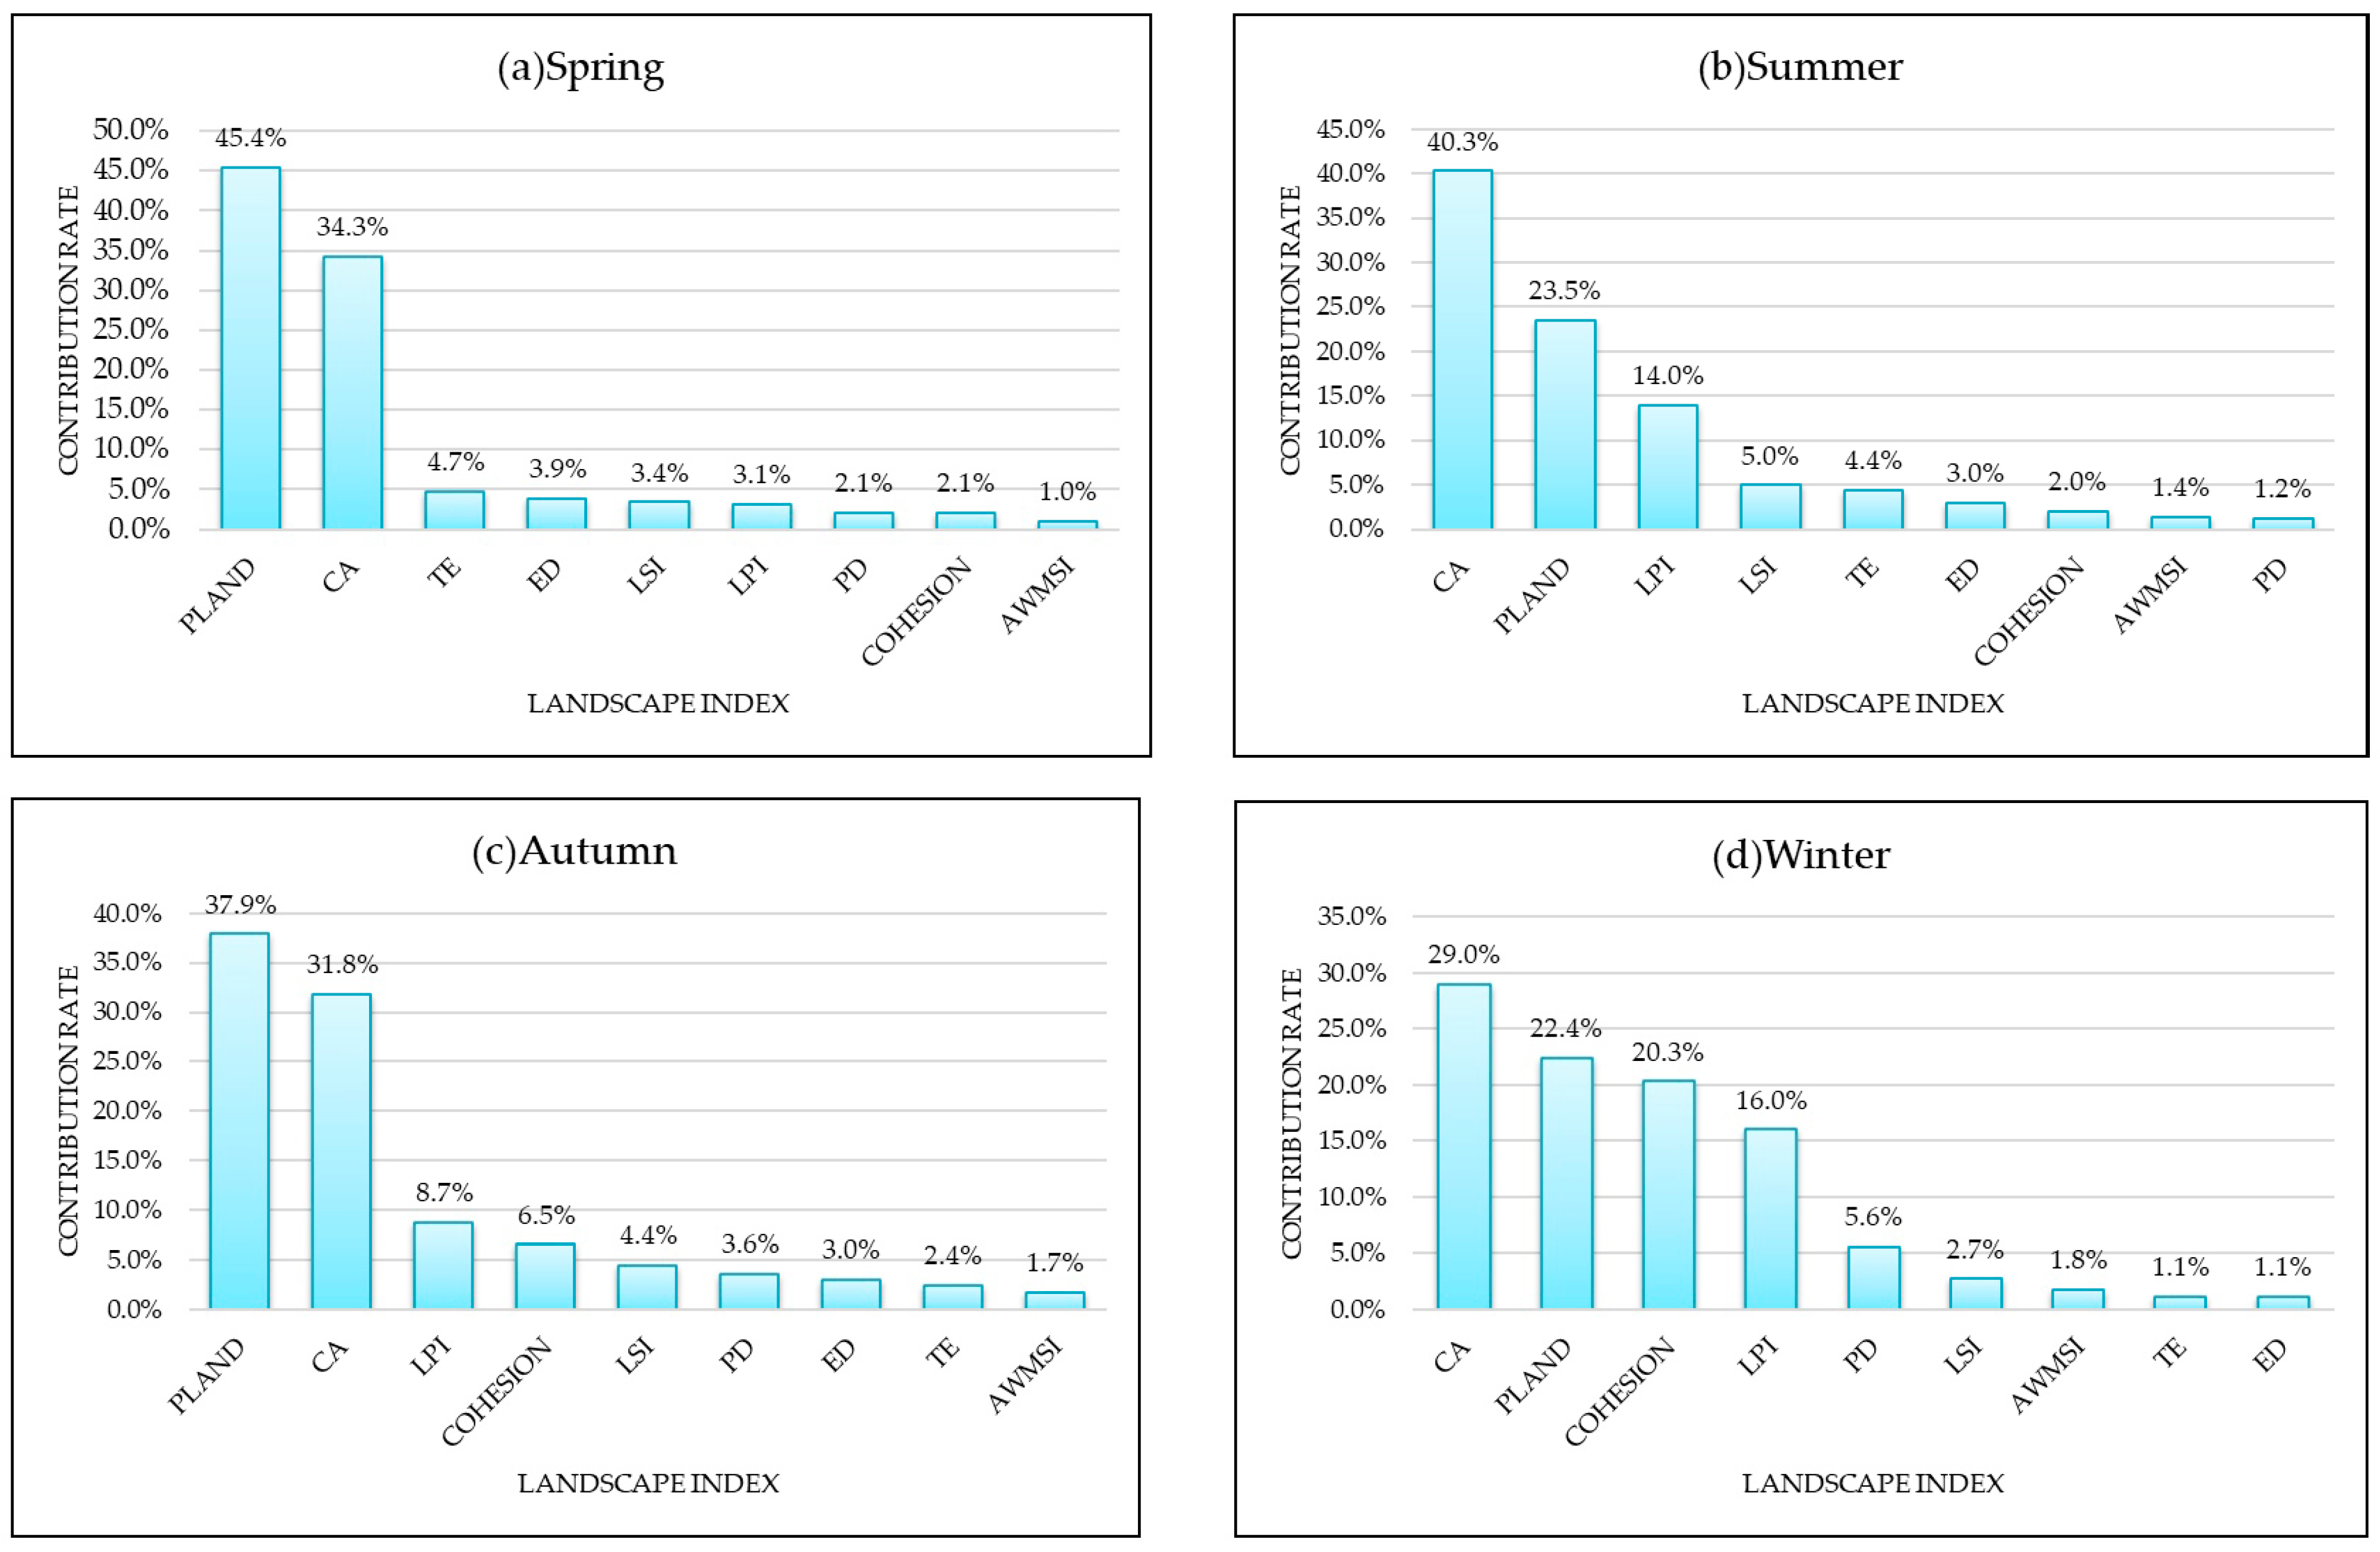
3.4. Contribution Rate of Landscape Metrics to Seasonal FVC
4. Discussion
5. Conclusions
Author Contributions
Funding
Data Availability Statement
Conflicts of Interest
References
- Wang, M.; Liu, J. Evaluation of the potential effects of forest vegetation cover on surface temperature in different geographical and climatic regions of Shaanxi Province, China. CATENA 2025, 255, 109020. [Google Scholar]
- Chen, L.; Li, C.; Pan, C.; Yan, Y.; Jiao, J.; Zhou, Y.; Wang, X.; Zhou, G. Estimating the Effects of Natural and Anthropogenic Activities on Vegetation Cover: Analysis of Zhejiang Province, China, from 2000 to 2022. Remote Sens. 2025, 17, 1433. [Google Scholar]
- Yao, Y.; Yan, J.; Li, G.; Ma, W.; Yao, X.; Song, M.; Li, Q.; Li, J. A GNSS-IR Soil Moisture Inversion Method Considering Multi-Factor Influences Under Different Vegetation Covers. Agriculture 2025, 15, 837. [Google Scholar]
- Gu, R.; Li, X.; Liu, B.; Li, H.; Zhang, Z.; Liu, Y. The crucial role of vegetation cover in shaping the dipole pattern of East Asian summer monsoon changes during the late Pliocene warm period. Quat. Sci. Rev. 2025, 357, 109317. [Google Scholar]
- Hickman, I.; Camac, J.; Venn, S.; Morgan, J. Long-term alpine summit vegetation cover change: Divergent trajectories driven by climate warming and fire. Arct. Antarct. Alp. Res. 2025, 56, 2429864. [Google Scholar]
- Sofue, Y.; Kohsaka, R. Vegetation cover survey methods at cross-roads: Choice of aerial photography or satellite imagery by Japanese municipalities. Environ. Sustain. Indic. 2024, 24, 100471. [Google Scholar]
- Yang, R.; Li, S.; Zhang, B.; Jiao, Q.; Peng, D.; Yang, S.; Yu, R. A Multispectral Feature Selection Method Based on a Dual-Attention Network for the Accurate Estimation of Fractional Vegetation Cover in Winter Wheat. Remote Sens. 2024, 16, 4441. [Google Scholar]
- Roman, L.A.; Catton, I.J.; Greenfield, E.J.; Pearsall, H.; Eisenman, T.S.; Henning, J.G. Linking Urban Tree Cover Change and Local History in a Post-Industrial City. Land 2021, 10, 403. [Google Scholar] [CrossRef]
- Zhao, Y.; Xu, S.; Huang, Z.; Fang, W.; Huang, S.; Huang, P.; Zheng, D.; Dong, J.; Chen, Z.; Yan, C.; et al. Temporal and Spatial Characteristics of Soundscape Ecology in Urban Forest Areas and Its Landscape Spatial Influencing Factors. Forests 2022, 13, 1751. [Google Scholar] [CrossRef]
- Osewe, E.; Popa, B.; Kagombe, J.; Osewe, I.; Abrudan, I. Ecosystem services values for local people in participatory forestry context: The case of karura urban forest reserve. Trees For. People 2025, 20, 100834. [Google Scholar]
- Morato, K.; Morante, J.; Cabral, J.; Heming, N.; Faria, D. Landscape forest cover and local vegetation structure mediate multitrophic relationships but not the leaf damage in cacao trees. For. Ecol. Manag. 2024, 572, 122286. [Google Scholar]
- Lin, Y.; Jin, Y.; Ge, Y.; Hu, X.; Weng, A.; Wen, L.; Zhou, Y.; Li, B. Insights into forest vegetation changes and landscape fragmentation in Southeastern China: From a perspective of spatial coupling and machine learning. Ecol. Indic. 2024, 166, 112479. [Google Scholar]
- Joshi, A.; Ratnam, J.; Paramjyothi, H.; Sankaran, M. Climate and vegetation collectively drive soil respiration in montane forest-grassland landscapes of the southern Western Ghats, India. J. Trop. Ecol. 2024, 40, e16. [Google Scholar]
- Li, Y.; Xue, C.; Shao, H.; Shi, G.; Jiang, N. Study of the Spatiotemporal Variation Characteristics of Forest Landscape Patterns in Shanghai from 2004 to 2014 Based on Multisource Remote Sensing Data. Sustainability 2018, 10, 4397. [Google Scholar] [CrossRef]
- Wang, H.; Wang, H.; Chen, S.; Luo, X.; Liu, B.; Tian, X.; Feng, Y.; Wang, P. Dynamic Change Analysis of Vegetation Coverage and Landscape Pattern Characteristics in Longquan Mountain Urban Forest Park, Chengdu City. Remote Sens. Technol. Appl. 2023, 38, 1455–1466. [Google Scholar]
- Duo, L.; Li, Y.; Zhang, M.; Zhao, Y.; Wu, Z.; Zhao, D. Spatiotemporal Pattern Evolution of Urban Ecosystem Resilience Based on “Resistance-Adaptation-Vitality”: A Case Study of Nanchang City. Front. Earth Sci. 2022, 10, 902444. [Google Scholar]
- Byrne, G.; Broomhall, M.; Walsh, A.J.; Thankappan, M.; Hay, E.; Li, F.; McAtee, B.; Garcia, R.; Anstee, J.; Kerrisk, G.; et al. Validating Digital Earth Australia NBART for the Landsat 9 Underfly of Landsat 8. Remote Sens. 2024, 16, 1233. [Google Scholar]
- Zhao, F.; Xia, L.; Kylling, A.; Li, R.; Shang, H.; Xu, M. Detection flying aircraft from Landsat 8 OLI data. ISPRS J. Photogramm. Remote Sens. 2018, 141, 176–184. [Google Scholar]
- Stuart, W.; Hossain, A.K.M.A.; Hunt, N.; Mix, C.; Qin, H. Spatiotemporal Analysis of Urban Forest in Chattanooga, Tennessee from 1984 to 2021 Using Landsat Satellite Imagery. Remote Sens. 2024, 16, 2419. [Google Scholar]
- Jinhua Overview. Available online: https://www.jinhua.gov.cn/col/col1229159908/index.html (accessed on 20 February 2025).
- Yang, H.; Zeng, H.; Chu, S.; Zhao, Y.; Cai, X. Analysis of Morphological Impacts on Cooling Effects of Urban Water Bodies in Five Cities of Zhejiang. Water 2025, 17, 80. [Google Scholar]
- 2013 Jinhua Municipal National Economic and Social Development Statistical Bulletin. Available online: http://tjj.jinhua.gov.cn/art/2014/2/12/art_1229317894_2979239.html (accessed on 12 February 2014).
- 2023 Jinhua Municipal National Economic and Social Development Statistical Bulletin. Available online: http://tjj.jinhua.gov.cn/art/2024/5/9/art_1229317894_4154037.html (accessed on 9 May 2024).
- Gu, H.; Zhang, W. Quantitative assessment of urban-rural spatiotemporal heterogeneity in air pollutants using GEE multi-source data across the Anhui province, China. Atmos. Pollut. Res. 2025, 16, 102464. [Google Scholar]
- The 30 m Annual Land Cover Datasets and Its Dynamics in China from 1985 to 2023. Available online: https://zenodo.org/records/12779975 (accessed on 1 August 2024).
- Zang, Y.; Wang, K.; Xu, S.; Xiao, W.; Tong, T.; Sun, H.; Li, C. Identification of surface mining and assessment of ecological restoration effects using GEE and Sentinel-2 image data—A case study on Yangtze River watershed, China. Ecol. Eng. 2025, 212, 107525. [Google Scholar]
- Singh, B.M.; Komal, C.; Victorovich, K.A. Crop growth monitoring through Sentinel and Landsat data based NDVI time-series. Comput. Opt. 2020, 44, 409–419. [Google Scholar]
- Hernández-López, D.; Piedelobo, L.; Moreno, M.A.; Chakhar, A.; Ortega-Terol, D.; González-Aguilera, D. Design of a Local Nested Grid for the Optimal Combined Use of Landsat 8 and Sentinel 2 Data. Remote Sens. 2021, 13, 1546. [Google Scholar]
- Huang, S.; Tang, L.; Hupy, J.; Wang, Y.; Shao, G. A commentary review on the use of normalized difference vegetation index (NDVI) in the era of popular remote sensing. J. For. Res. 2021, 32, 1–6. [Google Scholar]
- Zea, P.; Pascual, C.; García-Montero, L.G.; Cedillo, H. NDVI Performance for Monitoring Agricultural Energy Inputs Using Landsat Imagery: A Study in the Ecuadorian Andes (2012–2023). Sustainability 2025, 17, 3480. [Google Scholar] [CrossRef]
- Yao, Y.; Shen, J.; Yue, J.; Liu, Y.; Feng, H.; Shu, M.; Fu, Y.; Qiao, H.; Sun, T.; Zheng, G. Remotely estimate the cropland fractional vegetation cover using linear spectral mixture analysis and improved band operations. Int. J. Remote Sens. 2025, 46, 3466–3486. [Google Scholar]
- Liu, Z.; Bi, H.; Zhao, D.; Guan, N.; Wang, N.; Song, Y. Determination of Fractional Vegetation Cover Threshold Based on the Integrated Synergy–Supply Capacity of Ecosystem Services. Forests 2025, 16, 587. [Google Scholar] [CrossRef]
- Lin, R.; Xu, X.; Zhang, X.; Hu, Z.; Wang, G.; Shi, Y.; Zhao, X.; Sang, H. Surface Soil Moisture Estimation Taking into Account the Land Use and Fractional Vegetation Cover by Multi-Source Remote Sensing. Agriculture 2025, 15, 497. [Google Scholar] [CrossRef]
- He, Z.; Lin, Z.; Xu, Q.; Ding, S.; Bao, X.; Li, X.; Hu, X.; Li, J. Multi-Dimensional Landscape Connectivity Index for Prioritizing Forest Cover Change Scenarios: A Case Study of Southeast China. Forests 2024, 15, 1490. [Google Scholar] [CrossRef]
- Zhong, J.; Li, X.; Liu, W.; Zhang, F.; Huang, F.; Xu, S.; Xiao, S.; Wang, Q. Effects of urbanization intensity on forest vegetation characteristics and landscape pattern indices in Nanchang. Chin. J. Ecol. 2024, 43, 2285–2294. [Google Scholar]
- Malcangi, F.; Lindén, A.; Sundell, J.; Loehr, J. Correlation between mammal track abundance and Forest Landscape Integrity Index validates actual forest ecological integrity. Oecologia 2024, 206, 61–72. [Google Scholar]
- He, X.; Huang, B.; Peng, L.; Chen, J. Studies on Submersible Short-Circuit Blowing Based on Orthogonal Experiments, Back Propagation Neural Network Prediction, and Pearson Correlation Analysis. Appl. Sci. 2024, 14, 10321. [Google Scholar]
- Wang, X.; Yao, Y.; Li, Z.; Su, C.; Tian, Y. Protocol Reverse Analysis of Ethernet for Control Automation Technology Based on Sequence Alignment and Pearson Correlation Coefficient. Sensors 2024, 24, 7922. [Google Scholar] [CrossRef]
- Shi, Z.; Xiao, J.; Jiang, J.; Zhang, Y.; Zhou, Y. Identifying Reliability High-Correlated Gates of Logic Circuits with Pearson Correlation Coefficient. IEEE Trans. Circuits Syst. II 2024, 71, 2319–2323. [Google Scholar]
- Zhao, Z.; Kantono, K.; Kam, R.; Le, T.T.; Kitundu, E.; Chen, T.; Hamid, N. Improving the Bioactivities of Apricot Kernels Through Fermentation: Investigating the Relationship Between Bioactivities, Polyphenols, and Amino Acids Through the Random Forest Regression XAI Approach. Foods 2025, 14, 845. [Google Scholar] [CrossRef]
- Qiao, Y.; Sun, H.; Qi, J.; Liu, S.; Li, J.; Ji, Y.; Wang, H.; Peng, Y. Examining water bodies’ cooling effect in urban parks with buffer analysis and random forest regression. Urban Clim. 2025, 59, 102301. [Google Scholar]
- Fan, C.; Wu, Q.; Zhang, G.; Zeng, J. Construction and test of mango fruit shape identification platform based on 3D point cloud data. Trans. Chin. Soc. Agric. Eng. 2024, 40, 290–296. [Google Scholar]
- Zhang, Y.; Ge, J.; Bai, X.; Wang, S. Blue-Green space seasonal influence on land surface temperatures across different urban functional zones: Integrating Random Forest and geographically weighted regression. J. Environ. Manag. 2025, 374, 123975. [Google Scholar]
- Brown, M.; Peterson, M.; Tezaur, I.; Peterson, K.; Bull, D. Random forest regression feature importance for climate impact pathway detection. J. Comput. Appl. Math. 2025, 464, 116479. [Google Scholar]
- Scriven, S.; Carlson, K.; Hodgson, J.; McClean, C.; Heilmayr, R.; Lucey, J.; Hill, J. Testing the benefits of conservation set-asides for improved habitat connectivity in tropical agricultural landscapes. J. Appl. Ecol. 2019, 56, 2274–2285. [Google Scholar] [PubMed]
- Cui, L.; Zhao, Y.; Liu, J.; Wang, H.; Han, L.; Li, J.; Sun, Z. Vegetation Coverage Prediction for the Qinling Mountains Using the CA–Markov Model. ISPRS Int. J. Geo-Inf. 2021, 10, 679. [Google Scholar]
- Yirigui, Y.; Lee, S.-W.; Nejadhashemi, A.P. Multi-Scale Assessment of Relationships between Fragmentation of Riparian Forests and Biological Conditions in Streams. Sustainability 2019, 11, 5060. [Google Scholar] [CrossRef]
- Zhao, J.; Liu, S.; Wang, Z.; Gao, H.; Feng, S.; Wei, B.; Hou, Z.; Xiao, F.; Jing, L.; Liao, X. The Impact of Land Use and Landscape Pattern on Ecosystem Services in the Dongting Lake Region, China. Remote Sens. 2023, 15, 2228. [Google Scholar]
- Calamari, N.; Vilella, F.; Sica, Y.; Mercuri, P. Patch and landscape responses of bird abundance to fragmentation in agroecosystems of east-central Argentina. Avian Conserv. Ecol. 2019, 13, 3. [Google Scholar]
- Faye, B.; Du, G.; Li, Q.; Faye, H.V.M.T.; Diéne, J.C.; Mbaye, E.; Seck, H.M. Lessons Learnt from the Influencing Factors of Forested Areas’ Vulnerability under Climatic Change and Human Pressure in Arid Areas: A Case Study of the Thiès Region, Senegal. Appl. Sci. 2024, 14, 2427. [Google Scholar]
- Wang, F.; Wang, K. Assessing the Effect of Eco-City Practices on Urban Sustainability Using an Extended Ecological Footprint Model: A Case Study in Xi’an, China. Sustainability 2017, 9, 1591. [Google Scholar]
- Lee, P.S.-H.; Park, J. An Effect of Urban Forest on Urban Thermal Environment in Seoul, South Korea, Based on Landsat Imagery Analysis. Forests 2020, 11, 630. [Google Scholar] [CrossRef]
- Cao, W.; Huang, L.; Liu, L.; Zhai, J.; Wu, D. Overestimating Impacts of Urbanization on Regional Temperatures in Developing Megacity: Beijing as an Example. Adv. Meteorol. 2019, 2019, 3985715. [Google Scholar]
- Jaworek-Jakubska, J.; Filipiak, M.; Michalski, A.; Napierała-Filipiak, A. Spatio-Temporal Changes of Urban Forests and Planning Evolution in a Highly Dynamical Urban Area: The Case Study of Wrocław, Poland. Forests 2020, 11, 17. [Google Scholar]


| FVC | Level |
|---|---|
| FVC < 30% | Very Low Coverage |
| 30% ≤ FVC < 45% | Low Coverage |
| 45% ≤ FVC < 60% | Moderate Coverage |
| 60% ≤ FVC < 75% | High Coverage |
| 75% ≤ FVC | Very High Coverage |
| City | Spring | Summer | Autumn | Winter |
|---|---|---|---|---|
| Jinhua | 0.65 | 0.67 | 0.65 | 0.49 |
| Wucheng | 0.67 | 0.67 | 0.63 | 0.48 |
| Jindong | 0.58 | 0.57 | 0.56 | 0.35 |
| Wuyi | 0.73 | 0.74 | 0.69 | 0.50 |
| Pujiang | 0.74 | 0.73 | 0.71 | 0.58 |
| Pan’an | 0.67 | 0.80 | 0.79 | 0.71 |
| Lanxi | 0.63 | 0.62 | 0.60 | 0.43 |
| Yiwu | 0.56 | 0.55 | 0.54 | 0.35 |
| Dongyang | 0.64 | 0.66 | 0.67 | 0.54 |
| Yongkang | 0.58 | 0.61 | 0.59 | 0.43 |
| Land Use Type | Spring | Summer | Autumn | Winter |
|---|---|---|---|---|
| Cropland | 0.53 | 0.60 | 0.59 | 0.37 |
| Forest | 0.77 | 0.79 | 0.76 | 0.63 |
| Water | 0.04 | 0.05 | 0.02 | 0.01 |
| Impervious surfaces | 0.14 | 0.15 | 0.13 | 0.12 |
| Landscape Indices | Spring | Summer | Autumn | Winter |
|---|---|---|---|---|
| CA | 0.842 | 0.826 | 0.799 | 0.731 |
| TE | −0.113 | −0.092 | −0.072 | −0.120 |
| PLAND | 0.842 | 0.826 | 0.799 | 0.731 |
| LPI | 0.838 | 0.820 | 0.793 | 0.730 |
| LSI | −0.352 | −0.321 | −0.305 | −0.346 |
| PD | −0.354 | −0.324 | −0.324 | −0.368 |
| ED | −0.113 | −0.092 | −0.072 | −0.120 |
| AWMSI | −0.088 | −0.070 | −0.041 | −0.072 |
| COHESION | 0.656 | 0.662 | 0.643 | 0.558 |
| Season | Dataset | MSE | MAE |
|---|---|---|---|
| Spring | Test set | 0.010 | 0.071 |
| Summer | Test set | 0.009 | 0.070 |
| Autumn | Test set | 0.011 | 0.082 |
| Winter | Test set | 0.017 | 0.105 |
Disclaimer/Publisher’s Note: The statements, opinions and data contained in all publications are solely those of the individual author(s) and contributor(s) and not of MDPI and/or the editor(s). MDPI and/or the editor(s) disclaim responsibility for any injury to people or property resulting from any ideas, methods, instructions or products referred to in the content. |
© 2025 by the authors. Licensee MDPI, Basel, Switzerland. This article is an open access article distributed under the terms and conditions of the Creative Commons Attribution (CC BY) license (https://creativecommons.org/licenses/by/4.0/).
Share and Cite
Yang, H.; Chu, S.; Zeng, H.; Zhao, Y. Relationship Between Urban Forest Structure and Seasonal Variation in Vegetation Cover in Jinhua City, China. Forests 2025, 16, 1129. https://doi.org/10.3390/f16071129
Yang H, Chu S, Zeng H, Zhao Y. Relationship Between Urban Forest Structure and Seasonal Variation in Vegetation Cover in Jinhua City, China. Forests. 2025; 16(7):1129. https://doi.org/10.3390/f16071129
Chicago/Turabian StyleYang, Hao, Shaowei Chu, Hao Zeng, and Youbing Zhao. 2025. "Relationship Between Urban Forest Structure and Seasonal Variation in Vegetation Cover in Jinhua City, China" Forests 16, no. 7: 1129. https://doi.org/10.3390/f16071129
APA StyleYang, H., Chu, S., Zeng, H., & Zhao, Y. (2025). Relationship Between Urban Forest Structure and Seasonal Variation in Vegetation Cover in Jinhua City, China. Forests, 16(7), 1129. https://doi.org/10.3390/f16071129