Abstract
Acoustic tomography is a non-destructive technique used in the internal assessment of standing trees. Various researchers have focused on developing analytical tools using this technique, demonstrating that they can detect internal biodeterioration in cross-sections with good accuracy. This study evaluates the use of two ultrasonic wave devices with different frequencies (USLab and Sylvatest Duo) and a stress wave device (Microsecond Timer) to generate acoustic tomography using ImageWood VC1 software. The tests were carried out on 12 cross-sections of urban trees in the city of Madrid of the species Robinia pseudoacacia L., Platanus × hybrida Brot., Ulmus pumila L., and Populus alba L. Velocity measurements were made, forming a diffraction mesh in both standing trees and logs after cutting them down. An inspection was carried out with a perforation resistance drill (IML RESI F-400S) in the radial direction in each section, which allowed for more precise identification of defects and differentiating between holes and cracks. The various defects were determined with greater accuracy in the tomographic images taken with the higher-frequency equipment (45 kHz), and the combination of ultrasonic tomography and the use of the inspection drill can provide a more accurate representation of the defects.
1. Introduction
The presence of urban trees has both an intrinsic and monetary value and represents a heritage value for cities [1]. Among the negative aspects related to urban trees are the costs derived from their implementation and maintenance and the undesirable characteristics of certain species [2]. In an urban community, trees are valuable assets providing ecological, aesthetic, social, and economic benefits, but, at the same time, they pose a potential risk to people and property when they become structurally unstable [3].
Non-destructive testing and evaluation of urban trees for decay detection have drawn attention from the research community around the world [4]; today, wood quality can be assessed through several non-destructive techniques, such as acoustic methods, drilling, and imaging. The use of acoustic tomography technology is beneficial for appropriate tree management in urban communities; in fact, an acoustic tomographic device allows for obtaining data from the inside of the trees, and the tomograms allow for the determination of the stability of the trees to minimize the risk of tree failure [5].
The concept of detecting decay using ultrasound or sound waves is based on the observation that stress wave propagation is sensitive to the presence of degradation in wood [6]. The propagation of mechanical waves in material media is mainly influenced by differences in their elastic properties [7]. Therefore, the velocity of the wave may be affected by the position of the decay, hole, or singularity (knot, pith, resin pocket, etc.) in relation to the wave’s transmission [8], so internal obstructions increase the perceived time of flight of impact-induced stress waves as they travel through the diameter of the tree trunk [9].
Several studies [10,11,12,13,14,15,16,17,18,19,20] have shown that acoustic tomography can be effectively used to map tree cross-sections and identify decay or internal defects. Ref. [21] studied the influence of frequency on spatial resolution and reported that the resolution of acoustic tomography based on stress waves is influenced by the frequency, number of sensors, and inversion technique applied and that the image resolution was better at a higher frequency.
Various image reconstruction methods have been developed to determine the size and shape of defects inside of the wood [22,23,24], and they have been demonstrated to produce high-quality and accurate reconstructions. Ref. [18] indicated that the interpolation techniques used in the tomographic image creation process use different algorithms and present certain types of interference. Their efficiency depends on the type of deterioration. The same authors studied interferences in the velocities of ultrasonic tomography so that they can be taken into account in order to minimize the misinterpretation of the tomography.
In addition to assessment with acoustic methods and images, wood quality can be evaluated through drilling. The measurement of resistance to drilling is a conventional method of evaluating trees [4]. Resistance to microperforation is a quantitative method that detects changes in the density of wood related to decay and cracking [9]. A drill resistance tool typically consists of an electric drill unit, a small-diameter spade bit, and a data acquisition device. As the bit is drilled, it moves along a linear path through the wood, and the resistance to penetration along this path is measured and recorded [25]. Some researchers have used local methods to investigate the mechanical properties of timber, such as resistograph testing and sclerometer tests. These methods are easy to handle but limited to a small part of the material [26].
In urban tree risk assessment, the most commonly used non-destructive technique is visual inspection, which often does not include identification of anomalies that indicate internal instabilities or biodeterioration. Therefore, it is necessary to use equipment and technologies that, when combined with visual inspection, make it possible to monitor the internal state of the tree and thus relate this knowledge to the risk of falling trees. The purpose of this study was to evaluate the use of ultrasound techniques, stress waves, and drilling resistance in order to evaluate the internal conditions in sections of standing trees and in the same sections in logs after cutting them down and determine the difference in these methods of detecting and quantifying internal defects in urban trees in Madrid City.
2. Materials and Methods
The sample used in this research consisted of six specimens of urban trees in the city of Madrid from the species Robinia pseudoacacia L., Platanus × hybrida Brot., Ulmus pumila L., and Populus alba L. The specimens under study were selected for felling as they visually presented some wound or rot in the bark or because they were leaning, which was considered a potential risk of falling or failure of the specimens according to the visual evaluation methodology. The P. alba L. tree was located in an environment of compact grass, while the rest of the trees were on pavements (in tree pits).
Cores measuring 5 mm in diameter and 15 cm long were taken from each standing specimen with a Pressler drill at three different heights of the stem (0.3 m, 1.3 m, and 2.2 m). The samples were sectioned into three proportional parts, and the green weight of each section was immediately obtained with a portable digital scale (0.01 g precision). The length and diameter were determined with a caliper with an accuracy of 0.01 mm, and the volume was then determined considering each sample as a perfect cylinder [27]. The samples were taken to the laboratory and placed in the drying oven at 103 ± 2 °C to obtain the anhydrous weight. Moisture content (MC) was calculated using the following equation:
where is the green weight of the sample and is the oven-dried weight of the sample.
Green density was estimated (), with green volume () and green weight () determined based on the Pressler drill samples using the following equation:
2.1. Ultrasound and Stress Wave Tests
The ultrasound tests were performed with two pieces of equipment USLab (Agricef, Campinas Brazil) and Sylvatest Duo (CBS-CBT, Paris France) with 45 kHz and 22 kHz frequency, respectively; these pieces of equipment measure the transmission time of the ultrasonic wave in microseconds (µs).
The ultrasound tests were carried out transversally at two different stem heights: one at breast height (called section A) and the second at 0.9 m above the first (section B). Considering the dimensions of the different diameters, each cross-section was divided into eight equidistant points [28], with the first point marked towards geographic north and continuing clockwise.
The stress wave tests were performed with the Microsecond Timer (MST) (Fakopp Enterprise, Sopron, Hungary), a device for measuring acoustic wave transmission time (µs) comprising two spike-shaped sensors (emitter and receiver). An external stress on the emitting sensor is required to generate the wave, which is activated by the user with a hammer (100 g weight).
To make the measurements on the tree and ensure correct coupling between the sensor and the trunk, it was necessary to drill through the bark to insert the sensor tips. The measurements were made in the following manner and order: the emitter remained at the same point, while the receiver rotated clockwise through the rest of the points. After making the seven measurements with the emitter at the first point, it was moved to the second point while the receiver rotated through the rest of the points and so on until a diffraction mesh was formed (Figure 1). The stress wave tests were performed at the same points as the ultrasonic tests.
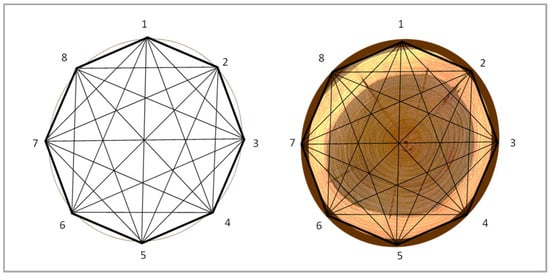
Figure 1.
Measurement paths forming a diffraction mesh of eight points, locating the first point to the geographic north.
Additionally, for the velocities determined with the Microsecond Timer, the relative velocity decrease (RVD) was calculated according to the equipment’s user manual Fakopp Enterprise Bt. [29]:
where is the reference velocity (provided in the user manual), which is the radial velocity for a healthy shaft, and is the measured velocity.
2.2. Drilling Resistance Tests
The test was performed with a IML RESI F-400S brand inspection drill (IML, Wiesloch, Germany), which has a drill bit that generates a perforation of approximately 2 mm in diameter as it advances, with a maximum penetration depth of 40 cm. The forward velocity of the measurements was 30 cm/min. The inspection drill is equipped with an electronic unit that automatically records the measurements in digital format thanks to a space designed so that a needle can plot the graph of efforts on wax paper as the drill bit penetrates. This graph shows the power consumed by the advance of the drill and contrasts the amplitude (%) with the maximum possible power versus the distance traveled. The inspection drill test was conducted in north and south directions, one centimeter down from points 1 and 5 (Figure 1) of the ultrasonic and stress wave propagation tests, in order to validate and compare the estimates generated through tomography. Measurements were made in section A in each standing tree and, for safety reasons, in the laboratory in the case of section B.
2.3. Laboratory Tests
For the purpose of comparing the measurements of the sections in the standing tree and measurements of extracted sections from the trunk, after felling the trees, two logs from each tree were transferred to the laboratory, and the sections to be analyzed in the upper parts of these logs were conserved. Ultrasonic and stress wave tests were carried out with the same methodology and on the same marks and perforations as in the standing tree. The measurements were taken immediately after felling and obtaining the logs to prevent moisture loss. The velocity () for the ultrasonic and impact equipment was obtained using the following equation:
where d is the distance (m) between transducers and t is the transmission time (s) of the ultrasonic or stress wave.
2.4. Obtaining Tomographic Images
The data from the ultrasonic and stress wave equipment was analyzed and processed with ImageWood VC1, non-commercial software developed by the Non-Destructive Testing Research Group in the Faculty of Agricultural Engineering at the State University of Campinas, Brazil. This software can generate tomographic images from the velocities of waves traveling through a section and requires two spreadsheets: one with the coordinates of the cross-section contour and another with the coordinates of the measurement points with their respective wave propagation times, both in simple text files (.txt).
ImageWood image processing software generates the images through spatial interpolation of velocities using two different interpolators: the Inverse Square Distance (ISD) and the Ellipses method, the latter being used in the present study. The interpolator allows us to assign estimated velocity values in regions where it is unknown from velocities calculated in the theoretical grating measurement paths. The tomographic image is then generated by associating colors with velocity ranges, resulting in a color map that can be associated with wood biodeterioration conditions [30]. Version 1.52p of free ImageJ software was used to generate the coordinates of the contours. For standing trees, simulated contours were generated from the smallest and largest diameters of each section, and the perimeter coordinates for feeding the contour spreadsheet were calculated using a macro (regular contour generator, GCR). The coordinates of the cross-sections of the logs were obtained from photographs of the sections also analyzed in ImageJ (Figure 2). The photographs were opened in the software, and their scale was transformed from pixels to centimeters with the set scale tool. The contour points are marked in the image with the multipoint tool, sequentially and clockwise, starting at point 1. The points were saved in x and y coordinates in text files (.txt).
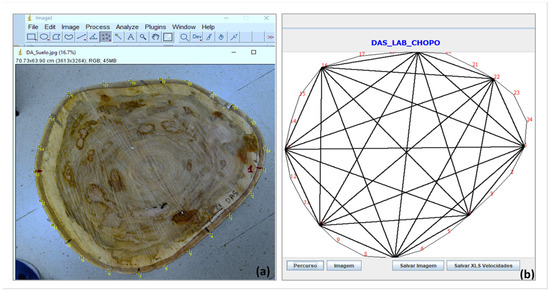
Figure 2.
(a) Generation of coordinates in ImageJ from a photograph of the log section. (b) Contour generated in ImageWood.
A total of 32 tomographic images were generated with data from the three devices on standing trees and 36 tomographic images with data from the logs in the laboratory. To interpret the tomographic images, it was necessary to determine the dimensions and the area percentage of the various defects (mainly holes and cracks) in both the photographs and the tomographic images in ImageJ.
The statistical analysis was performed with Statgraphics Centurion 19. The existence of any significant differences in the velocities between species and devices was noted. The analysis of variance (ANOVA) was conducted. The assumptions of normality and variance homogeneity were evaluated using Levene tests (p < 0.05).
3. Results
Table 1 contains information on the relative age, diameter at breast height, and general state of each specimen, the type of surface (pavement over roots or compact lawn), the standing moisture content, and green density determined with the Pressler drill.

Table 1.
Relative age, diameter, main state, soil condition, standing tree moisture content, and green density.
The diagnosis of ailments in the various specimens revealed that only P. alba L., in the log corresponding to section B, was affected by Coleoptera individuals from the Scarabaeidae family, Dynastinae subfamily, in their larval phase (Figure 3). In this phase, they are capable of fragmenting large amounts of wood during feeding, thus accelerating the decomposition process.
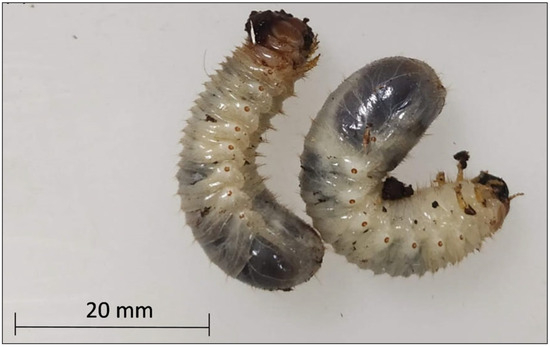
Figure 3.
Coleoptera individuals in larval phase found in Populus alba.
These attacks also favor the entry of fungi and bacteria. Scarab beetles can carry wood-decaying fungi on their bodies while burrowing; in this case, a wood-decaying fungus (Figure 4) caused the primary injury. In addition to the evaluations carried out with the inspection drill at points 1 and 5, evaluations were also carried out at points 2, 3, 4, 6, 7, and 8 to determine the percentage loss of wood density in the various parts of this section.
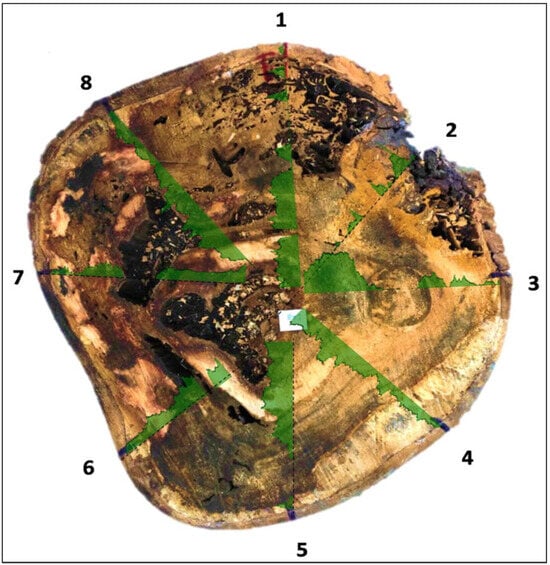
Figure 4.
Inspection drill evaluations in the affected section of P. alba.
3.1. Transverse Velocities
Higher velocities were generally found with the USLab equipment than with Sylvatest Duo and MST. Table 2 shows the statistics of transverse velocities obtained with the different equipment in standing trees and in the logs of the species studied.

Table 2.
Average transverse velocities obtained in the standing tree and in logs in the laboratory.
The transverse velocities determined in the six standing trees were generally higher than those obtained in the laboratory. This difference was not the same in all measurement routes, and, in some cases, lower velocities were found in the standing tree than in the logs in the laboratory. In the transverse velocities, some variation was also observed in completely healthy wood in the tangential and radial velocities, with the radial velocities being higher than the tangential ones.
In the analysis of variance, because the p-value was less than 0.05, there was a significant difference between the mean velocities with different equipment, species, and measurements on the standing and logs at the 95% confidence level. Similarly, in the Levene test, the p-value was less than 0.05, so a statistically significant difference was found between the standard deviations of the different variables.
3.2. Ultrasonic Tomography in Standing Trees and Logs in the Laboratory
The images generated in ImageWood VC1 were made by adopting eight velocity bands, always related to the maximum velocity (Vmax) determined in each section. Table 3 shows the maximum velocities of the species determined with different equipment in each section.

Table 3.
Maximum velocities (m/s) determined in the standing tree and in logs in the laboratory with different ultrasound and impact equipment.
Figure 5 shows the images obtained in ImageWood VC1 for a section of R. pseudoacacia L., a section of P. × hybrida Brot, and a section of U. pumila 2 (Appendix A: Figure A1 and Figure A2), illustrating three different conditions: presence of holes, healthy wood, and presence of cracks, respectively. Yellow indicates 49%–60% of maximum velocity (Vmax), cyan 61%–72%, blue 73%–84%, and magenta 85%–100%. The R. pseudoacacia L. sections presented a hole in the center, representing 4.5% of the total area in section A and 4.1% in section B. This hole was associated with a 49%–60% loss of maximum velocity according to USLab. There was a more accurate representation of the hole in both sections with the velocities determined in the laboratory. The yellow zone represented 4.2% of the area of the tomographic image in section A and 4.1% in section B, which is a very accurate quantification of the defect. It was not possible with Sylvatest Duo and MST to differentiate the loss of velocity that could be associated with the presence of the hole.
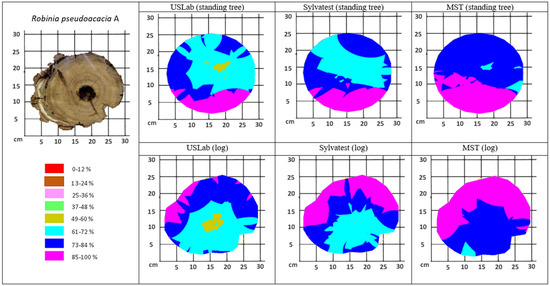
Figure 5.
Tomographic images of the standing tree and the log of section A of Robinia pseudoacacia L. The velocities’ bands are shown based on of the percentage of the maximum velocity obtained in the section.
Table 4 shows a summary of the evaluation of the different tree sections, with the percentage of the area of the defects in the photograph or real image and the percentage of the area of the defects determined through tomography.

Table 4.
Percentage of the area of the defects in the real image and percentages of the area of the defects determined in the tomography images.
3.3. Relative Velocity Decrease
Regarding the determination of the relative velocity decrease (RVD), it should be interpreted as the percentage decrease in radial velocity compared to a healthy tree. For example, RVD = 50% denotes a 50% velocity decrease in the measured tree compared to a healthy tree. A higher RVD implies a worse condition of the tree. Table 5 shows the reference velocities indicated in the manual for the species in this study and the mean velocities, made by taking the average of the radial velocities of each section. The estimate of the degraded area (%) based on the calculated RVD is also shown.

Table 5.
Reference velocities for the species in this study, velocity, relative velocity decrease (%), and estimation of the degraded area (%) based on the calculated RVD.
Despite being healthy, the radial velocity found in the standing P. × hybrida tree was much lower than the reference velocity indicated for this species. In the case of U. pumila, it can also be seen that the velocity was much lower than the reference due to the presence of cracks. These defects interfere with the signal path and would therefore be interpreted as decay. It is important to mention that the equipment manual does not specify any further characteristics to be considered for the validity of the reference velocities, such as the tree diameter, growth condition, moisture content, etc., which could lead to the misinterpretation or overestimation of the degraded area. The calculation of the RVD can provide an initial approximation of the internal condition, although there is insufficient information on the reference velocity of certain species, as in the case of U. pumila L., where the reported reference velocity corresponds to the Ulmus genus.
3.4. Drilling Resistance Test
The technique works on the principle that drill resistance is directly related to the density of the material being tested [31,32,33]. Significant research has been carried out to explore the use of drill resistance measurements for various applications, such as growth ring analysis, tree decay detection, and assessing the condition of structural wood. Ref. [34] used the IML-Resistograph F300S to estimate the cross-sectional area of decay in Eucalyptus globulus and concluded that the equipment was very successful in quantitatively evaluating tree decay and has great potential in the arboriculture industry. The resistance to perforation determined in each part of this study established the location of the defects with greater accuracy and differentiated between cracks and holes, whereas acoustic tomography was limited in this sense. In the case of sections with holes, the graph accurately determined their dimensions (Figure 6). In healthy wood, the graph is relatively constant in the peaks and valleys and displays no drastic drops.
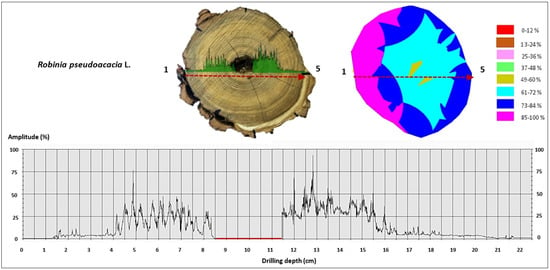
Figure 6.
Drill resistance profile of a section of R. pseudoacacia L. showing the dimensions of the hole.
It should be noted that the graphic profile in Figure 6 is the result of amalgamating the two profiles for geographic north and south (point 1 and point 5, respectively). The perforation resistance test is a very useful tool for differentiating a hole from a crack, as the graph clearly shows that there is no sudden drop, as in the case of the presence of holes.
There was a significant crack in the U. pumila sections that was not identified in any of the drilling resistance graphs, possibly because the needle’s route did not pass through the crack area (for details, check Appendix B: Figure A3 and Figure A4). This result highlights the fact that this type of inspection is very site-specific, and it is important to know where it needs to be to be applied. Refs. [35,36] reached the same conclusion.
4. Discussion
One of the main challenges of acoustic tomography is interpreting the variations in velocities in the trunk and thus differentiating the natural variations in the wood from the variations caused by decomposition [18]. The images generated through ultrasonic tomography show the variation in velocity in the inspected section, which can then be associated with differences in stiffness to signal the position and approximate degree of potential deterioration or internal damage in the tree so that defects (holes, cracks, or decay) or singularities (knots, reaction wood, juvenile wood) with varying degrees of severity can all be inferred as accurately as possible.
Considering that the difference found in velocity in standing trees and logs was over 22% using Sylvatest Duo, it is very important to take this into account when interpreting the tomographic image, because the practical use of this methodology is in standing trees. Therefore, if a good result is obtained from the tomographic images from logs or discs, it cannot be ensured that the same will happen in standing trees.
Regarding the difference in tangential and transverse velocities, Palma et al. [18] studied the interference and velocity variation in Pinus elliottii disks caused by knots, wave propagation direction, and the presence of reaction wood and juvenile wood and concluded that the intrinsic orthotropy of the wood was reflected in the propagation of the waves. They found higher radial than tangential velocities, like this study.
Ref. [37] evaluated defects in Cryptomeria japonica trees using an ultrasonic tomography technique with Sylvatest Duo equipment and 22 kHz sensors. The experimental results showed that the differences in the mapped colors and ultrasonic velocities between the area of the hole and its surrounding area were obvious. Likewise, when the ratio of the area of the hole to the area of the cross-section exceeded 2.8%, the hole was detectable through ultrasonic tomography.
Similarly, Ref. [38] qualitatively and quantitatively evaluated the results of ultrasonic tomography with USLab for different types and levels of deterioration and found that in areas with moderate to severe decomposition by fungi, the loss of velocity was greater than 50%, while a velocity loss of around 20% to 30% was associated with incipient to low decomposition. A 50% loss in velocity denoted hollow areas, which tended to be overestimated in image interpretation. The P. × hybrida Brot. specimen in the study was visually healthy and had no abnormalities, and the loss of velocity with USLab was associated with the presence of pith and the difference between sapwood and heartwood. Although at first glance it was impossible to differentiate the two types of wood, in the tomographic images based on both USLab and Sylvatest Duo laboratory measurements, the pith area was associated with a velocity of 61%–72% of Vmax. In a study of two specimens of Platanus hybrida Brot, Ref. [39] showed that ultrasound tomography is an effective tool for detecting internal damage, although it was found to underestimate the loss of velocity in the decayed area, as the wave paths tend to avoid regions of low velocity, and therefore the corresponding travel times do not contain information about the material in these slow areas.
A common characteristic of all of the sections analyzed from the trees of U. pumila in this study was the presence of cracks in the central part of the section. In the USLab tomographs, these cracks were associated with 49%–60% of the maximum velocity, except for section B of specimen 3, which was associated with 61%–72% of the Vmax. In the case of the R. pseudoacacia L. sections, the 49%–60% velocity rate already signaled the presence of a hole, which would initially indicate that the ultrasonic tomography was overestimating the size of the cracks. Ref. [12] found that acoustic tomography performed on specimens of Prunus serótina Ehrh. underestimated heartwood decomposition when it was the main structural defect in the trees and tended to overestimate the size of internal cracks. It is important to consider that the velocity reduction in the central part of the trunk may be associated with the presence of the pith.
Ref. [40] studied the use of ultrasonic waves with Sylvatest Duo to detect internal decay in standing trees of Fagus orientalis Lipski. They found that the velocity of the ultrasonic wave decreased linearly and significantly as the hole’s dimensions increased and that the location of the holes did not influence the extent and trend of the decrease in velocity. Although the cracks covered only a small fraction of the sections, they had a greater effect in reducing ultrasound velocities than circular holes. In this study, ultrasound and acoustic tomography also overestimated the size of internal cracks in U. pumila trees.
In this study, the device with the highest ultrasonic frequency (45 kHz) invariably offered better results in the tomographic images and represented the presence and size of the defects more accurately. Considering 50% of the velocity loss occurs in hollow areas [38], USLab ultrasonic tomography showed a very accurate defect area, although it tended to overestimate the size of the cracks. Sylvatest Duo tomography was limited in detecting the areas with holes but tended to overestimate the areas with cracks.
5. Conclusions
The device with higher ultrasonic frequency (45 kHz) invariably offered better results of the tomographic images, representing the presence and size of the defects with greater approximation. Considering 50% of the velocity loss occurs in hollow areas [38], USLab ultrasonic tomography showed a very approximate defect area, while in the case of cracks it tended to overestimate its size. Sylvatest tomography was limited in detecting the area with holes; however, it tended to overestimate the areas with cracks.
In this work, the association of ultrasonic tomography with UsLab and the use of the inspection drill offered greater accuracy of the defects. The inspection drill turned out to be a very useful tool to specifically differentiate whether it is a hole, crack, or rot of smaller size. The acoustic tomography allowed for global analysis of the variation of the velocity on each section analyzed; for their part, the tests of resistance to perforation with the inspection drill worked as a very precise but punctual tool. Therefore, the use of ultrasonic tomography in the evaluation of the internal state of the trees offers a first idea of where the defects are located and whether they are holes, decay, or cracks; in this way, it is possible to determine the areas where it is necessary to carry out diagnosis with the drill inspection. Inferences about the superior performance of USLab reflect only the behavior observed in this specific set of samples and cannot be extrapolated to other field situations without due validation with larger and more diverse samples.
It would be advisable to carry out more studies with a greater number of specimens of the same species that are healthy and with a diversity of diameters, as this would allow for reference information to be obtained in the inspection of specimens with defects, decay, or internal anomalies.
Author Contributions
Conceptualization, G.O.-L., G.H.V.-C., I.B., and M.E.; methodology, G.O.-L., G.H.V.-C., I.B., and M.E.; software, G.O.-L. and G.H.V.-C.; validation, G.O.-L., G.H.V.-C., I.B., and M.E.; formal analysis, G.O.-L., G.H.V.-C., I.B., and M.E.; investigation, G.O.-L., G.H.V.-C., I.B., and M.E.; resources, G.O.-L., G.H.V.-C., and M.E.; data curation, G.O.-L., G.H.V.-C., I.B., and M.E.; writing—original draft preparation, G.O.-L. and G.H.V.-C.; writing—review and editing, G.O.-L., G.H.V.-C., I.B., and M.E.; visualization, G.O.-L., G.H.V.-C., I.B., and M.E.; supervision, G.O.-L., I.B., and M.E.; project administration, I.B. and M.E.; funding acquisition, I.B. and M.E. All authors have read and agreed to the published version of the manuscript.
Funding
Partial financial support in 2022 by the Timber Construction Research Group, Universidad Politécnica de Madrid, Spain. Guadalupe Olvera Licona and Gabriel Humberto Virgen Cobos were supported by the National Council of Science and Technology (CONACyT) of the Mexican government through a doctoral grant.
Data Availability Statement
The original contributions presented in this study are included in the article. Further inquiries can be directed to the corresponding author.
Acknowledgments
The authors would like to thank the company Ferrovial S.A. for providing the trees tested. They also thank the Timber Laboratory of Forest Research Centre (INIA-CSIC) and the Forest Products Industries Laboratory (Universidad Politécnica de Madrid) for the facilities provided to carry out tests.
Conflicts of Interest
The authors declare no conflicts of interest.
Appendix A
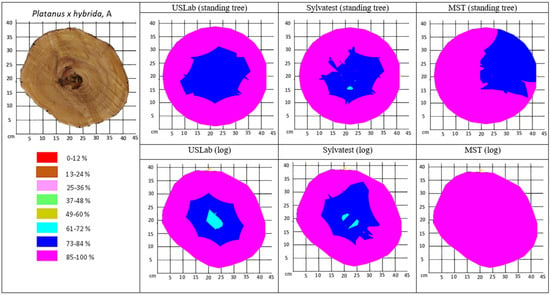
Figure A1.
Tomographic images of the standing tree and the logs in the laboratory of P. × hybrida Brot. section A.
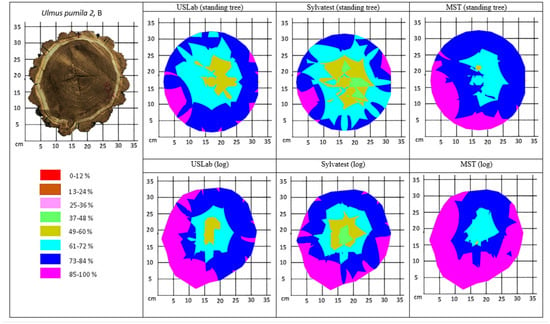
Figure A2.
Tomographic images of the standing tree and in the laboratory of section B of U. pumila 2.
Appendix B
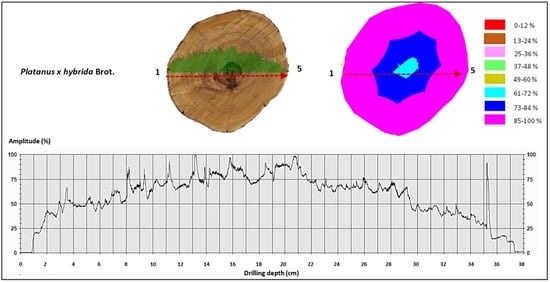
Figure A3.
Drill resistance profile of a P. × hybrida section showing the behavior of the profile in healthy wood.
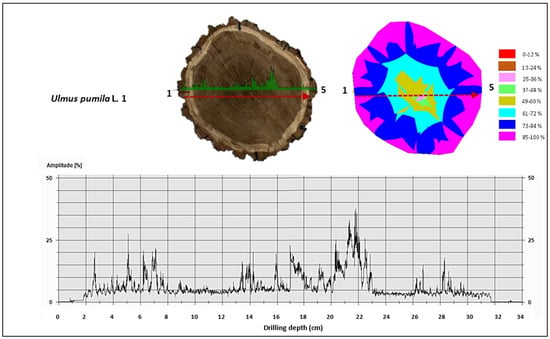
Figure A4.
Drill resistance profile of a U. pumila section with the presence of internal cracks.
References
- Ponce, D.M.; Vallejos, B.Ó. Valoración de árboles urbanos, comparación de fórmulas. Rev. Fac. Cienc. Agric. 2016, 48, 195–208. [Google Scholar]
- Calaza, P.; Iglesias, M. Evaluación de Riesgo de Arbolado Peligroso: Principios, Indicadores y Métodos; Asociación Española de Arboricultura: Valencia, Spain, 2012. [Google Scholar]
- Brashaw, B.K.; Bucur, V.; Divos, F.; Goncalves, R.; Lu, J.; Meder, R.; Pellerin, R.F.; Potter, S.; Ross, R.J.; Wang, X.; et al. Nondestructive testing and evaluation of wood: A worldwide research update. For. Prod. J. 2009, 59, 7–14. [Google Scholar]
- Arciniegas, A.; Prieto, F.; Brancheriau, L.; Lasaugues, P. Literature review of acoustic and ultrasonic tomography in standing trees. Trees 2014, 28, 1559–1567. [Google Scholar] [CrossRef]
- Proto, A.R.; Cataldo, M.F.; Costa, C.; Papandrea, S.F.; Zimbalatti, G. A tomographic approach to assessing the possibility of ring shake presence in standing chestnut trees. Eur. J. Wood Prod. 2020, 78, 1137–1148. [Google Scholar] [CrossRef]
- Wang, X.; Allison, R. Decay detection in red oak trees using a combination of visual inspection, acoustic testing, and resistance microdrilling. Arboric. Urban For. 2008, 34, 1–4. [Google Scholar] [CrossRef]
- Bucur, V. Acoustics of Wood, 2nd ed.; Springer: New York, NY, USA, 2006; 393p. [Google Scholar]
- Bucur, V. Ultrasonic techniques for nondestructive testing of standing trees. Ultrasonics 2005, 43, 237–239. [Google Scholar] [CrossRef]
- Allison, R.B.; Wang, X.; Senalik, C.A. Methods for Nondestructive Testing of Urban Trees. Forests 2020, 11, 1341. [Google Scholar] [CrossRef]
- Deflorio, G.; Fink, S.; Schwarze, F.W.M.R. Detection of incipient decay in tree stems with sonic tomography after wounding and fungal inoculation. Wood Sci. Technol. 2007, 42, 117–132. [Google Scholar] [CrossRef]
- Brancheriau, L.; Lasaygues, P.; Debieu, E.; Lefebvre, J.P. Ultrasonic tomography of green wood using non-parametric imaging algorithm with reflected waves. Ann. For. Sci. 2008, 65, 712–718. [Google Scholar] [CrossRef]
- Wang, X.; Wiedenbeck, J.; Liang, S. Acoustic tomography for decay detection in black cherry trees. Wood Fiber Sci. 2009, 41, 127–137. [Google Scholar]
- Gonçalves, R.; Trinca, A.J.; dos Santos Ferreira, G.C. Effect of coupling media on velocity and attenuation of ultrasonic waves in Brazilian wood. J. Wood Sci. 2011, 57, 282–287. [Google Scholar] [CrossRef]
- Brancheriau, L.; Ghodrati, A.; Gallet, P.; Thaunay, P.; Lasaygues, P. Application of ultrasonic tomography to characterize the mechanical state of standing trees (Picea abies). J. Phys. Conf. 2012, 353, 012007. [Google Scholar] [CrossRef]
- Feng, H.; Li, G.; Fu, S.; Wang, X. Tomographic Image Reconstruction Using an Interpolation Method for Tree Decay Detection. BioResources 2014, 9, 3248–3263. [Google Scholar] [CrossRef]
- Du, X.; Li, S.; Li, G.; Feng, H.; Chen, S. Stress Wave Tomography of Wood Internal Defects using Ellipse-Based Spatial Interpolation and Velocity Compensation. BioResources 2015, 10, 3948–3962. [Google Scholar] [CrossRef]
- Koeser, A.K.; Hauer, R.J.; Klein, R.W.; Miesbauer, J.W. Assessment of likelihood of failure using limited visual, basic, and advanced assessment techniques. Urban For. Urban Green. 2017, 24, 71–79. [Google Scholar] [CrossRef]
- Palma, S.S.; Gonçalves, R.; Trinca, A.; Costa, C.; Nagle, M.; Martins, G. Interference from knots, wave propagation direction and effect of juvenile and reaction wood on velocities in ultrasound tomography. BioResources 2018, 13, 2834–2845. [Google Scholar] [CrossRef]
- Wu, X.; Li, G.; Jiao, Z.; Wang, X. Reliability of acoustic tomography and ground-penetrating radar for tree decay detection. Appl. Plant Sci. 2018, 6, e1187. [Google Scholar] [CrossRef]
- Papandrea, S.F.; Cataldo, M.F.; Zimbalatti, G.; Proto, A.R. Comparative evaluation of inspection techniques for decay detection in urban trees. Sens. Actuators A 2022, 340, 113544. [Google Scholar] [CrossRef]
- Divos, F.; Divos, P. Resolution of stress wave based acoustic tomography. In Proceedings of the 14th International Symposium on Non-Destructive Testing of Wood, Eberswalde, Germany, 2–4 May 2005; pp. 309–314. [Google Scholar]
- Espinosa, L.; Arciniegas, A.; Cortes, Y.; Prieto, F.; Brancheriau, L. Automatic segmentation of acoustic tomography images for the measurement of wood decay. Wood Sci. Technol. 2017, 51, 69–84. [Google Scholar] [CrossRef]
- Du, X.; Li, J.; Feng, H.; Chen, S. Image Reconstruction of Internal Defects in Wood Based on Segmented Propagation Rays of Stress Waves. Appl. Sci. 2018, 8, 1778. [Google Scholar] [CrossRef]
- Espinosa, L.; Prieto, F.; Brancheriau, L.; Lasaygues, P. Quantitative parametric imaging by ultrasound computed tomography of trees under anisotropic conditions: Numerical case study. Ultrasonics 2020, 102, 106060. [Google Scholar] [CrossRef] [PubMed]
- Wang, X. Partial Resistance Drilling to Assess Wood Density in Trees. In Proceedings of the 20th International Nondestructive Testing and Evaluation of Wood Symposium, Madison, WI, USA, 12–15 September 2017. [Google Scholar]
- Yang, Z.; Jiang, Z.; Hse, C.Y.; Liu, R. Assessing the impact of wood decay fungi on the modulus of elasticity of slash pine (Pinus elliottii) by stress wave non-destructive testing. Int. Biodeterior. Biodegrad. 2017, 117, 123–127. [Google Scholar] [CrossRef]
- Virgen-Cobos, G.H.; Olvera-Licona, G.; Hermoso, E.; Esteban, M. Nondestructive Techniques for Determination of Wood Mechanical Properties of Urban Trees in Madrid. Forests 2022, 13, 1381. [Google Scholar] [CrossRef]
- Palma, S.S.A.; Gonçalves, R. Tomographic images of the trunks generated using ultrasound and post-processed images: Influence of the number of measurement points. BioResources 2022, 17, 6638–6655. [Google Scholar] [CrossRef]
- Fakopp Enterprise Bt. 2022. Microsecond Timer Manual. Available online: https://files.fakopp.com/mstimer/mstimer_manual.pdf (accessed on 1 December 2024).
- Palma, S.S.; dos Reis, M.N.; Gonçalves, R. Tomographic Images Generated from Measurements in Standing Trees Using Ultrasound and Postprocessed Images: Methodological Proposals for Cutting Velocity, Interpolation Algorithm and Confusion Matrix Metrics Focusing on Image Quality. Forests 2022, 13, 1935. [Google Scholar] [CrossRef]
- Rinn, F.; Schweingruber, F.H.; Schar, E. Resistograph and X-ray density charts of wood: Comparative evaluation of drill resistance profiles and X-ray density charts of different wood species. Holzforschung 1996, 50, 303–311. [Google Scholar] [CrossRef]
- Mattheck, C.; Bethge, K.; Albrecht, W. How to read the results of Resistograph M. Arboric. J. 1997, 21, 331–346. [Google Scholar] [CrossRef]
- Rinn, F. Basics of typical resistance-drilling profiles. Western Arborist Winter 2012, 17, 30–36. [Google Scholar]
- Johnstone, D.M.; Ades, P.K.; Moore, G.M.; Smith, I.W. Predicting Wood Decay in Eucalypts Using an Expert System and the IML-Resistograph Drill. Arboric. Urban For. 2007, 33, 76–82. [Google Scholar] [CrossRef]
- Tannert, T.; Anthony, B.; Kasal, M.; Kloiber, M.; Piazza, M.; Riggio, M.; Rinn, F.; Widmann, R.; Yamaguachi, N. In situ assessment of structural timber using semi-destructive techniques. Mater. Struct. 2013, 47, 767–785. [Google Scholar] [CrossRef]
- Nagle, M.; Gonçalves, R.; Lopes-Garcia, G.H.; Manes, L. Profiles of a Non-Calibrated Resistance Drill Compared with Deteriorated Stem Cross Sections. Arboric. Urban For. 2019, 45, 1–9. [Google Scholar] [CrossRef]
- Lin, C.J.; Kao, Y.C.; Lin, T.T.; Tsai, M.J.; Wang, S.Y.; Lin, L.D.; Chan, M.H. Application of an ultrasonic tomographic technique for detecting defects in standing trees. Int. Biodeterior. Biodegrad. 2008, 62, 434–441. [Google Scholar] [CrossRef]
- Nagle, M. Association of Nondestructive Tools for Tree Inspection. Master’s Thesis, State University of Campinas, Brazil, South America, 2017. [Google Scholar]
- Nicolotti, G.; Socco, L.V.; Martinis, R.; Godio, A.; Sambuelli, L. Application and comparison of three tomographic techniques for detection of decay in trees. J. Arboric. 2003, 29, 66–78. [Google Scholar] [CrossRef]
- Kazemi-Najafi, S.K.; Shalbafan, A.; Ebrahimi, G. Internal decay assessment in standing beech trees using ultrasonic velocity measurement. Eur. J. For. Res. 2009, 128, 345–350. [Google Scholar] [CrossRef]
Disclaimer/Publisher’s Note: The statements, opinions and data contained in all publications are solely those of the individual author(s) and contributor(s) and not of MDPI and/or the editor(s). MDPI and/or the editor(s) disclaim responsibility for any injury to people or property resulting from any ideas, methods, instructions or products referred to in the content. |
© 2025 by the authors. Licensee MDPI, Basel, Switzerland. This article is an open access article distributed under the terms and conditions of the Creative Commons Attribution (CC BY) license (https://creativecommons.org/licenses/by/4.0/).