1. Introduction
The wood manufacturing industry is an important part of China’s forestry industry. According to the China Forestry and Grassland Statistical Yearbook, in 2022, the output values of “wood processing and manufacturing of wood, bamboo, rattan, palm, and reed products” and “manufacturing of wood, bamboo and rattan furniture” in China were CNY 1476.641 billion and CNY 764.789 billion, accounting for 55.48% of the output value of the secondary industry of forestry. The study of trade exchanges in the wood products industry is crucial for three key objectives: improving the timber supply chain, enhancing the competitiveness of the wood processing industry, and promoting the sustainable development of the regional economy. Specifically, this study facilitates resource sharing and complementary advantages through inter-provincial cooperation. Such cooperation further promotes the transformation and upgrading of the wood processing industry.
Located in the northeast of China, Heilongjiang Province has a clear geographical advantage over Russia, with a border of nearly 3000 km with Russia, and has become a major corridor for Russian timber imports based on the “Belt and Road” initiative. This geographic advantage, coupled with the local government’s support and investment in the wood processing industry, has enabled Heilongjiang Province to occupy an important position in wood processing and trade and become a resource-endowed province for wood processing based on Russian imports. Data show that in 2024, Heilongjiang Province’s timber production reached 1.61 million cubic meters, an increase of 17.9% over the previous year; the forestry output value reached CNY 20.1 billion, a year-on-year increase of 6%. As an important national strategic timber reserve base, Heilongjiang Province has several timber trading centers and markets, including Suifenhe Timber Trading Market, an important Russian timber import port in China, whose trade volume accounts for 40% of the province’s trade with Russia, and annual timber imports of nearly 3.5 million cubic meters, accounting for more than 50% of the national total. The 267 timber processing enterprises in the region have initially formed cross-border industrial clusters. Currently, their annual output of broadleaf veneer accounts for 70% of the domestic market share for similar products. The timber trade here is active, and cooperation with other regions in wood product trade is deepening.
China’s timber markets are characterized by diverse types, large quantities, wide geographical distribution, and active trading activities. Meanwhile, China’s timber supply remains highly dependent on external sources. Thus, conducting research on the domestic supply of China’s timber market from the perspective of fostering a “domestic cycle as the main body” is of significant importance for constructing a new development pattern [
1]. Currently, the academic community has not yet conducted systematic research on key issues. These include the national-scale layout of China’s wood products industry circulation network, the measurement of inter-provincial trade scale, and the evolution of resource-endowed regions’ functions. Moreover, the operational laws of the domestic wood products market still require further exploration.
When the division of labor and collaboration of the industrial chain breaks through the limitations of administrative divisions, inter-provincial trade becomes the carrier of industrial linkage, and inter-provincial trade promotes the domestic economic cycle and high-quality integrated development of the regional economy by giving full play to regional advantages and strengthening economic collaboration and complementarity [
2]. At present, the research on industrial linkage mostly adopts the gray correlation method [
3], the non-exhaustive hypothesis extraction method [
4], the input–output model, and the IMPLAN model. Among these, the input–output model is the most widely used, and “industrial linkage analysis” generally uses the “input–output table”, combined with mathematical matrices and other tools, to calculate the forward and backward correlation coefficients between industrial sectors, and then analyze the correlation relationship between industries [
5].
At present, analysis of industrial correlation effects mainly focuses on typical industries such as high energy-consuming industries in the manufacturing industry [
6], animal husbandry industry [
7], and digital economy industry [
8]. In addition, Fanglin Li identified the backward and forward roles and cross-sectoral and cross-regional mobility effects of tourism through estimated interregional input–output tables for Indonesia in 2019 [
9]. Poudel, J. et al. compared the economic contributions of wildlife watch expenditures in 13 southern U.S. states using the IMPLAN model [
10]. Youngseok Song et al. explore the economic impacts of agricultural droughts in South Korea through an input–output analysis [
11]. João Antonio F. Brito et al. apply an input–output model to calculate the Cape Verde’s region’s fisheries sector output and employment multipliers [
12].
In the field of forestry, Poudel, J. et al. employed the IMPLAN model to conduct a comprehensive analysis of the economic performance of the U.S. forest products industry and its respective subsectors in 2022 [
13]. Austin Lamica et al. estimated and empirically validated a model of sawn and pulpwood trade in 13 southern states of the U.S. [
14]; Domen Arnic et al. used an input–output model to estimate the multiplier effects of sectors representing the Slovenian timber bio-economy and to analyze their direct and indirect impacts on the economy [
15]; Reikha Habibah Yusfi et al. analyzed the economic impact of government expenditures through an input–output table for Central Java [
16]; Beatus John Temu et al. used input–output tables to depict the contribution of the forest sector to the Tanzanian economy [
17]; Matthias Bösch et al. constructed a physical input–output model of wood and paper in Germany to portray industry flow paths and identify key industries, and assessed inter-industry linkages [
18]; Xu Ruolin et al. and Zhu Yujie et al. used the grey correlation degree method to make suggestions for further optimizing and adjusting the industrial structure of the forestry industry [
19,
20]; Chen Wenhui et al. used input–output analysis to construct the industrial nature, linkages, and economic model of the forestry industry, pointing out that the entire forestry industry presents the nature of intermediate products [
21]. Lyu Jin-fei et al. made a systematic quantitative analysis of the indexes of the industrial relevance of the wood processing and furniture manufacturing industry in Zhejiang Province from the perspective of the consumption coefficient [
22]. Geng Xianhui et al. used the input–output method to empirically measure the industrial linkage of China’s wood processing and furniture manufacturing industry in 2005. Their findings showed that the backward-pulling effect of this industry on the national economy was greater than its driving effect [
23]. Yang Siyin et al. employed China’s input–output table to calculate the characteristic and correlation indices of the forestry industry. They also explored the pathway for high-quality integrated development of the forestry sector [
24].
Existing research primarily focuses on industrial linkages within regions or between provinces and across the country. However, research on trade transfer relationships between specific regions and other regions remains underexplored. Moreover, most domestic studies on the wood products industry rely on data prior to 2014, lacking systematic analysis of industry dynamics and the evolution of interregional industrial linkages during 2014–2017. This paper analyzes the association between the wood products industry and other industries in other regions with the wood products industry as the main perspective and analyzes the association between the wood products industry and other industries in Heilongjiang Province during the period of 2002–2017. This study aims to explore the following core question: As a key base for resource inflow and primary processing of wood products, what is the position of Heilongjiang Province’s wood products industry in the industrial chain? How does this position affect its industrial linkages with other regions across the country? Furthermore, how do these linkages influence its sensitivity to regional economic fluctuations?
3. Results and Discussion
3.1. Analysis of Industrial Comparative Advantage
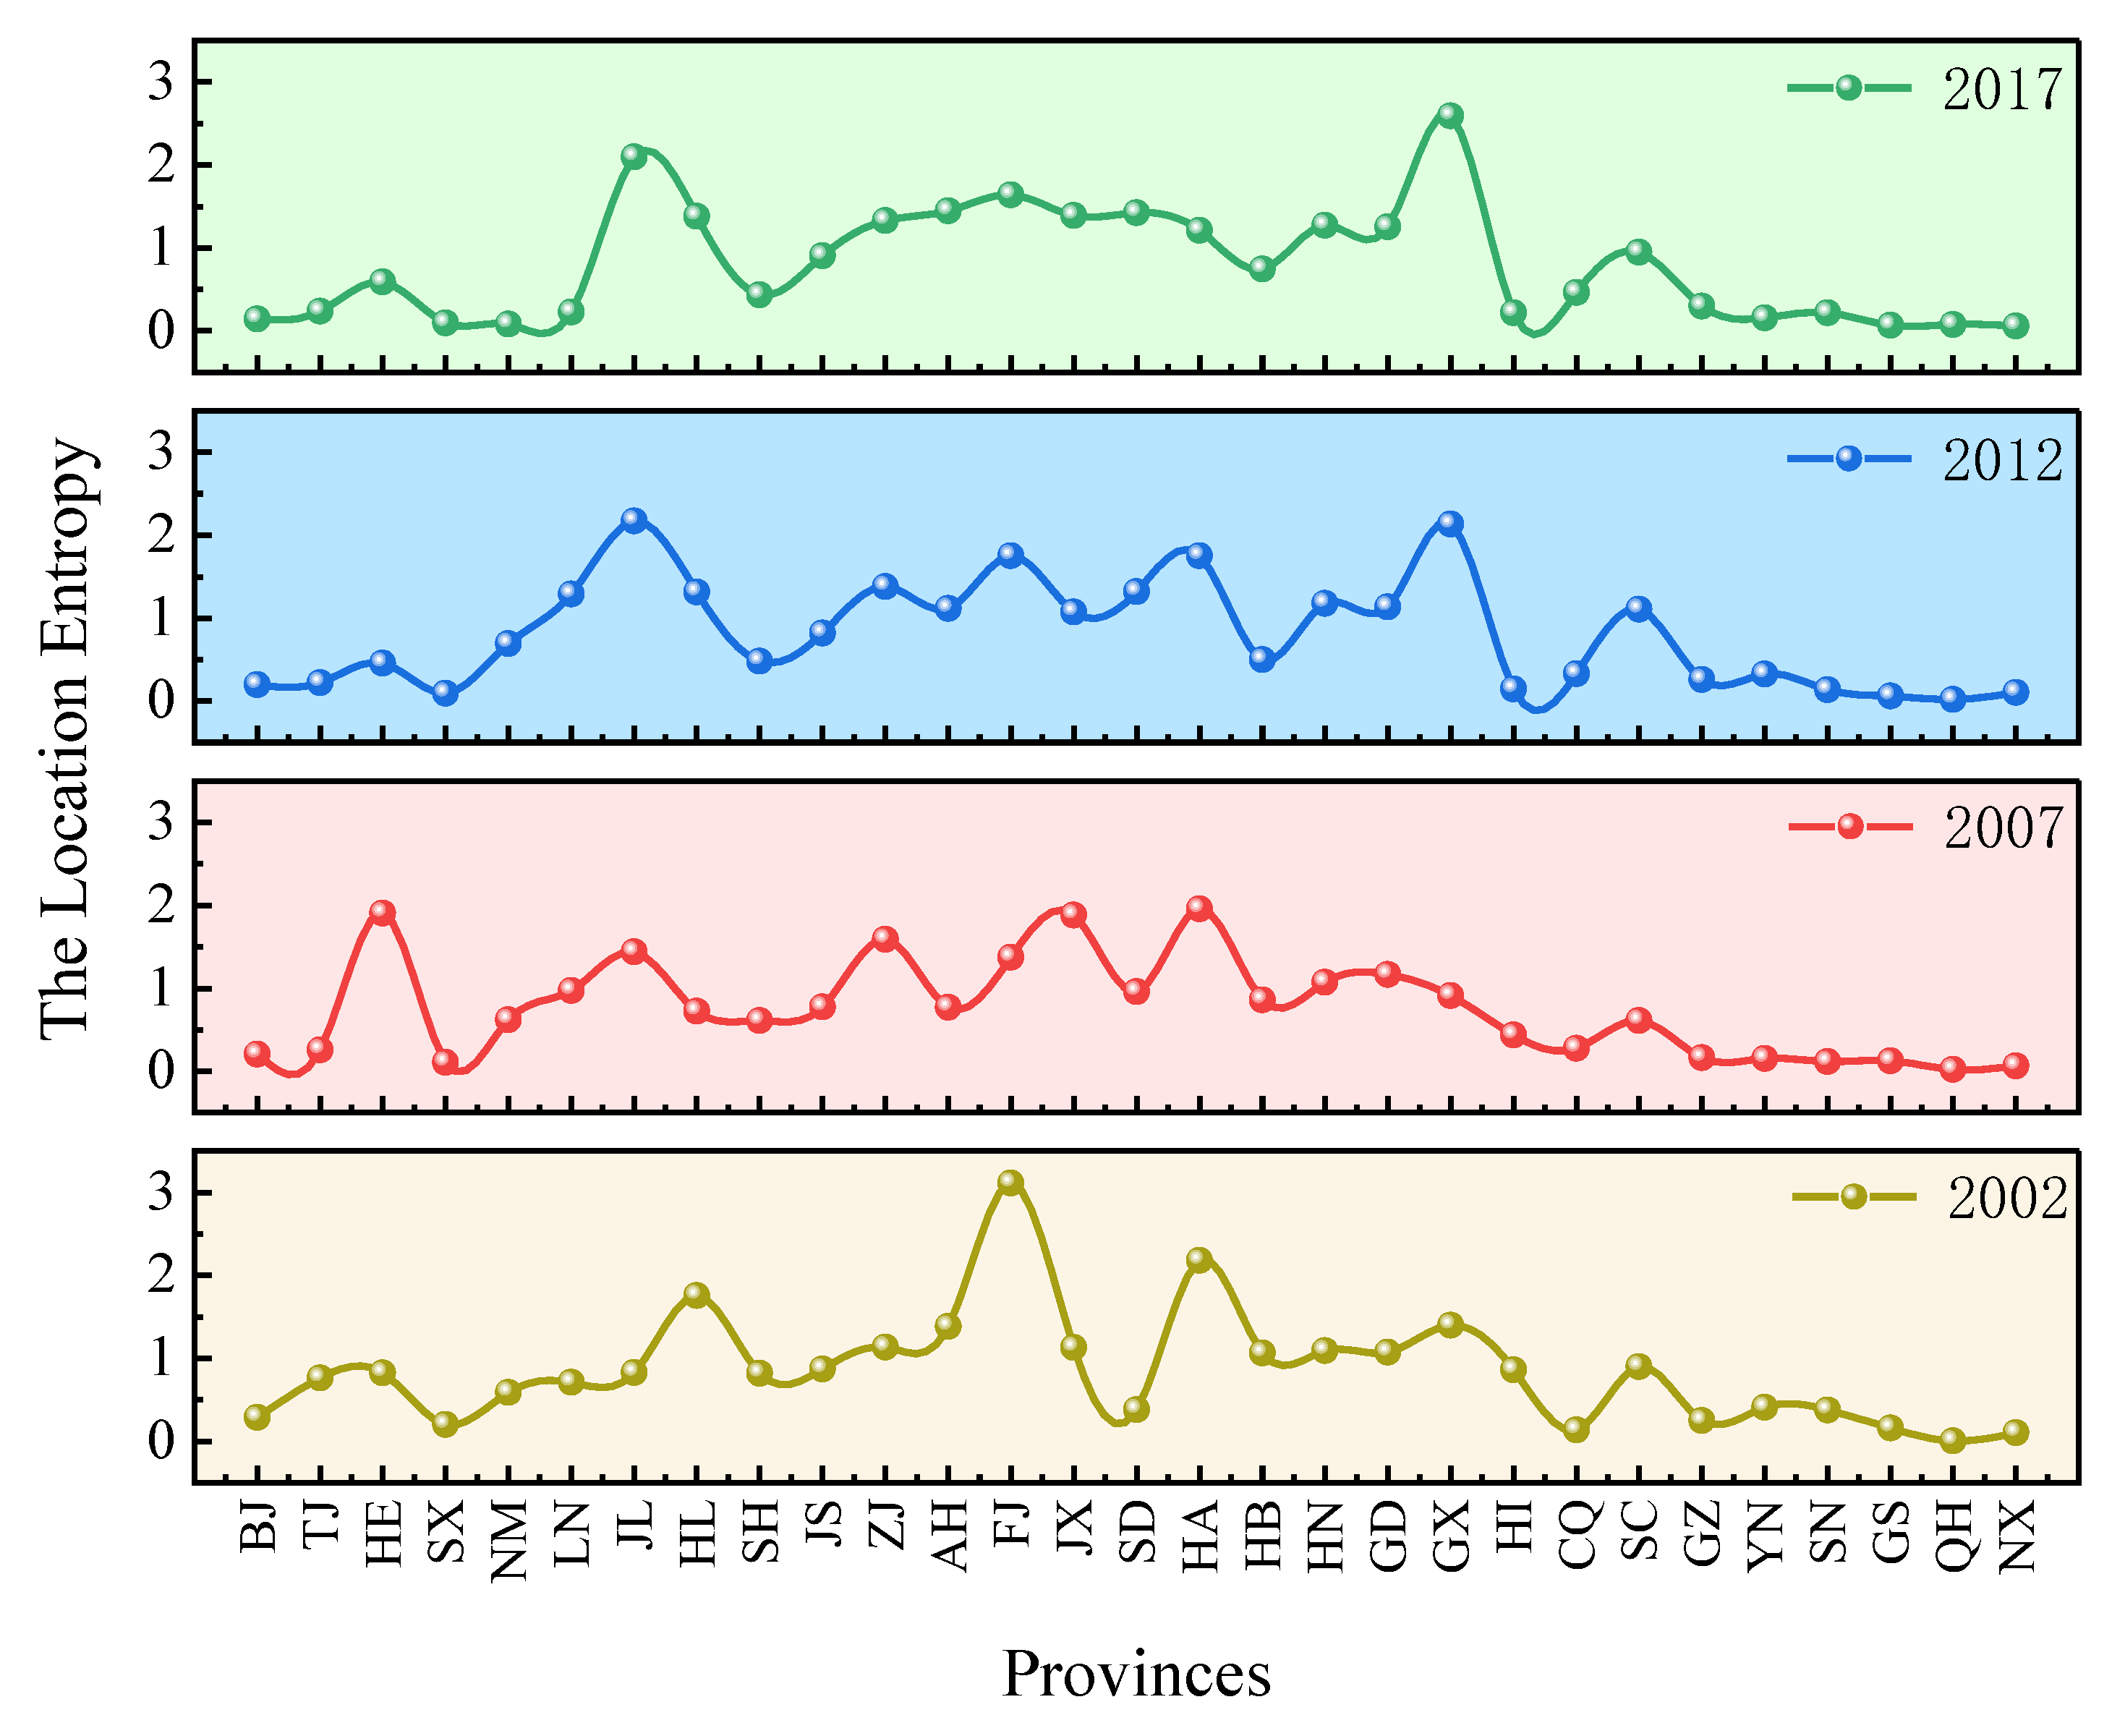
Between 2002 and 2017, the spatial and temporal variations of the location entropy (LQ) of the wood products industry in each province were remarkable, as shown in
Figure 1. The industry was highly concentrated in “East China” and the “Central and Southern China region” at an early stage. It then gradually formed a new pattern of “North–South Dual Core Driving” at a later stage. Although the eastern coastal region maintained the comparative advantage of LQ > 1 for a long time, its growth rate slowed down significantly, and some of the traditionally strong provinces even saw a trend of decline. For example, the location entropy of the traditional coastal province of Fujian dropped from a peak of 3.12 in 2002 to 1.64 in 2017. In contrast, the northeastern region and inland provinces have achieved leapfrog development through technological iteration and resource reconstruction: the LQ comparative advantage of Jilin and Shandong has increased year-by-year and they have risen to become the emerging agglomeration centers. On the contrary, in the southwest and northwest regions, limited by the availability of resources and a weak economic foundation, the average LQ value always hovers below 0.8, and there is a continuous polarization trend.
On the whole, the industrial layout evolved from the early coastal agglomeration to the multi-level network of “multi-point dispersion and resource reinforcement”, presenting the gradient transfer trend of “extending from the coast to the inland and penetrating from the south to the north”.
This paper focuses on the location entropy (LQ) data of Heilongjiang Province for in-depth analysis. In 2002, the LQ of the wood products industry in Heilongjiang Province reached 1.756, exceeding 93% of the provinces in the country, at an absolute high level. This is due to the natural forest resource endowment of state-owned forest areas such as Daxinganling and the logging and processing infrastructure accumulated during the First Five-Year Plan period, which supported the high concentration of the primary processing industry, but the “resource-dependent” development mode has buried the hidden problems of low value added and ecological constraints. In 2007, because of the “natural forest protection project” and the promotion of deep processing in the coastal areas transforming the competitive impact, resulting in the contraction stage of the industrial scale and forcing the industry to eliminate backward production capacity, the wood products industry in Heilongjiang Province entered a period of adjustment to the pressure, and the LQ fell to 0.725, lower than the national average value. The LQ gradually rebounded to 1.379 in 2012–2017, widening the advantage again, surpassing 79% of the provinces nationwide. This is mainly attributed effective cultivation of plantation forests in the province and the deepening of forestry cooperation with Russia, which has cracked the bottleneck of raw materials. The introduction of the Heilongjiang Forestry Industry Development Plan (2016–2020) also provided policy support for its development.
Location entropy (LQ), is the core indicator of regional measurement; the larger the result, the higher the degree of industrial specialization and comparative advantage.
Table 3 shows that the average value of LQ is relatively stable at the national level, fluctuating around 0.8, while the LQ of Heilongjiang Province shows a “U-shape” fluctuation in the statistical years. Comparison shows that the LQ of Heilongjiang Province is lower than the national average only briefly around 2007, and consistently higher than the national average in other statistical periods. Therefore, the wood products industry in Heilongjiang Province has significant comparative advantage and an agglomeration effect in the national context, and the industrial advantage is obvious.
3.2. Analysis of the Full Consumption Factor
From 2002 to 2017, the standard deviation values for each statistical year were 0.26, 0.28, 0.29, 0.38, 0.41, and 0.33. These values are relatively high and show an upward trend, indicating that the disparities in total consumption coefficients across industries are gradually widening. The degree of dependence of each industry on the wood products industry has become increasingly differentiated, with a significant gap between the maximum and minimum values. For example, in 2015, the Textile and Garment industry had a minimum value of 0.004, meaning that producing 1000 units of clothing products requires only 4 units of wood product industry outputs. In contrast, the wood products industry itself had a maximum value of 1.74 during the same period. This demonstrates an order-of-magnitude difference in the total consumption coefficients of different industries toward the wood products industry: some industries exhibit extremely high dependence, while others incur virtually no direct or indirect consumption of wood industry products in their production processes.
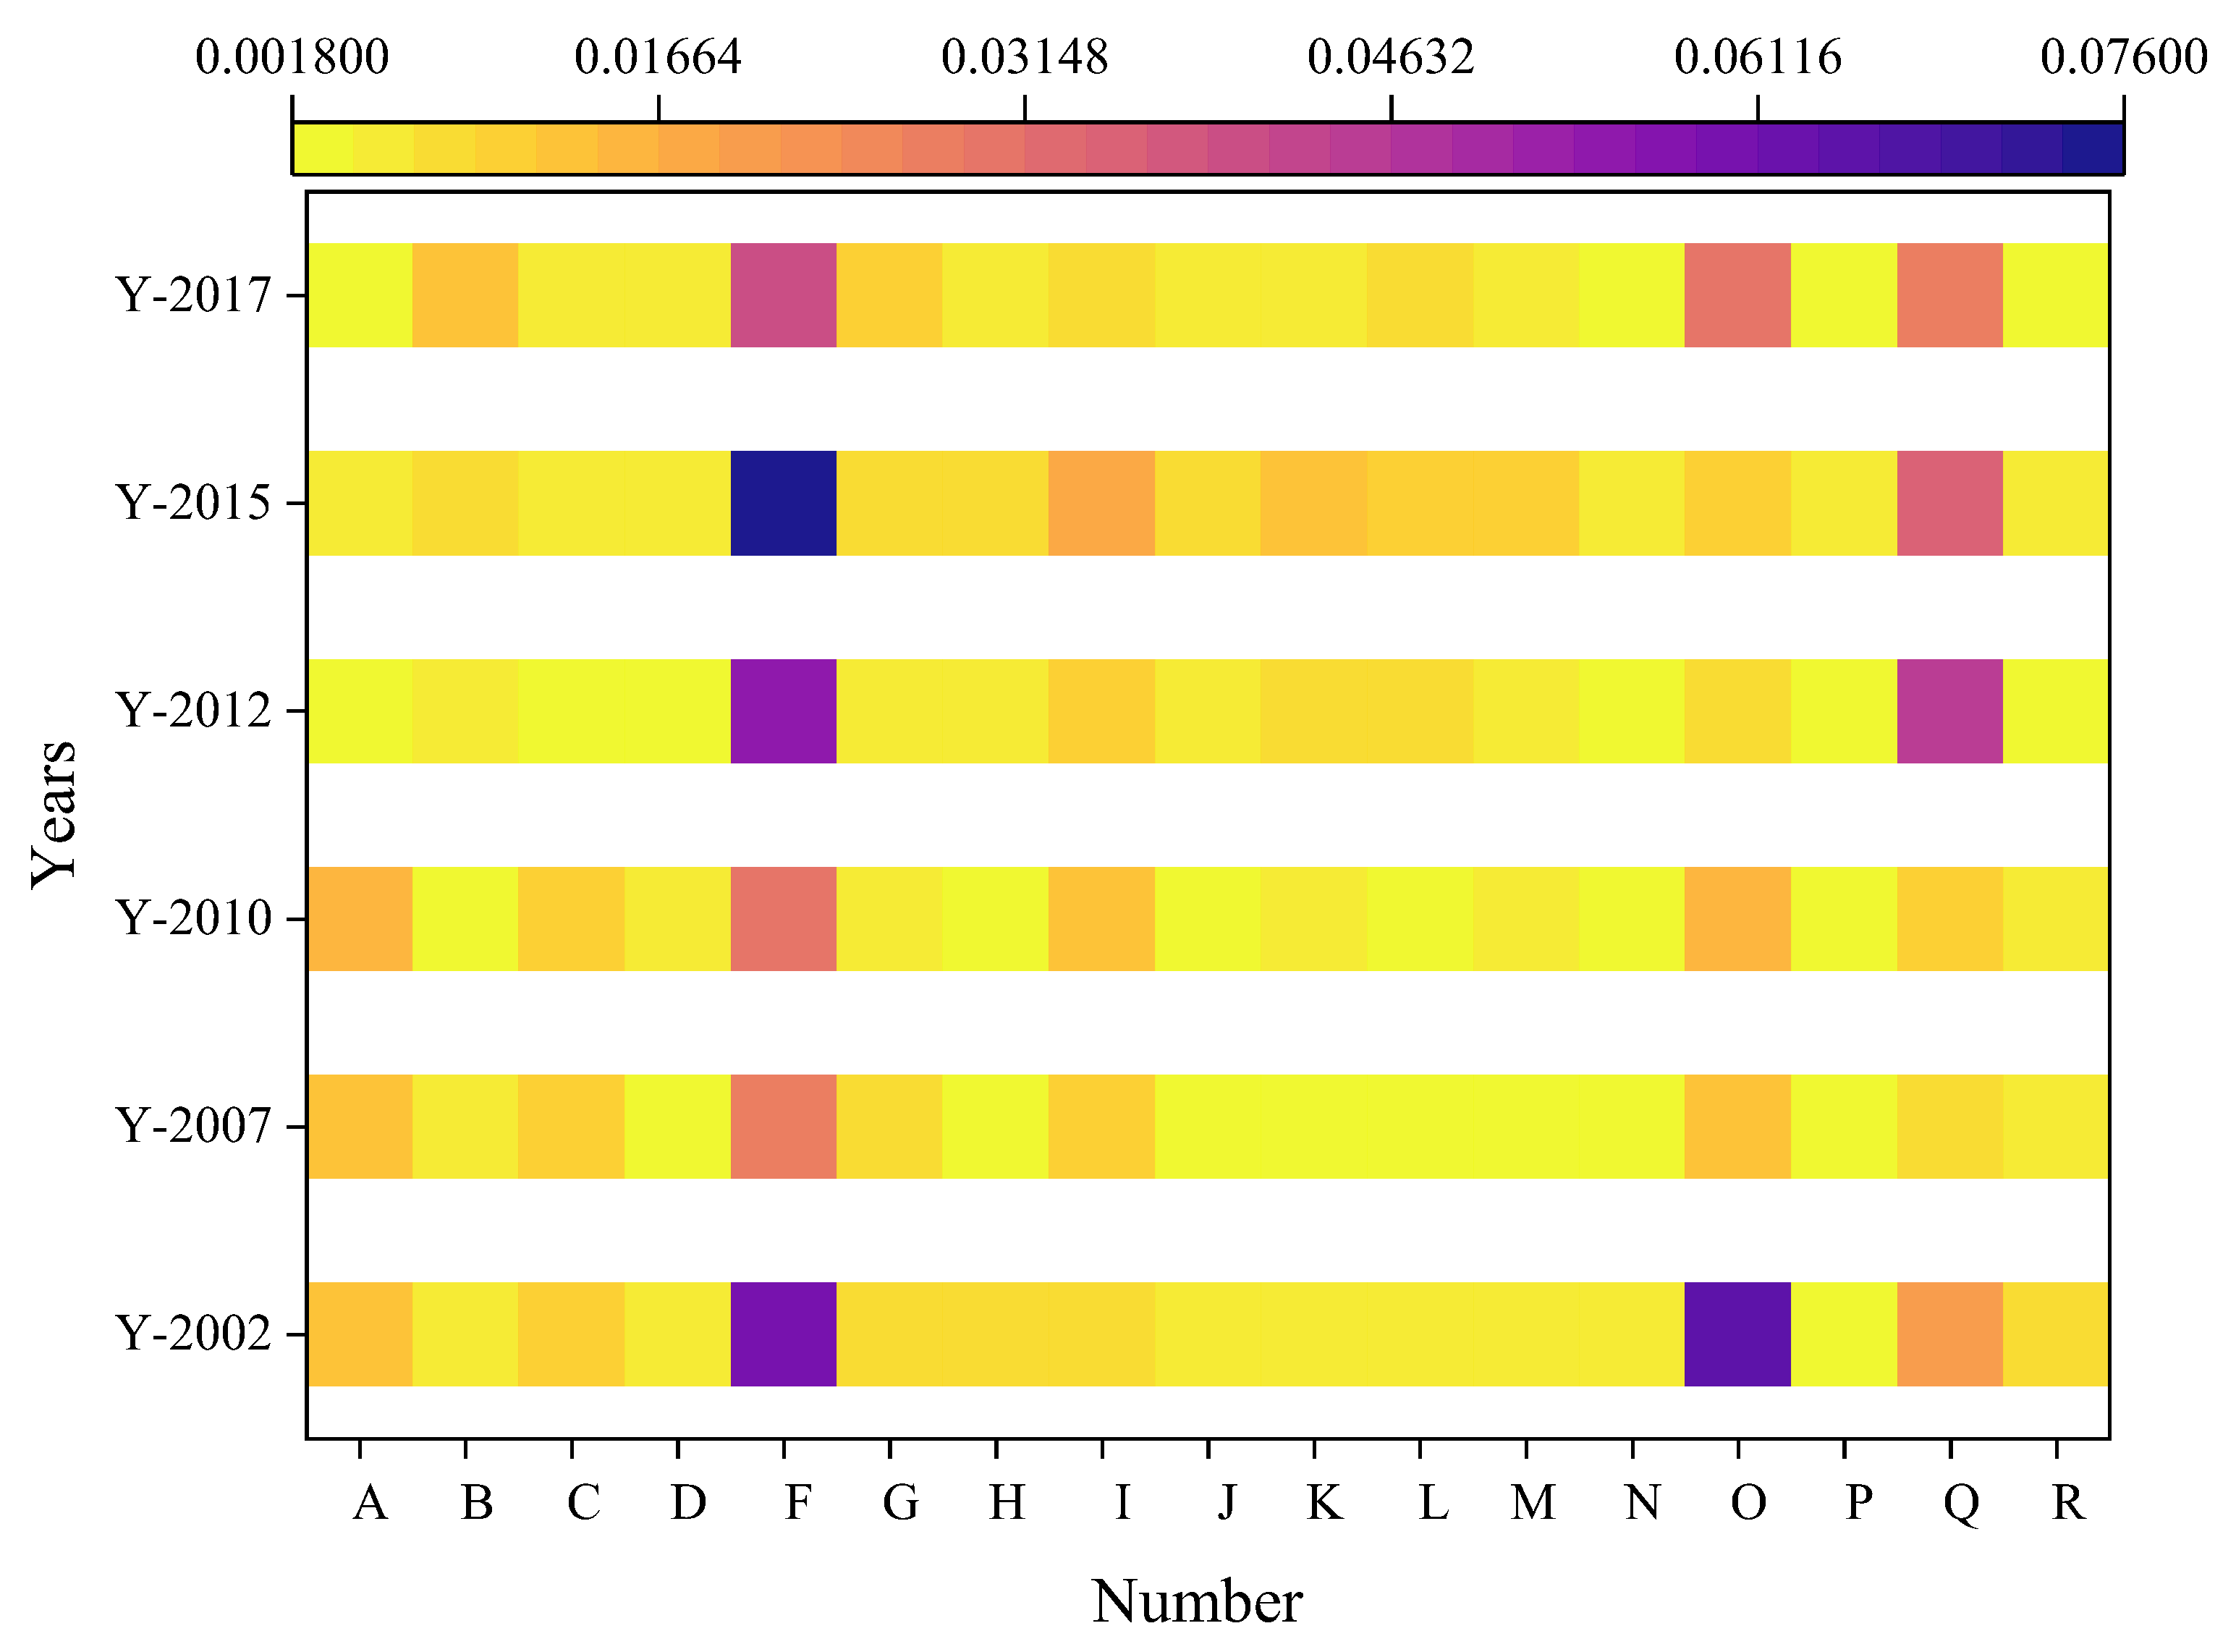
By industry, the average value of the total consumption coefficient for the wood products industry itself is significantly higher than that of other industries, reaching 1.38. This indicates that producing one unit of wood product industry output involves a combined direct and indirect consumption of 1.38 units. In other words, the industry exhibits the highest self-consumption of its products during the production process. The distribution of total consumption coefficients for the wood products industry across other industries is shown in
Figure 2.
As of 2017, Heilongjiang Province had a forest area of 21.5 million hectares; timber reserves of 2.14 billion cubic meters, accounting for 1/8 of the country’s total; and timber imports to Russia averaging 12 million cubic meters per year, representing a large timber resource endowment. Abundant local resources and low-cost imported wood resources give the local wood products industry an advantage, driving the industry to form a primary processing-led structure. On the one hand, this is due to a need to support the industry within the cycle of consumption, such as wood-based panel production relying on sawn timber residues or secondary processing of primary panels; on the other hand, to shape the pattern of downstream linkage, the paper and printing industry relies on timber fibers, and the construction industry needs the panels, both of which are due to the supporting nature of the local timber processing system, reflecting the fact that the formation of the wood products industry has a relatively high level of consumption. However, the industry has long been subject to the logic inhibition of resource realization in a “short and quick” fashion, resulting in the fact that, in Heilongjiang Province, the extension of the deep processing chain is insufficient. Imports of logs from Russia and the rough processing of wood-based structures further strengthen the local “primary processing and then processing” path, resulting in weak penetration of downstream related industries, and meaning that the provinces’s products find it difficult to widely penetrate multiple sectors of the national economy.
Overall, the complete consumption coefficients remain at a low level, predominantly fluctuating around 0.01. This suggests that, aside from the wood products industry’s self-reinforcing consumption, other industries exhibit generally weak direct and indirect dependence on Heilongjiang’s wood products industry. Notably, the complete consumption coefficients of the papermaking and printing industry (F), other manufacturing industries (O), and construction industry (Q) are significantly higher than those of other sectors, confirming their relatively strong industrial linkages with the wood products industry. This phenomenon is closely tied to the wood products industry’s characteristics as an intermediate processing node in the forestry industry chain. Its products—such as wood-based panels and furniture components—primarily serve specific downstream sectors rather than being widely integrated across all segments of the national economy.
3.3. Analysis of Upstream and Downstream Degrees
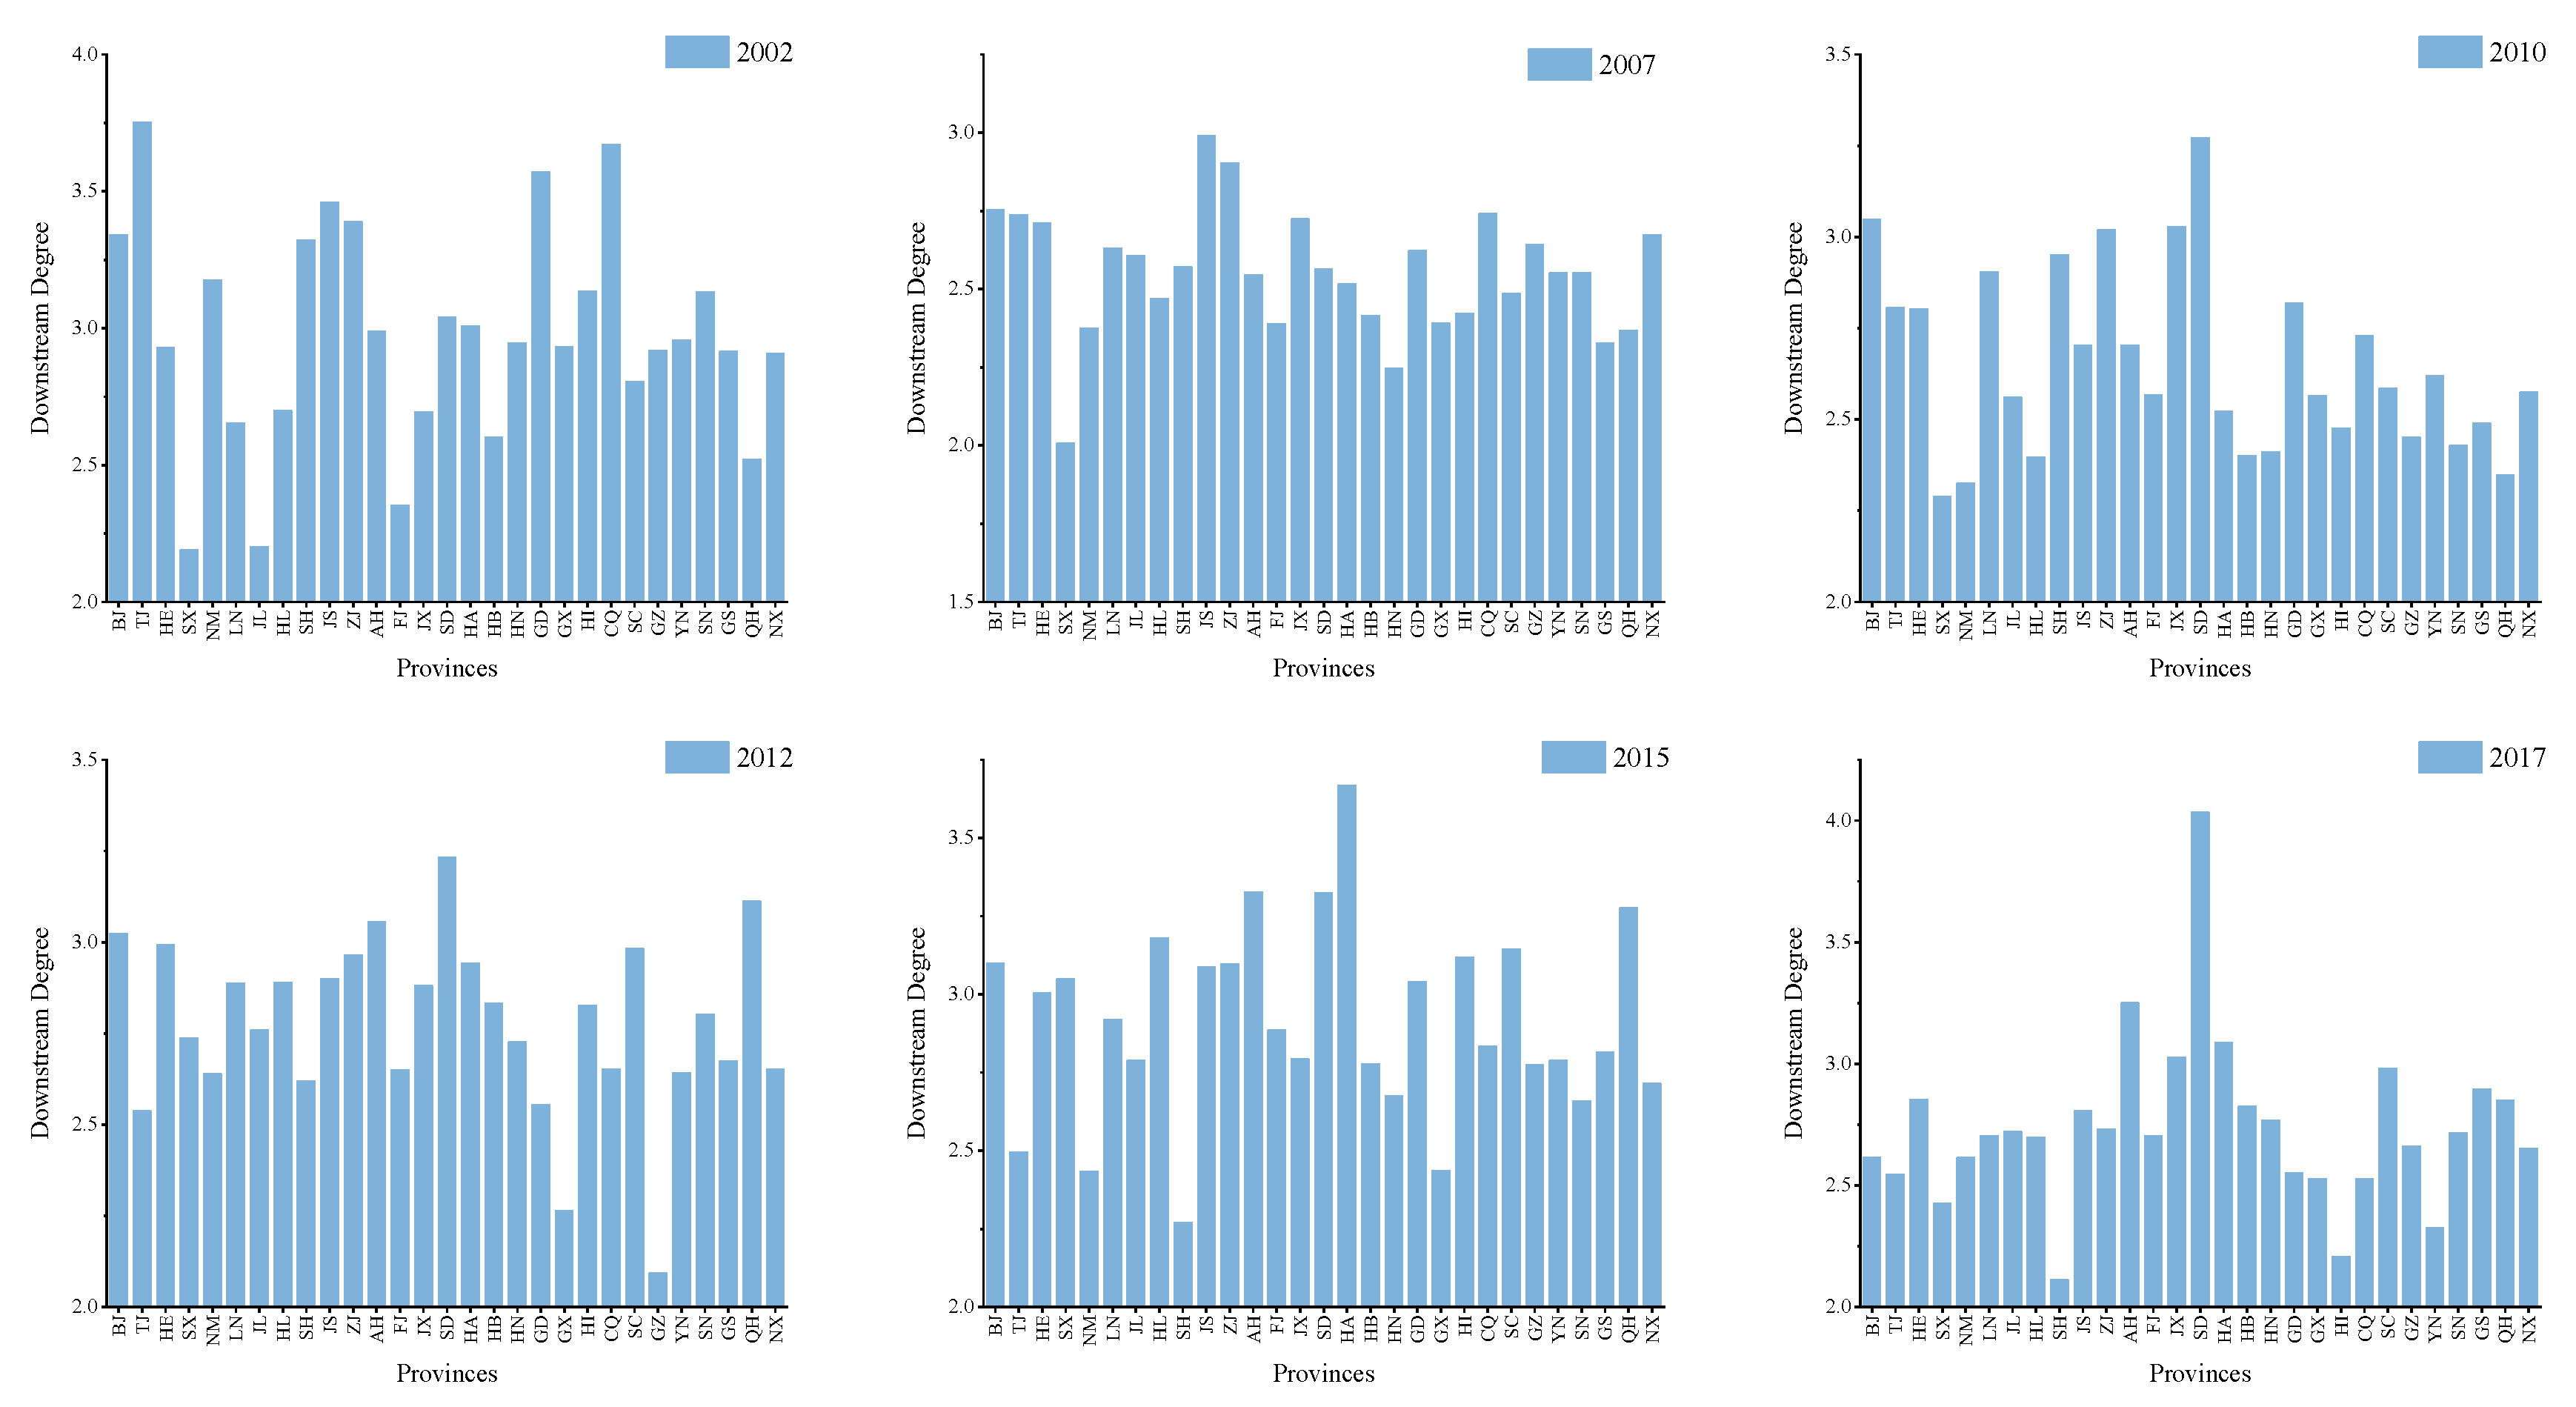
For the wood products industry, the extent of upstream advantages is primarily reflected in raw material control capabilities and the security and stability of raw material supply. For instance, if a province’s wood products industry holds strengths in upstream segments such as timber planting and logging, it can more effectively manage raw material costs and supply volumes. Downstream advantages, by contrast, focus more on product processing depth, market competitiveness, and sales channels. For example, deep processing of wood products—such as furniture manufacturing and woodcarving handicraft production—enables the creation of higher-value-added products and helps enterprises gain a favorable position in the sales market.
From 2002 to 2017, the national downstream degree values of the wood products industry remained relatively stable, while the upstream degree values in most provinces exhibited a fluctuating downward trend. This indicates that the wood products industry has gradually shifted toward the final consumer end and away from the primary raw material supply side within the overall production chain. In 2002, the upstream degree values of the wood products industry in all provinces were generally higher than their downstream counterparts, reflecting the industry’s closer proximity to primary raw material supply at that time. By 2017, this gap had significantly narrowed, suggesting that the industry’s position in the industrial chain had shifted toward deep processing markets, with reduced complexity and interlinkages in intermediate product supply and a stronger orientation toward final markets (
Figure 3 and
Figure 4).
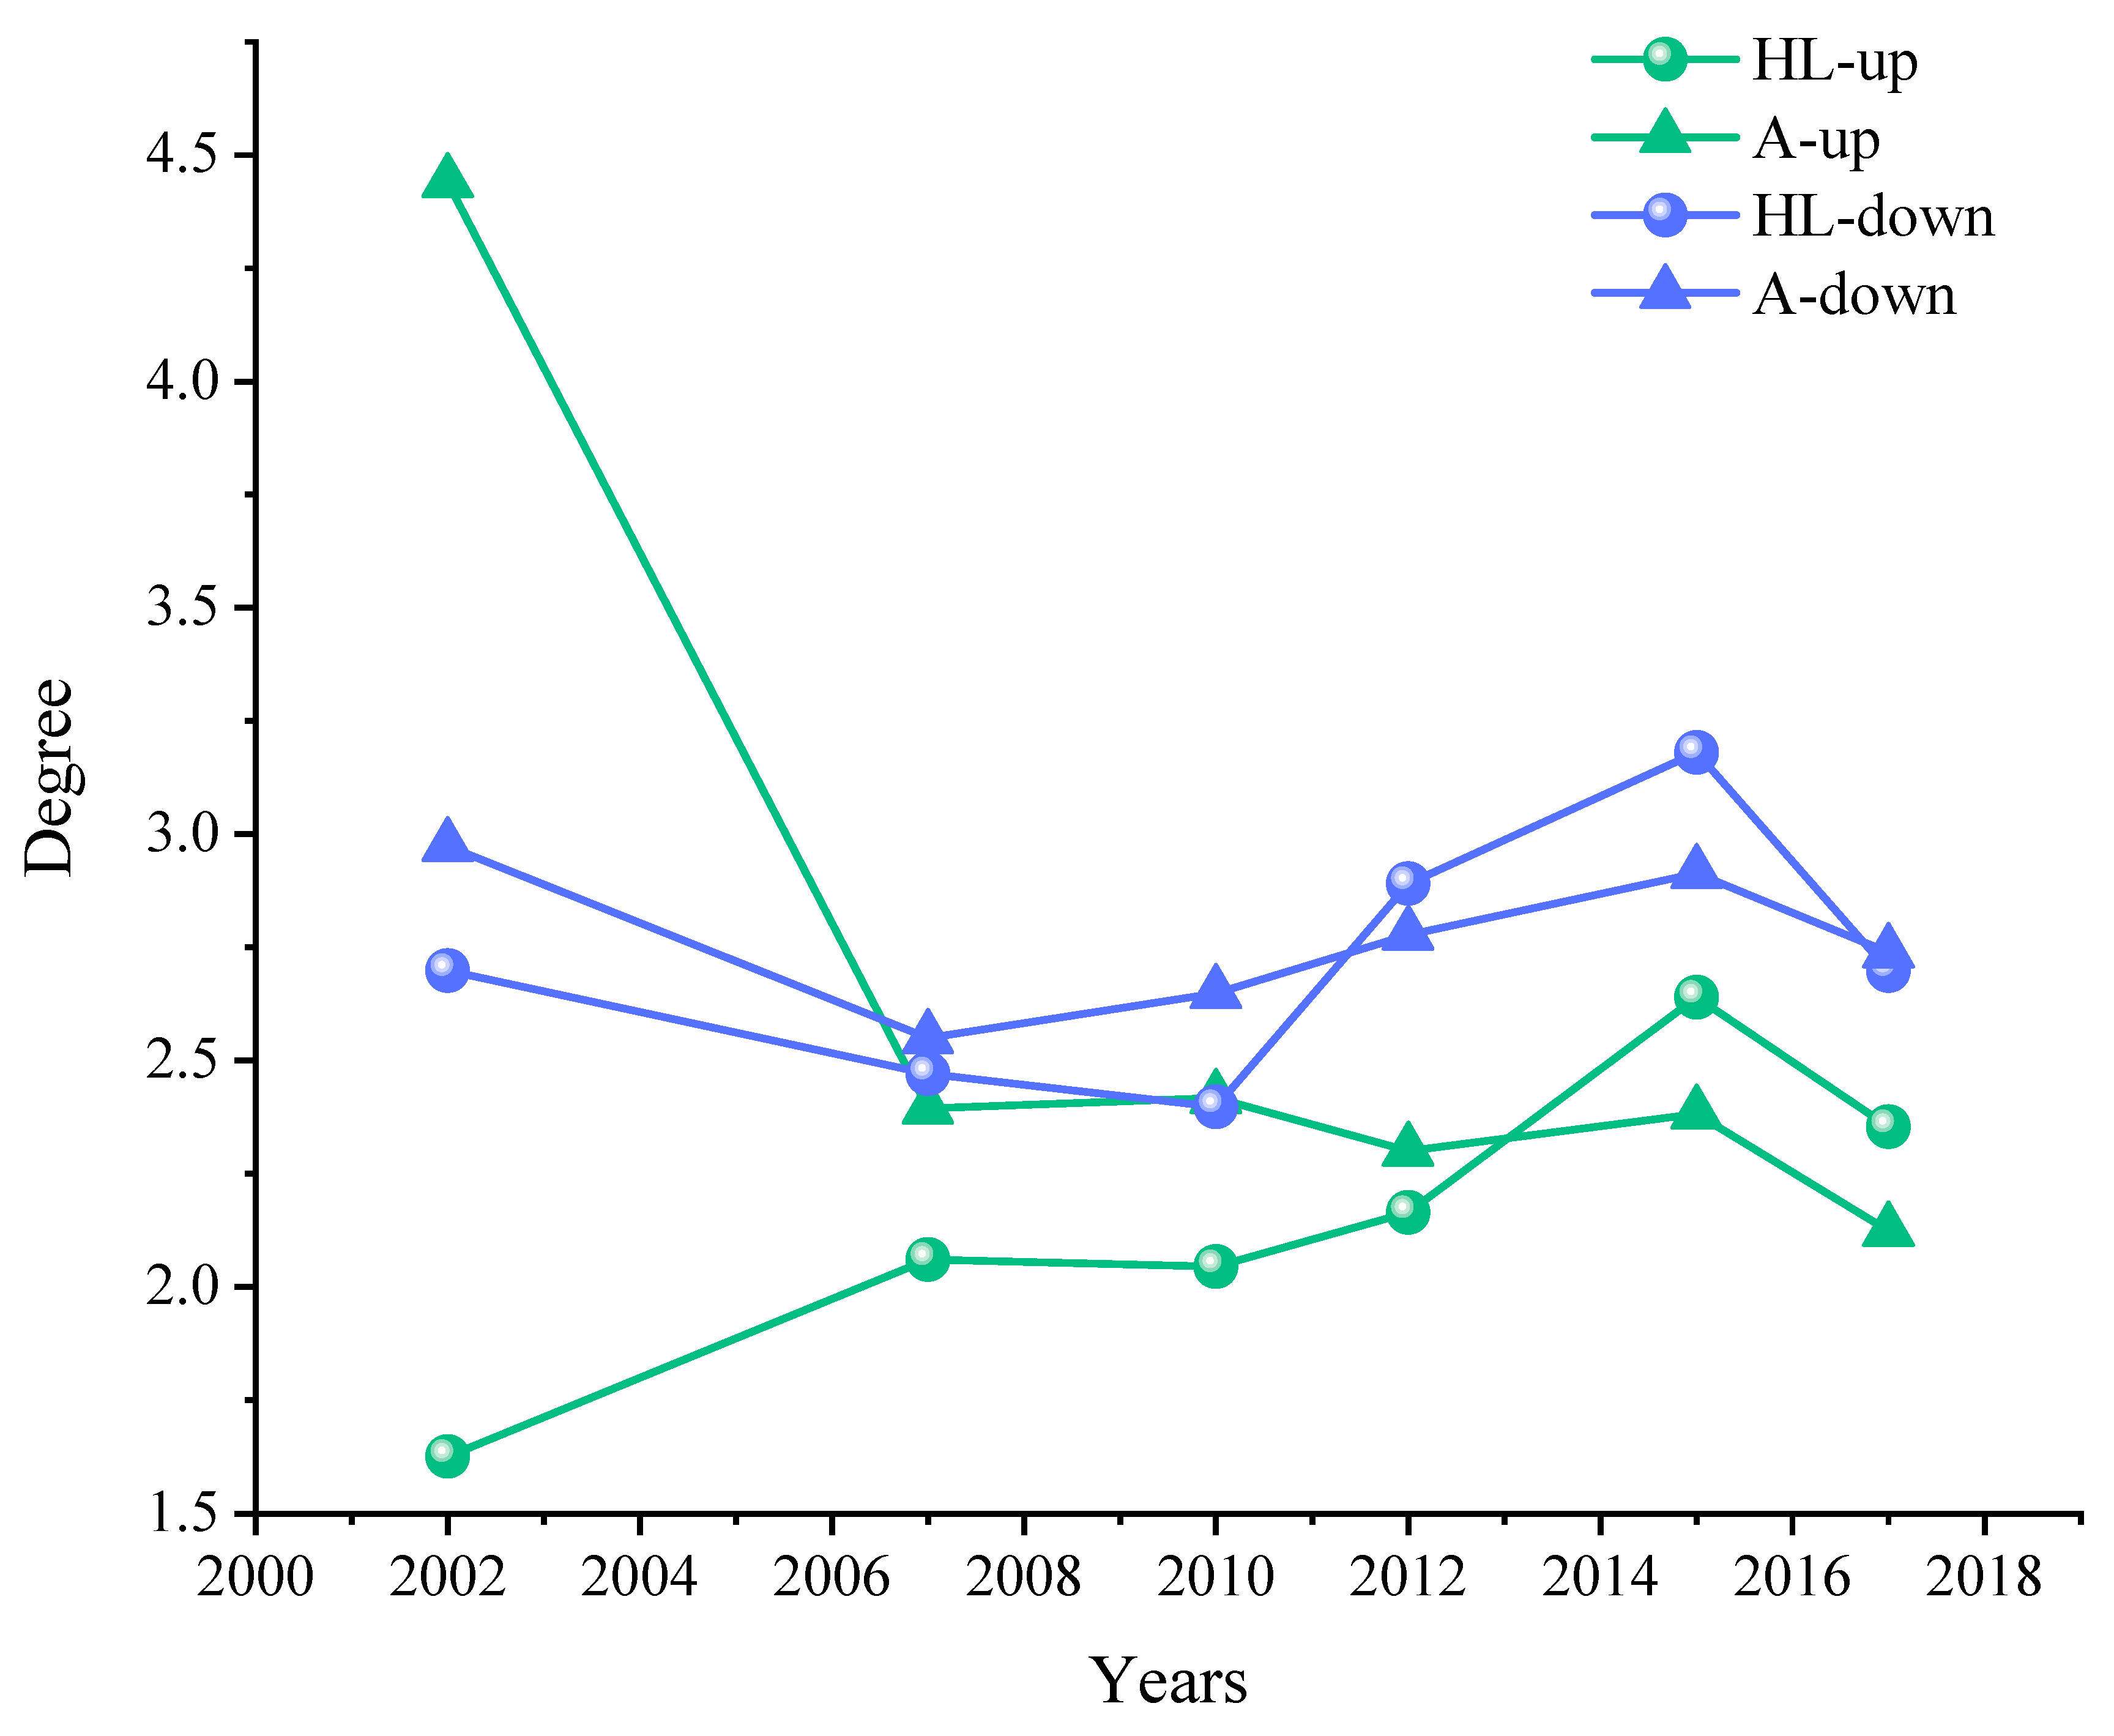
Figure 5 shows a comparison between the upstream and downstream degrees of Heilongjiang Province and the average value of upstream and downstream degrees of 29 provinces in the country, from which it can be seen that the upstream degree of Heilongjiang Province gradually climbed from 2002 to 2012, reaching a maximum value of about 2.64 in 2015, which was higher than the national average at the time, and began to maintain a consistent downward trend with the changes in the upstream degree of the country; the downstream degree of the change in the trend of the national average level for the period 2002–2010, although lower than the national average level, has a smaller gap. The trend of downstream degree change is consistent with the national average; in 2002–2010, Heilongjiang Province was lower than the national average, but the difference was smaller; in 2015, it broke through and also reached a peak of about 3.18, and in 2017, although it was lower than the national level, the difference was only 1.11%.
In 2002, the average value of the upstream degree of the national wood products industry reached a historical peak of 4.44, mainly relying on the policy environment and industrial structure. At that time, the domestic macro-economy continued to improve, the demand for wood products was steadily expanding, and the national timber industry was still mainly a resource-driven layout, that is, with resource dependence on the strengthening of the production area near the processing stage. At the same time, the “Natural Forest Protection Project” was still in the early stage of transition easing, plantation forest and collective forest logging control had not been completely tightened, the nationwide timber supply was relatively stable, and it was in the interests of enterprises to take the initiative to strengthen the layout of the upper reaches. Afterward, with policy constraints and industrial transformation, the wood products industry shifted focus from scale expansion to value enhancement, the national wood products industry upstream degree declined sharply, and ultimately, through the reconstruction of the industrial structure, the dynamic balance of supply and demand reached a stable state.
A focus on Heilongjiang Province reveals that, in 2015, its upstream and downstream integration degrees reached an all-time high. This period was marked by the implementation of the “Quality Longjiang” Construction Implementation Program (2012–2015). The program proposed actively converting the forestry and wood resource advantages into product advantages, stipulating that the supervision and sampling pass rates for wood products, wooden products, and wood-based panel products should reach 90%. These measures significantly enhanced the quality level of wood products and promoted the development of the wood products industry. Subsequently, the introduction of the “Heilongjiang Province Forestry Industry Development Plan (2016–2020)” and a series of supporting policies laid a solid policy foundation for the industry’s subsequent stable development.
Overall, the upstream degree of the wood products industry in Heilongjiang Province has been improved, which will help to strengthen the industrial base and improve overall competitiveness; the downstream degree is greater than the upstream degree, which indicates that Heilongjiang Province occupies the product processing link in the chain, with advanced processing equipment, a high-quality labor force, and advanced technology, which means that resources can be processed into high-quality wood and high value-added wood products, and that, in the downstream product processing and sales stages, the products are more competitive. Compared with other provinces, the industry chain of this province is closely coordinated, with high efficiency and value added in all links, with highly competitive enterprises, significant impact on the market, a solid industrial foundation, sufficient development momentum, and advantages in scale and cost, which can promote regional economic growth and drive the synchronized development of many industries.
3.4. Formatting of Mathematical Components
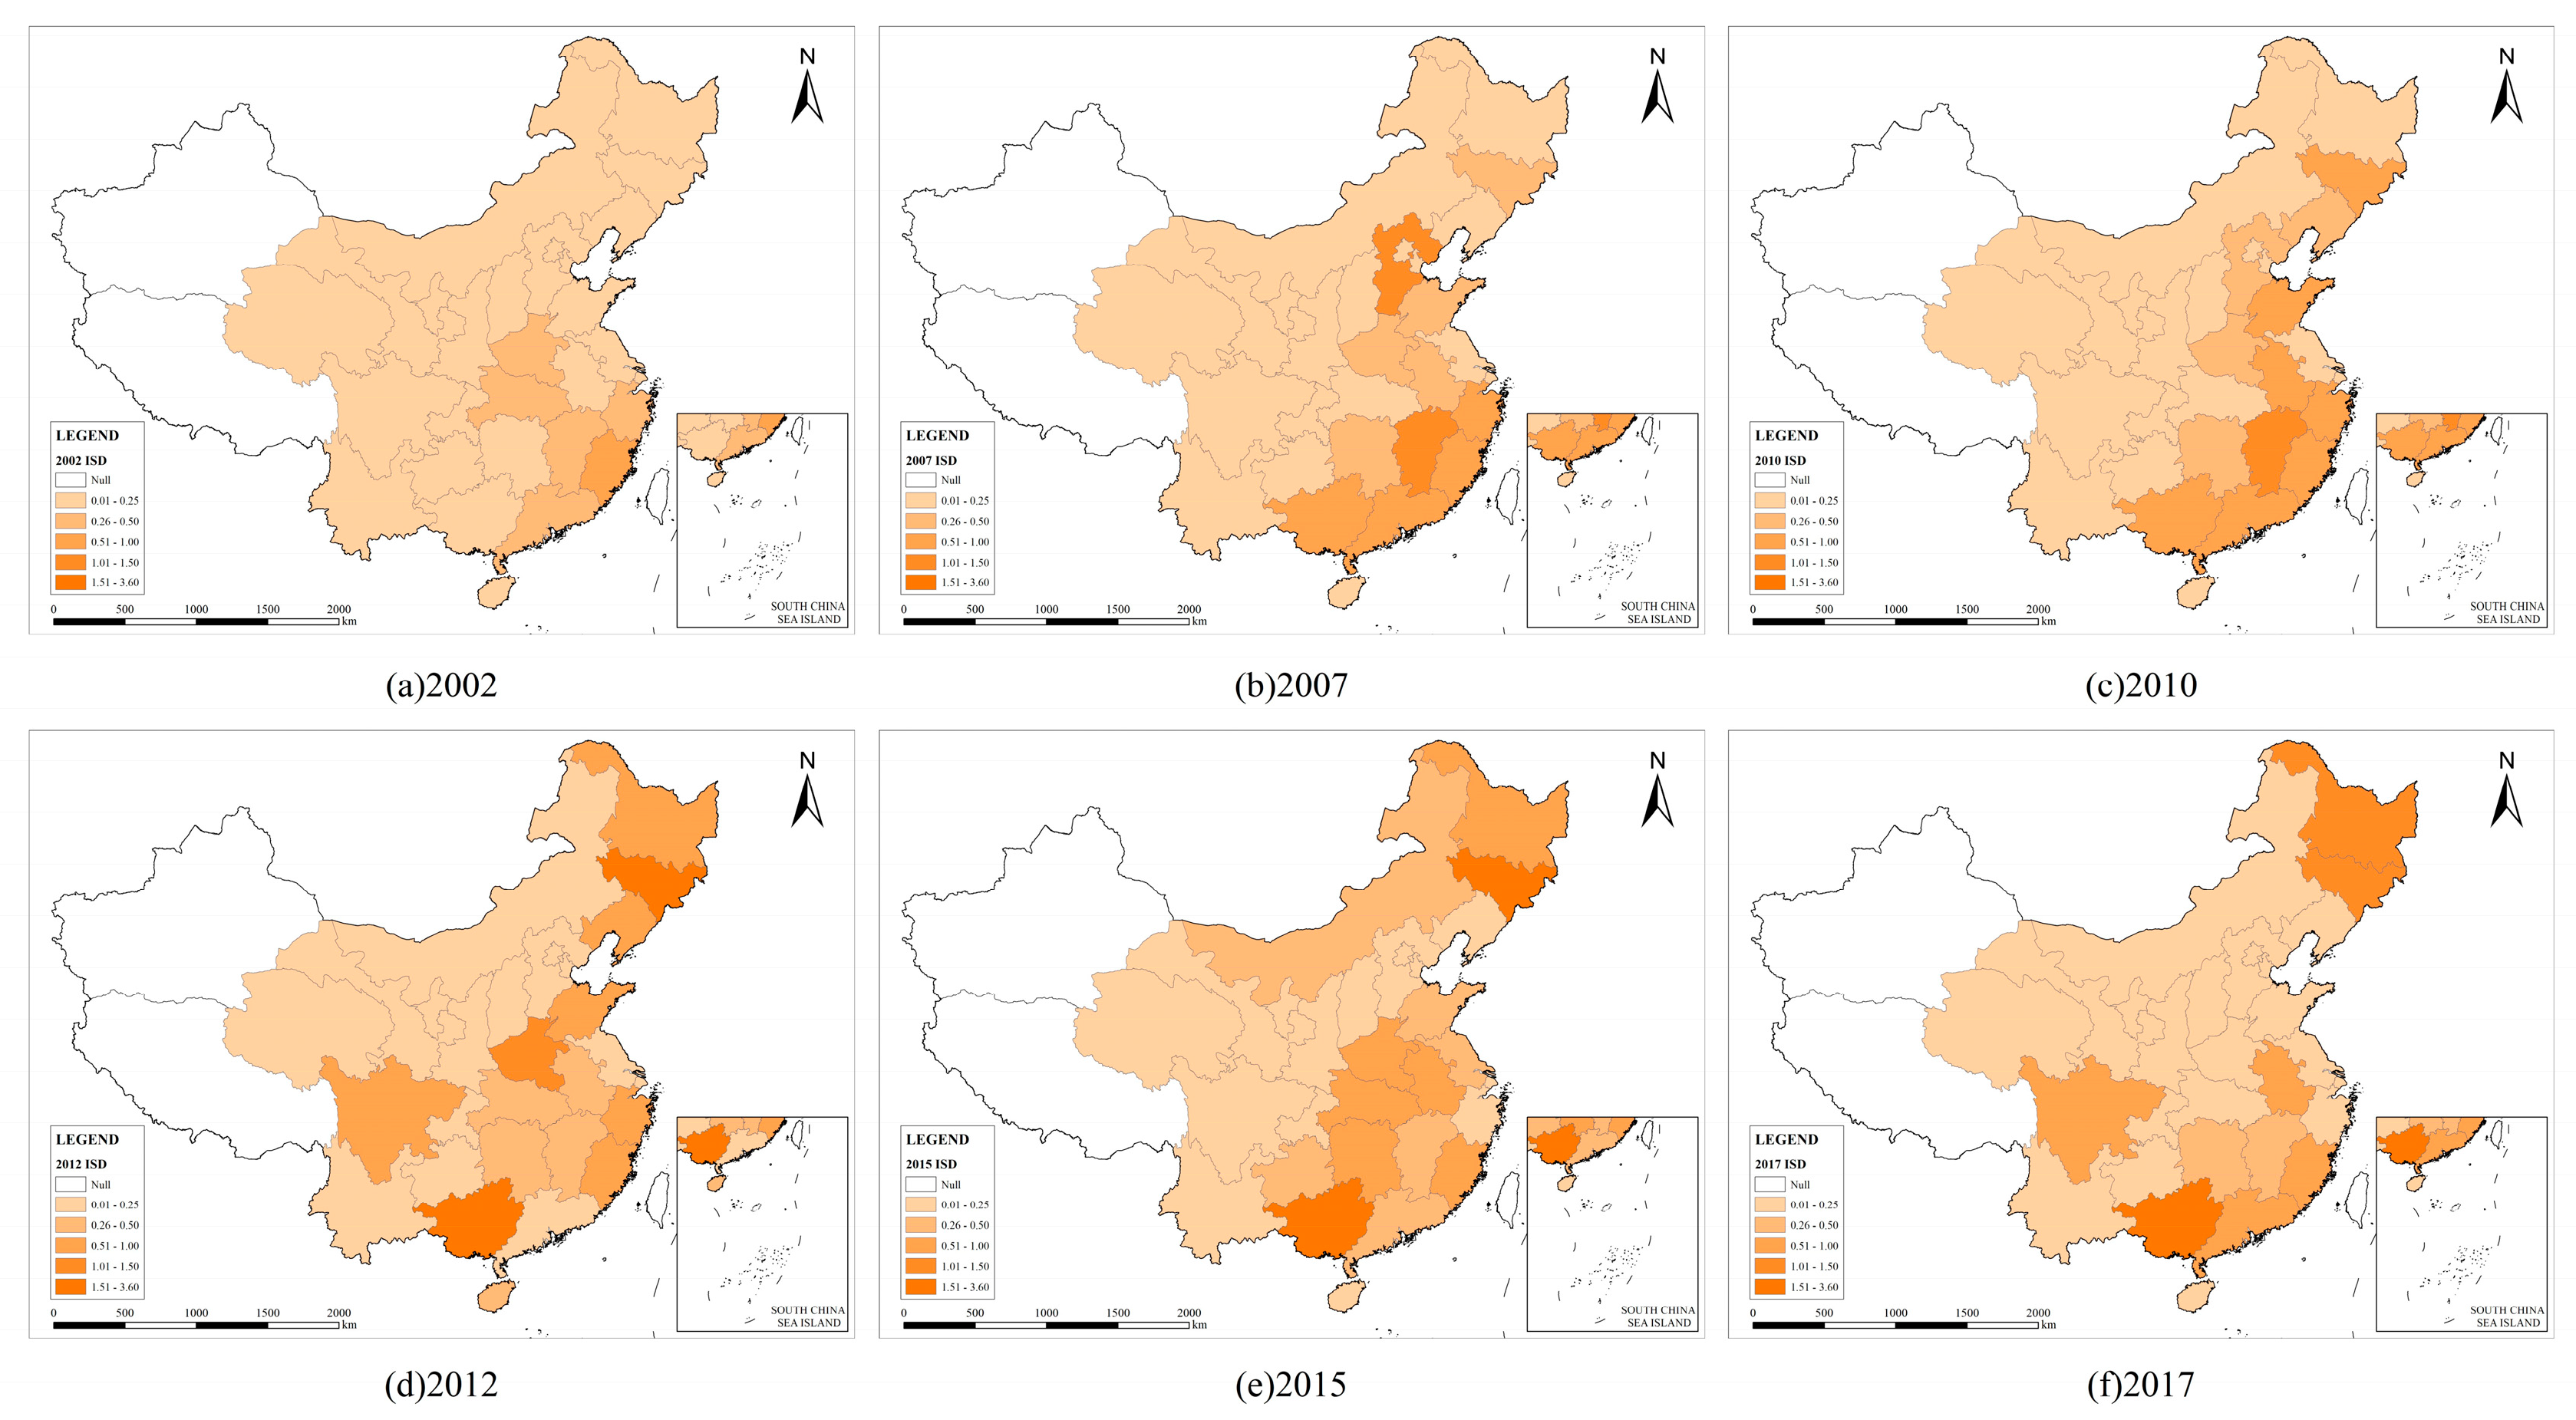
Figure 6 and
Figure 7, respectively, illustrate the changes in the distribution of interregional influence coefficients and induction coefficients for the wood products industry across 29 provinces during the statistical period from 2002 to 2017.
The data indicate that across the six statistical periods, provinces with interregional influence coefficients exceeding 1 constituted 52%, 55%, 59%, 45%, 48%, and 57% of the sample, respectively. This suggests that the driving force of the wood products industry nationwide generally surpassed the regional average, with nearly or over half of the provinces exerting a significant impact on national economic growth. As shown in
Figure 5, throughout the study period, provinces in central regions such as Beijing, Tianjin, and Shaanxi consistently had influence coefficients above 1, while those in southeast coastal regions like Jiangsu, Zhejiang, and Shanghai saw their influence coefficients fluctuate around a threshold of 1, though both groups maintained leading positions. This demonstrates a strong capacity to radiate and drive the domestic market, as evidenced by the increasing proportion of darker-shaded areas in central and western regions, reflecting an expanded scope of influence. Collectively, these observations reveal that most of the national wood products industry is situated in the mid-to-lower reaches of the industrial chain, exhibiting higher dependence on upstream sectors. Its demand growth can significantly stimulate output growth in other regions, thereby generating new market demand.
In
Figure 6 and
Figure 7, ISD stands for Induction Coefficients, and IPD stands for Influence Coefficients. Compared with the influence coefficient, the national wood products industry inductance coefficient as a whole presents “weak correlation dominant” characteristics. The values of around 80% of provinces are lower than the threshold value of 1.0, indicating a weak forward-promoting role for the wood products industry. The change in the induction coefficient of regional demand is limited, and the regional economic pull effect needs strengthening. Each region shows a gradient differentiation pattern. Economically developed areas like Beijing and Shanghai consistently exhibited inductance coefficients below the threshold. In coastal regions, the inductance coefficient showed a declining trend. For instance, Zhejiang dropped sharply from 0.72 in 2007 to 0.05 in 2015. Jiangsu maintained a coefficient between 0.11 and 0.38 but with significant fluctuations. As the central region gradually rose, Anhui showed steady growth. In particular, Guangxi surged from 2.29 to 3.57 between 2012 and 2017, indicating an average annual growth rate of 22.6%. The inductance coefficients of western provinces are generally low. For example, in most years, Sichuan, Yunnan, Shaanxi, and others had coefficients under 0.2, with some even below 0.1. In contrast, the northeast region performed better. Jilin and Heilongjiang maintained relatively high inductance coefficients, indicating a clear industrial advantage.
As shown in
Table 4, based on Herman’s benchmark, the wood products industry is classified into four categories according to the magnitude of influence and induction coefficients: I Sensitive Association, II Influential Association, III Retarded Association, and IV Inductive Association.
Taking the induction coefficient and influence coefficient as the horizontal and vertical coordinates, respectively, Type I represents industry sectors with strong radiation capacity and strong constraints. According to the results, typical examples of Type I include Jiangxi Province in 2010 and Jilin Province in 2017, where the wood products industry exhibited strong radiation-driven effects and constraints. Type IV, predominantly comprising upstream industries, is characterized by strong radiation-driven effects but weak constraints. The wood products industry in Heilongjiang Province in 2017 falls into this category.
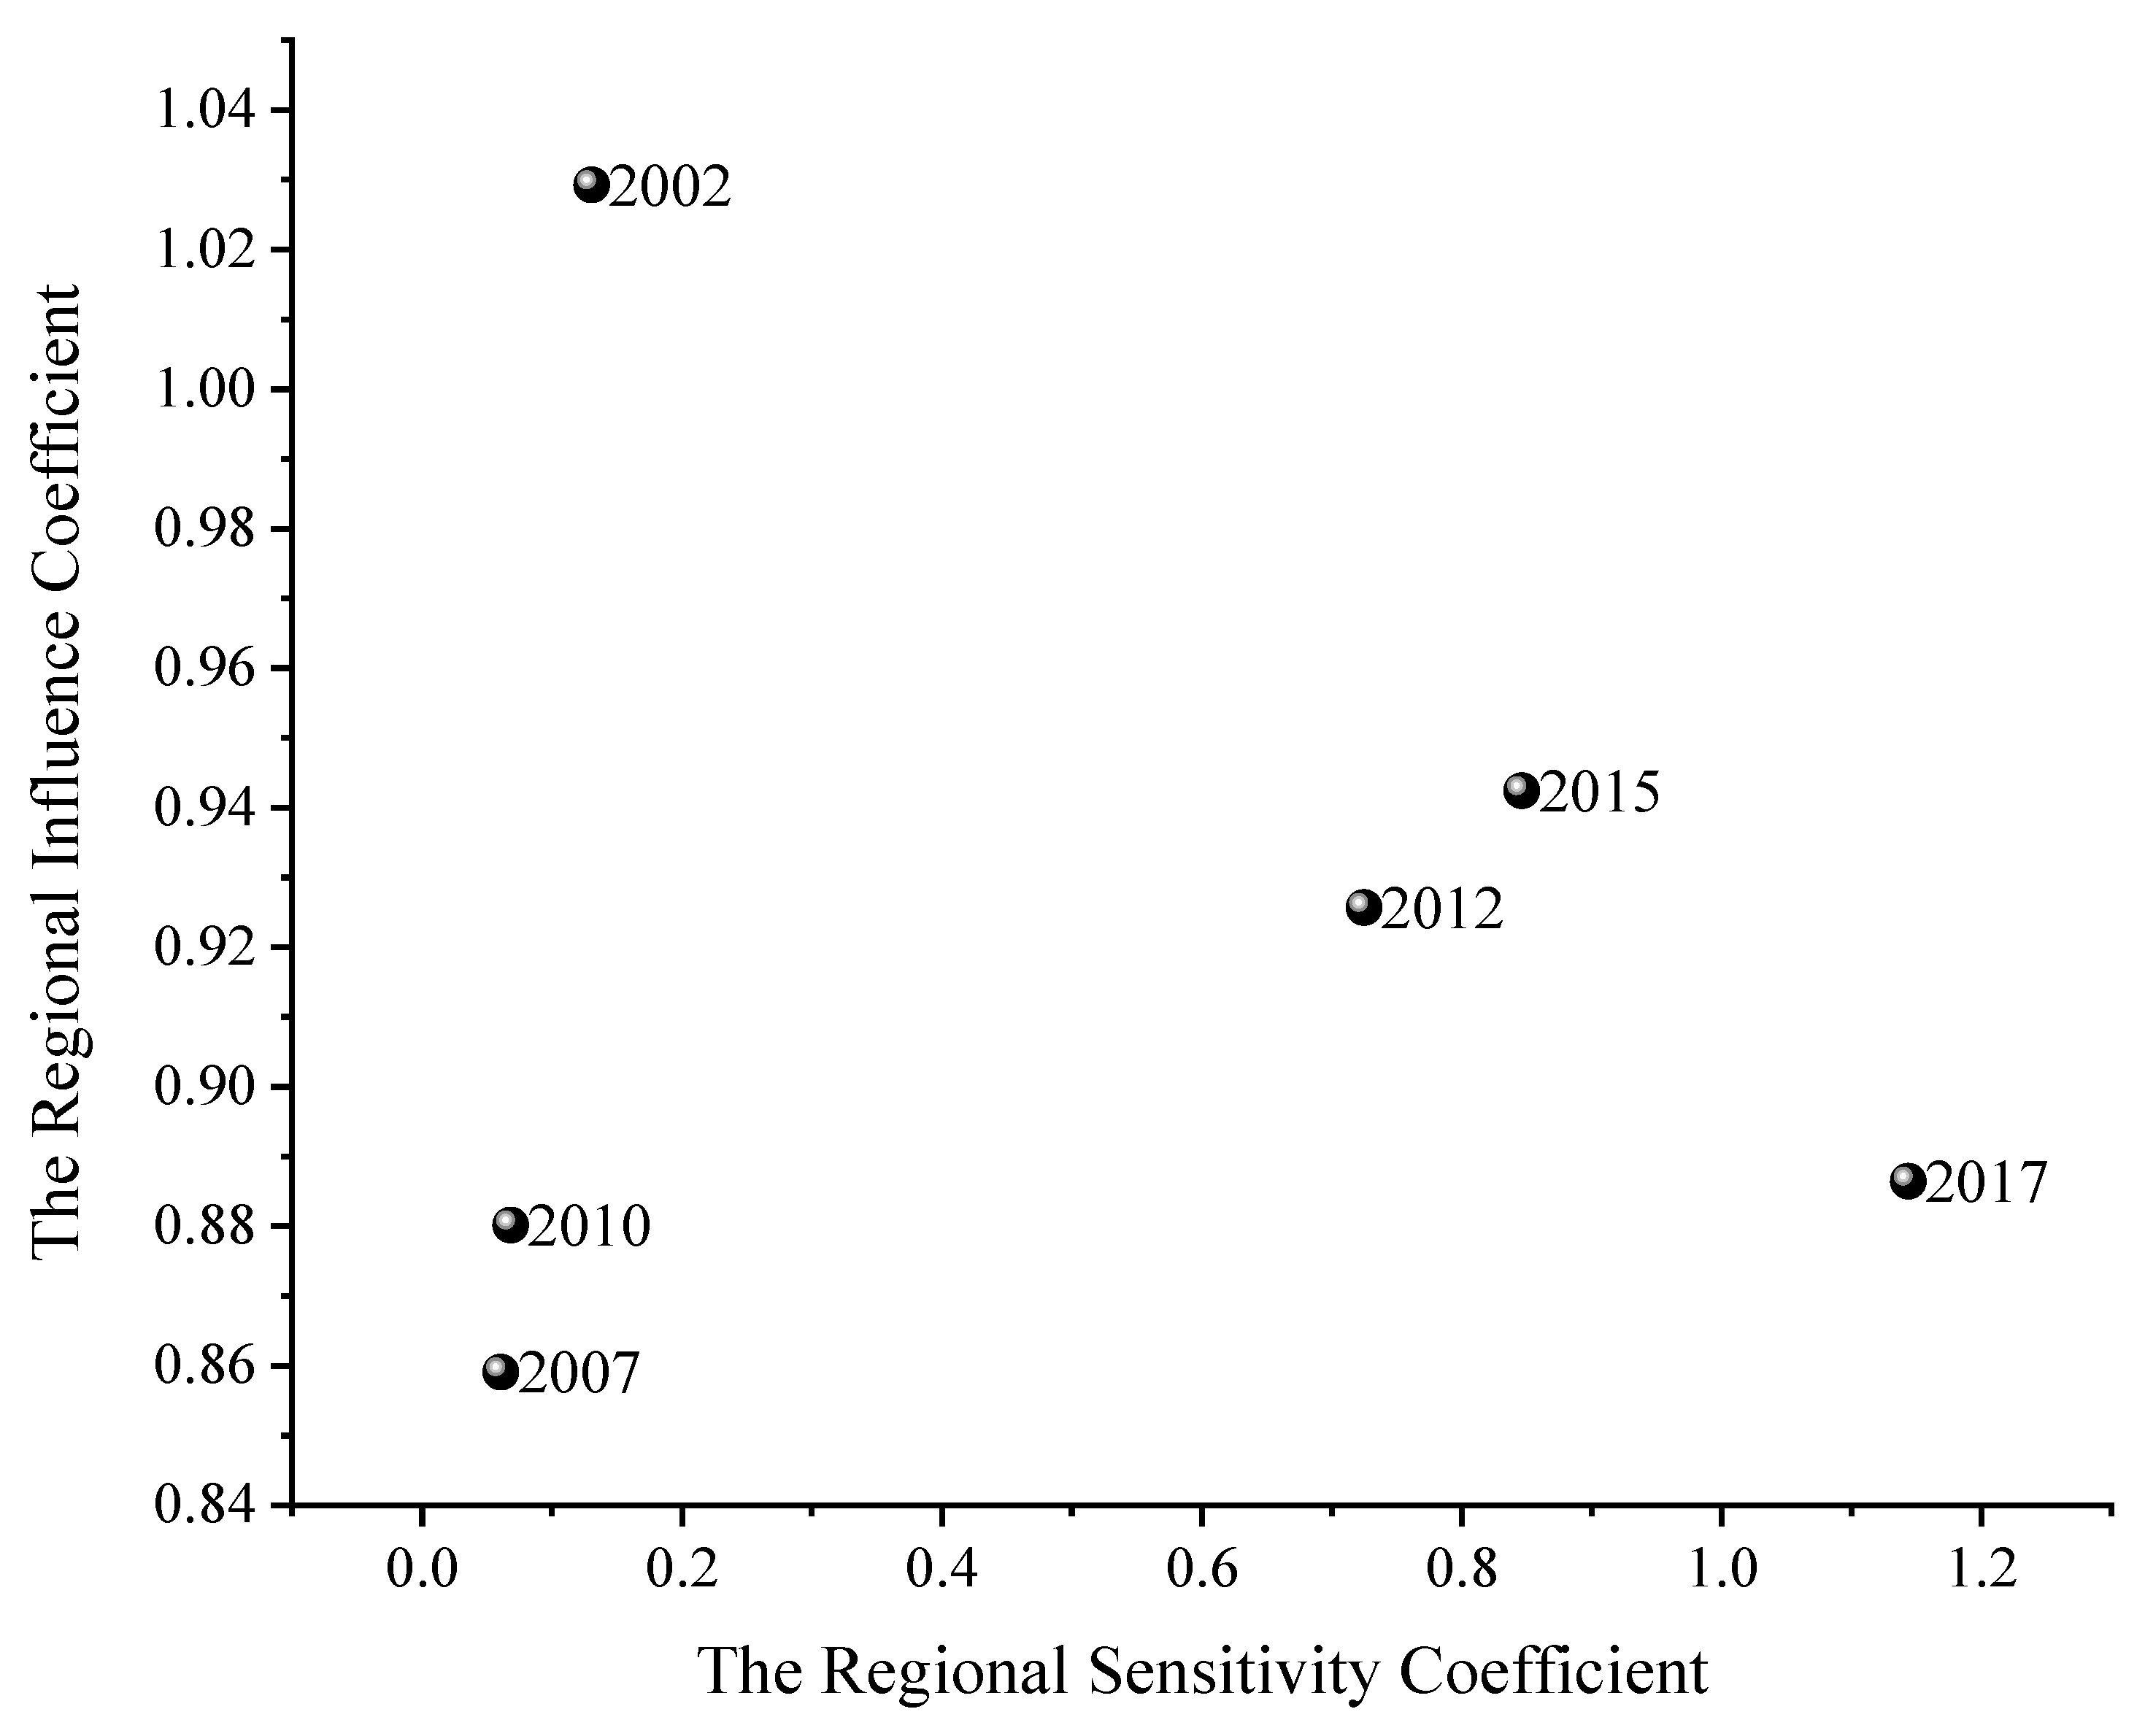
Based on the data points in
Figure 8, Heilongjiang Province’s influence coefficient exceeded the induction coefficient from 2002 to 2015, though the gap gradually narrowed from 0.899 to 0.096—a decline of approximately 89.32%—until the difference reversed to −0.257 in 2017, marking the induction coefficient’s overtaking of the influence coefficient. Excluding the exceptional cases of 2002 and 2017, the province’s induction and influence coefficients exhibited a linearly rising, same-directional trend between 2007 and 2015, though both remained below 1, classifying them as Zone III (Retarded Correlation Type). In 2002, Heilongjiang’s influence coefficient exceeded 1 while its induction coefficient remained below 1, placing it in Zone II (Influential Correlation Type), indicating that the province’s wood products industry had a strong backward pull effect on the national economy. In 2017, the situation reversed: with an influence coefficient of 0.89 (below 1) and an induction coefficient of 1.14 (above 1), the province shifted to Zone IV (Inductive Correlation Type), signifying that its industry achieved an advantageous level of demand-driven pull by other sectors of the national economy that year.
As shown in
Table 5, Heilongjiang Province’s influence coefficient fluctuated around the threshold of 1 but remained consistently below the national average from 2002 to 2017. Its overall ranking was volatile and trended lower, with approximately 83% of the years seeing the province ranked in the lower half of the national list. This suggests that its industrial influence coefficient is relatively unstable at the national level, that its regional driving effect on the national economy is relatively weak, and that there is significant room for improvement within the national industrial landscape.
The induction coefficient of Heilongjiang Province showed a pattern of weak early-stage performance followed by late-stage strengthening. From 2002 to 2010, it fell sharply from 0.1306 to 0.0608, remaining below the national average. After 2010, it surged to 1.1438, exceeding the threshold of 1 and establishing a gap of approximately 0.773 with the national average, while steadily ranking among the top five provinces. This indicates that its production system had become highly sensitive to regional demand changes, gradually shifting upstream to the core of the industrial chain, enhancing its standing in the national economic landscape, and making increasingly significant contributions to economic development.
4. Conclusions
This paper adopts the input–output analysis method and analyzes a variety of economic models to explore the industrial comparative advantages, industrial correlation effects, and industrial ripple effects of the wood products industry in Heilongjiang Province in the national context.
Remarkable industrial agglomeration and processing advantages have led to sustained enhancement of regional competitiveness. The location quotient of the wood products industry in Heilongjiang Province has long ranked among the top in the country. Despite showing “U-shaped” fluctuations, its advantages have continued to expand since 2012. By 2017, it had surpassed 79% of provinces nationwide, demonstrating its strong and stable industrial agglomeration capability at the national level. The average downstream degree of the industrial chain (2.7) is higher than the upstream degree (2.1), highlighting outstanding advantages in deep product processing and marketing. It possesses the core capability to efficiently transform forestry resources into high-value-added products, enabling it to occupy a leading position in regional industrial competition.
Industrial association mode transformation has led to a supply-side dominant pattern gradually emerging: the Heilongjiang Province wood products industry has transformed from the “influence associated type” to “induction associated type” of industrial association mode, and has gone from relying on demand-pull to being supply-side dominant, which is a response mechanism to significant changes in market demand. The coefficient of inductivity climbed rapidly after 2010, reaching 1.1438 in 2017, exceeding the national average value of 0.773 and ranking No. 3 in the country, highlighting the province’s important position on the supply side of the national wood products industry. However, its influence coefficient has been lagging behind the national average for a long time, which contrasts with the characteristic of “generally strong influence and weak inductance” of the national wood products industry. It shows that despite its obvious advantages in raw material supply and processing, there are significant shortcomings in terminal market expansion, brand effect shaping, and downstream integration of the industrial chain
Industry dependence exhibits significant differentiation, with pronounced sector-specific linkages. Between 2002 and 2017, the standard deviation of the complete consumption coefficient of the wood products industry in Heilongjiang province from industries in other provinces climbed from 0.26 to 0.33, revealing that the differentiation of the degree of dependence between industries continued to intensify. The wood products industry exhibits a notably high average complete consumption coefficient of 1.38, forming distinct characteristics of internal consumption circulation; the paper and printing industry, construction, and other manufacturing sectors demonstrate a higher degree of reliance on it, serving as critical associated industries driving its development. However, the overall coefficient has consistently fluctuated around 0.01, indicating that, apart from the specific traditional industries mentioned above, the dependency of other industries on the wood products industry remains weak, with limited cross-industry radiation capacity. This phenomenon is highly consistent with the industrial characteristics of Heilongjiang Province’s wood products industry as an intermediate processing link in forestry and a service provider for specific sectors.
Based on the above findings, the key to realizing the sustainable upgrade of Heilongjiang Province’s wood products industry lies in constructing a development path centered on sustainable forestry concepts. An efficient supply chain design should consider both local resource supply and external market demand. First, on the supply side, it is essential to consolidate the achievements of plantation forest cultivation and implement a diversified timber import strategy. These measures aim to ensure the security and stability of timber supply. Second, on the demand side, this study identifies the key demand segments of Heilongjiang Province’s wood products industry and its main trade flows. These findings should serve as the basis for optimizing timber trade policies, promoting deep processing, and actively cultivating high-end markets. Additionally, integrating the principles of a circular economy is crucial. This involves emphasizing efficient resource utilization, waste minimization, waste recycling, and product life cycle management to build a sustainable timber industry chain system.
Nonetheless, there are some noteworthy limitations to this study. On one hand, the study relies on the latest interregional input–output data as of 2017. The lack of timeliness may affect the representativeness of the findings and their relevance to the current economic conditions. On the other hand, the interregional input–output model adopted in this study is a static framework. This makes it difficult to fully characterize the dynamic impacts of technological changes, market structure shifts, and other factors. It also poses challenges for extrapolating long-term causal relationships. Future research will, based on updated data, actively explore modeling approaches that can effectively incorporate the effects of the aforementioned dynamic factors. This will enable more accurate revelation of long-term patterns and assessment of the sustained effects of policy shocks.


