Abstract
Blue–green infrastructure is widely recognized for mitigating the urban heat island effect. However, most existing ENVI-met 5.6.1 studies focus on average thermal conditions and overlook fine-scale spatial gradients. This study investigates the urban park in Luoyang City by integrating high-resolution 3D ENVI-met simulations, multi-source data, and field measurements to quantify thermal gradients between park interiors and surrounding built-up areas. A midline cut-off approach was applied to extract horizontal and vertical thermal profiles. The results show that (1) temperature and physiological equivalent temperature (PET) differences are most pronounced at park edges and transition zones, where vegetation and water bodies serve as natural cooling buffers; (2) urban form indicators, especially the building coverage and open space ratio, significantly impact wind speed and the PET, with greenery improving thermal comfort via shading and evapotranspiration, while impervious surfaces intensify heat stress; (3) the park exhibits a distinct cold island effect, with the average PET in the core area up to 12.3 °C lower than in adjacent built-up zones. The effective cooling distance, which is identified through buffer-based zonal statistics, rapidly attenuates within approximately 200 m from the park boundary. These findings offer a novel spatial perspective on thermal regulation mechanisms of urban landscapes and provide quantitative evidence to guide the design of climate-resilient green infrastructure.
1. Introduction
Urban green spaces are vital for public areas and are key to promoting sustainable urban development [1,2,3]. As urban heat island (UHI) effects intensify, landscape design strategies to mitigate these impacts have become a core focus in urban ecological research [4,5]. Design decisions shape microclimates, either easing or worsening the local climate [6]. Therefore, establishing rational and effective methods for evaluating the outdoor thermal environment is essential for planning climate-adaptive and sustainable human settlements [7]. To support such planning, various evaluation methods have been developed to quantitatively assess how spatial configurations affect outdoor microclimatic conditions. Presently, outdoor thermal environment evaluation methods can be broadly classified into four categories: remote-sensing techniques [8,9,10,11,12,13,14,15,16], in situ measurement approaches [17,18,19,20,21,22], physical modeling methods [23,24,25,26,27,28], and mathematical modeling approaches [29,30,31,32,33]. However, few existing methods explicitly capture fine-scale spatial variations related to specific landscape elements.
Simulated urban microclimates, primarily classified into physical and mathematical models, are widely used to explore the relationships between landscape features and thermal conditions at various scales. Physical models use scaled-down urban environments to study variables like shading [23,26,34,35]. They realistically represent urban landscapes but lack flexibility for design changes or condition extrapolation. While accurate for specific scenarios, they are less adaptable than mathematical models. Mathematical models are virtual, flexible, versatile, and cost-effective. They rely heavily on field data for validation [36]. Various mathematical models are available for thermal environment simulation, employing different methods to solve flow equations and model urban surface energy balances. Some models focus exclusively on radiation budgets, neglecting the effects of fluid flow through urban canyons [37,38,39,40], while others, such as large eddy simulations (LESs), address fluid dynamics around buildings within urban canyons [41]. Models like WRF and CFD simulations at the block-building scale are used for more detailed analyses. ENVI-met, a high-resolution microclimate simulation software, has proven invaluable for modeling the impact of urban greenery of varying scales on microclimatic regulation. Consequently, the software was selected for the mathematical modeling in this study. Integrating spatial morphology data of parks and surrounding settlements with microclimatic indicators facilitates three-dimensional numerical simulations to reveal the regulatory mechanisms of local heat conditions influenced by different landscape elements.
Thermal comfort evaluation indicators can be classified into two categories based on their scientific foundation and stage of application: empirical indicators and mechanistic indicators. Early studies predominantly employed empirical indicators such as temperature, relative humidity, wind speed, and solar radiation. However, these empirical metrics often fail to account for the human body’s thermoregulatory mechanisms and lack a robust scientific backing. In contrast, contemporary research on thermal comfort pre-dominantly utilizes four mechanistic evaluation indices: predicted mean vote (PMV), physiologically equivalent temperature (PET), standard effective temperature (SET), and the universal thermal climate index (UTCI). PET, developed from the Munich Energy Balance Model for Individuals (MEMI) by Hoppe in the 1990s, represents a scientifically grounded approach to assessing human thermal comfort. It is defined as the air temperature in a typical indoor environment that would result in the same heat balance for the human body as observed in the outdoor environment. This model integrates the human body’s energy balance with the fluxes of long-wave radiation in outdoor spaces [42]. Unlike empirical indicators, PET is based on established thermophysiological mechanisms and does not rely on subjective assessments, making it more accurate for evaluating outdoor thermal conditions.
Nature-based solutions (NbSs) have garnered increasing attention in recent research as effective strategies for mitigating urban overheating. Urban Park landscapes are widely recognized for their significant ecosystem services, which span environmental, social, and economic domains. Such research on improving thermal environments is widespread in countries such as Italy [43], Canada [44], and Japan [45]. Beyond their role in enhancing air quality and regulating temperatures, parks contribute to improving residents’ quality of life, fostering social cohesion, and stimulating economic growth, all while promoting a sustainable urban environment. Accordingly, this study aims to identify key landscape elements that can optimize the thermal environment of urban waterfront parks and their surrounding areas, utilizing 3D grid data. Current research has primarily focused on the analysis of various indicators within urban parks and green spaces to improve the urban thermal environment. These studies have examined factors such as park size [46,47], proximity to parks [48,49], and the characteristics of the parks themselves [50,51]. Furthermore, research has explored the effects of vegetation and tree cover types [52,53,54], as well as the role of park shape in enhancing the urban thermal environment [55]. While most studies focus on the park size and spatial extent, this research broadens the scope to include additional landscape features for effective thermal regulation. This study uses the ENVI-met model to generate high-resolution 3D grid data, offering a more detailed understanding of how landscape elements regulate local thermal environments compared to traditional macro-scale analyses.
However, previous studies have often relied on spatially simplistic approaches such as buffer zones [56], unidirectional transects [57], or randomly scattered point sampling to assess cooling effects [58]. These methods limit spatial continuity and fail to capture structural transitions within the landscape. To address these limitations, this study implements a composite method that includes fine-resolution grid extraction, a fixed midline cut-off technique, and 3D voxel analysis, enabling the quantification of correlations between specific landscape elements and microclimatic changes across both horizontal and vertical dimensions. This approach enhances both the accuracy and applicability of thermal environment studies. Previous ENVI-met studies predominantly assess average thermal effects, with limited attention to spatial thermal gradients within and around green spaces. To address that gap, this study integrates ENVI-met simulations with horizontal and vertical profile analyses to quantify the influence of specific landscape elements on fine-scale thermal variations. Correlation analysis between landscape features and microclimatic variables provides quantitative guidance for urban landscape design. Using the urban park in Luoyang City as a case study, a high-resolution 3D microclimate simulation grid was developed, incorporating air temperature, humidity, wind speed, and physiological equivalent temperature (PET). This approach advances beyond conventional regional averages, offering targeted insights for optimizing blue–green infrastructure to improve urban thermal resilience by enhancing the cooling capacity, mitigating heat-related health risks, and supporting sustainable urban development.
2. Materials and Methods
This study uses Luoyang City’s large-scale urban park as a case study to investigate the temperature distribution characteristics of green spaces within the park, identify key influencing factors, and explore the synergistic cooling effects between the park and surrounding settlements. Furthermore, it examines adaptive planning strategies for cooling and spatial layout optimization of the park’s green infrastructure. This study begins with the extraction of two-dimensional and three-dimensional spatial data of the site and its surrounding settlements through multi-source data integration, including field surveys, remote-sensing imagery, and open-source geographic information. These data are used to construct a detailed Layout file, which serves as the basis for generating a high-resolution three-dimensional simulation grid in the ENVI-met 5.6.1 (for Germany) model. Next, data from an automatic weather station located near the site are used to set the initial conditions of a 3D numerical model, with the accuracy of the simulated data validated against the weather station data. Following this, microclimate simulations are performed using the ENVI-met model, based on the validated data. The simulation outputs provide insights into the microclimatic characteristics and physiological equivalent temperature (PET) distribution within the study area, highlighting how the local microclimate varies with different spatial configurations of the urban park. Finally, correlation analyses are conducted to quantify the influence of spatial configuration parameters of the urban park’s green spaces on cooling effects, along with an investigation of the underlying mechanisms of these correlations (Figure 1).

Figure 1.
Technical route.
2.1. Theoretical Framework
This study is based on the integration of urban microclimatology and landscape morphology theories. It proposes that the spatial arrangement and physical attributes of green infrastructure, including vegetation, water bodies, and built environments, directly affect local thermal conditions through processes such as evapotranspiration, shading, and the modification of airflow. Grounded in thermal comfort theory, the physiologically equivalent temperature (PET) serves as a human-centred metric to assess microclimatic performance. By combining high-resolution ENVI-met simulations with landscape metrics and spatial statistical analysis, this study establishes a spatial environmental feedback framework. This framework enables the examination of how specific urban park design parameters influence the cooling intensity and spatial distribution, thereby supporting climate-adaptive planning at the neighborhood scale. This study is based on the integration of urban microclimatology and landscape morphology theories. It proposes that the spatial arrangement and physical attributes of green infrastructure, including vegetation, water bodies, and built environments, directly affect local thermal conditions through processes such as evapotranspiration, shading, and the modification of airflow. Grounded in thermal comfort theory, the PET serves as a human-centred metric to assess microclimatic performance. By combining high-resolution ENVI-met simulations with landscape metrics and spatial statistical analysis, this study establishes a spatial environmental feedback framework. This framework enables the examination of how specific urban park design parameters influence the cooling intensity and spatial distribution, thereby supporting climate-adaptive planning at the neighborhood scale.
2.2. Model Establishment
2.2.1. Study Area
Luoyang (34.62° N, 112.45° E) is a historically significant city in Henan Province. Bordered to the north by the Yellow River, it boasts a rich cultural heritage as one of China’s seven ancient capitals (Figure 2). In contemporary development, it plays a pivotal role in the regional economic and social landscape, serving as an integral part of the Central Plains city cluster. As a vital component of Luoyang’s urban framework, the city’s parks and surrounding settlements host a wide range of activities, including daily life, leisure, and entertainment for residents. However, with the annual rise in summer temperatures, the thermal environment of these parks and neighboring settlements has become an increasingly pressing concern, directly impacting residents’ quality of life. According to the Thermal Design Code for Civil Buildings of the People’s Republic of China [59], the country is divided into five distinct climate zones: Severe Cold Climate (SC), Cold Climate (C), Hot Summer and Cold Winter (HSCW), Hot Summer and Warm Winter (HSWW), and Mild Climate (M). Luoyang is classified within the Cold Climate zone. The study area encompasses diverse surface types, including impervious paved roads, vegetated areas, asphalt pavements, and water bodies. Additionally, the spatial morphology of the urban landscape varies, with a mix of high-rise, low-rise, and mixed residential zones. These varying urban features interact with the local microclimate, collectively influencing the thermal comfort and cooling effects within the study area.

Figure 2.
Location map of Wangcheng Park (white dots in the map show the measurement points of weather stations inside and outside the park; pictures of “East (E)”, “West (W)”, “North (N)”, and “South (S)” show images of the urban morphology of each side of the park).
2.2.2. Data Acquisition and Model Construction
Meteorological data, including ambient temperature, relative humidity, wind speed, and wind direction, were obtained from the local meteorological station for the simulation period. Spatial datasets covering topography, building footprints, vegetation distribution, impervious surfaces, and water bodies were collected from high-resolution remote-sensing imagery and supplemented by municipal geographic information system (GIS) databases (displayed in Electronic Supplementary Material, Tables S1, S3, and S4). A three-dimensional numerical model of the study domain was constructed with a spatial resolution of 4 m × 4 m horizontally and 3 m vertically. The computational grid comprised 337 × 281 × 50 cells (X·Y·Z), allowing for a detailed representation of vertical atmospheric stratification and surface heterogeneity. Building parameters such as height, material properties, and canopy characteristics of vegetation were incorporated based on field surveys and remote-sensing interpretations to enhance model realism.
2.3. Numerical Simulation
2.3.1. Model Selection and Description
This study comprehensively reviews and evaluates computer simulation software in urban climate studies, considering domestic and international advancements. By integrating these insights with its research (displayed in Electronic Supplementary Material, Table S6), this study ultimately adopts ENVI-met to investigate the impact of urban park green spaces on the thermal comfort of surrounding settlements. This gridded numerical simulation software tool intricately models the interactions between the urban surface, vegetation, and the atmosphere. It has gained widespread use in urban climate studies, particularly for assessing microclimate conditions and evaluating mitigation strategies for urban heat islands [60]. Notably, ENVI-met is highly user-friendly and efficient, offering low computational costs. The software includes an intuitive graphical user interface and integrates a pollutant dispersion module, making it accessible to users with varying levels of expertise [61]. It excels in accurately simulating critical microclimate variables such as airflow, temperature, and humidity. It provides a significant advantage in analyzing complex urban environments characterized by buildings, green coverage, and the heat island effect [62]. In this study, the reliability of the software is further validated using actual field measurement data to verify the accuracy of the numerical simulations. The findings underscore the robustness of ENVI-met in modeling the cooling effects of green infrastructural strategies.
It is important to note that the limitations of ENVI-met in micro-scale analysis still require objective scrutiny. The model’s simplified calculation of radiation flux may lead to quantification deviations in vegetation transpiration effects [63]. The grid generation’s insufficient adaptation to complex terrain may affect local accuracy [64], and the assumption of static meteorological conditions limits its ability to simulate dynamic climate scenarios [65]. Nevertheless, ENVI-met remains an efficient tool for current urban microclimate research, and its limitations can be further optimized in future studies through multi-source data integration and multi-model coupling.
2.3.2. Model Configuration
Simulations were conducted for a typical summer day, 10 July 2023, from 08:00 to 19:00 (11 h). The computational domain was discretized with a grid size of 4 m × 4 m × 3 m. Meteorological inputs included a wind speed of 1.15 m·s−1 at 10 m height, wind direction of 189.75°, ambient temperature ranging between 29 °C and 40.4 °C, and relative humidity fluctuating from 42% to 89%. Table 1 summarizes the detailed meteorological parameters for model initialization and boundary conditions.

Table 1.
Initial atmospheric input and simulation configuration settings for the simulation.
2.3.3. Selection of Observation Points and Spatial Unit Definition
In the ENVI-met model, two methods were employed to select observation points to assess the microclimatic conditions comprehensively. First, 18 points were chosen within the site, representing different types of subsurface areas (e.g., buildings, vegetated areas, and water bodies) to analyze the impact of each subsurface type on the thermal environment (Figure 3a). Additionally, to assess the thermal gradient from the park to the neighboring buildings, 29 points were selected along both transverse and longitudinal sections. Points inside the buildings were excluded, resulting in a final total of 25 observation points (Figure 3b,c). These points were distributed across both directions, enabling a precise evaluation of heat condition changes from the park’s edge to the surrounding built environment. This approach allowed for a detailed analysis of the gradient changes in temperature, humidity, and other microclimatic characteristics across different areas.

Figure 3.
Selection of observation sites for the ENVI-MET model. (a) Interior points; (b) horizontal transect points; (c) horizontal transect points; (d) spatial correspondence between landscape indicators and ENVI-met grid units.
To ensure spatial consistency between microclimate outputs and landscape indicators, we used an 8 m × 8 m grid cell as the analytical unit. Each landscape morphological indicator was calculated within this fixed spatial window using high-resolution GIS layers. Correspondingly, the ENVI-met model’s original output resolution of 4 m × 4 m × 3 m was aggregated such that four adjacent 4 m × 4 m cells (in the same horizontal plane) matched each 8 m × 8 m landscape unit. This spatial co-registration enabled a reliable statistical comparison between morphological indicators and thermal variables using Spearman’s rank correlation. An illustration of this spatial correspondence is shown in Figure 3d, where the left panel represents the 8 m × 8 m window used for calculating landscape indicators, and the right panel shows how this corresponds to four 4 m × 4 m ENVI-met grids used for thermal output aggregation.
2.3.4. Assessment of Thermal Comfort
This study selected the physiologically equivalent temperature (PET) as the primary thermal comfort index due to its scientific foundation and widespread applicability in outdoor thermal comfort research. Table 2 presents the PET thresholds used to categorize thermal stress levels, as established in previous studies [66].
Table 2.
PET thresholds and corresponding thermal perception categories with grades of thermal heat stress.
2.4. Statistical Analysis
2.4.1. Quantitative Indicators of Landscape Character of Urban Parks
This study synthesizes 11 landscape indicators derived from an extensive body of literature to quantify the characteristics of urban parks and assess their role in regulating the thermal environment (displayed in Electronic Supplementary Material, Table S2). These indicators encompass four major categories: greening, paving, water bodies, and architecture (Table 3). Numerous studies have demonstrated that the extent and configuration of urban greenery influence the cooling effect of urban parks. Typically, parks with greater vegetated coverage and more compact shapes exhibit stronger cooling effects. Consequently, the green cover ratio (GCR) and canopy cover ratio (CCR) are commonly employed as key metrics. In addition, this study introduces the green space shape index (GSSI) and green space edge length (ELGS) as novel indicators to quantify the spatial configuration and boundary openness of vegetated spaces, thus elucidating the role of green space morphology in heat diffusion and air circulation. However, the cooling effect of parks is not solely determined by greening features; it is also significantly influenced by other environmental factors such as impervious surfaces, water bodies, and buildings [67,68,69,70]. To account for these factors, the impervious surface coverage ratio (ISCR) is used to assess the impact of hard surfaces on heat accumulation within parks [71]. Among the water body-related metrics, the water body coverage ratio (WBCR) and distance to the water body (DWB) are utilized to evaluate the cooling effects of evapotranspiration from water bodies and the spatial extent of their influence. Unlike previous studies that applied the DWB for macro-scale analyses of entire parks, this study quantifies this metric at various measurement points within the park to reveal the dynamic modulation effect of water bodies on local temperatures within micro-spaces. Additionally, the open space ratio (OSR) and building coverage ratio (BCR) are employed to examine the role of open spaces and the building density in air circulation and heat distribution [72]. This study also introduces the innovative indicator of the average building height (ABH) to investigate the potential impact of building height variations on the park’s microclimate, thereby clarifying the specific influence of height differences on the thermal environment. By integrating these innovative indicators, this research provides a comprehensive multi-dimensional analysis of the mechanisms by which park landscape features regulate the surrounding thermal environment, offering a scientific foundation for optimizing urban park design in the future.
Table 3.
Quantitative indicators of landscape characteristics of urban parks.
2.4.2. Correlation Analysis
Prior to correlation analysis, the normality of all variables, including landscape morphological indicators and thermal environmental parameters, was assessed using the Shapiro–Wilk test. This test evaluates whether the data distribution deviates significantly from a normal distribution, with a significance level set at 0.05. Given that several variables did not satisfy the assumption of normality (p < 0.05), the non-parametric Spearman’s rank correlation coefficient (ρ) was applied to quantify the relationships between landscape morphological elements and thermal environmental factors. Spearman correlation is robust to non-normal data distributions and effectively measures monotonic associations between variables.
3. Results and Discussion
3.1. Model Validation
To verify the accuracy of the ENVI-met simulation, all-day air temperature simulation data within the study area were extracted and compared with observational data from the automatic weather station 02227, located in the study area (displayed in Electronic Supplementary Material, Table S5). The comparison was evaluated using several statistical measures, including the root mean square error (RMSE), mean absolute error (MAE), Willmott’s consistency index (d), and the coefficient of determination (R2). This validation approach is widely used in related literature [73,74,75,76]. The calculated values for R2, RMSE, MAE, and d were 0.93, 0.84 °C, 0.73, and 0.99, respectively. These results are consistent with previous validation studies [77,78], demonstrating that the ENVI-met simulation accuracy is within an acceptable error range and exhibits a similar daily temperature trend despite some discrepancies between the simulated and measured temperature data (Figure 4).

Figure 4.
Comparison of the measured and simulated air temperature.
3.2. Temporal Characteristics of the Distribution of the Thermal Environment
Figure 5a shows the trend of potential air temperature (PAT) at the 18 observation points throughout the day. PAT peaked between 14:00 and 16:00, with a maximum temperature close to 40 °C, while the lowest temperatures occurred in the morning and evening, concentrated at 35 °C. The temperatures varied throughout the day, with significant differences in temperature fluctuations across different points. Points 3, 5, and 8 (Figure 5b) had relatively low median values, indicating cooler average temperatures. The boxplot for Point 8 showed a smaller upper and lower quartile spacing, suggesting less temperature fluctuation and a more stable environment with adequate cooling. Points 3 and 8 are in the waterfront area, where the higher heat capacity of the water body leads to lower and more stable temperatures, providing a strong thermal buffer. Point 5, situated in the shaded area of a building, also experienced relatively lower and less fluctuating temperatures due to shading, resulting in a stable temperature. However, its cooling effect is more time-specific, lacking the long-term stability of the water environment. Point 13, on the other hand, exhibited a significant difference between the upper and lower temperature limits, indicating an unstable thermal environment, likely influenced by sun exposure or the presence of hard surfaces that cause significant temperature fluctuations. Overall, the cooling effect of urban parks on the surrounding environment is particularly noticeable during the day, especially in the afternoon when solar radiation is most potent. The parks’ microclimate regulation function can significantly reduce the surrounding air temperature, with the cooling effect varying depending on the surrounding environment.

Figure 5.
Potential air temperature at 18 measurement points: (a) hourly potential air temperature at 18 points; (b) box plots of potential air temperature fluctuations at 18 points.
Figure 6a illustrates the variation in wind speed (WS) at 18 observation points throughout the day. While there is a small gap in the wind speed variation over time at each point, the differences between observation points are more pronounced. As shown in Figure 6b, the median wind speed at Point 1 is relatively high, with wind speeds concentrated at 1.0 m/s and minimal fluctuation, indicating a stable and moderate wind environment at this location. Points 10 and 17 exhibit the lowest median wind speeds, close to 0.1 m/s, suggesting that wind speeds in these areas are significantly reduced, likely due to obstruction by nearby buildings or dense vegetation. Point 6, on the other hand, experiences moderate wind speed fluctuations, with values ranging from 0.3 to 0.8 m/s, indicating a more variable but generally moderate wind environment.

Figure 6.
Wind speed at 18 measurement points: (a) hourly wind speed at 18 points; (b) box plots of wind speed fluctuations at 18 points.
Figure 7a shows that the mean radiant temperature (MRT) at most detection points peaked at midday (12:00 to 15:00) and then rapidly decreased over time, with a clear downward trend after 15:00. Figure 7b highlights that the median MRT values at points 9, 13, and 16 are relatively high, approaching 80 °C. Point 9, located in a densely built-up area, exhibits a smaller range of fluctuation, indicating more substantial solar radiation exposure during the daytime and poorer thermal comfort in these areas. The lack of sufficient shading and green spaces likely results in direct solar radiation affecting both the population and the ground surface. In contrast, points 2, 10, 12, and 18 show lower median MRT values, with point 12 having a median MRT of approximately 50 °C or less. This suggests that these areas benefit from improved cooling effects, where greening, shading, or enhanced ventilation helps mitigate the impact of direct radiation on human thermal comfort.

Figure 7.
Mean radiant temperature at 18 measurement points: (a) hourly mean radiant temperature at 18 points; (b) box plots of mean radiant temperature fluctuations at 18 points.
Figure 8a shows that the relative humidity (RH) at all 18 points followed similar daily trends. From Figure 8b, it can be seen that points 3, 5, 6, and 8 exhibit higher median RH values and minimum RH values. The overall humidity distribution across the points is more uniform, with RH ranging from 40% to 50%.

Figure 8.
Relative humidity at 18 measurement points: (a) hourly relative humidity at 18 points; (b) box plots of relative humidity fluctuations at 18 points.
Figure 9a shows that the PET values at each detection point peaked between 12:00 and 16:00, following typical diurnal trends that align with solar radiation intensity and surface heat accumulation. From Figure 9b, it is evident that the median PET values at points 7 and 9 are higher, close to 60 °C, with less fluctuation, indicating higher heat stress in these areas. This high heat stress may be related to a lack of adequate cooling measures, such as insufficient greenery or heat buildup in the surrounding buildings. In contrast, detection points 12 and 18 have lower median PET values, with point 18 showing a PET value of about 47 °C, suggesting a comfortable thermal sensation and effective cooling. While point 12 also has a relatively low PET, some fluctuation remains, indicating that the thermal environment in this area has been alleviated to some extent.

Figure 9.
PET at 18 measurement points: (a) hourly PET at 18 points; (b) box plots of PET at 18 points.
3.3. Spatial Characteristics of the Distribution of the Thermal Environment
3.3.1. Potential Air Temperature
Based on Figure 10, there is a strong correlation between the temperature distribution within the park and the density of vegetation. Areas around vegetation and green spaces exhibit significantly lower temperatures compared to impervious surfaces, particularly in the deeper parts of the park. In these areas with dense tree cover and larger crowns, the temperature drop is more pronounced, creating a localized cooling effect. The boundaries of this effect show a transparent gradient, with temperatures gradually increasing as the distance from the park’s central area grows, peaking near the settlements at the park’s edge. Dense vegetation effectively reduces surface temperatures through mechanisms such as shading from solar radiation and heat evaporation.

Figure 10.
Spatial distribution of potential air temperature at 15:00.
While the park’s green infrastructure can effectively reduce temperatures through vegetation and water, its cooling effect is primarily concentrated within the park and along its edges. The spillover effect diminishes as the distance from the park increases.
3.3.2. Relative Humidity
From Figure 11, it can be seen that the spatial distribution of relative humidity (RH) is strongly associated with water bodies and vegetation density within the park. Humidity is significantly higher inside the park’s vegetated areas, especially in areas near water bodies than in settlements or impervious paved areas. Water bodies significantly increase the humidity of the surrounding air through evaporation, and this humidity increase is most pronounced within 50–100 m of the water body. Vegetation in these green zones not only provides shade but also further increases local humidity through plant transpiration, creating a calm, humid microclimate zone.

Figure 11.
Spatial distribution of relative humidity at 15:00.
Inside the settlement, the presence of hardened pavements and building masses inhibit water evaporation and humidity enhancement. In particular, humidity was significantly lower in the densely built-up areas, indicating that the density of the buildings and the paving of impermeable materials significantly reduced the moisture content of the air. In addition, the humidity distribution at the junction of parks and settlements shows a clear gradual trend, with moist air from the green spaces slowly diffusing into the settlements. However, this diffusion effect is more limited and is concentrated in the area around the edges of the parks.
3.3.3. Wind Speed
From Figure 12, it can be observed that the layout of buildings, vegetation density, and topographic relief intricately influence the spatial distribution of wind speed (WS). Inside the park, wind speed is notably reduced in areas with dense vegetation, particularly within the tree canopy, which creates a relatively calm microclimate. By obstructing and slowing down air movement, the trees contribute to the lowest wind speeds and limit air circulation in the park’s central areas. In contrast, in the park’s open spaces—such as lawns or plazas—wind speeds are higher, and air movement is more dynamic, especially near the park’s edges where the duct effect from surrounding buildings becomes more pronounced.

Figure 12.
Spatial distribution of wind speed at 15:00.
Within the surrounding settlements, the dense arrangement of buildings plays a crucial role in shaping wind speed patterns. The “ducting effect” created by tall buildings results in significantly higher wind speeds in certain areas, particularly in narrow passages between buildings, where the wind is funneled and air mobility increases. This effect is more evident in areas with sparse building layouts. However, in densely built environments, wind speeds tend to be lower due to the obstruction caused by the buildings. Additionally, variations in terrain—such as small hills or low-lying areas—further complicate the distribution of wind speed, with wind patterns becoming more erratic in such areas.
3.3.4. Mean Radiant Temperature
From Figure 13, it can be observed that the distribution of mean radiant temperature (MRT) is closely linked to vegetation shading and the shadowing effects of buildings. Inside the park, tree canopy coverage significantly reduces the amount of solar radiation reaching the ground, particularly in areas with a dense canopy cover, where the solar radiation intensity is substantially lowered, leading to a subsequent decrease in surface temperature. In contrast, within the settlement areas, solar radiation is unevenly distributed across different times of day due to the dynamic shading effects of buildings. Around high-rise buildings, the shadows shift as the sun moves, creating fluctuating solar radiation patterns throughout the day.

Figure 13.
Spatial distribution of mean radiant temperature at 15:00.
The transition zone between the park and the surrounding settlements exhibits a clear gradient in solar radiation intensity. As the distance from the park increases, solar radiation levels gradually rise. Near the park’s edge, where vegetation shading is weaker, the surface absorbs significantly more solar radiation. This effect is especially noticeable during midday when the exposed, hardened surfaces in the settlement and areas with sparse vegetation experience the highest levels of solar radiation, leading to heat accumulation and a localized increase in temperature.
3.3.5. PET
From Figure 14, the spatial distribution of PET values highlights the varying levels of thermal comfort across different areas. Inside the park, particularly near water bodies and areas with dense vegetation, PET values are significantly lower than those in the surrounding settlements, indicating a higher level of thermal comfort. The combined effects of tree shading, plant transpiration, and the cooling influence of the water body create a relatively comfortable environment, even during hot weather. As one moves away from the park’s central area, PET values increase progressively. This is particularly noticeable in the settlement areas with impermeable surfaces and dense development, where PET values are much higher, reflecting poorer thermal comfort. The observed difference suggests that the cooling effect of the park extends into the nearby settlements, but this effect is limited in range, mainly affecting areas within 200 m of the park’s edge.

Figure 14.
Spatial distribution of PET at 15:00.
In summary, the thermal environment within the study area is shaped by a complex interplay of factors. While the park plays a crucial role in alleviating local thermal discomfort through vegetation, water bodies, and shading, the cooling effect is most pronounced within the park itself and gradually diminishes as it moves outward into the surrounding built-up areas [79].
3.4. Quantitative Relationship Between Landscape Morphological Elements and the Thermal Environment
3.4.1. Impact Mechanisms of Landscape Morphological Elements on the Thermal Environment
In this study, landscape features are categorized into four primary types: buildings, water bodies, paving, and greenery, each interacting complexly with various thermal environmental factors. The average building height (ABH) and open space ratio (OSR) within buildings exert a significant influence on wind speed. An increase in these variables tends to reduce wind speed, limit air circulation, and elevate relative humidity, which subsequently lowers air temperature and enhances thermal comfort, as indicated by physiologically equivalent temperature (PET). Thus, ABH and OSR are positively correlated with the PET. Conversely, the building coverage ratio (BCR) is negatively correlated with the PET, suggesting that an increase in BCR results in diminished thermal comfort.
In regard to water bodies, the distance to the water body DWBx and DWBy plays a pivotal role in the thermal environment, with the transverse direction DWBx exhibiting a stronger correlation with PET. This is likely due to the heightened sensitivity of the water body to the wind direction, enhancing its cooling effect. The weak correlation of DWBx with relative humidity diminishes its impact on the PET. The distance to the water body along the y-axis DWBy negatively correlates with air temperature. In contrast, the distance along the x-axis DWBx is positively correlated with it, potentially influenced by other landscape characteristics.
Paving, particularly the impervious surface coverage ratio (ISCR), is inversely correlated with wind speed and positively correlated with air humidity. This suggests that an increased ISCR impedes wind speed and obstructs water infiltration, increasing the water vapor content in the air. The warming effect from solar radiation is counterbalanced by the localized cooling effect of impervious surfaces, resulting in a reduction in air temperature. This underscores the significant role of impervious paving in shaping the local thermal environment, with marked variations in the effects of different paving materials.
Greening features are particularly influential in modulating the thermal environment. The green coverage ratio (GCR), canopy coverage ratio (CCR), green space shape index (GSSI), and edge length of green space (ELGS) are all positively correlated with the wind speed and negatively correlated with solar radiation. This relationship is attributed to the vertical structure of vegetation; areas with more intricate vertical greening structures are more effective at reducing solar radiation and mitigating wind speed. Furthermore, greenery contributes to a reduction in relative humidity (RH) and improves thermal comfort through transpiration, although the extent of this effect varies depending on vegetation type and density (Figure 15).

Figure 15.
Correlation analysis of landscape morphological indicators and thermal environmental elements.
3.4.2. Correlation Analysis of Landscape Morphological Elements and Thermal Environment
Based on the correlation strength analysis, the influence on wind speed is ranked as follows: buildings > greenery > water > paving. The negative correlation between the open space ratio (OSR) and wind speed was particularly significant, suggesting that an increase in OSR may obstruct wind flow and limit air circulation. Similarly, the average building height (ABH) was negatively correlated with wind speed, likely due to the obstruction of airflow caused by taller buildings. Conversely, vegetation-related indicators—such as the green cover ratio (GCR), canopy cover ratio (CCR), green space shape index (GSSI), and edge length of green space (ELGS)—were positively correlated with wind speed. This indicates that the presence of vegetation may enhance wind flow by acting as a conduit, thereby promoting better air circulation.
In terms of relative humidity, the analysis revealed the following order of influence: greenery > water > buildings > paving. Variables such as ABH, building coverage ratio (BCR), OSR, and impervious surface coverage ratio (ISCR) were positively correlated with relative humidity. This can be attributed to the restrictive nature of these factors on air circulation, which in turn leads to an increase in humidity. In contrast, the presence of greenery, as indicated by the negative correlations of ELGS, GSSI, CCR, and GCR with relative humidity, suggests that greening elements help reduce air humidity through mechanisms such as transpiration and shading.
For air temperature, the correlation strength followed the order of buildings > greenery > paving > water bodies. The GCR, CCR, GSSI, ELGS, and the distance to the water body in the x-direction (DWBx) were positively correlated with air temperature. This may be because these green features can contribute to the accumulation of heat on the ground surface while simultaneously providing shading, creating localized temperature increases.
Regarding solar radiation, the analysis revealed the following rank: buildings > greening > water bodies > paving. Solar radiation was positively correlated with ABH, OSR, DWBx, and ISCR, suggesting that these factors may increase the amount of solar radiation received by the surface. On the other hand, BCR, DWBy, ELGS, GSSI, CCR, and GCR were negatively correlated with solar radiation, likely due to the ability of green spaces and water bodies to absorb or reflect solar radiation, thereby mitigating its intensity.
Finally, the correlation analysis of physiologically equivalent temperature (PET) ranked the factors as follows: greening > buildings > water bodies > paving. PET was positively correlated with ABH, OSR, DWBx, and ISCR, indicating that these factors could potentially improve thermal comfort by enhancing solar radiation and reducing wind speed, which may lead to higher temperatures. Conversely, BCR, ELGS, GSSI, CCR, and GCR were negatively correlated with the PET, suggesting that the presence of green features—such as shading and transpiration cooling—contributes to a reduction in thermal discomfort by lowering PET values.
3.5. Trends in Thermal Environmental Gradients
In order to reveal the spatial change pattern of landscape features and the heat variation gradient, this study analyzed the gradient change in the thermal environment by combining data from the horizontal and vertical axial midline profiles of 50 points. Figure 16 depicts microclimatic gradient changes across two directional profiles of the thermal environment—(a) the horizontal and (b) the vertical. Panel (a) presents the gradient change at 25 points along the horizontal axis, showing the distribution of average physiologically equivalent temperature (PET) values across different locations. The thermal environmental gradient reveals marked variations, with points near the park’s vegetated areas exhibiting significantly lower PET values, indicating improved thermal comfort. In contrast, points closer to impervious surfaces or built-up areas show higher PET values, indicating greater thermal stress. These findings suggest that areas with denser greenery, such as vegetation or water bodies, mitigate the heat island effect, while built environments exacerbate it.

Figure 16.
Change in thermal environment gradient. (a) Gradient change at 25 points in the horizontal direction. (b) Gradient change at 25 points in the vertical direction.
Figure 16b illustrates the vertical gradient change at the same 25 points along the vertical axis. Similar trends are observed, with a clearer stratification of thermal conditions between the park interior and the surrounding urban settlements. Points closer to the park’s edge exhibit higher PET values compared to the inner park zones, highlighting the diminishing cooling effect as one moves farther from the green space. The marked increase in PET near urban settlements further underscores the spatial limitations of the park’s cooling effect.
These results underscore the significant role of landscape features in regulating the thermal environment, particularly in urban parks, where vegetation and water bodies offer substantial cooling benefits. However, the analysis also highlights the limited extent of this cooling effect, which predominantly influences areas with proximity to green spaces.
4. Discussion
4.1. Analysis of Changes in Thermal Environmental Gradients
The analysis results show that the air temperature inside the park is significantly lower than that of the surrounding built-up areas, and the temperature gradient exhibits apparent spatial heterogeneity. This trend is highly consistent with the spatial pattern of the urban heat island (UHI) effect, in which thermal stress intensifies with an increasing distance from the urban green space boundary, particularly in densely built-up areas [4,43,80]. We also found that water bodies and densely vegetated areas can significantly alleviate heat accumulation through evaporation and transpiration processes, effectively reducing local PET values. In contrast, rigid pavements and high-rise buildings increase surface heat storage and the absorption of solar radiation, thereby forming inflexion points in the thermal gradient at the interface between park edges and built-up areas [44,80,81], which further enhances the ecological value of urban parks in mitigating high-temperature impacts. Therefore, identifying the patterns of gradient variation not only reveals the mechanisms of microclimate regulation but also provides spatial optimization references for improving the thermal environment in high-density urban areas.
4.2. Landscape Composition in Relation to the Thermal Environment
Based on data from 18 sampling points and the median values along both longitudinal and transverse transects, this study further clarifies the regulatory mechanisms of different landscape elements in the thermal environment. The results show that the green coverage ratio (GCR), canopy coverage ratio (CCR), and edge length of green spaces (ELGS) are significantly negatively correlated with the PET, indicating that the more complex the greening structure, the stronger its shading and evapotranspiration cooling effects [46,53,82,83]. In addition, the building coverage ratio (BCR) is also negatively correlated with the PET, suggesting that building clusters, while providing shade, can partially block solar radiation; however, in highly enclosed areas, they may lead to a reduced wind speed and localized heat accumulation [29,84,85]. Temperature fluctuations are particularly evident in park-edge zones, which may result from significant thermal differences between built-up areas and green spaces, leading to more intense heat exchange and the formation of a “thermal transition zone.” Compared with single-factor analysis, this study emphasizes the interactions among multiple elements within composite landscape structures and their combined effects on the thermal environment, especially the thermal impacts in park-edge areas. To optimize the thermal conditions of these boundary zones, it is recommended that transitional buffer greenbelts or ventilated corridors should be established between built-up areas and parks in order to enhance air circulation, reduce heat accumulation, extend the cooling effect, and improve thermal comfort for nearby residents.
4.3. Theoretical and Policy Implications
Theoretically, this study contributes to the growing body of literature on the urban microclimate by providing empirical support for the spatial differentiation of cooling effects within urban green and blue infrastructures. By highlighting the critical role of edge zones and landscape configurations in modulating thermal gradients, this study extends the understanding of microclimate heterogeneity beyond traditional green coverage metrics. These findings underscore the need to integrate spatial structure and adjacency effects into existing theories of urban thermal regulation, particularly in high-density, mixed-use urban fabrics.
From a policy perspective, the results offer several implications for climate-adaptive urban planning. First, the demonstrated effectiveness of water bodies and densely vegetated areas in mitigating local heat stress supports the prioritization of blue–green infrastructure in urban redevelopment projects. Second, the temperature gradient patterns observed from park edges into built-up areas suggest that buffer zones, such as vegetated strips or transition zones, should be formally incorporated into planning guidelines to enhance thermal protection for adjacent residential neighborhoods. Third, our findings advocate for context-sensitive design strategies that account for the spatial configuration, not just quantity, of green spaces—emphasizing form, edge permeability, and proximity to high-exposure zones. In sum, this study provides actionable insights for municipal governments, landscape designers, and urban policymakers seeking to develop evidence-based interventions to address urban heat stress under changing climate conditions.
4.4. Limitations and Future Research Directions
While this study advances the understanding of microclimate regulation through high-resolution thermal simulation and landscape analysis, several limitations should be acknowledged. First, the simulation relies on static input parameters and assumes stable weather conditions, which may not fully capture dynamic urban atmospheric processes. Second, the analysis is limited to a single urban park in Luoyang, which may affect the generalizability of the findings to other climatic regions or urban typologies. Future research should consider integrating real-time meteorological data and expanding the study across multiple urban parks with diverse spatial structures and environmental contexts. Additionally, exploring the seasonal variations in cooling effects and incorporating behavioural data could offer a more holistic understanding of urban thermal comfort. Advancing the coupling of ENVI-met with GIS-based multi-agent systems may also enhance scenario testing for climate-responsive urban planning. Third, although the study focuses on a typical hot summer day, the thermal performance of green and blue infrastructure may vary across seasons due to changes in solar radiation angle, vegetation phenology, and wind patterns. Although the simulations in this study were limited to the summer season, the spatial distribution patterns identified (e.g., cooling effects in water body buffers, densely planted green spaces, and heat stress enhancement in hard-paved areas) are expected to be somewhat regular in other seasons as well, differing only in cooling intensity. Future research should incorporate multi-season simulations to capture these temporal dynamics better and evaluate the year-round adaptability of urban cooling strategies. Furthermore, while this study primarily identifies spatial mechanisms underlying thermal differentiation, particularly the role of edge zones and vegetation and water configurations, it does not yet provide specific design parameters such as the optimal green coverage ratio or building coverage ratio. Future research will build on these findings through scenario-based simulations and comparative analyses, aiming to develop practical design guidelines for climate-adaptive green infrastructure under diverse urban and climatic conditions. Future work will build upon these insights through scenario-based simulations and comparative analyses to develop quantitative design guidelines, including thresholds for green space coverage, buffer zone widths, and building densities that optimize thermal comfort under varying climatic and urban conditions.
5. Conclusions
This study explores the changes in the thermal environment gradient and its relationship with landscape elements, from the interior of urban parks to the surrounding built environments, through innovative analyses of ENVI-MET gridded data. The findings demonstrate that green spaces and water bodies within the park significantly reduce the surrounding temperature and mitigate the urban heat island effect. At the same time, the built environment exacerbates local temperature increases. Through data extraction and sectional analysis, we have thoroughly examined the regulatory effects of various landscape components on the thermal environment, providing specific guidelines for urban planning and landscape design. Future research could incorporate machine learning algorithms with the ENVI-met model to explore the nonlinear relationship between the thermal environment and landscape elements through deep learning. For instance, the random forest model could be utilized to quantify the contribution of tree canopy density and water body morphological parameters to the cooling efficiency, or GIS spatial analysis could be combined to construct a thermal environment risk prediction map. Furthermore, it is possible to break through the limitations of static analysis and establish a long-term observation network with multi-scale interconnection among “neighborhoods–cities–regions”. For instance, a series of micrometeorological micro-meteorological stations can be set up at the boundaries of parks to simultaneously track the changes in temperature differences, humidity, and wind speed throughout the day and night and to correlate these with the time-series data of surface temperature derived from satellite remote sensing.
Moreover, this study proposes an innovative analytical framework that addresses the limitations of conventional methods in urban thermal environmental research. High-resolution data extraction and sectional analysis provide new insights into the spatial variability and underlying mechanisms of the urban heat island effect. The findings contribute to a deeper scientific understanding and offer practical guidance for enhancing urban thermal comfort and optimizing landscape design. From a policy standpoint, the results support evidence-based urban planning by demonstrating the cooling benefits of ecological infrastructure. These insights can help urban planners and decision-makers prioritize the allocation of green and blue spaces in high-density areas, formulate zoning regulations that incorporate thermal considerations, and advance climate-resilient, landscape-oriented strategies.
Supplementary Materials
The following supporting information can be downloaded at https://www.mdpi.com/article/10.3390/f16071085/s1, Table S1. Data source; Table S2. Summary of indicator sources.; Table S3. Plant Classification Table of Wangcheng Park; Table S4. Summary of ENVI-met model input and output parameters; Table S5. Information about the meteorological station; Table S6. Summary of methodological differences between existing ENVI-MET literature; Table S7. Comparison of ENVI-MET studies of the same kind; Figure S1. Schematic Illustration of the Midline Cut-off Approach [62,63,64,86,87,88,89,90,91,92,93,94,95,96,97,98,99,100,101,102,103,104,105].
Author Contributions
Conceptualization, D.Y., J.F. and X.W.; Methodology, D.Y.; Software, L.X.; Validation, L.X. and Q.W.; Formal Analysis, L.X.; Survey, Q.W.; Resources, D.Y.; Data Organization, D.Y. and L.X.; Writing—Original Draft Preparation, D.Y. and L.X.; Writing—Review and Editing, D.Y., J.F. and X.W.; Visualization, L.X. and Q.W.; Supervision, J.F.; Project Management, J.F.; Funding Acquisition, J.F. and X.W. All authors have read and agreed to the published version of the manuscript.
Funding
This study was supported by the China Meteorological Administration and the Key Laboratory of Agricultural Meteorological Assurance and Application Technology of Henan Province under the Application Technology Research Fund Project [KQ202432].
Data Availability Statement
The datasets presented in this article are not readily available because the data are part of an ongoing study and have time limitations. Requests to access the datasets should be directed to the corresponding author.
Conflicts of Interest
The authors declare no conflicts of interest.
References
- Wei, W.; Li, J. Assessing the Three-Dimensional Vegetation Carbon Sink of Urban Green Spaces Using Unmanned Aerial Vehicles and Machine Learning. Ecol. Indic. 2025, 173, 113380. [Google Scholar] [CrossRef]
- Liang, H.; Yan, Q.; Yan, Y.; Zhang, Q. Exploring the Provision, Efficiency and Improvements of Urban Green Spaces on Accessibility at the Metropolitan Scale. J. Environ. Manag. 2024, 352, 120118. [Google Scholar] [CrossRef] [PubMed]
- Zhang, L.; Tan, P.Y.; Gan, D.R.Y.; Samsudin, R. Assessment of Mediators in the Associations between Urban Green Spaces and Self-Reported Health. Landsc. Urban Plan. 2022, 226, 104503. [Google Scholar] [CrossRef]
- Gunawardena, K.R.; Wells, M.J.; Kershaw, T. Utilising Green and Bluespace to Mitigate Urban Heat Island Intensity. Sci. Total Environ. 2017, 584–585, 1040–1055. [Google Scholar] [CrossRef]
- Ai, J.; Kim, M. Research on Plant Landscape Design of Urban Industrial Site Green Space Based on Green Infrastructure Concept. Plants 2025, 14, 747. [Google Scholar] [CrossRef]
- Lan, H.; Lau, K.K.-L.; Shi, Y.; Ren, C. Improved Urban Heat Island Mitigation Using Bioclimatic Redevelopment along an Urban Waterfront at Victoria Dockside, Hong Kong. Sust. Cities Soc. 2021, 74, 103172. [Google Scholar] [CrossRef]
- Arrar, H.F.; Kaoula, D.; Santamouris, M.; Foufa-Abdessemed, A.; Emmanuel, R.; Matallah, M.E.; Ahriz, A.; Attia, S. Coupling of Different Nature Base Solutions for Pedestrian Thermal Comfort in a Mediterranean Climate. Build. Environ. 2024, 256, 111480. [Google Scholar] [CrossRef]
- Hu, J.; Yang, Y.; Zhou, Y.; Zhang, T.; Ma, Z.; Meng, X. Spatial Patterns and Temporal Variations of Footprint and Intensity of Surface Urban Heat Island in 141 China Cities. Sustain. Cities Soc. 2022, 77, 103585. [Google Scholar] [CrossRef]
- Yang, J.; Jin, S.; Xiao, X.; Jin, C.; Xia, J.; Li, X.; Wang, S. Local Climate Zone Ventilation and Urban Land Surface Temperatures: Towards a Performance-Based and Wind-Sensitive Planning Proposal in Megacities. Sustain. Cities Soc. 2019, 47, 101487. [Google Scholar] [CrossRef]
- Halder, B.; Bandyopadhyay, J.; Banik, P. Monitoring the Effect of Urban Development on Urban Heat Island Based on Remote Sensing and Geo-Spatial Approach in Kolkata and Adjacent Areas, India. Sustain. Cities Soc. 2021, 74, 103186. [Google Scholar] [CrossRef]
- Shi, Y.; Zhang, Y. Remote Sensing Retrieval of Urban Land Surface Temperature in Hot-Humid Region. Urban Clim. 2018, 24, 299–310. [Google Scholar] [CrossRef]
- Bonafoni, S.; Baldinelli, G.; Verducci, P. Sustainable Strategies for Smart Cities: Analysis of the Town Development Effect on Surface Urban Heat Island through Remote Sensing Methodologies. Sustain. Cities Soc. 2017, 29, 211–218. [Google Scholar] [CrossRef]
- Chen, X.; Zhang, Y. Impacts of Urban Surface Characteristics on Spatiotemporal Pattern of Land Surface Temperature in Kunming of China. Sustain. Cities Soc. 2017, 32, 87–99. [Google Scholar] [CrossRef]
- Roy, T.B.; Middey, A.; Krupadam, R.J. Unveiling the Microclimate: A Comprehensive Review of Tools, Techniques, and Future Directions for Sustainable Cities. Build. Environ. 2025, 274, 112726. [Google Scholar] [CrossRef]
- Al-Najjar, H.; Kalantar, B.; Abdul Halin, A. Editorial: Advancements in Land Cover Classification and Machine Learning Techniques for Urban Areas Using Remote Sensing Big Data. Front. Environ. Sci. 2025, 13, 1584485. [Google Scholar] [CrossRef]
- Sharma, G.; Morgenroth, J.; Richards, D.R.; Ye, N. Advancing Urban Forest and Ecosystem Service Assessment through the Integration of Remote Sensing and I-Tree Eco: A Systematic Review. Urban For. Urban Green. 2025, 104, 128659. [Google Scholar] [CrossRef]
- Yan, J.; Zhao, L.; Zhang, Y.; Liu, M.; Yang, Y.; Liu, Z.; Zhang, L. Effects of Microclimatic Factors on Stomatal Conductance of Plants in Vertical Greenery Systems in Humid Subtropical Areas. Sustain. Cities Soc. 2022, 85, 104056. [Google Scholar] [CrossRef]
- Qi, Q.; Meng, Q.; Wang, J.; He, B.; Liang, H.; Ren, P. Applicability of Mobile-Measurement Strategies to Different Periods: A Field Campaign in a Precinct with a Block Park. Build. Environ. 2022, 211, 108762. [Google Scholar] [CrossRef]
- Xu, D.; Zhou, D.; Wang, Y.; Xu, W.; Yang, Y. Field Measurement Study on the Impacts of Urban Spatial Indicators on Urban Climate in a Chinese Basin and Static-Wind City. Build. Environ. 2019, 147, 482–494. [Google Scholar] [CrossRef]
- Li, H.; Harvey, J.; Kendall, A. Field Measurement of Albedo for Different Land Cover Materials and Effects on Thermal Performance. Build. Environ. 2013, 59, 536–546. [Google Scholar] [CrossRef]
- Niachou, K.; Livada, I.; Santamouris, M. Experimental Study of Temperature and Airflow Distribution inside an Urban Street Canyon during Hot Summer Weather Conditions—Part I: Air and Surface Temperatures. Build. Environ. 2008, 43, 1383–1392. [Google Scholar] [CrossRef]
- Benbrahim, R.; Sriti, L.; Besbas, S.; Nocera, F.; Longhitano, A. Assessing the Impact of Urban Area Size on Thermal Comfort in Compact Urban Fabrics Considering the Saharan City of Ghardaïa, Algeria. Sustainability 2025, 17, 2213. [Google Scholar] [CrossRef]
- Chen, G.; Charlie Lam, C.K.; Wang, K.; Wang, B.; Hang, J.; Wang, Q.; Wang, X. Effects of Urban Geometry on Thermal Environment in 2D Street Canyons: A Scaled Experimental Study. Build. Environ. 2021, 198, 107916. [Google Scholar] [CrossRef]
- Guo, P.; Wang, S.; Xu, B.; Meng, Q.; Wang, Y. Reduced-Scale Experimental Model and Numerical Investigations to Buoyance-Driven Natural Ventilation in a Large Space Building. Build. Environ. 2018, 145, 24–32. [Google Scholar] [CrossRef]
- Lee, P.J.; Kim, Y.H.; Jeon, J.Y.; Song, K.D. Effects of Apartment Building Façade and Balcony Design on the Reduction of Exterior Noise. Build. Environ. 2007, 42, 3517–3528. [Google Scholar] [CrossRef]
- Pearlmutter, D.; Berliner, P.; Shaviv, E. Physical Modeling of Pedestrian Energy Exchange within the Urban Canopy. Build. Environ. 2006, 41, 783–795. [Google Scholar] [CrossRef]
- Touhami, H.; Berkouk, D.; Bouzir, T.A.K.; Khelil, S.; Gomaa, M.M. The Influence of Multisensory Perception on Student Outdoor Comfort in University Campus Design. Atmosphere 2025, 16, 150. [Google Scholar] [CrossRef]
- Yang, S.; Chong, A.; Liu, P.; Biljecki, F. Thermal Comfort Insight: Thermal Affordance and Its Visual Assessment for Sustainable Streetscape Design. Build. Environ. 2025, 271, 112569. [Google Scholar] [CrossRef]
- Zhang, J.; Li, Z.; Hu, D. Effects of Urban Morphology on Thermal Comfort at the Micro-Scale. Sustain. Cities Soc. 2022, 86, 104150. [Google Scholar] [CrossRef]
- Xu, F.; Gao, Z.; Zhang, J.; Hu, Y.; Ding, W. Influence of Typical Street-Side Public Building Morphologies on the Ventilation Performance of Streets and Squares. Build. Environ. 2022, 221, 109331. [Google Scholar] [CrossRef]
- Wu, Z.; Dou, P.; Chen, L. Comparative and Combinative Cooling Effects of Different Spatial Arrangements of Buildings and Trees on Microclimate. Sustain. Cities Soc. 2019, 51, 101711. [Google Scholar] [CrossRef]
- Ali-Toudert, F.; Mayer, H. Numerical Study on the Effects of Aspect Ratio and Orientation of an Urban Street Canyon on Outdoor Thermal Comfort in Hot and Dry Climate. Build. Environ. 2006, 41, 94–108. [Google Scholar] [CrossRef]
- Spantideas, S.T.; Giannopoulos, A.E.; Trakadas, P. Autonomous Price-Aware Energy Management System in Smart Homes via Actor-Critic Learning with Predictive Capabilities. IEEE Trans. Autom. Sci. Eng. 2025, 22, 15018–15033. [Google Scholar] [CrossRef]
- Park, J.S. Long-Term Field Measurement on Effects of Wind Speed and Directional Fluctuation on Wind-Driven Cross Ventilation in a Mock-up Building. Build. Environ. 2013, 62, 1–8. [Google Scholar] [CrossRef]
- Wen, Y.; Zhang, P.; Wei, J.; Yu, F.; Huang, C. Sustainable Urban Designs Integrating Aboveground Microclimates and Underground Heat Islands: A Systematic Review and Design Strategies. Renew. Sustain. Energy Rev. 2025, 212, 115445. [Google Scholar] [CrossRef]
- Liu, L.; Zhang, Y. Urban Heat Island Analysis Using the Landsat TM Data and ASTER Data: A Case Study in Hong Kong. Remote Sens. 2011, 3, 1535–1552. [Google Scholar] [CrossRef]
- Pigeon, G.; Moscicki, M.A.; Voogt, J.A.; Masson, V. Simulation of Fall and Winter Surface Energy Balance over a Dense Urban Area Using the TEB Scheme. Meteorol. Atmos. Phys. 2008, 102, 159–171. [Google Scholar] [CrossRef]
- Thorsson, S.; Lindberg, F.; Eliasson, I.; Holmer, B. Different Methods for Estimating the Mean Radiant Temperature in an Outdoor Urban Setting. Int. J. Climatol. 2007, 27, 1983–1993. [Google Scholar] [CrossRef]
- Sarria, F.R.; Delgado, M.G.; Palma, R.M.; Amores, T.P.; Ramos, J.S.; Dominguez, S. alvarez Modelling Pollutant Dispersion in Urban Canyons to Enhance Air Quality and Urban Planning. Appl. Sci. 2025, 15, 1752. [Google Scholar] [CrossRef]
- Cheng, W.-C.; Fu, T.-M. Accelerating Urban Street Canyon Wind Flow Predictions with Deep Learning Method. Build. Simul. 2025, 18, 923–936. [Google Scholar] [CrossRef]
- Krayenhoff, E.S.; Moustaoui, M.; Broadbent, A.M.; Gupta, V.; Georgescu, M. Diurnal Interaction between Urban Expansion, Climate Change and Adaptation in US Cities. Nat. Clim. Change 2018, 8, 1097–1103. [Google Scholar] [CrossRef]
- Makaremi, N.; Salleh, E.; Jaafar, M.Z.; GhaffarianHoseini, A. Thermal Comfort Conditions of Shaded Outdoor Spaces in Hot and Humid Climate of Malaysia. Build. Environ. 2012, 48, 7–14. [Google Scholar] [CrossRef]
- Vitale, V.; Salerno, G. A Numerical Prediction of the Passive Cooling Effects on Thermal Comfort for a Historical Building in Rome. Energy Build. 2017, 157, 1–10. [Google Scholar] [CrossRef]
- Wang, Y.; Berardi, U.; Akbari, H. Comparing the Effects of Urban Heat Island Mitigation Strategies for Toronto, Canada. Energy Build. 2016, 114, 2–19. [Google Scholar] [CrossRef]
- Takebayashi, H. Effects of Air Temperature, Humidity, and Wind Velocity Distribution on Indoor Cooling Load and Outdoor Human Thermal Environment at Urban Scale. Energy Build. 2022, 257, 111792. [Google Scholar] [CrossRef]
- Jiao, M.; Zhou, W.; Zheng, Z.; Wang, J.; Qian, Y. Patch Size of Trees Affects Its Cooling Effectiveness: A Perspective from Shading and Transpiration Processes. Agric. For. Meteorol. 2017, 247, 293–299. [Google Scholar] [CrossRef]
- Lin, B.-S.; Lin, C.-T. Preliminary Study of the Influence of the Spatial Arrangement of Urban Parks on Local Temperature Reduction. Urban For. Urban Green. 2016, 20, 348–357. [Google Scholar] [CrossRef]
- Gao, Z.; Zaitchik, B.F.; Hou, Y.; Chen, W. Toward Park Design Optimization to Mitigate the Urban Heat Island: Assessment of the Cooling Effect in Five U.S. Cities. Sustain. Cities Soc. 2022, 81, 103870. [Google Scholar] [CrossRef]
- Shi, M.; Wang, Y.; Lv, H.; Jia, W. Climate Gentrification along with Parks’ Cooling Performance in One of China’s Tropical Industrial Cities. Sci. Total Environ. 2023, 892, 164603. [Google Scholar] [CrossRef]
- Zhou, Y.; Luo, Y.; Yi, X.; Lun, F.; Hu, Q.; Huang, N.; Wen, G.; Zhou, H.; Hu, X. Exploring the Influence of Local Urban Heat Features on Park Cooling Effects: Insights from Chinese Cities. Build. Environ. 2024, 262, 111782. [Google Scholar] [CrossRef]
- Liu, Z.; Fu, L.; Wu, C.; Zhang, Z.; Zhang, Z.; Lin, X.; Li, X.; Hu, Y.; Ge, H. Spatialized Importance of Key Factors Affecting Park Cooling Intensity Based on the Park Scale. Sust. Cities Soc. 2023, 99, 104952. [Google Scholar] [CrossRef]
- Wang, Y.; Akbari, H. The Effects of Street Tree Planting on Urban Heat Island Mitigation in Montreal. Sust. Cities Soc. 2016, 27, 122–128. [Google Scholar] [CrossRef]
- Adams, M.P.; Smith, P.L. A Systematic Approach to Model the Influence of the Type and Density of Vegetation Cover on Urban Heat Using Remote Sensing. Landsc. Urban Plan. 2014, 132, 47–54. [Google Scholar] [CrossRef]
- Ibsen, P.C.; Crawford, B.R.; Corro, L.M.; Bagstad, K.J.; McNellis, B.E.; Jenerette, G.D.; Diffendorfer, J.E. Urban Tree Cover Provides Consistent Mitigation of Extreme Heat in Arid but Not Humid Cities. Sustain. Cities Soc. 2024, 113, 105677. [Google Scholar] [CrossRef]
- Feng, X.; Yu, J.; Xin, C.; Ye, T.; Wang, T.; Chen, H.; Zhang, X.; Zhang, L. Quantifying and Comparing the Cooling Effects of Three Different Morphologies of Urban Parks in Chengdu. Land 2023, 12, 451. [Google Scholar] [CrossRef]
- Sun, R.; Chen, A.; Chen, L.; Lu, Y. Cooling Effects of Wetlands in an Urban Region: The Case of Beijing. Ecol. Indic. 2012, 20, 57–64. [Google Scholar] [CrossRef]
- Cruz, J.A.; Blanco, A.C.; Garcia, J.J.; Santos, J.A.; Moscoso, A.D. Evaluation of the Cooling Effect of Green and Blue Spaces on Urban Microclimate through Numerical Simulation: A Case Study of Iloilo River Esplanade, Philippines. Sust. Cities Soc. 2021, 74, 103184. [Google Scholar] [CrossRef]
- Hamada, S.; Ohta, T. Seasonal Variations in the Cooling Effect of Urban Green Areas on Surrounding Urban Areas. Urban For. Urban Green. 2010, 9, 15–24. [Google Scholar] [CrossRef]
- GB 50176-2016; Thermal Design Code for Civil Buildings. Architecture & Building Press: Beijing, China, 2016.
- Crank, P.J.; Sailor, D.J.; Ban-Weiss, G.; Taleghani, M. Evaluating the ENVI-Met Microscale Model for Suitability in Analysis of Targeted Urban Heat Mitigation Strategies. Urban Clim. 2018, 26, 188–197. [Google Scholar] [CrossRef]
- Paas, B.; Schneider, C. A Comparison of Model Performance between ENVI-Met and Austal2000 for Particulate Matter. Atmos. Environ. 2016, 145, 392–404. [Google Scholar] [CrossRef]
- Ouyang, W.; Morakinyo, T.E.; Ren, C.; Ng, E. The Cooling Efficiency of Variable Greenery Coverage Ratios in Different Urban Densities: A Study in a Subtropical Climate. Build. Environ. 2020, 174, 106772. [Google Scholar] [CrossRef]
- Kleerekoper, L.; Taleghani, M.; van den Dobbelsteen, A.; Hordijk, T. Urban Measures for Hot Weather Conditions in a Temperate Climate Condition: A Review Study. Renew. Sustain. Energy Rev. 2017, 75, 515–533. [Google Scholar] [CrossRef]
- Acero, J.A.; Herranz-Pascual, K. A Comparison of Thermal Comfort Conditions in Four Urban Spaces by Means of Measurements and Modelling Techniques. Build. Environ. 2015, 93, 245–257. [Google Scholar] [CrossRef]
- Morakinyo, T.E.; Kong, L.; Lau, K.K.-L.; Yuan, C.; Ng, E. A Study on the Impact of Shadow-Cast and Tree Species on in-Canyon and Neighborhood’s Thermal Comfort. Build. Environ. 2017, 115, 1–17. [Google Scholar] [CrossRef]
- Alinasab, N.; Mohammadzadeh, N.; Karimi, A.; Mohammadzadeh, R.; Gál, T. A Measurement-Based Framework Integrating Machine Learning and Morphological Dynamics for Outdoor Thermal Regulation. Int. J. Biometeorol. 2025. [Google Scholar] [CrossRef]
- Cheng, X.; Wei, B.; Chen, G.; Li, J.; Song, C. Influence of Park Size and Its Surrounding Urban Landscape Patterns on the Park Cooling Effect. J. Urban Plan. Dev. 2015, 141, A4014002. [Google Scholar] [CrossRef]
- Qiu, K.; Jia, B. The Roles of Landscape Both inside the Park and the Surroundings in Park Cooling Effect. Sust. Cities Soc. 2020, 52, 101864. [Google Scholar] [CrossRef]
- Han, D.; Yang, X.; Cai, H.; Xu, X. Impacts of Neighboring Buildings on the Cold Island Effect of Central Parks: A Case Study of Beijing, China. Sustainability 2020, 12, 9499. [Google Scholar] [CrossRef]
- Chen, X.; Su, Y.; Li, D.; Huang, G.; Chen, W.; Chen, S. Study on the Cooling Effects of Urban Parks on Surrounding Environments Using Landsat TM Data: A Case Study in Guangzhou, Southern China. Int. J. Remote Sens. 2012, 33, 5889–5914. [Google Scholar] [CrossRef]
- Jamei, Y.; Rajagopalan, P.; Sun, Q. Spatial Structure of Surface Urban Heat Island and Its Relationship with Vegetation and Built-up Areas in Melbourne, Australia. Sci. Total Environ. 2019, 659, 1335–1351. [Google Scholar] [CrossRef]
- Karimi, A.; Moreno-Rangel, D.; Garcia-Martinez, A. Granular Mapping of UHI and Heatwave Effects: Implications for Building Performance and Urban Resilience. Build. Environ. 2025, 273, 112705. [Google Scholar] [CrossRef]
- Mo, F.; He, N.; Chen, L.; Li, M.; Yu, S.; Zhang, J.; Wang, W.; Wei, J. Strategies for Stabilization of Zn Anodes for Aqueous Zn-Based Batteries: A Mini Review. Front. Chem. 2022, 9, 822624. [Google Scholar] [CrossRef]
- Jacobs, C.; Klok, L.; Bruse, M.; Cortesao, J.; Lenzholzer, S.; Kluck, J. Are Urban Water Bodies Really Cooling? Urban CLim. 2020, 32, 100607. [Google Scholar] [CrossRef]
- Sodoudi, S.; Zhang, H.; Chi, X.; Mueller, F.; Li, H. The Influence of Spatial Configuration of Green Areas on Microclimate and Thermal Comfort. Urban For. Urban Green. 2018, 34, 85–96. [Google Scholar] [CrossRef]
- Zhao, Q.; Sailor, D.J.; Wentz, E.A. Impact of Tree Locations and Arrangements on Outdoor Microclimates and Human Thermal Comfort in an Urban Residential Environment. Urban For. Urban Green. 2018, 32, 81–91. [Google Scholar] [CrossRef]
- Liu, Z.; Cheng, W.; Jim, C.Y.; Morakinyo, T.E.; Shi, Y.; Ng, E. Heat Mitigation Benefits of Urban Green and Blue Infrastructures: A Systematic Review of Modeling Techniques, Validation and Scenario Simulation in ENVI-Met V4. Build. Environ. 2021, 200, 107939. [Google Scholar] [CrossRef]
- Tsoka, S.; Tsikaloudaki, A.; Theodosiou, T. Analyzing the ENVI-Met Microclimate Model’s Performance and Assessing Cool Materials and Urban Vegetation Applications-A Review. Sustain. Cities Soc. 2018, 43, 55–76. [Google Scholar] [CrossRef]
- Matzarakis, A.; Amelung, B. Physiological Equivalent Temperature as Indicator for Impacts of Climate Change on Thermal Comfort of Humans. In Seasonal Forecasts, Climatic Change and Human Health: Health and Climate; Thomson, M.C., Garcia-Herrera, R., Beniston, M., Eds.; Springer: Dordrecht, The Netherlands, 2008; pp. 161–172. ISBN 978-1-4020-6877-5. [Google Scholar]
- Xu, C.; Wang, W.; Zhu, H. Spatial Gradient Differences in the Cooling Island Effect and Influencing Factors of Urban Park Green Spaces in Beijing. Buildings 2024, 14, 1206. [Google Scholar] [CrossRef]
- Zhang, Y.; Wang, Y.; Ding, N.; Yang, X. Spatial Pattern Impact of Impervious Surface Density on Urban Heat Island Effect: A Case Study in Xuzhou, China. Land 2022, 11, 2135. [Google Scholar] [CrossRef]
- Zölch, T.; Maderspacher, J.; Wamsler, C.; Pauleit, S. Using Green Infrastructure for Urban Climate-Proofing: An Evaluation of Heat Mitigation Measures at the Micro-Scale. Urban For. Urban Green. 2016, 20, 305–316. [Google Scholar] [CrossRef]
- Liu, J.; Wang, J.; Chen, T.; Wang, L. Heat Stress Resilience Assessment of Urban Form from Physical Space Dimension: A Case Study of Guangdong-Hong Kong-Macao Greater Bay Area. Urban Clim. 2024, 55, 101905. [Google Scholar] [CrossRef]
- Chatzidimitriou, A.; Yannas, S. Microclimate Development in Open Urban Spaces: The Influence of Form and Materials. Energy Build. 2015, 108, 156–174. [Google Scholar] [CrossRef]
- Liu, H.; Zhou, X.; Ge, X.; Han, D.; Zhuang, W.; Tang, Y.; Shen, X. Multiscale Urban Design Based on the Optimization of the Wind and Thermal Environments: A Case Study of the Core Area of Suzhou Science and Technology City. Front. Archit. Res. 2024, 13, 822–841. [Google Scholar] [CrossRef]
- Wang, J.; Yin, P.; Li, D.; Zheng, G.; Sun, B. Quantitative Relationship between Urban Green Canopy Area and Urban Greening Land Area. J. Urban Plan. Dev 2021, 147, 05021016. [Google Scholar] [CrossRef]
- Petralli, M.; Massetti, L.; Brandani, G.; Orlandini, S. Urban Planning Indicators: Useful Tools to Measure the Effect of Urbanization and Vegetation on Summer Air Temperatures. Int. J. Climatol. 2014, 34, 1236–1244. [Google Scholar] [CrossRef]
- Yang, A.-S.; Juan, Y.-H.; Wen, C.-Y.; Chang, C.-J. Numerical Simulation of Cooling Effect of Vegetation Enhancement in a Subtropical Urban Park. Appl. Energy 2017, 192, 178–200. [Google Scholar] [CrossRef]
- Pradhan, K.; Ettinger, A.K.; Case, M.J.; Hille Ris Lambers, J. Applying Climate Change Refugia to Forest Management and Old-Growth Restoration. Glob. Change Biol. 2023, 29, 3692–3706. [Google Scholar] [CrossRef]
- Duy, T.D.; Huang, J.; Cheng, Y.; Thi, C.T.T. Da Nang Green Space System Planning: An Ecology Landscape Approach. Sustainability 2018, 10, 3506. [Google Scholar] [CrossRef]
- Li, X.; Xia, G.; Lin, T.; Xu, Z.; Wang, Y. Construction of Urban Green Space Network in Kashgar City, China. Land 2022, 11, 1826. [Google Scholar] [CrossRef]
- Wu, H.; Yang, C.; Chen, J.; Yang, S.; Lu, T.; Lin, X. Effects of Green Space Landscape Patterns on Particulate Matter in Zhejiang Province, China. Atmos. Pollut. Res. 2018, 9, 923–933. [Google Scholar] [CrossRef]
- Shao, Z.; Fu, H.; Li, D.; Altan, O.; Cheng, T. Remote Sensing Monitoring of Multi-Scale Watersheds Impermeability for Urban Hydrological Evaluation. Remote Sens. Environ. 2019, 232, 111338. [Google Scholar] [CrossRef]
- Hua, L.; Zhang, X.; Nie, Q.; Sun, F.; Tang, L. The Impacts of the Expansion of Urban Impervious Surfaces on Urban Heat Islands in a Coastal City in China. Sustainability 2020, 12, 475. [Google Scholar] [CrossRef]
- Han, K.-W.; Shi, K.-B.; Yan, X.-J.; Ling, F.; Hao, G.-C.; Qin, Q.-R. Estimating Water Surface Evaporation Losses under Floating Coverage: Modeling and Application. J. Hydrol. 2023, 626, 130252. [Google Scholar] [CrossRef]
- Arngrímsson, S.A.; Evans, E.M.; Saunders, M.J.; Ogburn, C.L.; Lewis, R.D.; Cureton, K.J. Validation of Body Composition Estimates in Male and Female Distance Runners Using Estimates from a Four-Component Model. Am. J. Hum. Biol. 2000, 12, 301–314. [Google Scholar] [CrossRef]
- Carrea, L.; Embury, O.; Merchant, C.J. Datasets Related to In-Land Water for Limnology and Remote Sensing Applications: Distance-to-Land, Distance-to-Water, Water-Body Identifier and Lake-Centre Co-Ordinates. Geosci. Data J. 2015, 2, 83–97. [Google Scholar] [CrossRef]
- Okabe, K.; Okabe, A. Functional Method for Analyzing Open-Space Ratios around Individual Buildings and Its Implementation with GIS. ISPRS Int. J. Geo-Inf. 2024, 13, 70. [Google Scholar] [CrossRef]
- Zeng, P.; Sun, F.; Liu, Y.; Tian, T.; Wu, J.; Dong, Q.; Peng, S.; Che, Y. The Influence of the Landscape Pattern on the Urban Land Surface Temperature Varies with the Ratio of Land Components: Insights from 2D/3D Building/Vegetation Metrics. Sust. Cities Soc. 2022, 78, 103599. [Google Scholar] [CrossRef]
- Wang, W.; Cheng, X.; Dai, M. Strategies for Sustainable Urban Development and Morphological Optimization of Street Canyons: Measurement and Simulation of PM2.5 at Different Points and Heights. Sust. Cities Soc. 2022, 87, 104191. [Google Scholar] [CrossRef]
- Liu, Q.; Dong, Q.; Zhang, L.; Sun, C. Summer Cooling Island Effects of Blue-Green Spaces in Severe Cold Regions: A Case Study of Harbin, China. Build. Environ. 2024, 257, 111539. [Google Scholar] [CrossRef]
- Niu, J.; Xiong, J.; Qin, H.; Hu, J.; Deng, J.; Han, G.; Yan, J. Influence of Thermal Comfort of Green Spaces on Physical Activity: Empirical Study in an Urban Park in Chongqing, China. Build. Environ. 2022, 219, 109168. [Google Scholar] [CrossRef]
- Chow, W.T.L.; Brazel, A.J. Assessing Xeriscaping as a Sustainable Heat Island Mitigation Approach for a Desert City. Build. Environ. 2012, 47, 170–181. [Google Scholar] [CrossRef]
- Liu, Z.; Zheng, S.; Zhao, L. Evaluation of the ENVI-Met Vegetation Model of Four Common Tree Species in a Subtropical Hot-Humid Area. Atmosphere 2018, 9, 198. [Google Scholar] [CrossRef]
- Herath, P.; Bai, X.; Jin, H.; Thatcher, M. Does the Spatial Configuration of Urban Parks Matter in Ameliorating Extreme Heat? Urban Clim. 2024, 53, 101756. [Google Scholar] [CrossRef]
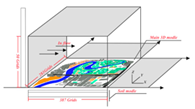
Disclaimer/Publisher’s Note: The statements, opinions and data contained in all publications are solely those of the individual author(s) and contributor(s) and not of MDPI and/or the editor(s). MDPI and/or the editor(s) disclaim responsibility for any injury to people or property resulting from any ideas, methods, instructions or products referred to in the content. |
© 2025 by the authors. Licensee MDPI, Basel, Switzerland. This article is an open access article distributed under the terms and conditions of the Creative Commons Attribution (CC BY) license (https://creativecommons.org/licenses/by/4.0/).