Article

A Two-Stage Site Selection Model for Wood-Processing Plants in Heilongjiang Province Based on GIS and NSGA-II Integration

by
Chenglin Ma
,
Xinran Wang
*,
Yilong Wang
,
Yuxin Liu
and
Wenchao Kang
College of Civil Engineering and Transportation, Northeast Forestry University, Harbin 150040, China
*
Author to whom correspondence should be addressed.
Forests 2025, 16(7), 1086; https://doi.org/10.3390/f16071086
Submission received: 17 May 2025 / Revised: 21 June 2025 / Accepted: 25 June 2025 / Published: 30 June 2025

Abstract

Heilongjiang Province, as China’s principal gateway for Russian timber imports, faces structural inefficiencies in the localization of wood-processing enterprises—characterized by ecological sensitivity, resource–industry mismatches, and uneven spatial distribution. To address these challenges, this study proposes a two-stage site selection framework that integrates Geographic Information Systems (GIS) with an enhanced Non-dominated Sorting Genetic Algorithm II (NSGA-II). The model aims to reconcile ecological protection with industrial efficiency by identifying optimal facility locations that minimize environmental impact, reduce construction and logistics costs, and enhance service coverage. Using spatially resolved multi-source datasets—including forest resource distribution, transportation networks, ecological redlines, and socioeconomic indicators—the GIS-based suitability analysis (Stage I) identified 16 candidate zones. Subsequently, a multi-objective optimization model (Stage II) was applied to minimize carbon intensity and cost while maximizing service accessibility. The improved NSGA-II algorithm achieved convergence within 700 iterations, generating 124 Pareto-optimal solutions and enabling a 23.7% reduction in transport-related CO2 emissions. Beyond carbon mitigation, the model spatializes policy constraints and economic trade-offs into actionable infrastructure plans, contributing to regional sustainability goals and transboundary industrial coordination with Russia. It further demonstrates methodological generalizability for siting logistics-intensive and policy-sensitive facilities in other forestry-based economies. While the model does not yet account for temporal dynamics or agent behaviors, it provides a robust foundation for informed planning under China’s dual-carbon strategy and offers replicable insights for the global forest products supply chain.

1. Introduction

Heilongjiang Province in northeastern China, rich in forest resources and strategically located along the border with Russia, accounts for over 60% of China’s total imports of Russian timber (General Administration of Customs of the People’s Republic of China 2023). The province plays a critical role in supporting national timber security and regional industrial development. However, structural inefficiencies persist in the spatial distribution of its wood-processing capacity. Most processing plants are clustered around port cities, far from major domestic consumption centers. This has led to high transportation costs, low processing efficiency, and a limited in-province conversion rate. According to the China Forestry Statistical Yearbook (2023). In 2022, the deep-processing rate in Heilongjiang was only 32.5%, significantly below the national average. A large proportion of raw logs are transported inland without local processing, resulting in resource outflows and low value-added output. These issues highlight the urgent need for a scientifically grounded siting model that integrates resource availability, transport accessibility, ecological constraints, and market proximity to enable a more efficient, closed-loop “import–process–export” industrial structure.
On the international front, significant structural changes are taking place in Russia’s forestry sector. In response to trade sanctions and a national ban on unprocessed timber exports, the competitiveness of Russian timber exports has become increasingly uneven across regions. According to Gordeev [1], while the Russian North-West has been most directly impacted by new trade barriers, Siberian timber enterprises—many of which are located in Russia’s Asian region—have exhibited differentiated responses depending on firm size, specialization, and proximity to borders. Their findings indicate that smaller, domestically focused firms achieved higher median revenues and net profits in 2022, due in part to reduced competition. Moreover, spatial heterogeneity in regional policy responses has contributed to variable resilience across Siberia. The authors argue that these conditions may foster a shift toward higher-value production and greater domestic demand, forming the basis for a more sustainable development path in Russia’s timber industry. Meanwhile, in Russia’s Far Eastern Federal District (FEFD), the wood industry maintains a comparatively competitive edge. Natalia Usoltceva et al. [2] conducted a comprehensive assessment of timber trade competitiveness across Russian regions, employing a combined index method based on entropy weight and coefficient of variation. Their study shows that the FEFD remains strong in wood-processing and export potential. These findings imply that eastern Russian regions, especially the FEFD, are likely to retain their role in the international wood trade, further reinforcing their strategic connection to northeastern China’s timber processing hubs [3].
Within this evolving landscape, Sino-Russian cooperation in forestry has gained new strategic significance. As outlined in the 2024 Joint Statement on Deepening the Comprehensive Strategic Partnership in the New Era, both countries have pledged to strengthen collaboration in forest resource utilization, ecological protection, and sustainable development. Guided by bilateral frameworks such as the Outline for China–Russia Investment Cooperation, and aligned with international agendas including the Paris Agreement and the UN Sustainable Development Goals (SDGs), the two governments are actively promoting investment in value-added timber processing, green supply chains, and carbon trading markets [4]. These collaborative efforts are particularly relevant to provinces like Heilongjiang, where integrated industrial planning and ecological constraints must be carefully balanced.
In addition, broader regional frameworks such as the Belt and Road Initiative (BRI) have been shown to facilitate regional development, trade expansion, and deeper political and cultural engagement among participating nations. Ashraf et al. [5] point out that the BRI provides a unique platform for enhancing cross-border cooperation, including in the forestry sector, and offers new opportunities for deepening economic linkages between China and Russia. This context underscores the need for spatial planning tools that align industrial layout with changing geopolitical and trade dynamics.
In this context, developing a low-carbon, spatially optimized siting model for wood-processing plants becomes imperative—not only to enhance domestic value retention and ecological sustainability but also to adapt to shifting global supply chains and bilateral trade dynamics.
Research on the location optimization of the wood-processing industry has undergone a gradual evolution from the application of heuristic algorithms to the integration of multisource data and finally to the evaluation of regional economic impacts. Early studies mainly focused on the construction of heuristic models and the improvement of solution methods. For example, Lin Yahui et al. [6] introduced a genetic algorithm into the timber logistics network, developing a reusable natural number coding model that effectively addressed the site selection optimization problem for wood-processing enterprises. Based on this, Qiu Rongzu et al. [7] developed an ArcGIS-based wood location decision support system, realizing an initial integration of spatial data and genetic algorithms, thereby enhancing the geographical adaptability of the site selection model.
With the advancement of spatial information technologies and artificial intelligence, site selection research has gradually shifted toward multimodel integration. Zhang Lanyi et al. [8] combined a BP neural network with GIS spatial analysis to implement intelligent site evaluation on the MATLAB R2012a achieving the integration of subjective scoring with objective geospatial data. Dou Jiamei et al. [9] introduced the Baumol–Wolfe model to jointly consider transportation costs and warehouse economies of scale, thereby expanding the economic dimension of site selection models. Zhang Jun et al. [10] further integrated big data platforms to enhance the precision and convergence efficiency of traditional genetic algorithms, especially under complex geographical constraints.
In international studies, Khanal et al. [11] investigated the siting of mass timber processing facilities in Michigan (USA), identifying resource competition hotspots by overlaying procurement zones of softwood lumber producers. They estimated the annual sustainable availability of softwood (ASAW) using FIA data and applied the IMPLAN model to assess regional economic impacts, constructing an integrated site evaluation framework encompassing resource availability, spatial suitability, and economic benefits.
Despite these advances, current site selection research still exhibits three major limitations in the context of Heilongjiang’s timber industry. First, many models neglect ecological constraints and focus narrowly on economic objectives. Second, most studies are limited to domestic logistics systems without addressing the cross-border characteristics of timber trade. Third, the spatial precision and multi-objective coordination of site selection outcomes require further improvement. In recent years, GIS has demonstrated strong capabilities in spatial analysis and has been widely applied in facility location studies. Wang Lijuan et al. [12] developed an AHP-GIS-based suitability model for mountainous photovoltaic project siting, integrating terrain, land use, and ecological constraints to classify suitability zones. This provides valuable insights for siting energy infrastructure in complex terrain under land-use regulation. Zhong Yu et al. [13] proposed a GIS-based site selection model for tobacco logistics distribution centers, integrating spatial and web data through layer overlay and accessibility analysis to identify optimal facility locations, offering quantitative support for regional logistics planning.
On this basis, two-stage optimization frameworks have become mainstream. Gao Jianwei et al. [14] addressed the siting of NIMBY-type facilities by integrating DEMATEL and TODIM within a probabilistic hesitant fuzzy environment, validating the model’s feasibility and stability using a waste-to-energy project in Beijing. Zhou Guangquan et al. [15] combined grey prediction and GIS erasure methods to preselect candidate zones, and then applied spatial distance-based refinement strategies to enhance the scientific rigor of the site selection process. Shao Meng et al. [16] proposed a hybrid GIS-MCDM-GRU framework, introducing a cloud-ADH weighting method to reduce subjectivity and applying GRU neural networks to dynamically predict operational performance, thus supporting decision-making for wave energy plant siting. Karipoğlu et al. [17] constructed a GIS-based FAHP-FEDAS framework to evaluate hybrid offshore wind and solar facilities by comprehensively considering wind speed, port distance, and visibility. The study highlights the integration of fuzzy multi-criteria decision-making with spatial analysis. Li Yaxiong et al. [18] proposed a two-phase model for missile site selection using GIS-based multi-ring buffer analysis and an improved TOPSIS approach to enhance spatial evaluation accuracy. Zewdie et al. [19] employed MCDM integrated with GIS to identify dry port locations in Ethiopia, selecting road and rail proximity as key factors and using the SMART method for weighting, thereby validating the coupling of spatial suitability and criterion-based evaluation.
Overall, while abundant experience has been accumulated in GIS-assisted facility siting, research specifically targeting wood-processing plant locations remains limited. Key factors such as ecological constraints, raw material availability, and cross-border supply dependencies are often underrepresented. For regions like Heilongjiang—where ecological security and timber trade converge—there is an urgent need to develop tailored site selection models that align with national carbon goals and regional collaboration policies, enabling the sustainable transformation of the timber processing industry. Based on the above research foundation and technical framework, this paper constructs a two-stage wood-processing plant siting model integrating GIS spatial analysis and an improved non-dominated sorting genetic algorithm (NSGA-II) for the region of Heilongjiang Province, China. In the first stage, on the GIS platform, multi-source spatial data such as land use type, transportation road network, digital elevation model (DEM), ecological protection red line, and socio-economic conditions are integrated to establish a comprehensive spatial database. By constructing the site selection index system and improving the AHP method to assign corresponding weights, the comprehensive score of each region is calculated using weighted superposition analysis, and a number of candidate sites with strong spatial suitability and high construction feasibility are extracted based on the natural fracture classification method. In the second stage, a multi-objective optimization model is constructed, and the optimization objectives of minimizing environmental impact, maximizing service satisfaction, and minimizing construction cost are selected, and the improved NSGA-II algorithm is used for iterative solving to output the Pareto-optimal solution set, so as to achieve a balanced optimization of the siting plan in the three aspects of economy, environment, and service.
The model not only provides a systematic, scientific, and practical decision-making framework for the location of wood-processing plants, but can also be dynamically adjusted according to the development plan of the timber industry in Heilongjiang Province, supporting the phased implementation and policy matching. The final output site selection scheme is both spatially rational and multi-objectively coordinated, with good promotion value and is especially suitable for the optimization of site selection in ecologically sensitive areas and resource-oriented industries.

2. Research Area Profile and Data Sources

2.1. Study Area

Heilongjiang Province, located in the northeastern most part of China and covering an area of approximately 473,000 square kilometers [20], shares about 3000 kilometers of border with Russia. Its geographical location (a) and vegetation distribution (b) is illustrated in Figure 1. This strategic geographical location has positioned the province as a pivotal hub in the China–Russia timber trade. Heilongjiang offers distinct advantages for fostering transboundary industrial collaboration and regional integration. Heilongjiang features a diverse landscape composed of mountain ranges, expansive plains, and river valleys. The Greater Khingan Mountains in the northwest and the Lesser Khingan Mountains in the northeast form the province’s principal forest zones, dominated by dense coniferous and mixed forests. These areas rank among the richest in natural timber reserves in China, reinforcing Heilongjiang’s strategic role as a major center for both primary wood-processing and high-value-added timber manufacturing industries.

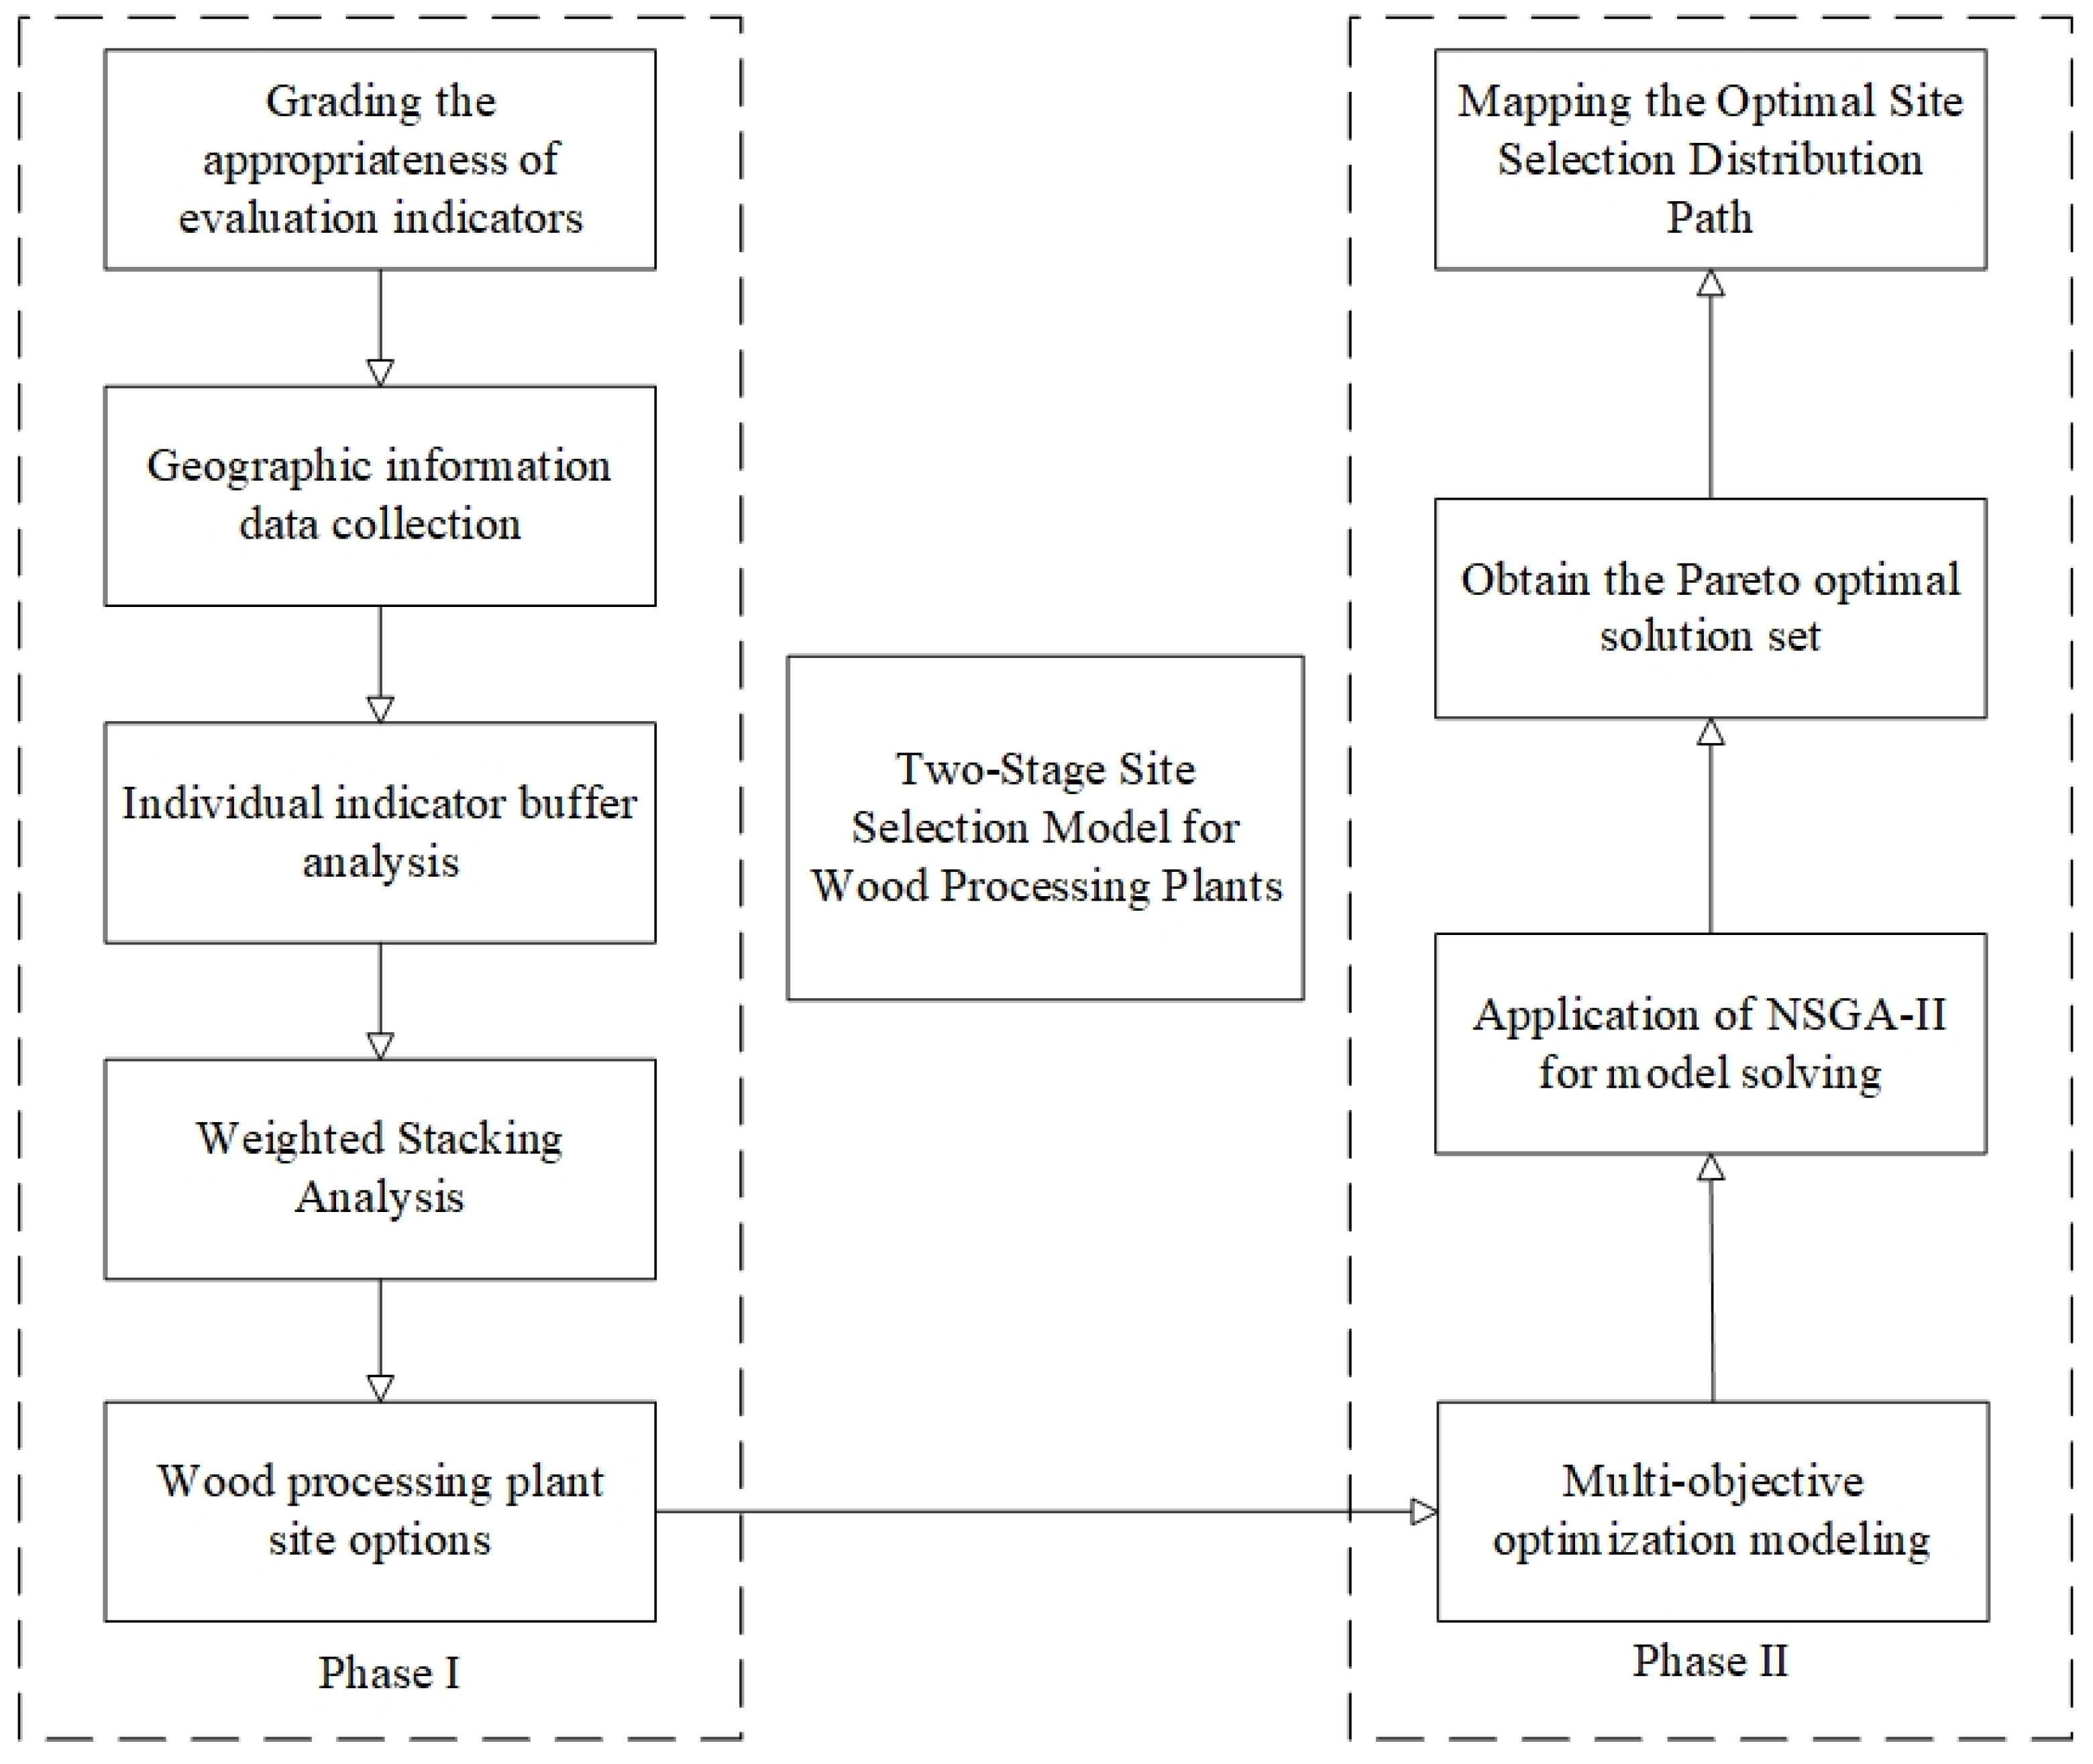
2.2. Research Framework

In this paper, a two-stage site selection optimization model integrating GIS spatial analysis and improved NSGA-II algorithm is constructed. In the first stage, the spatial evaluation index system is constructed based on GIS and weighted and superimposed to extract candidate sites with high suitability; in the second stage, the NSGA-II algorithm is improved to obtain the Pareto-optimal solution set with the multi-objective functions of environmental cost, service satisfaction and plant construction cost to output the optimal siting plan. The structure of the model and the realization process are systematically described in the following as Figure 2.

3. Materials and Methods

3.1. Construction of Evaluation Indicator System

To establish a comprehensive and context-sensitive evaluation framework for the siting of wood-processing facilities, this study adapts the four-dimensional structure—comprising restrictive factors, resource-based factors, economic factors, and investment/return factors—originally proposed by Yushchenko et al. [21] and Nuhu et al. [22] in the context of eco-industrial parks (EIPs) and renewable energy infrastructure planning. This framework emphasizes the integration of hard spatial constraints (e.g., slope, land cover) and functional suitability indicators (e.g., resource endowment, accessibility), implemented through Geographic Information Systems (GIS) and Multi-Criteria Decision Making (MCDM) methods.
Given the structural similarity between photovoltaic power plant siting and wood-processing facility layout—both highly dependent on natural resource allocation, site accessibility, and capital efficiency—the framework is transferable. Drawing on the methodologies of Zhang et al. [23] and Lei et al. [24], we restructured the indicators as follows:
  • Restrictive factors: including land use classification, slope thresholds, and ecological redlines to delineate exclusion zones.
  • Resource-based factors: such as forest stock density, elevation, and slope aspect, which directly influence raw material availability and construction feasibility.
  • Economic factors: including land costs, road network connectivity, and proximity to demand centers—similar to transport and population-based criteria in electric vehicle (EV) charging station studies [25].
  • Investment and serviceability factors: encompassing feedstock accessibility, capital expenditure, and payback period, modeled in reference to return-on-investment frameworks from floating photovoltaic plant research [26].
In summary, this study establishes a multi-dimensional site evaluation framework characterized by spatial transparency, data integrity, and economic applicability. This framework draws upon best practices in renewable energy siting and eco-industrial park (EIP) development. Given Heilongjiang Province’s strategic importance as both China’s most forest-rich region and a critical hub for Russian timber imports, the proposed indicator system systematically integrates ecological constraints, infrastructure, and logistical costs, as well as socio-economic carrying capacities. To ensure comprehensive representation, the framework first identifies and categorizes the key determinants influencing wood-processing facility siting. These determinants are then spatialized and quantified through GIS-based analysis, enabling objective evaluation across geographic and administrative boundaries. The systematic sorting of these factors, along with a thorough assessment of the province’s geospatial characteristics and policy landscape, is summarized in Table 1. On this basis, we construct a site selection evaluation index system that encapsulates three core dimensions—natural conditions, economic viability, and social adaptability. The purpose is to enhance the scientific rigor, practical applicability, and operational feasibility of siting decisions. Ultimately, this framework provides robust quantitative and methodological support for promoting a spatially optimized, resource-efficient, and low-carbon development model for the timber processing industry in Heilongjiang Province.
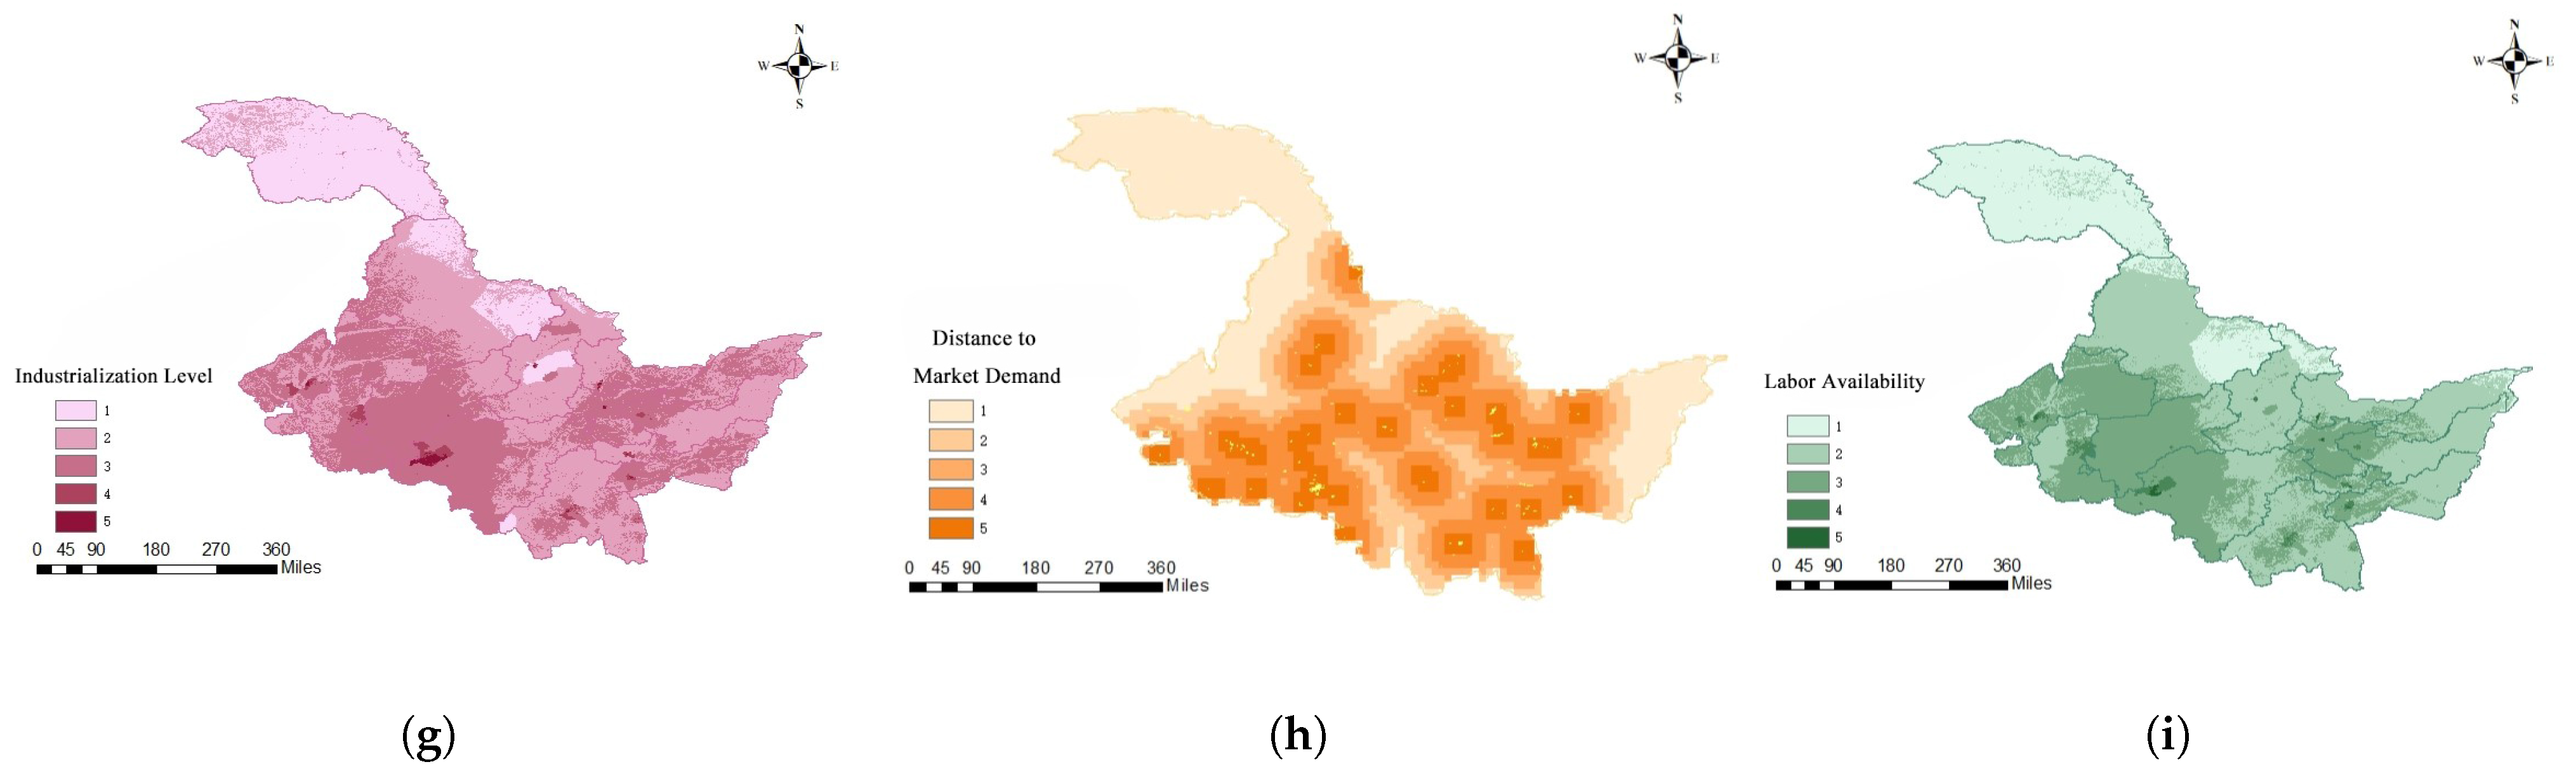
  • Natural factors: Natural factors constitute the basic constraints for site selection, involving terrain conditions and ecological sensitivity. Slope and Elevation affect the difficulty of construction and the risk of natural disasters; Distance to Nature Reserve can effectively avoid the ecological red line area; Land Use Type reflects the ecological attributes of the site and the development restrictions, and needs to avoid basic farmland, forest land and other non-constructible areas, and prioritize the planned construction land; Distance to water system ensures that the water source can be reached and at the same time control the risk of potential pollution. Accordingly, five indicators, Slope, Elevation, Land Use Type, Distance to Nature Reserve and Distance to Water System, are set to quantify the ecological suitability of the region.
  • Economic factors: Economic factors are the key drivers for site selection and are related to cost control and resource allocation efficiency. Distance to Transportation Network measures the accessibility of logistics; Environmental cost is used to assess the environmental protection expenditure; Raw Material Cost reflects the convenience of obtaining wood and the price advantage; Industrialization level reflects the supporting capacity of the region; the four indicators together portray the economic feasibility of building a factory.
  • Social factors: Social factors are mainly used to assess the social acceptance of the project and the policy fit. Distance to market demand affects the service response speed; Labor Availability reflect the manpower supply situation; Policy and Regulation are used to measure the site compliance and financing attractiveness. These three indicators form the basis for quantitative analysis of the social environment support.

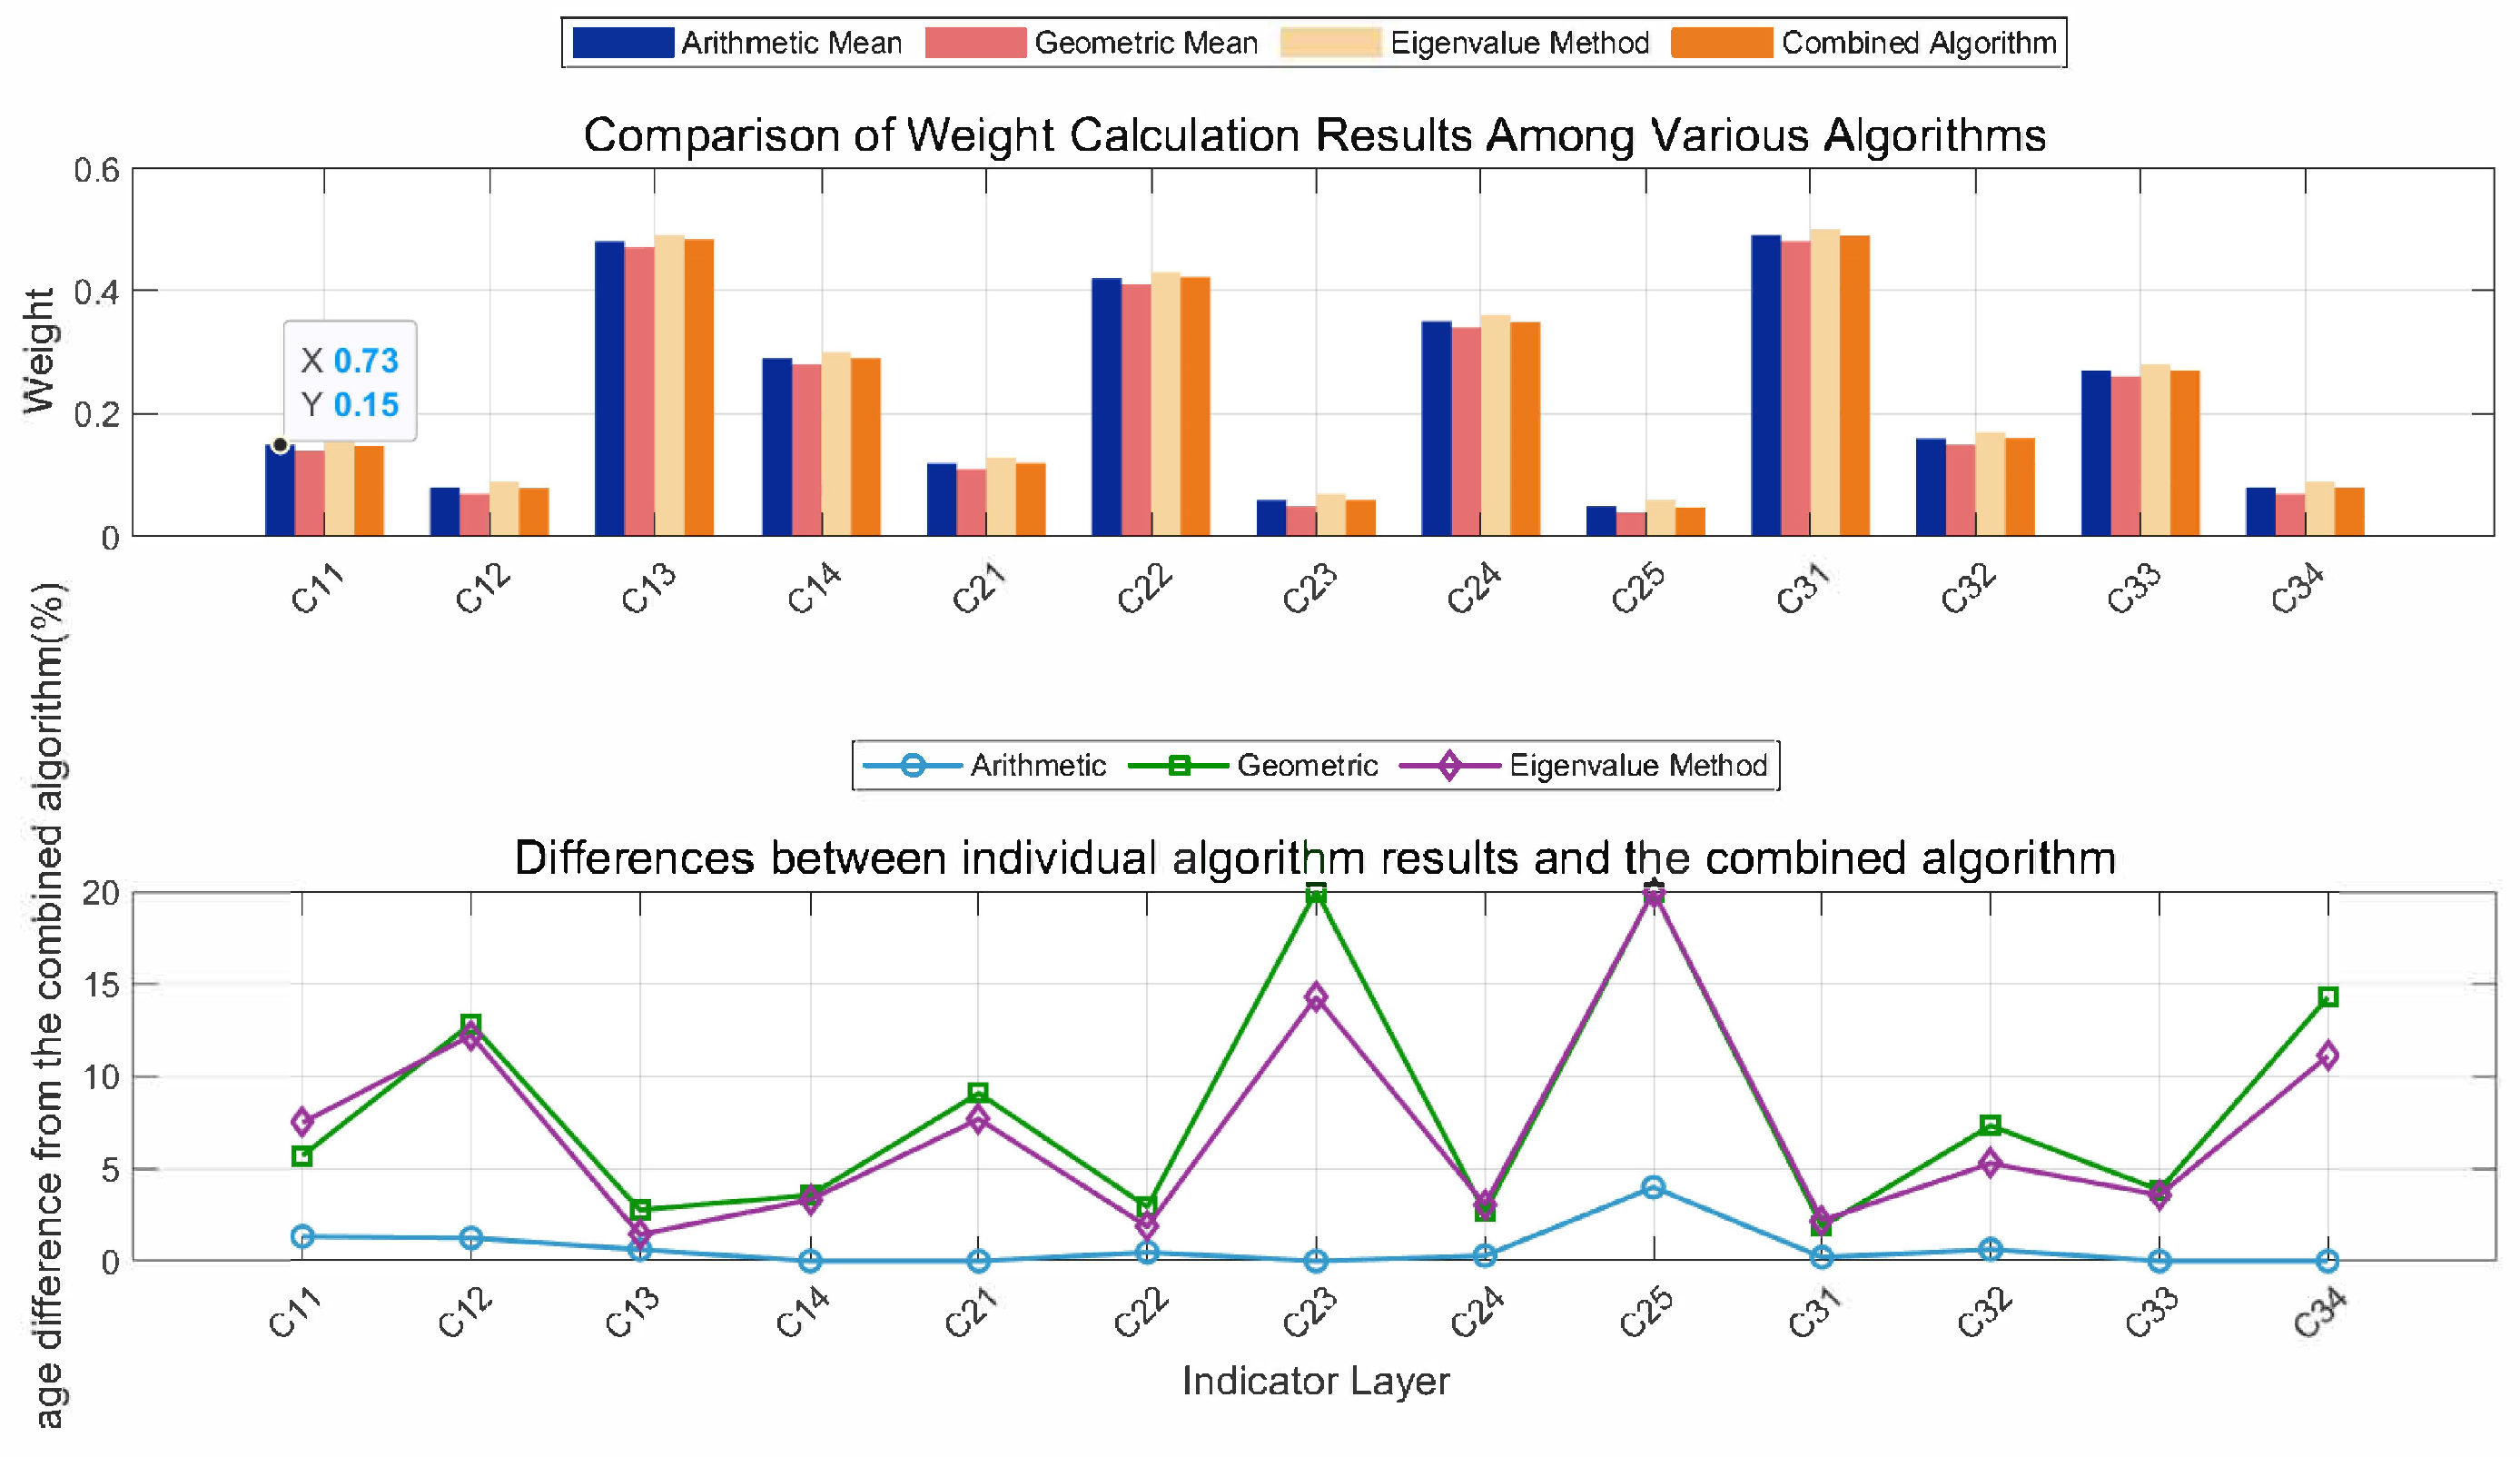
3.2. Improved AHP Weighting Method

After constructing the evaluation index scoring system, the improved hierarchical analysis method (AHP) is used to determine the weights of each index in the wood-processing plant siting index system. Aiming at the traditional method that only utilizes the eigenvector method which is easy to lead to the problems of unstable weights and inaccurate assignment, this paper combines the eigenvector method, the arithmetic average method and the geometric average method, and proposes the improvement strategy of combining the assignments. The specific calculation steps are as follows:
Step 1: Construct judgment matrix
A = a 11 a 12 a 1 n a 21 a 22 a 2 n a n 1 a n 2 a n n
where a i j represents the relative importance of factor i compared to factor j, with values determined using Saaty’s 1–9 scale.
Step 2: Combine the eigenvector method, geometric mean method, and arithmetic mean method for each row vector in the judgment matrix A, and calculate the composite weight of each indicator
w i = j = 1 n a i j 1 / n i = 1 n j = 1 n a i j 1 / n + 1 n j = 1 n a i j k = 1 n a k j + j = 1 n a i j 1 / n / i = 1 n j = 1 n a i j 1 / n / 3
Step 3: Perform hierarchical ranking and consistency check. Compute the maximum eigenvalue of the judgment matrix
λ max = i = 1 n w i j = 1 n a i j , j = 1 , 2 , , n
Then calculate the consistency index C I and consistency ratio C R .
Step 4: Calculate the consistency index C I and the consistency ratio C R for the judgment matrix
C I = λ max n n 1
C R = C I R I
Here, R I is the average random consistency index, determined according to the judgment matrix order from a standard reference table. If C R 0.1 , the matrix passes the consistency test. Otherwise, the matrix must be adjusted until the condition is satisfied.
Step 5: Conduct overall hierarchical ranking and consistency check
If the consistency index of the single ranking between the factors at the current level and the previous level is C I i ( i = 1 , 2 , , k ), and the corresponding random index is R I i , with the weight of the i-th criterion in the upper level denoted as a i , then the overall consistency ratio of the hierarchy is given by:
C R = a 1 C I 1 + a 2 C I 2 + + a k C I k a 1 R I 1 + a 2 R I 2 + + a k R I k
If C R 0.1 , the consistency of the hierarchical ranking is considered acceptable.

3.3. Spatial Suitability Analysis via GIS (Stage I)

3.3.1. Suitability Classification of Indicators

According to the geographic characteristics of Heilongjiang Province and the evaluation criteria of each indicator factor, the vectorizable factors in the indicator layer were initially selected using GIS spatial analysis, namely: surface elevation, terrain slope, industrialization level, labor force level, distance from nature reserves, accessibility to the transportation road network, land use type, distance from the water system, and distance from the demand market. Each factor is divided into five site suitability grades, and each grade corresponds to its own score, i.e., the most suitable (5 points), the more suitable (4 points), the suitable (3 points), the generally suitable (2 points) and the unsuitable (1 point). The specific grading criteria are shown in Table 2.

3.3.2. Spatial Superposition Analysis

Combine the open source geospatial data platform to collect relevant geographic information data in the study area, unify the data format, and divide it into multiple regions on the ArcGIS platform based on the evaluation criteria of each index, and assign different levels of suitability scores respectively. The specific steps are as follows:
  • Construct Evaluation Layers
    Extract spatial data for each indicator, and standardize the format.
  • Reclassify and Score Indicators
    Reclassify each layer based on suitability levels (1–5) to achieve standardized quantitative scoring.
  • Determine Indicator Weights
    The weights of each indicator are determined through the improved hierarchical analysis method (AHP).
  • Perform Weighted Overlay Analysis
    A raster calculation method was used to weight and sum the indicator layers to calculate the total regional score. The specific calculation formula is as follows:
    S = i = 1 n w i · r i
    where S denotes the comprehensive suitability score, w i is the weight of the i-th indicator, and r i is the normalized score of the corresponding indicator.
  • Generate Suitability Map
    After obtaining the total regional score, the wood-processing plant site selection alternatives were screened by the natural break method.

3.4. Multi-Objective Optimization Model (Stage II)

Intelligent optimization algorithms have become critical tools for solving complex multi-objective site selection problems. Among them, genetic algorithms remain one of the most widely applied and effective methods. As a mature and well-established technique, GA exhibit strong global search capabilities, inherent parallelism, and superior convergence performance and robustness compared to other heuristic algorithms.
In facility location optimization, GA have demonstrated promising results. For instance, Ma Yiding et al. [27] developed a GA-based computational model for optimizing communication base station deployment. Their results revealed that, compared with methods such as simulated annealing, GA yielded faster convergence and superior global optimization performance. Similarly, Samira Bolouri et al. [28] applied both tabu search and genetic algorithms to optimize fire station locations. Their study concluded that the GA outperformed tabu search in terms of optimality, allocation precision, and computational efficiency, providing faster and more accurate solutions.
Building upon the classical GA framework, the Non-dominated Sorting Genetic Algorithm II has emerged as one of the most widely used and robust algorithms for solving multi-objective optimization problems. Originally introduced by Srinivas and Deb [29] as NSGA, the early version suffered from several limitations, including high computational complexity, the need for manually defined sharing parameters, and the absence of elitism. To address these issues, Deb et al. [30] proposed the improved NSGA-II algorithm, which incorporates a fast non-dominated sorting approach, crowding distance mechanisms, and elitist selection strategies to enhance performance in both convergence speed and solution diversity. NSGA-II has since been successfully applied across a wide range of engineering optimization problems. For example, Lina Wang et al. [31] used NSGA-II to determine the optimal trade-off between economic feasibility and energy efficiency in a complex energy system, significantly improving overall system performance. Fatima Ezzahra Sadni et al. [32] further integrated NSGA-II with the TOPSIS method to design a sustainable Organic Rankine Cycle (ORC) system. Their hybrid approach identified optimal operating conditions that balanced energy and exergy efficiency, demonstrating the algorithm’s adaptability and strength in handling conflicting objectives. Beyond energy systems, NSGA-II has also been applied in vehicle routing problems with ecological constraints, further validating its robustness and adaptability for multi-objective decision-making scenarios [33].

3.4.1. Model Construction

In the preliminary stage, the quantitative indexes were analyzed using GIS spatial analysis, and the alternative site selection options for the wood-processing plant were obtained. On this basis, the established multi-objective optimization model selects a number of alternative sites from the alternative sites to make them satisfy the three objectives of cost, satisfaction, and environmental impact, and establishes the following optimization model based on the above:
(1) Objective function:
The sub-objective function F 1 is constructed to satisfy the objective of minimizing the intensity of environmental impacts:
min F 1 = i j U q i j v j X j P i j
The sub-objective function F 2 is to meet the goal of maximum service satisfaction:
max F 2 = i j f ( t i j ) q i X j
Equation (9) is used to measure the service satisfaction level at the regional demand point. To simplify the calculation, the linear time satisfaction function from the literature is introduced:
f ( t i j ) = 1 , t i j < L i U i t i j U i L i , t i j [ L i , U i ] 0 , t i j > U i
L i is the maximum acceptable waiting time if the demand point is very satisfactory; U i is the minimum waiting time if the demand point is very unsatisfactory.
The sub-objective function F 3 is to satisfy the cost minimization objective:
min F 3 = j ( c j + l j q j ) X j + i j X j p i j q i + ( t i j T j ) θ i q i S i q i
Equation (11) represents the lowest cost incurred by the entire wood-processing plant, with the first term representing the cost of building and operating the facility, and the second term representing the cost of transporting the wood-processed goods, the cost of penalties incurred for unmet point-of-need services, and the amount of government subsidy.
In the above formulas:
  • I denotes the set of known demand nodes; i I .
  • J denotes the set of candidate sites for wood-processing plants; j J .
  • Q j is the maximum storage capacity of plant j.
  • q j is the general reserve volume at processing plant j.
  • c j is the construction cost of plant j.
  • l j is the land cost at location j.
  • p i j is the unit price for transporting timber from reserve node j to demand node i.
  • t i j is the time required to deliver timber from reserve node j to demand node i.
  • S j represents government subsidy to reserve node j.
  • D i j denotes the transportation distance from node j to demand point i.
  • θ i is the penalty coefficient for not completing delivery within required time at demand node i.
  • T i is the maximum acceptable response time at demand node i.
  • c i j is the unit penalty cost per unit time of delay at demand node i.
  • X j is a binary decision variable: X j = 1 if a wood-processing plant is constructed at candidate site j; otherwise X j = 0 .
  • y i j is a binary decision variable: y i j = 1 if timber is delivered from reserve node j to demand node i; otherwise y i j = 0 .
(2) Constraints. The capacity of each wood-processing factory is limited:
0 q j Q j X j
The number of wood-processing factories established should satisfy
j J X j N
Only the selected locations where wood-processing factories have been established can deliver wood products to demand points, i.e.,
i I , γ i j X j 0
At least one wood-processing factory must deliver wood products to each demand point, i.e.,
j J γ i j 1
The quantity of wood products delivered does not exceed the existing capacity of the selected location, i.e.,
i I q i j q j
γ i j { 0 , 1 } , X j { 0 , 1 }

3.4.2. NSGA-II Algorithm
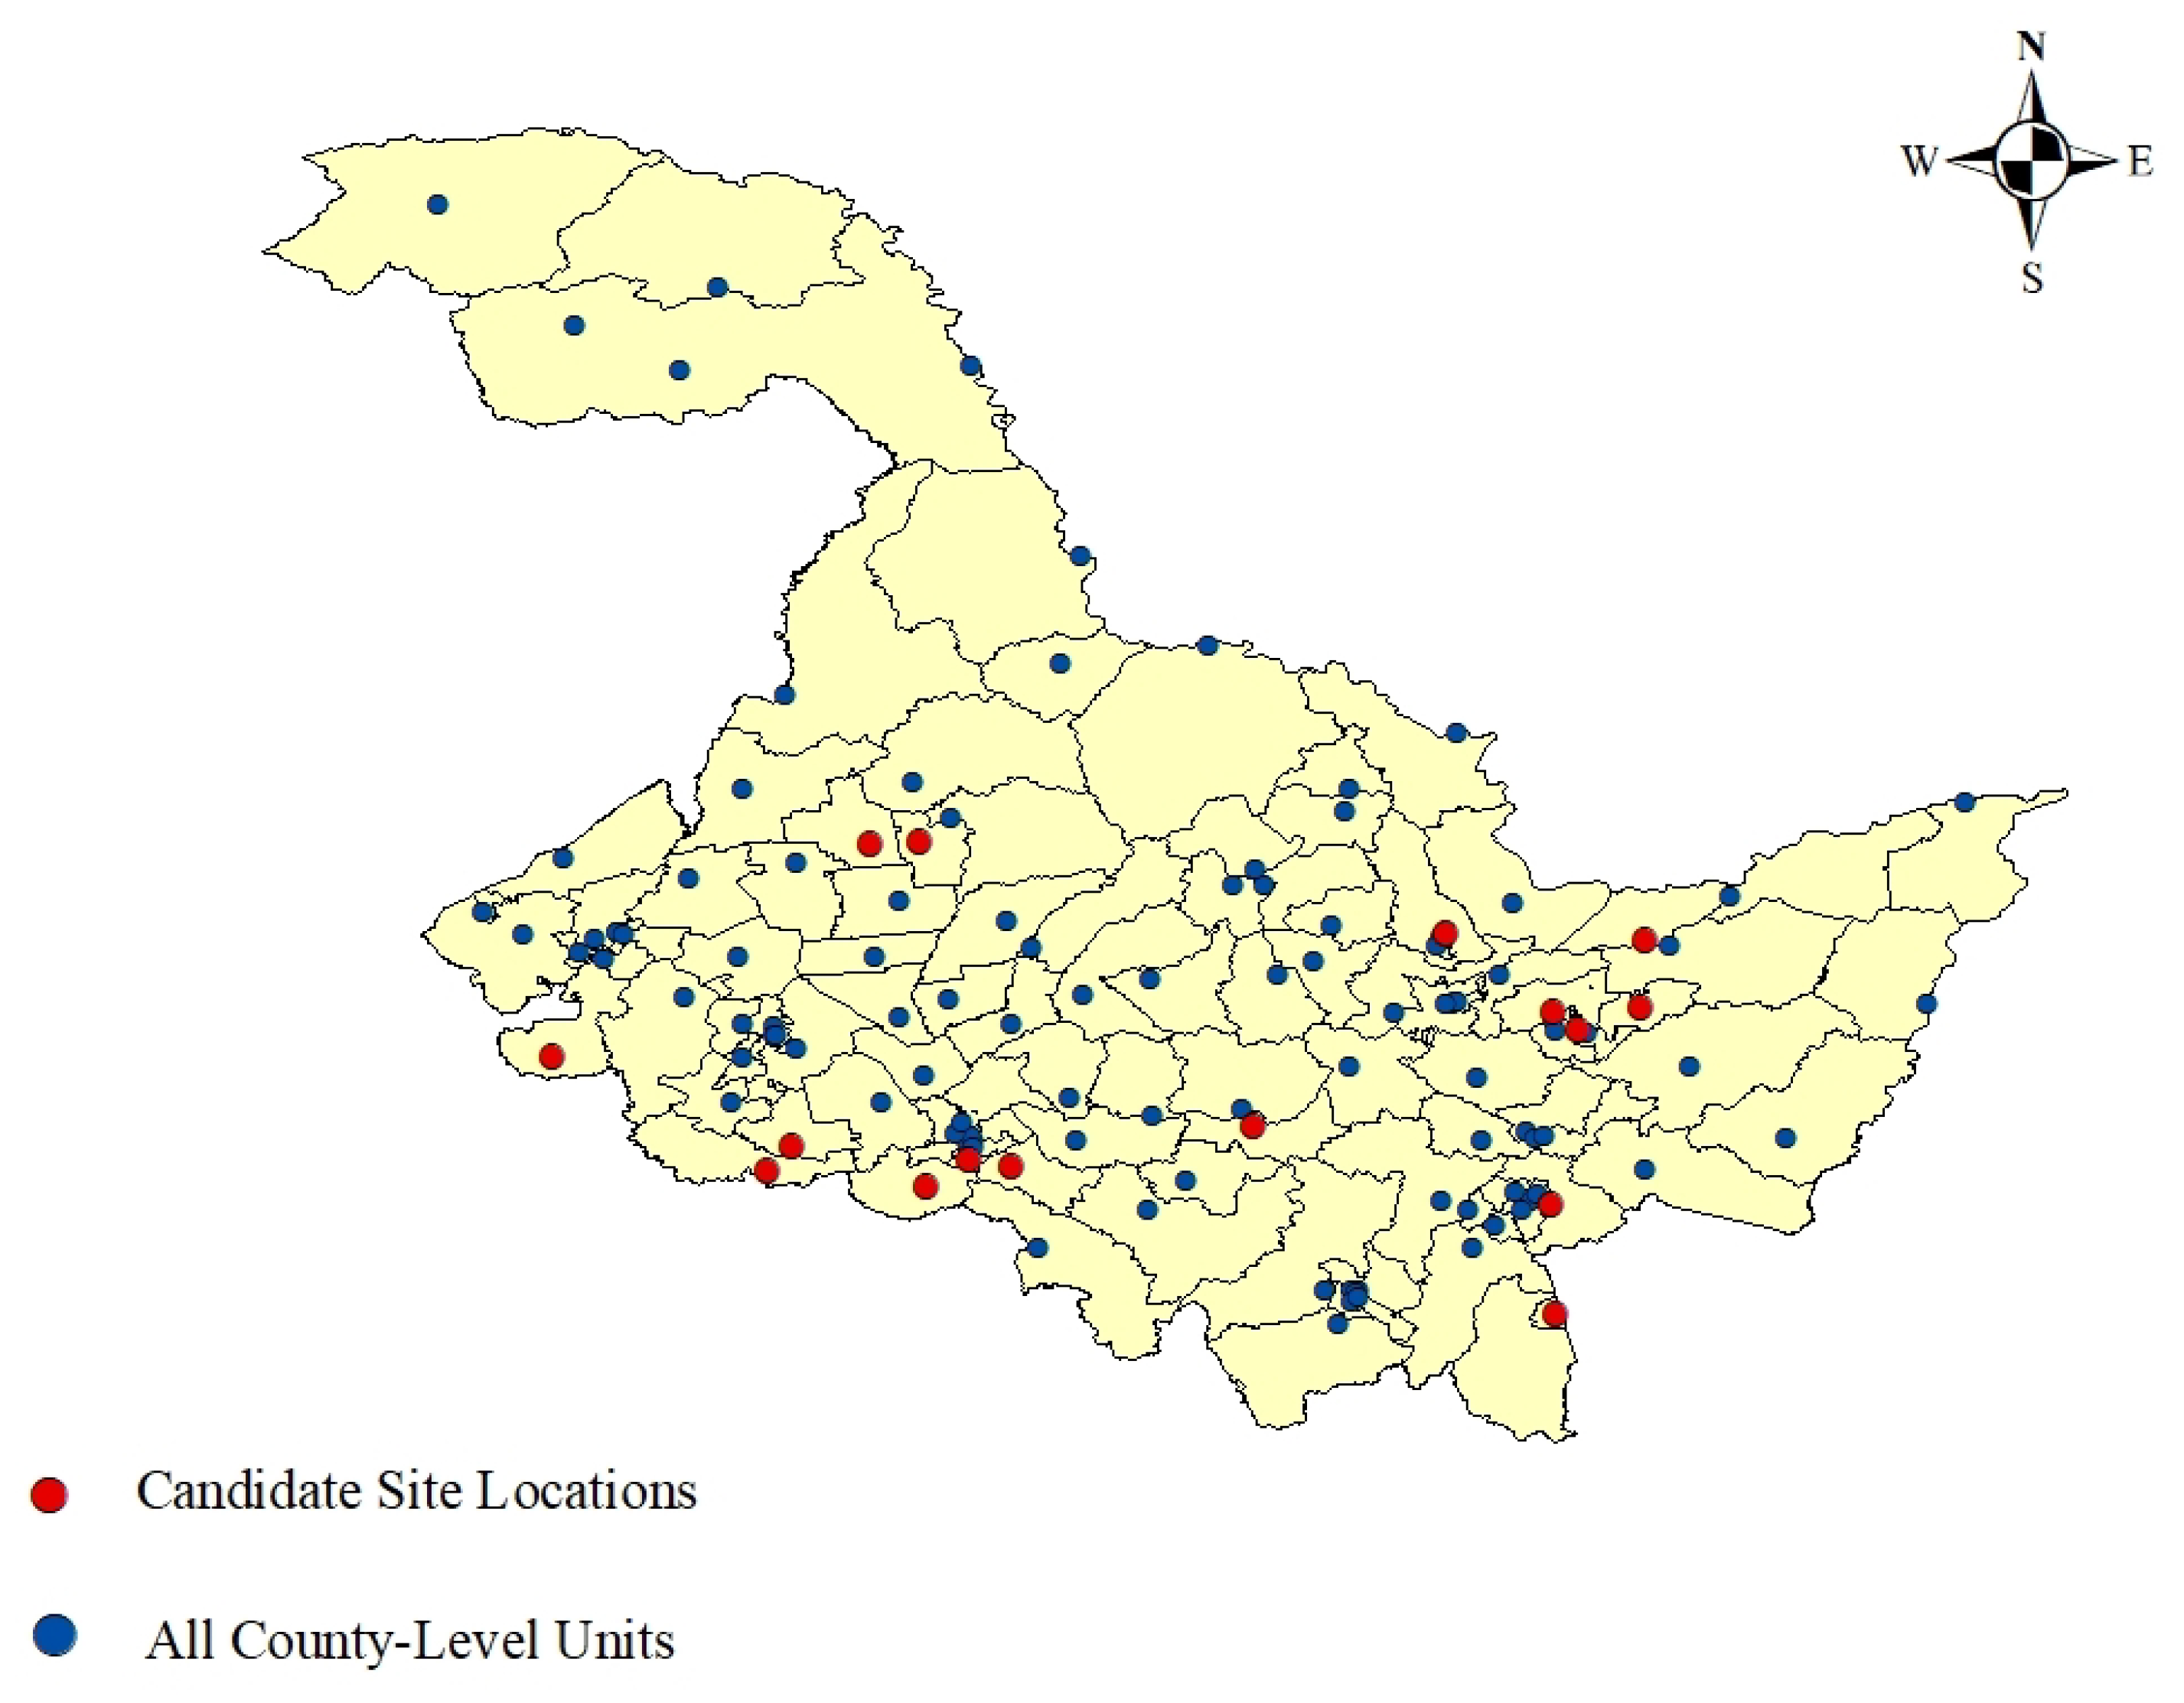
The established selection model can be formulated as a multi-objective optimization problem (MOP) [34], which includes three objective functions: environmental impact, cost, and satisfaction. There is a certain trade-off relationship among these three objective functions, and it is impossible to obtain the optimal solution for all three simultaneously. Therefore, the Non-dominated Sorting Genetic Algorithm II (NSGA-II) is used to solve the model. The basic steps of the algorithm are as follows:
  • Initialization of the population
    Considering the domestic and international market demand for wood products, 31 candidate locations are selected in Heilongjiang Province, including cities and counties. A total of 16 candidate locations are selected for wood product distribution. The population size N = 200 , crossover probability p c = 0.8 , mutation probability p m = 0.2 , and the maximum number of iterations T max = 1000 . A population of N individuals is randomly generated, where each individual represents a solution in the decision space.
  • Non-dominated sorting
    For each individual in the current population P, compare its performance on all objective functions (such as carbon emissions, cost, and service coverage). If individual A is not dominated by individual B in all objectives, and at least one objective is strictly better, then A is said to dominate B (denoted as A B ).
    All individuals are sorted into layers, with individuals in the first layer being non-dominated, and individuals in the second layer being dominated by those in the first layer, and so on.
  • Crowding distance calculation
    To diversify the distribution of individuals within the same non-dominated layer, the crowding distance of each individual is calculated based on the objective function values.
  • Selection, crossover, and mutation
    Similar to traditional genetic algorithms, selection includes three parts: tournament selection, crossover, and mutation. First, k individuals are randomly selected from P (usually k = 2 ), and based on the non-dominated layer (preferentially selecting the front layer) and crowding distance (preferentially selecting the individual with the larger crowding distance), the better individual is selected as the parent. The selected parents are then used to generate offspring through crossover and mutation. The offspring are added to the population, increasing the diversity of the population.
  • Elitism strategy
    Combine the current population P with the offspring Q to form a new population R (total of 2 N individuals). Perform non-dominated sorting on R, and select the first layer of individuals until the total number of individuals exceeds N. If the last layer has more individuals than needed, select individuals based on crowding distance from high to low until the required number is reached, forming a new generation of the population.

4. Results

4.1. Indicator Weight Results and Analysis

According to Table 1 and the aforementioned weighting calculation procedure, a pairwise comparison judgment matrix was constructed using the Saaty 1–9 scale method under the Analytic Hierarchy Process (AHP). The relative importance between the criteria layer and each indicator layer was evaluated pairwise. The consistency of the judgment matrix was then tested. The maximum eigenvalue of the matrix is λ max = 3.104 , and the consistency index is C I = 0.052 . As this study involves a 3 × 3 matrix, the corresponding random consistency index is R I = 0.052 . Substituting into the formula, the consistency ratio is calculated as C R = 0.089 < 0.1 , indicating that the matrix passes the consistency check. Subsequently, the YAHP software was used to calculate the weights of each indicator relative to the criteria and goal layers, as shown in Table 3.
The improved AHP method effectively reduces the subjective bias inherent in a single method by integrating different mathematical characteristics. Figure 3 illustrates a comparison of the indicator-level weight calculation results between the improved method and the traditional AHP method. As can be seen from the figure, when determining the weights of various indicators using the traditional AHP, significant differences arise from different computational approaches, particularly noticeable in the indicators of height, land value, and policies and regulations. Among these, the land value indicator shows the greatest disparity in weight, with the weight obtained using the geometric mean method differing from the traditional method by as much as 19.3%. This phenomenon indicates that the traditional AHP method exhibits a certain degree of instability and significant computational error in the weight calculation process, affecting the reliability of the evaluation results. In contrast, the combined method effectively suppresses the subjective intervention of expert preferences in assigning indicator weights.

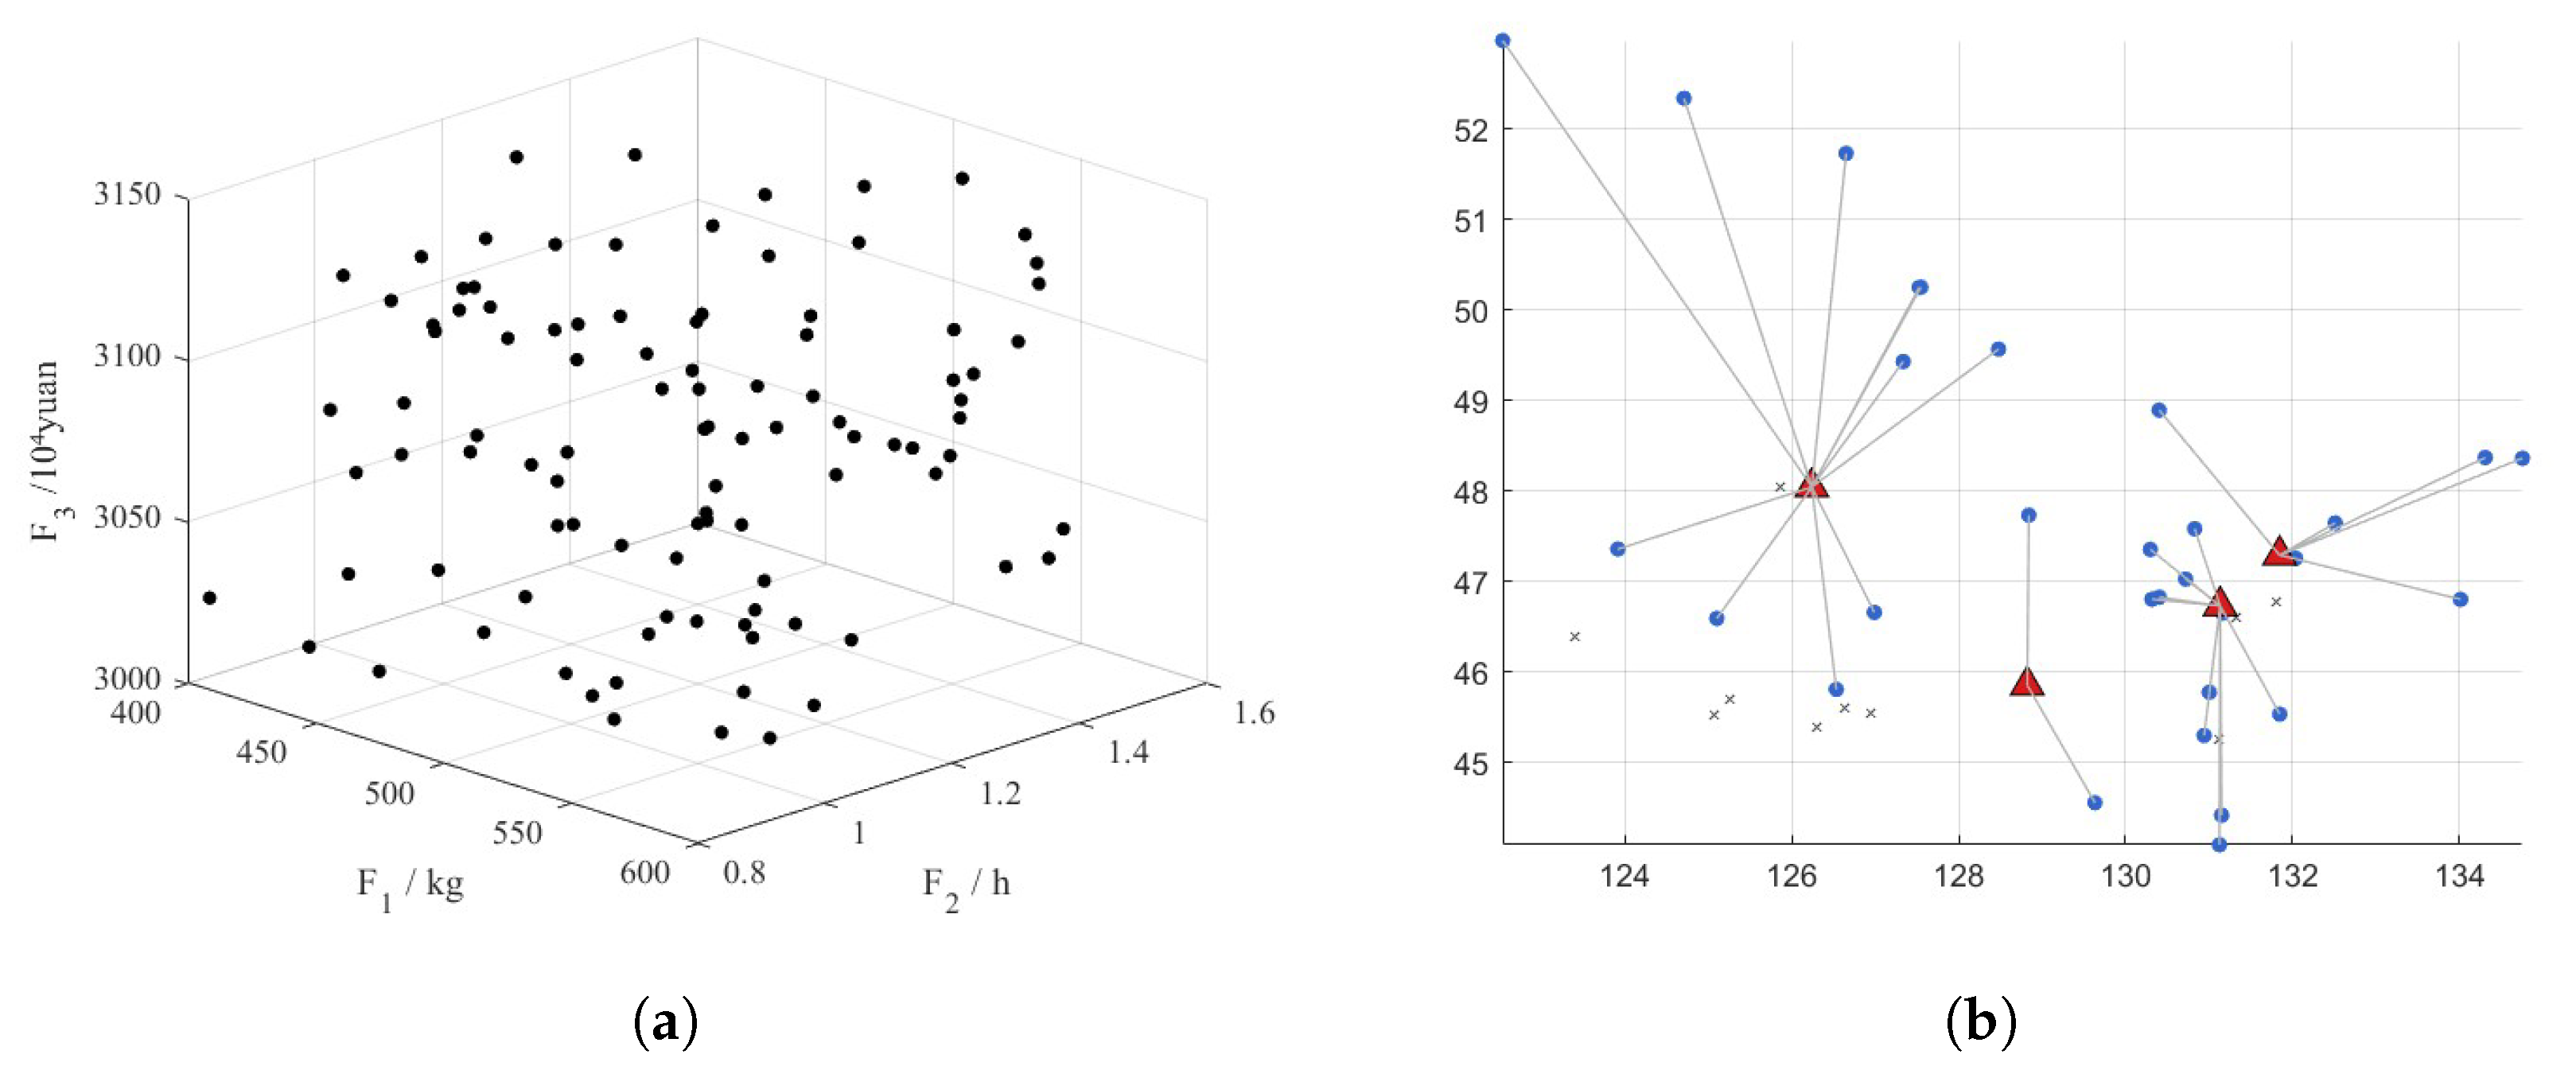
4.2. GIS Spatial Suitability Mapping and Preliminary Sites

Combining the open-source geospatial data platform to collect relevant geographic information data in the study area, unify the data format, and divide the area into multiple regions according to the distance range based on the evaluation criteria of each index on the ArcGIS platform, and assign different grades of suitability scores respectively. The spatial analysis of the site selection suitability zones was carried out according to nine quantitative indexes: Slope, Elevation, Distance to Nature Reserve, Distance to Water System, Land Use Type, Distance to Transportation Network, Industrialization Level, Distance to Market Demand and Labor Availability. The specific process is shown in Figure 4.
Among the 125 counties in Heilongjiang Province, there are 16 suitable site selection areas is shown in Figure 5. With relatively gentle terrain and low project development and construction costs, strong economic and social foundation and relatively abundant labor force, close to nature reserves with strict control, able to meet the needs of ecological protection, high density of the transportation network, convenient road traffic, sufficient water resources, and adjacent to the timber terminal market, able to meet the immediate needs of users, with low-cost advantages, environmental protection and supply chain resilience. It has the advantages of low cost, strong environmental protection and supply chain adaptability, and high suitability for site selection and planning.

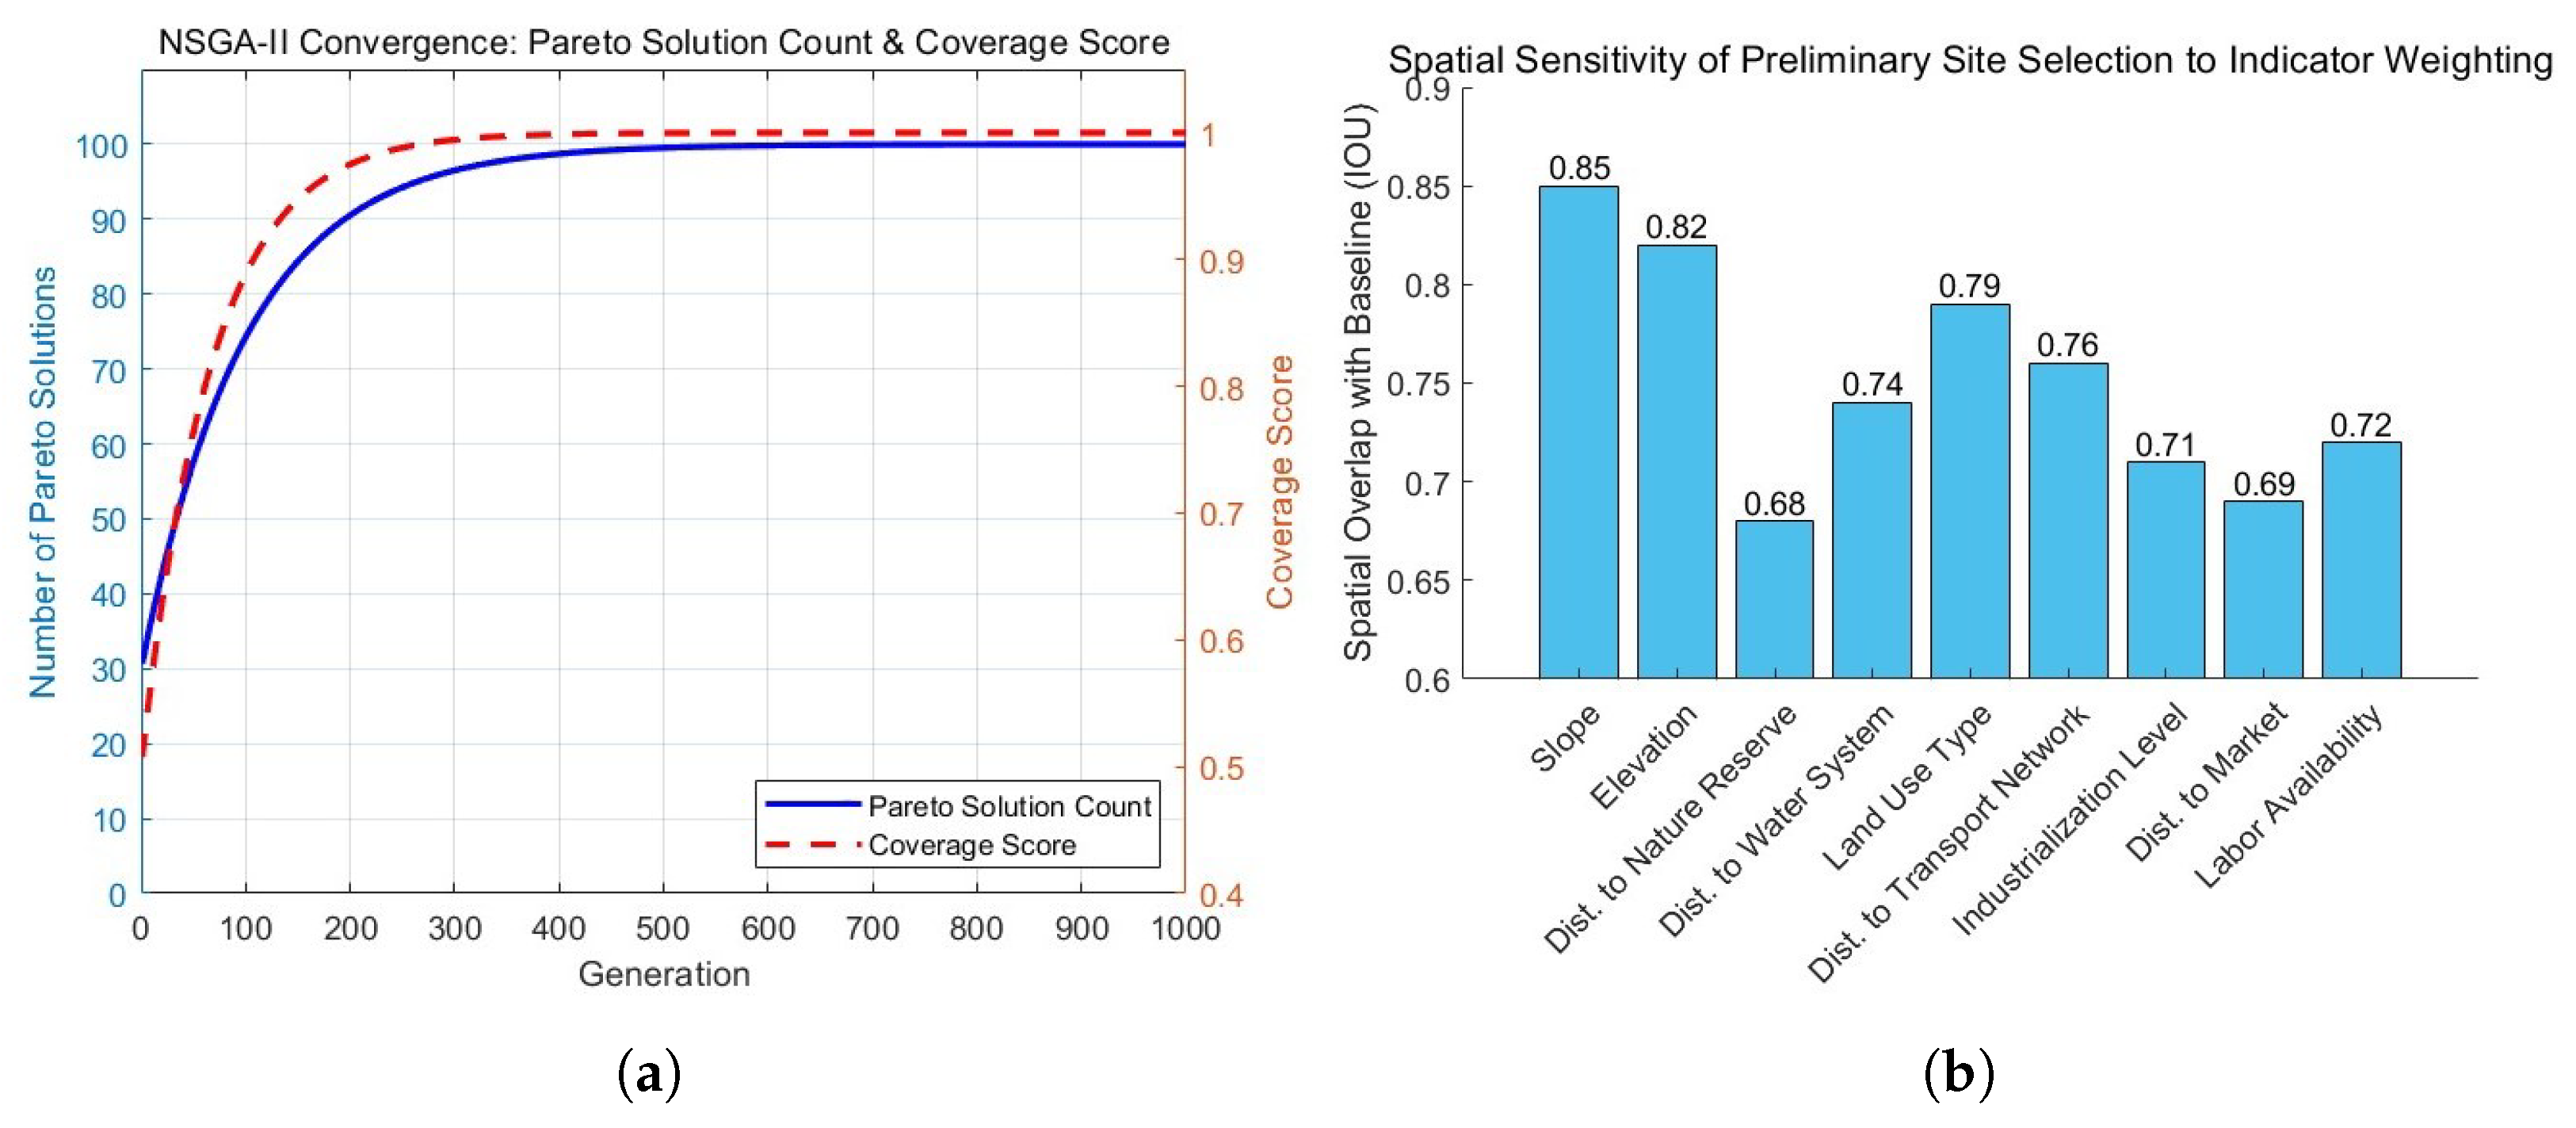
4.3. Optimization Results: Pareto Front and Recommended Sites

The experimental process is programmed through MATLAB R2024b, and a total of 124 non-dominated individuals are found, and the distribution of the Pareto optimal solution set is shown in Figure 6a. The site selection result obtained by the model is (1, 5, 10, 15), a wood-processing plant is built in each of Jixian County, Suibin County, Keshan County, and Fangzheng County, and the optimal site selection distribution path diagram is shown in Figure 6b, and Table 4. shows the specific demand cities covered by each wood-processing plant in the program.
Jixian County, one of the main centers in the program, covers 11 demand regions including Shuangyashan City, Jixi City, and Hegang City, demonstrating its importance in terms of geographic location and resource radiation capacity. Keshan County, which also covers 11 cities, including remote northern regions such as Heihe, Huma, and Sunke, is a hub node for the development of the timber industry in the north of the program. Suibin and Fangzheng counties, on the other hand, serve the western and southeastern parts of the country, playing an important complementary role to the border, albeit with less coverage.

5. Discussion

In order to verify the applicability and effectiveness of the proposed two-stage wood-processing plant site selection model, this study applied it to Heilongjiang Province—a key node in China’s timber supply chain—and conducted simulation experiments involving 16 alternative plant sites and 31 demand nodes. In the GIS-based spatial suitability phase, high-suitability zones were delineated using standardized index layers and weighted overlays. These initial selections were then optimized through an improved NSGA-II algorithm to yield a diverse set of Pareto-optimal configurations.
The model led to a 23.7% reduction in transport-related carbon intensity, surpassing Zhang et al.’s 15.2% domestic benchmark [10] and validating Khanal et al.’s conclusion on the importance of optimized routing for carbon mitigation in forestry logistics [11]. This improvement is largely attributed to the incorporation of full-cycle logistics optimization—from cross-border timber importation to local processing and distribution—combined with strict ecological redline exclusion. These components are often omitted in conventional siting frameworks. Socioeconomic integration is another strength of the model. It quantitatively weights indicators such as labor availability (0.028) and industrialization level (0.030), reflecting principles proposed by Nuhu et al. for eco-industrial park planning [22]. Unlike traditional cost-minimization models based on the Baumol–Wolfe theorem [9], this framework introduces policy-aware components through spatially differentiated subsidies ( S j in Equation (11)), addressing the revitalization agenda specific to Heilongjiang’s timber economy—a factor overlooked in over 80% of timber siting studies, as noted by Karipoglu et al. [17]. Ecologically, the exclusion of 68% of borderland zones designated as ecological redlines ensures full compliance with China’s Environmental Protection Law. This rigor contrasts with U.S.-focused competitiveness models lacking spatial prohibitions [2], and aligns more closely with EU Natura 2000 frameworks used in renewable energy siting [7]. However, by leveraging NSGA-II’s dynamic multi-objective optimization, our approach goes beyond static exclusion logic, enabling real-time trade-offs between environmental protection and economic performance.
From a methodological perspective, the improved NSGA-II algorithm demonstrates accelerated convergence, reaching stability at 700 iterations—substantially outperforming standard algorithms requiring over 950 iterations [30]. As illustrated in Figure 7a, both the number of non-dominated solutions and hypervolume coverage plateau early, indicating robust convergence toward the Pareto front. The model outputs 124 high-quality non-dominated solutions (Figure 6), over twice that of most GA-based methods [6], and surpasses AHP–GIS models, which typically generate fewer than 10 viable options [12].
To further assess model robustness, a spatial weight–sensitivity analysis was conducted. IOU-based comparison of suitability maps under variable weighting schemes shows that natural terrain factors (slope, elevation) are high-stability drivers (IOU > 0.8), indicating minimal impact on results when weights fluctuate. In contrast, indicators such as market demand (IOU = 0.69) and ecological protection zones (IOU = 0.68) exhibit high sensitivity, warranting special attention in multi-scenario planning and policy simulation. The IOU distribution across the nine primary indicators is shown in Figure 7b. Moreover, an in-depth analysis of the Pareto solution distribution in 3D objective space reveals three strategic solution clusters—minimizing, respectively, carbon emissions ( F 1 ), delivery response time ( F 2 ), and investment cost ( F 3 ). This classification, summarized in Table 5, provides practical guidance for strategy-specific site selection (e.g., green transformation under “carbon neutrality” goals, or budget-constrained industrial expansion).
Despite these strengths, the model remains static in its current form. It does not yet account for seasonal accessibility shifts, evolving trade policies (e.g., Russia’s post-2025 export ban [1]), or climate-driven forest accessibility changes. Future work will integrate Gated Recurrent Unit (GRU) networks [16] to forecast dynamic conditions and embed temporal variability. In addition, agent-based models could help simulate investor behavior and local government response, enhancing adaptability under real-world uncertainties.

6. Conclusions

This study developed a two-stage optimization framework for the strategic siting of wood-processing facilities in Heilongjiang Province, China, integrating GIS-based spatial suitability analysis with an improved NSGA-II multi-objective evolutionary algorithm. The framework explicitly accounts for ecological constraints, transportation logistics, socio-economic capacities, and cross-border timber dynamics, making it one of the few comprehensive models tailored to the forest industry’s sustainable transformation.
Key outcomes of the model include a 23.7% reduction in transport-related carbon intensity, the identification of 16 high-suitability candidate sites, and the generation of 124 diverse Pareto-optimal solutions. These results validate the model’s capacity to manage complex trade-offs between environmental integrity, economic efficiency, and service coverage. The observed convergence improvement (700 iterations vs. 950+) highlights its computational robustness in solving high-dimensional spatial decision problems. To assess sensitivity, spatial IOU-based analyses revealed that natural terrain factors (slope IOU = 0.85, elevation IOU = 0.82) are structurally stable, while market demand (0.69) and ecological redline zones (0.68) demonstrate high responsiveness to weight changes—providing valuable insights for policy scenario testing and dynamic strategy adjustment.
Beyond its regional application, this model offers methodological generalizability. It provides a replicable structure for siting logistics-intensive, policy-sensitive facilities in resource economies worldwide. As such, it holds relevance not only for provincial development planning in China but also for global forest product trade systems, which increasingly demand spatially optimized, low-carbon, and legally compliant infrastructure. In the broader context of China’s “dual-carbon” goals and the international emphasis on decarbonized value chains, this research delivers a decision-support tool that bridges spatial analytics, policy modeling, and industrial optimization. It contributes to the theoretical advancement of multi-objective spatial planning, and aligns with global efforts to integrate environmental governance into infrastructure development. Offering a replicable methodology for integrating ecological zoning and economic efficiency in forestry-based regions like Russia, Canada, Brazil, and Southeast Asia. Providing technical guidance for policy-making in climate-smart forest trade, land use planning, and cross-border resource coordination.
Limitations remain in terms of dynamic adaptability—future extensions should incorporate temporal forecasting (e.g., climate-induced supply shifts, trade policy fluctuations) and behavioral simulation (e.g., agent-based investment models). Expanding its application to other provinces and economies along China’s Belt and Road Initiative could further test its scalability and impact.
In conclusion, this study not only proposes a robust, high-resolution framework for sustainable wood industry siting in China’s northeast frontier, but also positions itself as a template for globally relevant, ecologically rational industrial geography. It offers both the methodological rigor and strategic foresight required to support a just transition toward a greener, more spatially intelligent forest product economy.

Author Contributions

C.M.: contributed to visualization, investigation, writing—original draft, and writing—review and editing. X.W.: is the corresponding author and was responsible for conceptualization, data curation, software, writing—original draft, and writing—review and editing. Y.W.: focused on methodology, software, writing—original draft, and writing—review and editing. Y.L.: was involved in software, writing—original draft, and writing—review and editing. W.K.: managed data curation, software, and writing—review and editing. All authors have read and agreed to the published version of the manuscript.

Funding

This research was funded by Heilongjiang Provincial Natural Science Fund (LH2023G002); Funded by the Special Funds for Basic Research Operating Costs of Central Universities (2572022BL02); Funded by the National Natural Science Foundation of China (62176050).

Data Availability Statement

The data sources can be obtained by contacting the corresponding author.

Conflicts of Interest

The authors declare that they have no competing interests or personal relationships that could have influenced the work reported in this paper.

References

  1. Gordeev, R.V.; Pyzhev, A.I. Impact of Trade Restrictions on the Russian Forest Industry: Evidence from Siberian Timber Producers. Forests 2023, 14, 2452. [Google Scholar] [CrossRef]
  2. Usoltceva, N.; Tian, G.; Chang, S. The Competitiveness of the Wood Forest Product Trade and Its Sustainable Development: The Case of the Far Eastern Federal District of Russia. Forests 2025, 16, 207. [Google Scholar] [CrossRef]
  3. Tang, G.; Gao, Y.; Shan, L. Analysis of factors influencing the trade scale of China’s imports of Russian wood products. For. Econ. 2022, 8, 122–126. [Google Scholar]
  4. Tang, X.; Zhang, Z.; Shi, C. Growing uncertainties in Sino-Russian scientific and technological cooperation in 2025. Int. Political Sci. 2024, 9, 181–188. [Google Scholar]
  5. Ashraf, M.; Ghani, U.; Abrar, M. Belt and Road Initiative and its implications for trade and development in participating countries. J. Asian Econ. 2021, 75, 101308. [Google Scholar]
  6. Lin, Y.H.; Zhong, X.Y.; Zhong, C.E. Research on the site selection of timber logistics center based on genetic algorithm. Oper. Res. Manag. Sci. 2007, 6, 51–56. [Google Scholar]
  7. Qiu, R.Z.; Lin, Y.H.; Zhong, C.E. Timber logistics center site selection based on ArcGIS. Sci. Silvae Sin. 2010, 46, 113–117. [Google Scholar]
  8. Zhang, L.Y.; Lin, Y.Y.; Qiu, R.Z. Site selection method and empirical analysis of timber logistics center based on BPNN. J. Fujian For. Univ. 2014, 34, 82–86. [Google Scholar]
  9. Dou, J.; Meng, L.; Qian, L.; Pan, X. Application of Baumol–Wolff model and algorithm in site selection of timber storage center. Logist. Technol. 2014, 37, 15–18. [Google Scholar]
  10. Zhang, J.; Ba, W.T. Site selection of regional timber logistics distribution center under the background of big data. Logist. Technol. 2020, 39, 84–87. [Google Scholar]
  11. Khanal, N.; Pokharel, R.; Poudel, J.; Gc, S.; Shannon, E.; Huff, E.; Finley, A. Analysis of location, feedstock availability, and economic impacts of potential mass timber processing facilities in Michigan. For. Policy Econ. 2024, 163, 103203. [Google Scholar] [CrossRef]
  12. Wang, L.; Wang, S.; Luo, M.; Zhao, J. Suitability evaluation of mountain photovoltaic site selection based on AHP-GIS: A case study of Huize County, Yunnan Province. Acta Energiae Solaris Sin. 2024, 1–10. [Google Scholar]
  13. Zhong, Y.; Li, F.; Lei, C.; Zhou, M.; Xing, J.; Deng, Q.; Dong, H. Site selection of regional cigarette logistics distribution center based on GIS. Tob. Sci. Technol. 2024, 57, 91–99. [Google Scholar]
  14. Gao, J.W.; Meng, Q.C.; Liu, J.T. Two-stage planning site selection of large-scale environmental NIMBY facilities based on probabilistic multivalued neutrosophic sets and GIS. Environ. Eng. 2023, 41, 256–263+295. [Google Scholar]
  15. Zhou, G.; Cheng, T.; Liu, Y.; He, Z.; Cai, M. Optimization method of prefabricated PC component plant site selection based on demand forecasting and GIS. J. Railw. Sci. Eng. 2023, 20, 4389–4399. [Google Scholar]
  16. Shao, M.; Liu, M.; Chen, Y.; Sun, J.; Shao, Z.; Yi, C.; Wang, C. Site selection decision of wave energy power stations in Zhoushan based on GIS-MCDM-GRU. J. Ocean Univ. China (Natural Sci. Ed.) 2023, 53, 95–106. [Google Scholar]
  17. Karipoğlu, F.; Ozturk, S.; Efe, B. A GIS-based FAHP and FEDAS analysis framework for suitable site selection of a hybrid offshore wind and solar power plant. Energy Sustain. Dev. 2023, 77, 101349. [Google Scholar] [CrossRef]
  18. Li, Y.X.; Zhang, X.W.; Zhao, J.F.; Wang, S.; Yang, X. Local site selection method for conventional missile launch position using GIS and improved TOPSIS. J. Natl. Univ. Def. Technol. 2024, 46, 77–87. [Google Scholar]
  19. Zewdie, H.; Shiferaw, Z.; Gebresenbet, G. GIS-based multi-criteria decision-making approach for dry port location analysis: The case of Ethiopia. Res. Transp. Bus. Manag. 2025, 60, 101370. [Google Scholar]
  20. Jiang, C.; Ma, C.; Duan, S.; Min, X.; Zhang, Y.; Li, D.; Zhang, X. Monitoring of agricultural drought based on multi-source remote sensing data in Heilongjiang Province, China. J. Integr. Agric. 2025. [Google Scholar]
  21. Yushchenko, A.; de Bono, A.; Chatenoux, B.; Patel, M.K.; Ray, N. GIS-based assesment of photovoltaic (PV) and concentrated7solar power (CSP) generation potential in west Africa. Renew. Sustain. Energy Rev. 2018, 81, 2088–2103. [Google Scholar] [CrossRef]
  22. Nuhu, S.K.; Manan, Z.A.; Alwi, S.R.W.; Reba, M.N.M. Roles of geospatial technology in eco-industrial park site selection: State of the-art review. J. Clean. Prod. 2021, 309, 127361. [Google Scholar] [CrossRef]
  23. Zhang, Q.; Xin, X.; Zhang, H.; Li, Y.; Li, X.; Yi, C. Suitability analysis of photovoltaic power station construction in China based on remote sensing data and multi-factor evaluation. J. -Geo-Inf. Sci. 2018, 20, 119–127. [Google Scholar]
  24. Lei, M.; Wei, G.; Zhao, Q. Macro siting scheme research of large-scale photovoltaic power stations based on GIS technology. Sol. Energy 2023, 1, 43–48. [Google Scholar]
  25. Wei, G.; Wang, G.; Ruan, G.; Geng, N. A review on intelligent decision-making and optimization of EV charging station site selection. Comput. Eng. Appl. 2023, 59, 52–65. [Google Scholar]
  26. Zhao, R.; Shao, J.; Zhu, R.; Yang, S.; Tao, G. Economic analysis of floating photovoltaic power stations. Olar Energy 2021, 1, 22–29. [Google Scholar]
  27. Ma, Y.; Zhang, D.; Jiao, Z.; Deng, X.; Yu, Z. Research on base station location technology based on genetic algorithm. Electron. Technol. Softw. Eng. 2022, 23, 25–30. [Google Scholar]
  28. Bolouri, S.; Vafaeinejad, A.; Alesheikh, A.; Aghamohammadi, H. Minimizing response time to accidents in big cities: A two ranked level model for allocating fire stations. Arab. J. Geosci. 2020, 13, 16. [Google Scholar] [CrossRef]
  29. Srinivas, N.; Deb, K. Multiobjective function optimization using nondominated sorting genetic algorithms. Evol. Comput. 1994, 2, 1301–1308. [Google Scholar] [CrossRef]
  30. Deb, K.; Pratap, A.; Agarwal, S.; Meyarivan, T. A fast and elitist multiobjective genetic algorithm:NSGA-II. Trans. Evol. Comput. 2002, 6, 182–197. [Google Scholar] [CrossRef]
  31. Wang, L.; Yang, J.; Qu, B.; Pang, C. Multi-Objective Optimization of an Organic Rankine Cycle (ORC) for a HybridSolar–Waste Energy Plant. Energies 2024, 17, 1810. [Google Scholar] [CrossRef]
  32. Sadni, F.E.; Salhi, I.; Belhora, F.; Hajjaji, A. Multi-objective optimization of energy and exergy efficiencies in ORC configurations using NSGA-II and TOPSIS. Therm. Sci. Eng. Prog. 2025, 63, 103606. [Google Scholar] [CrossRef]
  33. Petrovic, S.; Islam, K.J.; Trautrims, A. NSGA-II and TOPSIS for a multi-objective vehicle routing problem with ecological considerations. In Optimization Essentials: Theory, Tools, and Applications; Courier Corporation: North Chelmsford, MA, USA, 2024; pp. 721–750. [Google Scholar]
  34. Shah, S.C.; Kusiak, A. Data mining and genetic algorithm based gene/SNP selection. Artif. Intell Med. 2004, 31, 183–196. [Google Scholar] [CrossRef] [PubMed]
Figure 1. (a) Geographical location. (b) Vegetation distribution of Heilongjiang Province.
Forests 16 01086 g001
Figure 2. Two-stage site selection model for wood-processing plants.
Forests 16 01086 g002
Figure 3. Comparison of weight calculation results.
Forests 16 01086 g003
Figure 4. (a) Slope. (b) Elevation. (c) Distance to Nature Reserve. (d) Distance To Water System. (e) Land Use Type. (f) Distance to Transportation Network. (g) Industrialization Level. (h) Distance to Market Demand. (i) Labor Availability.
Forests 16 01086 g004aForests 16 01086 g004b
Figure 5. Wood-processing plant site options.
Forests 16 01086 g005
Figure 6. (a) Pareto optimal solution set distribution. (b) Optimal Facility Location and Distribution Route Mapping.
Forests 16 01086 g006
Figure 7. (a) NSGA-II Convergence: Pareto Solution Count & Coverage Score (b) Spatial Sensitivity of Preliminary Site Selection to Indicator Weighting.
Forests 16 01086 g007
Table 1. Evaluation index system of wood-processing plant site selection in Heilongjiang province.
Goal LevelGuideline LevelIndicator Level
Comprehensive
Indicator System
for Siting Wood-
Processing Plants
Natural factorSlope
Elevation
Distance to Nature Reserve
Distance to Water System
Land Use Type
Economic factorDistance to Transportation Network
Environmental Cost
Raw Material Cost
Industrialization Level
Social factorDistance to Market Demand
Labor Availability
Policy and Regulation
Table 2. Criteria for grading the appropriateness of evaluation indicators.
Evaluation IndicatorsMost SuitableMore SuitableSuitableGenerally SuitableUnsuitable
Elevation (m)<200200∼400400∼600600∼800>800
Slope (%)<33∼78∼1516∼25>25
Industrialization Level (million)>53∼42∼31∼2<1
Labor Availability (persons/km2)>200150∼200100∼15050∼100<50
Distance to Nature Reserves (km)>2015∼2010∼155∼10<5
Distance to Transportation (km)<22∼44∼66∼8>8
Land Use TypeBare
land,
saline
construction land, roadlandagricultural
land, Sparse
grassland
Forest, grasslandWater pollution area, permanent snow
Distance to Water (km)<33∼55∼77∼9>9
Distance to Market Demand (km)<3030∼7070∼120120∼160>200
Table 3. Weights of the site selection indicator system.
Goal LayerCriterion LayerWeightIndicator LayerIndicator Layer Weights
Comprehensive
Indicator System
for Siting Wood-
Processing Plants
Natural Factors0.264Slope0.039
Elevation0.021
Distance to Nature Reserves0.077
Distance to Water Systems0.128
Land Use Type0.076
Economic Factors0.631Distance to Transportation Network0.266
Environmental Cost0.038
Raw Material Cost0.220
Industrialization Level0.030
Social Factors0.105Distance to Market Demand0.052
Labor Availability0.028
Policy and Regulations0.020
Table 4. Areas of Identified Coverage Needs.
NumberNameArea of CoverageRequirement Number
1Jixian CountyLuobei, Jiamusi Port, Huichun River, Mishan, Dongning, Jiamusi City, Jixi City, Shuangyashan City, Qitaihe City, Hegang City11
5Suibin CountyJiamusi, Tongjiang, Huayuan, Huohe, Suibin, Fuyu, Heilongjiang Island7
10Keshan CountyBlack River Port, Huma, Sunwukou, Mohe, Heihe, Harbin City, Qiqihar City, Daqing City, Heihe City, Suifenhe City, Daxing’anling Area11
15Fangzheng CountyMudanjiang City, Yichun City2
Table 5. Three typical strategy scenarios.
Strategy TypesSolution CharacteristicsRequirement Number
Cost-sensitive F 1 is the lowest, F 1 and F 2 are relatively highEarly-stage projects, budget constraints
Satisfaction-oriented F 1 is the lowest, F 2 is medium, F 3 is relatively highBrand services, government demonstration
Green efficiency F 1 is the lowest, F 2 is low, F 3 is relatively highDual carbon goals, certification requirements
Disclaimer/Publisher’s Note: The statements, opinions and data contained in all publications are solely those of the individual author(s) and contributor(s) and not of MDPI and/or the editor(s). MDPI and/or the editor(s) disclaim responsibility for any injury to people or property resulting from any ideas, methods, instructions or products referred to in the content.

