Article

GIS-Based Multi-Criteria Analysis for Urban Afforestation Planning in Semi-Arid Cities

by
Halil İbrahim Şenol
1,
Abdurahman Yasin Yiğit
2 and
Ali Ulvi
2,*
1
Department of Geomatics Engineering, Faculty of Engineering, Harran University, 63100 Şanlıurfa, Türkiye
2
Department of Geomatics Engineering, Faculty of Engineering, Mersin University, 33343 Mersin, Türkiye
*
Author to whom correspondence should be addressed.
Forests 2025, 16(7), 1064; https://doi.org/10.3390/f16071064
Submission received: 30 May 2025 / Revised: 24 June 2025 / Accepted: 25 June 2025 / Published: 26 June 2025

Abstract

Urban forests are very important for the environment and for people, especially in semi-arid cities where there is not much greenery. This makes heat stress worse and makes the city less livable. This paper presents a comprehensive geospatial methodology for selecting afforestation sites in the expanding semi-arid urban area of Şanlıurfa, Turkey, characterized by minimal forest cover, rapid urbanization, and extreme weather conditions. We identified nine ecological and infrastructure criteria using high-resolution Sentinel-2 images and features from the terrain. These criteria include slope, aspect, topography, land surface temperature (LST), solar radiation, flow accumulation, land cover, and proximity to roads and homes. After being normalized to make sure they were ecologically relevant and consistent, all of the datasets were put together into a GIS-based Multi-Criteria Decision Analysis (MCDA) tool. The Analytic Hierarchy Process (AHP) was then used to weight the criteria. A deep learning-based semantic segmentation model was used to create a thorough classification of land cover, primarily to exclude unsuitable areas such as dense urban fabric and water bodies. The final afforestation suitability map showed that 151.33 km2 was very suitable and 192.06 km2 was suitable, mostly in the northeastern and southeastern urban fringes. This was because the terrain and subclimatic conditions were good. The proposed methodology illustrates that urban green infrastructure planning can be effectively directed within climate adaptation frameworks through the integration of remote sensing and spatial decision-support tools, especially in ecologically sensitive and rapidly urbanizing areas.

1. Introduction

Urban green space (UGS) components, specifically urban forests, play an integral role in improving the environmental, social, and economic resilience of urbanized areas, particularly in the context of climate change and rapid urban growth [1]. These vegetative features play a pivotal role in urban ecosystems by regulating microclimates, mitigating the urban heat island (UHI) effect, enhancing water and air quality, and fostering biodiversity [2,3]. Researchers have underscored the significance of urban forests in several domains, including carbon sequestration, stormwater management, noise abatement, and public health [4,5,6,7,8]. Beyond its ecological benefits, green space confers psychological and recreational advantages, thereby enhancing quality of life and fostering social connectivity in densely populated areas [9,10,11].
Urban forests are generally acknowledged to be providers of ecosystem services at the provisioning, regulating, supporting, and cultural levels. These services are particularly significant in areas where natural ecosystems are heavily fragmented through urbanization. This multifunctionality of urban forests implies that they benefit climate adaptation, urban food security, water cycle regulation, restoration of living habitats, and the process of place-making [12]. Planned urban forest corridors in urban agglomerations such as Berlin, Singapore, and Ahmedabad have been undertaken as part of larger green infrastructure and climate adaptation initiatives, underscoring the relevance at the geographical and governance levels [13].
In semi-arid and dry urban regions, characterized by harsh climates and little vegetation, afforestation has emerged as a crucial adaptation strategy to address urban environmental degradation [14,15,16]. Şanlıurfa, situated in southeastern Türkiye, exemplifies this occurrence. The area demonstrates little yearly rainfall, extended dry spells, and one of the lowest rates of forest coverage in the country. Şanlıurfa confronts considerable ecological threats. Incorporating afforestation into regional urban development is essential for improving environmental quality and offering sustainable solutions for livability and climate resilience.
Effective urban afforestation planning requires a multidisciplinary approach that integrates ecological suitability, spatial constraints, and environmental factors [14,17]. In recent years, geospatial technologies, including Geographic Information Systems (GISs) and Remote Sensing (RS), have become essential for identifying possible sites for ecological interventions [18,19,20,21]. The incorporation of Multi-Criteria Decision Analysis (MCDA) into GIS-oriented planning allows decision-makers to compare different parameters (e.g., topography, land cover, accessibility, and climate indicators) in a systematic and transparent procedure [22,23,24,25].
A plethora of methodologies have been formulated in the extant literature to ascertain the optimal locations for afforestation and green space development. The Normalized Difference Vegetation Index (NDVI) has historically been utilized to identify regions lacking in vegetation or vegetation density. However, employment of NDVI at specific thresholds may prove insufficient for differentiation of land uses, particularly in regions characterized by diverse or transitional land coverings. Similarly, land cover layers such as CORINE have been employed to infer land suitability; however, their poor spatial resolution and generalist classifications limit their applicability in urban, fine-scale investigations [26,27,28,29,30].
Recent advancements in machine learning, particularly deep learning, have enhanced the precision and intricacy of land cover classification by leveraging the comprehensive spectral and geographical variability of high-resolution satellite data [31,32]. Convolutional neural networks (CNNs) represent a distinguished category of deep learning models that have exhibited exceptional effectiveness in detecting urban infrastructures, vegetation types, and human-made objects when utilized with Sentinel-2 and Landsat data [33,34,35,36]. These classifiers enhance the reliability of spatial planning models by reducing uncertainty in land cover mapping.
In addition to land cover, environmental and climatic factors are essential in investigations of afforestation suitability. Land Surface Temperature (LST), obtained from the thermal infrared bands of Landsat-8/9, is progressively utilized as an indicator of metropolitan heat and thermal discomfort. Areas with elevated land surface temperatures are frequently prioritized for ecological initiatives to mitigate heat stress and improve human thermal comfort [37,38,39,40]. Solar radiation, derived from Digital Elevation Models (DEMs), provides critical information regarding regions with adequate sunlight for photosynthesis, impacting seedling viability and plant development [41,42,43]. Furthermore, hydrological attributes such as flow accumulation, derived from DEM-based hydrologic modeling, are crucial for identifying areas susceptible to flooding or erosion that should be avoided in afforestation efforts [44,45,46,47].
The closeness of a region to established human settlements and transportation infrastructure is a crucial distance-related element in the execution of afforestation initiatives in urban settings. These characteristics denote the accessibility and practicality of administration, while also promoting the incorporation of green spaces into urban frameworks from a socio-ecological perspective [48,49,50,51]. The deliberate placement of trees in residential zones has been shown to foster environmental justice, improve accessibility, and augment the visibility and safety of green spaces [52,53,54].
The prevailing trend in urban afforestation modeling suggests a shift towards detailed, high-resolution models that utilize many layers of information to facilitate spatial decision-making. Bai et al. (2022) [55] and Kiberet et al. (2025) [18] have proved that remote sensing and machine learning techniques are successful in discerning complex land surface dynamics. The utilization of MCDA in urban green space planning has been evidenced in areas with constrained knowledge, as demonstrated by Anteneh et al. (2023) [56] and Gelan (2021) [57]. This method highlights the replicability of MCDA in many geographic settings.
In conjunction with methodological advancements, there is increasing interest in amalgamating artificial intelligence (AI) with MCDA techniques to improve the flexibility and scalability of urban ecological models [24,58,59,60]. Hybrid approaches integrating fuzzy logic, deep learning, and AHP have been employed in the design of green infrastructure in urban settings, resulting in more robust spatial models [61,62]. These techniques improve classification accuracy while concurrently reducing subjectivity in weighting procedures.
Numerous studies continue to employ pre-classified land cover data or singular indicator procedures such as NDVI, neglecting the integration of modern classification techniques and multidimensional criteria. Moreover, applications focused on semi-arid cities, where afforestation provides the most significant marginal ecological benefit, are very limited [63,64,65,66]. We propose that the amalgamation of deep learning-based land cover classification MCDA, utilizing topographic, climatic, hydrological, and accessibility variables, can markedly improve the spatial accuracy and contextual appropriateness of afforestation planning in semi-arid urban regions, as illustrated by Şanlıurfa.
This study offers a detailed spatial framework for assessing afforestation suitability in Şanlıurfa through the integration of deep learning-based classification and GIS-MCDA. The study’s uniqueness lies in its methodological framework and regional emphasis. It incorporates high-resolution Sentinel-2 imagery, terrain derivatives, thermal and solar indices, hydrological models, and accessibility metrics—weighted using the Analytic Hierarchy Process—to provide a replicable, data-driven afforestation suitability map. The afforestation suitability model developed through the GIS-based MCDA framework is intended for ecologically vulnerable metropolitan regions and offers a scalable resource for urban planners seeking to implement flexible and robust green infrastructure solutions in similar semi-arid environments.

2. Data and Methodology

This section presents the data sources, spatial variables, and geospatial techniques used in developing the afforestation suitability model. The methodology integrates multiple datasets, including satellite imagery, terrain derivatives, and spatial infrastructure layers, into a GIS-based MCDA framework. Each step of the analysis—from preprocessing of remote sensing inputs to criteria weighting and final suitability mapping—was designed to ensure ecological relevance and spatial precision.
The selection of input variables was grounded in ecological theory and spatial planning literature focused on afforestation in semi-arid urban environments. The included variables were chosen to capture both the biophysical suitability for tree growth (e.g., slope, aspect, elevation, land surface temperature, solar radiation) and the logistical feasibility for afforestation interventions (e.g., distance to roads and settlements, land cover suitability). These factors have been validated in previous research on urban green infrastructure planning, particularly in Mediterranean and arid climates. Their integration ensures a balanced assessment that reflects both environmental performance and practical implementation constraints.

2.1. Study Area

The city of Şanlıurfa, located in the southeastern region of Türkiye, boasts a rich historical significance within the broader context of the Southeastern Anatolia Region. The city’s precise geographical location is approximately 37°10′ N and 38°47′ E, strategically positioned within the semi-arid expanse of the Euphrates valley. The region’s climate is classified as semi-arid continental, with characteristics that include protracted hot and arid summers and brief cold winters with minimal precipitation. The mean annual precipitation is roughly 460 mm, occurring from November to April, whereas the summer months are often arid and exceedingly hot, with daily temperatures frequently exceeding 40 °C.
Data from the General Directorate of Forestry and the Turkish Statistical Institute indicate that Şanlıurfa ranks among the provinces with the least forest cover in Türkiye, with forested regions comprising less than 1% of its total land area. The central urban area has experienced swift expansion in recent decades, propelled by population growth, internal migration, and regional development initiatives. In 2023, the metropolitan population of Şanlıurfa exceeded 2 million, marked by informal settlements, high-density residential zones, and expanding industrial corridors.
The urban expansion of Şanlıurfa has primarily adhered to linear patterns along major transportation corridors, especially in the northern and eastern areas of the city center. The increasing strain on agricultural lands and environmentally delicate areas adjacent to the city highlights the imperative for sustainable urban development strategies, including afforestation and the enhancement of green infrastructure. The deficiency of per capita urban green space and the city’s susceptibility to urban heat island effects highlight the necessity for the creation of new urban forest areas.
The research area encompasses the key metropolitan districts of Şanlıurfa. The municipalities of Eyübiye, Haliliye, and Karaköprü, in conjunction with their adjacent peri-urban regions, constitute the subject of this study. The selection of these districts was predicated on three factors: their rapid urbanization, the absence of established green infrastructure, and their socio-ecological significance within the broader urban environment. The overall analysis area is roughly 450 km2, including both developed regions and prospective open lands appropriate for afforestation. A spatial boundary for the study was defined using administrative district shapefiles and a 5 km buffer from the major urban footprint to encompass transitional areas between urban and rural zones. This buffer was selected to identify regions that would most benefit from green infrastructure for accessibility, ecological interconnectedness, and micro-climate enhancement. Figure 1 illustrates the distribution of significant natural and manmade features within the research region.

2.2. Data Acquisition and Preprocessing

A spatial decision support system for afforestation appropriateness in Şanlıurfa was developed by acquiring and preprocessing a combination of multispectral, topographic, thermal, and infrastructural datasets using ArcGIS Pro (version 3.4). The principal remote sensing collection comprised Sentinel-2 Level-2A (L2A) images, offering surface reflectance-corrected data at a spatial resolution of 10 m. The multispectral images were utilized as input for land cover classification, as elaborated in Section 3.2. Topographic variables including slope, aspect, elevation, solar radiation, and flow accumulation were obtained from the Shuttle Radar Topography Mission (SRTM) DEM, with a resolution of 30 m. Terrain derivatives were computed utilizing ArcGIS spatial analyst and hydrological toolsets, thereafter resampled to a consistent spatial resolution compatible with other datasets. Thermal conditions were assessed using Landsat 8–9 data, utilizing the Thermal Infrared Sensor (TIRS) bands to calculate LST by the mono-window method. The LST layer was standardized and incorporated as a key factor in the afforestation suitability model because of its role in identifying urban heat island regions. Vector data for roads and building footprints were obtained from OpenStreetMap and converted into raster format to illustrate the Euclidean distance to infrastructure. All raster datasets were projected to WGS 1984 UTM Zone 37N and normalized to a 0–1 scale using min–max normalization, as illustrated in Equation (1).
x = x x m i n x m a x x m i n
where x is the original raster value, x m i n and x m a x denote the minimum and maximum values within the layer, respectively, and x is the scaled output. This standardization ensured equitable weighting in the MCDA framework described in subsequent sections.

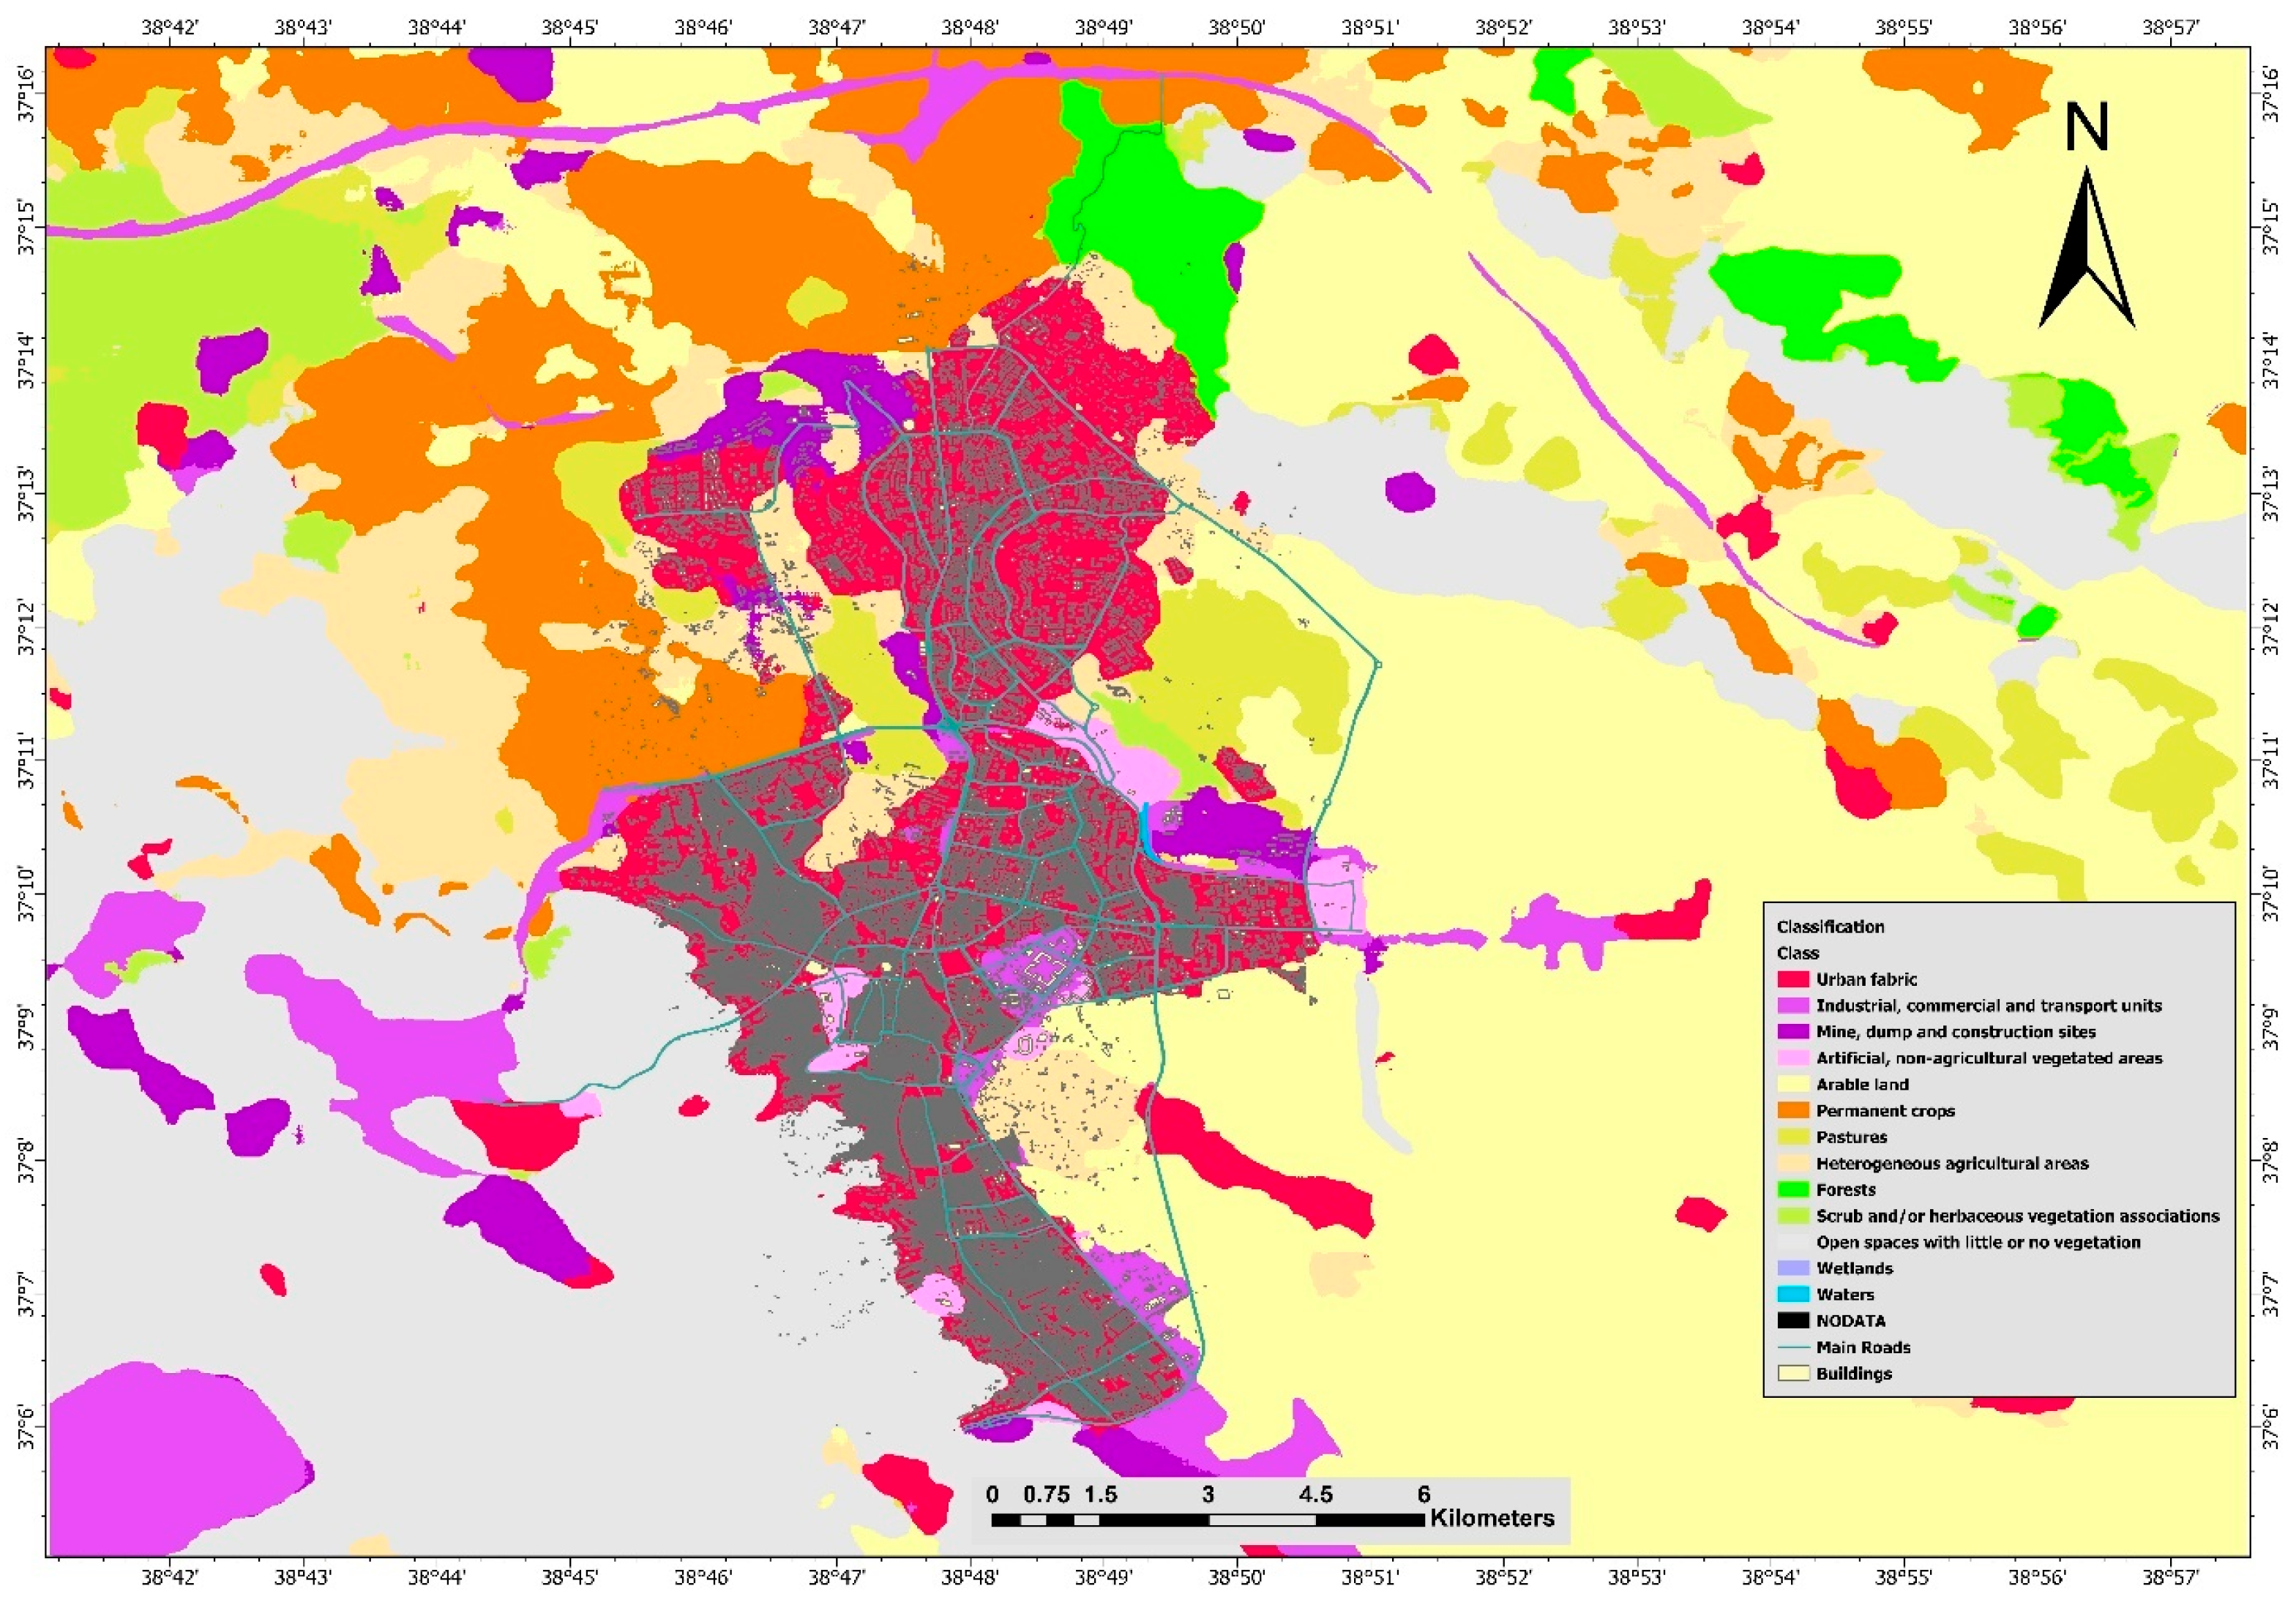
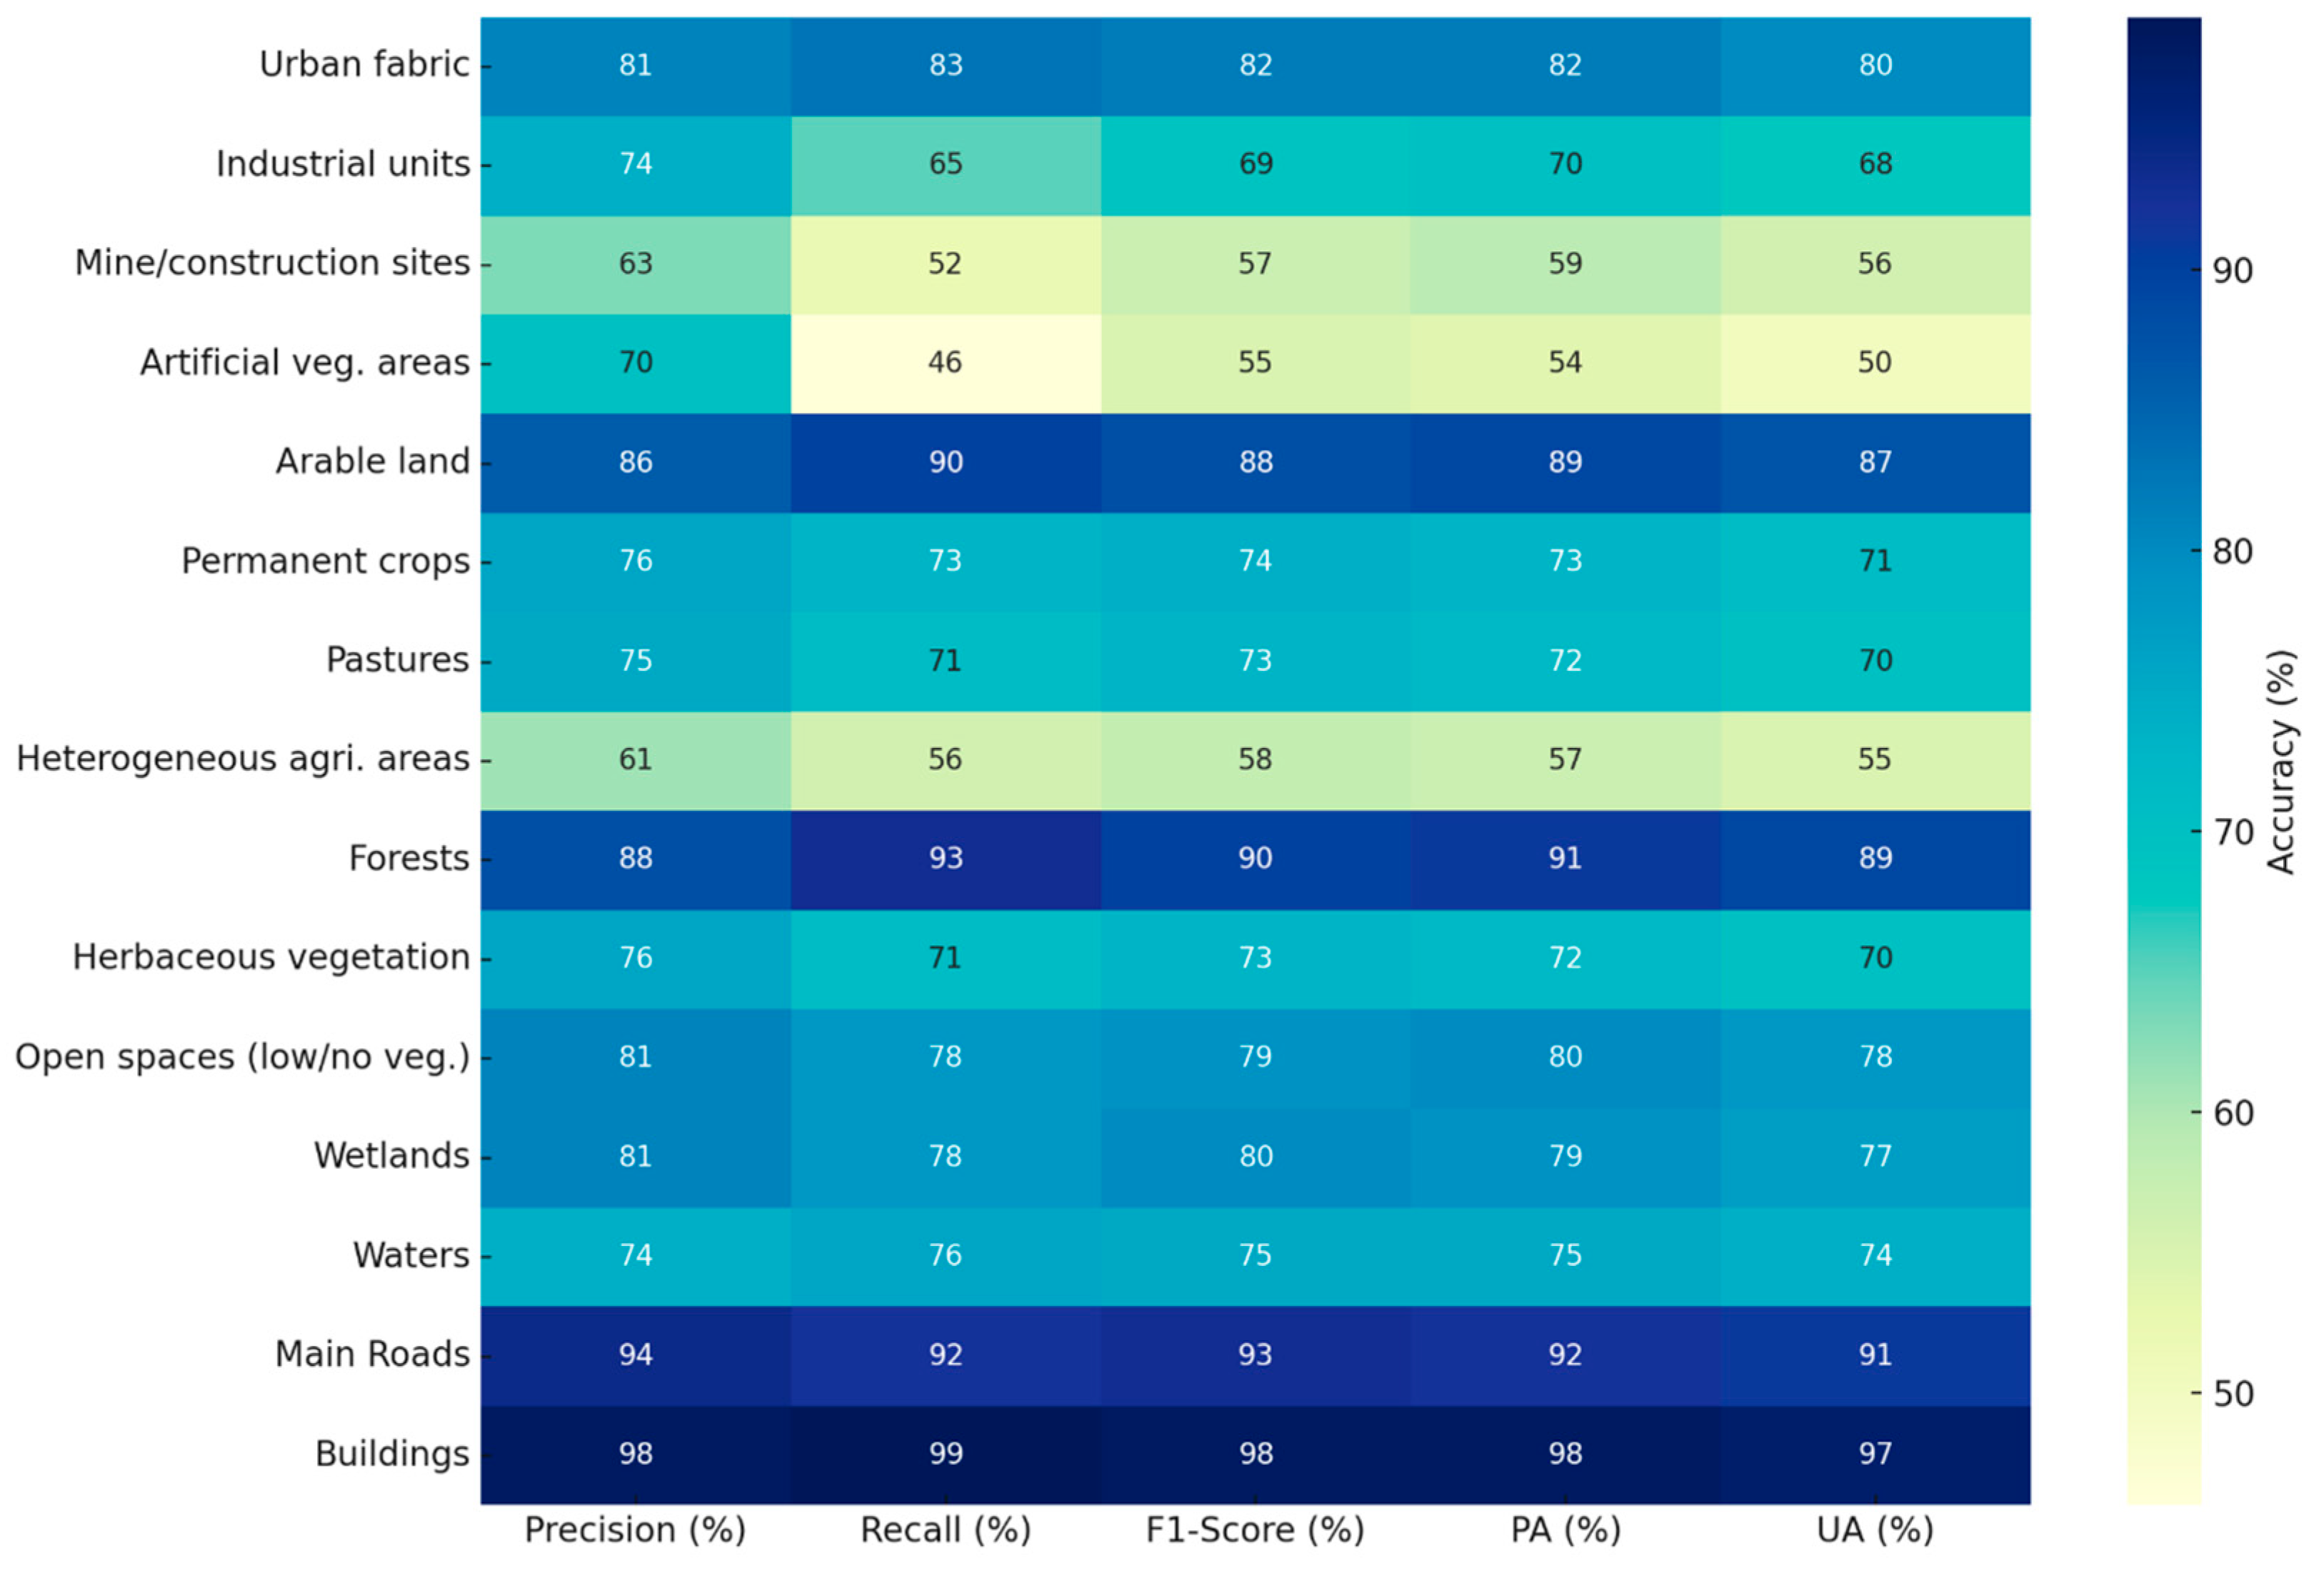
2.3. Land Use and Land Cover Classification

This research gathered land use and land cover (LULC) data from high-resolution Sentinel-2 Level-2A imagery using a pretrained deep learning model developed by Esri and published via the ArcGIS Living Atlas of the World. The model, titled Land Cover Classification using Deep Learning, utilizes a U-Net convolutional neural network (CNN) architecture, which is well-suited for pixel-wise semantic segmentation of land cover classes in complex urban and peri-urban environments. The pretrained model was trained on the CORINE Land Cover (CLC) 2018 database using Sentinel-2 imagery across diverse European and Mediterranean regions. It classifies images into 15 Level-2 CORINE-based categories, including artificial surfaces, agricultural areas, natural vegetation, wetlands, and water bodies, at a spatial resolution of 10 m. The classification was implemented directly within ArcGIS Pro (version 3.4) using the “Classify Pixels Using Deep Learning” tool and the published .dlpk model package. The model required no additional training, configuration, or annotation and utilized four input bands: Red, Green, Blue, and Near Infrared (NIR).
Following classification, the resulting LULC map was reviewed for thematic consistency and subjected to an exclusion process. Inappropriate zones for afforestation—such as dense urban fabric, industrial zones, forested areas, and permanent water bodies—were removed using a binary mask to isolate ecologically viable land. This filtered land cover map served as both a constraint layer in the MCDA and a validation base for spatial eligibility. To assess classification accuracy, a stratified random sample of reference points was manually generated and cross-referenced with CORINE 2018 data, high-resolution satellite imagery (Google Earth and World Imagery), and visual interpretation. The classification achieved an overall accuracy of 83.7% and a Kappa coefficient of 0.81, indicating strong agreement. Additional class-specific metrics (Precision, Recall, and F1-score) are presented in the Results section.
This model was selected for three primary reasons: (i) it is semantically aligned with the CORINE classification system, (ii) it demonstrates high reported accuracy over 15 Level-2 land cover categories, and (iii) it provides operational efficiency inside the ArcGIS Pro environment. The classification utilized the Classify Pixels Using Deep Learning tool, employing the pretrained .dlpk (Esri Model Definition) file. This file contains the network weights, input format specifications, and runtime configuration parameters necessary for model execution. Thus, users can perform pixel-wise classification directly in ArcGIS Pro without the need for retraining or manual configuration of the network architecture.
The output of the classification consisted of 15 land cover classes corresponding to CORINE Level-2 categories. These include, but are not limited to, artificial surfaces (e.g., urban fabric, industrial units), agricultural areas (e.g., arable land, permanent crops, pastures), natural vegetation (e.g., forests, shrublands), inland and maritime wetlands, and water bodies. Subsequent to classification, an exclusion mask was utilized to remove inappropriate places for afforestation, including impermeable metropolitan regions and permanent water bodies. The conclusive LULC map functioned as a binary decision layer in the afforestation suitability analysis detailed in Section 3.1.
To evaluate the thematic quality of the classification, confusion matrix-based accuracy assessment was performed. Reference data were collected from three sources: (i) visual interpretation of high-resolution basemap imagery (World Imagery and Google Earth), (ii) CORINE 2018 vector layers, and (iii) manually annotated ground-truth points selected across representative LULC categories.
The assessments included computation of standard classification accuracy metrics via Equations (2)–(8).
Overall Accuracy (OA): the proportion of correctly classified samples over the total sample size.
O A = i = 1 k n i N
Producer’s Accuracy P A i : the likelihood that a reference sample of class i is correctly classified.
P A i = n i i j = 1 k n i j
User’s Accuracy U A i : the probability that a sample labeled as class i in the output actually belongs to that class.
U A i = n i i j = 1 k n j i
Kappa Coefficient ( K ): a measure of agreement between the classification and reference data, adjusted for chance agreement.
K = N n i i ( n i + n + i ) N 2 ( n i + n + i )
where
n i i is the number of correctly classified samples for class i ,
n i j is the number of reference samples of class i predicted as class j ,
n j i is the number of predicted samples as class i actually belonging to class j ,
n i + is the total number of reference samples in class i ,
n + i is the total number of predicted samples as class i , and
N is the total number of validation samples.
Additionally, for selected key classes (e.g., scrublands, open lands), Precision, Recall, and F1-score metrics were calculated via Equations (6)–(8).
True Positives (TP): correctly predicted instances of a class,
False Positives (FP): pixels incorrectly assigned to a class, and
False Negatives (FN): pixels belonging to a class but not identified as such [67].
P r e c i s i o n = T P T P + F P
R e c a l l = T P T P + F N
F 1 = 2 P r e c i s i o n R e c a l l P r e c i s i o n + R e c a l l
All validation procedures were performed without including any of the training tiles used by the pretrained model, thereby ensuring independent evaluation.

2.4. Land Surface Temperature Calculation

In this study, satellite data from Landsat 8 were used to estimate LST for the year 2024. Landsat 8 carries the Operational Land Imager (OLI) and the TIRS, enabling high-resolution multispectral and thermal imaging suitable for environmental monitoring. LST was derived using Band 10 (TIRS) and calculated following the Radiative Transfer Equation (RTE) approach, incorporating NDVI-based Land Surface Emissivity (LSE) correction. LSE was calculated based on NDVI thresholds. Specifically, NDVI values were used to distinguish among bare soil, mixed, and vegetated surfaces. For vegetated areas, LSE was computed using the proportional vegetation method, while fixed emissivity values were applied for non-vegetated pixels. These LSE values were then used in Equation (11) to estimate the LST from the thermal infrared band of Landsat 8 imagery.
Although LST was not validated using ground-based temperature sensors due to the absence of in-situ surface thermal records in the study area, the estimated values were used as relative indicators in the ecological suitability analysis rather than for absolute temperature prediction. Therefore, they serve to capture thermal gradients across the landscape, especially urban heat island patterns, rather than precise temperature values.
Equations (9)–(11) detail the computational steps used in LST derivation. The resulting raster was integrated as one of the nine criteria in the GIS-based MCDA framework for afforestation planning.
T o p o f A t m o s p h e r e   T O A R a d i a n c e   C o n v e r s i o n = M L x Q c a l + A L
where M L and A L are rescaling coefficients from the metadata and Q c a l is the DN value.
B r i g h t n e s s   T e m p e r a t u r e   B T = K 2 l n ( K 1 L λ + 1 )
where K 1 and K 2 being calibration constants from the metadata. LSE was calculated based on NDVI thresholds.
L a n d   S u r f a c e   T e m p e r a t u r e   L S T = B T 1 + λ B T ρ l n ε
where λ = 10.895 µm, ρ = 1.438 × 10⁻² m K, and ε is LSE. The resulting LST raster (in °C) was normalized and used as a key thermal input, given its significance in identifying areas of urban heat stress and guiding ecological interventions.

2.5. Criteria Layer Development

The criteria used for afforestation suitability were pre-selected based on a structured literature review and ecological logic relevant to semi-arid and urban greening contexts. We prioritized factors that directly influence planting viability, microclimate regulation, and infrastructure accessibility—based on established precedents in spatial planning and MCDA research (e.g., [37,47,68]). The final selection of nine criteria was also guided by expert consultation and the technical feasibility of spatial modeling using open-access datasets.
Each raster criterion was selected to represent one of four domains critical for afforestation planning: topographic suitability (slope, aspect, elevation), thermal and solar conditions (LST, solar radiation), hydrological stability (flow accumulation), and accessibility and land use context (proximity to roads and settlements, land cover type). Criteria were normalized so that higher values indicate greater suitability. A summary of each criterion’s ecological or logistical rationale is provided in Table 1.
While some topographic variables (e.g., aspect and solar radiation) may exhibit correlation, both were retained in the model to capture microclimatic nuances relevant to semi-arid afforestation. Aspect controls directional moisture retention, while solar radiation accounts for cumulative energy exposure independent of slope orientation.

2.6. Analytical Hierarchy Process

A pairwise comparison matrix was constructed using Saaty’s AHP, where each criterion was compared with the others based on expert judgment and literature-derived relative importance [69]. The expert input was obtained from three academic professionals with specialization in geosciences, spatial planning, and environmental sustainability—each possessing prior experience with MCDA and ecological modeling in arid or urban contexts. The comparison values range from 1 (equal importance) to 9 (extreme importance), following Saaty’s fundamental scale. Table 2 presents the upper triangle of the matrix for simplicity; the full comparison matrix was completed using reciprocal values (i.e., if criterion A is 3 times more important than B, then B is 1/3 as important as A). This is not a correlation matrix, and values are not normalized at this stage. The normalized priority vector (criteria weights) was calculated using the eigenvector method, and results are provided in Table 3 along with the consistency ratio (CR), which was 0.044—well below the 0.10 threshold for acceptable consistency [24].
The calculated CR was 0.044, which is below the accepted threshold of 0.10. This confirms that the judgments provided in the pairwise comparison matrix are logically consistent and suitable for use in multi-criteria evaluation. Each criterion C i   was compared against every other criterion C j   using Saaty’s 1–9 scale. The pairwise matrix A = [aij] was used to compute the normalized principal eigenvector, which yielded the weight vector w = [w1,w2, …,wn]. The Consistency Index (CI) and CR were calculated using Equations (12) and (13):
C l = ( λ m a x n ) / ( n 1 )
C R = C l / R l
where λ m a x is the maximum eigenvalue, n is the number of criteria, and RI is the random consistency index. CR < 0.10 indicates acceptable consistency.

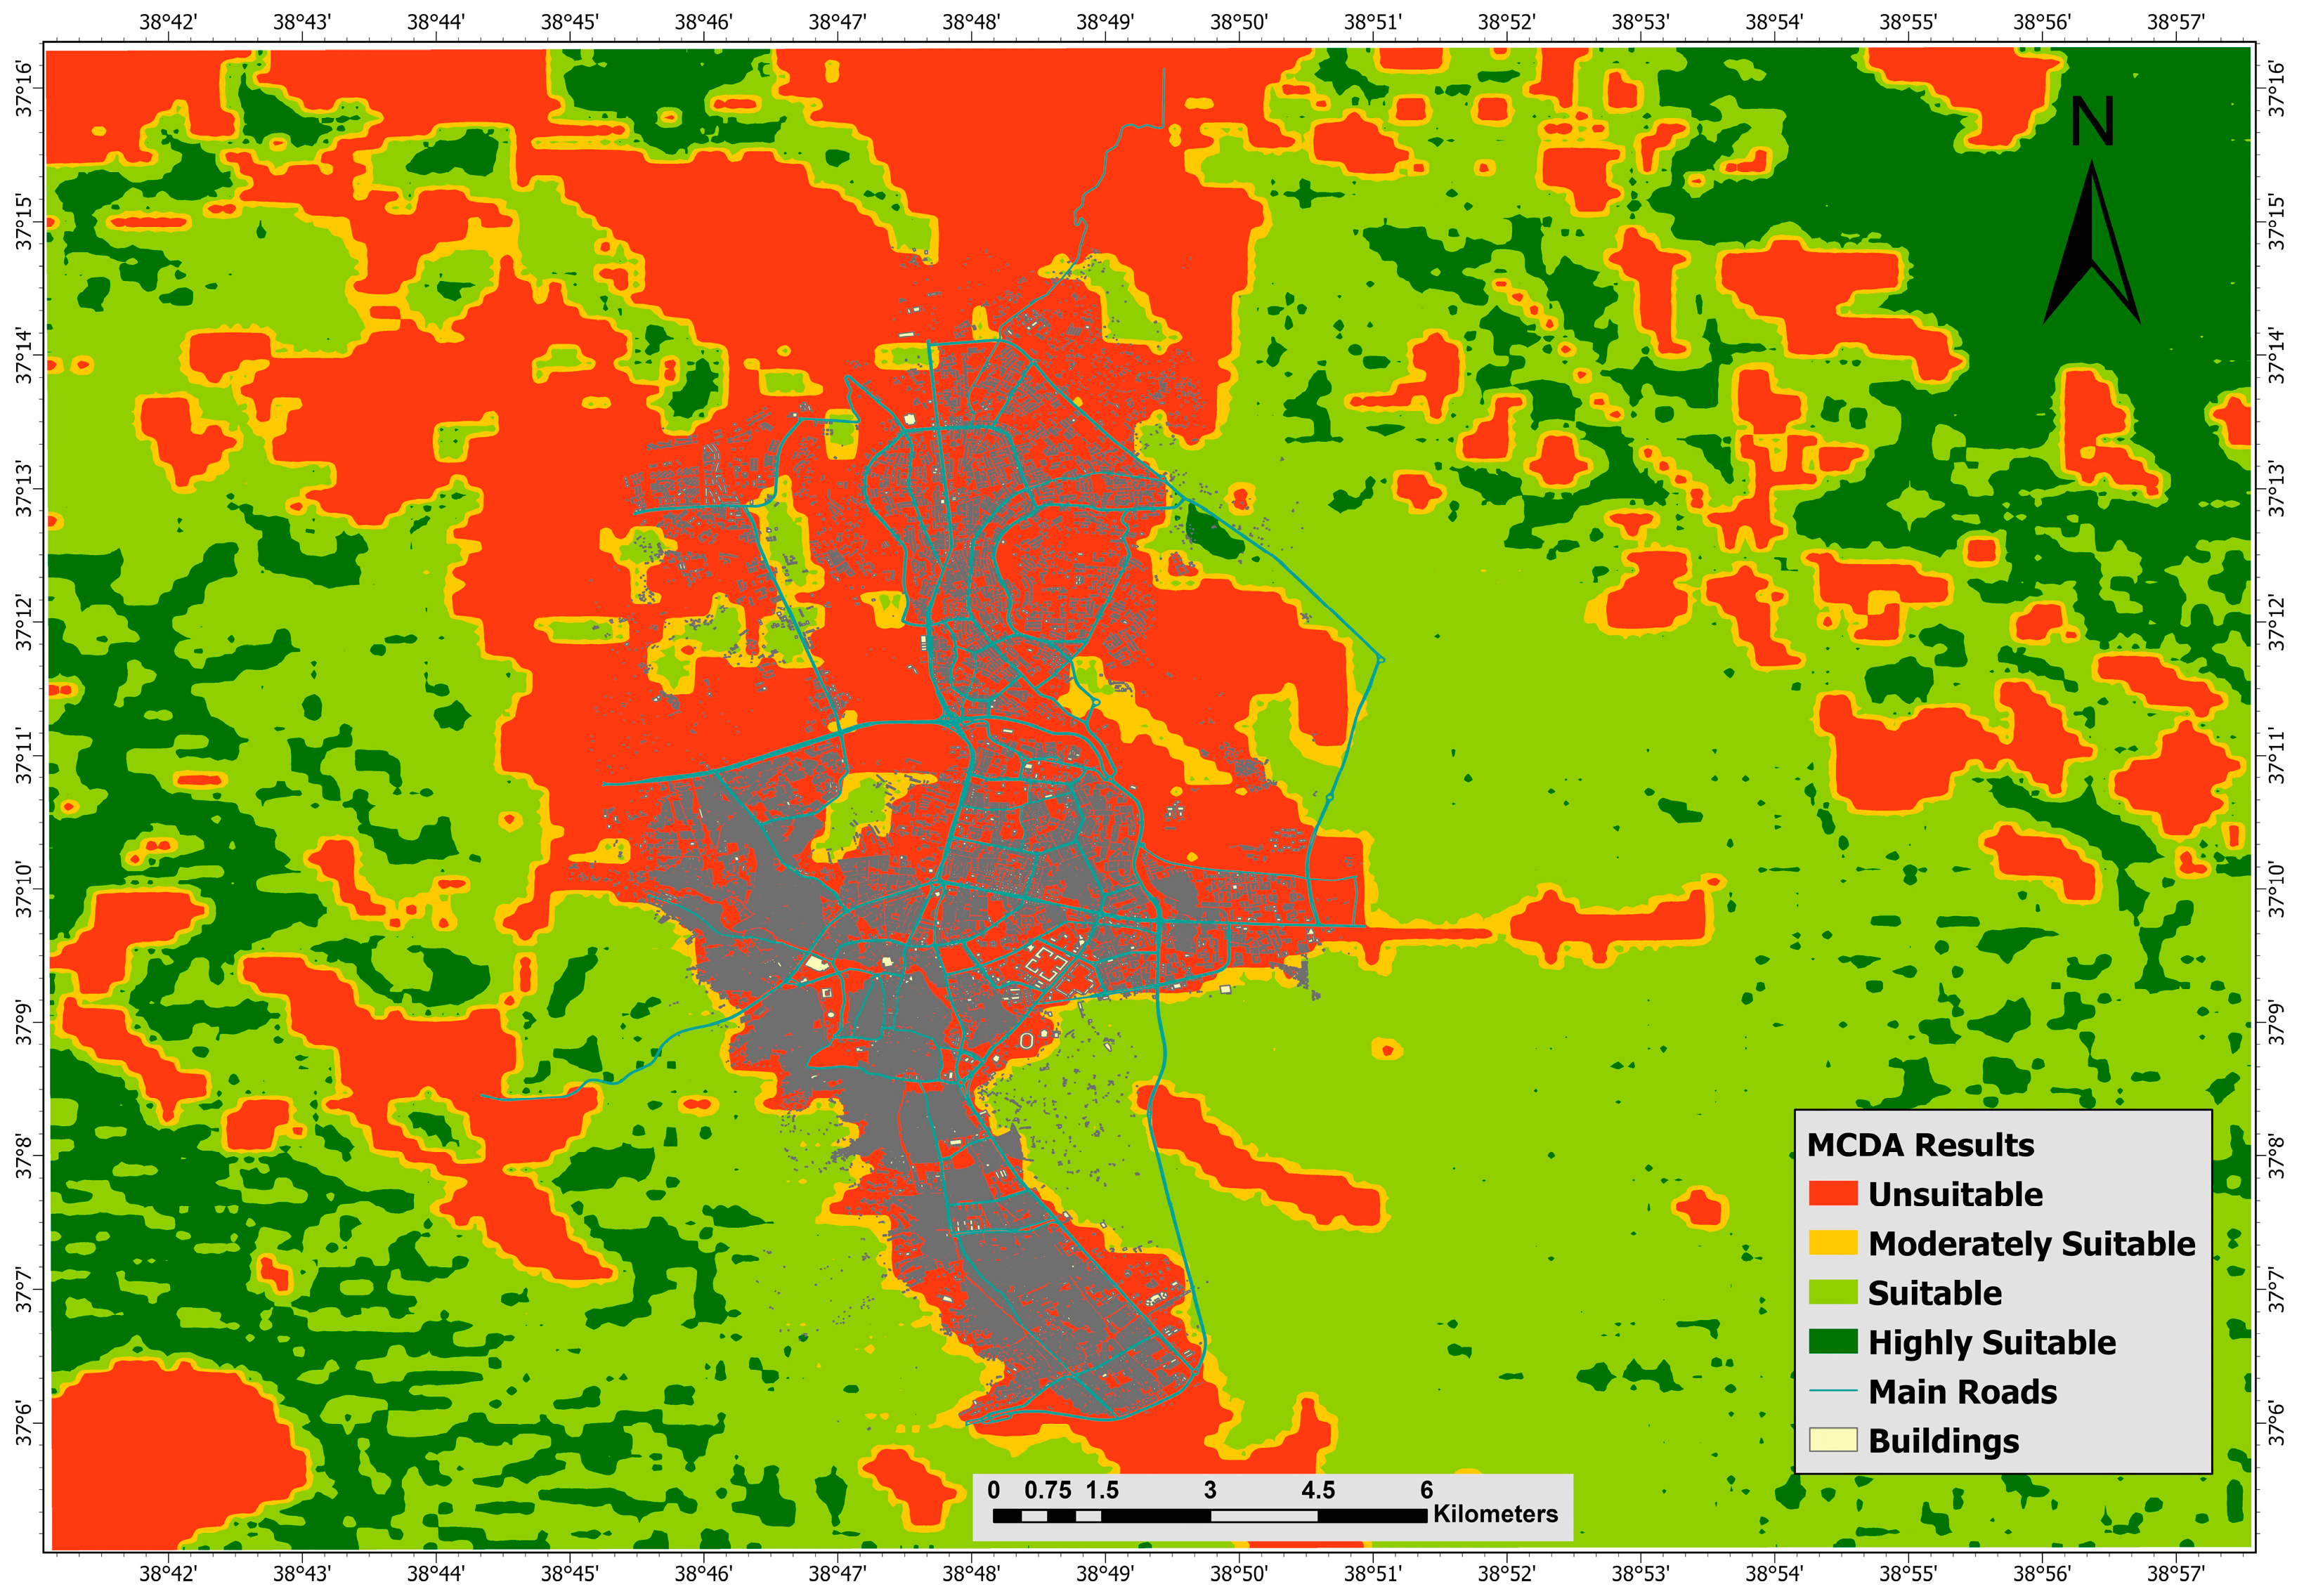
2.7. Weighted Overlay and Final Suitability Mapping

The final suitability index S was calculated using Equation (14) with Weighted Linear Combination (WLC):
S = w i x i
where x i represents the normalized raster value of the ith criterion, and w i is its AHP-derived weight. The resulting raster S was masked using the binary land cover mask and classified into four suitability categories:
  • Highly suitable (0.75–1.00)
  • Suitable (0.50–0.75)
  • Moderately suitable (0.25–0.50)
  • Unsuitable (0.00–0.25)
This structured methodology ensures an evidence-based, spatially explicit identification of urban afforestation sites under semi-arid conditions, combining remote sensing, geospatial modeling, and multi-criteria decision support tools.

3. Results

This section presents the spatial outcomes of the MCDA conducted to determine afforestation-suitable areas in the urban and peri-urban regions of Şanlıurfa. A total of nine spatial criteria layers were derived, normalized, and integrated using the AHP. The results are presented in two main parts: (1) analysis of individual criterion layers and (2) final suitability map based on weighted overlay.

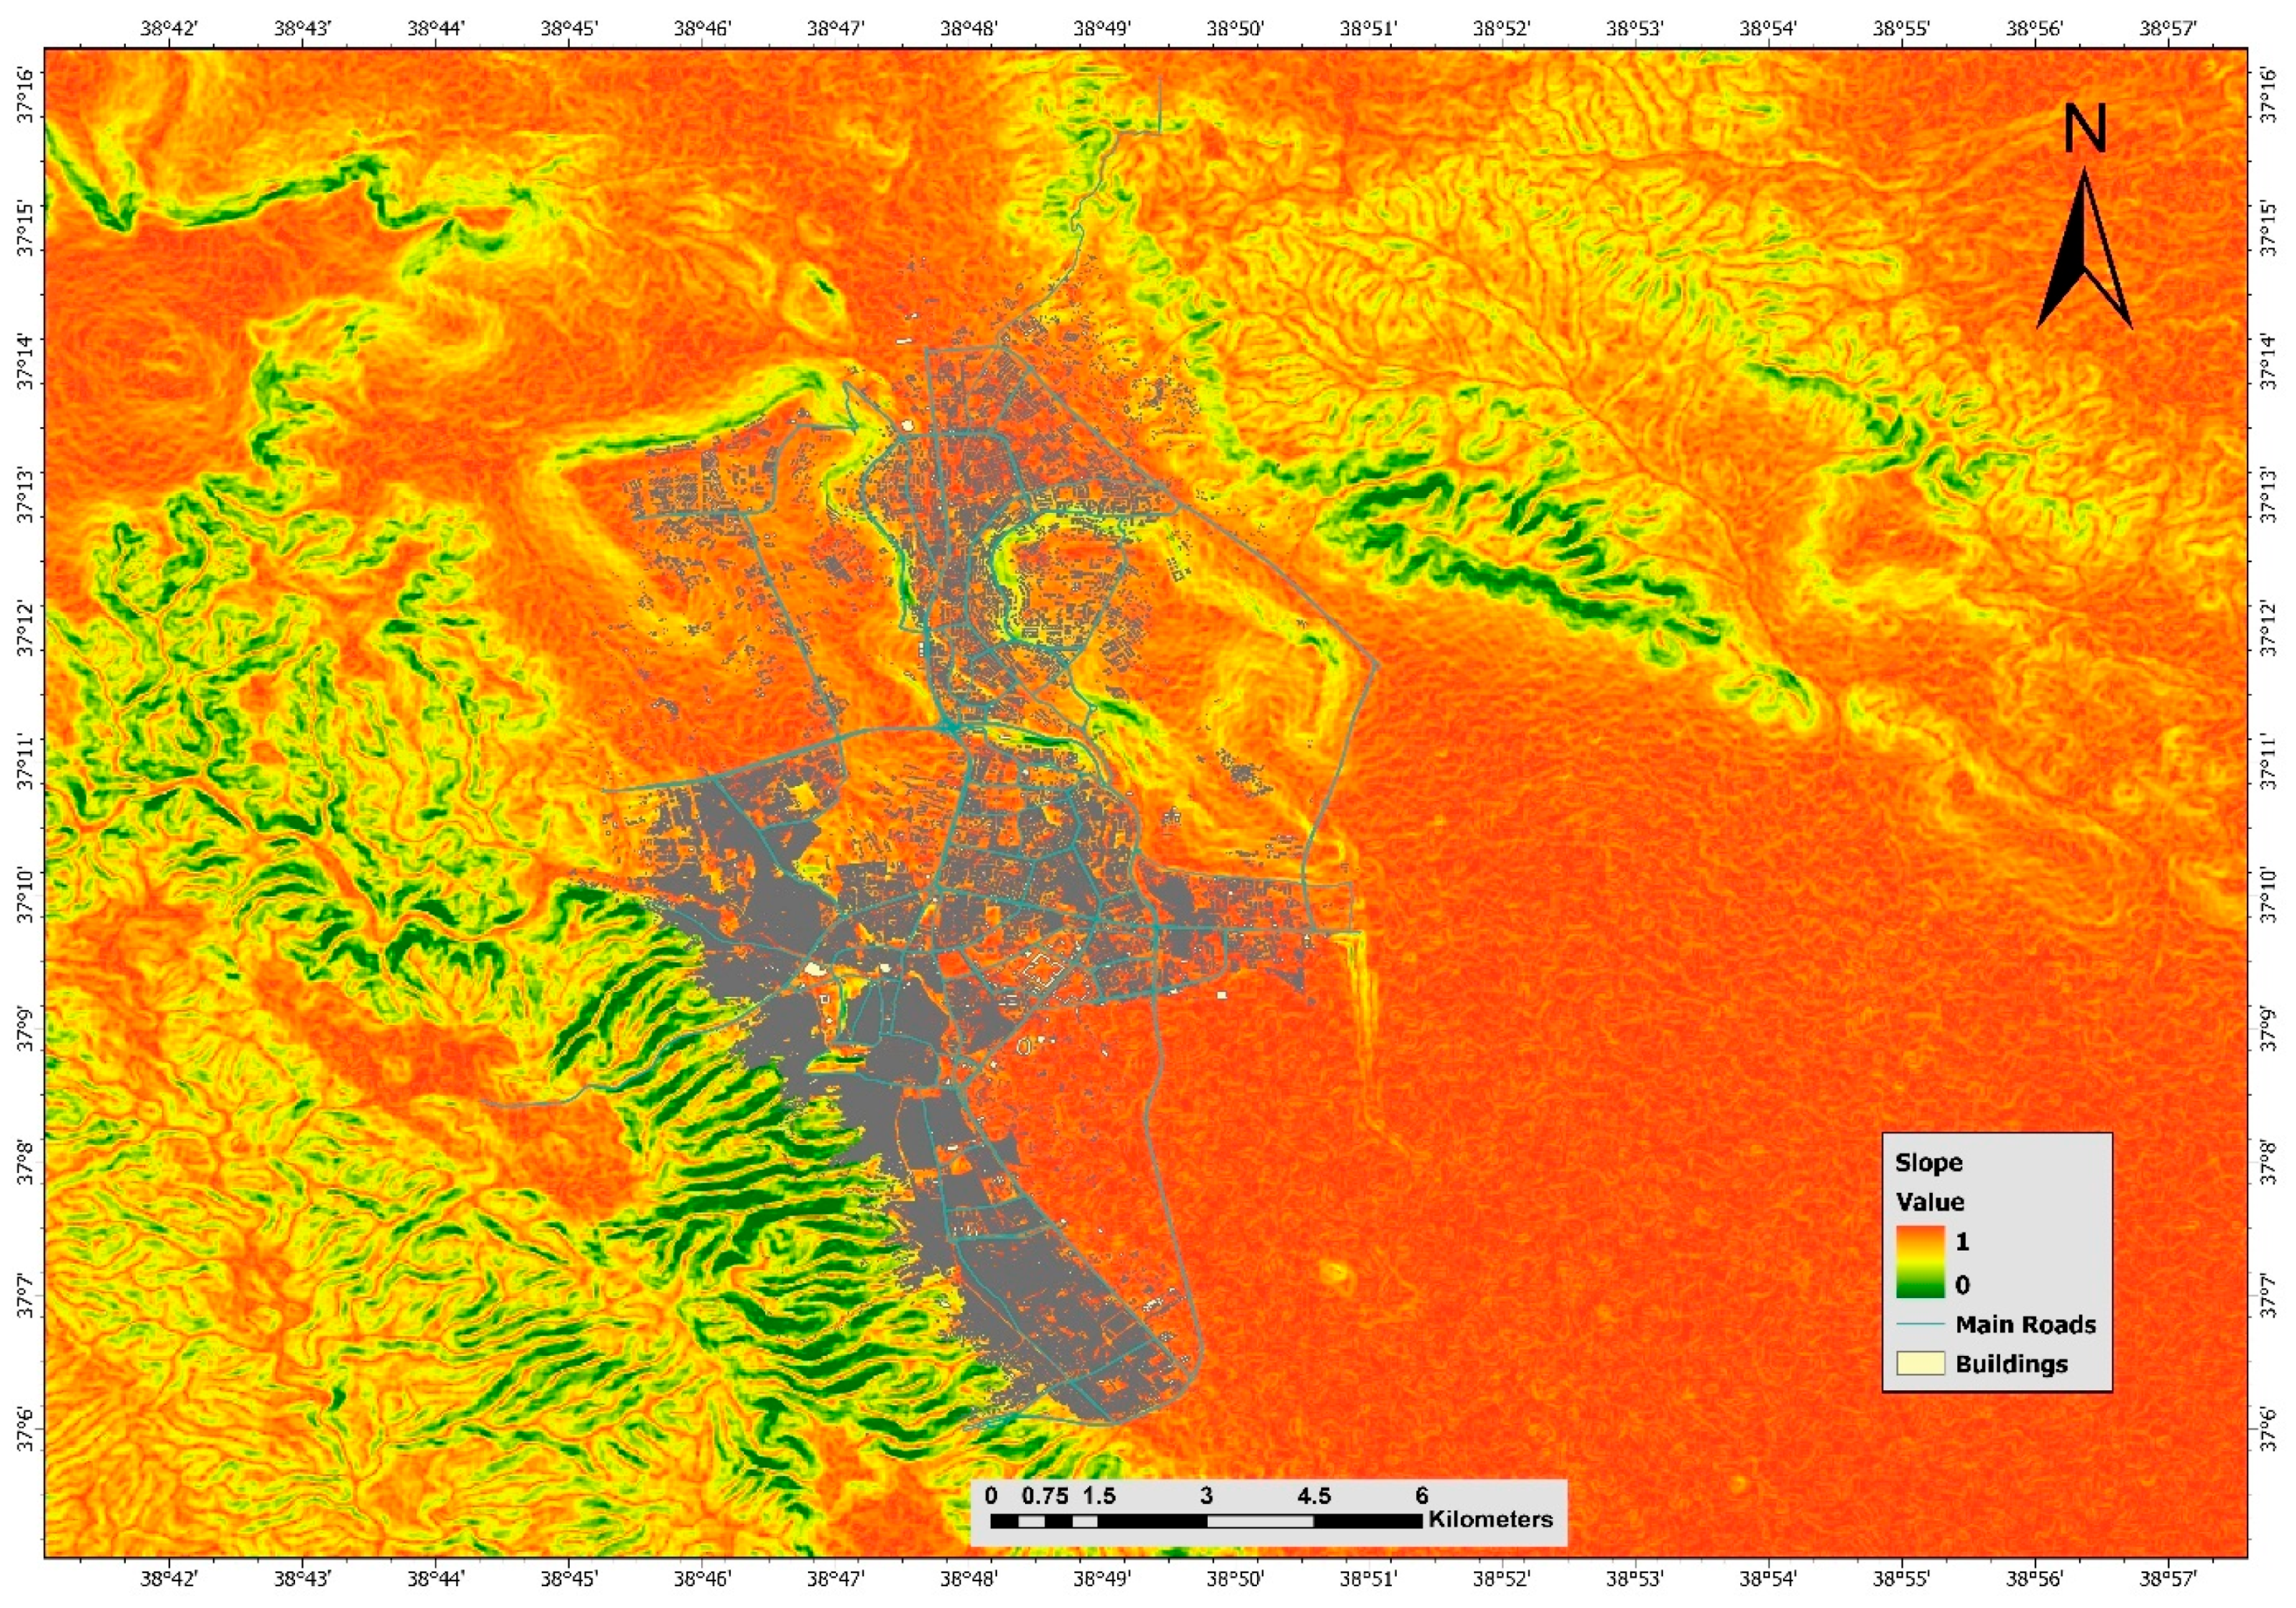
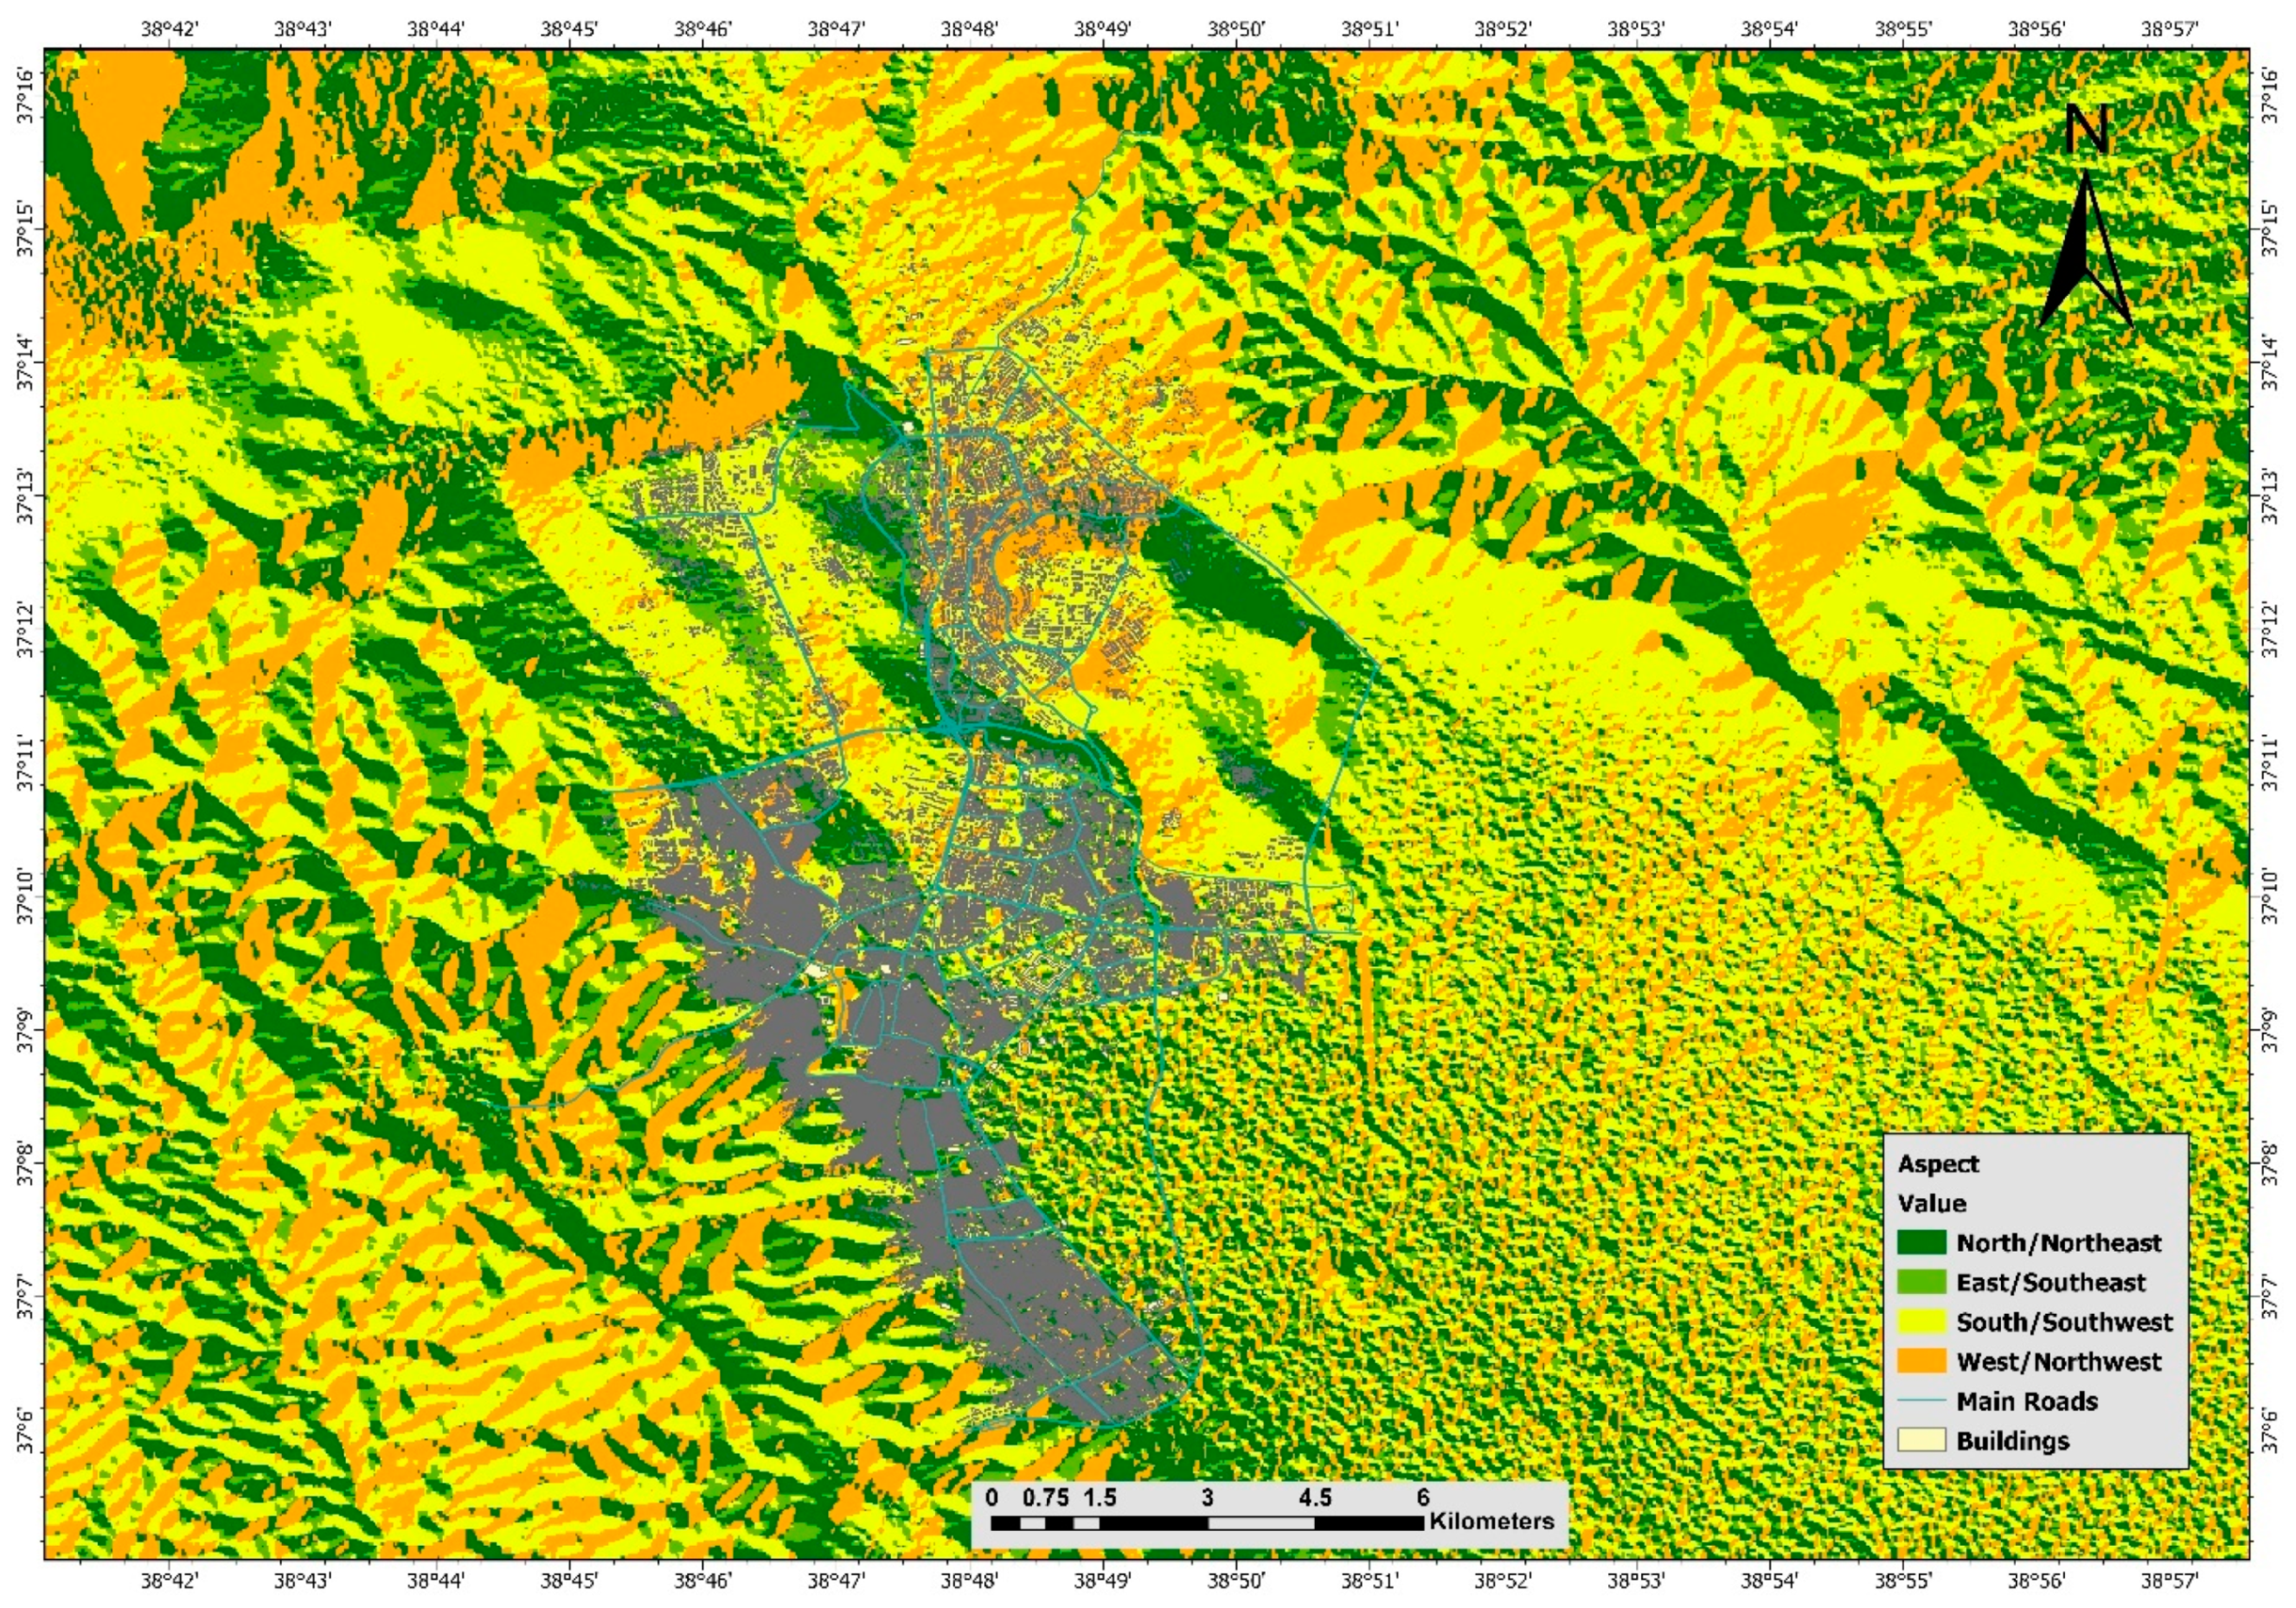
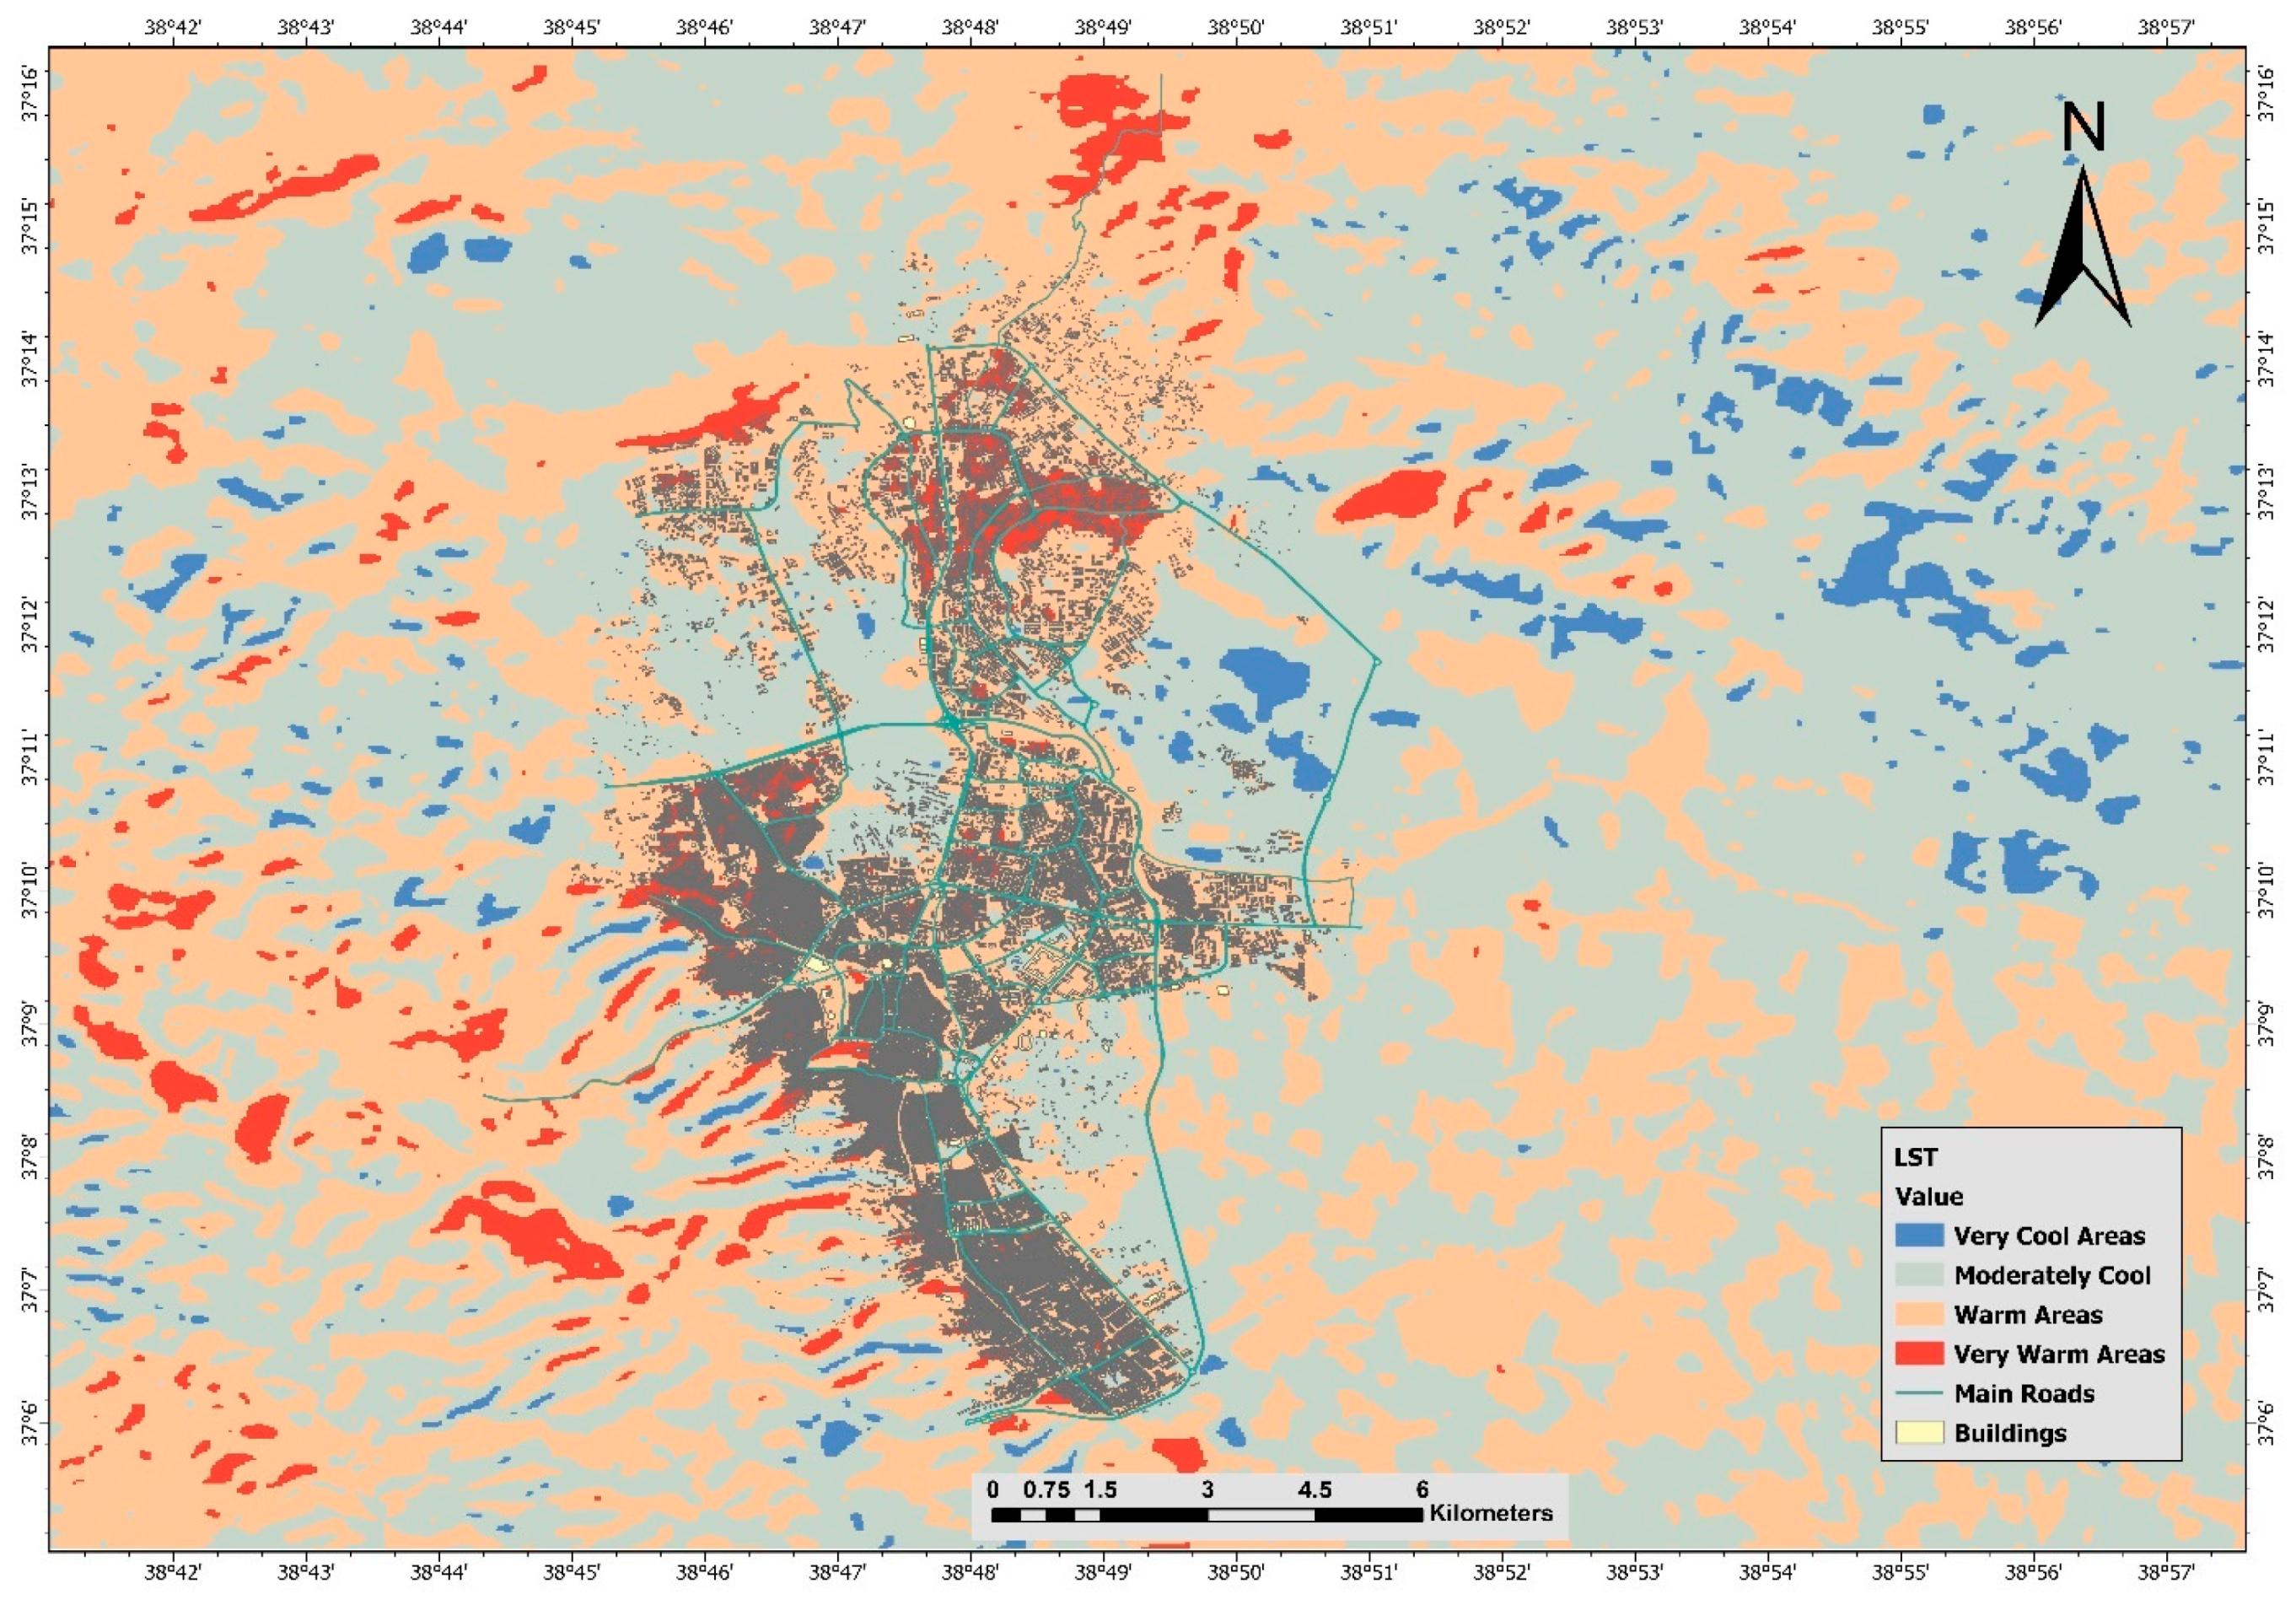
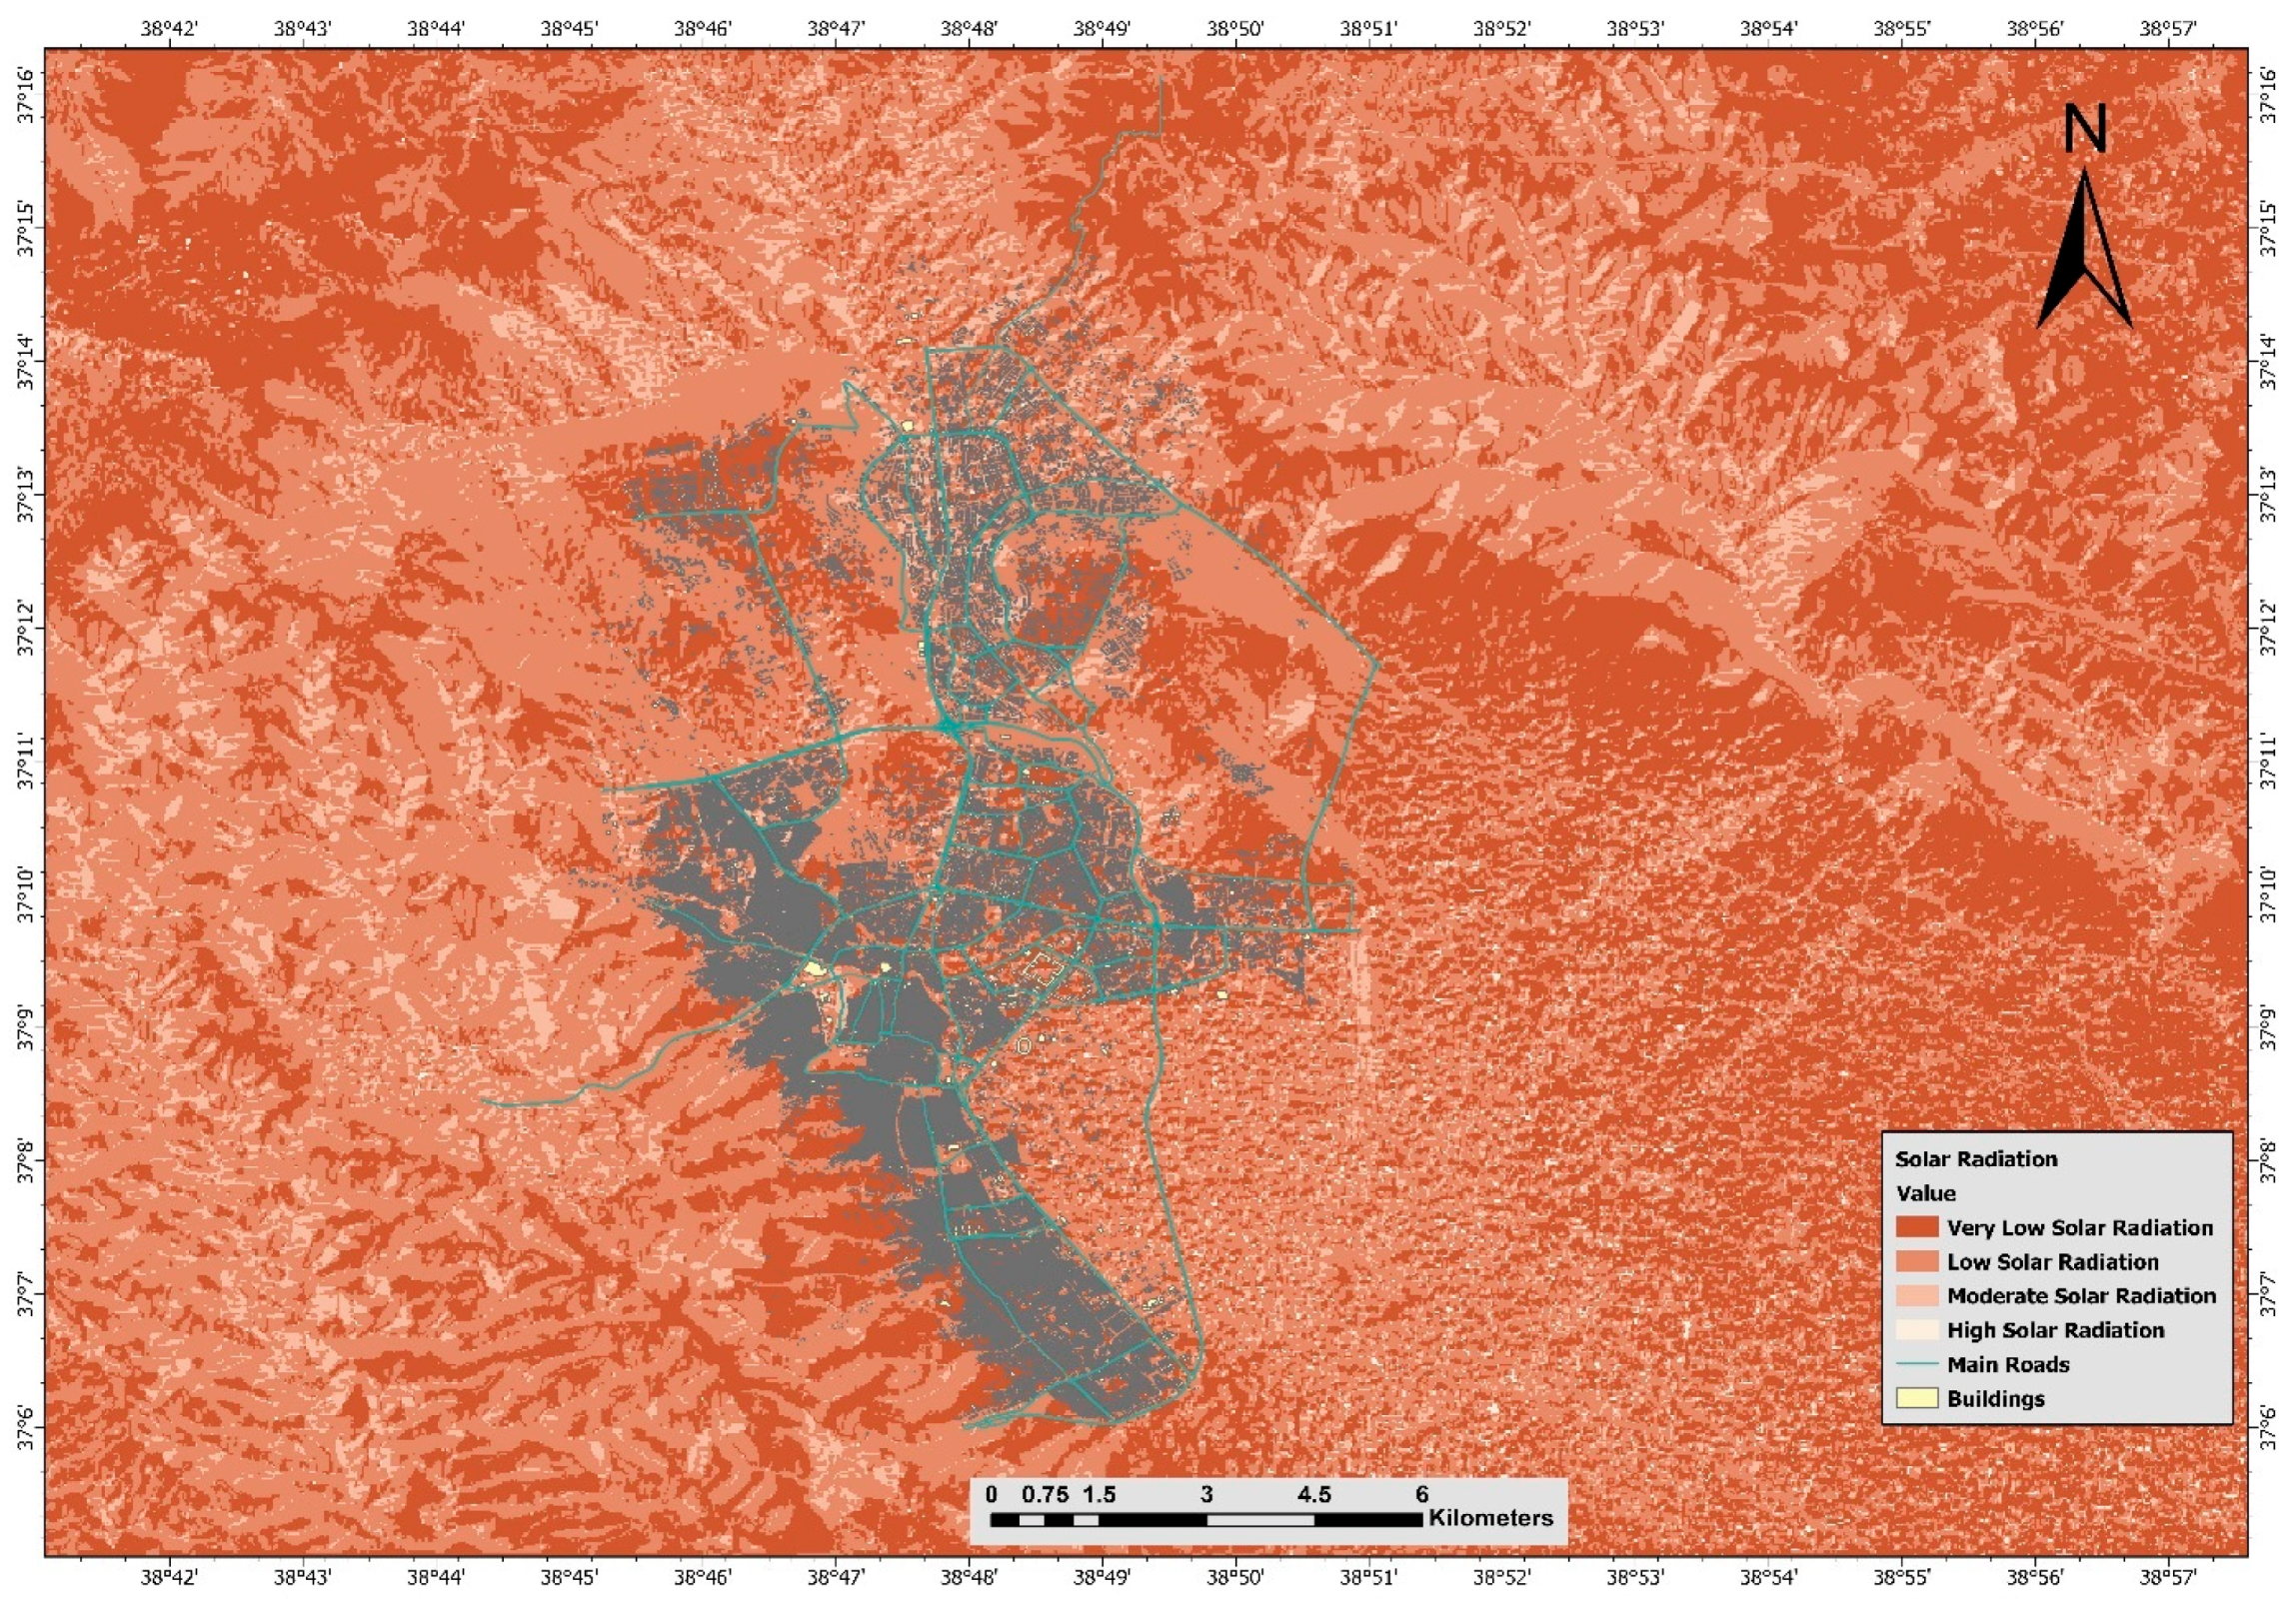
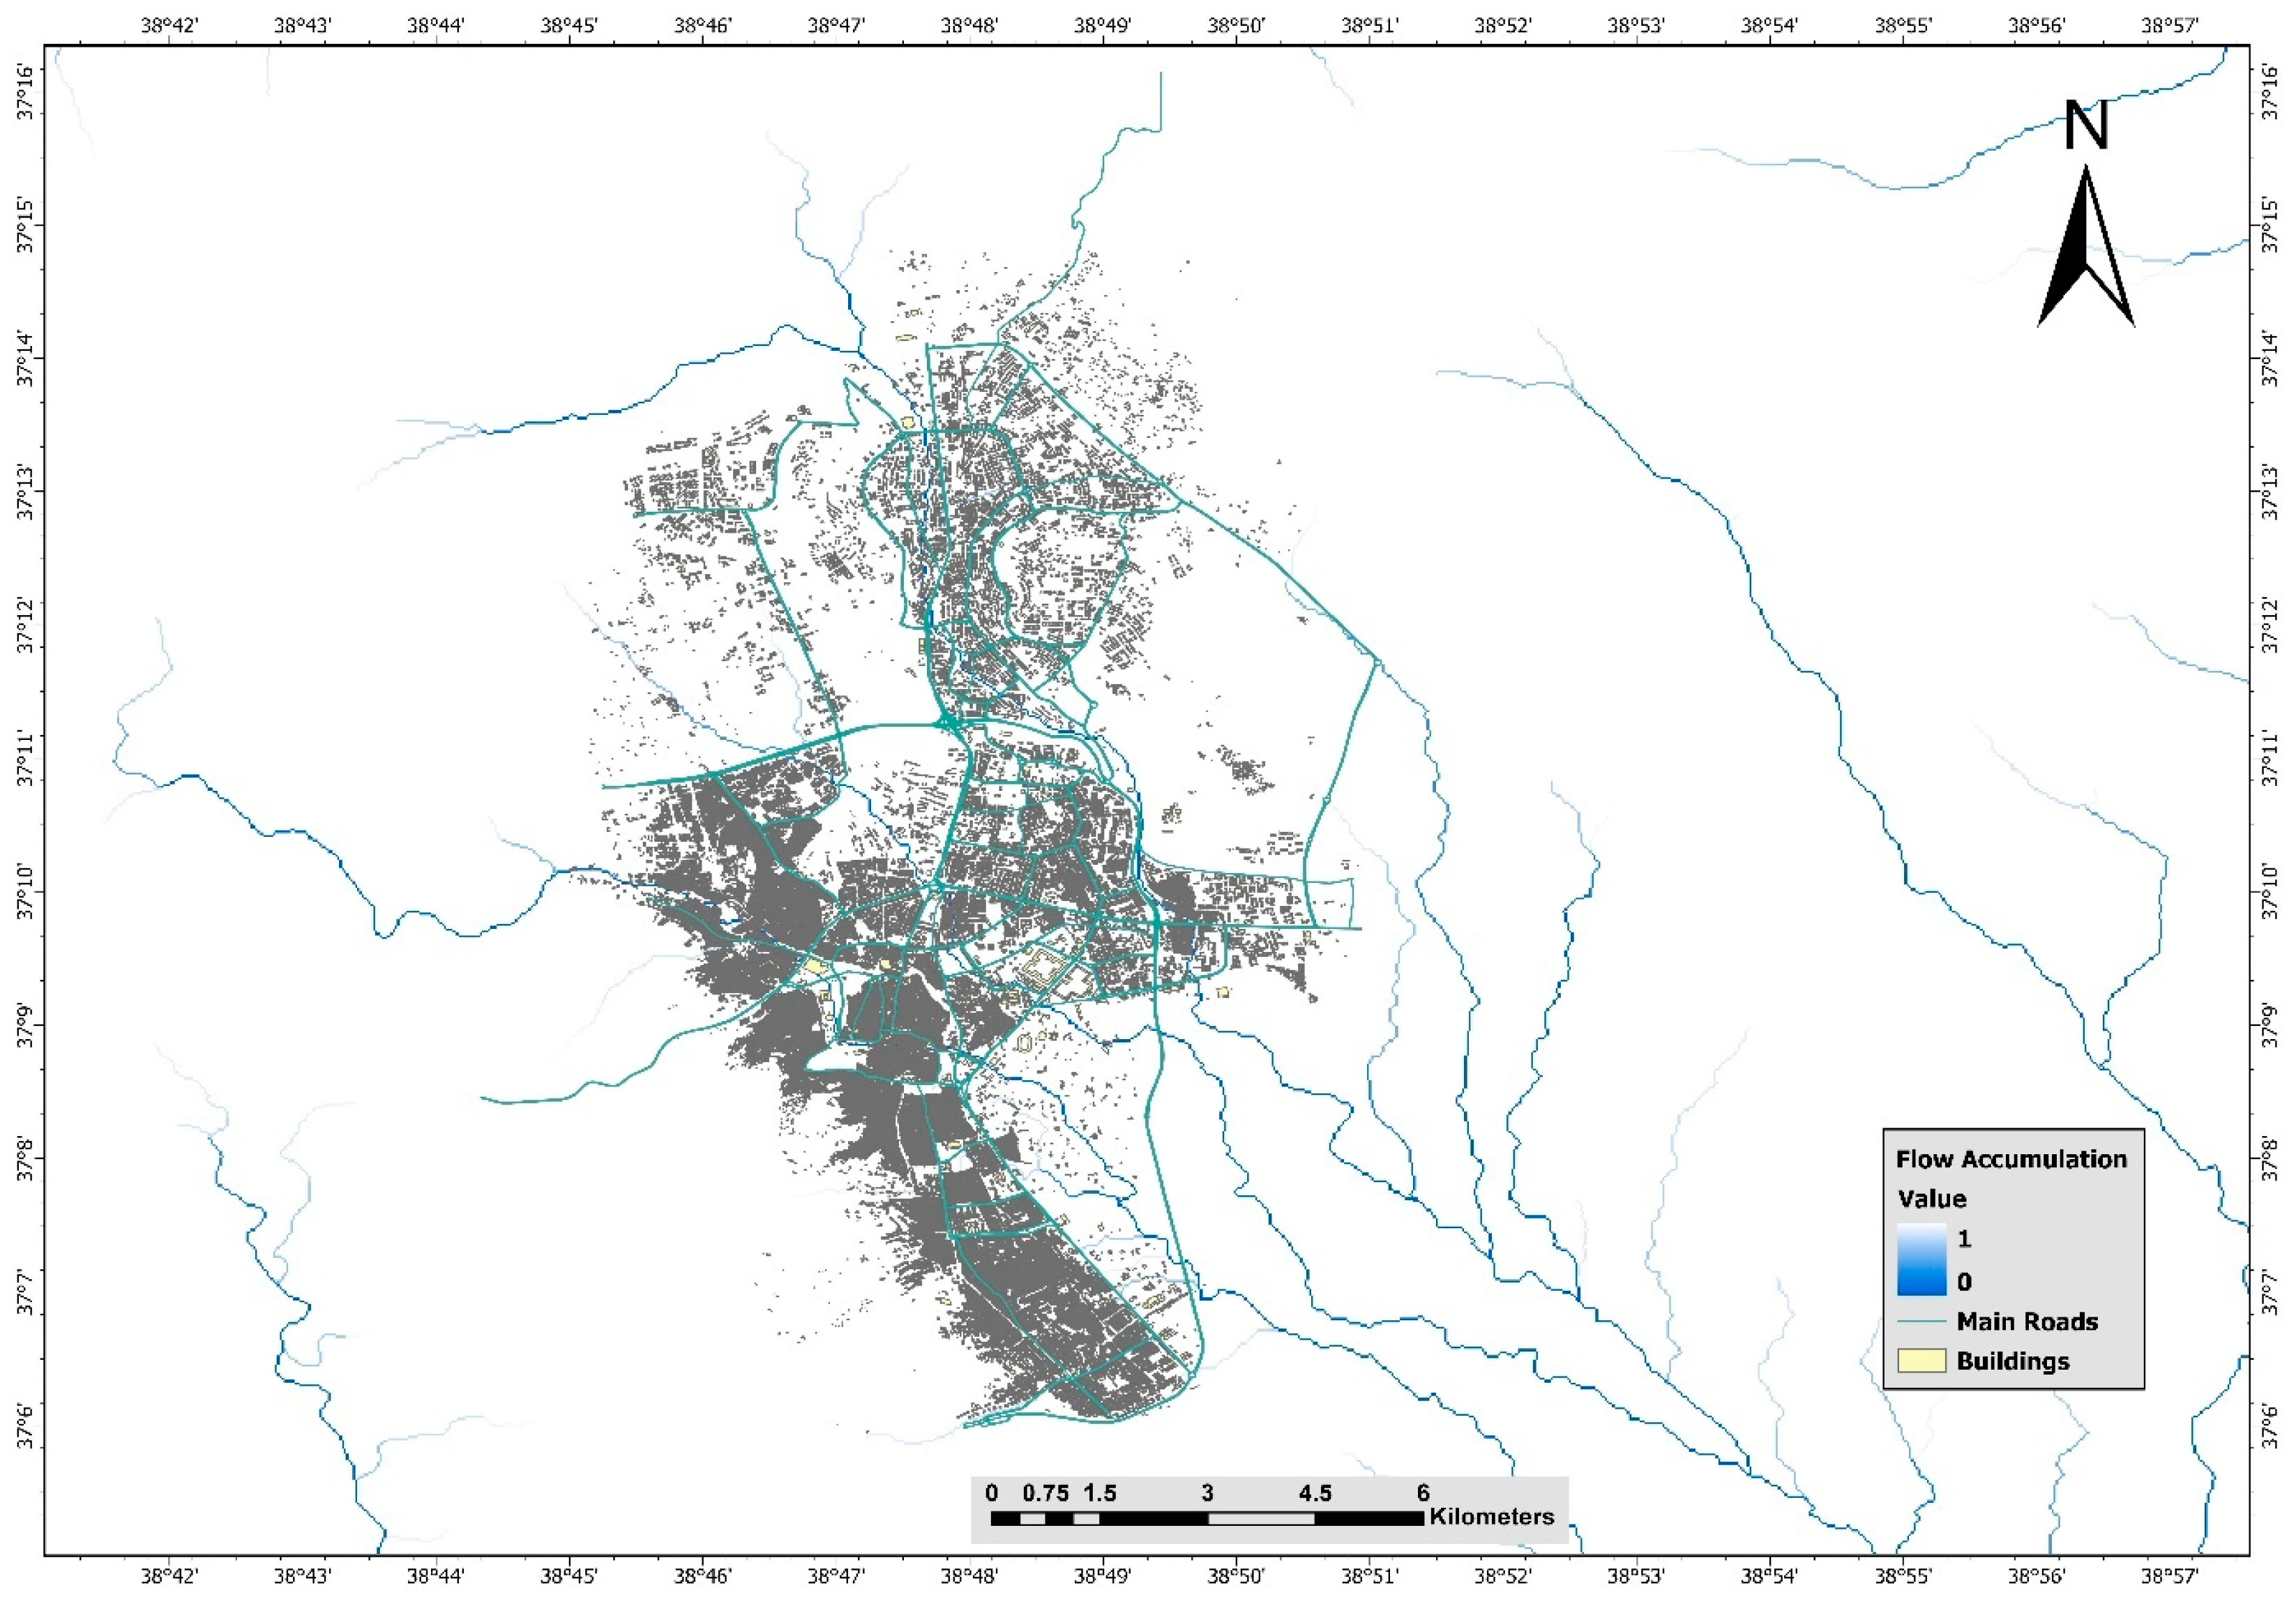
3.1. Spatial Patterns of Individual Criteria

Each contributing criterion was evaluated and mapped to assess its spatial distribution and potential influence on afforestation suitability. Each of these maps was normalized to a 0–1 scale and interpreted in the context of ecological suitability, urban logistics, and environmental thresholds. The analyses were conducted according to each criterion given in Table 1 and weighted in accordance with the values in Table 2.
Analysis of the slope is a critical factor in the domain of afforestation planning, especially in semi-arid urban cities. In such a context, factors related to accessibility, land stability, and soil erosion call for careful consideration. The current research made use of the following as the input for analysis of the slope: the 30 m resolution SRTM DEM, standardized to the 0–1 scale. The suitability map pinpointed lower values of the slope, since gently sloping regions are more suitable for the requirements of afforestation and long-term vegetation stability. As reflected in Figure 2, steep slopes, colored in green, are mainly positioned in the western and north-eastern peripheries, which correspond to eroding uplands and valleys. The regions include large gradient variations that tend to be not very suitable for afforestation because of limitations for planting and increased vulnerability to surface runoff and landslides. Gently sloping terrain (colored red and orange) consisting of the middle and the SE part of the area under investigation provide comparatively flat topography that is suitable for afforestation, infrastructure development, and maintenance accessibility.
However, in the specific context of Şanlıurfa, the suitability of gently sloping or flat terrain is often constrained by land use and property ownership. The vast majority of flatlands in the region are actively cultivated agricultural lands and are privately owned, limiting their availability for afforestation initiatives. Conversely, many of the rocky and moderately steep terrains—particularly those located on the periphery—are state-owned and not under active agricultural use. This institutional land ownership dynamic renders these areas more feasible and legally accessible for public afforestation projects, despite their relative physical challenges. Therefore, afforestation planning in Şanlıurfa must prioritize these topographically marginal but institutionally viable lands to ensure practical implementation.
The weight information of the AHP suggests that slope accounts for 13.8% of the overall suitability for afforestation score, which is a moderate contribution. The result agrees with outcomes obtained from studies elsewhere under Mediterranean, as well as semi-arid, conditions, in which the factor of the slope was recognized as a major physical limitation for land suitability modeling. Removing steep slopes from the area of the highest adaptability ensures ecological suitability as well as practicality for the proposed green infrastructure construction over Şanlıurfa.
Aspect, which denotes the direction a slope faces, is a crucial factor in vegetation dynamics, soil water-holding capacity, and microclimatic conditions, especially in semi-arid cities. Aspect values from the SRTM DEM were computed for this research and classified as four principal directional categories: north/northeast, east/southeast, south/southwest, and west/northwest. Northerly and easterly slopes would receive reduced direct radiation from the sun and maintain relatively more soil water-holding capacity, making them more suitable for planting in water-scarce areas like Şanlıurfa. Figure 3 shows that north- and east-facing slopes (green colors) are fairly distributed throughout the metropolitan center, particularly in the city’s north and east-facing hill slopes. These aspects are consistent with the suitability factors proposed for afforestation, with prospects for vegetation growth with lower evapotranspiration stress. In contrast, south- and west-facing slopes (orange hues) prevail in extensive areas of the periphery, especially in the western ridges and southeastern escarpments. These features are marked by increased solar radiation exposure and diminished water retention capacity, therefore impairing their viability in semi-arid environments.
The AHP weighting of the aspect was 10.6%, reflecting a moderate but definite contribution towards the general suitability model. The intensity and distribution of the aspect, combined with the slopes and the radiation, provide a good pointer towards microclimatic heterogeneity and the impact it will have on the process of afforestation. The aspect difference is particularly relevant in regions like Şanlıurfa, where maximum ecological productivity with minimal resources calls for carefully targeted schemes of afforestation.
The elevation distribution in the Şanlıurfa metropolitan area (Figure 4) indicates a notable altitudinal gradient from around 418 m to 952 m above sea level. The city center and its adjacent areas are primarily located in low to moderate elevation zones, although the outskirts, especially to the northeast and southwest, display higher altitudes. High elevation zones typically align with rough terrain, rendering them less conducive to afforestation due to restricted accessibility and possible limitations in terms of soil depth and moisture retention. Conversely, moderately elevated regions offer advantageous conditions for urban forestry initiatives, merging accessibility with positive microclimatic impacts, like enhanced ventilation and less likelihood of thermal inversion. The regions, mainly situated in the northern and southeastern peripheries of the city, are advised for prioritization in afforestation initiatives.
The LST map (Figure 5) categorizes the research area into five thermal zones—extremely cool, moderately cool, warm, and very warm—based on a Landsat 8 scene acquired in July 2024, representing peak summer conditions in Şanlıurfa. A pronounced urban heat island effect is observable, with densely constructed regions—especially in the central and southwestern districts—exhibiting the highest surface temperatures. In contrast, cooler zones appear primarily in the peripheral areas, associated with greater vegetation density or elevation-driven cooling. Although derived from a single-date snapshot, the timing corresponds to the climatically most critical period for thermal discomfort and ecological stress. From an afforestation perspective, prioritizing the warmest zones—particularly those lacking existing green infrastructure—can yield the greatest marginal cooling benefits. Targeted establishment of urban trees in these thermally stressed areas would significantly reduce surface temperatures, enhance thermal comfort, and mitigate public health risks linked to extreme heat events in Şanlıurfa’s semi-arid environment.
The solar radiation map (Figure 6) demonstrates that the entire research area experiences predominantly high to very high solar radiation levels, which is anticipated due to Şanlıurfa’s latitude and arid climate. Nonetheless, specific microclimatic differences are present. The most intense radiation zones are generally located on open, flat terrains with southern and southwestern orientations, whereas areas of reduced radiation are associated with shaded slopes or narrow valleys. Moderate to high sun radiation zones are optimal for afforestation, as they supply adequate energy for photosynthesis while preventing excessive evapotranspiration. Consequently, the central and southeastern peripheral regions, which benefit from abundant sunlight and accessibility, offer ideal circumstances for the establishment of sustainable urban forests.
Flow accumulation is a critical measure for distinguishing the regions prone to surface runoff and erosion. Analysis of the study area suggests that regions with high accumulation values are mainly concentrated along the natural water flow lines extending eastward and southeastward from the city center (Figure 7). These regions represent the natural water flow convergence and are thus not well suited for afforestation, because the soil would be liable to instability and enhanced erosion risks. Converse to this, regions with low values of flow accumulation (mostly in the north and south) are dominated by stable topography attributes, which make them suitable for long-term forest growth.
The land cover classification results, using Sentinel-2 imagery and deep learning techniques, clearly differentiate between metropolitan centers, agricultural land, and types of vegetation (Figure 8). To identify afforestation sites, existing forest patches, industrial areas, and cities were ruled out. The best prospects are zones defined as scrublands, open land with little or no vegetation cover, and mixed farm land, particularly adjacent to the existing city limits. These categories yield contiguous land units that are ecologically viable and logistically accessible, minimizing land conflicts and increasing reforesting prospects.
To spatially isolate zones that are functionally available for afforestation, a binary Urban Suitability Mask was derived from the classified LULC map. This mask identifies suitable (green) and unsuitable (red) areas by excluding permanent urban fabric, industrial zones, dense vegetation (e.g., forests), and water bodies, as shown in Figure 9. The mask guarantees that only ecologically and logistically viable zones are transmitted to the MCDA model, enhancing the decision framework by pre-filtering conflicting land use categories. This improves the geographical reality of the afforestation suitability evaluation and prevents overestimation in urban core regions where land use conversion is impracticable or restricted.
To evaluate the thematic reliability of the LULC classification, a confusion matrix–based accuracy assessment was conducted. Reference data were obtained from CORINE 2018 vector layers, visual interpretation of high-resolution satellite imagery, and manually annotated ground-truth points. The assessment was based on a stratified sampling approach covering all major land cover classes used in the classification process.
The model achieved an Overall Accuracy (OA) of 83.7% and a Kappa Coefficient (κ) of 0.81, indicating substantial agreement with the reference data. Class-specific accuracy values are presented in Figure 10, which summarizes five evaluation metrics—Precision, Recall, F1-score, Producer’s Accuracy (PA), and User’s Accuracy (UA)—for each of the 15 CORINE-based land cover categories.
The highest agreement was observed in Forest (PA: 91%, UA: 89%) and Arable Land (PA: 89%, UA: 87%). Classes with relatively lower performance included Artificial Vegetated Areas, Mine/Construction Sites, and Heterogeneous Agricultural Areas, with F1-scores ranging between 55% and 58%. These findings are consistent with reported challenges in distinguishing spectrally similar transitional land types using Sentinel-2 data.
To further validate the classification quality in zones of ecological interest, additional evaluation metrics were computed for afforestation-relevant categories. For example:
  • Scrublands: Precision = 76%, Recall = 71%, F1-score = 73%
  • Open Land with Little or No Vegetation: Precision = 81%, Recall = 78%, F1-score = 79%
  • Heterogeneous Agricultural Areas: Precision = 61%, Recall = 56%, F1-score = 58%
These results confirm that the deep learning-based classification provided a reliable thematic foundation for integration into the afforestation suitability model. While certain semi-natural or mixed-use classes exhibited moderate class confusion, the overall classification performance was sufficient for spatial decision-making and ecological planning.
Proximity to highways is necessary for efficient forest maintenance, management, fire control, and accessibility for planting. However, areas near major roads might be subject to pollution, encroachment, or edge effect. As such, locations at a moderate distance from major roads are preferable to balance accessibility with integrity. Urban buildings, meanwhile, tend to enhance the urban heat island effect and limit spatial access. Proximity analysis ensures that proposed locations for afforestation are placed in buffer zones that are far enough away to provide micro-climatological advantages to cities and are also close enough to avoid conflicts with the infrastructure of the city. This balance enhances delivery of ecosystem services in a manner which also alleviates encroachment issues.

3.2. Multi-Criteria Decision Analysis Results

The MCDA results indicate that approximately 192.06 km2 of the study area is deemed acceptable for afforestation, while an additional 151.33 km2 is classified as highly suitable. These areas mostly include transitional and peri-urban zones characterized by ecological sustainability, moderate elevation, and adequate infrastructure access. These zones collectively represent a substantial portion of the region appropriate for climate-resilient greening activities.
The MCDA suitability map, created through the weighted overlay of normalized thematic criteria, illustrates specific spatial patterns of afforestation suitability throughout the research region (Figure 11). The optimal regions are predominantly located along the north-northeastern and southeastern elevation corridors. These regions are distinguished by their favorable aspect orientation and moderate elevation, which enhances natural ventilation. This is a particularly salient benefit in Şanlıurfa’s arid climate. These regions are typically situated in the downwind direction of dominant northwesterly breezes, thereby facilitating pollutant dispersion and rendering them conducive to strategic afforestation. The topography of these regions boasts a balanced blend of gentle slopes and moderate sunlight, thereby enhancing agricultural viability and expansion prospects. These zones correspond to undeveloped buffer areas adjacent to expanding residential sectors, where afforestation of these areas could function as an ecological buffer, thereby mitigating heat stress and enhancing urban livability.
The map categorizes the area into four suitability classifications––unsuitable, moderately suitable, suitable, and highly suitable––thereby facilitating decision-making for urban forest site distribution. A significant segment of the urban periphery, especially in the southeast and northeast quadrants, demonstrates high suitability (indicated by dark green areas), signifying locations where optimal combinations of slope, aspect, moderate solar radiation, appropriate elevation ranges, and proximity to dense urban infrastructure intersect. These areas are defined by non-urbanized terrains that provide ecological benefits and practical accessibility, rendering them appropriate for afforestation initiatives.
In contrast, the central urban core and its adjacent buffer zones are primarily designated as unsuitable (red regions), mainly due to extensive impervious surface coverage, inadequate land cover suitability (urban/industrial land classifications), and limited buffering from existing structures and traffic networks. This spatial trend corresponds strongly with urban expansion patterns, where increased land sealing, road density, and built-up coverage create unsuitable thermal and logistical conditions for afforestation. The western fringe has undergone rapid urbanization over the last two decades, as evidenced by elevated LST values and fragmented green spaces. This urbanization trend highlights the necessity of planning for peripheral afforestation, especially in areas anticipated for future growth according to the city’s metropolitan development plan.
In contrast, areas with steep slopes on the western and southern escarpments show reduced suitability, highlighting the relationship between topographical limitations and erosion risks, as indicated by flow accumulation metrics. Areas classified as fairly acceptable or adequate (yellow to light green) generally appear as transitional zones surrounding the metropolitan boundary. These regions may demonstrate afforestation potential dependent on minimal interventions, such as soil restoration or the mitigation of minor accessibility barriers. The regional distribution of suitability demonstrates coherent alignment with the weighted criterion framework. Within this framework, land surface temperature and slope substantially influence the results. The MCDA results clearly identify climate-resilient and logistically accessible areas for afforestation planning, thereby facilitating sustainable urban greening initiatives in semi-arid urban settings such as Şanlıurfa.

4. Discussion

The inclusion of topographic, meteorological, infrastructural, and land cover factors within a GIS-based MCDA framework has yielded a methodologically rigorous analysis of future afforestation sites in Şanlıurfa, a rapidly growing semi-arid city in the southeastern part of Türkiye. The results emphasize the importance of spatial decision support systems in guiding ecological initiatives in the city, particularly in climatically vulnerable and growing regions. The incorporation of a land cover-based suitability mask enhances the practical viability of spatial afforestation modeling. Although core metropolitan locations may exhibit topographic and thermal appropriateness, land use restrictions frequently render them unsuitable for intervention. This classification underscores the necessity of integrated land governance and urban planning frameworks that emphasize afforestation in legally and physically accessible areas.
The significance of appropriately designated regions in the northeastern and southeastern fringes of the city border underscores the influence of topographic factors on land suitability. Northern and eastern slopes possess microclimatic benefits, characterized by less solar exposure and lower surface temperatures, corroborating prior ecological findings regarding tree survival in arid environments. In addition, flow accumulation information allowed for the removal of the erosion-prone zones, which is critical for the planning of sustainable green infrastructure for cities.
Additionally, the inclusion of both aspect and solar radiation as separate variables in the MCDA framework was based on their distinct yet complementary influence on site microclimate. While north- and east-facing slopes typically receive reduced solar input and retain more moisture—enhancing tree survival—solar radiation quantifies total energy load irrespective of slope direction. Despite potential correlation, these variables provide independent insights into thermal exposure and ecological stress. However, future versions of the model may benefit from further sensitivity testing to evaluate the impact of omitting one of these factors or combining them into a unified solar exposure index.
These findings are consistent with prior studies conducted in other semi-arid cities, such as Addis Ababa [56] and Tehran [25], where slope, land cover, and accessibility emerged as principal suitability determinants. However, unlike some previous efforts that relied exclusively on NDVI or coarse land classification datasets (e.g., CORINE), the present study employs a deep learning-based land cover approach that improves spatial granularity and urban-scale relevance. This distinction enhances the credibility of the model in fine-resolution planning contexts and reduces uncertainty associated with conventional pre-classified datasets.
The implementation of deep learning-based land cover classification has led to substantial enhancements in the spatial accuracy, thematic detail level, and ecological relevance of the MCDA framework. In contrast to conventional datasets, such as CORINE or NDVI-derived indices, which frequently exhibit inadequate resolution or an inability to capture urban heterogeneity, the applied model employs high-resolution Sentinel-2 imagery and semantic segmentation techniques to differentiate nuanced land cover classes. This has enhanced the land cover suitability mask by facilitating the precise identification and exclusion of unsuitable areas, such as impervious surfaces, industrial areas, and existing dense vegetation. The MCDA approach enhances the interpretability and field applicability of the afforestation suitability model by focusing exclusively on ecologically and logistically suitable areas. The incorporation of deep learning classification into the methodological framework enhances its robustness by more effectively aligning with the inherent complexity of real-world urban environments, particularly in transition zones.
Notwithstanding the strong methodological integration, the work has several limitations. Initially, land ownership and administrative zoning were excluded, potentially restricting the immediate applicability of certain highly appropriate places due to legal or bureaucratic limitations. The land cover classification and surface indices relied on a single-season image composite, potentially overlooking seasonal variations and multi-year trends. Third, ground-truth data for validation of LST and land cover classification were unavailable, which limits field-level verification. Future studies should incorporate socio-institutional layers, time-series classification, and participatory validation frameworks.
Another limitation of the current framework is the absence of formal uncertainty or sensitivity analysis regarding the MCDA weightings. While the AHP matrix yielded a CR well below the acceptable threshold (0.044), no additional testing was performed to assess how variations in weights or the exclusion of potentially correlated criteria—such as aspect and solar radiation—might impact the final suitability map. Future studies should consider incorporating scenario-based sensitivity analysis or Monte Carlo simulations to evaluate model robustness. Moreover, although soil characteristics such as depth, fertility, and texture are highly relevant to afforestation planning, spatially consistent soil datasets were not available for the study area at the required resolution. Integrating such data in future work could substantially improve the ecological validity of suitability assessments.
In addition to future sensitivity analyses, spatial generalization of the final suitability map (like we used in this study) could be improved through interpolation-based smoothing. A potential enhancement involves converting raster suitability outputs into point features and applying Inverse Distance Weighting (IDW) to produce a continuous, generalized surface. This approach mitigates classification noise, highlights broader suitability trends, and facilitates more intuitive interpretation by planners and stakeholders. The smoothed surface would be particularly useful for communicating spatial strategies in public presentations or policy planning documents, where pixel-level variability may obscure overall patterns.
The poor suitability values for densely developed regions and steep slopes confirm the spatial limitations of cities and validate the need for strategic afforestation in transitional or boundary conditions. The relatively poor suitability of regions with sufficient biophysical conditions but close distances from cities also highlights the necessity of exclusion by closeness in suitability modeling for cities.
Furthermore, although the existing suitability model provides an accurate representation, the long-term viability of these regions under anticipated climate change scenarios is still questionable. Due to projected rises in temperature and extreme heat occurrences in southeastern Türkiye [2,37], certain now-suitable areas may become less viable as a result of modified moisture balance or heightened evapotranspiration. Consequently, integrating dynamic modeling frameworks, such as climate-adjusted land surface temperature estimates or long-term land degradation indices, into future research will be crucial for resilience-oriented planning.
In addition to identifying spatially suitable areas for afforestation, practical implementation also requires careful selection of tree species that are ecologically compatible with local site conditions. Different zones identified on the suitability map—such as highly suitable, moderately suitable, and low suitability areas—present distinct challenges related to elevation, heat exposure, water availability, and soil structure. Based on regional afforestation practices and the ecological literature, certain native and drought-tolerant species are well-adapted to Şanlıurfa’s semi-arid conditions. In highly suitable zones with moderate elevation and lower land surface temperature, species such as Pinus brutia (Turkish red pine), Quercus calliprinos (Palestine oak), Ceratonia siliqua (carob), and Morus alba (white mulberry) may thrive. Moderately suitable areas, which experience more solar exposure or slightly degraded conditions, may support species like Olea europaea (olive), Robinia pseudoacacia (black locust), and Ailanthus altissima (tree of heaven) for rapid canopy formation, where appropriate. In low suitability areas, particularly near urban fringes or zones with limited ecological resilience, smaller drought-tolerant species such as Albizia julibrissin (silk tree), Tamarix spp., and xerophytic shrubs like Pistacia lentiscus and Capparis spinosa may provide viable alternatives. These recommendations are intended to guide species selection in alignment with microclimatic constraints and urban ecological goals, promoting long-term resilience and maintenance efficiency.
These results complement the existing evidence towards the application of data-driven urban forestry planning in semi-arid cities, particularly in regions with constricted green space that exacerbates the impact of the urban heat island. The outlined process can be replicated in other cities with similar morphology and climatic conditions, particularly in situations with a focus on spatial justice in green infrastructure.

5. Conclusions

This study offers a multi-criteria, spatially explicit evaluation of afforestation appropriateness in Şanlıurfa, utilizing geospatial datasets related to topography, thermal conditions, hydrology, and land cover within a GIS-based MCDA framework. The findings indicate that areas with moderate topography, gentle slopes, a north/east aspect, and moderate land surface temperature are appropriate locations for future urban forest development. This research highlights the effectiveness of afforestation in mitigating the spatial effects of the urban heat island effect, improving microclimatic comfort, and strengthening landscape resilience in semi-arid areas.
In particular, the analysis identified approximately 192.06 km2 as suitable and 151.33 km2 as highly suitable for afforestation, together comprising over 43% of the study area. These high-priority zones are primarily concentrated in the northeastern and southeastern peripheries, where state-owned lands offer both institutional feasibility and environmental compatibility for afforestation.
The methodological approach utilized is not site-specific and can be easily adapted to other semi-arid urban regions with comparable climatic challenges and urbanization trends. The use of open-access satellite imagery, objective criteria weighting, and spatial normalization enhances the adaptability of this model for planners and policymakers in cities across North Africa, the Middle East, and parts of Central Asia.
Anticipated urban expansion and climate challenges in the region necessitate a proposed technique that facilitates proactive urban design, using green infrastructure as both a functional and ecological imperative. This research does not depict every criterion; nonetheless, the analytical rigor of the MCDA output and the methodological clarity provide a reproducible foundation for sustainable land-use planning.
Future research should explore the integration of socio-economic and demographic factors, such as population density, income levels, and environmental justice metrics, to better align afforestation efforts with community needs. In addition, ground-truthing of satellite-based outputs is necessary to validate classification accuracy and improve the reliability of thematic layers. Incorporating climate change projections, particularly long-term surface temperature and precipitation models, would further improve the temporal sustainability and resilience of the suitability framework.

Author Contributions

Conceptualization, A.U. and H.İ.Ş.; methodology, A.Y.Y. and H.İ.Ş.; software, A.Y.Y. and H.İ.Ş.; validation, A.Y.Y. and H.İ.Ş.; formal analysis, A.Y.Y. and A.U.; investigation, A.Y.Y. and H.İ.Ş.; resources, A.U. and H.İ.Ş.; data curation, A.Y.Y. and H.İ.Ş.; writing—original draft preparation, A.Y.Y. and H.İ.Ş.; writing—review and editing, A.Y.Y., A.U. and H.İ.Ş.; visualization, A.Y.Y. and H.İ.Ş.; supervision, A.U. and H.İ.Ş. All authors have read and agreed to the published version of the manuscript.

Funding

This research received no external funding.

Data Availability Statement

The datasets used and analyzed in this study are publicly available. Sentinel-2 data were obtained from the Copernicus Open Access Hub (https://dataspace.copernicus.eu/ (accessed on 24 May 2025)), Landsat 8 and 9 data were provided by the United States Geological Survey (USGS) via EarthExplorer (https://earthexplorer.usgs.gov/ (accessed on 26 May 2025)), and OpenStreetMap vector data were accessed from https://www.openstreetmap.org. No new data were generated during this study.

Acknowledgments

The authors would like to express their sincere gratitude to the European Space Agency (ESA) for providing free access to Sentinel-2 satellite imagery and to the United States Geological Survey (USGS) for the availability of Landsat 8 and Landsat 9 datasets. We also acknowledge the OpenStreetMap (OSM) community for offering openly accessible vector data that contributed significantly to the spatial analyses in this study.

Conflicts of Interest

The authors declare no conflicts of interest.

References

  1. Pamukcu-Albers, P.; Ugolini, F.; La Rosa, D.; Grădinaru, S.R.; Azevedo, J.C.; Wu, J. Building green infrastructure to enhance urban resilience to climate change and pandemics. Landsc. Ecol. 2021, 36, 665–673. [Google Scholar] [CrossRef] [PubMed]
  2. Yu, H.; Zahidi, I.; Fai, C.M. Mitigating Urban Heat Islands (UHI) Through Vegetation Restoration: Insights From Mining Communities. Glob. Chall. 2025, 9, 2400288. [Google Scholar] [CrossRef]
  3. Shen, X.; Chen, M.; Li, X.; Gao, S.; Yang, Q.; Wen, Y.; Sun, Q. Advancing climate resilience through a geo-design framework: Strengthening urban and community forestry for sustainable environmental design. J. For. Res. 2024, 35, 117. [Google Scholar] [CrossRef]
  4. Sharma, G.; Morgenroth, J.; Richards, D.R.; Ye, N. Advancing urban forest and ecosystem service assessment through the integration of remote sensing and i-Tree Eco: A systematic review. Urban For. Urban Green. 2025, 81, 128659. [Google Scholar] [CrossRef]
  5. Yin, S.; Chen, W.Y.; Liu, C. Urban forests as a strategy for transforming towards healthy cities. Urban For. Urban Green. 2023, 81, 127871. [Google Scholar] [CrossRef]
  6. Singh, H. Urban Forests, Climate Change and Environmental Pollution: Physio-Biochemical and Molecular Perspectives to Enhance Urban Resilience; Springer Nature: Cham, Switzerland, 2024. [Google Scholar]
  7. Wolf, K.L.; Lam, S.T.; McKeen, J.K.; Richardson, G.R.; van Den Bosch, M.; Bardekjian, A.C. Urban trees and human health: A scoping review. Int. J. Environ. Res. Public Health 2020, 17, 4371. [Google Scholar] [CrossRef]
  8. Liang, D.; Huang, G. Influence of urban tree traits on their ecosystem services: A literature review. Land 2023, 12, 1699. [Google Scholar] [CrossRef]
  9. Cardinali, M.; Beenackers, M.A.; Fleury-Bahi, G.; Bodénan, P.; Petrova, M.T.; van Timmeren, A.; Pottgiesser, U. Examining green space characteristics for social cohesion and mental health outcomes: A sensitivity analysis in four European cities. Urban For. Urban Green. 2024, 93, 128230. [Google Scholar] [CrossRef]
  10. Wilson, B.; Neale, C.; Roe, J. Urban green space access, social cohesion, and mental health outcomes before and during Covid-19. Cities 2024, 152, 105173. [Google Scholar] [CrossRef]
  11. Xu, Z.; Marini, S.; Mauro, M.; Maietta Latessa, P.; Grigoletto, A.; Toselli, S. Associations Between Urban Green Space Quality and Mental Wellbeing: Systematic Review. Land 2025, 14, 381. [Google Scholar] [CrossRef]
  12. Russo, A.; Escobedo, F.J.; Cirella, G.T.; Zerbe, S. Edible green infrastructure: An approach and review of provisioning ecosystem services and disservices in urban environments. Agric. Ecosyst. Environ. 2017, 242, 53–66. [Google Scholar] [CrossRef]
  13. Simath, S.; Emmanuel, R.; Aarrevaara, E. Sustainable Urban Heat Risk Resilience: Lessons on Opportunities and Barriers to Action from Colombo, Sri Lanka. Sustainability 2024, 16, 9488. [Google Scholar] [CrossRef]
  14. Alikhanova, S.; Bull, J.W. Review of nature-based solutions in dryland ecosystems: The aral sea case study. Environ. Manag. 2023, 72, 457–472. [Google Scholar] [CrossRef]
  15. Xie, X.; Zhao, W.; Yin, G.; Fu, H.; Wang, X. Divergent ecological restoration driven by afforestation along the North and south banks of the Yarlung Zangbo middle reach. Land Degrad. Dev. 2025, 36, 521–532. [Google Scholar] [CrossRef]
  16. Olgun, R.; Cheng, C.; Coseo, P. Nature-based solutions scenario planning for climate change adaptation in arid and semi-arid regions. Land 2024, 13, 1464. [Google Scholar] [CrossRef]
  17. Resemini, R.; Geroldi, C.; Capotorti, G.; De Toni, A.; Parisi, F.; De Sanctis, M.; Cabai, T.; Rossini, M.; Vignali, L.; Poli, M.U.; et al. Building Greener Cities Together: Urban Afforestation Requires Multiple Skills to Address Social, Ecological, and Climate Challenges. Plants 2025, 14, 404. [Google Scholar] [CrossRef] [PubMed]
  18. Kiberet, B.; Nebere, A.; Workineh, B.A.; Jothimani, M. Integrating geospatial technologies and AHP for optimal urban green space development: A case study of Gondar, Ethiopia. Discov. Sustain. 2025, 6, 303. [Google Scholar] [CrossRef]
  19. Zhao, Y.; Wang, Z.; Lin, Y.; Jing, R.; Wang, Z.; Liu, X. GIS-Based Suitability Assessment for the Ecological Restoration of Oyster Reefs: A Case Study of the Tianjin Coast in Bohai Bay. Sustainability 2025, 17, 4759. [Google Scholar] [CrossRef]
  20. Prodromou, M.; Gitas, I.; Mettas, C.; Tzouvaras, M.; Themistocleous, K.; Konstantinidis, A.; Pamboris, A.; Hadjimitsis, D. Remote-Sensing-Based Prioritization of Post-Fire Restoration Actions in Mediterranean Ecosystems: A Case Study in Cyprus. Remote Sens. 2025, 17, 1269. [Google Scholar] [CrossRef]
  21. Wang, R.; Sun, Y.; Zong, J.; Wang, Y.; Cao, X.; Wang, Y.; Cheng, X.; Zhang, W. Remote Sensing Application in Ecological Restoration Monitoring: A Systematic Review. Remote Sens. 2024, 16, 2204. [Google Scholar] [CrossRef]
  22. Rahman, M.M.; Szabó, G. Sustainable Urban Land-Use Optimization Using GIS-Based Multicriteria Decision-Making (GIS-MCDM) Approach. ISPRS Int. J. Geo-Inf. 2022, 11, 313. [Google Scholar] [CrossRef]
  23. Heydari, R.; Fathololoumi, S.; Soltanbeygi, M.; Firozjaei, M.K. A Sustainability-Oriented Spatial Multi-Criteria Decision Analysis Framework for Optimizing Recreational Ecological Park Development. Sustainability 2025, 17, 731. [Google Scholar] [CrossRef]
  24. Kayitete, L.; Bakolo, C.; Tomlinson, J.; Fawcett, J.; Tuyisenge, M.F.; de Dieu Tuyizere, J. Applying Multi-Criteria Analysis in GIS to predict suitability for recreational green space interventions in Kigali City, Rwanda. Appl. Geomat. 2025, 17, 163–175. [Google Scholar] [CrossRef]
  25. Moradi, B.; Akbari, R.; Taghavi, S.R.; Fardad, F.; Esmailzadeh, A.; Ahmadi, M.Z.; Attarroshan, S.; Nickravesh, F.; Jokar Arsanjani, J.; Amirkhani, M.; et al. A Scenario-Based Spatial Multi-Criteria Decision-Making System for Urban Environment Quality Assessment: Case Study of Tehran. Land 2023, 12, 1659. [Google Scholar] [CrossRef]
  26. Martin, G.K.; O’Dell, K.; Kinney, P.L.; Pescador-Jimenez, M.; Rojas-Rueda, D.; Canales, R.; Anenberg, S.C. Tracking progress toward urban nature targets using landcover and vegetation indices: A global study for the 96 C40 Cities. GeoHealth 2024, 8, e2023GH000996. [Google Scholar] [CrossRef] [PubMed]
  27. Pelorosso, R.; Apollonio, C.; Rocchini, D.; Petroselli, A. Effects of Land Use-Land Cover Thematic Resolution on Environmental Evaluations. Remote Sens. 2021, 13, 1232. [Google Scholar] [CrossRef]
  28. Aryal, J.; Sitaula, C.; Aryal, S. NDVI Threshold-Based Urban Green Space Mapping from Sentinel-2A at the Local Governmental Area (LGA) Level of Victoria, Australia. Land 2022, 11, 351. [Google Scholar] [CrossRef]
  29. Śleszyński, P.; Gibas, P.; Sudra, P. The Problem of Mismatch between the CORINE Land Cover Data Classification and the Development of Settlement in Poland. Remote Sens. 2020, 12, 2253. [Google Scholar] [CrossRef]
  30. Kwan, C.; Gribben, D.; Ayhan, B.; Li, J.; Bernabe, S.; Plaza, A. An Accurate Vegetation and Non-Vegetation Differentiation Approach Based on Land Cover Classification. Remote Sens. 2020, 12, 3880. [Google Scholar] [CrossRef]
  31. Sierra, S.; Ramo, R.; Padilla, M.; Cobo, A. Optimizing deep neural networks for high-resolution land cover classification through data augmentation. Environ. Monit. Assess. 2025, 197, 423. [Google Scholar] [CrossRef]
  32. Fayaz, M.; Nam, J.; Dang, L.M.; Song, H.-K.; Moon, H. Land-Cover Classification Using Deep Learning with High-Resolution Remote-Sensing Imagery. Appl. Sci. 2024, 14, 1844. [Google Scholar] [CrossRef]
  33. Corbane, C.; Syrris, V.; Sabo, F.; Politis, P.; Melchiorri, M.; Pesaresi, M.; Soille, P.; Kemper, T. Convolutional neural networks for global human settlements mapping from Sentinel-2 satellite imagery. Neural Comput. Appl. 2021, 33, 6697–6720. [Google Scholar] [CrossRef]
  34. Zhou, X.; Zhou, W.; Li, F.; Shao, Z.; Fu, X. Vegetation Type Classification Based on 3D Convolutional Neural Network Model: A Case Study of Baishuijiang National Nature Reserve. Forests 2022, 13, 906. [Google Scholar] [CrossRef]
  35. Chen, S.; Zhang, M.; Lei, F. Mapping Vegetation Types by Different Fully Convolutional Neural Network Structures with Inadequate Training Labels in Complex Landscape Urban Areas. Forests 2023, 14, 1788. [Google Scholar] [CrossRef]
  36. Manos, E.; Witharana, C.; Udawalpola, M.R.; Hasan, A.; Liljedahl, A.K. Convolutional Neural Networks for Automated Built Infrastructure Detection in the Arctic Using Sub-Meter Spatial Resolution Satellite Imagery. Remote Sens. 2022, 14, 2719. [Google Scholar] [CrossRef]
  37. Mo, Y.; Huang, Y.; Zhong, R.; Wang, B.; Guo, Z. Investigating the Effects of 2D/3D Urban Morphology on Land Surface Temperature Using High-Resolution Remote Sensing Data. Buildings 2025, 15, 1256. [Google Scholar] [CrossRef]
  38. Patra, P.K.; Behera, D.; Chettry, V.; Jena, K.M.; Goswami, S.; Jothimani, M. Geospatial analysis of unplanned urbanization: Impact on land surface temperature and habitat suitability in Cuttack, India. Discov. Sustain. 2025, 6, 118. [Google Scholar] [CrossRef]
  39. Feng, Y.; Wu, G.; Ge, S.; Feng, F.; Li, P. Identification of Key Drivers of Land Surface Temperature Within the Local Climate Zone Framework. Land 2025, 14, 771. [Google Scholar] [CrossRef]
  40. Wang, X.; Scott, C.E.; Dallimer, M. High summer land surface temperatures in a temperate city are mitigated by tree canopy cover. Urban Clim. 2023, 51, 101606. [Google Scholar] [CrossRef]
  41. Staples, T.L.; Mayfield, M.M.; England, J.R.; Dwyer, J.M. Drivers of Acacia and Eucalyptus growth rate differ in strength and direction in restoration plantings across Australia. Ecol. Appl. 2022, 32, e2636. [Google Scholar] [CrossRef]
  42. Clementi, M.; Dessì, V.; Podestà, G.M.; Chien, S.-C.; Wei, B.A.T.; Lucchi, E. GIS-Based Digital Twin Model for Solar Radiation Mapping to Support Sustainable Urban Agriculture Design. Sustainability 2024, 16, 6590. [Google Scholar] [CrossRef]
  43. Ramírez, L.A.; Llambí, L.D.; Azocar, C.J.; Fernandez, M.; Torres, J.E.; Bader, M.Y. Patterns in climate and seedling establishment at a dry tropical treeline. Plant Ecol. 2022, 223, 1047–1068. [Google Scholar] [CrossRef]
  44. Al-Kindi, K.M.; Alabri, Z. Investigating the role of the key conditioning factors in flood susceptibility mapping through machine learning approaches. Earth Syst. Environ. 2024, 8, 63–81. [Google Scholar] [CrossRef]
  45. Shekar, P.R.; Mathew, A.; Hasher, F.F.B.; Mehmood, K.; Zhran, M. Towards Sustainable Development: Ranking of Soil Erosion-Prone Areas Using Morphometric Analysis and Multi-Criteria Decision-Making Techniques. Sustainability 2025, 17, 2124. [Google Scholar] [CrossRef]
  46. Elmahdy, S.; Ali, T.; Mohamed, M. Flash Flood Susceptibility Modeling and Magnitude Index Using Machine Learning and Geohydrological Models: A Modified Hybrid Approach. Remote Sens. 2020, 12, 2695. [Google Scholar] [CrossRef]
  47. Costache, R.; Barbulescu, A.; Pham, Q.B. Integrated Framework for Detecting the Areas Prone to Flooding Generated by Flash-Floods in Small River Catchments. Water 2021, 13, 758. [Google Scholar] [CrossRef]
  48. Battisti, L.; Giacco, G.; Moraca, M.; Pettenati, G.; Dansero, E.; Larcher, F. Spatializing Urban Forests as Nature-based Solutions: A methodological proposal. Cities 2024, 144, 104629. [Google Scholar] [CrossRef]
  49. Isola, F.; Lai, S.; Leone, F.; Zoppi, C. Urban Green Infrastructure and Ecosystem Service Supply: A Study Concerning the Functional Urban Area of Cagliari, Italy. Sustainability 2024, 16, 8628. [Google Scholar] [CrossRef]
  50. Magliocco, A.; Sabbion, P. Advancing Urban and Extra-Urban Afforestation: A Case Study of the Italian National Urban Forestry Plan in the Metropolitan City of Genoa. Land 2025, 14, 695. [Google Scholar] [CrossRef]
  51. Cimini, A.; De Fioravante, P.; Marinosci, I.; Congedo, L.; Cipriano, P.; Dazzi, L.; Marchetti, M.; Scarascia Mugnozza, G.; Munafò, M. Green Urban Public Spaces Accessibility: A Spatial Analysis for the Urban Area of the 14 Italian Metropolitan Cities Based on SDG Methodology. Land 2024, 13, 2174. [Google Scholar] [CrossRef]
  52. Ruiz-Apilánez, B.; Ormaetxea, E.; Aguado-Moralejo, I. Urban Green Infrastructure Accessibility: Investigating Environmental Justice in a European and Global Green Capital. Land 2023, 12, 1534. [Google Scholar] [CrossRef]
  53. Chen, S.; Knöll, M. Environmental Justice in the Context of Access to Urban Green Spaces for Refugee Children. Land 2024, 13, 716. [Google Scholar] [CrossRef]
  54. Konijnendijk, C.C. Evidence-based guidelines for greener, healthier, more resilient neighbourhoods: Introducing the 3–30–300 rule. J. For. Res. 2023, 34, 821–830. [Google Scholar] [CrossRef]
  55. Bai, H.; Li, Z.; Guo, H.; Chen, H.; Luo, P. Urban Green Space Planning Based on Remote Sensing and Geographic Information Systems. Remote Sens. 2022, 14, 4213. [Google Scholar] [CrossRef]
  56. Anteneh, M.B.; Damte, D.S.; Abate, S.G.; Gedefaw, A.A. Geospatial assessment of urban green space using multi-criteria decision analysis in Debre Markos City, Ethiopia. Environ. Syst. Res. 2023, 12, 7. [Google Scholar] [CrossRef]
  57. Gelan, E. GIS-based multi-criteria analysis for sustainable urban green spaces planning in emerging towns of Ethiopia: The case of Sululta town. Environ. Syst. Res. 2021, 10, 1–14. [Google Scholar] [CrossRef]
  58. Prodanovic, V.; Bach, P.M.; Stojkovic, M. Urban nature-based solutions planning for biodiversity outcomes: Human, ecological, and artificial intelligence perspectives. Urban Ecosyst. 2024, 27, 1795–1806. [Google Scholar] [CrossRef]
  59. Mecca, B. Assessing the sustainable development: A review of multi-criteria decision analysis for urban and architectural sustainability. J. Multi-Criteria Decis. Anal. 2023, 30, 203–218. [Google Scholar] [CrossRef]
  60. Başeğmez, M.; Doğan, A.; Aydın, C.C. Management of sustainable urban green spaces through machine learning–supported MCDM and GIS integration. Environ. Sci. Pollut. Res. 2025, 32, 11466–11487. [Google Scholar] [CrossRef]
  61. Fan, D.; Maliki, N.Z.B.; Yu, S.; Jin, F.; Han, X. Enhancing urban blue-green landscape quality assessment through hybrid genetic algorithm-back propagation (GA-BP) neural network approach: A case study in Fucheng, China. Environ. Monit. Assess. 2024, 196, 424. [Google Scholar] [CrossRef]
  62. Park, Y.; Lee, S.-W.; Lee, J. Comparison of Fuzzy AHP and AHP in Multicriteria Inventory Classification While Planning Green Infrastructure for Resilient Stream Ecosystems. Sustainability 2020, 12, 9035. [Google Scholar] [CrossRef]
  63. Wang, W.; Luan, W.; Jing, H.; Zhu, J.; Zhang, K.; Ma, Q.; Zhang, S.; Liang, X. Quantitative Assessment of Urban Expansion Impact on Vegetation in the Lanzhou–Xining Urban Agglomeration. Appl. Sci. 2024, 14, 8615. [Google Scholar] [CrossRef]
  64. Meng, Y.; Wei, C.; Guo, Y.; Tang, Z. A Planted Forest Mapping Method Based on Long-Term Change Trend Features Derived from Dense Landsat Time Series in an Ecological Restoration Region. Remote Sens. 2022, 14, 961. [Google Scholar] [CrossRef]
  65. Kwan, C.; Gribben, D.; Ayhan, B.; Bernabe, S.; Plaza, A.; Selva, M. Improving Land Cover Classification Using Extended Multi-Attribute Profiles (EMAP) Enhanced Color, Near Infrared, and LiDAR Data. Remote Sens. 2020, 12, 1392. [Google Scholar] [CrossRef]
  66. Phan, T.N.; Kuch, V.; Lehnert, L.W. Land Cover Classification using Google Earth Engine and Random Forest Classifier—The Role of Image Composition. Remote Sens. 2020, 12, 2411. [Google Scholar] [CrossRef]
  67. Orhan, O.; Bilgilioglu, S.S.; Kaya, Z.; Ozcan, A.K.; Bilgilioglu, H. Assessing and mapping landslide susceptibility using different machine learning methods. Geocarto Int. 2022, 37, 2795–2820. [Google Scholar] [CrossRef]
  68. Egerer, M.; Suda, M. Designing “Tiny Forests” as a lesson for transdisciplinary urban ecology learning. Urban Ecosyst. 2023, 26, 1331–1339. [Google Scholar] [CrossRef]
  69. Saaty, T.L. Decision making—The analytic hierarchy and network processes (AHP/ANP). Journal of systems science and systems engineering. J. Syst. Sci. Syst. Eng. 2004, 13, 1–35. [Google Scholar] [CrossRef]
Figure 1. Geographical location and administrative boundaries of the study area in Şanlıurfa, Türkiye.
Forests 16 01064 g001
Figure 2. Normalized slope map derived from SRTM DEM. In contrast to conventional assumptions, moderately steep and rocky areas (green) are considered more suitable for afforestation in the Şanlıurfa context, as flatlands are predominantly used for agriculture and are mostly privately owned. State-owned lands—often located on hilly, less arable terrain—present fewer legal and economic barriers for afforestation initiatives.
Forests 16 01064 g002
Figure 3. Aspect classification map generated from SRTM DEM. Northerly and easterly aspects (green) are prioritized for afforestation due to their reduced solar exposure and enhanced moisture retention, while southern and western aspects (orange) are less favorable.
Forests 16 01064 g003
Figure 4. Moderate elevations in the north and southeast are considered more suitable due to their accessibility, reduced urban pressure, and strategic availability as state-owned lands. In contrast, higher elevations are less prioritized due to limitations in soil moisture retention and potential exposure-related stress. This interpretation aligns with local land use conditions and institutional afforestation policies in semi-arid southeastern Türkiye, where flatter, cultivable lands are legally or economically restricted from conversion.
Forests 16 01064 g004
Figure 5. LST zones derived from Landsat 8 imagery. Warm to very warm urban zones are evident in densely built-up regions and represent priority areas for afforestation to mitigate urban heat island effects.
Forests 16 01064 g005
Figure 6. Normalized solar radiation map showing spatial variation in cumulative solar exposure. Moderate radiation zones are ideal for afforestation, as they balance photosynthetic potential with evapotranspiration stress, especially in semi-arid climates.
Forests 16 01064 g006
Figure 7. Flow accumulation map derived from SRTM-based hydrologic modeling. High accumulation zones along natural channels are excluded due to erosion and instability risks, while low accumulation zones indicate more stable terrain suitable for planting.
Forests 16 01064 g007
Figure 8. Normalized land cover classification map produced from Sentinel-2 imagery using deep learning. Categories include urban fabric, forested land, arable land, scrubland, and transitional open spaces. Non-urban, non-forested, and non-aquatic zones were prioritized for afforestation.
Forests 16 01064 g008
Figure 9. Urban suitability mask derived from land cover classification constraints. Green areas represent afforestation-eligible zones, while red areas denote restricted zones such as urban fabric, dense forest, and water bodies. Overlaid infrastructure includes road and building footprints.
Forests 16 01064 g009
Figure 10. Heatmap of classification accuracy metrics for CORINE-based land cover classes.
Forests 16 01064 g010
Figure 11. Final afforestation suitability map generated through GIS-based MCDA using weighted overlay analysis. The map classifies the region into four suitability categories (highly suitable, suitable, moderately suitable, and unsuitable) based on integrated topographic, thermal, hydrological, land cover, and proximity-based criteria. Green areas on the periphery, particularly in the northeast and southeast, show the highest afforestation potential.
Forests 16 01064 g011
Table 1. Overview of afforestation suitability criteria, associated data sources, and their ecological or logistical interpretations within the GIS-based MCDA framework.
CriterionData SourceSuitability Interpretation
SlopeSRTM DEMLower slopes preferred for planting accessibility
AspectSRTM DEMNorth and east-facing slopes prioritized
ElevationSRTM DEMModerate elevations are ecologically favorable
LSTLandsat 8Cooler areas preferred to reduce urban heat islands
Solar RadiationSRTM DEMModerate exposure preferred for growth potential
Flow AccumulationSRTM DEMLow accumulation preferred to avoid erosion risks
Distance to RoadsOpenStreetMapModerate proximity facilitates management/logistics
Distance to SettlementsOpenStreetMapReasonable proximity supports accessibility
Land Cover SuitabilitySentinel-2Non-forested, non-urban, non-water areas only
Table 2. Pairwise comparison matrix (upper triangle).
CriterionSLOASPELELSTSOLFLADTRDTSLCS
Slope 1211/313342
Aspect 111/513232
Elevation 11/512222
LST 124453
Solar Radiation 13332
Flow Accumulation 1232
Distance to Roads 122
Distance to Settlements 12
Land Cover Suitability 1
Table 3. Criterion weights and consistency metrics.
CriterionWeightWeight (%)
Surface Temperature (LST)0.29629.6%
Slope0.13813.8%
Solar Radiation0.13013.0%
Aspect0.10610.6%
Elevation0.10210.2%
Flow Accumulation0.0727.2%
Distance to Roads0.0595.9%
Land Cover Suitability0.0505.0%
Distance to Settlements0.0464.6%
Disclaimer/Publisher’s Note: The statements, opinions and data contained in all publications are solely those of the individual author(s) and contributor(s) and not of MDPI and/or the editor(s). MDPI and/or the editor(s) disclaim responsibility for any injury to people or property resulting from any ideas, methods, instructions or products referred to in the content.

