Article

Modeling Natural Forest Fire Regimes Based on Drought Characteristics at Various Spatial and Temporal Scales in P. R. China

1
Key Laboratory of Forest Ecology and Silviculture, Institute of Applied Ecology, Chinese Academy of Sciences, Shenyang 110016, China
2
College of Geography and Environment, Shandong Normal University, Jinan 250358, China
3
School of Life Sciences and Engineering, Shenyang University, Shenyang 110044, China
*
Author to whom correspondence should be addressed.
Forests 2025, 16(7), 1041; https://doi.org/10.3390/f16071041
Submission received: 22 May 2025 / Revised: 17 June 2025 / Accepted: 18 June 2025 / Published: 21 June 2025
(This article belongs to the Special Issue Forest Fires Prediction and Detection—2nd Edition)

Abstract

Climate change causes extreme weather events to occur frequently, such as drought, which may exacerbate forest fire regimes; as such, forest fire regimes may be closely related to drought characteristics. The spatial non-stationarity of factors affecting forest fires has not been fully clarified and needs further exploration. This study intends to address how drought characteristics affect forest fire regimes in China and whether spatial non-stationarity can improve the model prediction based on methods such as the run theory and GWR. Our results show that geographically weighted regression models perform better (AICc, AUC, R2, RMSE, and MAE) than global regression models in modeling forest fire regimes. Although GWR improves accuracy, small sample sizes (vegetation zones, climatic zones) may affect its accuracy. Drought characteristics significantly affect (p < 0.05) the forest fire regimes, and the correlation is spatially non-static. At the grid scale, a positive correlation between the forest fire occurrence probability and drought characteristics is mostly distributed in the southwest and northwest regions. Our study is conducive to an in-depth understanding of the relationship between forest fire regimes and drought, aiming to provide a scientific basis for the development of forest fire management measures to mitigate drought stress according to local conditions.

1. Introduction

Forest fire regimes comprise a set of parameters that characterize forest fires, including the frequency/probability of forest fires, the size of the burned area, seasonality, severity, spatial pattern, etc. [1,2]. The probability of a forest fire occurring is a particularly important parameter of forest fire regimes. In recent years, large forest fires have occurred across the world, which is likely associated with prolonged periods of drought [3]. Droughts—prolonged periods in which there is a lack of, or lower than, the required precipitation, runoff, or water supply [4]—are regarded as a crucial contributor [5]. Droughts increase the dryness and flammability of forest fuels [6], as well as the dead fuel load and continuity on the forest floor, exacerbating the rate of forest fire spread [7]; prolonged periods of drought may cause forest fires [8]. The relationship between forest fires and drought is important in relation to fire ecology research. A deeper understanding of the relationship between the drought process and forest fire regimes can provide a scientific basis for the development of climate change adaptation measures [9], forest fire management decisions [10,11], and fire loss reduction [12].
Several drought indices have been used for drought monitoring, such as the Palmer Drought Severity Index (PDSI) [13], the Standard Precipitation Index (SPI) [14], the Standard Precipitation Evapotranspiration Index (SPEI) [15], and the Standard Palmer Drought Severity Index (SPDI) [16]. An extension of the Standardized Precipitation Index (SPI) is the Standardized Precipitation Evapotranspiration Index (SPEI), which attempts to overcome various limitations by combining the multi-scale nature of the SPI with the water balance equation used in the PDSI [17]. The SPEI is characterized by multi-scale and non-stationary properties [18,19]; additionally, it considers the temperature factor and introduces potential evapotranspiration, which is more suitable for a warming climate context [20,21]. Furthermore, the SPEI takes into account the effects of temperature on evapotranspiration and water availability, which have not yet been considered in studies related to drought and fire variability [11,22,23], enabling a better estimation of drought characteristics [24]. In contrast to the Palmer Drought Severity Index (PDSI), which has a fixed time scale, the SPEI has a temporal multi-scalar property, which allows it to relate drought at a given time scale to the occurrence of a given phenomenon or event (e.g., forest fires) [25]. The SPI index is based solely on precipitation data, and compared to the Standardized Precipitation Index (SPI), the SPEI combines temperature and precipitation data, and thus can more accurately reflect drought conditions under global warming [26]. SPEI is superior to other drought indices [27], and SPEI is used in this paper to quantify drought characteristics.
The climate is an important driver of fire regimes [28]. Global warming, as well as increased levels of drought, has led to weather conditions conducive to starting fires [29], longer fire seasons [30], drier fuels [31], and larger burned areas [32]. The degree of wildfire hazard depends on the weather and fuel conditions [33]. Gusts of wind accelerate the spread of wildfires [34]. Drought dries out the soil and accelerates vegetation senescence [35], reducing fuel moisture and creating favorable ignition conditions and increased fire intensity [36]. It is also important to note that weather conditions can affect soil moisture and thus the rate of fuel accumulation [37]. For example, higher levels of precipitation during the previous vegetation growing season lead to a higher biomass and increased forest fire risk in the following months [38]. On longer time scales, climate change can significantly affect wildfire risk by altering weather and fuel conditions. Estimates of fuel moisture content are a key factor in wildfire risk management [39], and dead fuel moisture content affects fire likelihood and early fire behavior to a greater extent than live fuel moisture content [40].
The Canadian Forest Fire Danger Rating System [41], the U.S. National Fire Danger Rating System [42], and the Australian McArthur Forest Fire Danger Index [43] have been used to assess the fire hazard of forests in Canada; all systems include specialized fuel moisture models. In Russia, the ISDM-Rosleshoz system [44,45,46] uses satellite imagery, meteorological data, and ground-based observations to monitor and predict forest fires, combined with real-time data to support fire prevention and firefighting strategies. The European Forest Fire Information Service (EFFIS) provides a large number of global fire perimeters, burned area, and burn severity, but in some cases, it has limitations that could be improved [47]. For example, the EFFIS fire weather index underestimates the variability of locally measured fire weather and fuel moisture content due to the limitation of having coarse resolution [48]. Forest combustibles with moisture content below a certain threshold will catch fire and burn [49]. The most comprehensive physical–mathematical model for predicting forest fires based on the drying of forest combustibles is given by Grishin et al., 2001 [50]. Grishin, A.M. et al. considered all known causes of natural fires. A set of accurate physical and mathematical models was proposed to improve the Russian forest fire risk system GOST P 22.1.09-99 [51]. Future climate change is also expected to affect wildfire danger levels by altering fire weather and fuel conditions [33]. The occurrence of forest fires is considered probabilistic [52]. Fuel load and fuel moisture content are important variables in predicting fire occurrence [53]. Different types of vegetation burn at different rates [54]. Grishin, A.M. et al. physically and mathematically modeled the drying process of the combustible layer of forests, providing a rigorous physical and mathematical basis for predicting forest fires [50]. Fire danger predictions rely heavily on meteorological variables, which typically include temperature and precipitation [55].
There are many approaches to predicting forest fires, such as deterministic approaches [53,54], probabilistic approaches [52], deterministic–probabilistic systems [48], empirical fire models [55], and neural networks [56], among others. Methods for predicting the number of forest fires include Poisson mixed models [56], space–time Poisson model [57,58], Linear Model [59], etc. Most researchers have explored the relationship between forest fire and drought index, such as burned area vs. sc-PDSI in California [60] and southwest India [8], the number of large fires vs. PDSI [61], and burned area vs. SPI and SPEI in the Iberian Peninsula [25]. These relationships between forest fire regimes and drought indices are used for fire prediction via regression models [62]. However, drought characteristics, including drought duration, severity, intensity, frequency, etc., are crucial for the spatial and temporal distribution patterns of forest fires; however, they are currently seldom documented. In addition, the first law of geography states that everything is spatially correlated, and this correlation varies with spatial location, i.e., spatial non-stationarity. Traditional statistical models and algorithms cannot reflect the spatial variation in the correlation between forest fire regimes and drought characteristics. The geographically weighted regression (GWR) model could solve this problem by estimating the regression coefficients of each spatial unit [63]. We assume that forest fire regimes are highly related to drought characteristics, and considering spatial non-stationarity could improve the accuracy of prediction models for forest fire regimes.
To address the above issues, we extracted drought characteristics from SPEI data at four temporal scales (SPEI-1, SPEI-3, SPEI-6, and SPEI-12), including drought duration, severity, intensity, and frequency, in order to explore the relationship between forest fire regimes (forest fire occurrence probability, number of forest fires, and burned area) and drought characteristics in China according to Spearman’s correlation coefficient, as well as to model forest fire occurrence probability based on drought characteristics according to the global logistic regression model and the geographically weighted logistic regression model. Additionally, the number of forest fires according to the Poisson regression model and the geographically weighted Poisson regression model, as well as the burned area according to the global regression model and the geographically weighted regression model, were investigated. The model fitting and prediction effects were evaluated by R2, RMSE, MAE, AICc, and AUC to verify the hypothesis that the consideration of spatial non-stationarity can improve the model fitting and prediction effects. The aim of the study is to explore the spatial non-stationarity of the relationship between forest fire regimes and drought characteristics, and to construct prediction models of forest fire regimes based on drought characteristics. Our ultimate goal is to explore the spatial non-stationarity of drought characteristics influencing forest fire regimes, which will be used to accurately predict forest fire regimes and to take measures for forest fire prevention.

2. Materials and Methods

2.1. Study Area

China is located in eastern Asia, on the western coast of the North Pacific Ocean. The country’s climate is influenced by monsoons, resulting in significant differences in precipitation patterns both in time and space [64]. Owing to China’s large population, diverse climatic conditions, and vegetation types, there are large regional differences in the spatial and temporal distribution characteristics of forest fires, with northern China being likely to have a larger burned area than the south, but at a lower frequency [23]. The distribution of drought and forest fire regimes in China is complex. To explore the relationship between drought characteristics and forest fire regimes at different spatial and temporal scales, we created grids (0.5° × 0.5°) with a width of 71 grids and a length of 121 grids. Then, 3822 grids were extracted based on the shape of the map of China (Figure 1a), climatic zones (Figure 1b), and vegetation zones (Figure 1c), and to establish a prediction model of forest fire regimes in order to verify the hypothesis that considering spatial non-stationarity can improve the model fitting and prediction effect. According to China’s climate zoning data and vegetation zoning data from the Center for Resource and Environmental Science and Data (CRESD) (https://www.resdc.cn/ (accessed on 11 June 2024)), the study area was divided into eight vegetation zones and 36 vegetation belts [65,66]. The eight vegetation zones were as follows: (I) cold temperate coniferous forest region, (II) warm temperate deciduous broad-leaved forest region, (III) alpine vegetation area of Qinghai–Tibet Plateau, (IV) tropical monsoon rainforest region, (V) temperate grassland area, (VI) temperate desert area, (VII) temperate coniferous and deciduous broad-leaved mixed forest, and (VIII) subtropical evergreen broad-leaved forest region. According to the climatic zoning map of China [67] compiled by the National Meteorological Administration of China (NMA) in 1978 using climatic data for the period between 1951 and 1970, the study area was divided into 10 first-order climatic zones and 45 s-order climatic zones. The 10 Class I climatic regions included the following: (I) north temperate zone, (II) mid-temperate zone, (III) south temperate zone, (IV) north subtropical, (V) middle subtropical zone, (VI) south subtropical, (VII) north tropic, (VIII) mid-tropical, (IX) plateau climate zone, and (X) south tropic. Because the South Tropic Zone is mainly located in the Nansha district of China, with a smaller area and fewer forest fire records, it was not included in our study.

2.2. Data Source and Pre-Processing

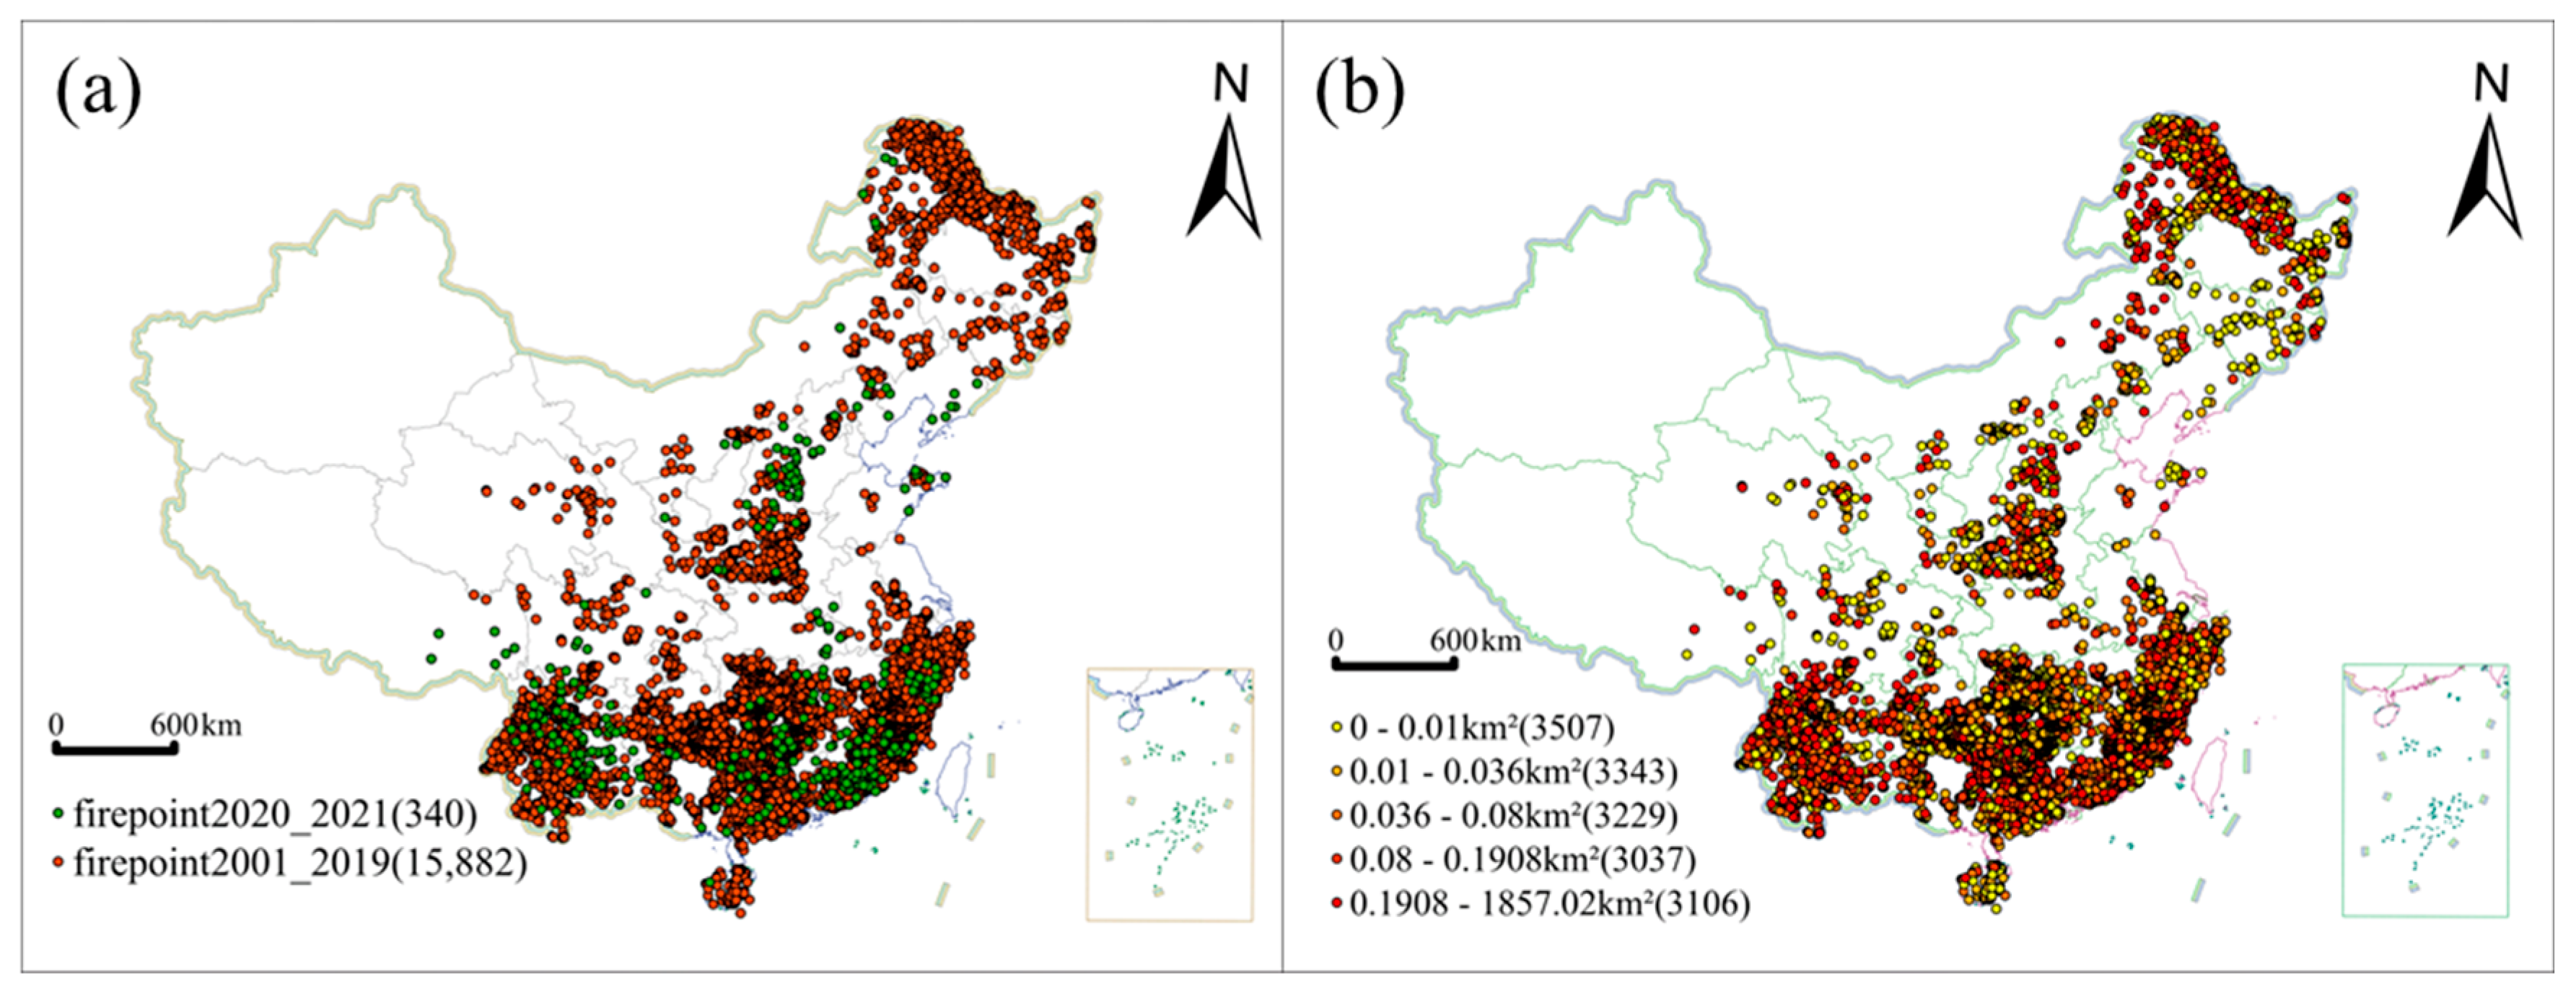
2.2.1. Forest Fire Regimes

The majority of forest fire records were obtained from the WFAC fire dataset generated by Keyan Fang et al. in their 2021 research study [68]. This dataset was obtained from the Polar Orbiting Satellite Wildfire Monitoring System, which enables the continuous monitoring of vegetation throughout the country. If the hot spot location of potential fires on the satellite imagery was confirmed by the local fire department within 24 h of on-site verification, then it was returned to the monitoring center. Hot spots identified in satellite imagery but not observed in the field were eliminated from the final data product. The WFAC dataset includes the ignition location (longitude and latitude), starting date and time, extinguishing date and time, fire size, fire cause (natural or human), etc., for each verified fire. The WFAC dataset contains 53,561 fire records from 1999 to 2019. We did not use the records from 1999 and 2000 to keep the consistency of the period with the prediction variables. In addition, this paper primarily considers natural fires. Based on the definitions in Vilar et al., 2019 [69], we excluded human fires primarily as common human activities that could result in wildfire ignition due to accidental, negligent, or intentional actions, and added official fire records from 2020 to 2021, resulting in a total of 16,222 records for further analysis. The distribution of forest fire records for different years and areas is shown in Figure 2. The normality test showed that both the number of fires and the area burned have a skewed distribution. The final two years of the dataset (2020–2021) were employed as an independent test set [70] (340 fire records). The remaining data (2001–2019) (15,882 fire records) were used to construct prediction models for forest fire regimes.
We calculated the average number of ignitions and the average burned area for each grid cell, each climate zone, and each vegetation zone according to the two datasets, respectively. At the grid-cell scale, we estimated the forest fire occurrence probability (FP) for each cell by dividing the years in which forest fires had occurred in each cell by the total number of years in the fire dataset. At both the climate zone and vegetation zone scales, we performed the logarithmic transformation ln(FN+1) for the annual number of fires (FN), as well as the transformation ln(BA+1) for the annual burned area (BA), for each climate zone and vegetation zone [71]; then, we calculated the multi-year logarithmic mean of the number of fires (AFN) and the logarithmic mean of the burned area (ABA).

2.2.2. Natural and Anthropogenic Factors

Multiple environmental variables influence fire regimes. In addition to the drought characteristics, this study divides the variables into natural and anthropogenic variables [72]. Natural variables mainly include slope, river density, and surface roughness. The average slope for each grid cell, climatic zone, and vegetation zone was extracted using ArcGIS Pro based on national 1 km resolution DEM data (https://www.resdc.cn/ (accessed on 3 March 2025)). The river density was obtained according to Equation (2). The surface roughness was extracted for each grid cell, climate zone, and vegetation zone according to the local elevation difference algorithm [73] with the following formula:
R = Z max Z min
where R is the local elevation difference; Z m a x is the maximum elevation value; and Z m i n   is the minimum elevation value in the moving window.
Anthropogenic variables are characterized by population density and road density [74]. The impact of anthropogenic factors on fire regimes can be two-fold—on the one hand, high population densities increase the likelihood of human-induced fires, while on the other hand, they can also help to reduce fire regimes by reducing fuel availability and changing vegetation patterns [75]. Based on the national population distribution data (2001–2021) (https://landscan.ornl.gov/ (accessed on 6 December 2023)) and road and river distribution data (scale 1:1,000,000) (https://www.webmap.cn/ (accessed on 7 December 2023)), population density (persons/km2) (2001–2019 and 2020–2021) was obtained by dividing the sum of the population distribution within the grid by the area of the grid. Road density and river density (2001–2019 and 2020–2021) were obtained by counting the length of the roads within each grid and by using the road and river density formula (Equation (2)), as follows:
δ = L / F
where δ is the road or river network density in km/km2; L is the road or river network length in km; and F is the area of the region in km2.

2.2.3. The Standard Precipitation Evapotranspiration Index (SPEI)

The Standardized Precipitation Evapotranspiration Index (SPEI) was used to characterize droughts. The SPEI has multiple time scales and can identify droughts at different time scales [76] and performs well in the assessment of the effects of drought on vegetation growth [77]. SPEI data (2001–2021) come from the global SPEI database v.2.9 (https://spei.csic.es/database.html (accessed on 15 April 2024)), which is in n c format and needs to be converted to t i f raster format first. The main steps for calculating the SPEI are as follows.
The difference between monthly precipitation and potential evapotranspiration D j is calculated using the following equation:
D j = P j P E T j
Summing X i , j k for D j according to different time scales, the following can be obtained:
X i , j k = l = 13 k + j 12 D i 1 , l + l = i j D i , j ( j < k )
X i , j k = l = j k + 1 j D i , l ( j k )
where k is the time scale (months), i is the year, and j is the month.
  • The probability distribution of X i , j k is set as follows:
F ( X ) = [ 1 + ( α X γ ) β ] 1
The probability of a particular X i , j k is calculated as follows:
P = 1 F ( X )
The SPEI is calculated as follows:
SPEI = C 0 + C 1 w + C 2 w 2 1 + d 1 w + d 2 w 2 + d 3 w 3 w
where w = 2 l n p when p ≤ 0.5, and w = 2 l n ( 1 p ) when p > 0.5. C0 = 2.515517, C1 = 0.802853, C2 = 0.010328, d1 = 1.432788, d2 = 0.189269, and d3 = 0.001308 [15].

2.2.4. Drought Characterization

Many drought indices exist, among which the Standardized Precipitation Evapotranspiration Index (SPEI) is widely used, and it can reflect different types of drought, including meteorological drought (time scale: 1 month), agricultural drought (time scale: 3–6 months), and hydrological drought (time scale: 12 months) [78]. Hydrological droughts are defined as rainfall deficits lasting long enough to cause rivers to dry up and groundwater levels to drop, leading to severe water scarcity [79]; agricultural drought assessment is based on soil moisture deficits during the growing season of plants. Meteorological drought arises from changes in meteorological variables, such as precipitation deficits, and is a temporary, recurring meteorological event [80] and can propagate to agricultural and hydrological droughts [81]. Meteorological droughts are the cause of other drought hazards and are the basis for recognizing various drought types [82], which are characterized by precipitation deficits, high temperatures, and increased evapotranspiration [83].
The relationship between drought and forest fire is very complicated. Forest fires usually do not occur just at the beginning of the drought. The occurrence of forest fires may be closely related to the characteristics of drought, such as the number of drought events, drought duration, severity, and intensity, etc. A drought is a multi-scale event [80], and the sensitivity of the SPEI to precipitation and temperature varies at different time scales [18]. To comprehensively understand the drought regimes in China, the SPEI time scales SPEI-1, SPEI-3, SPEI-6, and SPEI-12 were selected. Monthly scale SPEI values (SPEI-1) can reflect subtle short-term drought changes. Seasonal-scale SPEI values (SPEI-3) reflect seasonal drought variability and are widely used in agricultural irrigation. Semi-annual-scale SPEI values (SPEI-6) can reflect semi-annual drought changes, and SPEI-6 can be used for agricultural drought monitoring [84]. The annual-scale SPEI value (SPEI-12) can reflect the interannual drought variation [85]. The value of the aridity index reflects the degree of wetness and dryness. Higher values represent wet areas, while lower values demonstrate drier areas [86]. This study defines a drought event as a period of at least three consecutive months with SPEI values below −0.5 according to our meteorological drought classification criteria [87] (Table 1).
In this study, the average SPEI values for each 0.5° × 0.5° grid cell were extracted using ArcGIS Pro for each month per year from 2001 to 2021. The MATLAB R2018b programming language was used to implement the run theory algorithm and to batch calculate the drought characteristics for each grid cell for each year from 2001 to 2021. According to the run theory [88], the drought characteristics (drought duration, severity, and intensity) of each drought event can be calculated according to the following equations [89,90]:
D D = D T T D I T
D S = i = 1 D D S P E I i
D I = D S D D
where DTT and DIT are the drought end and start times, respectively; SPEIi is the Standardized Precipitation Evapotranspiration Index (SPEI) value for month i ; DD is the drought duration; DS is the drought severity; and DI is the drought intensity.
We counted the total number of drought events (n) in each grid cell for the two datasets obtained in 2001–2019 and 2020–2021, respectively, and calculated the multi-year average number of drought events (MDN), multi-year average drought duration (MDD), multi-year average drought severity (MDS), and multi-year average drought intensity (MDI) (Equations (12)–(15)). Finally, MDN, MDD, MDS, and MDI were obtained using spatial statistics for each climatic zone and vegetative zone, respectively.
M D N = j = 1 n D N j n
M D D = j = 1 n D D j n
M D S = j = 1 n D S j n
M D I = j = 1 n D I j n
where DN is the drought number; DD is the drought duration; DS is the drought severity; DI is the drought intensity; MDN is the multi-year average number of drought events; MDD is the multi-year average drought calendar time; MDS is the multi-year average drought severity; and MDI is the multi-year average drought intensity.

2.2.5. Data Standardization

Data standardization is required to eliminate the quantitative influence of the factors affecting the forest fire regimes so that the influencing factors are of the same order of magnitude and thus suitable for comprehensive and comparative evaluation. Slope, terrain roughness, road density, stream density, settlement density, MDN, and MDD are positive indicators, while MDS and MDI are negative ones, according to Pang et al., (2022) [91]. In this study, the normalization ensures that the value of the influencing factors is limited to the range of [0, 1], and the specific formulas and explanations can be seen in Table 2 [91].

2.3. Data Analysis Methods

2.3.1. Diagnosis of Multicollinearity Among Explanatory Variables

Multicollinearity can lead to distortion or difficulty in accurately estimating models [92]. VIF is an important measure of the severity of multicollinearity. When VIF ranges from 0 to 10, there is no multicollinearity; however, when VIF ≥ 10, there is a high degree of multicollinearity between the variables, indicating that some of the variables need to be removed from the model [93]. We performed the VIF covariance diagnosis of the independent variables using IBM SPSS Statistics 22 software.

2.3.2. Selection of Drought Characteristics Used for Model Building

We used Spearman’s correlation coefficient to analyze the relationship between forest fire regimes and drought characteristics (MDN, MDD, MDS, and MDI) and to select the drought characteristics that had the highest correlation with forest fire regimes before constructing the model.

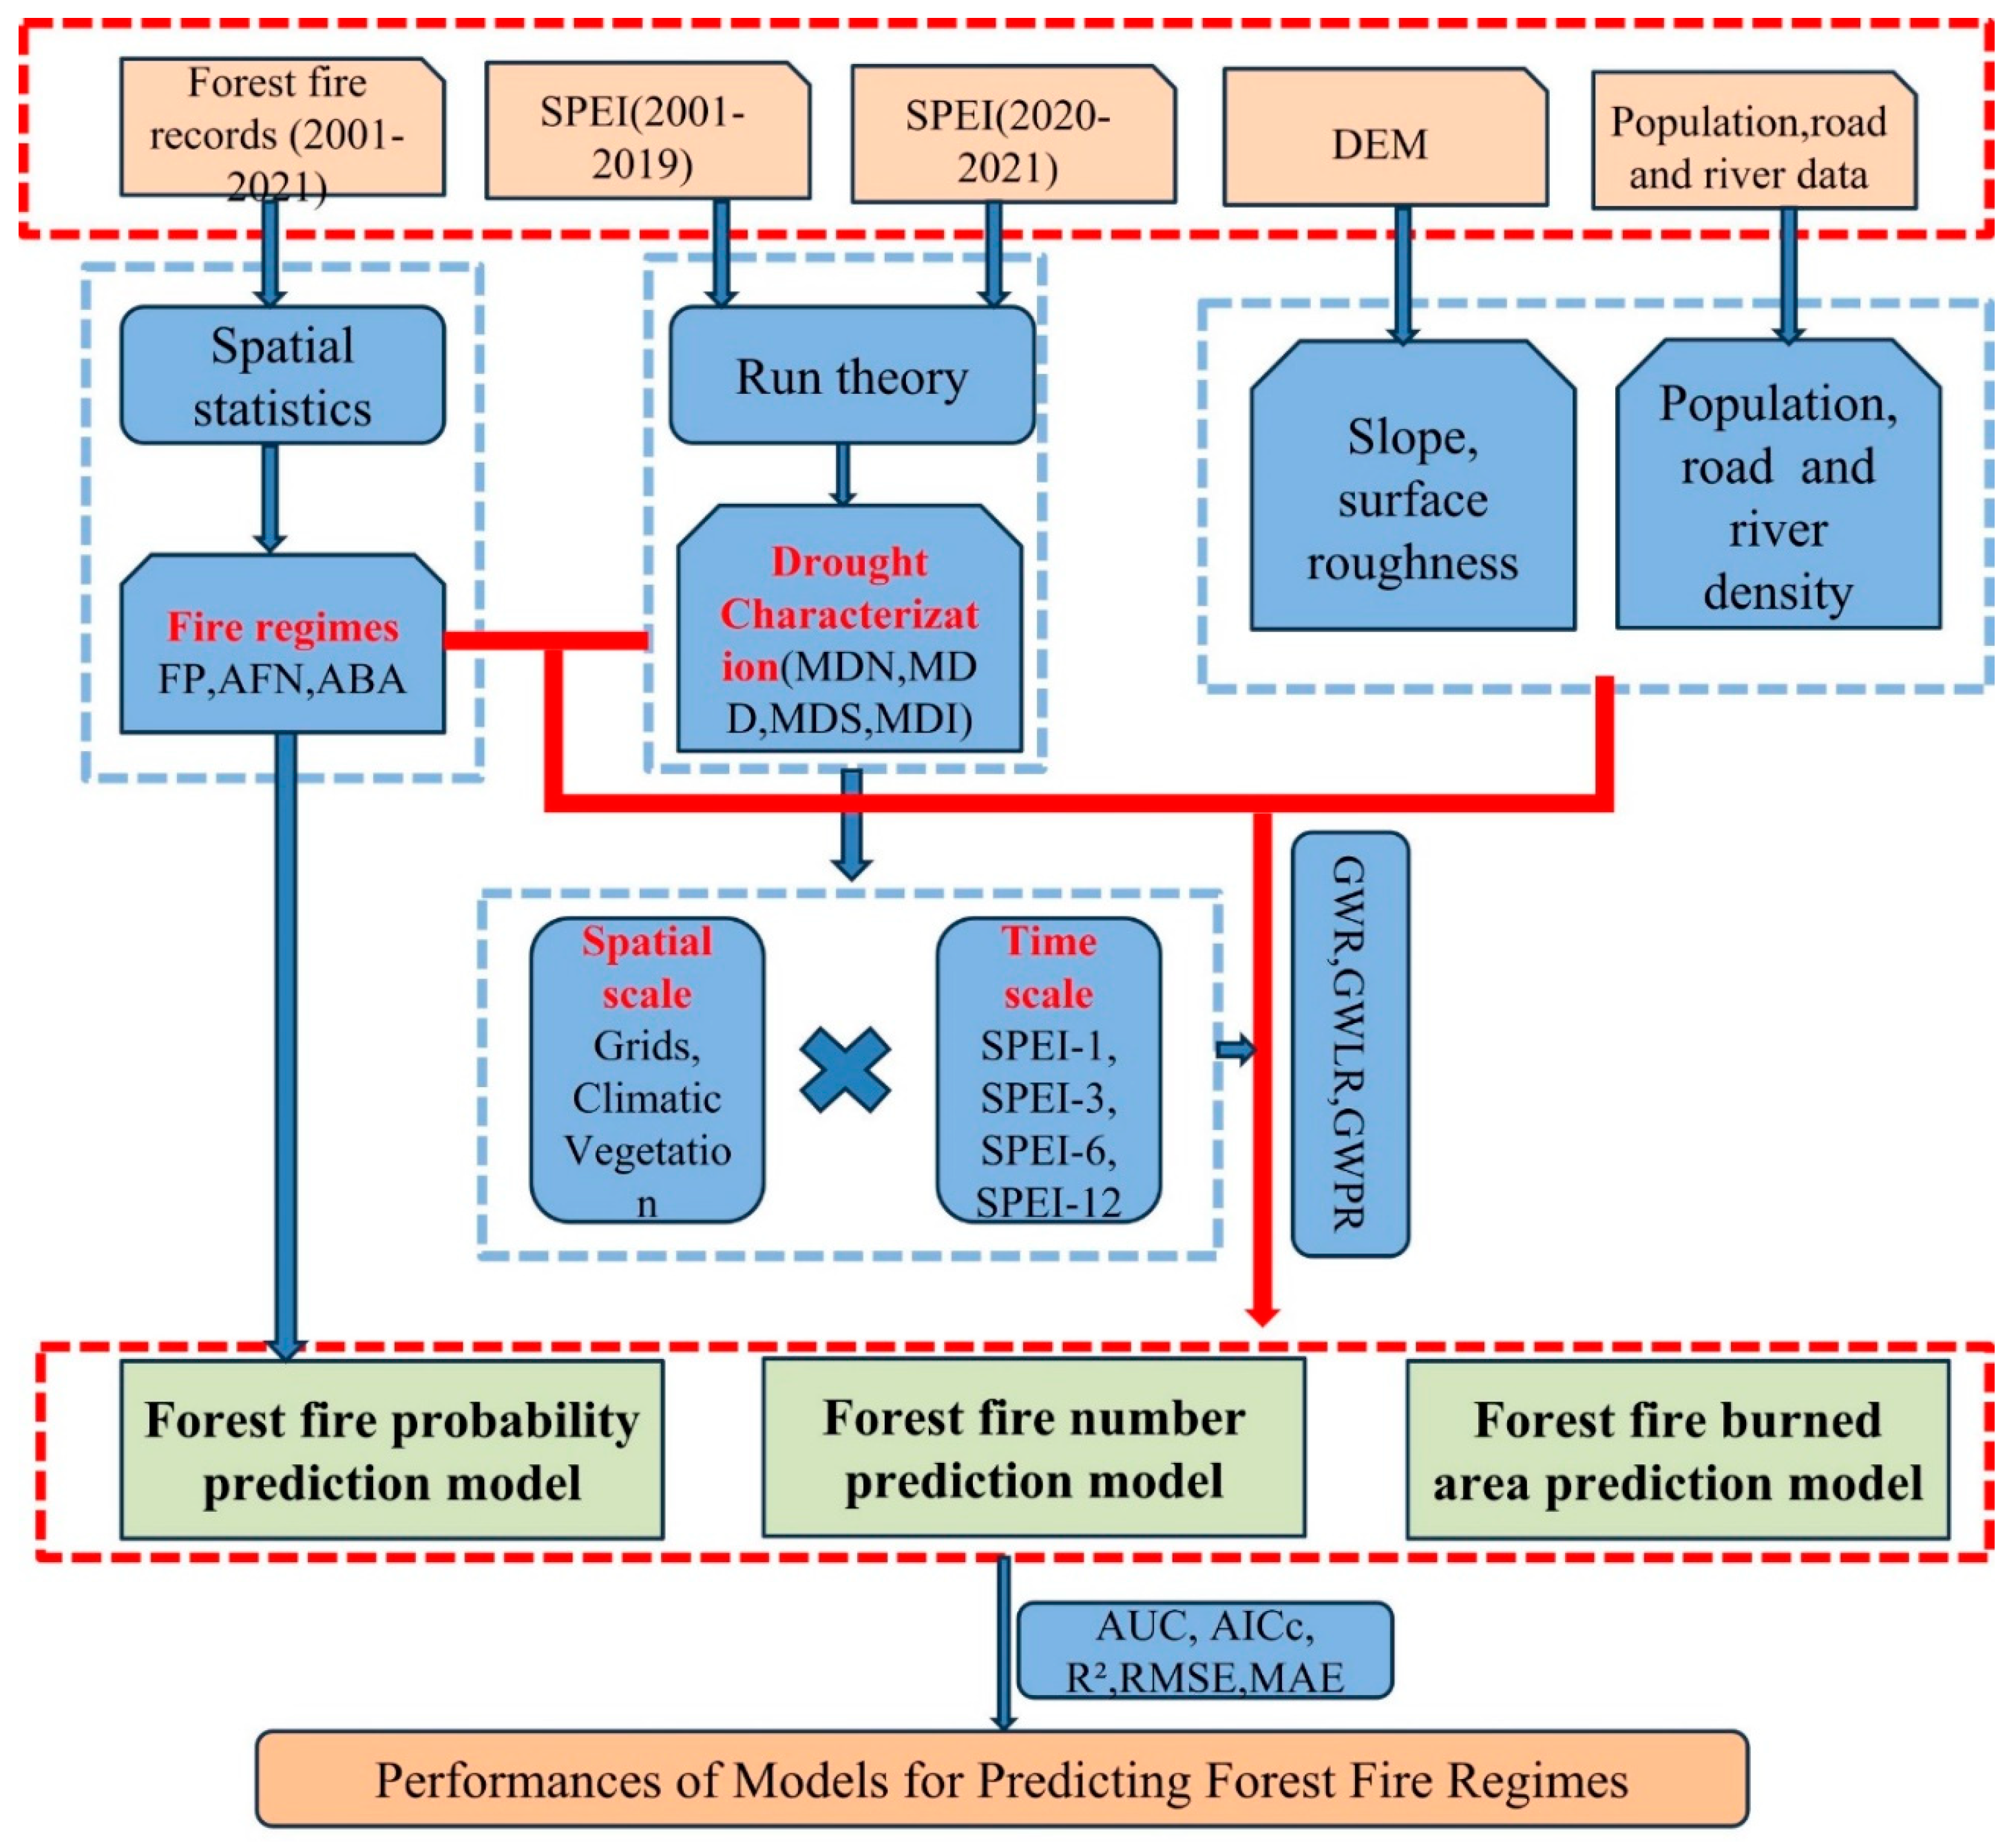
2.3.3. The Study Flowchart

The technical flowchart of this study is shown in Figure 3. The construction of the forest fire regime prediction model is divided into three steps. First, in the data collection and processing stage, drought characteristic factors were extracted based on the natural and anthropogenic factors of each grid, climate zone, and vegetation zone using the run theory. The multicollinearity between the selected variables was analyzed, and the drought characteristics with the highest correlation with the forest fire regimes were analyzed using Spearman’s correlation coefficient. Then, the prediction model of forest fire regimes was constructed based on the selected independent variables, in which the prediction model of the number of forest fires used the geographically weighted Poisson regression, the prediction model of the probability of forest fires used the geographically weighted logistic regression, the prediction model of the overfire area used the geographically weighted regression model, and global regression was used as a control. Finally, AICc, AUC, R2, RMSE, and MAE indicators were used to evaluate the model and analyze the spatial non-stationarity of forest fire and drought characteristics to provide the scientific basis for forest fire prevention and control.

2.3.4. Construction of Models for Forest Fire Regimes Based on Drought Characteristics

We modeled forest fire occurrence probability (FP) at the grid-cell scale, and the logarithmic mean number of fires (AFN) and the logarithmic mean size of the burned area (ABA) were modeled at both the scales of the climate zone and vegetation zone. The independent variables were drought characteristics, along with natural and anthropogenic factors. The models were built for 1-, 3-, 6-, and 12-month temporal scales, respectively. FP was modeled using the global logistic regression (GLR) and geographically weighted logistic regression (GWLR) models using GWR 4.0.77 software, AFN was modeled using the global Poisson regression (GPR) and geographically weighted Poisson regression (GWPR) models, and ABA was modeled using the global regression (GR) and geographically weighted regression (GWR) models.
The global regression model does not consider the effect of spatial location and assumes that the regression coefficients of independent variables are spatially invariant, i.e., spatial statistics [94]. The global regression model is formulated as follows:
y i = α + β x i 1 + + τ x i n + ε i
where y is the dependent variable; x is the independent variable; α, βτ are the parameters to be estimated; ε is the error term; and i is a location in space where observations of y and x are recorded.
Previous studies have indicated that spatial heterogeneity is common in forest fire regimes [65,95]. The relationship between forest fire regimes and influencing factors can also exhibit significant spatial variation, i.e., a factor affecting the dependent variable in one region may have a completely different effect in other regions [96,97], and this variation is referred to as spatial non-stationarity. The geographically weighted regression (GWR) model solves the problem of the spatial non-stationarity of variables by estimating the regression coefficients of each spatial unit [63]. The expression of GWR at point i is as follows [98]:
y i = k = 1 n β k ( u i , v i ) x i k + β 0 ( u i , v i ) + ε i
where y i is the explanatory variable; β 0 ( u i , v i ) is the intercept; x i k is the kth explanatory variable for sample   i ; ( u i , v i ) are the spatial coordinates of i; β k ( u i , v i ) is the coefficient of the kth explanatory variable for sample i; and ε i ( i = 1, 2, 3,…., k) is the random perturbation term.
The logistic regression model maps the results of linear regression to (0, 1) space using the sigmoid function, and the probability of forest fire occurrence (Y = 1) at location i is P. The probability of forest fire occurrence at location i is as follows [99]:
P ( Y = 1 ) = 1 1 + e y i
After the logit transformation, the following can be obtained:
log it ( P ) = ln P 1 P = y i
where if y i is a global regression model, the equation is a global logistic regression (GLR) model; if y i is a geographically weighted regression model, the equation is a geographically weighted logistic regression (GWLR) model.
The Poisson regression model was developed for count data [100]. In this study, the global Poisson regression (GPR) and geographically weighted Poisson regression (GWPR) models were used to construct a prediction model for forest fire counts at the climate zone and vegetation zone scales. The formulas are as follows [101]:
ln ( μ ) = y i
where μ is the forest fire frequency; if y i is a global regression model, the formula is a global Poisson regression (GPR) model; if y i is a geographically weighted regression model, the formula is a geographically weighted Poisson regression (GWPR) model.
In this study, we use the adaptive bi-square kernel function to compute the weight matrix, and the optimal bandwidth of the model is determined using the Akaike information criterion (AIC) calibration value— A I C c ; the specific definition of A I C c is as follows [102]:
A I C = 2 ln ( L ) + 2 k
A I C c = A I C + ( 2 k ( k + 1 ) / ( m k 1 ) )
where m is the number of sample points; ln(L) is the value of the log-likelihood function for the maximum likelihood estimation of the model; and k is the number of parameters in the model. Smaller values of   A I C c indicate a higher model precision and a lower correlation between explanatory variables.

2.3.5. Model Prediction Accuracy Assessment

We used the final two years of the dataset (2020–2021) as an independent test set [70]. The performance of forest fire occurrence probability models was evaluated using the Receiver Operating Characteristic (ROC) curve and the area under the ROC curve (AUC) [103]. A perfect model is obtained when AUC = 1, while the model is non-informative when AUC = 0 [104].
The performance of the forest fire number model and forest fire area model was evaluated according to the A I C c root mean square error (RMSE), mean absolute error (MAE), and coefficient of determination R2. A I C c measures the complexity of the predictive model and the goodness of fit of the model data [72]. R2 is used to measure the degree of match between the true and predicted values, whereby the higher the value, the better the prediction. The root mean square error (RMSE) is used to measure the distance of the model from the true value, which indicates the accuracy of the model and is a measure of the average size of the residuals or errors between the predicted and observed values. The mean absolute error (MAE) is another measure of the average size of the residuals or errors between predicted and observed values, which shows how close the model is to the true values and provides a degree of model accuracy similar to RMSE. Model prediction accuracy increases as the root mean squared error (RMSE) and the mean absolute error (MAE) decrease [105]. The formula is as follows [106]:
R 2 = i = 1 n ( O i O ¯ ) P i P ¯ i = 1 n ( O i O ¯ ) 2 i = 1 n ( P i P ¯ ) 2
R M S E = i = 1 n ( O i P i ) 2 N
M A E = 1 N i = 1 n O i P i
where O i and P i are the observed and predicted values, respectively; Q ¯ and P ¯ are the mean values of O i and P i , respectively; and N is the number of samples.

3. Results

3.1. Multicollinearity Among Explanatory Variables

The multicollinearity analysis showed that the four drought characteristics were multicollinear at both spatial (the grid cell, climate zone, and vegetation zone) and temporal (1-, 3-, 6-, and 12-month) scales (Table 3).

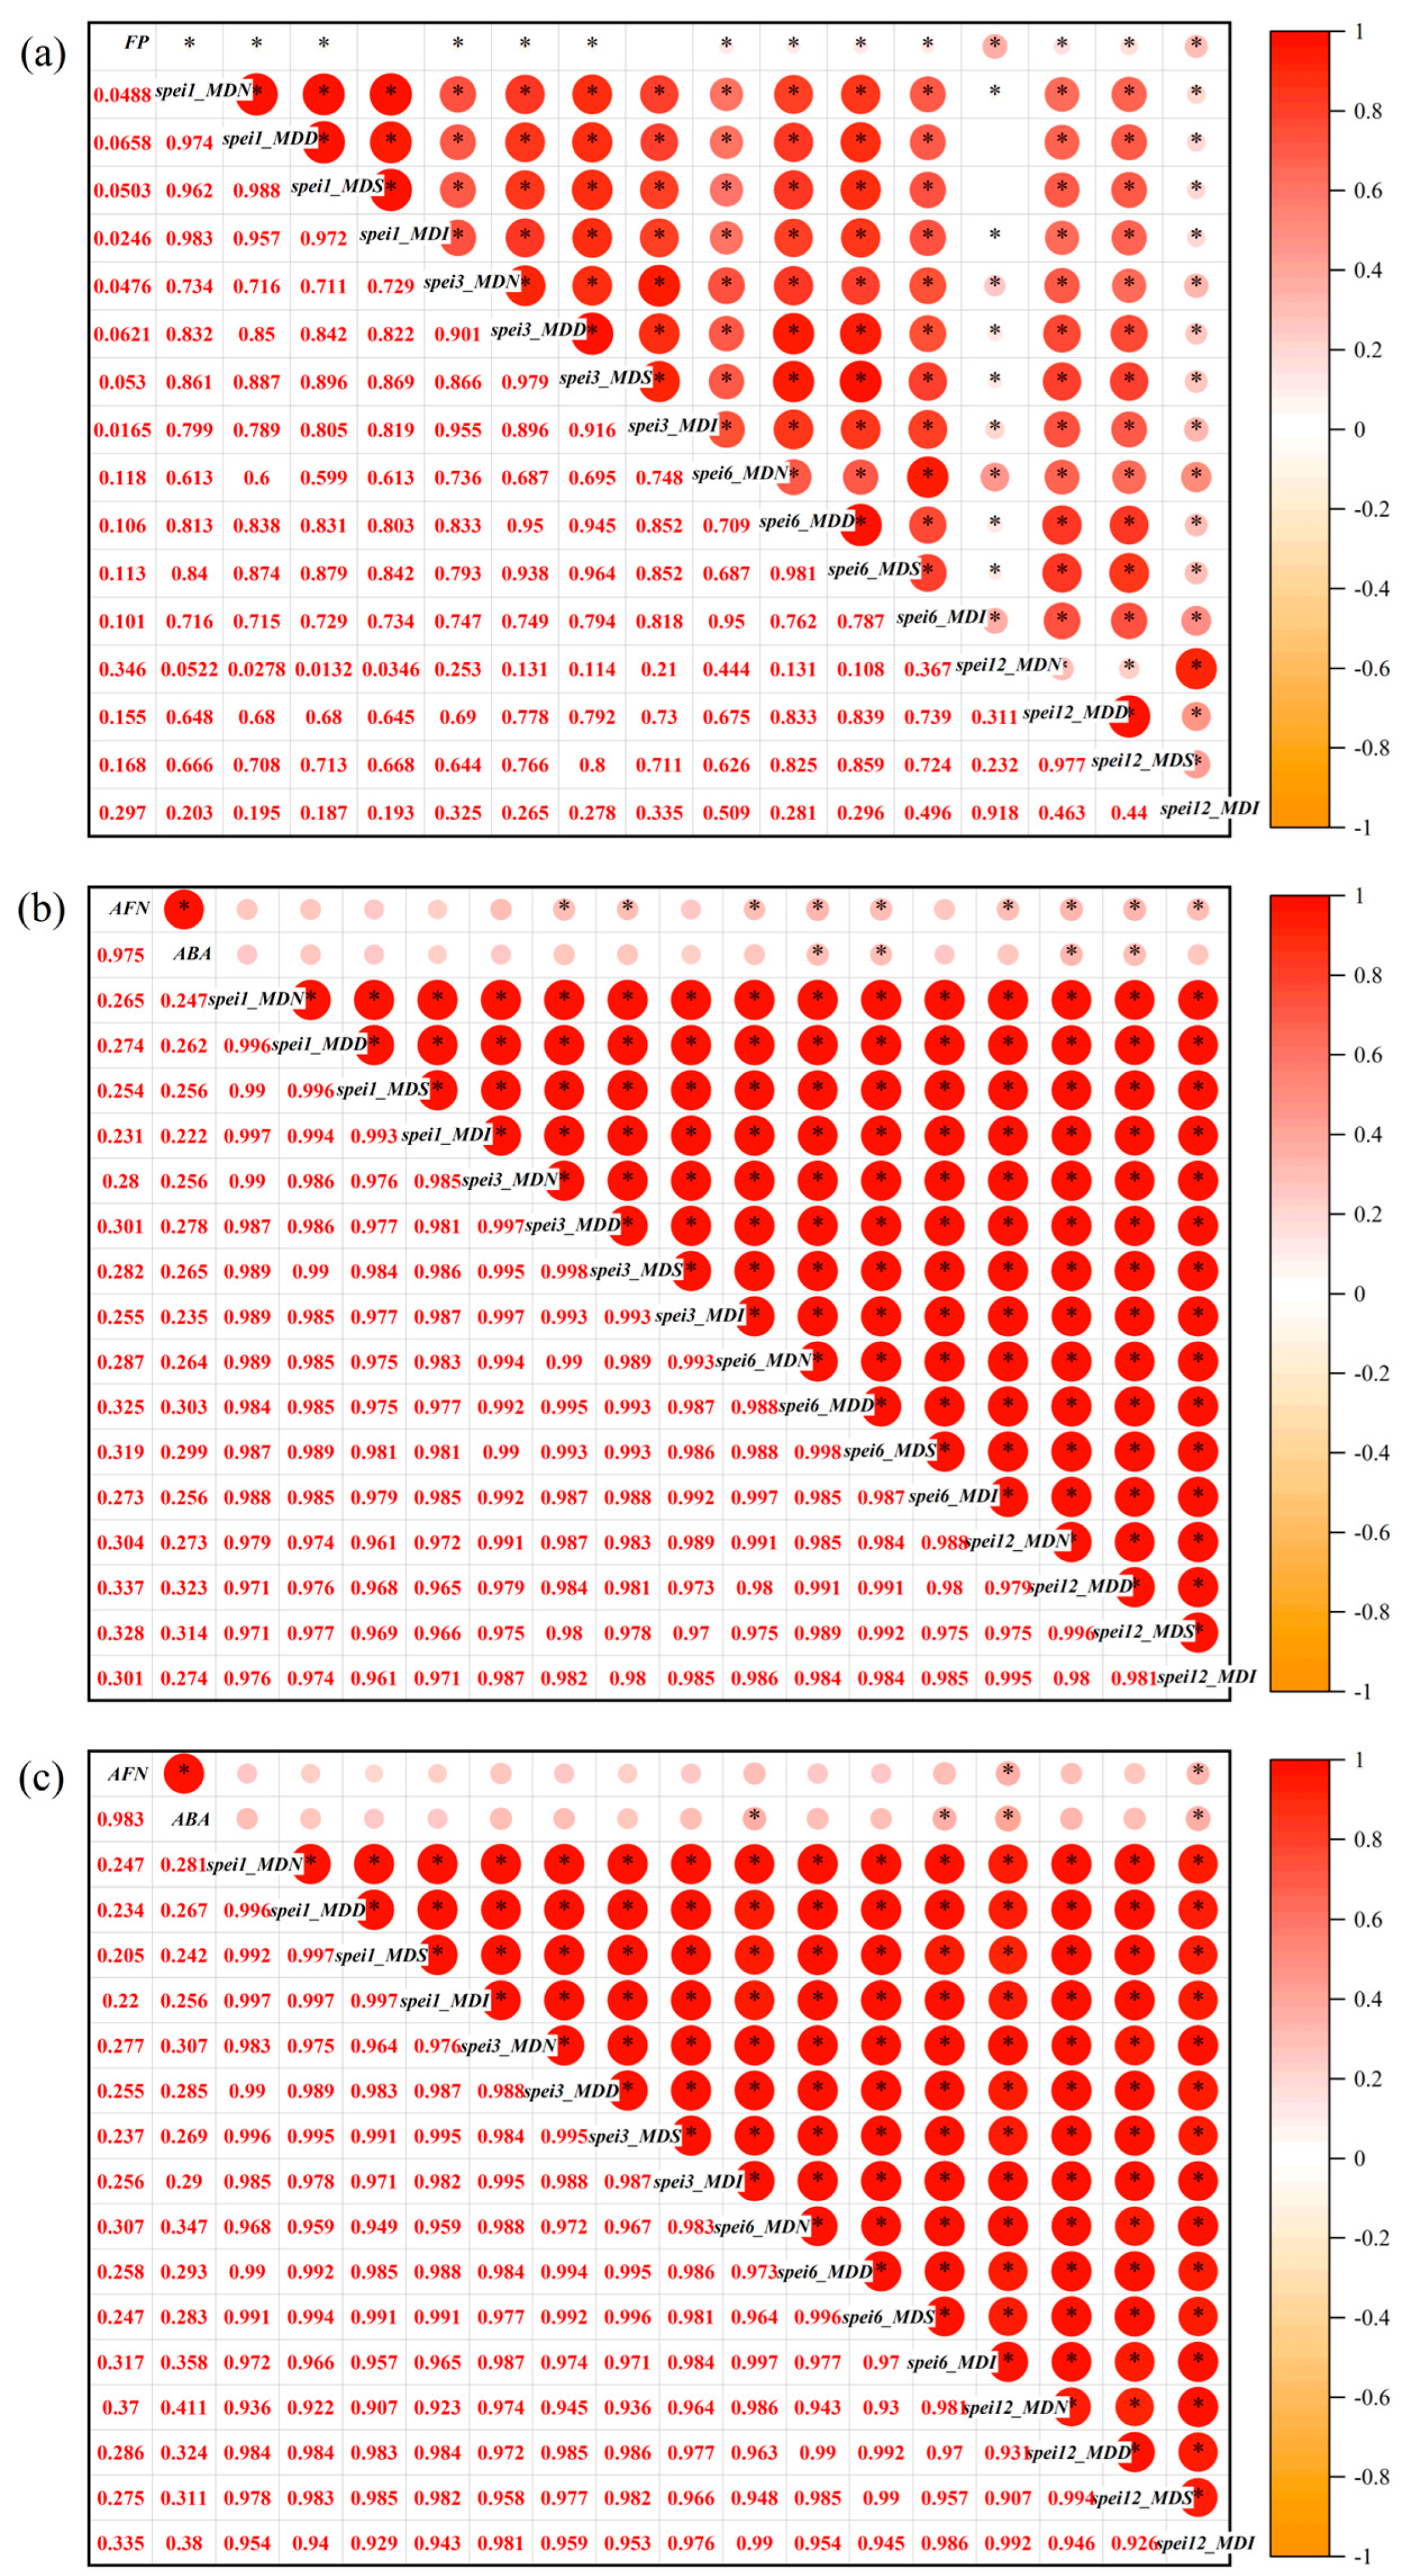
3.2. Correlation Analysis Results

We found that there is a significant positive correlation between forest fire regimes and drought characteristics, the number of drought events, drought duration, degree, and intensity at several scales (Figure 4). Our results were consistent with previous research [107]. However, correlations between forest fire regimes and drought characteristics were inconsistent across temporal and spatial combinations, with positive correlations tending to increase with increasing time scales, and extended drought periods may lengthen the wildfire season, keeping fuels dry for longer periods [108]. Prolonged drought also leads to increased evapotranspiration from forests, further exacerbating water deficits [59]. At the climate zone scale, forest fire regimes are more sensitive to drought duration and severity, but the opposite is true at the vegetation zone scale. This may be related to the fact that the same climate types do not differ much in precipitation and temperature, resulting in small differences in their drought amounts and drought class intensities [109], while at the same time, drought influences wildfire fuel accumulation through duration and severity [110].
At the grid-cell spatial scale and the 1- and 3-month temporal scales, forest fire occurrence probability and drought characteristics (MDN, MDD, and MDS) had a significant positive correlation (p < 0.05), and the most highly correlated characteristic was MDD (r = 0.0658; r = 0.0621). However, at the 6- and 12-month temporal scales, forest fire occurrence probability and drought characteristics (MDN, MDD, MDS, and MDI) showed a significant positive correlation (p < 0.05), and the most highly correlated characteristic was MDN (r = 0.118; r = 0.346) (Figure 4a, Table 4).
At the climate zone spatial scale and 1-month temporal scales, both AFN and ABA had positive correlations with MDN, MDD, MDS, and MDI, respectively, and the most highly correlated characteristic was MDD (r = 0.274; r = 0.262). At the 3-month temporal scale, AFN had a significantly positive correlation (p < 0.05) with both MDD and MDS, and ABA was positively correlated with MDN, MDD, MDS, and MDI, respectively; the most highly correlated characteristic was MDD (r = 0.301; r = 0.278). At the 6-month temporal scale, AFN had a significantly positive correlation (p < 0.05) with MDN, MDD, and MDS, while the ABA was correlated with MDD and MDS; the most highly correlated characteristic was MDD (r = 0.325; r = 0.303). At the 12-month temporal scale, AFN had a significantly positive correlation with MDN, MDD, MDS, and MDI, respectively (p < 0.05), and ABA was correlated with MDD and MDS; the most highly correlated characteristic was MDD (r = 0.337; r = 0.323) (Figure 4b, Table 4).
At the grid-cell spatial scale and the 1- and 3-month temporal scales, forest fire occurrence probability and MDD correlations were the highest, and at the climate zone scale, forest fire regimes and MDD correlations were the highest. This may be due to prolonged periods of drought along with high temperatures favoring higher evapotranspiration rates, subsequently reducing the moisture content of dead fuels [111]. Ultimately, increasing fuel flammability and forest fire occurrence probability [112], particularly in subtropical regions with abundant fuel loads, the effects of drought on wildfires usually occur after a period of sustained fuel drying [113]. High temperatures increase the severity of drought by prolonging the agricultural drought period and increasing the likelihood of large forest fires [5]. Hydrologic drought also affects the area burned by influencing soil and fuel moisture through the duration and total flow of water [114].
At the vegetation zone spatial scale and 1-month temporal scales, both AFN and ABA had positive correlations with MDN, MDD, MDS, and MDI, respectively, and the most highly correlated characteristic was MDD (r = 0.247; r = 0.281). At the 3-month temporal scale, both AFN and ABA had positive correlations with MDN, MDD, MDS, and MDI, respectively, and the most highly correlated characteristic was MDD (r = 0.277; r = 0.307). At the 6-month temporal scale, AFN showed a positive correlation with MDN, MDD, MDS, and MDI, respectively, and ABA had a significantly positive correlation with both MDN and MDI (p < 0.05); the most highly correlated characteristic was MDI (r = 0.317; r = 0.358). At the 12-month temporal scale, both AFN and ABA showed a significantly positive correlation with MDN and MDI (p < 0.05), and the most highly correlated characteristic was MDD (r = 0.37; r = 0.411) (Figure 4c, Table 4).
Forest fire occurrence probability had the highest correlation with MDN at the 6- and 12-month time scales, and forest fire regime had the highest correlation with the number of droughts at the vegetation zone scale and the 1-, 3-, and 12-month time scales. However, forest fire regimes (forest fire number and forest fire area) and MDI correlations were the highest at the vegetation zone scale and the 6-month time scale. Forest fuel ignition is largely dependent on moisture content, and frequent and prolonged moisture deficits make fuels drier and more flammable [115], which can significantly increase the probability of forest fires. The probability of forest fires is most strongly correlated with MDN and MDI in hydrologic droughts, with prolonged meteorological droughts propagating into hydrologic droughts, as well as frequent and high-intensity surface water shortages significantly increasing the probability of forest fires [114]. Frequent and intense agricultural droughts also reduce fuel moisture and lead to an increase in fuel burning [107], which, in turn, causes intense fire behavior.

3.3. Goodness of Fit for Forest Fire Prediction Models

Table 5 lists the indicators for assessing the performance of the models for predicting the probability of forest fire occurrences. In general, the AUCs of the GWLR models were higher than those of the GLR models at the 1-, 3-, 6-, and 12-month scales, while the   A I C c s reported the opposite trend, indicating that the GWLR models performed better than GLR models in predicting forest fire occurrence probability. The best temporal scale was the 1-month scale according to the AUC and the 3-month scale based on A I C c .
Table 6 shows the indicators for assessing the performance of the models for predicting the number of fires and the area burned. The results showed that the GWPR models for predicting the number of forest fires perform better than the GPR models, and the GWR models for predicting the area burned perform better than the GR models at various spatial and temporal scales, indicating that considering spatial non-stationarity can improve the performance of forest fire prediction models. We also found that models at various temporal scales, both for the number of fires and the area burned at the vegetation zone scale, are more accurate than those at the climate zone scale. At the vegetation zone scale, the number of fires could be predicted using the GWPR models, as indicated by the higher values of R2 (>0.60), while the area burned could be predicted using the GWR models, with values of R2 greater than 0.50 at the four temporal scales. However, at the climate zone scale, both the number of fires and the area burned could not be well-predicted, as indicated by the lower values of R2 (<0.40) at the four temporal scales.

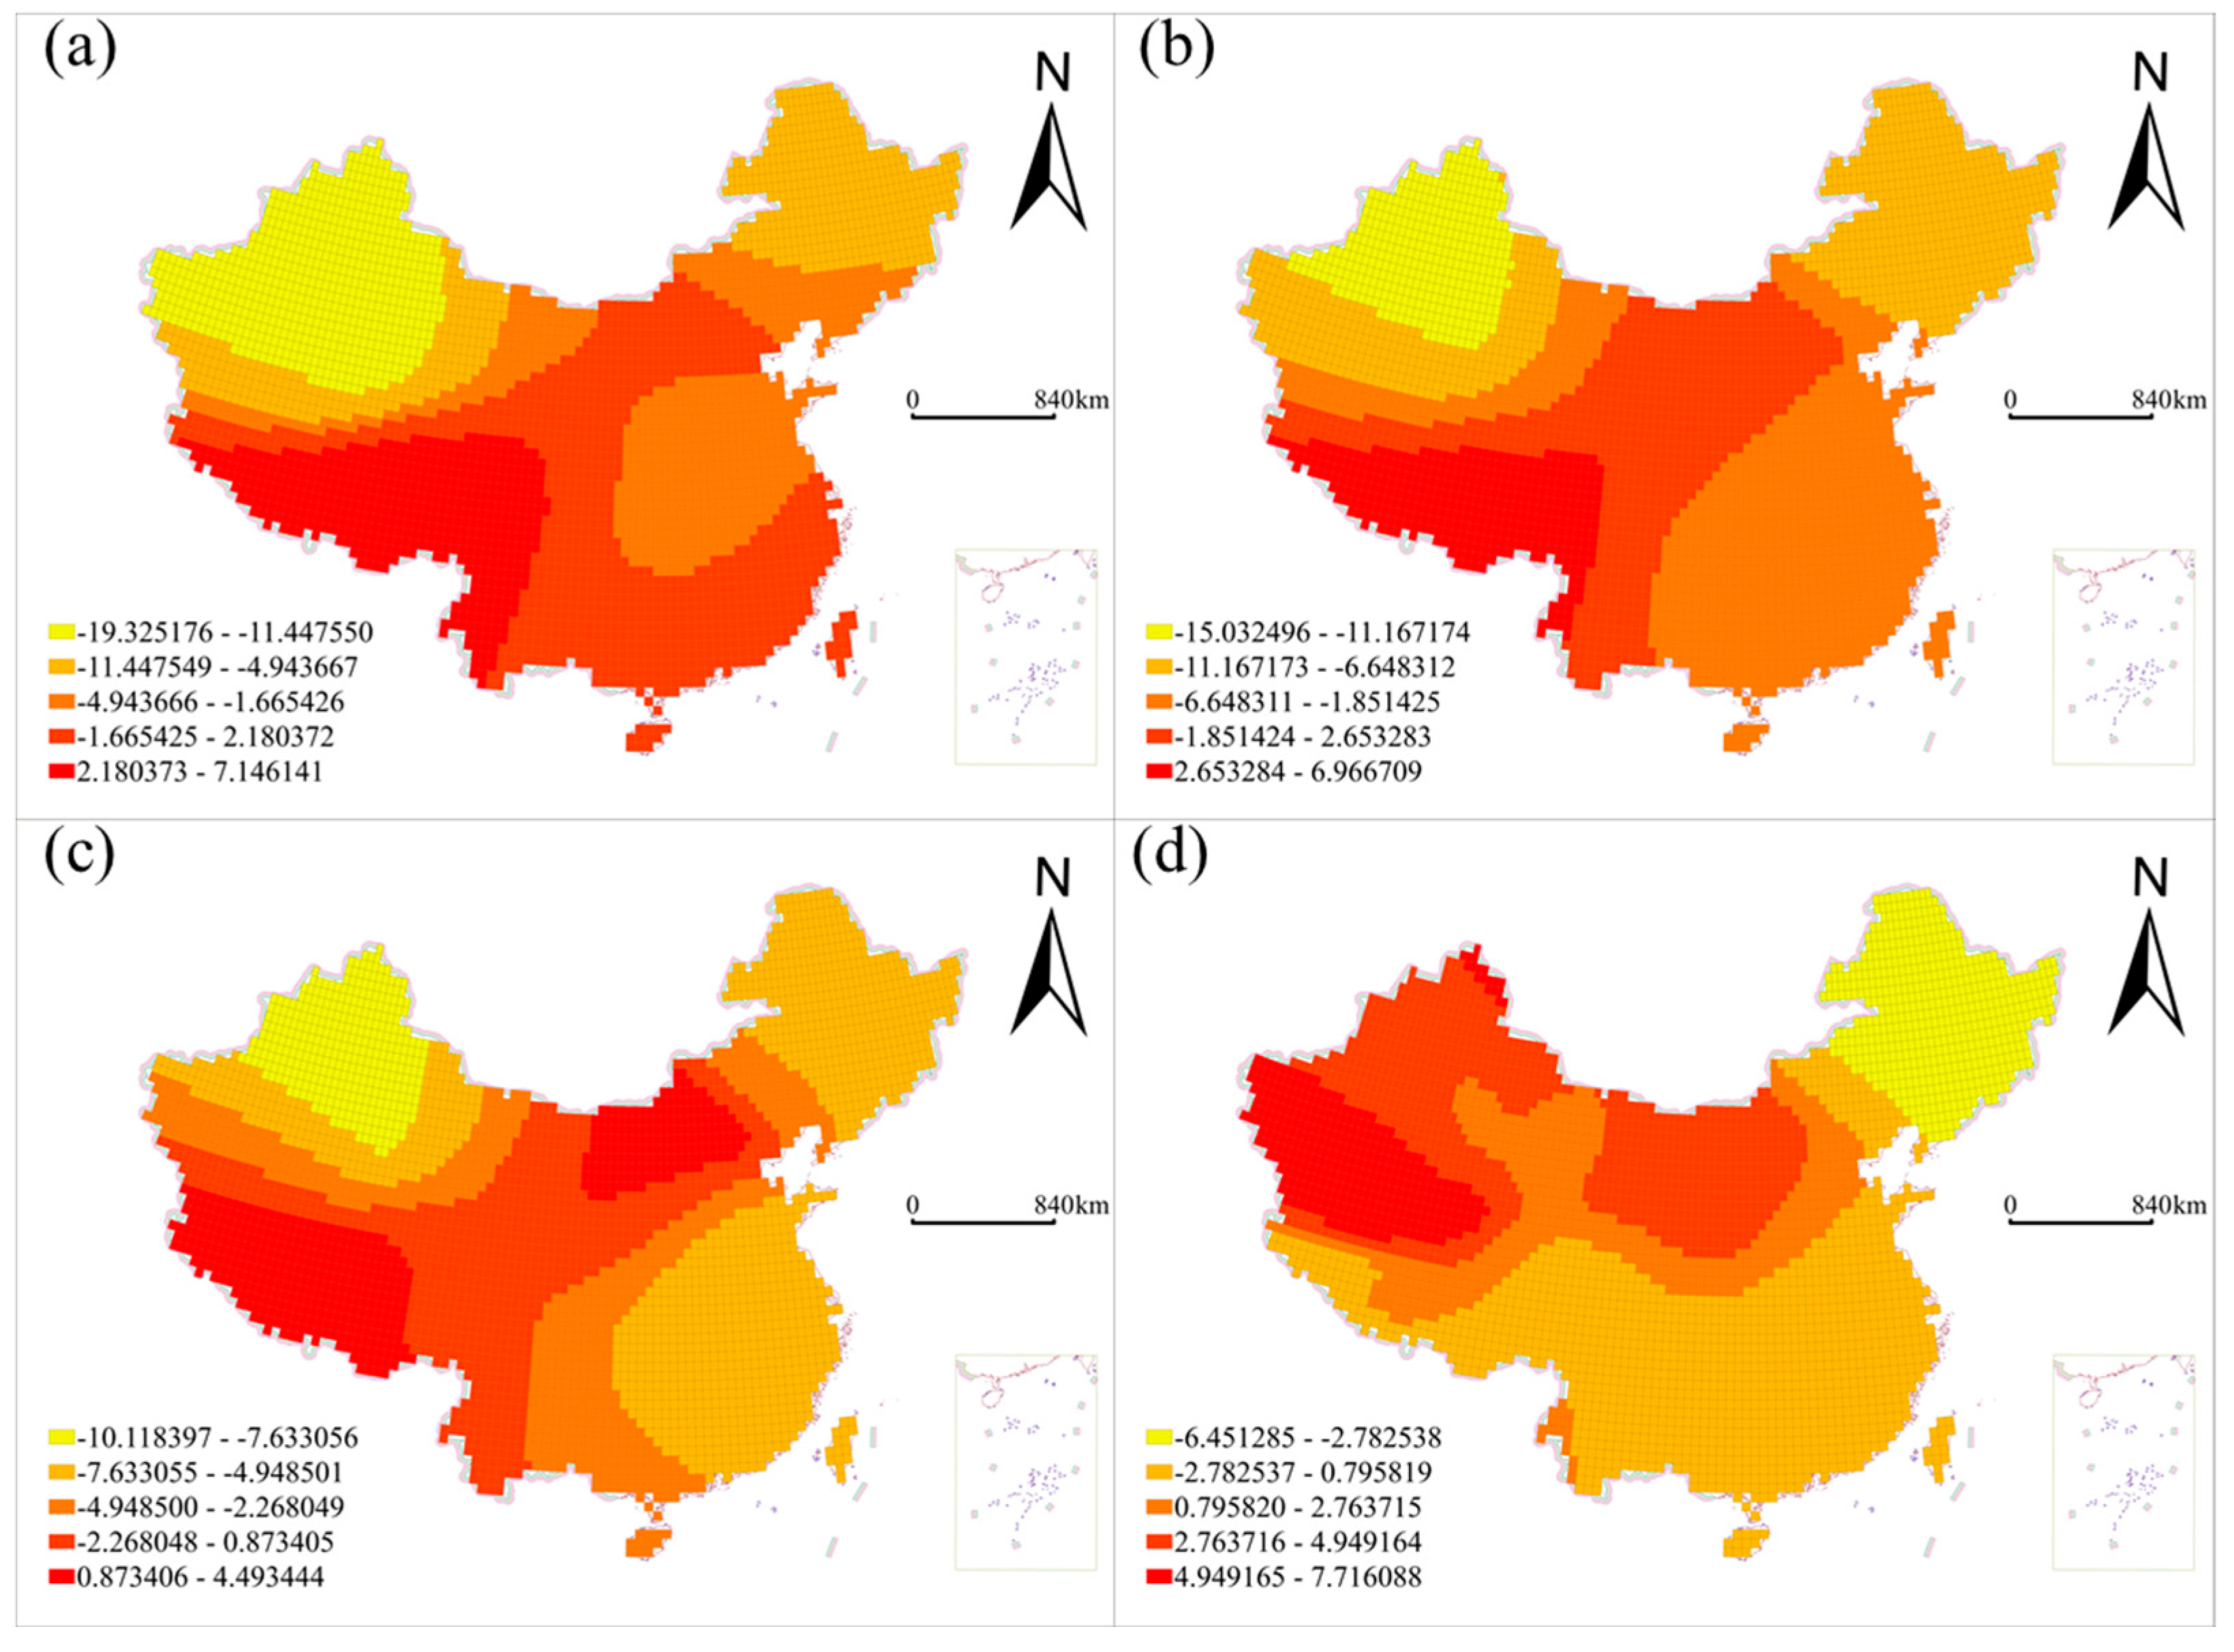
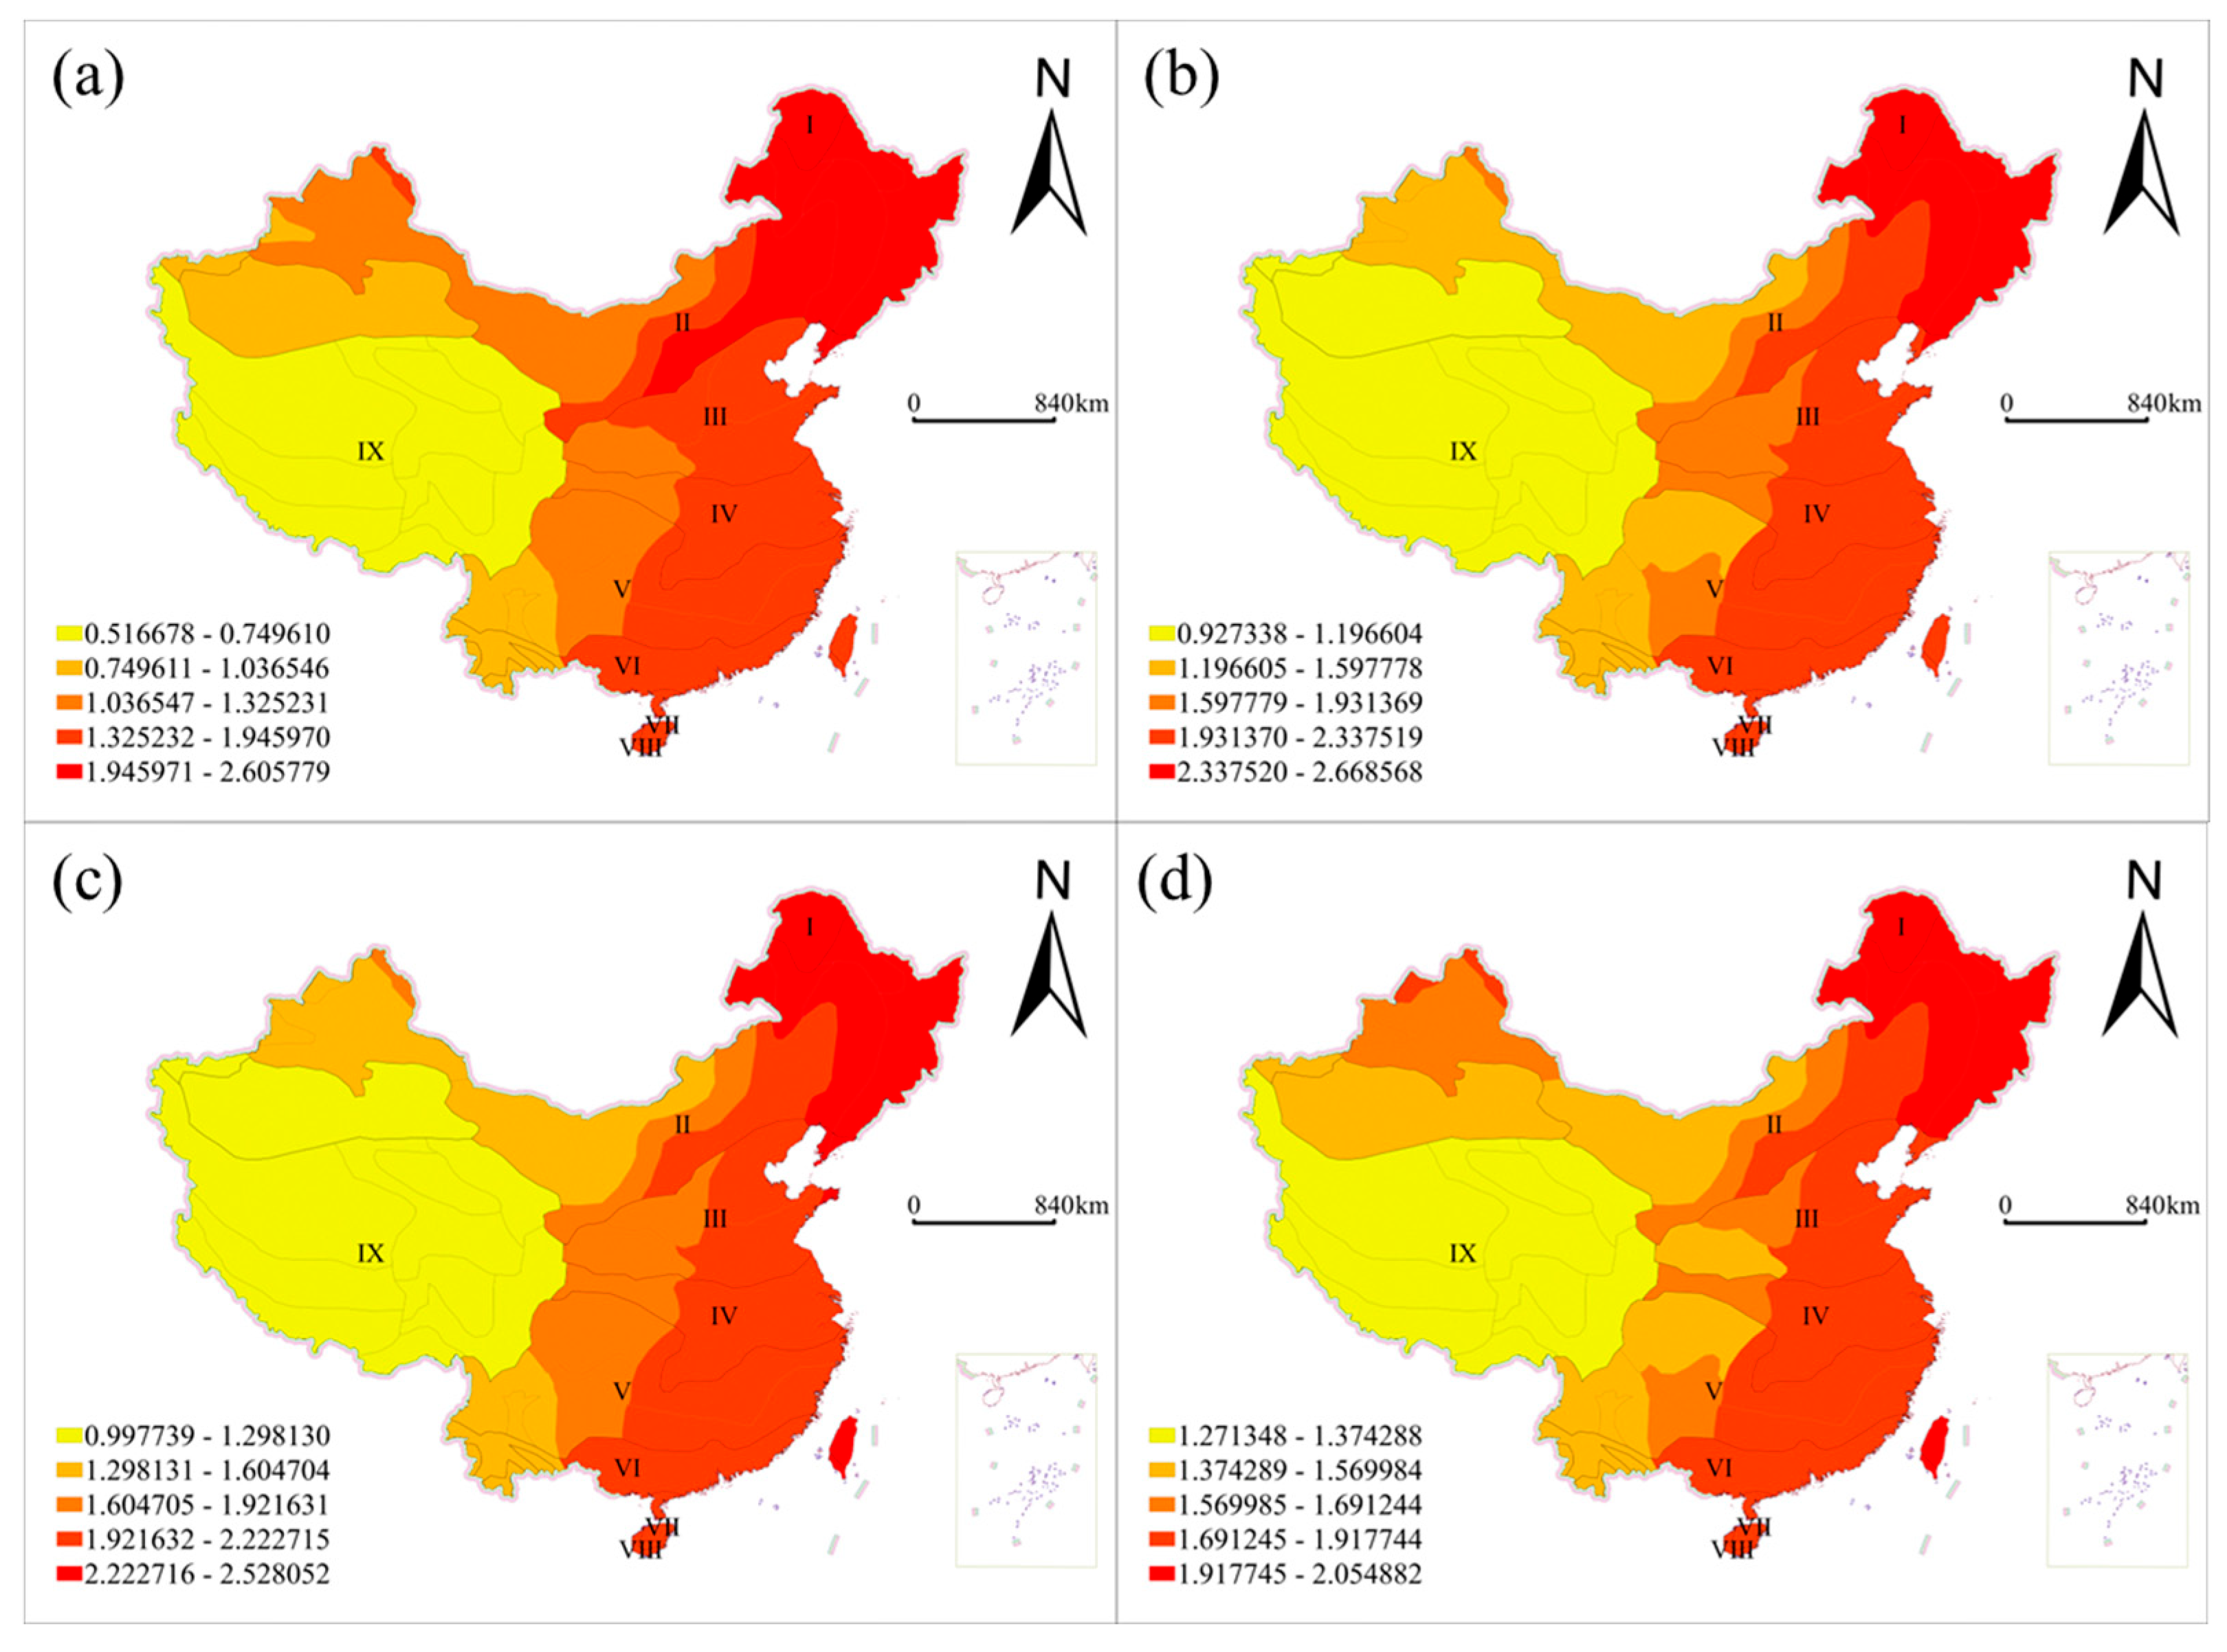
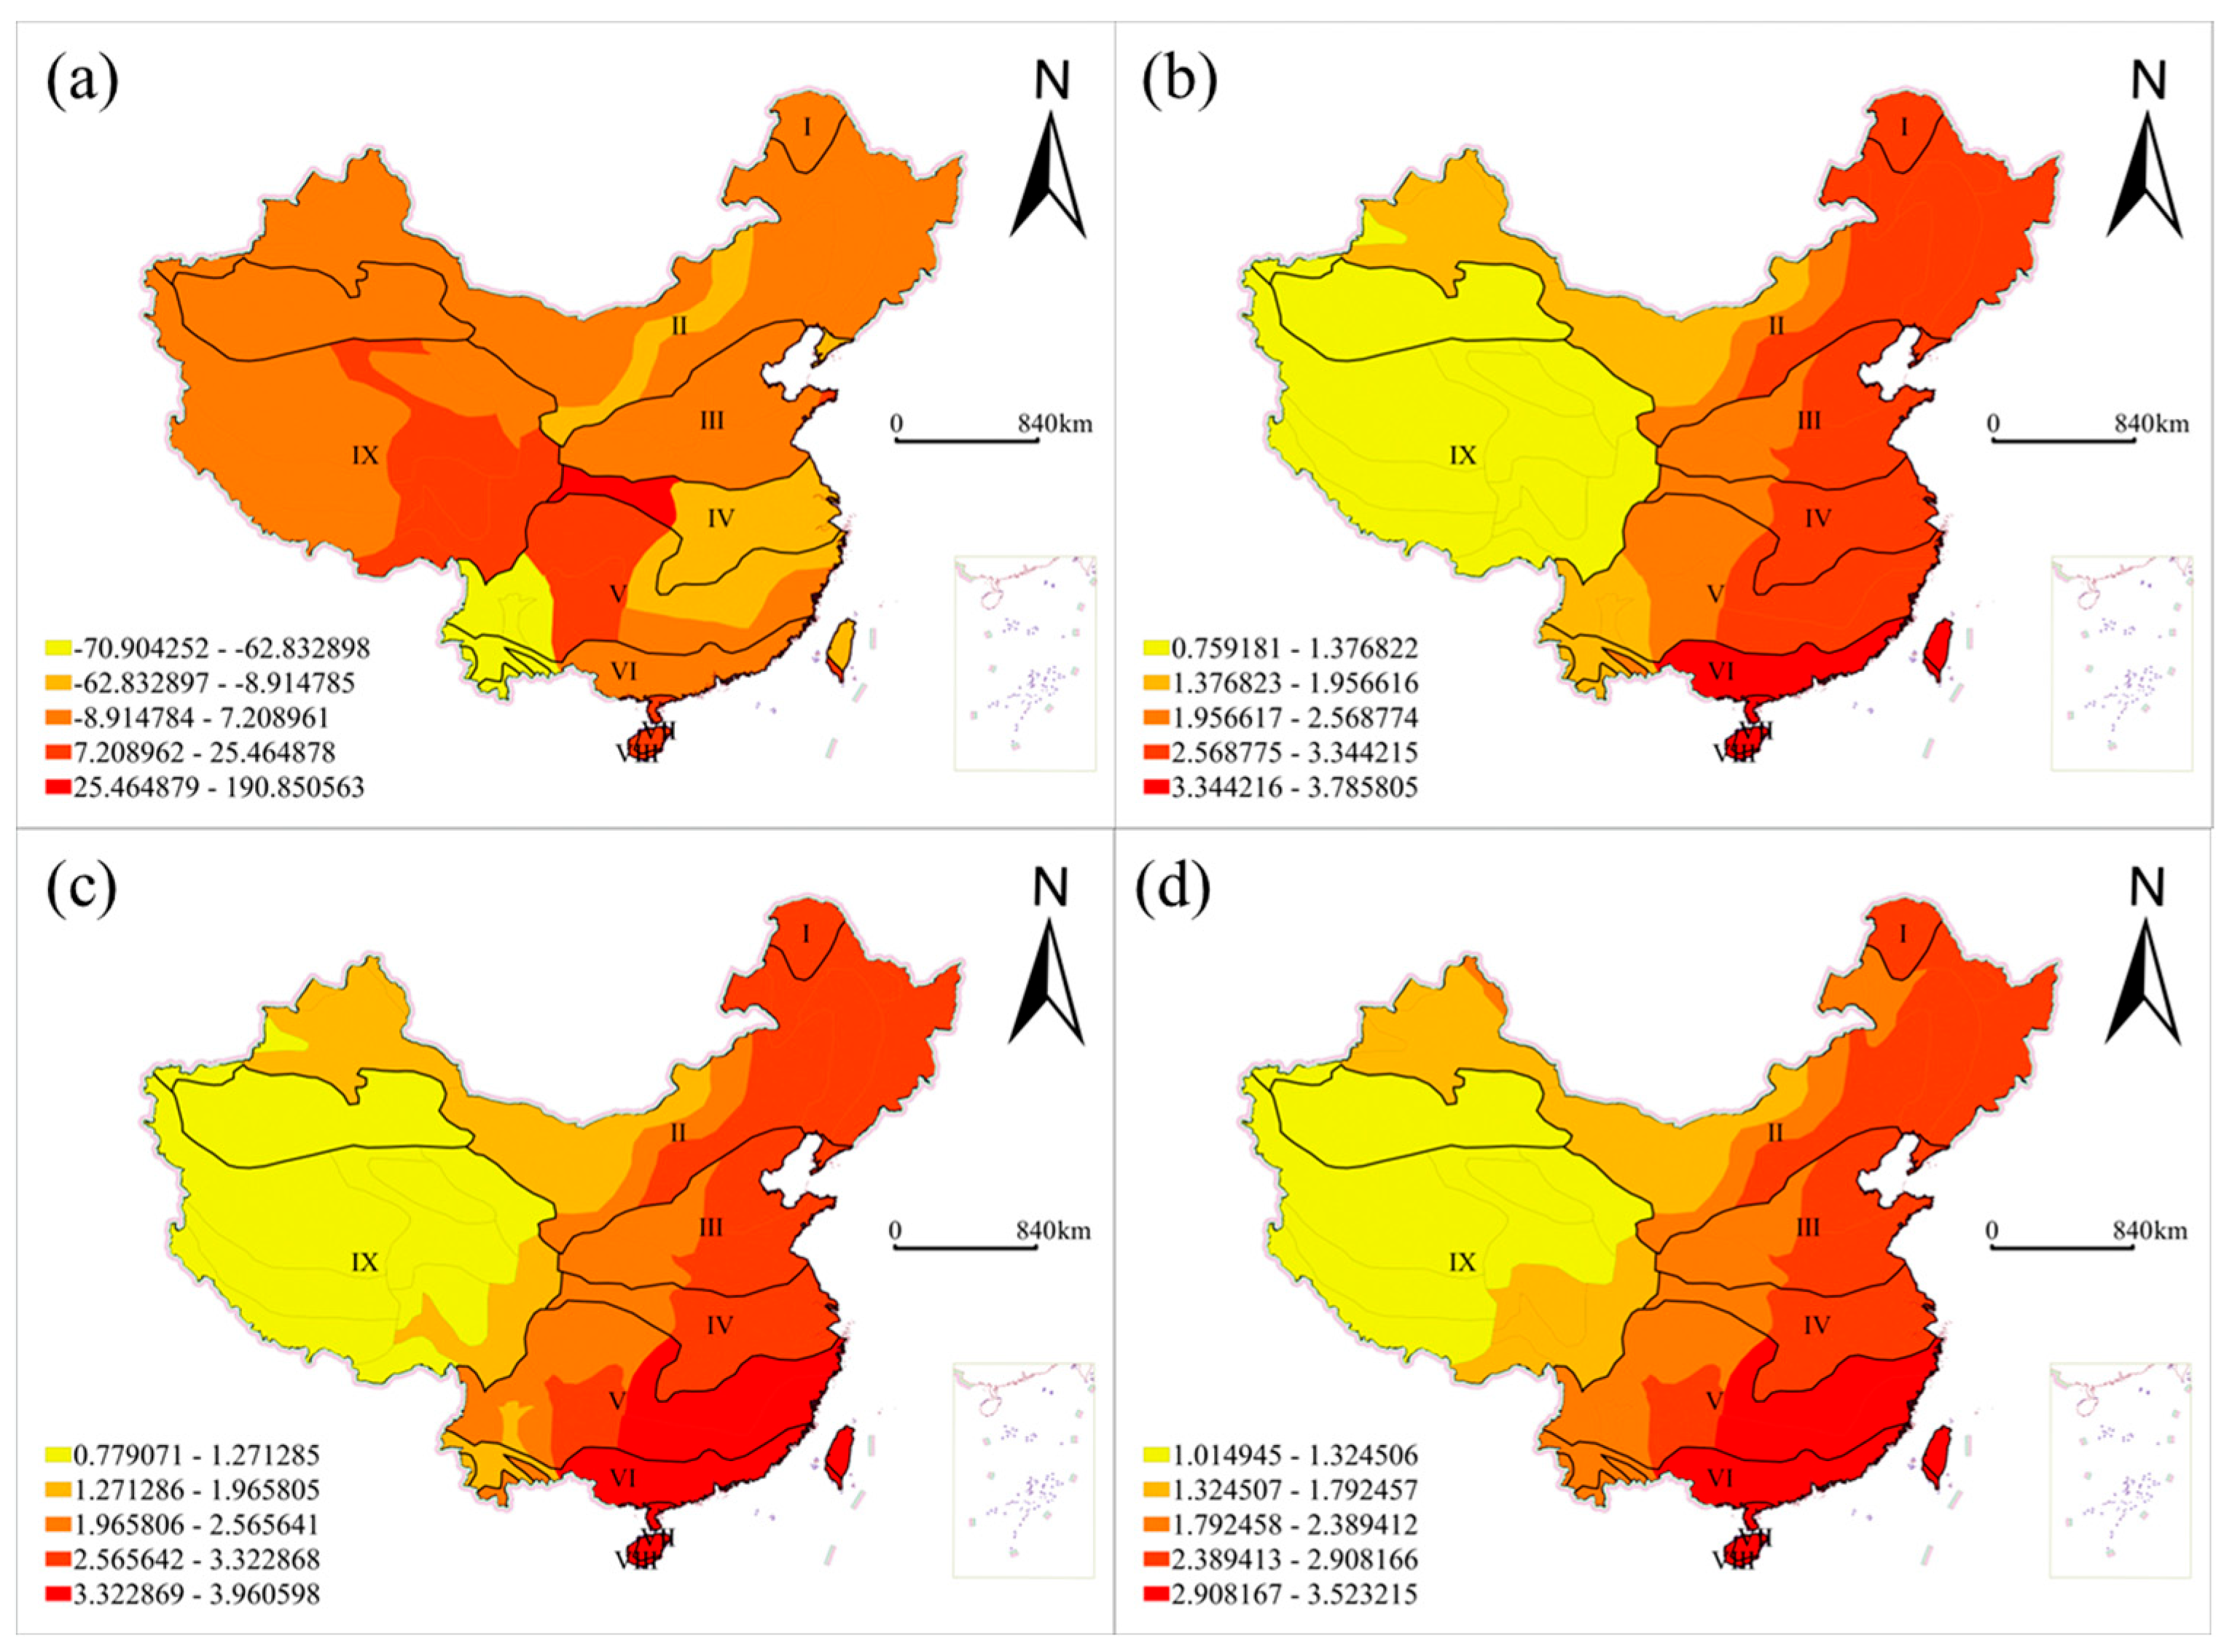
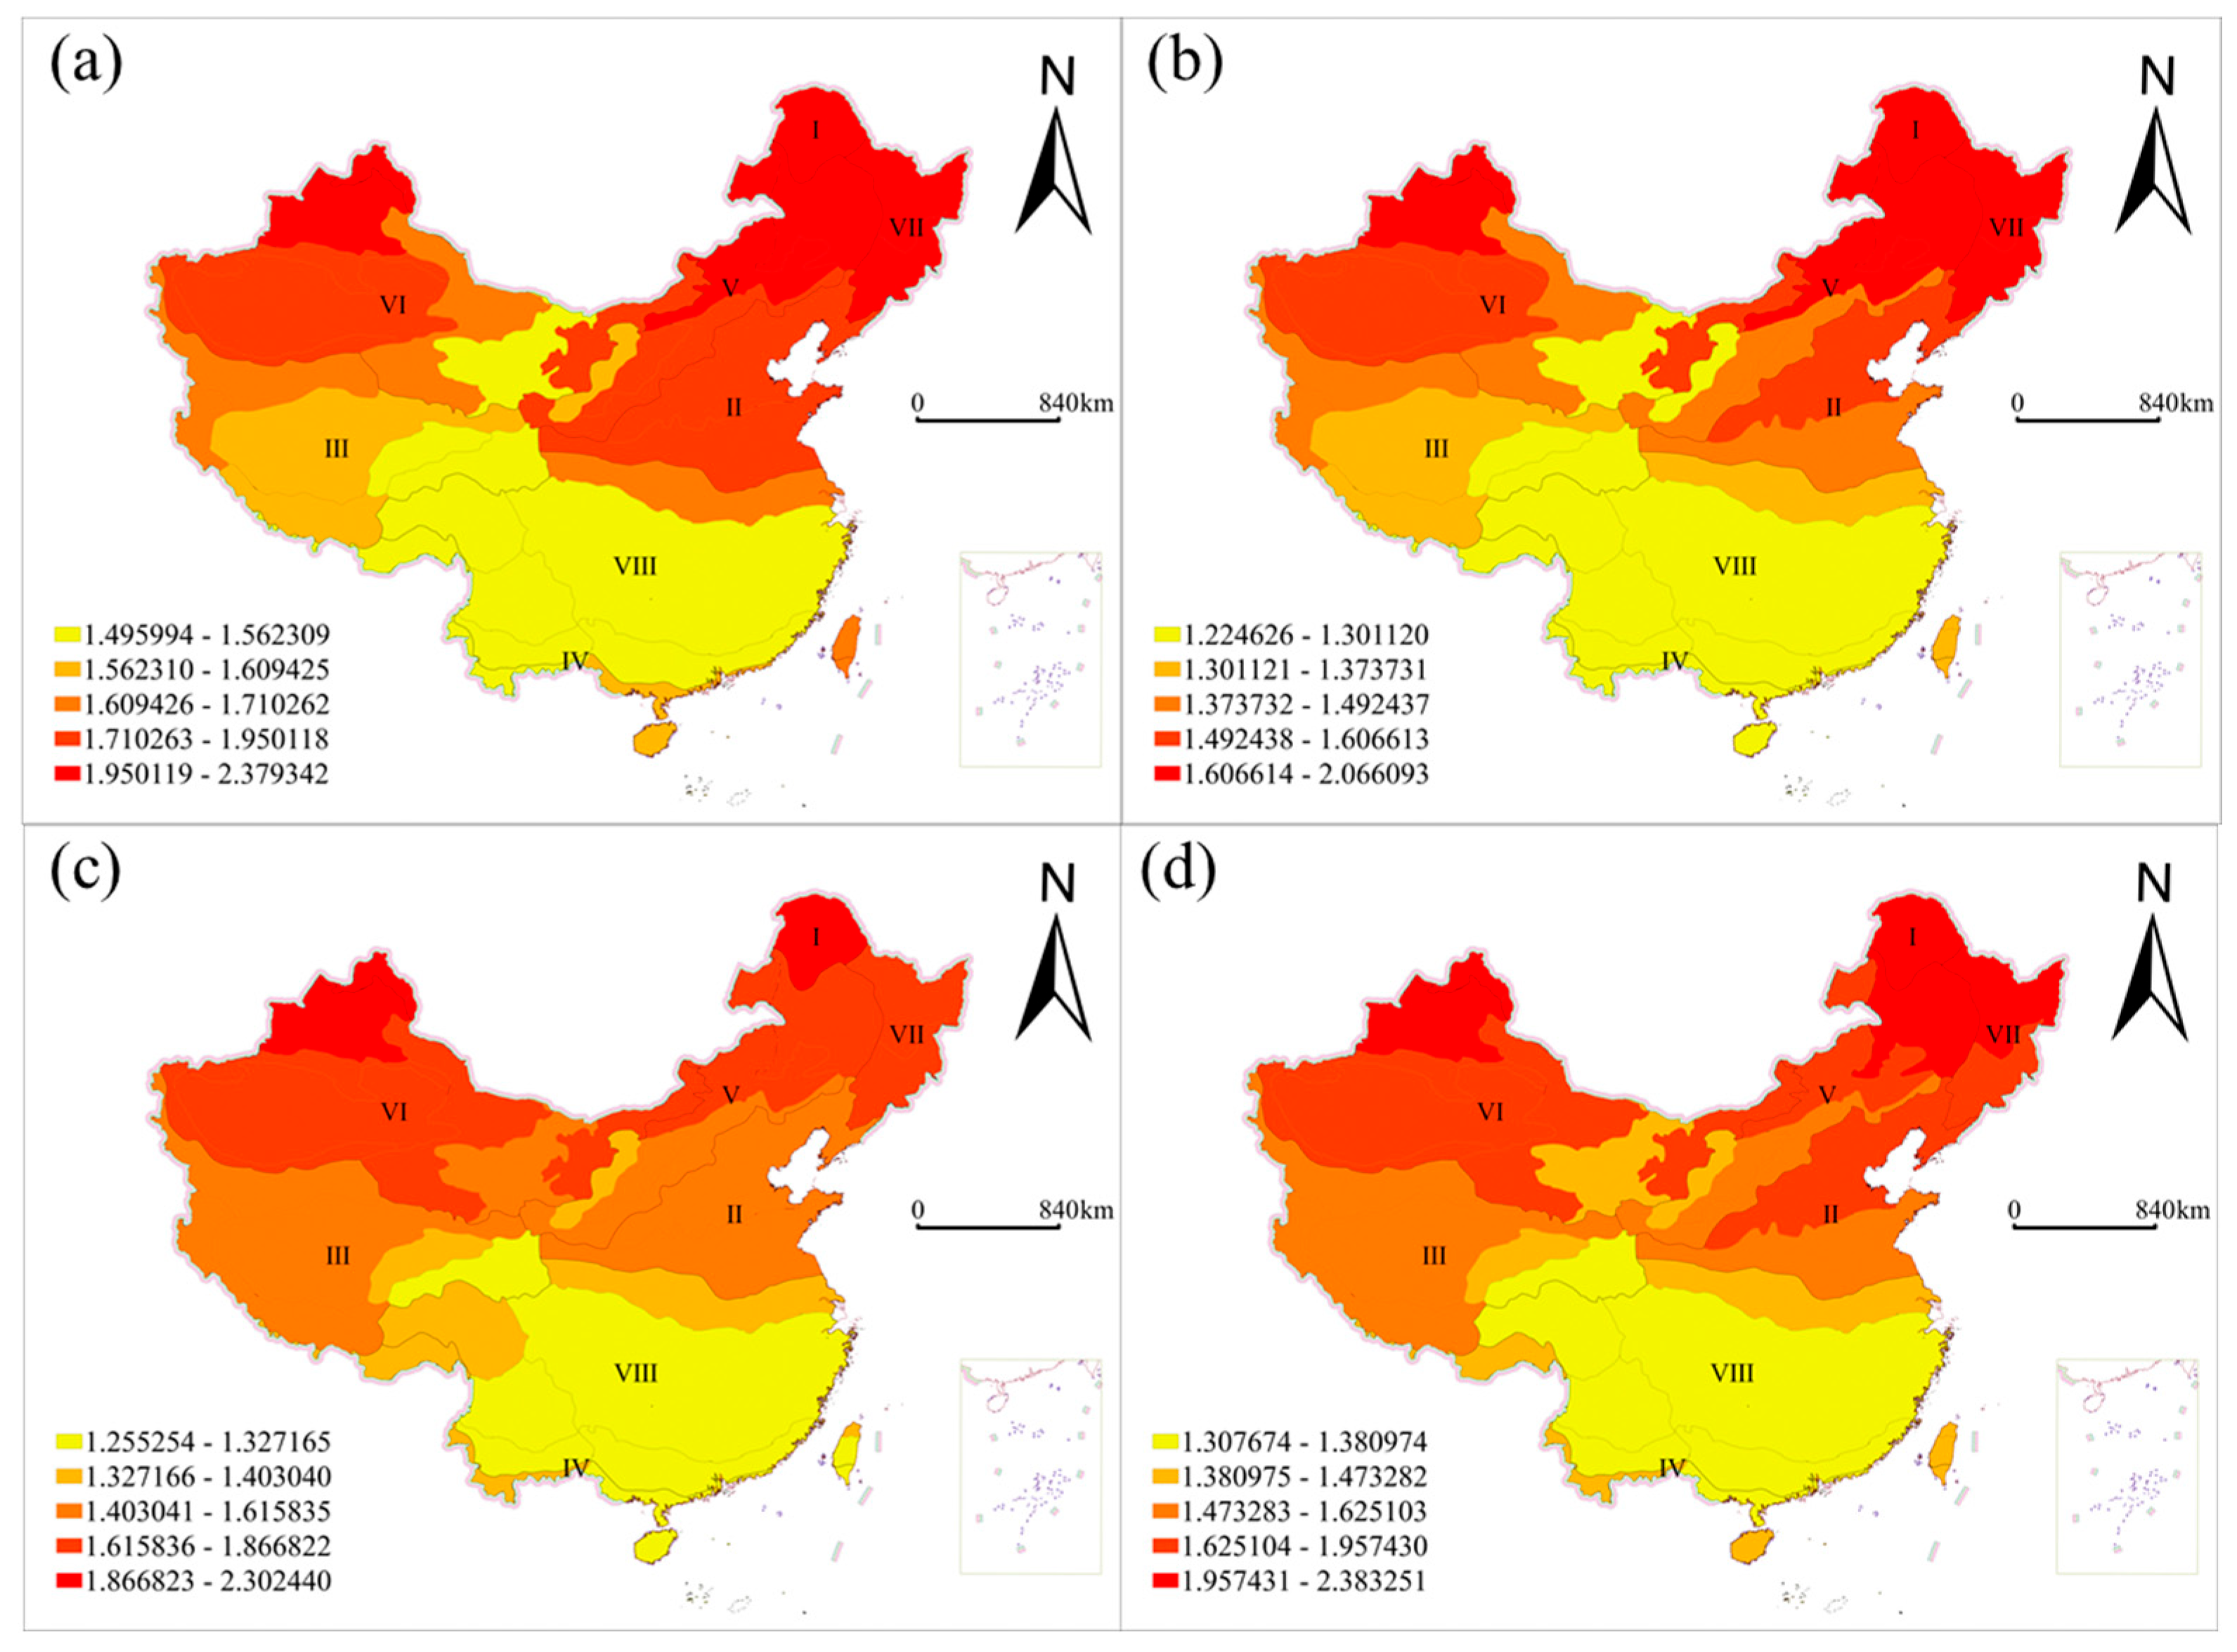
3.4. Spatial Non-Stationarity of the Effects of Drought Characteristics on Forest Fire Regimes

We found a large spatial non-stationarity in the relationship between forest fire regimes and drought characteristics at different spatial scales. Forest fire occurrence is the result of a combination of ignition sources and fire spread conditions, including fuel and meteorology [75]. Based on the drought characteristics derived from the SPEI, we modeled forest fire regimes (forest fire occurrence probability, number of fires, and burned area) at various spatial and temporal scales.
The spatial correlation coefficients between forest fire occurrence probability and selected drought characteristics at the grid-cell scale are shown in Figure 5. The negative correlation between the forest fire occurrence probability and SPEI-1 drought duration is mainly distributed in the northeast and northwest regions, while the positive correlation is in the southwest regions (Figure 5a). The negative correlation between the forest fire occurrence probability and both SPEI-3 drought duration (Figure 5b) and SPEI-6 drought number (Figure 5c) is mainly distributed in the northeast, northwest, and southeast regions, and a positive correlation is observed in the southwest region. The negative correlation between the forest fire occurrence probability and SPEI-12 drought number (Figure 5d) is mainly distributed in the northeast region, and a positive correlation is observed in the northwest region.
At the grid-cell scale, we found that forest fire occurrence probability has a negative correlation with drought duration at one month (Figure 5a) and three months (Figure 5b), and several drought events are observed at the six-month scale (Figure 5c) in the majority of China, especially in the northwest. This is contrary to previous studies, which show that drought increases forest fire occurrence probability [107,113]. In northwest China, the westerly winds often meet with the Asian monsoon, the cold and dry westerly winds prevail in winter, and the warm and humid moisture carried by the Asian monsoon is barely able to replenish the northwest in summer, resulting in the predominantly arid climate of the northwest [116], where vegetation cover is limited, with lower fuel loads and less continuity [23]. Zhao et al., (2024a) also indicate that inland areas of western China are more vulnerable to drought [117]. Therefore, forest fire occurrence probability is lower despite the enhanced drought conditions. We also observed that forest fire occurrence probability was negatively correlated with the number of drought events at the 12-month time scale in the northeast and southern regions, which are close to the ocean, with sufficient rainfall and high vegetation cover to mitigate the occurrence of drought events [118] resulting in smaller values of the long-term drought characteristics revealed by the SPEI-12 compared to the other regions; however, the probability of forest fires in this region is higher. Except for the fuel and climate aspects, the effective management of forest fire ignition sources also substantially contributes to the negative effects. The majority of forest fires are caused by humans in China [119,120], and the government has been implementing strict fire management policies that limit people from entering forests during fire seasons. This policy greatly reduces forest fire occurrence even with hot and dry weather conditions [121].
The spatial correlation coefficients between the number of forest fires and drought characteristics at the climate zone scale are shown in Figure 6, and the correlation between the number of forest fires and burned area is shown in Figure 7. The number of forest fires and burned areas was positively correlated with drought duration at the SPEI-1, SPEI-3, SPEI-6, and SPEI-12 scales, and the correlation decreased from east to west, with the weakest correlation being observed in the plateau climate zone (IX). The negative correlation between the burned area and SPEI-1 drought duration at the climate zone scale was the strongest in the west of the middle subtropical zone (V), the south subtropical zone (VI), and the north tropic zone (VII), while the positive correlation extremes are distributed around the negative correlation extremes.
At the climate zone scale, forest fire numbers and drought characteristics show a positive correlation, and the correlation decreases from east to west (Figure 6), with forest fires often occurring in moderately wet areas, where drying levels are high compared to the local wet state, which alters local fuel flammability [23]. The large spatial variability in the correlation between the burned area and SPEI-1 drought characteristics (Figure 7a) may be due, in part, to the short-term surface water anomalies reflected by the SPEI at a monthly time scale, and partly because the monthly scale SPEI does not consider the effects of past precipitation and temperature; therefore, the monitoring results are somewhat random [122]. The burned area and SPEI-3, SPEI-6, and SPEI-12 drought characteristics showed a positive correlation, and the correlation weakened from east to west (Figure 6b–d) because shorter-duration drought events are frequent in humid areas [123], which dries out fuels, and humid environments help plant growth and can produce sufficient fuel [23], resulting in larger burned areas. This is similar to the findings of Zhao et al. 2024b, which pointed to relatively favorable drought conditions and a high probability of drought in much of the humid subtropics [124]. We also found that the forest fire number and drought characteristics were less correlated in the plateau climate zone (IX). This may be because the vegetation types in this region are dominated by coniferous forests and alpine meadows, which have a low leaf area index and evapotranspiration, leading to their relatively low water requirements [125]. Moisture may not be a major limiting factor for vegetation growth in the region [126]. Meanwhile, under low temperatures and high water vapor conditions, heat may be more important than moisture for vegetation growth at high altitudes [127]. Therefore, the response of vegetation to extreme drought may not be prominent at high altitudes [128]. Liu et al., (2024) also pointed out that the Tibetan Plateau is highly resistant to drought [129].
The spatial correlation coefficients between the number of forest fires and drought characteristics at the vegetation zone scale are shown in Figure 8, and the correlation coefficients between the number of forest fires and the burned area are shown in Figure 9. Both the number of forest fires and burned area were positively correlated with the average number of drought events at the SPEI-1, SPEI-3, and SPEI-12 time scales, as well as being positively correlated with the average drought intensity at the SPEI-6 time scale, with the maximum value of the correlation coefficients being located in the cold temperate coniferous forest region (I), the warm temperate deciduous broad-leaved forest region (II), the temperate grassland area (V), the temperate desert area (VI), and the temperate coniferous and deciduous broad-leaved mixed forest region (VII). The correlation between the number of forest fires and the number of SPEI-1 droughts, the number of SPEI-3 droughts, the intensity of SPEI-6 droughts, and the number of SPEI-12 droughts was the weakest in the tropical monsoon rainforest region (IV) and the subtropical evergreen broad-leaved forest region (VIII). The minimum value of the correlation between the burned area and SPEI-6 drought intensity and SPEI-12 drought duration was mainly distributed in the tropical monsoon rainforest region (IV) and the subtropical evergreen broad-leaved forest region (VIII).
At the vegetation zone scale, the forest fire number and drought characteristics showed a positive correlation, and the correlation was greater in the north than in the south (Figure 8), which may be due to the prevalence of hot weather in northern China, with a wide range of impacts and intensity [130], as well as the fact that the sensitivity of vegetation to temperature in northern China is higher than that in the south [131]. Han et al., (2021) also noted that the intensity and duration of drought in the north are greater than that in the south [132]. The water content of vegetation is affected by soil moisture [133]. However, soil moisture may be a viable water source for vegetation in humid areas [134]; thus, meteorological drought may not significantly affect soil moisture and vegetation in humid areas [135]. In addition, the higher correlation between the number of forest fires and the drought characteristics in the cold temperate coniferous forest region (I) may result from the moist humus layer underneath the forest, which is dried out by the persistent high temperatures during the fire season, causing frequent fires [23]. The positive correlation between the burned area and drought characteristics is high in (V) temperate grassland areas (Figure 9). Although the area belongs to the arid and semi-arid dry climate, due to the long-term exposure to soil moisture stress, the scrub and herbaceous vegetation can reduce water loss by changing the growth mechanism, which improves the water absorption capacity, enhancing its drought tolerance to provide fuel accumulation for fires [136]. Liu et al., (2024) also confirmed that the Inner Mongolian Plateau has a strong drought tolerance [129]. The burned area and SPEI-1 and SPEI-3 drought characteristics are less correlated in the temperate desert area (VI). This may be related to the fact that ecosystems in northwestern China have a high drought tolerance, resulting in their weaker sensitivity to short-term drought [137]. The spatial correlation coefficients between the burned area and drought characteristics generally show an increasing trend with increasing time scales in northwest China, which may be related to the fact that long-time-scale drought events mainly occur in arid and semi-arid regions [123]. We also found that the burned area and drought characteristics are highly correlated in cold temperate coniferous forest regions (I). This may be because the wood of coniferous forests contains high levels of resin, making it susceptible to large fires [23].

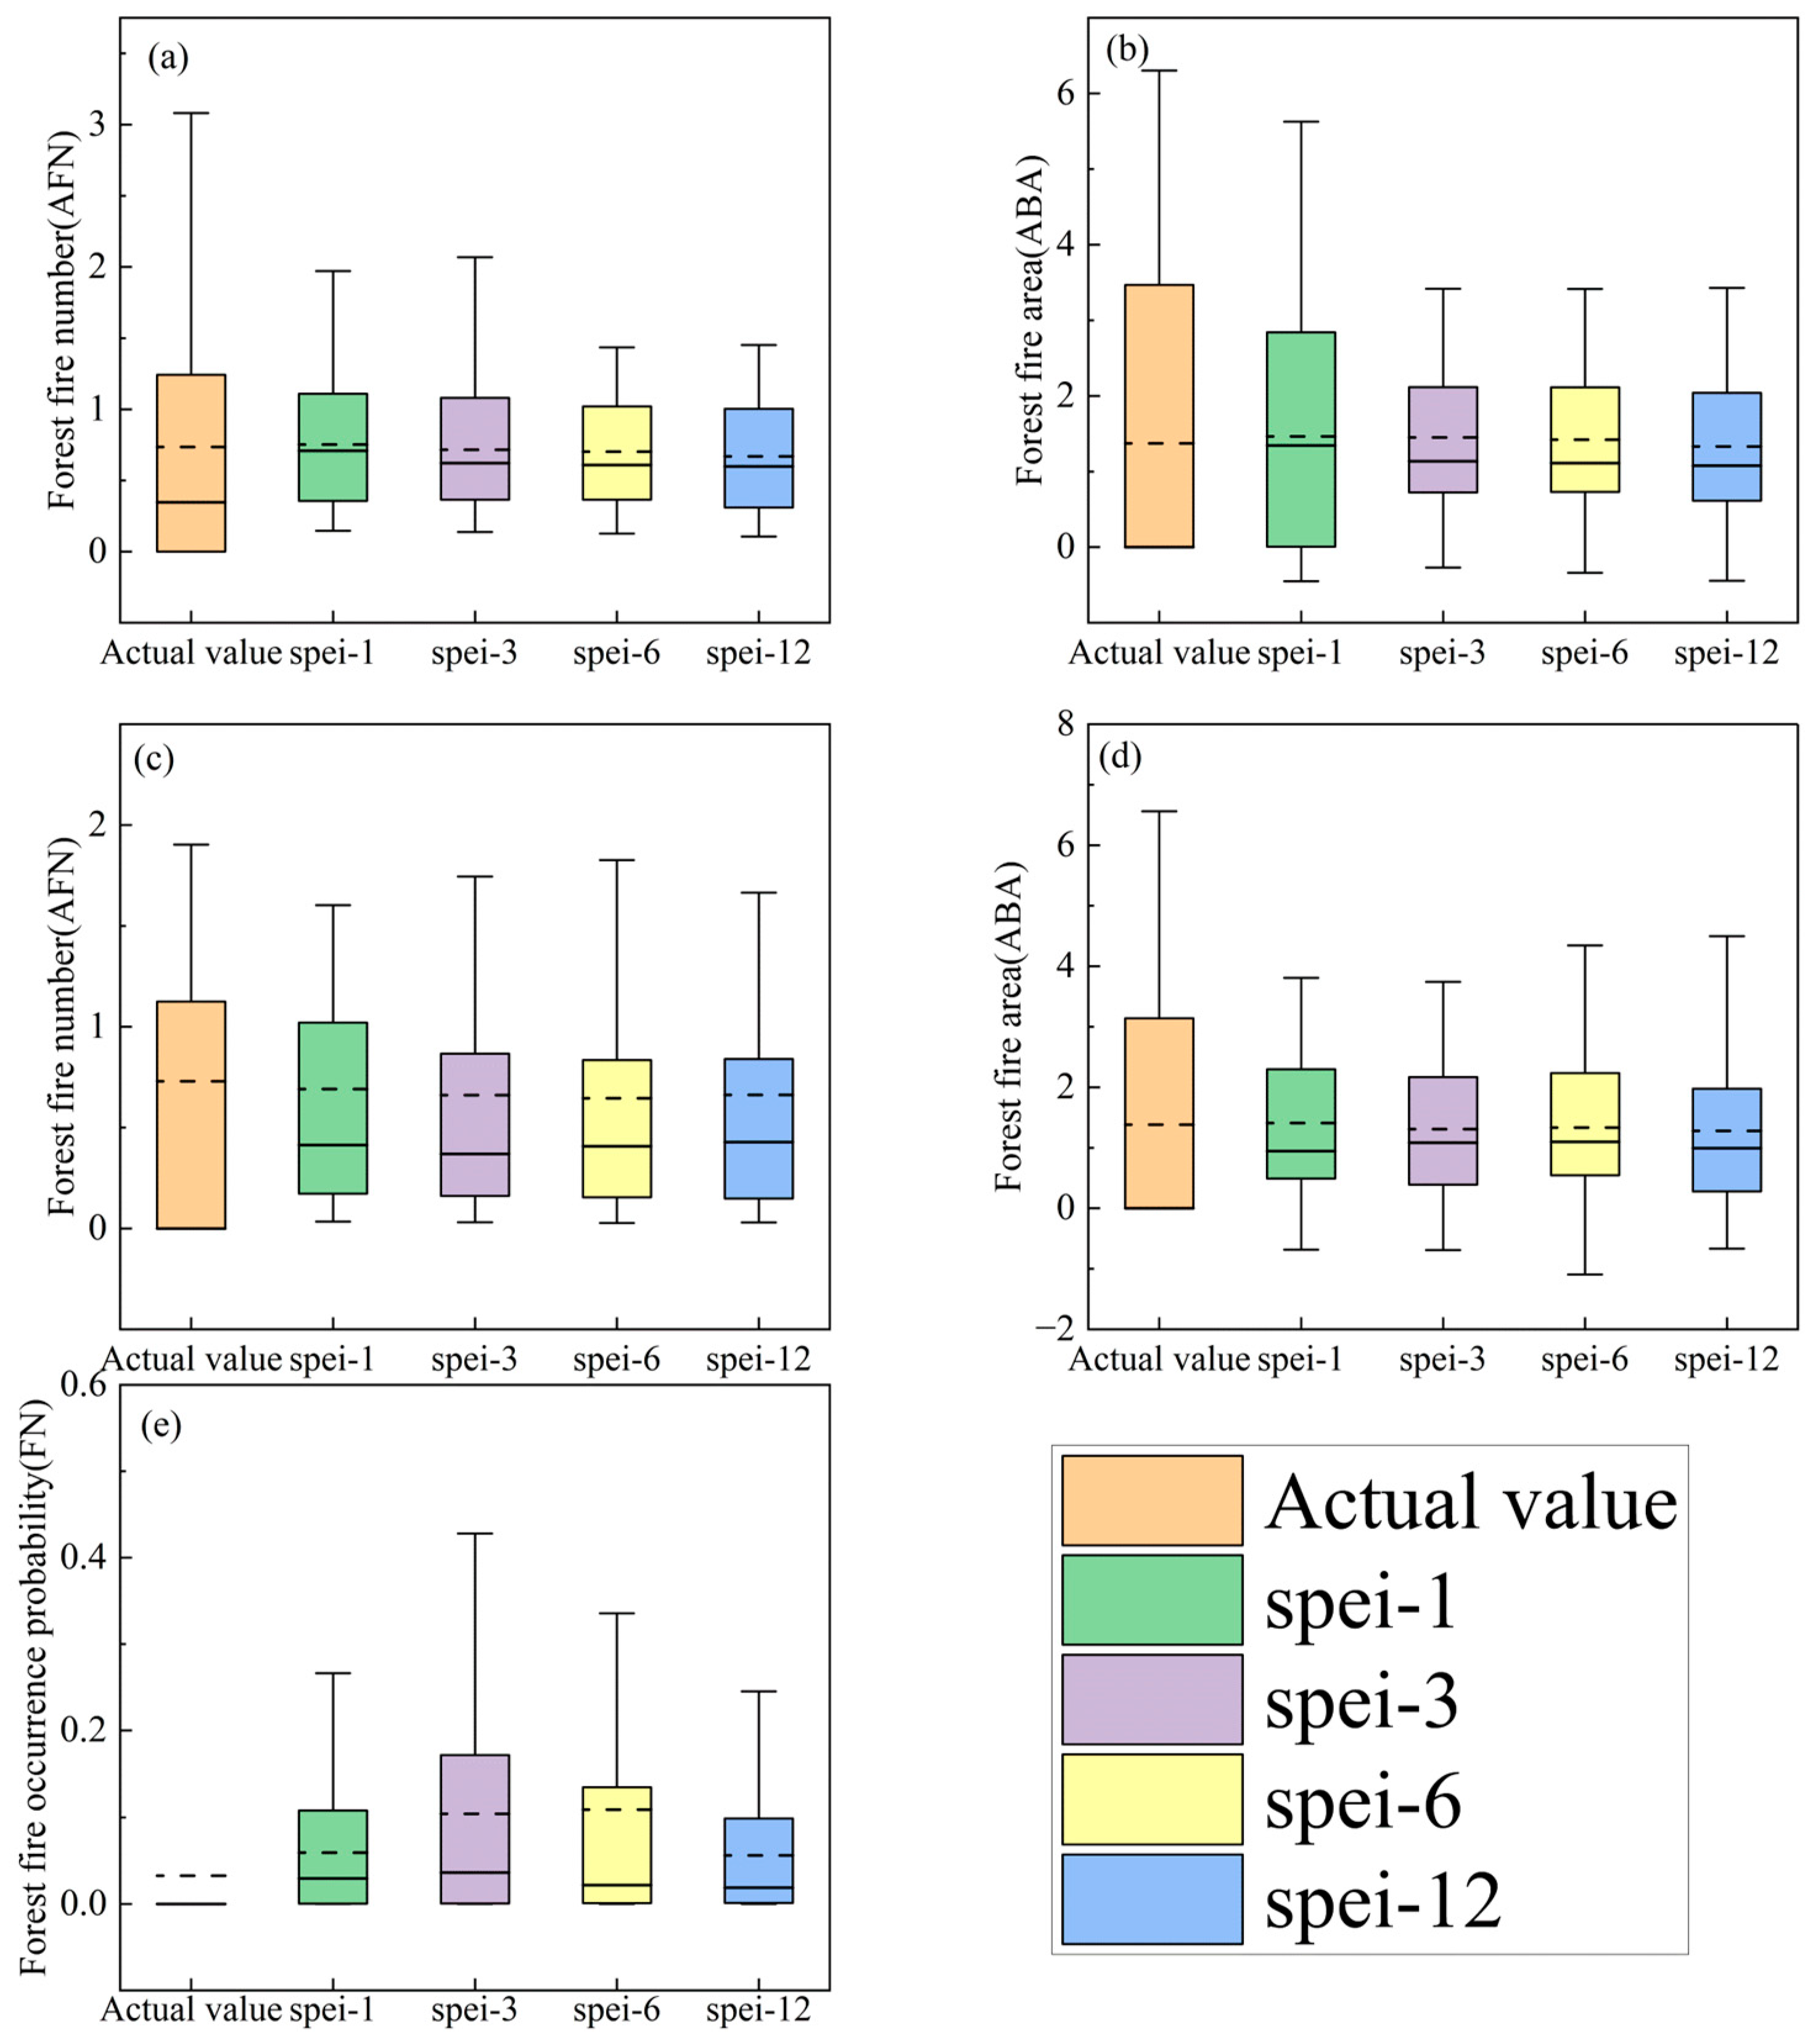
3.5. Main Influencing Factors and Accuracy of Forecasts

We determined the main influences on forest fire regimes by averaging the regression coefficients of the model variables (Table 7). At the grid scale, the main influences on forest fire regimes were drought characteristics, population density, and road density, except at the SPEI-12 scale, where the main influences were population density and road density; drought characteristics had no significant effect. Population density and drought characteristics tend to be inhibitory, and road density tends to be facilitative in most regions of China. By comparing the median and mean of the model-predicted values with the actual values (Figure 10), we found that of the SPEI-1, SPEI-3, and SPEI-6 scales with larger mean regression coefficients for drought characteristics, the SPEI-1 time scale was the best predictor, suggesting that short-term droughts appear to be better predictors of forest fire probability. At the SPEI-12 scale, the greater influence on the probability of forest fire occurrence is the road density and population density, and the prediction accuracy of the model constructed by these factors is also higher, which suggests that in addition to the drought characteristics, the anthropogenic factors also have a greater influence on the probability of forest fire occurrence.
In the prediction model of the number of forest fires at the climate zone scale, the main influencing factors of the prediction model of the forest fire regimes were road density and drought characteristics, and the predicted and actual values (average value) of the prediction models at all four scales were not significantly different. A comparison of the medians revealed that better predictions were made on the SPEI-3, SPEI-6, and SPEI-12 scales. This indicates that the prediction model constructed by road density and drought characteristics as main influencing factors for the number of forest fires also predicted better. In the fire area prediction model at the climatic zone scale, except for the SPEI-1 time scale, the main factors affecting the forest fire regimes were drought characteristics and road density, and the main factors affecting the forest fire regimes at the SPEI-1 time scale were population density, slope, and roughness. A comparison of the medians revealed that better predictions were made on the SPEI-3, SPEI-6, and SPEI-12 scales. This indicates that road density and drought characteristics as the main influencing factors predicted better forest fire area prediction models constructed compared to population density, slope, and roughness as influencing factors.
In the prediction model of the number of forest fires at the vegetation zone scale, the main influencing factors of the forest fire regimes were population density and road density, and the predicted and actual average values of the prediction models at the four scales did not differ much. This indicates that the prediction model of forest fire number constructed by human factors as the main influencing factors, besides drought characteristics, is also better. In the prediction model of overfire area at the vegetation zone scale, the main factors affecting the forest fire regimes were road density and drought characteristics. By comparing the median of predicted and actual values, we find that the best predictions are for the SPEI-1 and SPEI-12 scales. The overfire area prediction model, constructed with road density and drought characteristics as the main influencing factors, was able to predict the overfire area very well.
In conclusion, Table 7 shows that the mean value of the regression coefficients of the independent variables of drought characteristics is high, which indicates that drought characteristics play an important role in constructing the prediction model of forest fire regimes, and confirms the important influence of the number, duration, degree and intensity of droughts on the forest fire regimes. Meanwhile, the influence of drought characteristics on forest fire regimes varies with different spatial and temporal scales, which is spatially non-static. In addition, the mean value of the regression coefficient of human factor is high, and the human factor has an important role in constructing forest fire regimes, which is the same as the study of Zhao, L. et al. [119,120]. By comparing the R2, RMSE, and MAE of the constructed forest fire regimes prediction models considering drought characteristics and Figure 10, it was found that better scales of forest fire regimes prediction models were mostly SPEI-1 and SPEI-12 (Table 5, Figure 10e). In addition to the SPEI-1 and SPEI-12 scales, other time scales also performed better, and the model’s prediction accuracy is higher at the vegetation zone scale than at the climate zone scale (R2 > 0.6).

4. Discussion

4.1. Correlation Between Forest Fire Regimes and Drought Characteristics

Previous studies have confirmed the linear correlation between drought index (PDSI, SPI, SPEI) and forest fire regimes [25,60,61]. Based on the research of previous scholars, this paper extracts drought characteristics by using SPEI data and the run theory, and explores the spatial non-stationarity of drought characteristics and forest fire regimes by constructing the geographically weighted regression model, which fills the gap of the influence of drought characteristics on forest fire regimes and its spatial non-stationarity in China.
In general, our results indicate that drought events, drought duration, degree, and intensity at several scales have significant effects on forest fire regimes, and the spatial correlation coefficients between forest fire regimes and drought characteristics show an overall increasing trend with increasing time scales (Figure 4), which may be because a longer time scale not only integrates an increased water deficit, but also loses more information on water change [138]; additionally, the higher SPEI scale and longer drought accumulation time [84] made the SPEI more sensitive to long-term drought [66]. This is consistent with previous studies stating that the vulnerability and sensitivity of forests increase with increasing time scales and drought intensity [139]. The years that are considered the driest on lower time scales are not always the driest on longer time scales, and vice versa [140]. Meanwhile, the relationship between forest fire regimes and drought characteristics shows spatial variation, with different regions having different impacts on forest fire regimes. This is consistent with the work of Yin et al., (2024) [113], which pointed to the spatial and temporal heterogeneity of the drought–wildfire relationship due to spatial differences in vegetation productivity, climatic conditions, and anthropogenic interventions. However, this relationship is non-stationary and varies across spatial and temporal scales [113].

4.2. Performances of Models for Predicting Forest Fire Regimes

4.2.1. Model Performance

We found that accounting for spatial non-stationarity improves model fitting and prediction due to the large spatial variations in topography and climate conditions [65,95]. Our results are consistent with previous studies that have demonstrated the potential of geographically weighted models (GWR, GWPR, and GWLR) in modeling large-scale fire occurrence [75,141]. The good performances of geographically weighted models may be due to these local models (GWR, GWPR, and GWLR) having lower autocorrelation values in the residuals and a more random spatial distribution across all spatiotemporal combinations than global models, although the method does not directly address this issue [141], implying that the spatial pattern of the dependent variable can be accounted for by the spatial pattern observed in the explanatory variables included in the model [142]. In addition, we found that the model fitting ability ( A I C c ) becomes better overall with increasing time scales between 1 and 3 months. The reason for this is discussed by Yin et al., (2024) [113], who noted that the drought–wildfire relationship tended to strengthen significantly when drought conditions lasted 1–3 months but disappeared after more than 3 months. This suggests that there is a critical threshold of fuel moisture content that maximizes the drought–wildfire relationship [113]. However, time scales of 6–12 months in the SPEI work well in describing drought, and an increase in the length of the filters used in SPEI calculations could reduce the noise more efficiently [143]. Other related studies have also shown that drought indicators derived from the SPEI at longer time scales are significantly more applicable than those derived at shorter time scales [144]. Our results suggest that the best temporal scale for predicting forest fire occurrence probability was at 1 and 12 months.

4.2.2. Limitations

At the vegetation zone scale, the number of fires could be well predicted using the GWPR models (R2 > 0.6), and the area burned could be predicted using the GWR models (R2 > 0.5). However, at the climate zone scale, the number of fires and the area burned could not be well predicted (R2 < 0.4) (Table 6). Even though models considering spatial non-stationarity have some degree of strength over their global counterparts, they also have some limitations [105]. The resolution of SPEI data, such as the spatial and temporal scales of precipitation and evapotranspiration measurements, may not be fine enough to accurately capture localized drought conditions, leading to less-accurate predictions for specific areas or periods, especially short droughts and high-intensity droughts, which are difficult to accurately identify at the monthly scale alone [138,145]. At the same time, the SPEI may not capture all the relevant features and variables that contribute to drought conditions and may overestimate the contribution of temperature anomalies to drought in arid and semi-arid regions [130,146]. The factors affecting forest fire regimes are complex and interact with each other. In this study, natural and anthropogenic factors include slope, roughness, population density, road density, and river density. In addition, natural factors include extreme weather events [147,148], slope orientation [149], lightning [150], etc. Human factors also include land use type [149], distance to water [149], etc. The SPEI provides indirect information on the moisture and amount of fuels that directly affect wildfires [151], and limited or unreliable data can affect the validity and reliability of the model. Other important predictors may not be considered in the model. For example, burned areas may be affected by firefighters’ fire suppression efforts [152], which may limit their predictive performance. For the identification of drought characteristics, negative values of the drought index lasting more than 3 months were used to identify drought characteristics, which is an empirical approach that does not apply to identifying sudden droughts that have occurred in recent years over a short period [153]. In addition, the small sample sizes at the climate zone scale and vegetation zone scale can affect the predictions. The GWR relies on spatial bandwidth selection, and the A I C c criterion is susceptible to random fluctuations in small samples, leading to increased variance of regression coefficients [154]. The smaller sample size may lead to overfitting and proliferation of model degrees of freedom, and Wu et al., (2025a) used an improved model CatGWR to suppress noise through the attention-based architecture [155], which improves the prediction accuracy.
Future studies should focus on (1) improving the spatial and temporal resolution of SPEI data for better prediction of forest fire regimes of both natural and anthropogenic fires; (2) considering a fuller range of influencing factors, especially the thunder and lightning data, to construct prediction models for forest fire regimes; and (3) exploring the dynamics of forest fire regimes under future climate change scenarios.

5. Conclusions

In this study, the correlation between forest fire regimes and drought characteristics was analyzed using Spearman’s correlation coefficient. Then, local and global models were established based on the drought characteristics to predict forest fire regimes; the fitting and prediction effects of the local and global models were compared using the AUC, A I C c , R2, RMSE, and MAE indicators. The results show the following:
(1) At the grid-cell spatial scale and the 1- and 3-month temporal scales, forest fire occurrence probability and drought characteristics (MDN, MDD, and MDS) had a significant positive correlation (p < 0.05), while at the 6- and 12-month temporal scales, forest fire occurrence probability and drought characteristics (MDN, MDD, MDS, and MDI) showed a significant positive correlation (p < 0.05). At the climate zone spatial scale and 3-month temporal scales, AFN had a significantly positive correlation (p < 0.05) with both MDD and MDS, and ABA was positively correlated with MDN, MDD, MDS, and MDI, respectively. At the 6-month temporal scale, AFN had a significantly positive correlation (p < 0.05) with MDN, MDD, and MDS, while the ABA was positively correlated with MDD and MDS. At the 12-month temporal scale, AFN had a significantly positive correlation with MDN, MDD, MDS, and MDI, respectively (p < 0.05), while ABA was correlated with MDD and MDS. At the vegetation zone spatial scale and the 6-month temporal scale, ABA had a significantly positive correlation with both MDN and MDI (p < 0.05). At the 12-month temporal scale, both AFN and ABA showed a significantly positive correlation with MDN and MDI (p < 0.05).
(2) By comparing the prediction effects of the local and global models, it was found that the prediction effect of the geographically weighted logistic regression model was better than that of the global logistic regression model according to AUC. The prediction effect of the geographically weighted Poisson regression model (R2, RMSE, and MAE) was better than that of the global Poisson regression model, and the prediction effect of the geographically weighted regression model (R2, RMSE, and MAE) was better than that of the global regression model. The local regression model solved the problem of the spatial non-stationarity of variables by estimating the regression coefficients of each spatial unit, which improved the effectiveness of model prediction.
(3) The relationship between forest fire regimes and drought characteristics shows spatial differences, and different regions have different impacts on the forest fire regimes. Our study is conducive to an in-depth understanding of the relationship between forest fire regimes and drought characteristics, providing a scientific basis for the development of forest fire management measures to reduce drought losses according to local conditions.

Author Contributions

Investigation, C.L.; Data curation, Z.X. and H.C.; Writing—original draft, X.S.; Writing—review & editing, X.S. and Y.C. All authors have read and agreed to the published version of the manuscript.

Funding

This research was funded by the National Natural Science Foundation of China (grant no. 32271660).

Data Availability Statement

The data that support this study will be shared on reasonable request to the corresponding author.

Acknowledgments

The authors greatly appreciate the assistance of everyone in the LandscapeEcology Group. We thank the anonymous reviewers for their very helpful suggestions to improve the manuscript.

Conflicts of Interest

The authors declare no conflicts of interest.

References

  1. Morgan, P.; Hardy, C.C.; Swetnam, T.W.; Rollins, M.G.; Long, D.G. Mapping fire regimes across time and space: Understanding coarse and fine-scale fire patterns. Int. J. Wildland Fire 2001, 10, 329–342. [Google Scholar] [CrossRef]
  2. Burnside, W. Altered fire regimes. Nat. Sustain. 2018, 1, 730. [Google Scholar] [CrossRef]
  3. Keeley, J.E.; Syphard, A.D. Large California wildfires: 2020 fires in historical context. Fire Ecol. 2021, 17, 22. [Google Scholar] [CrossRef]
  4. Ihinegbu, C.; Ogunwumi, T. Multi-criteria modelling of drought: A study of Brandenburg Federal State, Germany. Model. Earth Syst. Environ. 2022, 8, 2035–2049. [Google Scholar] [CrossRef]
  5. Daşdemir, İ.; Aydın, F.; Ertuğrul, M. Factors Affecting the Behavior of Large Forest Fires in Turkey. Environ. Manag. 2021, 67, 162–175. [Google Scholar] [CrossRef]
  6. Parente, J.; Pereira, M.G.; Amraoui, M.; Fischer, E.M. Heat waves in Portugal: Current regime, changes in future climate and impacts on extreme wildfires. Sci. Total Environ. 2018, 631–632, 534–549. [Google Scholar] [CrossRef] [PubMed]
  7. Cochrane, M.A.; Bowman, D.M.J.S. Manage fire regimes, not fires. Nat. Geosci. 2021, 14, 455–457. [Google Scholar] [CrossRef]
  8. Kodandapani, N.; Parks, S.A. Effects of drought on wildfires in forest landscapes of the Western Ghats, India. Int. J. Wildland Fire 2019, 28, 431–444. [Google Scholar] [CrossRef]
  9. Turco, M.; Jerez, S.; Augusto, S.; Tarín-Carrasco, P.; Ratola, N.; Jiménez-Guerrero, P.; Trigo, R.M. Climate drivers of the 2017 devastating fires in Portugal. Sci. Rep. 2019, 9, 13886. [Google Scholar] [CrossRef]
  10. Margolis, E.; Woodhouse, C.A.; Swetnam, T.W. Drought, multi-seasonal climate, and wildfire in northern New Mexico. Clim. Change 2017, 142, 433–446. [Google Scholar] [CrossRef]
  11. Marín, P.-G.; Julio, C.J.; Dante Arturo, R.-T.; Daniel Jose, V.-N. Drought and spatiotemporal variability of forest fires across Mexico. Chin. Geogr. Sci. 2018, 28, 25–37. [Google Scholar] [CrossRef]
  12. Dowdy, A.J.; Ye, H.; Pepler, A.; Thatcher, M.; Osbrough, S.L.; Evans, J.P.; Di Virgilio, G.; McCarthy, N. Future changes in extreme weather and pyroconvection risk factors for Australian wildfires. Sci. Rep. 2019, 9, 10073. [Google Scholar] [CrossRef] [PubMed]
  13. Guttman, N.B. Accepting the standarized precipitaion index: A calculation algrithm. JAWRA J. Am. Water Resour. Assoc. 1999, 35, 311–322. [Google Scholar] [CrossRef]
  14. McKee, T.B.; Doesken, N.J.; Kleist, J. The relationship of drought frequency and duration to time scales. In Proceedings of the 8th Conference on Applied Climatology, Anaheim, CA, USA, 17–22 January 1993; pp. 179–183. [Google Scholar]
  15. Vicente-Serrano, S.M.; Beguería, S.; López-Moreno, J.I.; Angulo, M.; El Kenawy, A. A New Global 0.5° Gridded Dataset (1901–2006) of a Multiscalar Drought Index: Comparison with Current Drought Index Datasets Based on the Palmer Drought Severity Index. J. Hydrometeorol. 2010, 11, 1033–1043. [Google Scholar] [CrossRef]
  16. Mega, N.; Medjerab, A. Statistical comparison between the standardized precipitation index and the standardized precipitation drought index. Model. Earth Syst. Environ. 2021, 7, 373–388. [Google Scholar] [CrossRef]
  17. Cabral-Alemán, C.; Villanueva-Díaz, J.; Quiñonez-Barraza, G.; Gómez-Guerrero, A.; Arreola-Ávila, J.G. Reconstruction of the Standardized Precipitation-Evapotranspiration Index for the Western Region of Durango State, Mexico. Forests 2022, 13, 1233. [Google Scholar] [CrossRef]
  18. Wang, Q.; Liu, X.; Wang, Z.; Zhao, L.; Zhang, Q.-p. Time scale selection and periodicity analysis of grassland drought monitoring index in Inner Mongolia. Glob. Ecol. Conserv. 2022, 36, e02138. [Google Scholar] [CrossRef]
  19. He, B.; Chang, J.; Wang, Y.; Wang, Y.; Zhou, S.; Chen, C. Spatio-temporal evolution and non-stationary characteristics of meteorological drought in inland arid areas. Ecol. Indic. 2021, 126, 107644. [Google Scholar] [CrossRef]
  20. Yang, Q.; Li, M.; Zheng, Z.; Ma, Z. Regional applicability of seven meteorological drought indices in China. Sci. China Earth Sci. 2017, 60, 745–760. [Google Scholar] [CrossRef]
  21. Geng, G.; Yang, R.; Liu, L. Downscaled solar-induced chlorophyll fluorescence has great potential for monitoring the response of vegetation to drought in the Yellow River Basin, China: Insights from an extreme event. Ecol. Indic. 2022, 138, 108801. [Google Scholar] [CrossRef]
  22. Wells, N.; Goddard, S.; Hayes, M.J. A self-calibrating Palmer drought severity index. J. Clim. 2004, 17, 2335–2351. [Google Scholar] [CrossRef]
  23. Yang, S.; Zeng, A.; Tigabu, M.; Wang, G.; Guo, F. Investigating Drought Events and Their Consequences in Wildfires: An Application in China. Fire 2023, 6, 223. [Google Scholar] [CrossRef]
  24. Gond, S.; Gupta, N.; Patel, J.; Dikshit, P.K.S. Spatiotemporal evaluation of drought characteristics based on standard drought indices at various timescales over Uttar Pradesh, India. Environ. Monit. Assess. 2023, 195, 439. [Google Scholar] [CrossRef]
  25. Russo, A.; Gouveia, C.M.; Páscoa, P.; DaCamara, C.C.; Sousa, P.M.; Trigo, R.M. Assessing the role of drought events on wildfires in the Iberian Peninsula. Agric. For. Meteorol. 2017, 237–238, 50–59. [Google Scholar] [CrossRef]
  26. Wei, X.; He, W.; Zhou, Y.; Ju, W.; Xiao, J.; Li, X.; Liu, Y.; Xu, S.; Bi, W.; Zhang, X.; et al. Global assessment of lagged and cumulative effects of drought on grassland gross primary production. Ecol. Indic. 2022, 136, 108646. [Google Scholar] [CrossRef]
  27. Zhao, A.; Yu, Q.; Feng, L.; Zhang, A.; Pei, T. Evaluating the cumulative and time-lag effects of drought on grassland vegetation: A case study in the Chinese Loess Plateau. J. Environ. Manag. 2020, 261, 110214. [Google Scholar] [CrossRef]
  28. Dye, A.; Reilly, M.; McEvoy, A.; Lemons, R.; Riley, K.; Kim, J.; Kerns, B. Simulated Future Shifts in Wildfire Regimes in Moist Forests of Pacific Northwest, USA. J. Geophys. Res. Biogeosci. 2024, 129, e2023JG007722. [Google Scholar] [CrossRef]
  29. Zhang, F.; Biederman, J.A.; Dannenberg, M.P.; Yan, D.; Reed, S.C.; Smith, W.K. Five decades of observed daily precipitation reveal longer and more variable drought events across much of the western United States. Geophys. Res. Lett. 2021, 48, e2020GL092293. [Google Scholar] [CrossRef]
  30. Westerling, A.L.; Brown, T.J.; Schoennagel, T.; Swetnam, T.W.; Turner, M.G.; Veblen, T.T. Climate and wildfire in Western US Forests. For. Conserv. Anthr. Sci. Policy Pract. 2016, 43–55. [Google Scholar] [CrossRef]
  31. Williams, A.P.; Abatzoglou, J.T.; Gershunov, A.; Guzman-Morales, J.; Bishop, D.A.; Balch, J.K.; Lettenmaier, D.P. Observed impacts of anthropogenic climate change on wildfire in California. Earth’s Futur. 2019, 7, 892–910. [Google Scholar] [CrossRef]
  32. Zhang, Y.; Xiang, Q.; Yu, C.; Bao, J.; Ho, H.C.; Sun, S.; Ding, Z.; Hu, K.; Zhang, L. Mortality risk and burden associated with temperature variability in China, United Kingdom and United States: Comparative analysis of daily and hourly exposure metrics. Environ. Res. 2019, 179, 108771. [Google Scholar] [CrossRef] [PubMed]
  33. Fang, S.; Yang, J.; Zou, C.B.; Krueger, E.S.; Ochsner, T.E.; Zhang, Q. Wildfire danger under changing climates in the southern Great Plains throughout the 21st century. Ecol. Indic. 2025, 170, 112994. [Google Scholar] [CrossRef]
  34. Liu, Y.; Feng, S.; Qian, Y.; Huang, H.; Berg, L.K. How do North American weather regimes drive wind energy at the sub-seasonal to seasonal timescales? Npj Clim. Atmos. Sci. 2023, 6, 100. [Google Scholar] [CrossRef]
  35. Sharma, S.; Carlson, J.; Krueger, E.S.; Engle, D.M.; Twidwell, D.; Fuhlendorf, S.D.; Patrignani, A.; Feng, L.; Ochsner, T.E. Soil moisture as an indicator of growing-season herbaceous fuel moisture and curing rate in grasslands. Int. J. Wildland Fire 2020, 30, 57–69. [Google Scholar] [CrossRef]
  36. Clark, S.; Mills, G.; Brown, T.; Harris, S.; Abatzoglou, J.T. Downscaled GCM climate projections of fire weather over Victoria, Australia. Part 2*: A multi-model ensemble of 21st century trends. Int. J. Wildland Fire 2021, 30, 596–610. [Google Scholar] [CrossRef]
  37. Krueger, E.S.; Ochsner, T.E.; Levi, M.R.; Basara, J.B.; Snitker, G.J.; Wyatt, B.M. Grassland productivity estimates informed by soil moisture measurements: Statistical and mechanistic approaches. Agron. J. 2021, 113, 3498–3517. [Google Scholar] [CrossRef]
  38. Krueger, E.S.; Ochsner, T.E.; Carlson, J.; Engle, D.M.; Twidwell, D.; Fuhlendorf, S.D. Concurrent and antecedent soil moisture relate positively or negatively to probability of large wildfires depending on season. Int. J. Wildland Fire 2016, 25, 657–668. [Google Scholar] [CrossRef]
  39. Perello, N.; Trucchia, A.; D’Andrea, M.; Degli Esposti, S.; Fiorucci, P.; Gollini, A.; Negro, D. An adaptable dead fuel moisture model for various fuel types and temporal scales tailored for wildfire danger assessment. Environ. Model. Softw. 2025, 183, 106254. [Google Scholar] [CrossRef]
  40. Asensio, M.I.; Cascón, J.M.; Laiz, P.; Prieto-Herráez, D. Validating the effect of fuel moisture content by a multivalued operator in a simplified physical fire spread model. Environ. Model. Softw. 2023, 164, 105710. [Google Scholar] [CrossRef]
  41. Lawson, B.D.; Armitage, O. Weather Guide for the Canadian Forest Fire Danger Rating System; Canadian Forest Service, Northern Forestry Centre: Edmonton, AB, Canada, 2008.
  42. Carlson, J.; Bradshaw, L.S.; Nelson, R.M.; Bensch, R.R.; Jabrzemski, R. Application of the Nelson model to four timelag fuel classes using Oklahoma field observations: Model evaluation and comparison with National Fire Danger Rating System algorithms. Int. J. Wildland Fire 2007, 16, 204–216. [Google Scholar] [CrossRef]
  43. Dowdy, A.J.; Mills, G.A.; Finkele, K.; De Groot, W. Australian Fire Weather as Represented by the McArthur Forest Fire Danger Index and the Canadian Forest Fire Weather Index. 2009. Available online: https://www.cawcr.gov.au/technical-reports/CTR_010.pdf (accessed on 18 March 2025).
  44. Yang, J.; Jiang, H.; Wang, S.; Ma, X. A Multi-Scale Deep Learning Algorithm for Enhanced Forest Fire Danger Prediction Using Remote Sensing Images. Forests 2024, 15, 1581. [Google Scholar] [CrossRef]
  45. Loupian, E.; Bartalev, S.; Ershov, D.; Kotel’nikov, R.; Balashov, I.; Bourtsev, M.; Egorov, V.; Efremov, V.Y.; Zharko, V.; Kovganko, K. Satellite data processing management in Forest Fires Remote Monitoring Information System (ISDM-Rosleskhoz) of the Federal Agency for Forestry. Sovrem. Probl. Distantsionnogo Zondirovaniya Zemli Iz Kosmosa 2015, 12, 222–250. [Google Scholar]
  46. Kotel’Nikov, R.; Lupyan, E.; Bartalev, S.; Ershov, D. Space monitoring of forest fires: History of the creation and development of ISDM-Rosleskhoz. Contemp. Probl. Ecol. 2020, 13, 795–802. [Google Scholar] [CrossRef]
  47. Llorens, R.; Sobrino, J.A.; Fernández, C.; Fernández-Alonso, J.M.; Vega, J.A. A methodology to estimate forest fires burned areas and burn severity degrees using Sentinel-2 data. Application to the October 2017 fires in the Iberian Peninsula. Int. J. Appl. Earth Obs. Geoinf. 2021, 95, 102243. [Google Scholar] [CrossRef]
  48. Kranz, J.; Bauer, K.; Pampanoni, V.; Zhao, L.; Marrs, C.; Mauder, M.; Poděbradská, M.; van der Maaten-Theunissen, M.; Yebra, M.; Forkel, M. Assessing predictors for fuel moisture content in Central European forests. Agric. For. Meteorol. 2025, 371, 110590. [Google Scholar] [CrossRef]
  49. Grishin, A.M. Mathematical Modeling of Forest Fires and New Methods of Fighting Them; Publishing House of the Tomsk State University: Tomsk, Russia, 1997. [Google Scholar]
  50. Grishin, A.M.; Golovanov, A.N.; Kataeva, L.Y.; Loboda, E.L. Formulation and solution of the problem of drying of a layer of combustible forest materials. Combust. Explos. Shock Waves 2001, 37, 57–66. [Google Scholar] [CrossRef]
  51. Grishin, A.; Filkov, A. A deterministic-probabilistic system for predicting forest fire hazard. Fire Saf. J. 2011, 46, 56–62. [Google Scholar] [CrossRef]
  52. Grishin, A.; Filkov, A. The forecast of ignition and spread of forest fires. Praktika 2005, 201. [Google Scholar]
  53. McNorton, J.R.; Di Giuseppe, F. A global fuel characteristic model and dataset for wildfire prediction. Biogeosciences 2024, 21, 279–300. [Google Scholar] [CrossRef]
  54. Grishin, A.M.; Zima, V.P.; Kuznetsov, V.T.; Skorik, A.I. Ignition of combustible forest materials by a radiant energy flux. Combust. Explos. Shock Waves 2002, 38, 24–29. [Google Scholar] [CrossRef]
  55. Castel-Clavera, J.; Pimont, F.; Opitz, T.; Ruffault, J.; Barbero, R.; Allard, D.; Dupuy, J.-L. A comparative analysis of fire-weather indices for enhanced fire activity prediction with probabilistic approaches. Agric. For. Meteorol. 2025, 361, 110315. [Google Scholar] [CrossRef]
  56. Boubeta, M.; Lombardía, M.J.; Marey-Pérez, M.; Morales, D. Poisson mixed models for predicting number of fires. Int. J. Wildland Fire 2019, 28, 237–253. [Google Scholar] [CrossRef]
  57. Pimont, F.; Fargeon, H.; Opitz, T.; Ruffault, J.; Barbero, R.; Martin-StPaul, N.; Rigolot, E.; RiviÉre, M.; Dupuy, J.-L. Prediction of regional wildfire activity in the probabilistic Bayesian framework of Firelihood. Ecol. Appl. 2021, 31, e02316. [Google Scholar] [CrossRef] [PubMed]
  58. Pimont, F.; Ruffault, J.; Opitz, T.; Fargeon, H.; Barbero, R.; Castel-Clavera, J.; Martin-StPaul, N.; Rigolot, E.; Dupuy, J.-L. Future expansion, seasonal lengthening and intensification of fire activity under climate change in southeastern France. Int. J. Wildland Fire 2023, 32, 4–14. [Google Scholar] [CrossRef]
  59. Wang, M.; Si, L.; Chen, F.; Shu, L.; Zhao, F.; Li, W. Simulation of Fire Occurrence Based on Historical Data in Future Climate Scenarios and Its Practical Verification. Fire 2024, 7, 346. [Google Scholar] [CrossRef]
  60. Chen, A. Evaluating the relationships between wildfires and drought using machine learning. Int. J. Wildland Fire 2022, 31, 230–239. [Google Scholar] [CrossRef]
  61. Riley, K.L.; Abatzoglou, J.T.; Grenfell, I.C.; Klene, A.E.; Heinsch, F.A. The relationship of large fire occurrence with drought and fire danger indices in the western USA, 1984–2008: The role of temporal scale. Int. J. Wildland Fire 2013, 22, 894–909. [Google Scholar] [CrossRef]
  62. Vilchis-Francés, A.Y.; Díaz-Delgado, C.; Becerril Piña, R.; Mastachi Loza, C.A.; Gómez-Albores, M.Á.; Bâ, K.M. Daily prediction modeling of forest fire ignition using meteorological drought indices in the Mexican highlands. Iforest-Biogeosciences For. 2021, 14, 437. [Google Scholar] [CrossRef]
  63. Brunsdon, C.; Fotheringham, A.S.; Charlton, M.E. Geographically weighted regression: A method for exploring spatial nonstationarity. Geogr. Anal. 1996, 28, 281–298. [Google Scholar] [CrossRef]
  64. Liu, X.; Feng, X.; Ciais, P.; Fu, B.; Hu, B.; Sun, Z. GRACE satellite-based drought index indicating increased impact of drought over major basins in China during 2002–2017. Agric. For. Meteorol. 2020, 291, 108057. [Google Scholar] [CrossRef]
  65. Su, J.; Liu, Z.; Wang, W.; Jiao, K.; Yu, Y.; Li, K.; Lü, Q.; Fletcher, T.L. Evaluation of the Spatial Distribution of Predictors of Fire Regimes in China from 2003 to 2016. Remote Sens. 2023, 15, 4946. [Google Scholar] [CrossRef]
  66. Zhao, L.; Li, L.; Li, Y.; Zhong, H.; Zhang, F.; Zhu, J.; Ding, Y. Monitoring vegetation drought in the nine major river basins of China based on a new developed Vegetation Drought Condition Index. J. Arid Land 2023, 15, 1421–1438. [Google Scholar] [CrossRef]
  67. Qing, G. Research on the Development of Climate Regionalization in China (1929–1966). Master’s Thesis, University of Science and Technology of China, Hefei, China, 2023. [Google Scholar]
  68. Fang, K.; Yao, Q.; Guo, Z.; Zheng, B.; Du, J.; Qi, F.; Yan, P.; Li, J.; Ou, T.; Liu, J.; et al. ENSO modulates wildfire activity in China. Nat. Commun. 2021, 12, 1764. [Google Scholar] [CrossRef] [PubMed]
  69. Vilar, L.; Garrido, J.; Echavarría, P.; Martínez-Vega, J.; Martín, M.P. Comparative analysis of CORINE and climate change initiative land cover maps in Europe: Implications for wildfire occurrence estimation at regional and local scales. Int. J. Appl. Earth Obs. Geoinf. 2019, 78, 102–117. [Google Scholar] [CrossRef]
  70. Thies, B. Machine learning wildfire susceptibility mapping for Germany. Nat. Hazards 2025. [Google Scholar] [CrossRef]
  71. Turco, M.; Marcos-Matamoros, R.; Castro, X.; Canyameras, E.; Llasat, M.C. Seasonal prediction of climate-driven fire risk for decision-making and operational applications in a Mediterranean region. Sci. Total Environ. 2019, 676, 577–583. [Google Scholar] [CrossRef]
  72. Chang, C.; Chang, Y.; Xiong, Z.; Ping, X.; Zhang, H.; Guo, M.; Hu, Y. Predicting Grassland Fire-Occurrence Probability in Inner Mongolia Autonomous Region, China. Remote Sens. 2023, 15, 2999. [Google Scholar] [CrossRef]
  73. Pike, R.J.; Evans, I.S.; Hengl, T. Chapter 1 Geomorphometry: A Brief Guide. Dev. Soil Sci. 2009, 33, 3–30. [Google Scholar]
  74. Zhang, Q.; Gao, C.; Shi, C. An improved machine-learning model for lightning-ignited wildfire prediction in Texas. Environ. Res. Lett. 2025, 20, 064026. [Google Scholar] [CrossRef]
  75. Oliveira, S.; Pereira, J.M.; San-Miguel-Ayanz, J.; Lourenço, L. Exploring the spatial patterns of fire density in Southern Europe using Geographically Weighted Regression. Appl. Geogr. 2014, 51, 143–157. [Google Scholar] [CrossRef]
  76. Vicente-Serrano, S.M.; Beguería, S.; López-Moreno, J.I. A multiscalar drought index sensitive to global warming: The standardized precipitation evapotranspiration index. J. Clim. 2010, 23, 1696–1718. [Google Scholar] [CrossRef]
  77. Cui, T.; Martz, L.; Guo, X. Grassland phenology response to drought in the Canadian prairies. Remote Sens. 2017, 9, 1258. [Google Scholar] [CrossRef]
  78. World Meteorological Organization. Standardized Precipitation Index User Guide; World Meteorological Organization: Geneva, Switzerland, 2012; 24p. [Google Scholar]
  79. Mishra, D.; Goswami, S.; Matin, S.; Sarup, J. Analyzing the extent of drought in the Rajasthan state of India using vegetation condition index and standardized precipitation index. Model. Earth Syst. Environ. 2022, 8, 601–610. [Google Scholar] [CrossRef]
  80. Hamarash, H.; Hamad, R.; Rasul, A. Meteorological drought in semi-arid regions: A case study of Iran. J. Arid Land 2022, 14, 1212–1233. [Google Scholar] [CrossRef]
  81. Won, J.; Kim, S. Ecological Drought Condition Index to Monitor Vegetation Response to Meteorological Drought in Korean Peninsula. Remote Sens. 2023, 15, 337. [Google Scholar] [CrossRef]
  82. Zhang, Z.; Zhang, W.; Yang, B.; Xie, W.; Tao, C.; Hong, Z.; Xie, Y.; Li, J.; Li, L.; Meng, L. Long-term spatiotemporal characteristics of meteorological drought in China from a three-dimensional (longitude, latitude, time) perspective. Int. J. Appl. Earth Obs. Geoinf. 2024, 126, 103633. [Google Scholar] [CrossRef]
  83. Ben Mhenni, N.; Shinoda, M.; Nandintsetseg, B. Assessment of drought frequency, severity, and duration and its impacts on vegetation greenness and agriculture production in Mediterranean dryland: A case study in Tunisia. Nat. Hazards 2021, 105, 2755–2776. [Google Scholar] [CrossRef]
  84. Wei, W.; Yan, P.; Zhou, L.; Zhang, H.; Xie, B.; Zhou, J. A comprehensive drought index based on spatial principal component analysis and its application in northern China. Environ. Monit. Assess. 2024, 196, 193. [Google Scholar] [CrossRef]
  85. Wang, F.; Wang, Z.; Yang, H.; Zhao, Y. Study of the temporal and spatial patterns of drought in the Yellow River basin based on SPEI. Sci. China Earth Sci. 2018, 61, 1098–1111. [Google Scholar] [CrossRef]
  86. Zhang, P.; Cai, Y.; Cong, P.; Xie, Y.; Chen, W.; Cai, J.; Bai, X. Quantitation of meteorological, hydrological and agricultural drought under climate change in the East River basin of south China. Ecol. Indic. 2024, 158, 111304. [Google Scholar] [CrossRef]
  87. Guna, A.; Zhang, J.; Tong, S.; Bao, Y.; Han, A.; Li, K. Effect of climate change on maize yield in the growing season: A case study of the Songliao Plain Maize Belt. Water 2019, 11, 2108. [Google Scholar] [CrossRef]
  88. Yevjevich, V.M. An Objective Approach to Definitions and Investigations of Continental Hydrologic Droughts; Colorado State University: Fort Collins, CO, USA, 1967; Volume 23. [Google Scholar]
  89. Guo, H.; Bao, A.; Liu, T.; Jiapaer, G.; Ndayisaba, F.; Jiang, L.; Kurban, A.; De Maeyer, P. Spatial and temporal characteristics of droughts in Central Asia during 1966–2015. Sci. Total Environ. 2018, 624, 1523–1538. [Google Scholar] [CrossRef]
  90. Malik, A.; Kumar, A.; Kisi, O.; Khan, N.; Salih, S.Q.; Yaseen, Z.M. Analysis of dry and wet climate characteristics at Uttarakhand (India) using effective drought index. Nat. Hazards 2021, 105, 1643–1662. [Google Scholar] [CrossRef]
  91. Pang, Y.; Li, Y.; Feng, Z.; Feng, Z.; Zhao, Z.; Chen, S.; Zhang, H. Forest Fire Occurrence Prediction in China Based on Machine Learning Methods. Remote Sens. 2022, 14, 5546. [Google Scholar] [CrossRef]
  92. Wheeler, D.C. Diagnostic tools and a remedial method for collinearity in geographically weighted regression. Environ. Plan. A 2007, 39, 2464–2481. [Google Scholar] [CrossRef]
  93. Wang, N.; Sun, M.; Ye, J.; Wang, J.; Liu, Q.; Li, M. Spatial Downscaling of Forest Above-Ground Biomass Distribution Patterns Based on Landsat 8 OLI Images and a Multiscale Geographically Weighted Regression Algorithm. Forests 2023, 14, 526. [Google Scholar] [CrossRef]
  94. Stewart Fotheringham, A.; Charlton, M.; Brunsdon, C. The geography of parameter space: An investigation of spatial non-stationarity. Int. J. Geogr. Inf. Syst. 1996, 10, 605–627. [Google Scholar] [CrossRef]
  95. Cano-Crespo, A.; Traxl, D.; Prat-Ortega, G.; Rolinski, S.; Thonicke, K. Characterization of land cover-specific fire regimes in the Brazilian Amazon. Reg. Environ. Change 2023, 23, 19. [Google Scholar] [CrossRef]
  96. Huang, Z.; Li, S.; Peng, Y.; Gao, F. Spatial non-stationarity of influencing factors of China’s county economic development base on a multiscale geographically weighted regression model. ISPRS Int. J. Geo-Inf. 2023, 12, 109. [Google Scholar] [CrossRef]
  97. Lai, J.; Pan, J. China’s city network structural characteristics based on population flow during spring festival travel rush: Empirical analysis of “tencent migration” big data. J. Urban Plan. Dev. 2020, 146, 04020018. [Google Scholar] [CrossRef]
  98. Ma, L.; Yang, B.; Feng, Y.; Ju, L. Evaluation of provincial forest ecological security and analysis of the driving factors in China via the GWR model. Sci. Rep. 2024, 14, 14299. [Google Scholar] [CrossRef] [PubMed]
  99. Zhang, Z.; Yang, S.; Wang, G.; Wang, W.; Xia, H.; Sun, S.; Guo, F.-T. Evaluation of geographically weighted logistic model and mixed effect model in forest fire prediction in northeast China. Front. For. Glob. Change 2022, 5, 1040408. [Google Scholar] [CrossRef]
  100. Tyas, S.W.; Puspitasari, L.A. Geographically weighted generalized poisson regression model with the best kernel function in the case of the number of postpartum maternal mortality in east java. MethodsX 2023, 10, 102002. [Google Scholar] [CrossRef] [PubMed]
  101. Cao, Q.; Zhang, L.; Su, Z.; Wang, G.; Sun, S.; Guo, F. Comparing four regression techniques to explore factors governing the number of forest fires in Southeast, China. Geomat. Nat. Hazards Risk 2021, 12, 499–521. [Google Scholar] [CrossRef]
  102. Zhang, W.; Dai, L.; Yan, Y.; Han, X.; Teng, Y.; Li, M.; Zhu, Y.; Zhang, Y. Multiscale geographically weighted regression-based analysis of vegetation driving factors and mining-induced quantification in the Fengfeng District, China. Ecol. Inform. 2024, 80, 102506. [Google Scholar] [CrossRef]
  103. Fawcett, T. An introduction to ROC analysis. Pattern Recognit. Lett. 2006, 27, 861–874. [Google Scholar] [CrossRef]
  104. Bui, D.T.; Le, K.T.T.; Nguyen, V.C.; Le, H.D.; Revhaug, I. Tropical Forest Fire Susceptibility Mapping at the Cat Ba National Park Area, Hai Phong City, Vietnam, Using GIS-Based Kernel Logistic Regression. Remote Sens. 2016, 8, 15. [Google Scholar] [CrossRef]
  105. Al Moteri, M.; Alrowais, F.; Mtouaa, W.; Aljehane, N.O.; Alotaibi, S.S.; Marzouk, R.; Mustafa Hilal, A.; Ahmed, N.A. An enhanced drought forecasting in coastal arid regions using deep learning approach with evaporation index. Environ. Res. 2024, 246, 118171. [Google Scholar] [CrossRef]
  106. Samad Emamgholizadeh, S.S.; Mohamad Amin, E. Comparison of Artificial Neural Networks, Geographically Weighted Regression and Cokriging Methods for Predicting the Spatial Distribution of Soil Macronutrients (N, P, and K). Chin. Geogr. Sci. 2017, 27, 747–759. [Google Scholar] [CrossRef]
  107. Zong, X.; Tian, X.; Liu, X.; Shu, L. Drought threat to terrestrial gross primary production exacerbated by wildfires. Commun. Earth Environ. 2024, 5, 225. [Google Scholar] [CrossRef]
  108. Robbins, Z.J.; Loudermilk, E.L.; Mozelewski, T.G.; Jones, K.; Scheller, R.M. Fire regimes of the Southern Appalachians may radically shift under climate change. Fire Ecol. 2024, 20, 2. [Google Scholar] [CrossRef]
  109. Mallick, T.; Pandidurai, D.; Sharma, D.; Sharma, A.; Panda, S.K. A comparative assessment of meteorological drought characteristics in agro-climatic zones of Rajasthan (arid) and Tamil Nadu (humid), India. Nat. Hazards 2024, 120, 4181–4203. [Google Scholar] [CrossRef]
  110. González, M.E.; Gómez-González, S.; Lara, A.; Garreaud, R.; Díaz-Hormazábal, I. The 2010–2015 Megadrought and its influence on the fire regime in central and south-central Chile. Ecosphere 2018, 9, e02300. [Google Scholar] [CrossRef]
  111. Van der Kamp, D.; Bürger, G.; Werner, A. Evaluation of the Monthly Drought Code as a metric for fire weather in a region of complex terrain and un-certainties in future projections. Vic. Pac. Clim. Impacts Consort. 2013. Available online: https://www.pacificclimate.org/sites/default/files/publications/evaluation_of_the_monthly_drought_code.pdf (accessed on 18 March 2025).
  112. Chan, X.Y.; Robinne, F.-N.; Parisien, M.-A.; Wang, X.; Fleming, T.; Flannigan, M.D. Assessment of lake-level fluctuation as an indicator of fire activity in boreal Canada. Ecol. Indic. 2022, 145, 109611. [Google Scholar] [CrossRef]
  113. Yin, J.; He, B.; Fan, C.; Chen, R.; Zhang, H.; Zhang, Y. Drought-related wildfire accounts for one-third of the forest wildfires in subtropical China. Agric. For. Meteorol. 2024, 346, 109893. [Google Scholar] [CrossRef]
  114. Holden, Z.A.; Luce, C.H.; Crimmins, M.A.; Morgan, P. Wildfire extent and severity correlated with annual streamflow distribution and timing in the Pacific Northwest, USA (1984–2005). Ecohydrology 2012, 5, 677–684. [Google Scholar] [CrossRef]
  115. Dimitrakopoulos, A.; Vlahou, M.; Anagnostopoulou, C.; Mitsopoulos, I. Impact of drought on wildland fires in Greece: Implications of climatic change? Clim. Change 2011, 109, 331–347. [Google Scholar] [CrossRef]
  116. Zhang, Y.; Zhang, Y.; Cheng, L.; Cong, N.; Zheng, Z.; Huang, K.; Zhang, J.; Zhu, Y.; Gao, J.; Sun, Y. Have China’s drylands become wetting in the past 50 years? J. Geogr. Sci. 2023, 33, 99–120. [Google Scholar] [CrossRef]
  117. Zhao, C.; Feng, Y.; Liu, W.; Wang, H.; Wang, T.; Liu, Y.; Sun, F. Provincial-scale assessment of vulnerability and resilience to drought in China. Sci. Total Environ. 2024, 934, 173199. [Google Scholar] [CrossRef]
  118. Wei, W.; Zhang, J.; Zhou, J.; Zhou, L.; Xie, B.; Li, C. Monitoring drought dynamics in China using Optimized Meteorological Drought Index (OMDI) based on remote sensing data sets. J. Environ. Manag. 2021, 292, 112733. [Google Scholar] [CrossRef] [PubMed]
  119. Zhao, L.; Ge, Y.; Guo, S.; Li, H.; Li, X.; Sun, L.; Chen, J. Forest fire susceptibility mapping based on precipitation-constrained cumulative dryness status information in Southeast China: A novel machine learning modeling approach. For. Ecol. Manag. 2024, 558, 121771. [Google Scholar] [CrossRef]
  120. Hayes, J.P. Fire Suppression and the Wildfire Paradox in Contemporary China: Policies, Resilience, and Effects in Chinese Fire Regimes. Hum. Ecol. 2020, 1–14. [Google Scholar] [CrossRef]
  121. Zhao, F.; Liu, Y. Important meteorological predictors for long-range wildfires in China. For. Ecol. Manag. 2021, 499, 119638. [Google Scholar] [CrossRef]
  122. Yang, S.; Meng, D.; Li, X.; Wu, X. Multi-scale responses of vegetation changes relative to the SPEI meteorological drought index in North China in 2001–2014. Acta Ecol. Sin 2018, 38, 1028–1039. [Google Scholar]
  123. Su, B.; Huang, J.; Mondal, S.K.; Zhai, J.; Wang, Y.; Wen, S.; Gao, M.; Lv, Y.; Jiang, S.; Jiang, T.; et al. Insight from CMIP6 SSP-RCP scenarios for future drought characteristics in China. Atmos. Res. 2021, 250, 105375. [Google Scholar] [CrossRef]
  124. Zhao, Q.; Zhang, X.; Li, C.; Xu, Y.; Fei, J. Compound ecological drought assessment of China using a Copula-based drought index. Ecol. Indic. 2024, 164, 112141. [Google Scholar] [CrossRef]
  125. Gupta, A.; Rico-Medina, A.; Caño-Delgado, A.I. The physiology of plant responses to drought. Science 2020, 368, 266–269. [Google Scholar] [CrossRef]
  126. Chen, C.; Zhu, L.; Tian, L.; Li, X. Spatial-temporal changes in vegetation characteristics and climate in the Qinling-Daba Mountains. Acta Ecol. Sin 2019, 39, 3257–3266. [Google Scholar]
  127. Zhang, Y.; Liu, L.-Y.; Liu, Y.; Zhang, M.; An, C.-B. Response of altitudinal vegetation belts of the Tianshan Mountains in northwestern China to climate change during 1989–2015. Sci. Rep. 2021, 11, 4870. [Google Scholar] [CrossRef]
  128. Qi, G.; Song, J.; Li, Q.; Bai, H.; Sun, H.; Zhang, S.; Cheng, D. Response of vegetation to multi-timescales drought in the Qinling Mountains of China. Ecol. Indic. 2022, 135, 108539. [Google Scholar] [CrossRef]
  129. Liu, P.; Chi, Y.; Huang, Z.; Zhong, D.; Zhou, L. Multidimensional response of China’s grassland stability to drought. Glob. Ecol. Conserv. 2024, 52, e02961. [Google Scholar] [CrossRef]
  130. Shi, X.; Ding, H.; Wu, M.; Shi, M.; Chen, F.; Li, Y.; Yang, Y. A comprehensive drought monitoring method integrating multi-source data. PeerJ 2022, 10, e13560. [Google Scholar] [CrossRef] [PubMed]
  131. Zhang, X.; Zhang, B. The responses of natural vegetation dynamics to drought during the growing season across China. J. Hydrol. 2019, 574, 706–714. [Google Scholar] [CrossRef]
  132. Han, L.; Zhang, Q.; Zhang, Z.; Jia, J.; Wang, Y.; Huang, T.; Cheng, Y. Drought area, intensity and frequency changes in China under climate warming, 1961–2014. J. Arid Environ. 2021, 193, 104596. [Google Scholar] [CrossRef]
  133. Luo, M.; Meng, F.; Sa, C.; Duan, Y.; Bao, Y.; Liu, T.; De Maeyer, P. Response of vegetation phenology to soil moisture dynamics in the Mongolian Plateau. Catena 2021, 206, 105505. [Google Scholar] [CrossRef]
  134. Ding, Y.; Xu, J.; Wang, X.; Peng, X.; Cai, H. Spatial and temporal effects of drought on Chinese vegetation under different coverage levels. Sci. Total Environ. 2020, 716, 137166. [Google Scholar] [CrossRef]
  135. Ding, Y.; He, X.; Zhou, Z.; Hu, J.; Cai, H.; Wang, X.; Li, L.; Xu, J.; Shi, H. Response of vegetation to drought and yield monitoring based on NDVI and SIF. CATENA 2022, 219, 106328. [Google Scholar] [CrossRef]
  136. Reddy, A.R.; Chaitanya, K.V.; Vivekanandan, M. Drought-induced responses of photosynthesis and antioxidant metabolism in higher plants. J. Plant Physiol. 2004, 161, 1189–1202. [Google Scholar] [CrossRef]
  137. Xu, H.-J.; Wang, X.-P.; Zhao, C.-Y.; Yang, X.-M. Diverse responses of vegetation growth to meteorological drought across climate zones and land biomes in northern China from 1981 to 2014. Agric. For. Meteorol. 2018, 262, 1–13. [Google Scholar] [CrossRef]
  138. Liu, X.; Yu, S.; Yang, Z.; Dong, J.; Peng, J. The first global multi-timescale daily SPEI dataset from 1982 to 2021. Sci. Data 2024, 11, 223. [Google Scholar] [CrossRef] [PubMed]
  139. Deng, H.; Yin, Y.; Han, X. Vulnerability of vegetation activities to drought in Central Asia. Environ. Res. Lett. 2020, 15, 084005. [Google Scholar] [CrossRef]
  140. Parente, J.; Amraoui, M.; Menezes, I.; Pereira, M.G. Drought in Portugal: Current regime, comparison of indices and impacts on extreme wildfires. Sci. Total Environ. 2019, 685, 150–173. [Google Scholar] [CrossRef] [PubMed]
  141. Koutsias, N.; Martínez-Fernández, J.; Allgöwer, B. Do factors causing wildfires vary in space? Evidence from geographically weighted regression. GIScience Remote Sens. 2010, 47, 221–240. [Google Scholar] [CrossRef]
  142. Dormann, C.F.; McPherson, J.M.; Araújo, M.B.; Bivand, R.; Bolliger, J.; Carl, G.; Davies, R.G.; Hirzel, A.; Jetz, W.; Daniel Kissling, W. Methods to account for spatial autocorrelation in the analysis of species distributional data: A review. Ecography 2007, 30, 609–628. [Google Scholar] [CrossRef]
  143. Zhang, R.; Chen, Z.-Y.; Xu, L.-J.; Ou, C.-Q. Meteorological drought forecasting based on a statistical model with machine learning techniques in Shaanxi province, China. Sci. Total Environ. 2019, 665, 338–346. [Google Scholar] [CrossRef]
  144. Zhai, J.; Mondal, S.K.; Fischer, T.; Wang, Y.; Su, B.; Huang, J.; Tao, H.; Wang, G.; Ullah, W.; Uddin, M.J. Future drought characteristics through a multi-model ensemble from CMIP6 over South Asia. Atmos. Res. 2020, 246, 105111. [Google Scholar] [CrossRef]
  145. Yang, J.-Z.; Yang, Y.-C.; Li, Z.-H.; Liao, L.-P.; Gan, R.-M.; Wang, W.-Q.; Wang, T.-Y.; Liang, L.-Q. The regional characteristics of meteorological drought event and its multidimensional factors measurement by daily SPEI in Guangxi, China. Geomat. Nat. Hazards Risk 2023, 14, 117–142. [Google Scholar] [CrossRef]
  146. Liu, Y.; Zhou, R.; Wen, Z.; Khalifa, M.; Zheng, C.; Ren, H.; Zhang, Z.; Wang, Z. Assessing the impacts of drought on net primary productivity of global land biomes in different climate zones. Ecol. Indic. 2021, 130, 108146. [Google Scholar] [CrossRef]
  147. Ng, C.Y.; Wan Jaafar, W.Z.; Othman, F.; Lai, S.H.; Mei, Y.; Juneng, L. Assessment of Evaporative Demand Drought Index for drought analysis in Peninsular Malaysia. Sci. Total Environ. 2024, 917, 170249. [Google Scholar] [CrossRef]
  148. Migała, K.; Łupikasza, E.; Osuch, M.; Opała-Owczarek, M.; Owczarek, P. Linking drought indices to atmospheric circulation in Svalbard, in the Atlantic sector of the High Arctic. Sci. Rep. 2024, 14, 2160. [Google Scholar] [CrossRef] [PubMed]
  149. Gerberding, K.; Schirpke, U. Mapping the probability of forest fire hazard across the European Alps under climate change scenarios. J. Environ. Manag. 2025, 377, 124600. [Google Scholar] [CrossRef] [PubMed]
  150. Wickramasinghe, A.M.K.; Boer, M.M.; Cunningham, C.X.; Nolan, R.H.; Bowman, D.M.J.S.; Williamson, G.J. Modeling the Probability of Dry Lightning-Induced Wildfires in Tasmania: A Machine Learning Approach. Geophys. Res. Lett. 2024, 51, e2024GL110381. [Google Scholar] [CrossRef]
  151. Vissio, G.; Turco, M.; Provenzale, A. Testing drought indicators for summer burned area prediction in Italy. Nat. Hazards 2023, 116, 1125–1137. [Google Scholar] [CrossRef]
  152. Taylor, S.W.; Woolford, D.G.; Dean, C.; Martell, D.L. Wildfire prediction to inform fire management: Statistical science challenges. Stat. Sci. 2013, 28, 586–615. [Google Scholar] [CrossRef]
  153. Xu, Y.; Zhu, X.; Cheng, X.; Gun, Z.; Lin, J.; Zhao, J.; Yao, L.; Zhou, C. Drought assessment of China in 2002–2017 based on a comprehensive drought index. Agric. For. Meteorol. 2022, 319, 108922. [Google Scholar] [CrossRef]
  154. Qiu, M.-L.; Cao, X.-S.; Zhou, J.; Feng, X.-L.; Gao, X.-C. Spatial differentiation and impact factors of grain yield per hectare in Weibei Plateau based on GWR model: A case study of Binxian county, Shannxi. Sci. Agric. Sin. 2019, 52, 273–284. [Google Scholar]
  155. Wu, S.; Jiale, D.; Ruoxu, W.; Yige, W.; Ziyu, Y.; Bo, H.; Du, Z. Using an attention-based architecture to incorporate context similarity into spatial non-stationarity estimation. Int. J. Geogr. Inf. Sci. 2025, 39, 1460–1483. [Google Scholar] [CrossRef]
Figure 1. The spatial scales used in our study area. (a) Grids (0.5° × 0.5°), (b) climatic zones, and (c) vegetation zones.
Forests 16 01041 g001
Figure 2. Distribution of forest fire records by year (a) and by area (b). The numbers in parentheses in the legend represent the number of forest fires.
Forests 16 01041 g002
Figure 3. The technical flowchart of this study.
Forests 16 01041 g003
Figure 4. Heat map of the correlation between forest fire occurrence probability (FP), multi-year average forest fire number (AFN), burned area (ABA), and drought characteristics at (a) the grid-cell scale, (b) the climatic zone scale, and (c) the vegetation zone scale. * indicates that the correlation is significant at p < 0.05.
Forests 16 01041 g004
Figure 5. Spatial distribution of GWLR coefficients between forest fire occurrence probability and drought characteristics at the grid-cell scale for the period between 2001 and 2019. (a) Multi-year average drought duration (MDD) assessed with the SPEI at the 1-month scale (SPEI-1), (b) multi-year average drought duration (MDD) assessed with the SPEI at the 3-month scale (SPEI-3), (c) multi-year average number of drought events (MDN) assessed with the SPEI at the 6-month scale (SPEI-6), and (d) multi-year average number of drought events (MDN) assessed with the SPEI at the 12-month scale (SPEI-12).
Forests 16 01041 g005
Figure 6. Spatial distribution of GWPR coefficients between the number of forest fires and drought characteristics at the climate zone scale for the period between 2001 and 2019. (a) Multi-year average drought duration (MDD) assessed with the SPEI at the 1-month scale (SPEI-1), (b) multi-year average drought duration (MDD) assessed with the SPEI at the 3-month scale (SPEI-3), (c) multi-year average drought duration (MDD) assessed with the SPEI at the 6-month scale (SPEI-6), and (d) multi-year average drought duration (MDD) assessed with the SPEI at the 12-month scale (SPEI-12).
Forests 16 01041 g006
Figure 7. Spatial distribution of GWR coefficients between the burned area and drought characteristics at the climate zone scale for the period between 2001 and 2019. (a) Multi-year average drought duration (MDD) assessed with the SPEI at the 1-month scale (SPEI-1), (b) multi-year average drought duration (MDD) assessed with the SPEI at the 3-month scale (SPEI-3), (c) multi-year average drought duration (MDD) assessed with the SPEI at the 6-month scale (SPEI-6), and (d) multi-year average drought duration (MDD) assessed with the SPEI at the 12-month scale (SPEI-12).
Forests 16 01041 g007
Figure 8. Spatial distribution of GWPR coefficients between the number of forest fires and drought characteristics at the vegetation zone scale for the period between 2001 and 2019. (a) Multi-year average number of drought events (MDN) assessed with the SPEI at the 1-month scale (SPEI-1), (b) multi-year average number of drought events (MDN) assessed with the SPEI at the 3-month scale (SPEI-3), (c) multi-year average drought intensity (MDI) assessed with the SPEI at the 6-month scale (SPEI-6), and (d) multi-year average number of drought events (MDN) assessed with the SPEI at the 12-month scale (SPEI-12).
Forests 16 01041 g008
Figure 9. Spatial distribution of GWR coefficients between the burned area and drought characteristics at the vegetation zone scale for the period between 2001 and 2019. (a) Multi-year average number of drought events (MDN) assessed with the SPEI at the 1-month scale (SPEI-1), (b) multi-year average number of drought events (MDN) assessed with the SPEI at the 3-month scale (SPEI-3), (c) multi-year average drought intensity (MDI) assessed with the SPEI at the 6-month scale (SPEI-6), and (d) multi-year average number of drought events (MDN) assessed with the SPEI at the 12-month scale (SPEI-12).
Forests 16 01041 g009
Figure 10. Comparison of actual values and model predictions. (a,b) are climate zone scales; (c,d) are vegetation zone scales; and (e) is the grid scale. The box indicates the interquartile range, the horizontal line is the median, the dashed line is the mean, and the whisker plot extends to the upper and lower quartiles, 1.5 quartile range.
Forests 16 01041 g010
Table 1. China’s meteorological drought classification standard.
SPEIDegree of Drought
(−0.5,+∞)No drought
(−1.0,−0.5]Light drought
(−1.5,−1.0]Mid-drought
(−2.0,−1.5]Heavy drought
(-∞,−2.0]Extraordinary drought
Table 2. Normalized formulas and explanations.
No.FormulaExplanationVariables Using This Formula
(1) x i * = x i x min x max x min x i and x i * are the values before and after data normalization,
respectively; x m a x and x m i n are the maximum and minimum
values of the full sample data, respectively.
Slope, terrain roughness, road density, stream density, settlements density, MDN, and MDD
(2) x i * = x max x i x max x min x i and x i * are the values before and after data normalization,
respectively; x m a x and x m i n are the maximum and minimum
values of the full sample data, respectively.
MDS and MDI
Table 3. Explanatory variable VIF covariance diagnostic results.
Spatial ScaleTime ScaleMDNMDDMDSMDIPopulation DensityTerrain RoughnessRoad DensityRiver DensitySlope
GridSPEI-1473.515735.083785.057516.3731.9954.422.4291.8384.737
SPEI-393.778250.833270.608101.4322.0194.4122.4331.8634.713
SPEI-649.589153.513171.28554.3932.0564.4532.3951.8394.763
SPEI-1219.76864.05870.28817.0682.0894.3932.4941.7484.684
Climate zoneSPEI-1397.014146.76925,748.552382.192.4824.2313.072.3333.877
SPEI-3295.94711,438.62342.481438.1412.4784.5563.1232.4124.115
SPEI-6317.4312,263.31515.759396.972.54.8493.0152.424.087
SPEI-12706.3592788.1442534.195586.1182.5124.1192.92.494.112
Vegetation zoneSPEI-1413.69821,402.35689.097658.1563.0493.3624.3282.7373.438
SPEI-35466.7147715.0386731.3954685.9852.7693.7783.8613.2053.329
SPEI-62932.1865075.6144503.2222473.9372.7274.2083.5332.7833.605
SPEI-121897.6252881.6822535.3791564.4432.693.6223.3353.3983.991
Table 4. Selection of drought characteristics for fire regime modeling.
Spatial ScaleTime ScaleForest Fire RegimesDrought Characterization SelectionCorrelation Coefficient (r)
GridSPEI-1Forest fires probability (FP)MDD0.066
SPEI-3Forest fires probability (FP)MDD0.062
SPEI-6Forest fires probability (FP)MDN0.118
SPEI-12Forest fires probability (FP)MDN0.346
Climate zoneSPEI-1Forest fires number (AFN)MDD0.274
SPEI-3Forest fires number (AFN)MDD0.301
SPEI-6Forest fires number (AFN)MDD0.325
SPEI-12Forest fires number (AFN)MDD0.337
SPEI-1Forest fires area (ABA)MDD0.262
SPEI-3Forest fires area (ABA)MDD0.278
SPEI-6Forest fires area (ABA)MDD0.303
SPEI-12Forest fires area (ABA)MDD0.323
Vegetation zoneSPEI-1Forest fires number (AFN)MDN0.247
SPEI-3Forest fires number (AFN)MDN0.277
SPEI-6Forest fires number (AFN)MDI0.317
SPEI-12Forest fires number (AFN)MDN0.370
SPEI-1Forest fires area (ABA)MDN0.281
SPEI-3Forest fires area (ABA)MDN0.307
SPEI-6Forest fires area (ABA)MDI0.358
SPEI-12Forest fires area (ABA)MDN0.411
Table 5. Comparison of the goodness of fit of forest fire occurrence probability models according to the test dataset.
Time ScaleModelsAUC (2020)Significance TestAUC (2021)Significance TestAUC (Average Value) A I C c
1GLR0.733p < 0.0010.679p < 0.0010.7065557.885
GWLR0.759p < 0.0010.810p < 0.0010.7855075.387
3GLR0.683p < 0.0010.629p < 0.0010.6565549.720
GWLR0.684p < 0.0010.697p < 0.0010.6915015.870
6GLR0.698p < 0.0010.656p < 0.0010.6775621.884
GWLR0.730p < 0.0010.738p < 0.0010.7345079.253
12GLR0.741p < 0.0010.762p < 0.0010.7525552.902
GWLR0.757p < 0.0010.801p < 0.0010.7795100.363
Table 6. Comparisons of the goodness of fit of forest fire number and burned area models according to the test dataset.
Time ScaleSpatial ScaleForest Fire RegimesModelsR2RMSEMAE A I C c
1Vegetation zoneForest fires number (AFN)GPR0.57140.91420.614639.4522
GWPR0.66840.82400.531238.4935
Forest fires area (ABA)GR0.48500.81411.4734121.0521
GWR0.55711.73041.3158118.9629
Climate zoneForest fires number (AFN)GPR0.15311.00930.831577.7203
GWPR0.38320.92150.720854.7073
Forest fires area (ABA)GR0.02302.07451.8009190.6213
GWR0.50202.19651.3348−172,435.9467
3Vegetation zoneForest fires number (AFN)GPR0.47770.98600.648839.2792
GWPR0.60000.88840.567438.1480
Forest fires area (ABA)GR0.46731.83601.4195119.7505
GWR0.52851.77011.3347116.8250
Climate zoneForest fires number (AFN)GPR0.16651.00580.811675.5902
GWPR0.37020.92720.717553.8537
Forest fires area (ABA)GR0.03032.07921.7603189.3072
GWR0.18982.02481.6253177.8480
6Vegetation zoneForest fires number (AFN)GPR0.55010.93120.620438.3726
GWPR0.64730.85020.548837.8103
Forest fires area (ABA)GR0.49301.80161.4344115.5250
GWR0.54211.73851.3824−2859.9011
Climate zoneForest fires number (AFN)GPR0.18320.99900.796675.5349
GWPR0.36230.93140.717653.7501
Forest fires area (ABA)GR0.05092.06691.7236189.2227
GWR0.19012.02671.6181177.6037
12Vegetation zoneForest fires number (AFN)GPR0.57040.91420.624538.4794
GWPR0.64800.84610.549237.5106
Forest fires area (ABA)GR0.48091.82461.4014117.5047
GWR0.53231.76751.3350110.7712
Climate zoneForest fires number (AFN)GPR0.23850.98520.771973.4857
GWPR0.38890.92110.695053.5372
Forest fires area (ABA)GR0.10352.07031.6436187.6698
GWR0.20952.01891.5895177.3279
Table 7. Table of mean values of regression coefficients of model variables.
Grid (FP)Climate Zone (AFN)Climate Zone (ABA)Vegetation Zone (AFN)Vegetation Zone (ABA)
SPEI-1Population density−5.58−0.4010.74−3.96−1.49
Road density7.431.512.725.145.00
Surface roughness0.10−0.137.65−0.51−1.18
River density0.180.782.120.740.67
Slope1.820.21−12.280.772.04
Drought characteristics−4.211.34−2.901.723.32
SPEI-3Population density−5.69−0.31−1.14−3.87−1.92
Road density8.101.481.885.034.97
Surface roughness0.75−0.49−1.40−0.64−1.40
River density−0.370.790.840.500.30
Slope1.490.651.410.822.16
Drought characteristics−4.441.712.261.443.10
SPEI-6Population density−4.37−0.30−1.14−3.79−5.11
Road density7.631.501.905.106.04
Surface roughness0.02−0.45−1.34−0.68−1.91
River density0.340.790.840.480.92
Slope2.540.631.370.882.50
Drought characteristics−3.571.752.311.513.78
SPEI-12Population density−4.87−0.21−1.07−3.66−2.05
Road density6.921.491.895.034.90
Surface roughness−0.24−0.49−1.41−0.73−1.45
River density1.110.860.940.27−0.15
Slope3.010.751.510.812.07
Drought characteristics0.871.642.191.584.01
Disclaimer/Publisher’s Note: The statements, opinions and data contained in all publications are solely those of the individual author(s) and contributor(s) and not of MDPI and/or the editor(s). MDPI and/or the editor(s) disclaim responsibility for any injury to people or property resulting from any ideas, methods, instructions or products referred to in the content.

