Article

The Mechanical Properties of Laminated Veneer Products from Different Stands of Douglas Fir and Norway Spruce in Germany

1
Fraunhofer Institute for Wood Research Wilhelm-Klauditz-Institute WKI, 38108 Braunschweig, Germany
2
Department of Wood Biology and Wood Products, Georg-August-University Göttingen, 37073 Göttingen, Germany
*
Author to whom correspondence should be addressed.
Forests 2025, 16(7), 1040; https://doi.org/10.3390/f16071040 (registering DOI)
Submission received: 29 April 2025 / Revised: 30 May 2025 / Accepted: 17 June 2025 / Published: 21 June 2025
(This article belongs to the Special Issue Wood Properties: Strength, Density, Hardness)

Abstract

:
The relationship between silvicultural strategies, manifested in the thinning method and rotation age on sites with different water supply, and the mechanical properties of engineered wood products plywood and laminated veneer lumber has been analyzed. Sample logs from five German sites of Norway spruce (Picea abies (L.) Karst.) and Douglas fir (Pseudotsuga menziesii (M.) Franco) have been rotary-peeled and processed into boards with a phenol–resorcinol–formaldehyde adhesive to evaluate their performance under flexural, tensile, and compressive loads. Satisfactory coefficients of determination were reached for Norway spruce in regard to the silvicultural framework and the tree characteristics of slenderness and crown base height. Douglas fir products did not achieve comparable determination due to high variance within boards and stands but did achieve significantly better mechanical properties. Norway spruce was observed to be more responsive to thinning measures, while the effect of different thinning regimes was not evident for Douglas fir. The on-site evaluation of Douglas fir stands for veneer product quality based on silvicultural parameters and tree characteristics was shown to be inconclusive, with its naturally higher wood density being the decisive constant.

1. Introduction

While the conservation of stable forest ecosystems throughout changes in climatic conditions has become the primary directive for silvicultural strategies, the demand for renewable building materials is rising. Plywood and laminated veneer lumber are homogenized products, but still, a question for quality predictions arises: How are the factors of the thinning system, rotation age, and site quality potentially influencing the product quality of these engineered wood products? The effects of these silvicultural parameters could also be expressed by the anatomical characteristics of trees, like height and diameter, or different features of the crown, like its base height or radius. If mechanical board properties could be modeled depending on these factors with sufficient accuracy, an on-site non-destructive quality evaluation would be feasible to allocate timber lots efficiently to producers of different products.
Therefore, we have examined the mechanical properties of veneer boards, both plywood and laminated veneer lumber, produced from Norway spruce (Picea abies (L.) Karst.; PCAB) and Douglas fir (Pseudotsuga menziesii (M.) Franco; PSMN) logs of different origin. A change toward a focus on single trees in thinning regimes, prevalent as thinning from above, with selective measures in the co-dominant tree layer, has become predominant in Germany in recent decades, accompanied by concerns for accelerated growth with stronger knots and wider growth rings. Previously, a more uniform treatment of stands with the removal of subdominant and subordinate trees, thinning from below, led to denser, one-layered structures.
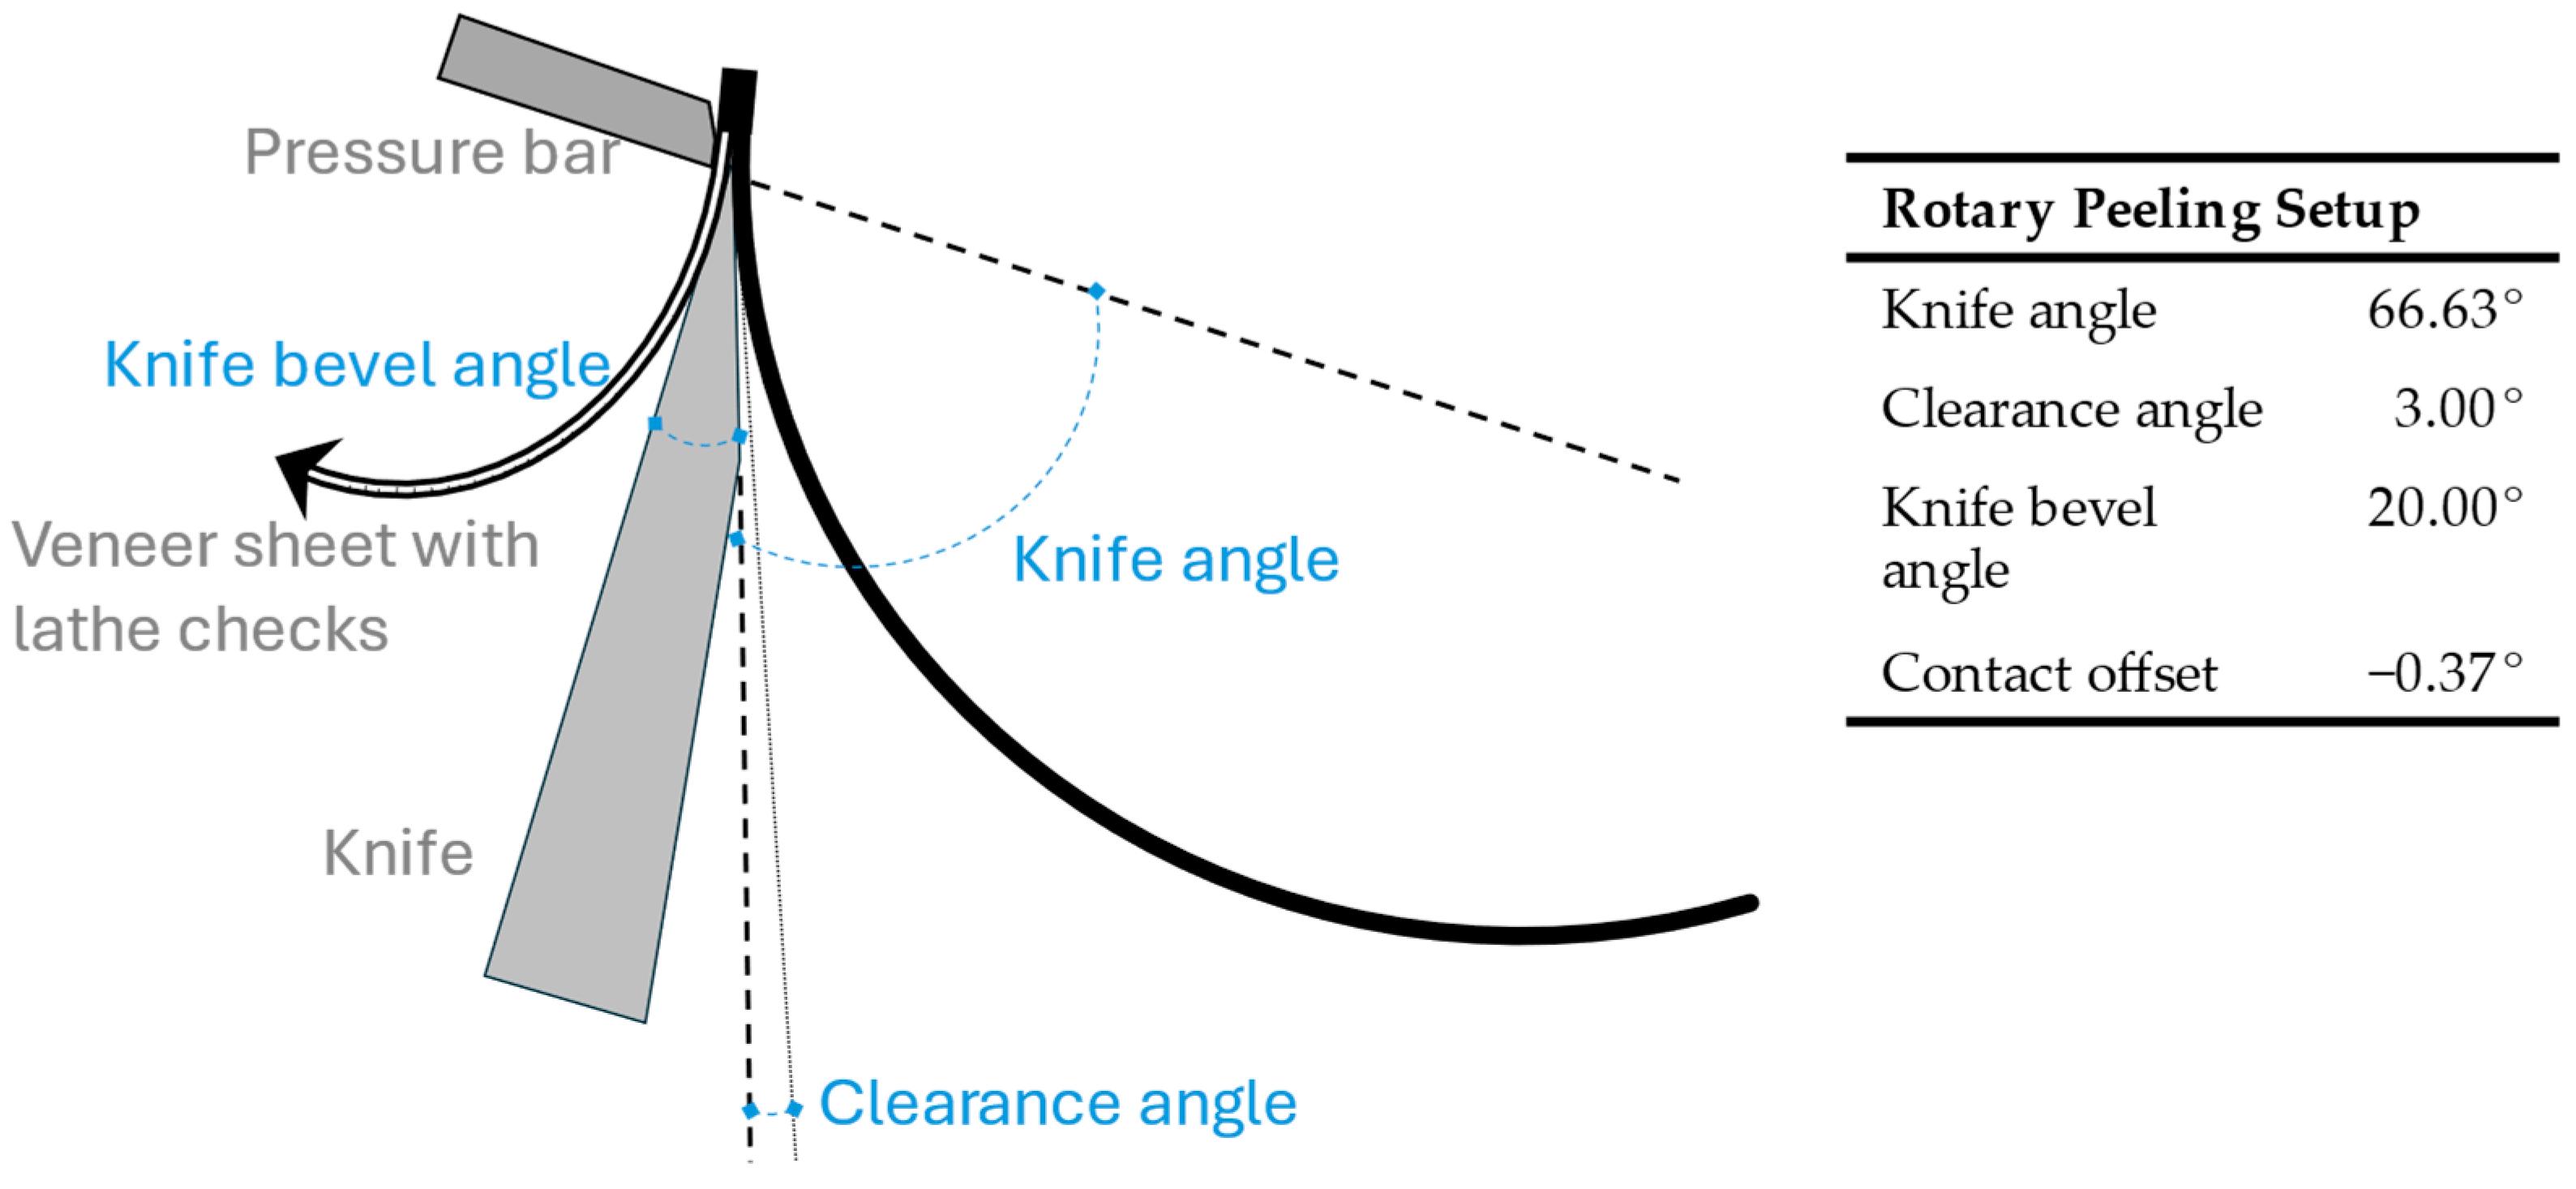
Laminated veneer products can be produced by rotary-peeling logs that have been pre-treated with heat and moisture to soften the wood material, depending on the grain orientation of plies, cross-directional and dimensional stable plywood, or unidirectional laminated veneer lumber, in reference to their substitute application as load-bearing beams. Hybrid products, with different layer build-up, have been researched to adjust the physical properties for both ply orientation and wood species combination [1,2,3]. The advantage of veneer products lies in their high resource efficiency, which is paid for by the higher use of adhesive. The adhesive consumption has been addressed by efforts toward an ever-increasing veneer thickness, with a standard range of 1.5 to 3.5 mm being effectively raised to up to 7 mm [4], with a certain effect in that regard [5]. The resource efficiency applies to logs of very large dimensions that would require elaborate band-saw equipment in sawmills but that can be rotary-peeled with far less waste material [6], as well as thin logs, especially with the use of spindleless rotary cutting machines [7], or for low-quality wood [3,6] with the redistribution of wood defects reaching higher strengths than equal cross-sections of sawed timber. The quality assessment of veneers is mainly concerned with knots [8,9], surface roughness [10,11], and lathe cracks [8,12,13,14]. A comprehensive study on the general mechanical properties of LVL in the three primary directions has been carried out by Romero and Odenbreit [15]. As an alternative to the costly setup of endless-LVL assembly lines, Gilbert et al. [16] examined finger-jointed LVL from batch presses, finding a performance within 99% of the regular cross-section without joints.
Schönfelder et al. [17] and Kask et al. [18] investigated the effect of growth conditions and silvicultural practices on wood density for clean wood samples of Scots pine (Pinus sylvestris L.). Higher wood densities were observed on poorer sites [18] and lower variation of wood density along the log radius for slow-growing trees from the shelterwood practice [17]. Shupe et al. [19] were able to examine Loblolly pine (Pinus taeda L.) plywood sourced from even-aged stands with different basal areas, finding an advantage in flexural stiffness in material from densely growing sites. Similarly, Huang et al. [20] observed an advantage in mechanical properties for stands of Larix olgensis (H.) with high density. Twenty-year-old and forty-year-old Southern pine from plantations was processed to LVL by Biblis [21], who found a distinct advantage of using veneer from older stands. Differences in the mechanical properties of the sapwood and heartwood of softwoods also have to be considered but are detectable by the state-of-the-art optical grading of knots and the acoustic measurement of wood density. For French Douglas fir, significantly better performances in flexural behavior were measured for sapwood [22], with heartwood performing 16% worse in flatwise bending and 20% worse in edgewise bending. Viguier et al. [23] compared LVL from equally dimensioned beech logs from high wood and coppice and found significantly better flexural behavior in high-wood material but missing differences in wood density. The stiffness properties of roughly 50-year-old Douglas fir veneers have been compared to the acoustic velocity within trees by Lowell et al. [24], finding a negative correlation of tree diameter and taper with veneer stiffness. Different non-destructive evaluation methods were tested in an extensive trial by Schimleck et al. [25], examining NIR spectroscopy, computer tomography, Pilodyn, Resistograph, and acoustic velocity. These state-of-the-art methods all measure expressions of the tree wood density, while this study takes a more conservative approach by evaluating the anatomical appearance of trees and thereby indirectly deducing the wood properties; however, using laser scan data is a less researched approach.

2. Materials and Methods

2.1. Production of Boards and Mechanical Testing

Logs from six stands of Norway spruce and from five stands of Douglas fir were harvested in the course of a larger project on the mechanical properties of Norway spruce (PCAB) and Douglas fir (PSMN) depending on site and tree characteristics [26,27,28]. The tree ages for PCAB were 40 and 80 years, while 30- and 45-year-old trees (with stand 11 at 60 years old being an exception) were sampled for PSMN. Both ages represent realistic rotation ages within central European silvicultural practice in regard to the species growth rate. For simplification, the stands were sorted into a younger and an older age group. Both older rotation ages can still be considered as economically oriented, yielding typical dimensions for modern profile chipper sawmills. Conservative or conservationist management would aim for longer rotation periods, e.g., 120 years for PCAB and 80 years for PSMN.
The strongest and most centric log of each stand was selected for rotary veneer peeling. Logs from one stand of PCAB had to be redacted due to insufficient dimensions. An additional stand of PCAB was included in an accompanying investigation and supplied mechanical data but did not possess the same information content on tree characteristics, which led to it not being included in some parts of the analysis. More detailed stand characteristics can be found in Table A1.
The logs were cut into segments of 1.6 m and heated in a water tank at 70 °C over the course of three days. After debarking, the plasticized logs were peeled with a knife bevel angle of 20° and a knife gap of 1.2 mm (Figure 1), resulting in a veneer thickness of 1.5 ± 0.1 mm prior to drying, losing an additional 0.05 mm on average during the drying process at 60 °C. The veneers were divided into smaller quadratic sheets of 600 mm × 600 mm. These sheets were graded according to the guidelines for knots of DIN EN 635-3 [29] into classes I to IV. Each board was laid out using visual veneer class II as face veneer, if possible, while the inner layers consisted of class III with a class IV, without large cracks, as the core sheet. Face veneers had to be sourced from grade III veneers for stands 4, 5, 8, and 10 due to a lack of grade II veneers. The thresholds of sound knots were 15 mm, 50 mm, and 60 mm. For softwoods and thus for the examined sample veneers, the criterion of knot holes and blackened knots with traces of bark or rot was more decisive, with applied thresholds of 5 mm and 40 mm for classes II and III.
During the pressing preparation, the sheets of each board were oriented to keep open and closed sides together, meaning sides with and without peeling cracks in the surface. The adhesive was applied one-sided at a load of 300 g m−2 (±20 g). A phenol–resorcinol–formaldehyde adhesive system, Prefere 4040 with hardener Prefere 5839 (Prefere Resins Holding GmbH, Erkner, Germany), was used in the production of boards and prepared as a batch for each board to keep the processing time below 20 min and the open time of the adhesive system of 80 min. A seven-layer build-up was chosen for LVL and plywood to minimize dimensional effects on the mechanical cross-comparability between product properties and site effects and to yield sufficient samples for the mechanical properties of each board. The board thickness was compressed by 10% from 10.5 mm to 9.5 mm during the pressing process at 1 MPa minimal pressure at the desired thickness. The press was set to 140 °C with a 5 min pressing time for 32 s mm−1.
For each stand of PCAB, five boards of plywood and laminated veneer lumber (LVL) were produced. For PSMN, six boards of each type were produced as the standard, making up for the lower planned number of examined stands. To make observations on this limited laboratory scale, test specimen size was adapted where possible, despite the overall aim of the study being an evaluation of the effects on the suitability of site and tree characteristics for structural applicability of the appropriately sourced softwood logs. Both LVL and plywood follow the same examination scheme (schematic illustration in Figure 2). The flat-wise flexural properties, bending strength and stiffness, were measured in accordance with EN 310 [30] with a 250 × 50 × 9.7 ± 0.2 mm sample size. DIN EN ISO 527-2 [31] provided a sufficiently proportioned specimen design, for tensile strength tests, at 180 mm length, 20 mm width at the head for pulling clamps, and a taper down to 5 mm at the 50 mm long testing length in the specimen center. The provisional standard prEN 14374:2016 [32], which has been redacted after the practical tests of this study, contained a comprehensive design for compression-strength specimens. The longitudinal compression specimen consisted of a quadratic cross-section with thrice the board thickness in length, i.e., 30 mm. The specimens for the orthogonal compression strength in the board plane were 20 mm in width and length with unmodified board thickness. All specimens were stored under controlled climate conditions with 20 °C and 65% relative humidity until mass consistency was reached.

2.2. Data Analysis

The results of mechanical tests have been examined for the relevant statistical assumptions with the Shapiro–Wilk test for normality. Although the vast majority of factors are normally distributed, we chose to provide a robust comparison of variants at the observed sample size and applied the Kruskal–Wallis test to define significant differences between data groups. Due to the examination of natural sample sites, a hierarchy within samples was unavoidable. The respective factors are addressed in the Section 3, but the construction of linear mixed models was not deemed appropriate, as the factors of age group, water supply quality (WS), and silvicultural thinning method (TFA, thinning from above; TFB, thinning from below), were two-level factors or did not possess sufficient repetitions within the data structure. We used the statistical programming tool RStudio (Version 2024.04.0) for the construction, analysis, and visualization of linear models.
List of packages: stats, car [33], flexplot [34], dplyr [35], rstatix [36], multcomp [37], asbio [38]

3. Results

3.1. Laminated Veneer Lumber Properties

The results of the mechanical tests were compared in accordance with the anisotropy of the examined wood material to show the relation of LVL properties and their dependence on each other. The data was plotted in Figure 3 as a comparison of the two examined wood species. The tensile strength of LVL boards correlated to their compression strength in the grain direction at 0.45 for PCAB and 0.23 for PSMN. The correlation between tensile and bending properties was more pronounced for PCAB with 0.69, while PSMN again had a coefficient of 0.23. The longitudinal bending stiffness was significantly correlated to the bending strength with 0.91 for PCAB and 0.78 PSMN. The relation of compression and bending properties, as depicted in Figure 3b, is characterized by their matching intercepts for both species, correlating at 0.65 and 0.37. PCAB generally exhibited stronger correlations of mechanical properties compared to PSMN, as detailed in Table A2.
The differences in mean board properties of both species were analyzed with pairwise Kruskal–Wallis comparisons, which indicated, with a p-value of 0.12, that the tensile strength of PCAB and PSMN LVL boards was not significantly different. The distinction of each species’ properties was evident in the results of compressive tests and bending strength, both with p-values < 0.00 at the 95% confidence interval. In both cases, PSMN showed higher mechanical properties. In addition to the graphically included properties, the bending stiffness in the direction of grain, or Modulus of Elasticity, ranged between stand means of 8761 N mm−2 and 12,640 N mm−2 for PCAB and between 10.987 N mm−2 and 14,586 N mm−2 for PSMN. Considering the results for the different mechanical properties in the context of Figure 4, beginning with Figure 4a for PCAB, the relevance of board density is put into perspective. The younger stands 12 and 2 are on par with the achieved board density of the older stand 3. Significant rank differences between data groups were detected only for stands 12, 3, and 2 in relation to stand 6. The rank structure for the mechanical strength and stiffness, however, is composed differently. For the tensile (101.41 N mm−2), compression (51.3 N mm−2), and bending strengths (94.8 N mm−2), as well as the bending stiffness (12,640.8 N mm−2), stand 3 reached the highest means. Compared to its mean board density, the specimen of stand 4 performed surprisingly well, reaching the second-highest means for all four properties (detailed in Table A3). The lowest means were measured within boards from stands 6 and 12, both from the younger age group and treated with TFA. The tensile (65.2 N mm−2), compression (41.5 N mm−2), and bending strength (71.6 N mm−2), as well as the bending stiffness (8761.5 N mm−2) of these two stands, are insignificantly different from those of the older TFB stand 5. In comparison to stands 2 and 4, no consistent hierarchical advantage is indicated. As a mean, the deviation of the test results is stronger between boards than within single boards. The mean standard deviation (σ) of boards, given in Table A3 for PCAB LVL, indicates, exemplary for the tensile strength, the widest range of results within stand 4 at 17.2 N mm−2, while the strongest mean deviation of results within boards was detected in stand 5 with 15.8 N mm−2. The generally lower σ within boards of stand 12 are explained by the higher board count. The detected σ between boards is well within the range of stands 2 to 6. The test of stand 12 included veneer sheets from more logs than the LVL and plywood from the other stands, which was intended to test if the chosen sample sizes were appropriately reflecting the expected variation in veneer quality within stands. This condition was regarded as fulfilled after comparing the variability. The scope and relation of variances varied considerably between the mechanical properties, e.g., the within board σ for tensile properties was highest for stand 5, while its other strength properties were most consistent among PCAB LVL.
Examining the properties of PSMN LVL, the higher variance is conspicuous, while the general range of results for mean board density overlaps just slightly with the highest results of PCAB, as expected for the higher natural density of PSMN and the identical compression factor of 10%. The two stands of the young age group, stand 10, with a mean of 733.7 kg m−3, and stand 8, exhibit the highest medians among stands, but the high variance within stand 8 results in a lower mean of 686.9 kg m−3 than within stand 7 of 713.2 kg m−3. The lowest observed mean board density was found in stand 9 at 641.7 kg m−3. For PSMN, the largest knot within each board was noted to characterize this factor for each stand. The older stands 7, 9 and 11 tended to exhibit smaller knot diameters on their veneer sheets, although stand 9 was not significantly different from stands 8 and 10 for the LVL boards. The highest tensile strength was measured for the specimen of stand 11 at a mean of 96.3 N mm−2, while the lowest mean, 67.1 N mm−2, was measured in stand 10 (as detailed in Table A4). The differences in compression strength on average were small. Stand 10 showed the highest mean at 58.14 N mm−2. At the examined sample size, the certainty of non-significant differences between stands was high at a p-value of 1.0 and at its lowest value at a mean of 52.3 N mm−2 in stand 9. The flat bending strength and stiffness did achieve their highest values in boards from stand 7 with 105.9 N mm−2 and 14,586.8 N mm−2, closely followed by stand 11 with 99.7 N mm−2 for bending strength. To evaluate the data variance within and between stands and the related feasibility of the gathered data, the σ within stands and boards of stands 10 and 11 should be considered carefully as examples of lower and higher sample sizes. The mean σ values of both stands lie within the range of the other stands for more than one property. The best example is the tensile strength, as stands 8 and 9 showed the lowest (16.4 N mm−2) and highest (20.0 N mm−2) standard deviation. However, the results of stand 10 were susceptible to outliers, resulting in a high variance for results within the stand, e.g., the bending strength and stiffness. In conclusion, the results of stand 10 are feasible but should be interpreted within their context. The σ of PSMN LVL in general exceeds the values determined for PCAB LVL for both the variance within specimen from one board and the σ of mean board values within stands.

3.2. Plywood Properties

Regarding the overall mechanical properties of plywood, the difference between PCAB and PSMN regarding their variance become apparent, as was already observed in the previous section. Concerning the correlations of mechanical properties depicted in Figure 5 and detailed in Table A5, the results of tensile and compression strengths of PCAB plywood correlate positively at 0.51, comparable to the PCAB LVL results, while these two properties correlate distinctly negatively at −0.41 for boards from PSMN. The correlation coefficient between perpendicular bending strength and compression strength was determined to be 0.45 for PCAB and 0.30 for PSMN, which, although less determined, is comparable to the results of both species for their longitudinal bending strengths. For plywood from PCAB, the bending strength correlated significantly with tensile strength at 0.61, while no correlation was detected for PSMN, with a coefficient of 0.03. The correlation of bending strength and stiffness was higher for the PSMN plywood at 0.89, compared to 0.74 for PCAB. The density of plywood boards correlated significantly to the perpendicular bending stiffness of PCAB at 0.53 and the bending properties of PSMN at 0.50 for fm,90 and 0.48 for Em,90. PCAB plywood compression strength did not correlate significantly to board density in contrast to a slight correlation of 0.30 within PSMN plywood results. The tensile strength of plywood from both species did not significantly differ, with a Kruskal–Wallis comparison reaching a p-value of 0.11.
While PCAB stand 12’s plywood boards are ranked at a comparable density as the older stand 3 (Figure 6a), stand 12, possessing a mean of 575.0 kg m−3 and stand 3 having a mean of 579.7 kg m−3, the mechanical properties of stand 3 are distinctly superior. For the tensile strength, three data groups can be defined, with stand 3 and its mean of 57.2 N mm−2 at the top; stands 4, 5, and 2 as an intermediate group; stand 5 having a mean of 41.34 N mm−2; and a low-performing group with stand 6 having a mean of 35.0 N mm−2 and stand 12 of 34.0 N mm−2 (Table A6). These three groups were declared significant by a one-way ANOVA, applicable due to a non-rejectable assumption of normality, as proven by a Shapiro–Wilk test, but the more robust Kruskal–Wallis comparison only assumes a significant distinction between the high- and low-performing stands. The range of values is more limited for the compression strength. While stand 3 exhibited the highest mean at 31.6 N mm−2, here, the boards of stand 2 and stand 5, with means of 24.4 and 24.6 N mm−2, make up the lowest ranks. Regarding the perpendicular bending properties, stand 3 stands out, with a bending strength of 40.0 N mm−2 and an MoE of 3733.5 N mm−2. The lowest bending properties were measured among the specimen of stand 6 at 28.3 N mm−2 and 2746.8 N mm−2.
For the plywood boards from PSMN, interestingly, the boards of stand 10 and stand 9 possessed the highest and lowest mean of measured density as they had for LVL with means of 768.0 kg m−3 and 648.4 kg m−3 (Figure 6b). Especially considering the low board count for stand 10, one could suspect the cause for these density relations in natural variance between veneer sheets. Instead, we can deduce that we have adequately represented the density of trees within the stands. The variance is high, but the means of the stands between products differ minimally.
The distinction between stands is obscured by a high σ (Table A7). Neither a Kruskal–Wallis comparison nor a more lenient ANOVA detected significant differences between groups. The highest mean for tensile strength was measured in stand 11 with 42.0 N mm−2, but with a σ of 16.3 mm−2, the extreme values of over 60 N mm−2 and below 30 N mm−2 are not attributable to single outliers, but to a general phenomenon.
The results of compression strength varied between 40.3 N mm−2 among the stand 7 specimen and 34.5 N mm−2 for the mean of stand 8. The coefficient of variance (CV) was lowest for the compression strength, as has been the case for the strength properties of both veneer products and both species. In a comparison of LVL and plywood, the latter had a compression strength CV range of 12.6 to 16.6, the first from 12.7 to the special case, stand 10, at 22.6, with the next lowest CV at 12.7. The similarity of CV between plywood and LVL from one species can also be observed within the ranges of PCAB, e.g., the CV ranges of bending stiffness: PCAB LVL showed 11.2 to 12.9 and PCAB plywood 9.1 to 13.8. The same comparison for PSMN reveals 15.5 to 25.9 for LVL and 14.2 to 27.0. This exemplifies the difference of variance between the materials of both wood species. The highest CV can be observed for tensile strength in both cases, reaching up to 46.5 for PSMN plywood. Stand 10 reached the highest mean for bending strength at 47.5 N mm−2, while the lowest mean was detected within the stand 8 specimen at 34.7 N mm−2. The corresponding MoE is ranked accordingly for means between 1293.8 N mm−2 and 657.0 N mm−2. The largest knot sizes contained in boards, as depicted in Figure 6c, relate to the age-wise grouping of stands into younger and older stands. As we applied the appropriate randomness in selecting sheets of a particular quality class to be used within boards, there should be no bias toward the incorporation of more or fewer sheets from the core of logs. The diameter of each knot should therefore be assumed to be representative of its stand.

3.3. Linear Models in Dependence of Site Conditions

The previous section established the variance within stands and boards, basic characteristics of boards for both PCAB and PSMN, and the correlation between their mechanical properties. To approach the introductory hypothesis, an analysis of linear models is needed in which the dependence of the mechanical properties on the silvicultural framework and the characteristics of trees within stands are used to identify indicators for product quality (Table 1).
For the mechanical properties of bending strength, bending stiffness, tensile and compression strength of LVL, the tree characteristics of crown base height (CB) and slenderness (height diameter ratio; HDR) have been identified as the most significant factors to formulate linear models. They were tested against the addition of further factors with a comparison of the Akaike Information Criterion, Bayes Information Criterion, and the adjusted Coefficient of Determination (R2) in a model comparison. Improvements to determination and information criteria had to be compared to the variation inflation factor (VIF) of the estimators. This was necessary to detect any concerning covariance patterns, as the mean tree features per stand were used for this analysis. Further factors, e.g., crown radius or crown surface, did increase the VIF over 5.0, which should be considered a cause for concerning covariance patterns [39,40].
The linear models in Table 1 for bending strength reached an adj. R2 of 0.56 based on the silvicultural factors. The estimators of factors are to be interpreted as an expected decrease in bending strength of −7.3 when the thinning system is changed from TFA to TFB. Although a direct comparison of TFA and TFB results suggests significantly higher mechanical properties of boards from TFB stands, the model analysis attributes the changes in bending strength to the age group and the water supply, increasing with stand age, but decreasing in sites with higher water availability. The thinning system is only significant within the 10% confidence range. The same observation can be made for the bending stiffness, where a COD of 0.60 was reached. The COD for the tensile strength was even higher at 0.66. Here, the thinning system was regarded to be of negligent significance. The model for compressive strength had the lowest COD of PCAB LVL models based on silvicultural data, with an adj. R2 of 0.29. In comparison, this means a drop in the overall model significance, but with its p-value of 0.02, the model is still within acceptable boundaries. The proportion of the explained variance of the models based on CB and HDR was slightly lower due to being a two-factor model
The linear models for the determination of PSMN LVL properties did not reach comparable CODs. Only 16% of variance within bending strength was explained by the silvicultural factors, shifting the overall model significance into the 90% confidence range. The results for the corresponding bending stiffness were slightly better with a COD of 0.22 and an acceptable model significance of 0.04. Water supply on-site was determined as a significant factor, with the thinning system having a slightly significant effect, while the age group was non-significant. Model iterations based on the tree anatomy were inconclusive for bending strength and stiffness, as well as the compressive strength results, but reached a COD of 0.23 for the explained variance of tensile strength. For PCAB, the thinning system TFB was associated with a negative effect on the mechanical properties, while for PSMN LVL, the shift from TFA to TFB resulted in positive estimator coefficients. Single-factor model iterations are visualized in Figure 7 for the bending stiffness in grain direction. The depicted factors, slenderness for PSMN and CB for PCAB, were chosen by the higher amount of explained variance. While the trends of PCAB for CB benefit from the low variance of stand 6 at slightly over 6 m CB, the trend is viable within the groups of TFB and age group. The effect of slenderness within the PSMN data was negative, contrary to the PCAB models, and was defined as insignificant for all examined properties but tensile strength. The high data variance of stand 10, with high slenderness, distorts the linear models, but even without considering stand 10, the variance along the axis of slenderness is low with a range between 75 and 85. The factor slenderness being higher in the younger age group indicates that at the examined age of 30 years old, the considerable clearing of single trees still has to take place to facilitate stronger radial growth.
The linear models for plywood made from PCAB reached higher CODs compared to LVL. For the perpendicular bending strength, an adjusted R2 of 0.77 was reached when thinning type, age group, and watr supply were incorporated into the model. Among the framework factor models, the compression strength model resulted in the lowest determination at 0.22, yet the model’s p-value lay within the acceptable confidence interval. While the factor of silviculture achieved at least a slight significance rating for its effect on the mechanical properties of LVL, its effect strength did not reach significant values for the framework models where the age group and water supply were considered. Age group and water supply were significant factors for the mechanical properties, excluding water supply within the linear model with the dependent factor compression strength, where its estimator coefficient of −1.5 did not suffice to be considered impactful. The results of the higher age group having a positive effect on the mechanical properties and an improved water supply having a negative effect were in agreement with the observations from LVL. When the crown properties were used as a basis for the formulation of linear models, using two crown characteristics as independent factors resulted in concerningly high VIFs. Therefore, factors from the silvicultural framework were used to complete two-factorial models, choosing the thinning system where viable, to gain additional information on its effect on the mechanical properties. The included crown factor was selected based on a comparison of one-factorial model determination, resulting in CB being chosen for PCAB in Table 2a and slenderness being selected for PSMN in Table 2b. The applied thinning system reached significant effect strengths in combination with CB for all but the compression strength models. These two-factorial models still result in a determination between 0.54 and 0.67, not considering the compressive strength, which would benefit from a substitution of silviculture with age group, as doing so explains 21% of the variance.
The model quality for PSMN has decreased, compared to PSMN LVL. The thinning system did not achieve sufficient CODs, which is why we selected the age group as a categorical factor. Two models resulted in slight model significance, and only the model for bending stiffness based on slenderness and age group achieved a considerable determination of 0.21. Within this model, both the slenderness and the age group had a significant effect on the observed MoE. Among the silvicultural factors, only the water supply had a significant effect in the three-factorial models, but this should be seen only as an indicator, as the overall model quality was low. As the PSMN plywood model for bending stiffness was the only iteration with significance and approved by tests for VIF, we chose this property for visualization in Figure 8. The graphical representation of bending properties benefits from the reduced CV of stand 10. The increased mean of stand 10 results, in relation to the second young stand 8, lead to an alignment of slopes for the bending stiffness depending on slenderness. An exemplary linear mixed model, with age group as a grouping factor for randomized intercepts, results in a marginal R2 of 0.24, i.e., the amount of variance explained by the tree slenderness, and a conditional R2 of 0.74 under the presumption that the age group factor accurately represents a group distinction. Comparable mixed models with WS and thinning system as random factors did not detect a meaningful effect of slenderness within their respective factor levels. The higher CODs of PCAB models enable a clearer deduction of the effect of CB, without dependence on the considered grouping factor.
Considering the low determination of PSMN models, additional factors have to be considered to determine the board quality. For both PSMN LVL and plywood, the size of knots within used veneer sheets was determined. For spruce, the quality class is the only data on knot sizes and only provides a rough estimation. For each PSMN board, the largest knot within its layers has been noted. This factor when combined with the achieved board density is visualized in Figure 9 for the achieved bending stiffness of plywood. The visualization includes the interaction term of density and knot size, which was found to be significant within the LVL and plywood data. The depicted model reached an adjusted COD of 0.41. The determination of bending strength was 0.36. The COD for LVL models was improved for the bending properties, with 0.39 for bending strength and 0.44 for elasticity. The tensile strength was not explained by a conclusive model based on these parameters and the compressive strength, though determined by the achieved board density with an adjusted R2 of 0.25 for LVL data, would not be feasible to test against knot sizes. The specimen size could not realistically contain representative knot sizes [32] and was cut among knot-free material where possible. However, for bending tests, where adequate samples for knots within the boards were included inside the specimen, a clear negative correlation of knots and bending properties is observable, which loses its effect and determination in combination with higher density.

4. Discussion

The site characteristics (
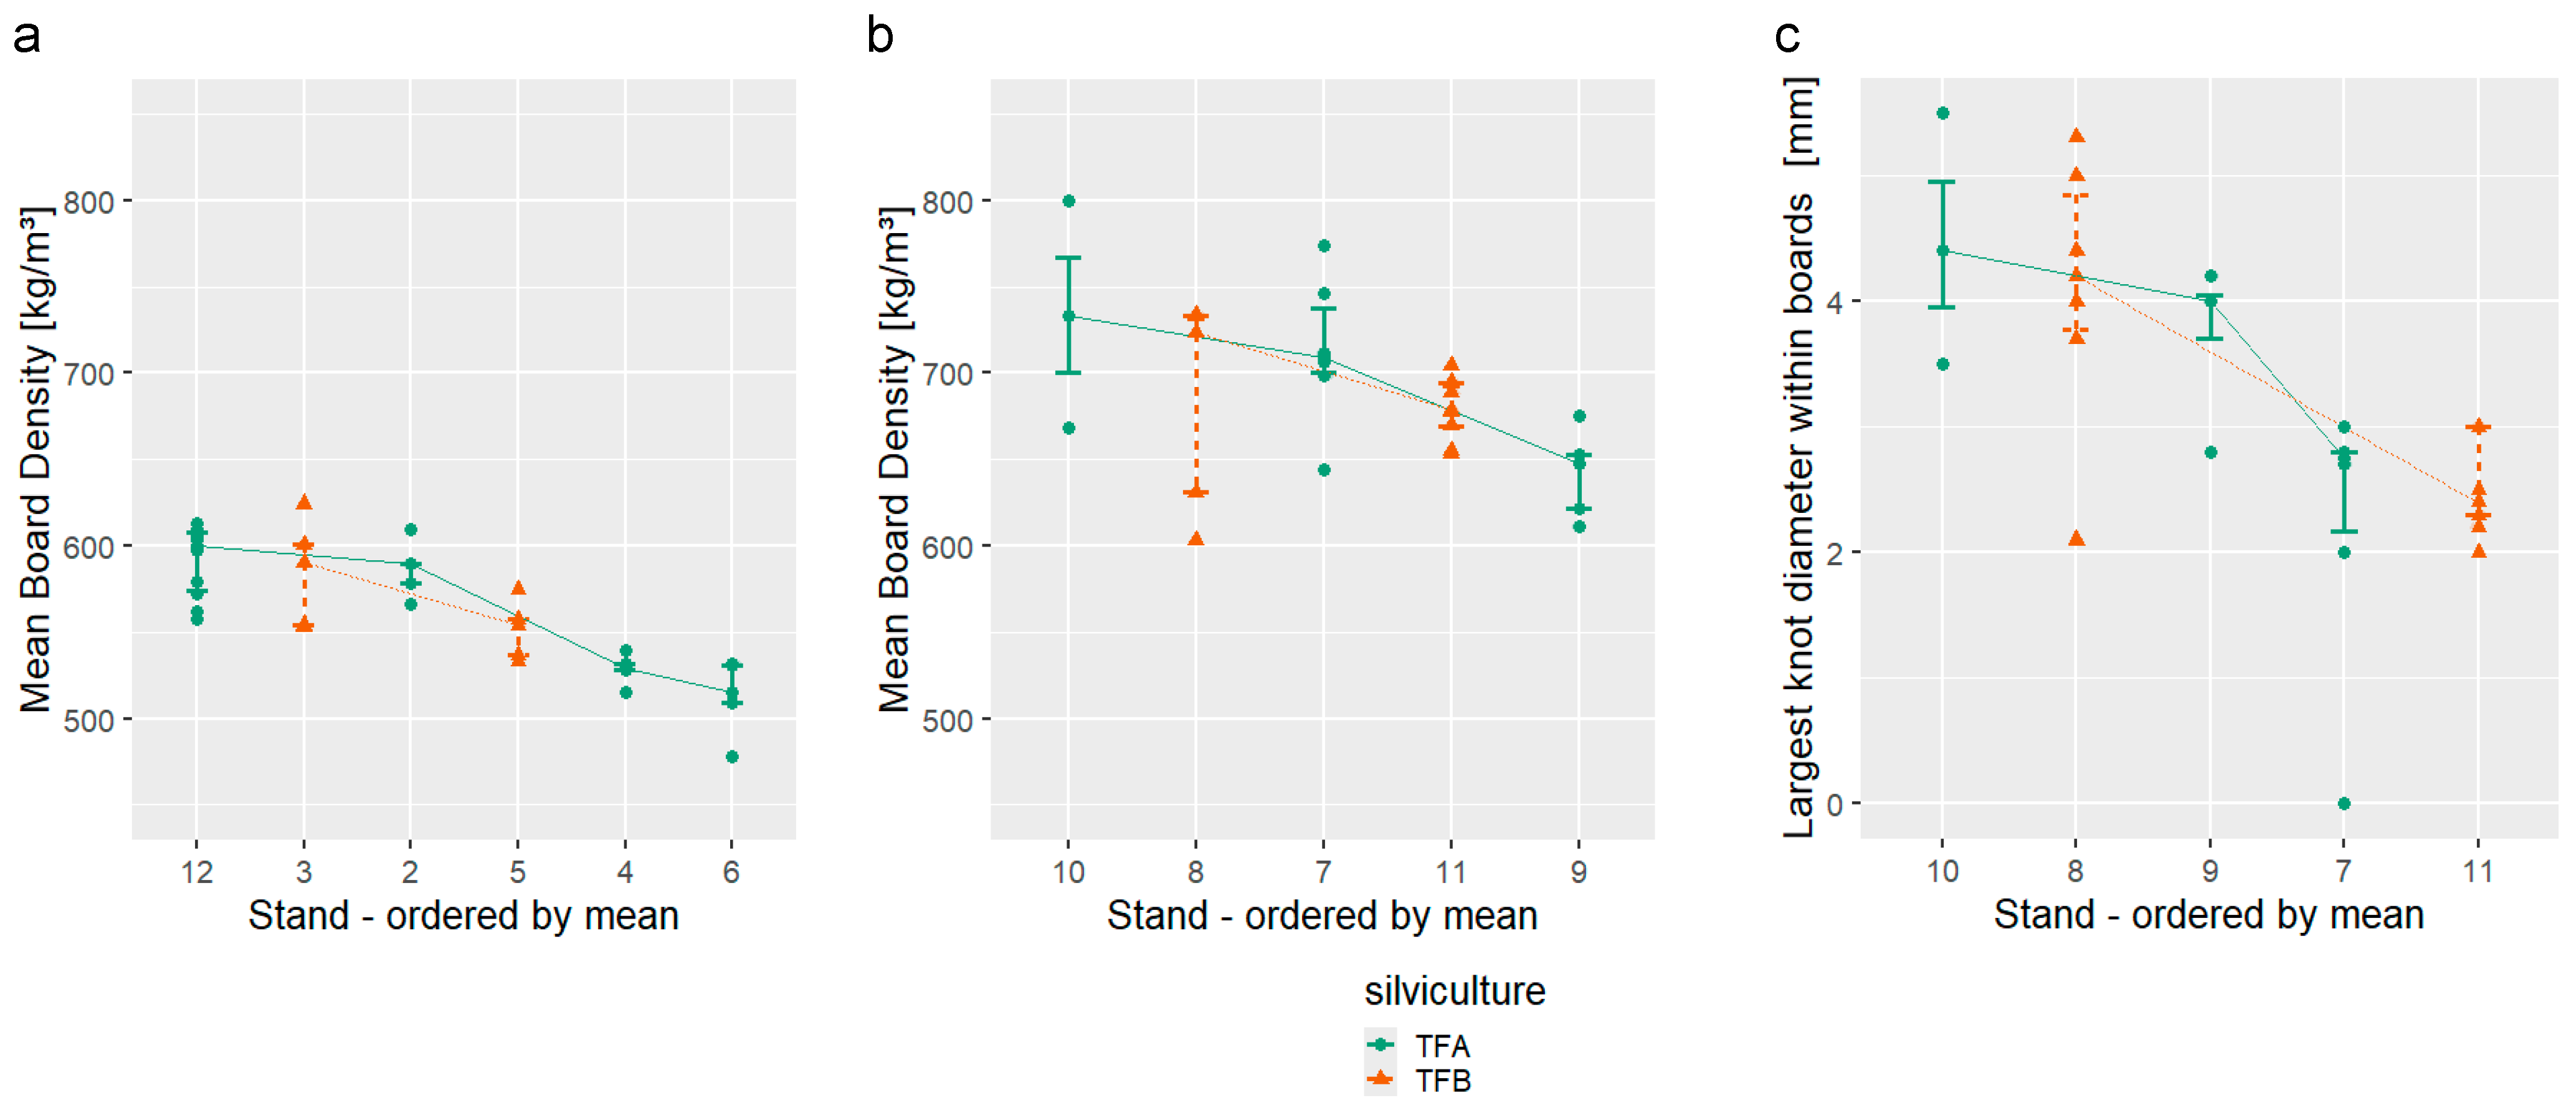
Table A1) suggest a certain rank order of wood density based on the water supply, the age and corresponding annual growth, and the presumed thinning intensity. A trend that was observed to be accurate for sawn timber [27,
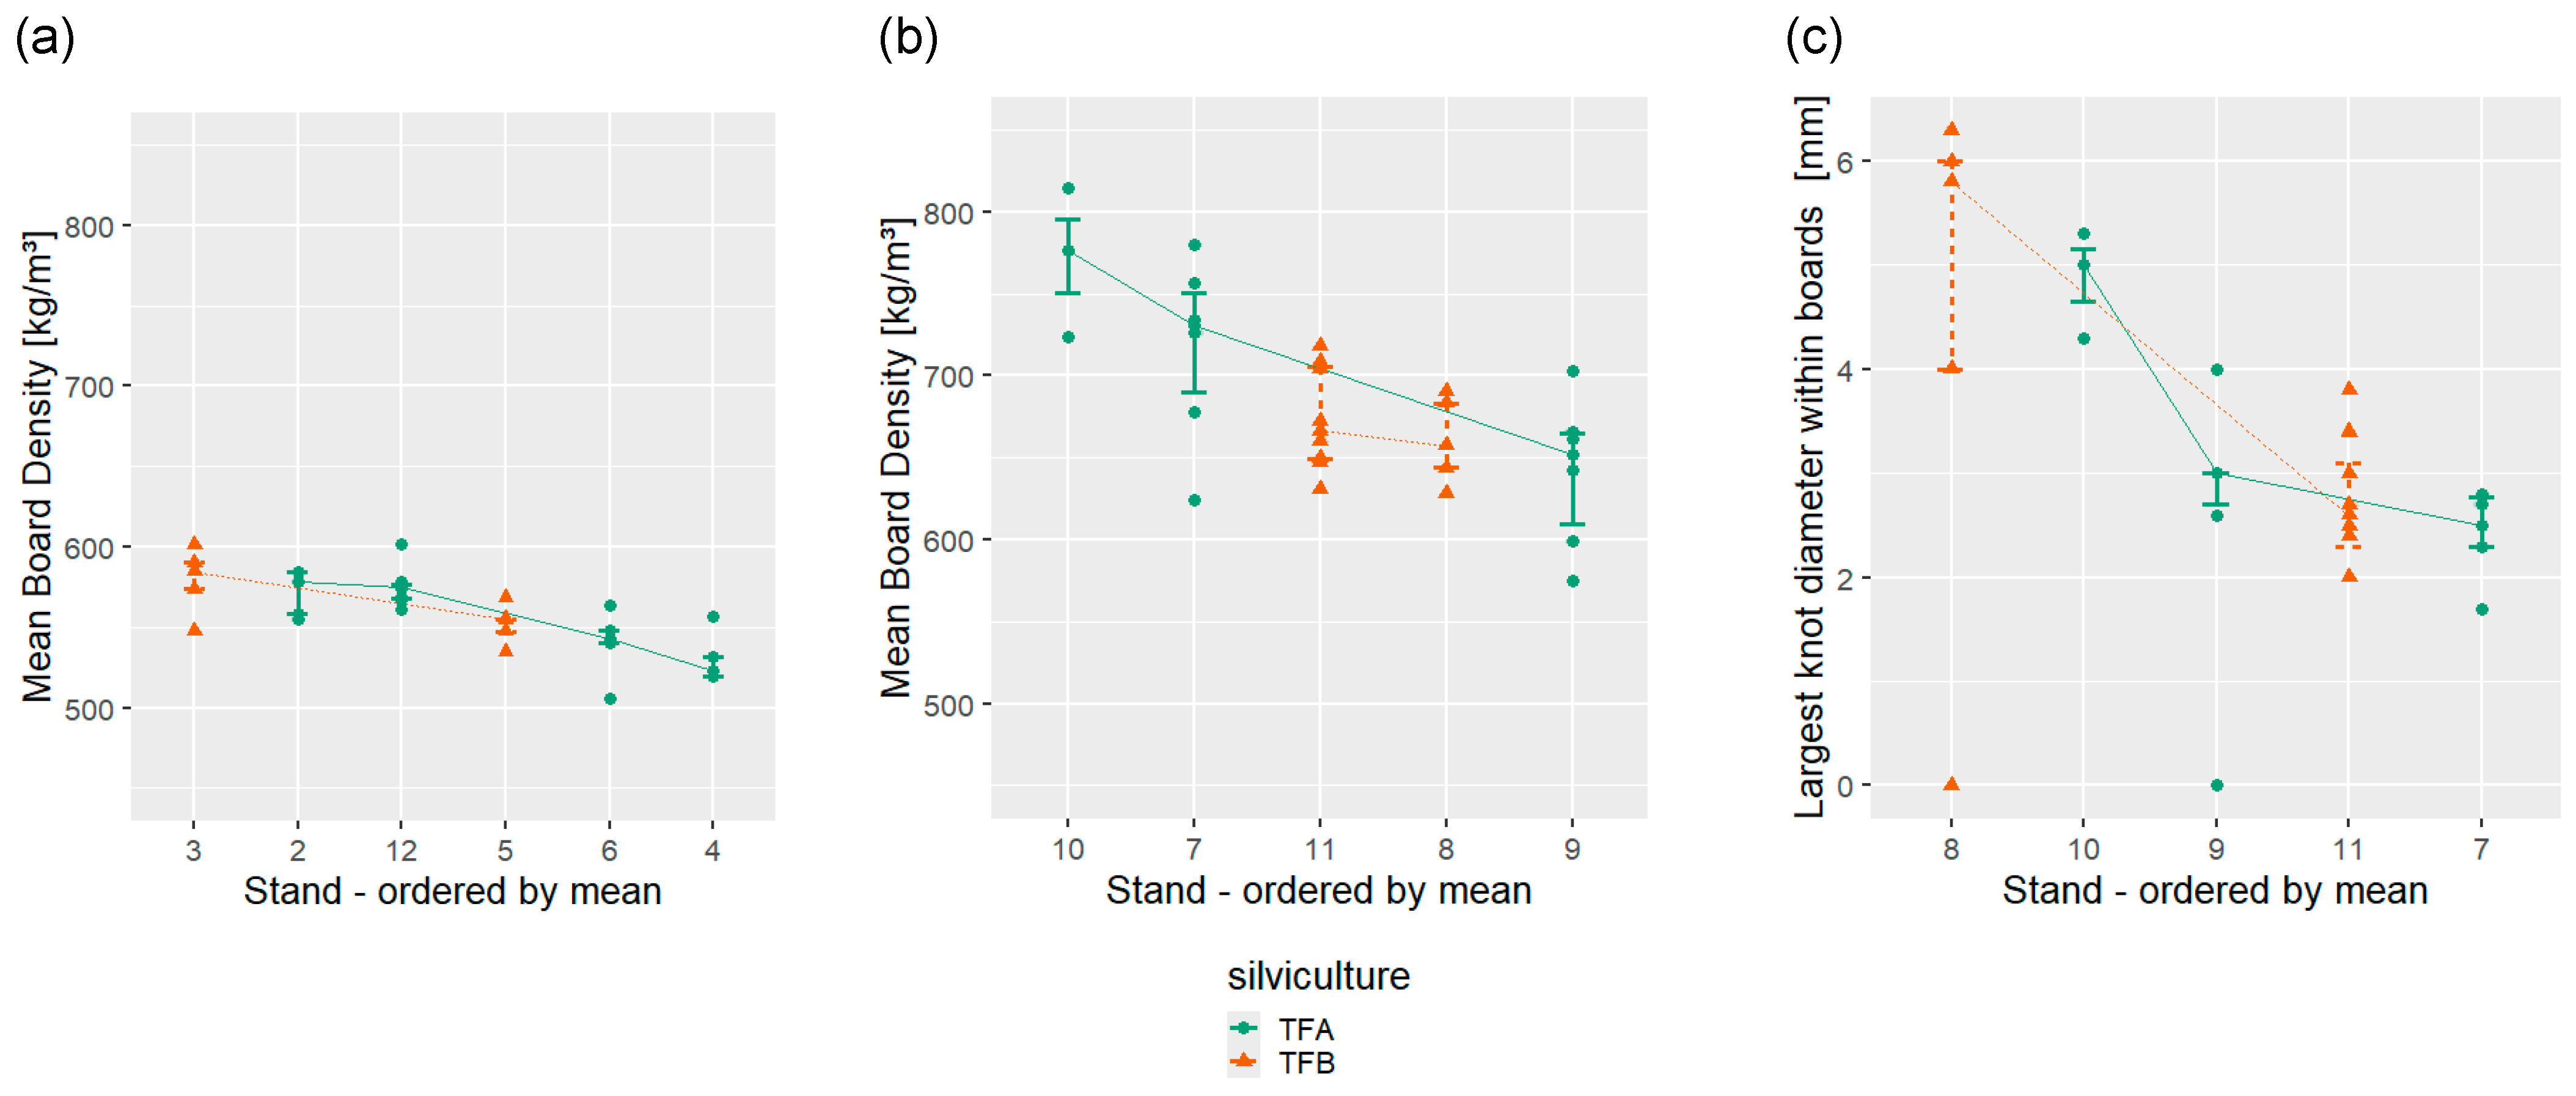
28]. With the press configuration set to achieve a defined thickness, the remaining variables to determine the final board density were the wood density itself and deviations in veneer thickness. Uneven veneers would experience a stronger springback during the relaxation phase, widening the press gap to 11.5 mm over the course of 20 s, and holding at that gap for 5 s before opening. When plywood and LVL within each species are compared, the mean densities of boards from one stand are similar, regardless of the product. This indicates that the deviations in veneer thickness were consistent for the treatment and peeling process of logs from each stand. Without changes to knife angle and gap, this suggests that logs with less diameter or density tend to yield thicker veneer or higher variance of sheet thickness. For PSMN, the σ of density is higher within the younger stand group, while this trend was undetermined for PCAB. The deductions regarding the material quality from different stands are mainly unaffected by this observation. Although the consequences of wood density are distorted during the production process, the factor of knot sizes for PSMN and the mechanical performance during tests correspond to stands with a younger age or with better water supply, exhibiting faster growth, which results in thicker knots compared to stands of a similar age (see Table A8).
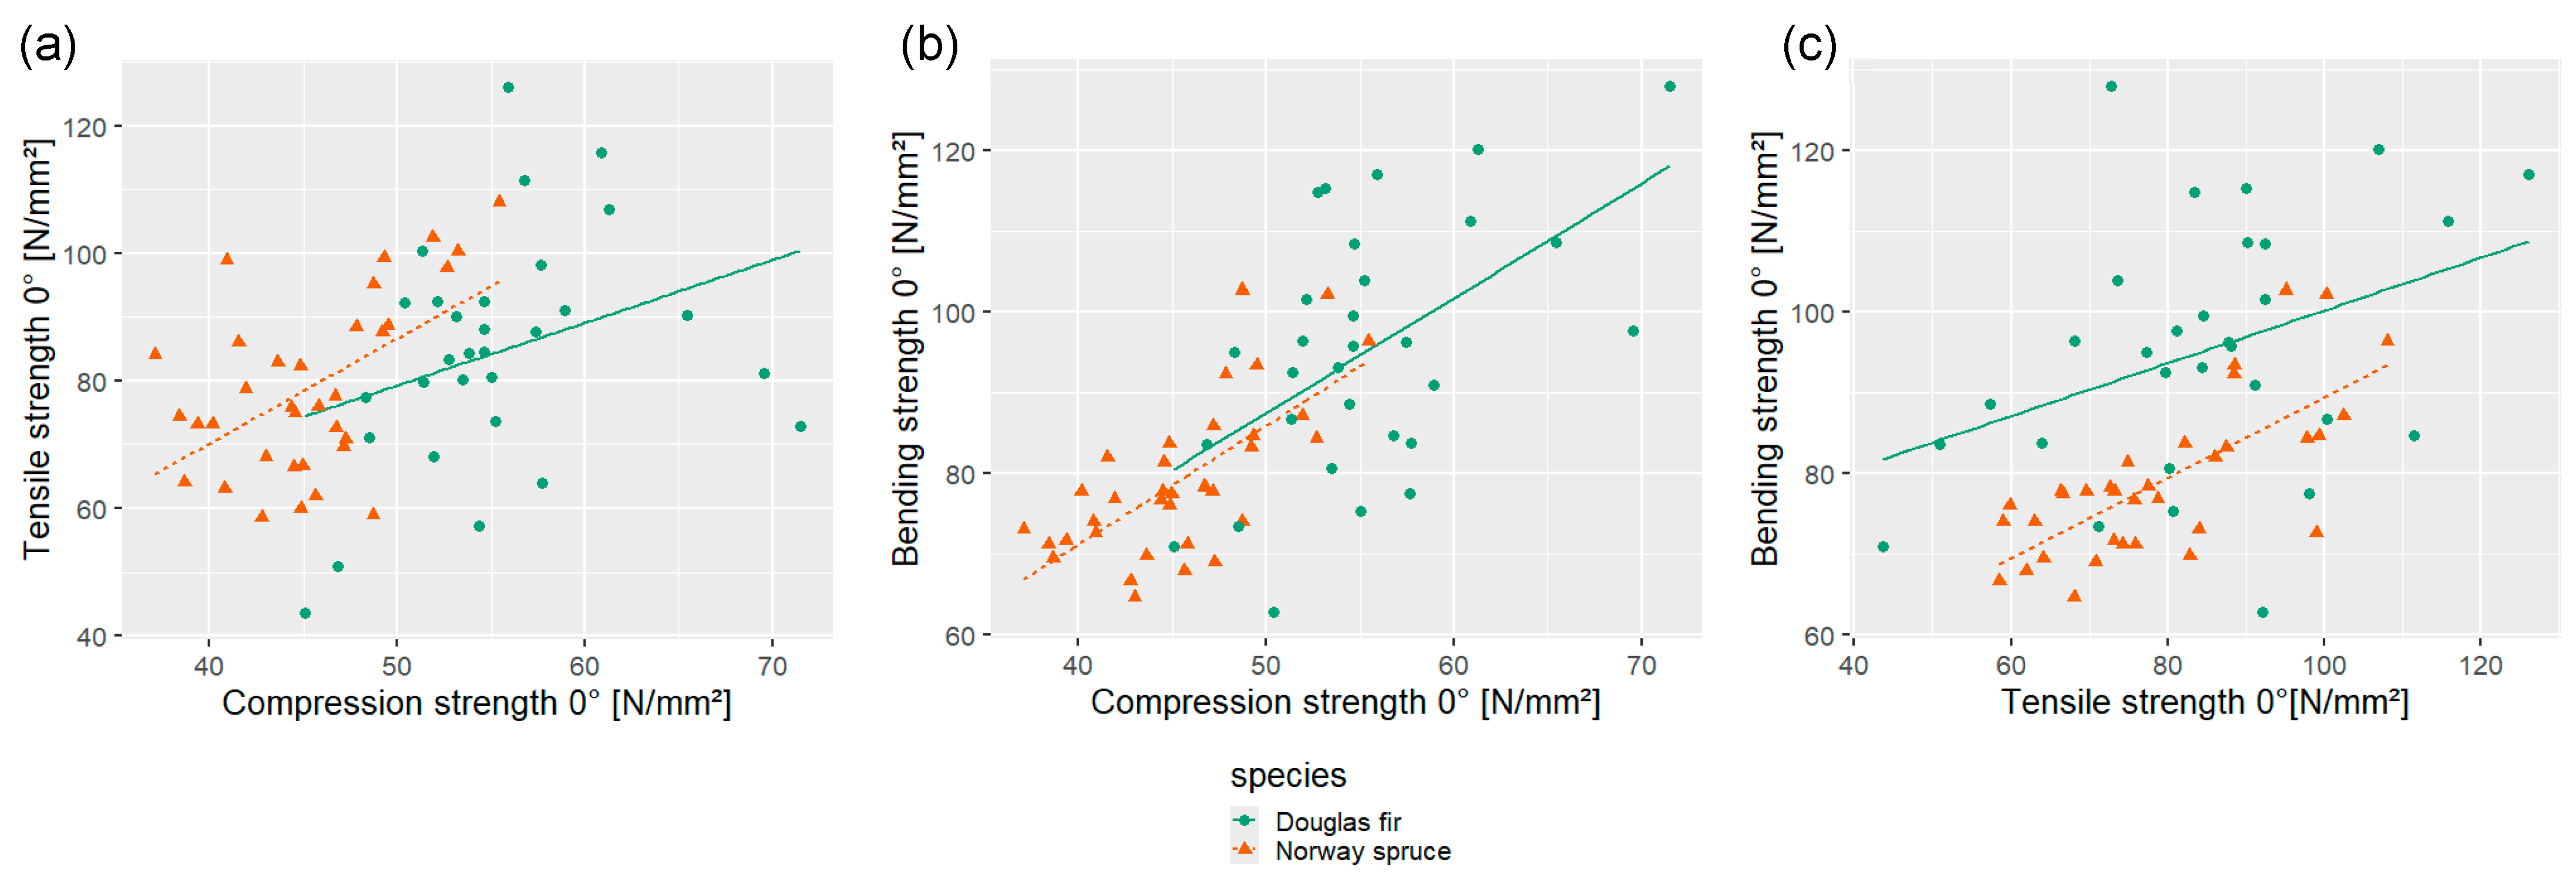
When evaluating the general mechanical properties of both species and products, the homogenized characteristics of plywood are recognizable, achieving a lower variance within species, when compared to the LVL boards. The high variance of PSMN products negatively influenced the deductions regarding the initial research hypothesis. For PCAB LVL and plywood, the highly significant models, based on thinning type, water supply, and age, adequately describe the product quality for the examined properties of bending strength, bending stiffness, and tensile and compression strength. The effect of the applied thinning system did not reach sufficient estimator coefficients to achieve p-values below 0.05. The flexural properties of LVL are the only exception for both PCAB and PSMN, with a slight significance between thinning type and test result. In conclusion, when the silvicultural framework is considered, the applied thinning system was negligible. Extended to the specifications of both systems, this implies that the intensity of thinning and resulting stand structure did not significantly influence the product quality.
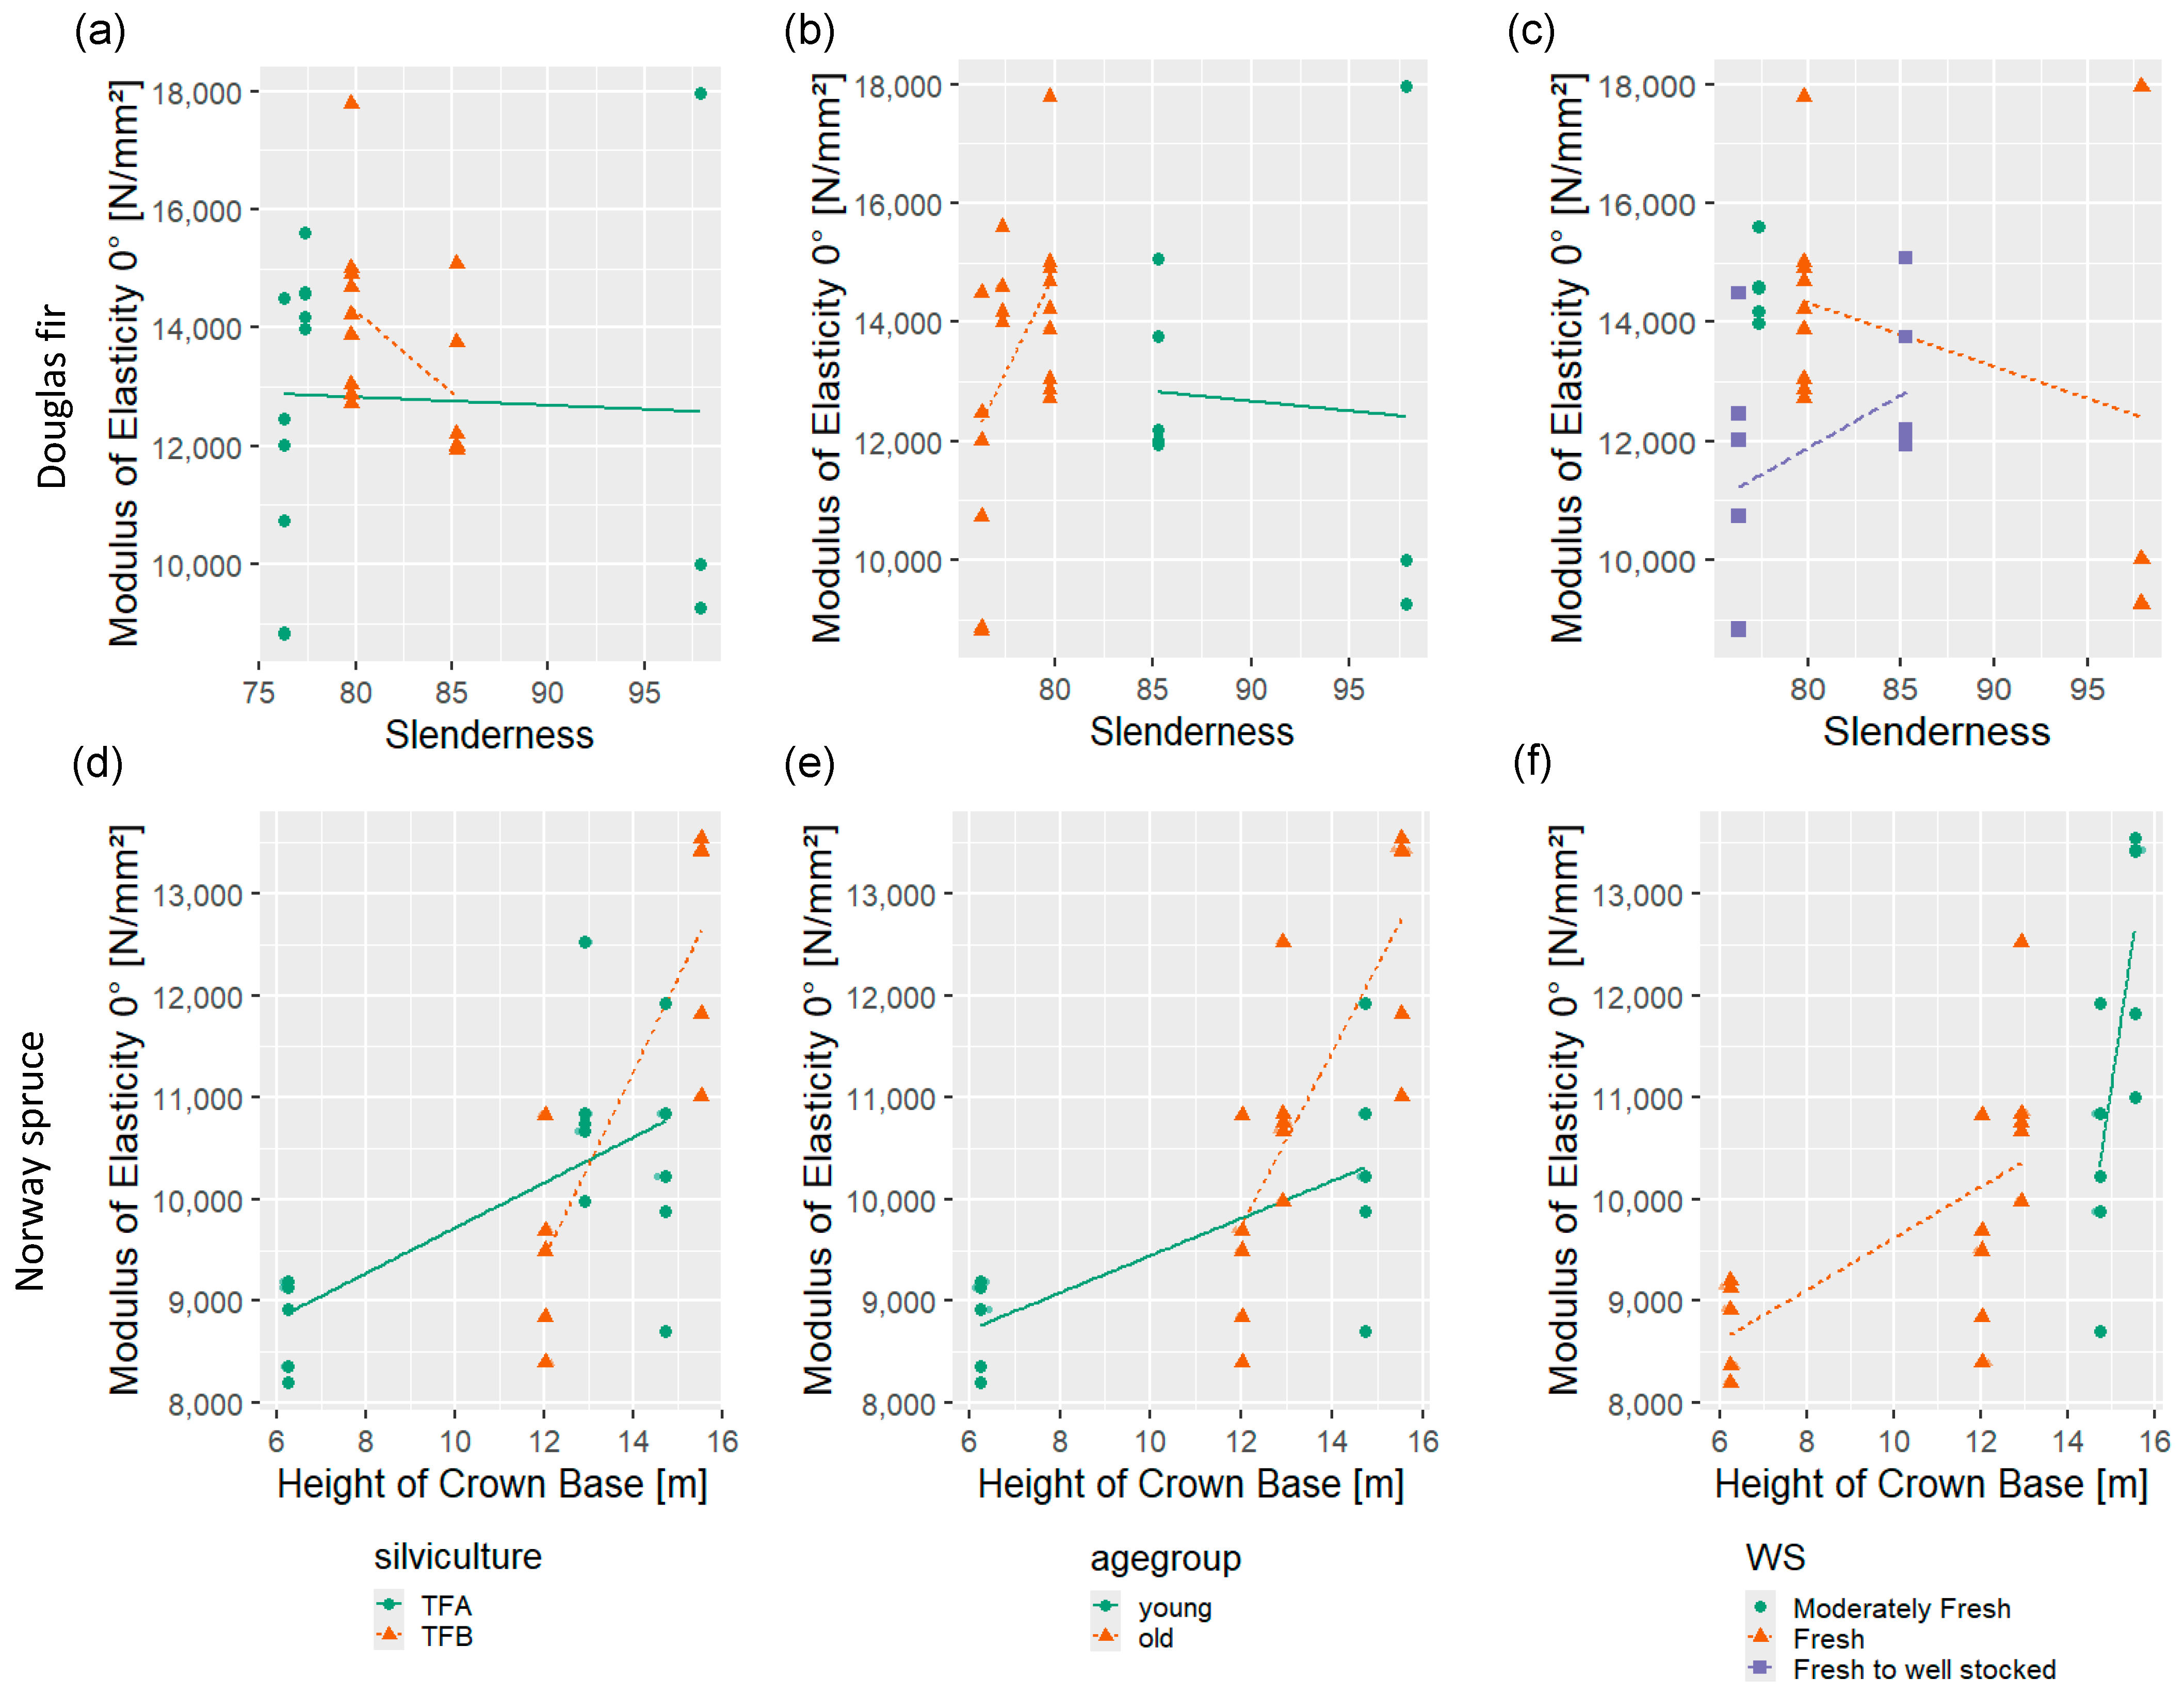
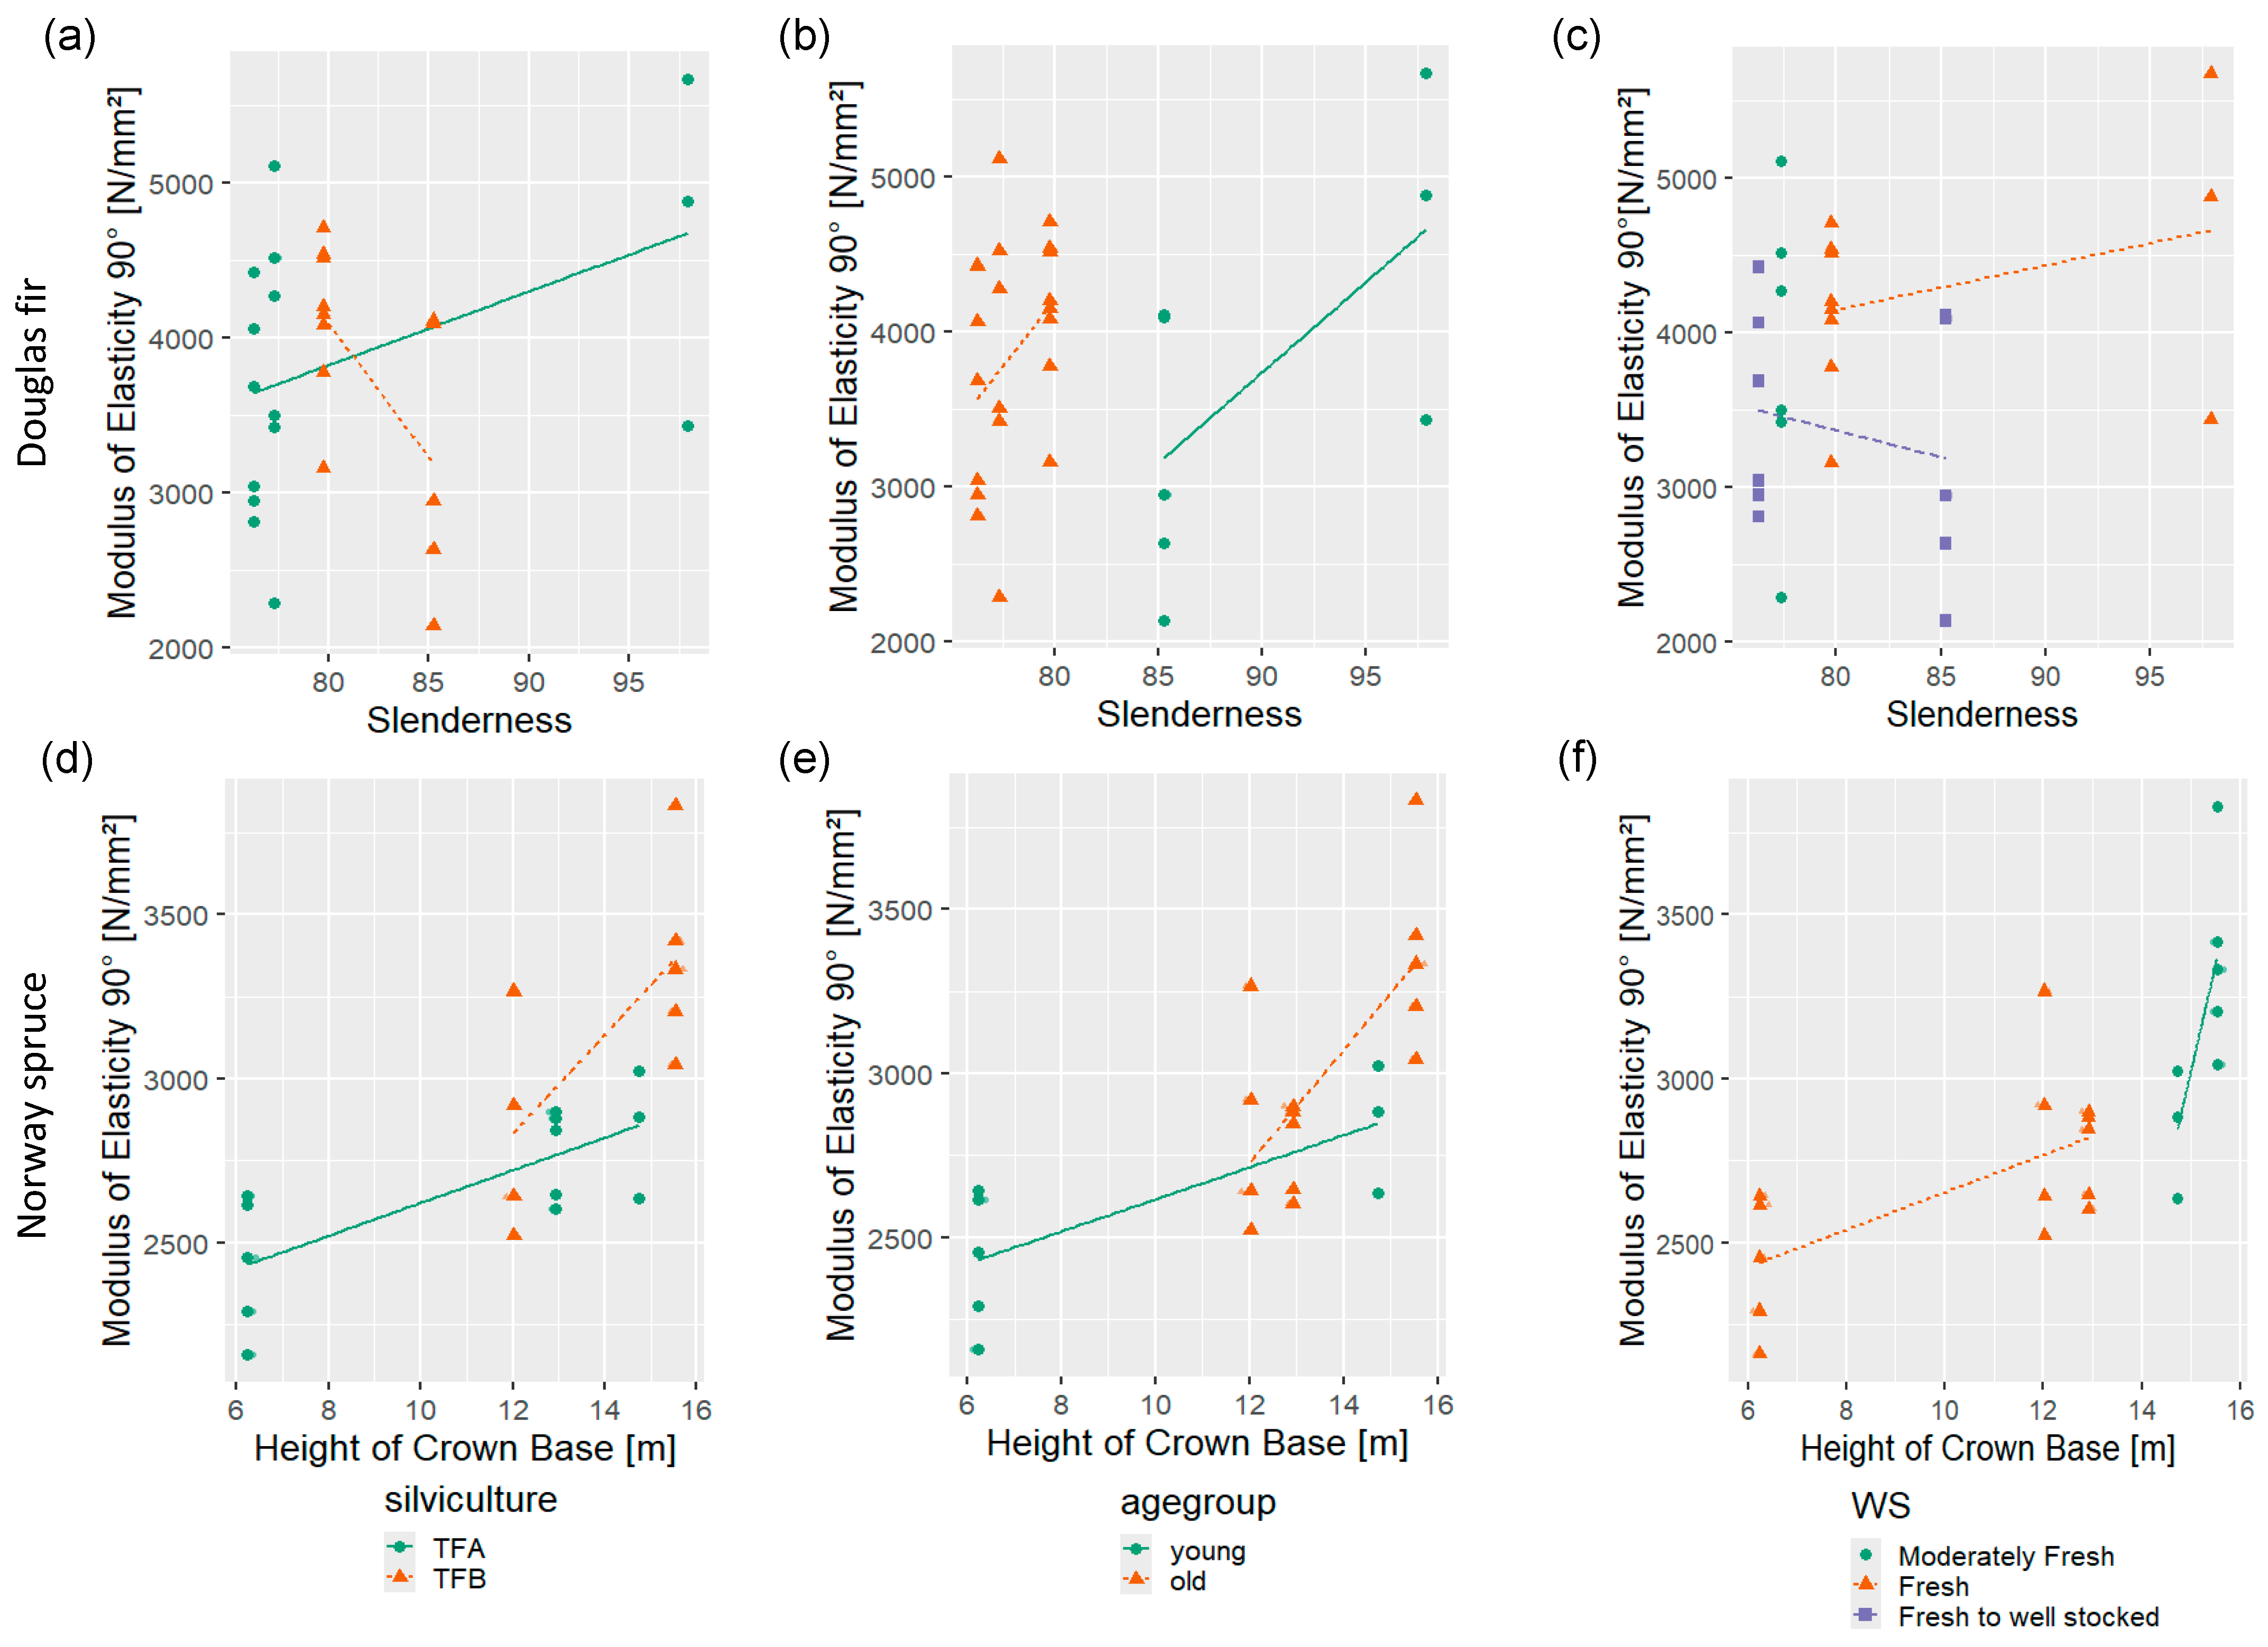
The prediction of LVL and plywood properties, based on the tree characteristics within a stand, was possible for the examined PCAB stands. The CODs between 0.50 and 0.59, with slenderness and CB as independent variables for tensile and bending properties of LVL, indicate promising accuracy. The model selection process of plywood made it necessary to include a factor of the higher-level data. For PCAB, the thinning type performed best in model comparisons and showed, in contrast to the effect in combination with age and WS, that TFB tends to result in higher mechanical board properties. The high CODs for PCAB plywood properties could have been caused by the higher grade of isotropy within boards and a lower variance compared to LVL. The high CODs for crown parameters arguably could be facilitated by the use of stand means, with values for crown factors taking on categorical properties; this was, however, controlled for with tests for variation inflation of included factors resulting in the concise models as presented. The number of logs would not be appropriate for linear mixed models, and verifications for the PSMN data did not increase model quality in an evaluation by tree.
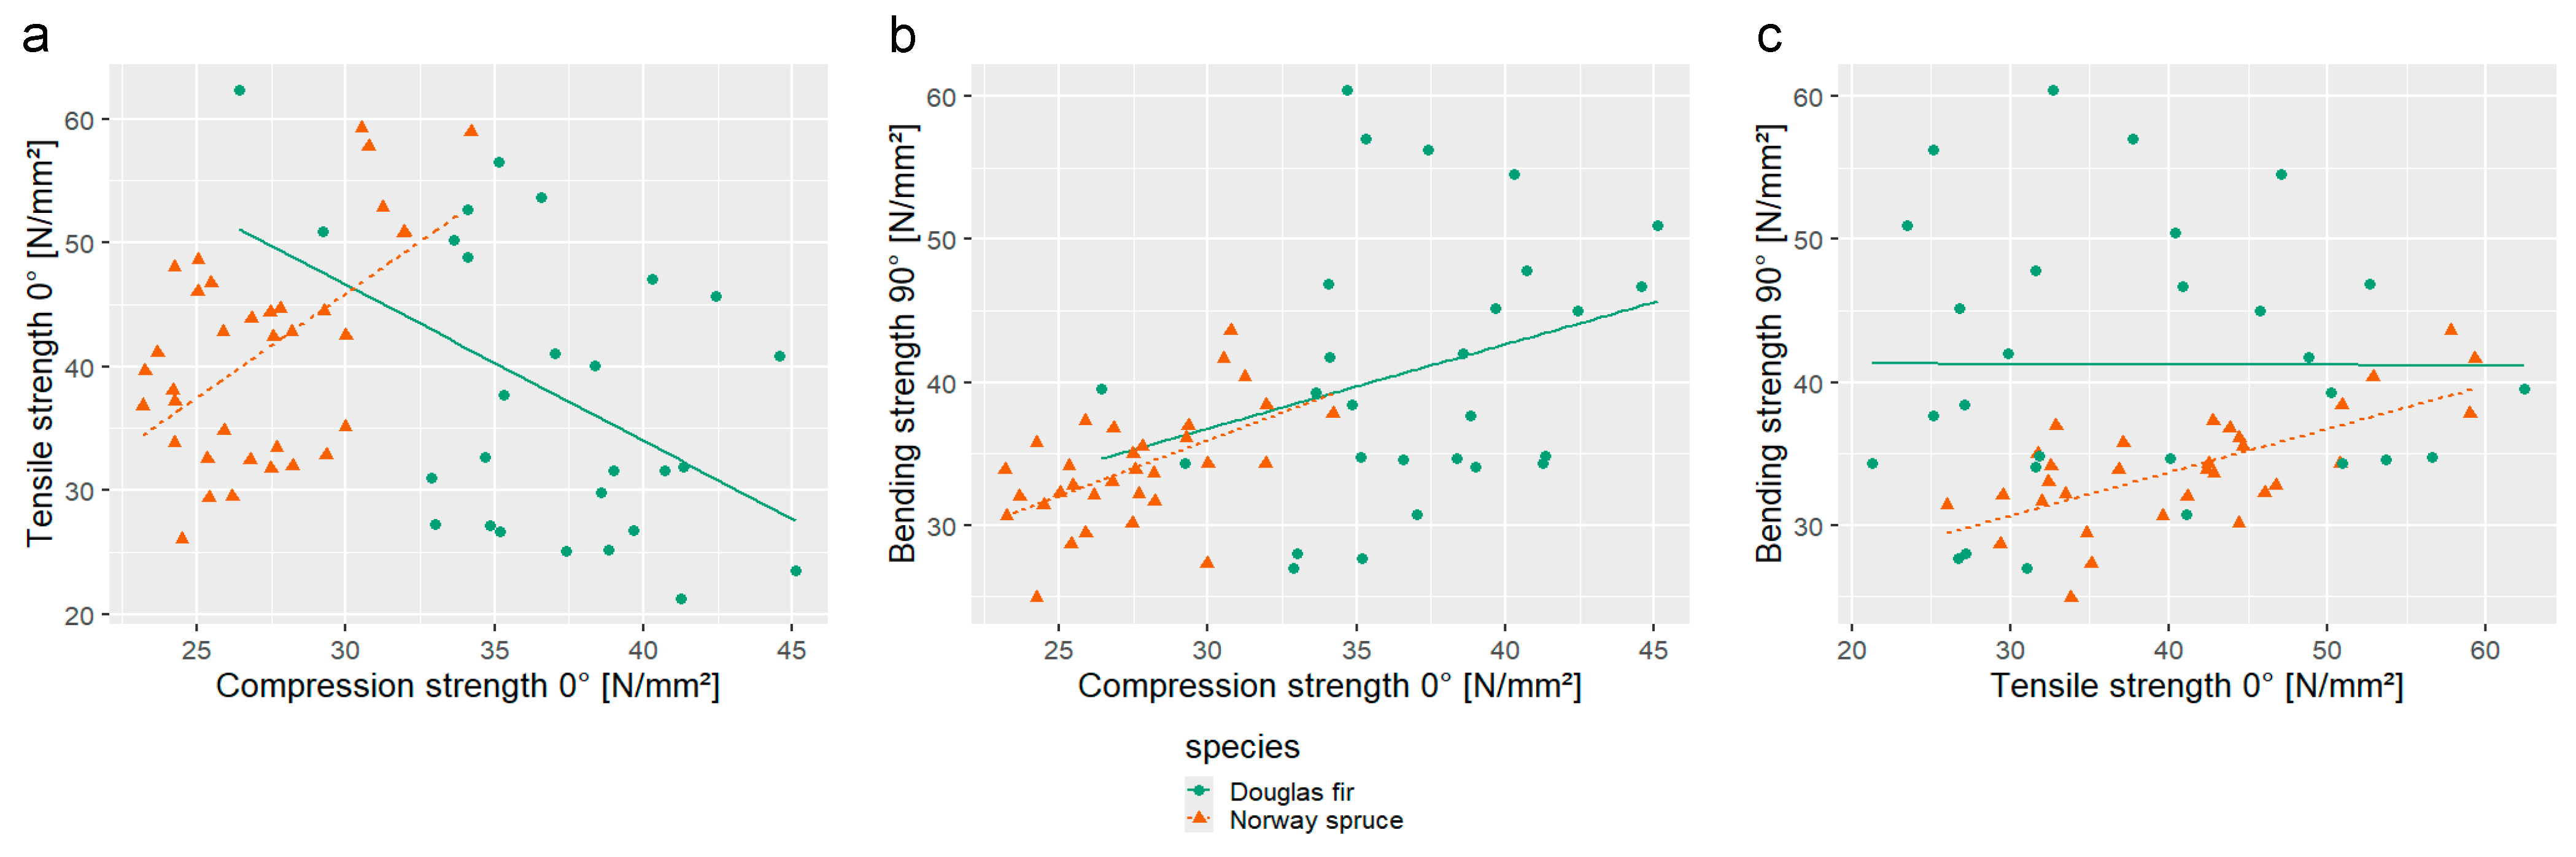
For PSMN, the high σ resulted in low model quality. Although the general performance of PSMN products was superior to that of PCAB in regard to compression strength and bending properties, the assignment of mechanically relevant effects to stand and tree characteristics was inconclusive. Significant model determination was only reached in a few instances. Where models reached significance or near-significance, with p-values below 0.1, water supply or age group were the determining factors but never simultaneous. The higher variance of PSMN and thus the model failure can be explained by the wood anatomy of PSMN. The variance difference between PSMN and PCAB is already caused on the board level. The significantly larger growth rings of PSMN resulted in larger sections of pure latewood and early wood within sheets. Even without discussing the variance distinction between core- and sapwood, when layered randomly, it is possible to achieve board sections of higher and lower mechanical properties. With a seven-layered setup, the homogenization might have been insufficient. Wider growth rings led to more pronounced extremes of density across boards, which in turn increased the within-board variance for all mechanical properties. An indication of this may be found in the lower correlation of bending strength and elasticity of PSMN. Higher latewood content, with a higher density, could still result in a more brittle specimen due to higher lignin content, i.e., a high module of elasticity but lower bending strength due to impaired tensile properties.
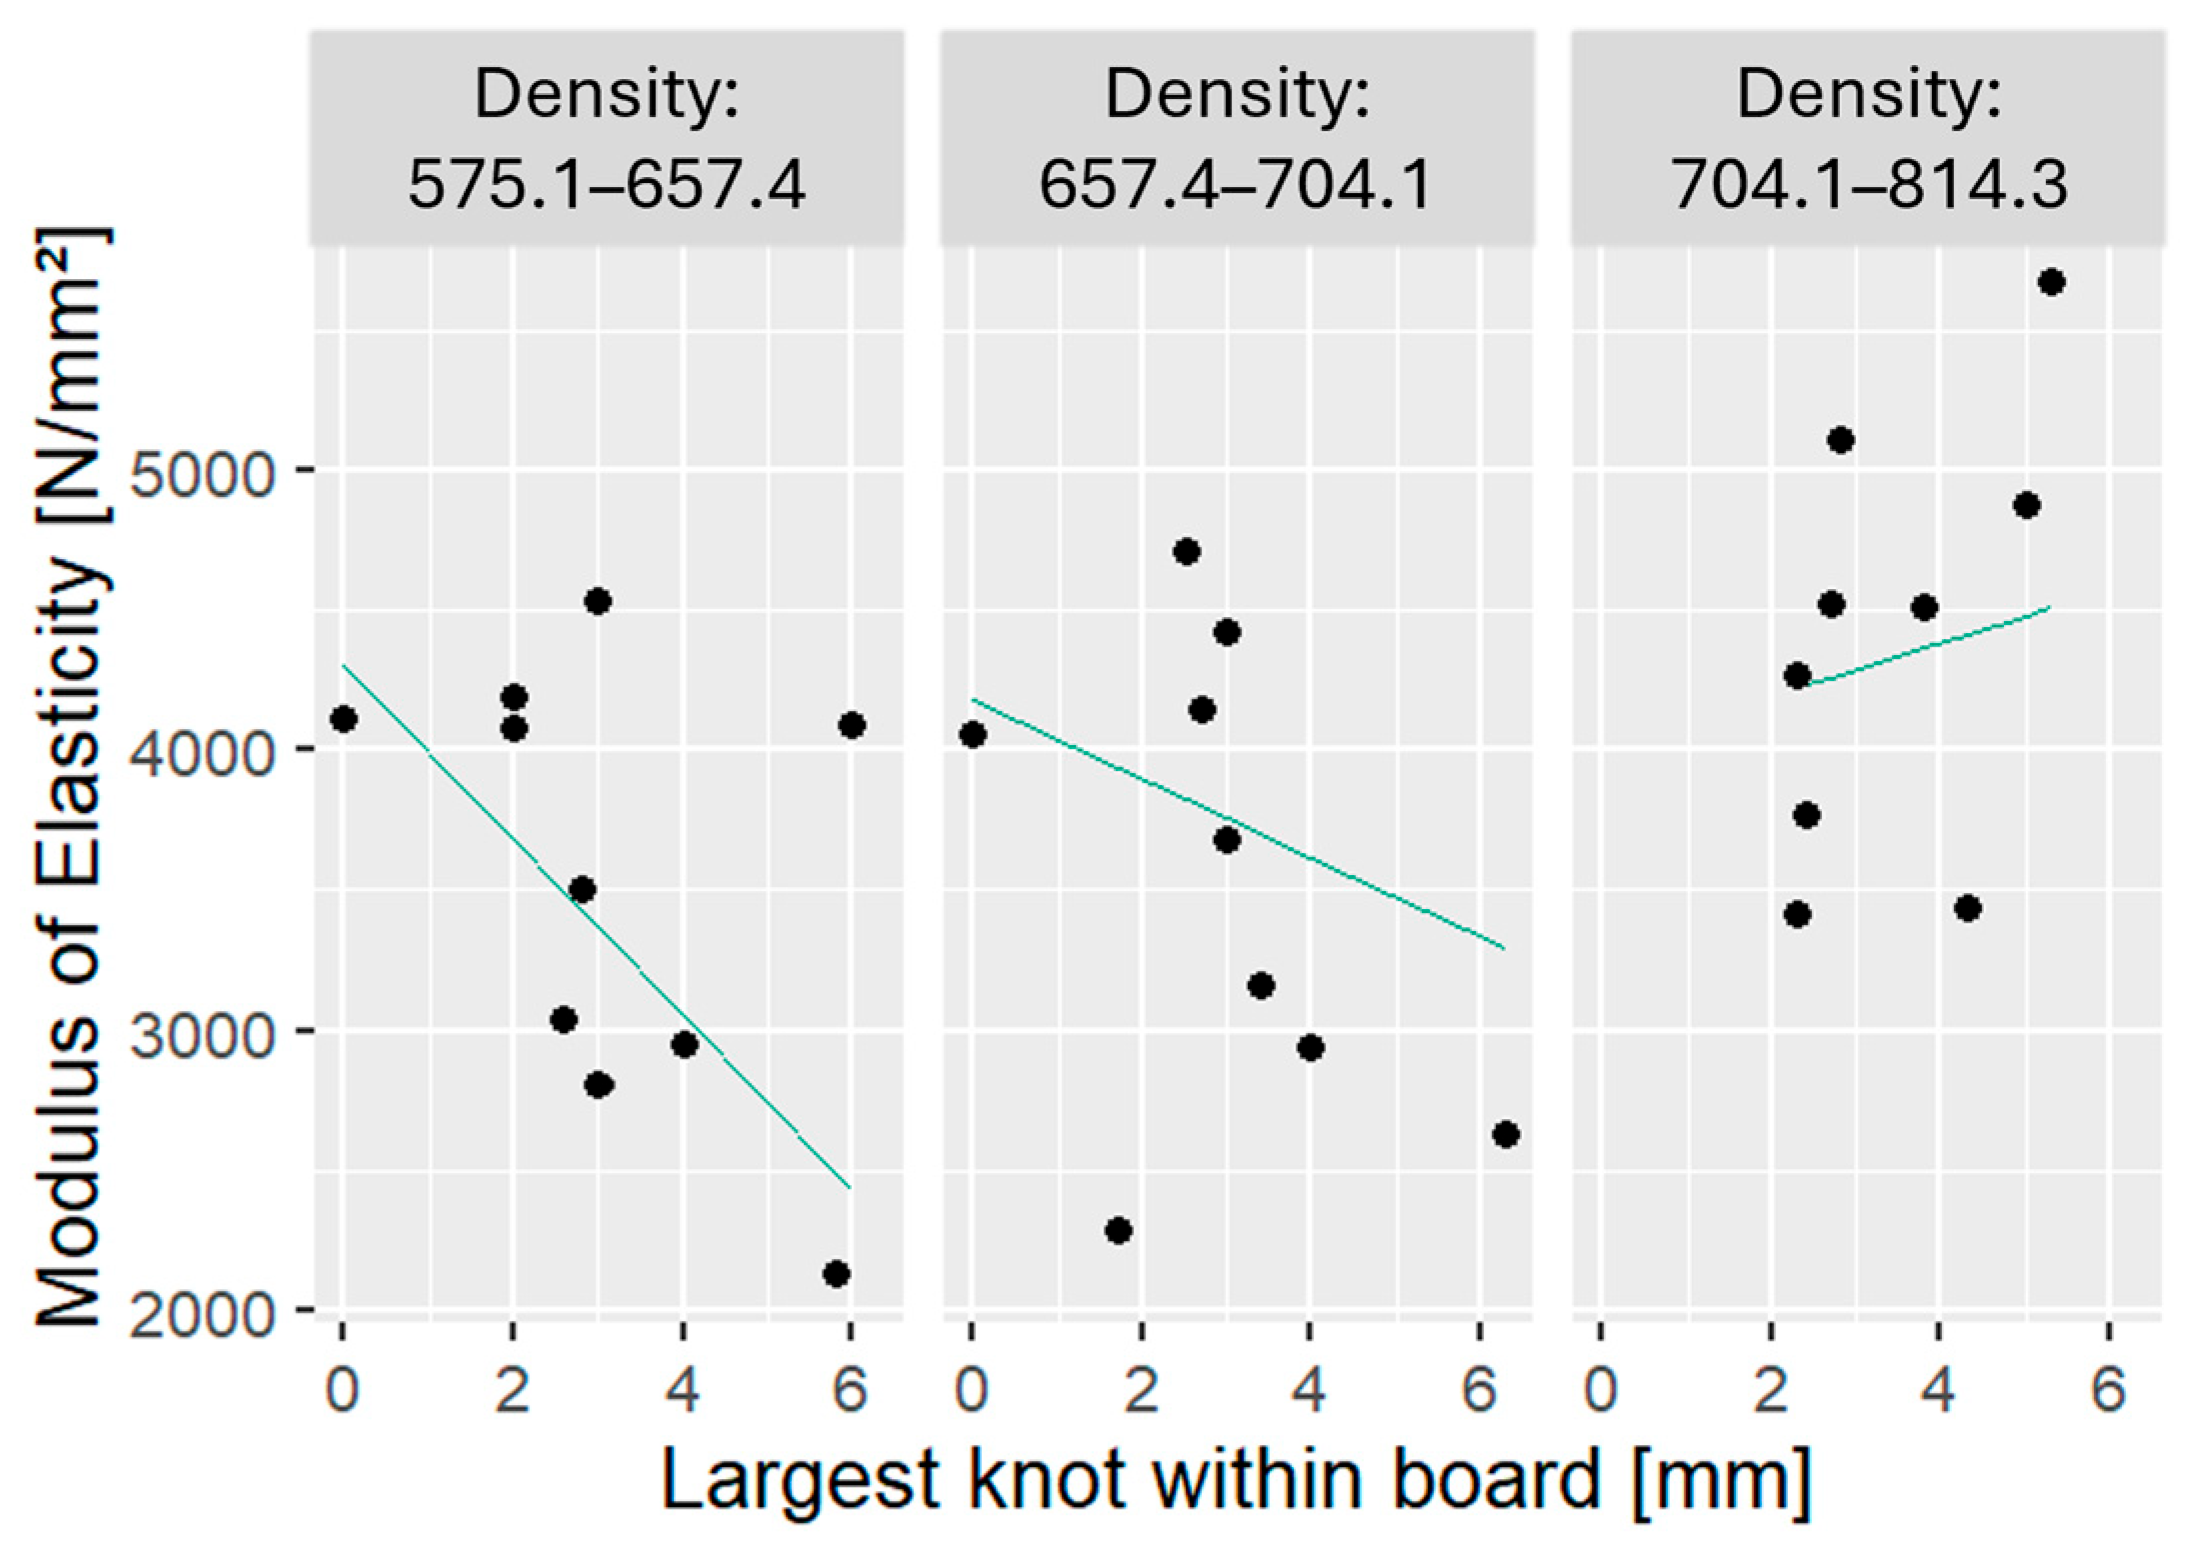
The examined sample size was appropriate to give indications on the predictability of veneer product quality, and an on-site pre-grading of PCAB seems promising. The model quality of PSMN board properties was insufficient. Considering the maximum knot sizes within boards and the density of boards as predictors, CODs of 0.44 are reached for bending stiffness (Em,0) of LVL and 0.41 (Em,90) for plywood. This should only be used as an approximation, as a plant-grading process would employ the sheet density for veneer grading, and we discovered disparities between board density, suggested wood density, and test performance in our data, as discussed previously.
Generalizing the results for softwood veneer products, higher rotation ages and lower water supply are noticeably beneficial for mechanical performance. The effect of the applied silvicultural thinning system only reached slight significance for LVL performance, with more evidence within PCAB than in PSMN boards. The significance was less pronounced for plywood boards, although for PCAB, the thinning system was a suitable second factor in combination with CB, while PSMN plywood showed no evidence for a significance of thinning type. The overall suggestion of the models in regard to species amounts to the suggestion that PCAB is more prone to the influence of active management measures, while PSMN seems less responsive. The reaction of different tree species to environmental changes is known to differ. The best example for PCAB and PSMN is a difference in resistance and resilience to drought. PCAB has lower resistance, while PSMN was observed to have lower resilience, expressed by a growth rate decline and the recovery of growth rate after drought years [41,42]. Similar behavior could be suspected for crown development and growth after thinning. Should PSMN, despite generally higher growth rates than spruce, show a slower rate of adaptation in regard to changes in available crown space and resulting potential additional growth, i.e., low plasticity of growth behavior, earliest stand development determines the growth characteristics, and the differences in specific intervention strategy, i.e., thinning type, are without effect. The research by Dušek and Novák [43] seems to imply such a connection for early and delayed thinnings of PSMN. The homogenization in processed wood products, like LVL and plywood, further obscure these causations.
Due to the scope, limited by the processability at the technical laboratory-scale level, and to keep the LVL comparable to plywood, the deductions of this work should be taken as indicators. However, they exemplify the potential for additional research on the non-destructive evaluation for PCAB and for a focus on the site quality and stand age for PSMN at a higher sample size to account for the high observed variance. Further research should be carried out on beam-sized samples of LVL for a better comparability of industry-scale specimens. A qualitative analysis of strength classes would be possible for plywood, while for LVL, there are no defined classifications, but strength classes of glue-laminated timber could pose an adequate substitute.

5. Conclusions

The prospect of predicting veneer board quality based on a non-destructive evaluation of site and tree characteristics is dependent on the species. The results for Norway spruce in this study are promising, while the higher within-stand and within-board variance of produced Douglas fir boards have shown the necessity for higher sample sizes to significantly define relations for all relevant mechanical properties. A trend within our analysis was the insignificance of the applied thinning type for the quality of laminated veneer lumber and plywood. The factors of rotation age and water supply superseded this strategy of silvicultural treatment. The mechanical properties increase significantly with tree age and with decreasing water supply. In regard to the qualitative yield, Norway spruce was generally surpassed by the mechanical performance of Douglas fir, excluding the tensile strength. In addition, the higher natural density of Douglas fir made it possible to produce significantly stronger boards in a fraction of the rotation time of spruce, as the examined age groups were not equivalent but representative at 30 years for Douglas fir and 40 years for Norway spruce, declared as young stands, and 45 years and above for Douglas fir and 80 years for Norway spruce being, labeled as older stands. A further focus on the longer rotation ages for Douglas fir and high diameters could result in a much higher quantitative yield in the LVL production process than could be achieved in the sawing of Douglas fir.

Author Contributions

Conceptualization, D.B., N.R. and T.K.; methodology, T.K. and D.B.; validation, T.K.; formal analysis, T.K.; investigation, T.K.; resources, D.B. and N.R.; data curation, T.K.; writing—original draft preparation, T.K.; writing—review and editing, D.B., N.R., C.M. and T.K.; visualization, T.K.; supervision, D.B. and C.M.; project administration, D.B.; funding acquisition, D.B. and N.R. All authors have read and agreed to the published version of the manuscript.

Funding

This research was funded by the Forest Climate Fund of the Fachagentur Nachwachsende Rohstoffe (FNR) under grant number 22WK314901 as commissioned by the German Federal Ministry of Agriculture, Food and Regional Identity (BMLEH) and the German Federal Ministry for the Environment, Climate Action, Nature Conservationand Nuclear Safety (BMUKN). The APC was funded by the Fraunhofer Society for the Advancement of Applied Sciences.

Data Availability Statement

The data from this research are available from the Open Science Framework (OSF) under DOI: 10.17605/OSF.IO/NBK5W.

Acknowledgments

The authors would like to thank the HOFOS Oldershausen GmbH, the Lower Saxony State Forestry, and the HessenForst State Forestry for their kind support with sample sites and material.

Conflicts of Interest

The authors declare no conflicts of interest. The funders had no role in the design of the study; in the collection, analyses, or interpretation of data; in the writing of the manuscript; or in the decision to publish the results.

Abbreviations

The following abbreviations are used in this manuscript:
CASCrown asymmetry
CBCrown base height
CODCoefficient of Determination
CVCoefficient of Variance
Em0Global Modulus of Elasticity of bending in the direction of the grain of the face veneer
Em90Global Modulus of Elasticity of bending perpendicular to the grain of the face veneer
fc0Modulus of Rupture of compression in the direction of the grain of the face veneer
fm0Modulus of Rupture of bending in the direction of the grain of the face veneer
fm90Modulus of Rupture of bending perpendicular to the grain of the face veneer
ft0Modulus of Rupture of tensile strength in the direction of the grain of the face veneer
MoEModulus of Elasticity
MoRModulus of Rupture
PCABPicea abies—Norway spruce
PSMNPseudotsuga menziesii—Douglas fir
ρDensity at 12% wood moisture
σStandard deviation
THTree Height
WSWater supply

Appendix A

Table A1. Stand characteristics of Norway spruce and Douglas fir as groundwork for the analysis of hierarchical factors.
Norway Spruce
Stand2345612
Age groupYoungOldOldOldYoungYoung
Water supplyModerately freshModerately freshFreshFreshFresh--
Thinning systemTFATFBTFATFBTFATFA
Mean height (m)25.329.833.828.220.5--
Mean diameter at breast height (cm)28.532.346.342.428.6--
Altitude (m)450–490430–520551–600501–550554–600--
Douglas Fir
Stand7891011
Age groupOldYoungOldYoungOld
Water supplyModerately freshFresh to well-stockedFresh to well-stockedFreshFresh
Thinning systemTFATFBTFATFATFB
Mean height (m)28.42732.726.738
Mean diameter at breast height (cm)36.531.444.830.752.4
Altitude (m)351–400401–450401–450360–390320–390
Table A2. Spearman correlation coefficients for the mechanical properties of laminated veneer lumber from Norway spruce and Douglas fir.
Norway Sprucefm,0Em,0fc,0ft,0Density
fm,01.000.910.650.690.28
Em,00.911.000.700.640.24
fc,00.650.701.000.450.19
ft,00.690.640.451.000.35
density0.280.240.190.351.00
Douglas Fir
fm,01.000.780.370.230.41
Em,00.781.000.530.290.33
fc,00.370.531.000.230.29
ft,00.230.290.231.000.04
density0.410.330.290.041.00
Table A3. Detailed overview of sample sizes per board and per stand and the mechanical properties and the distribution of results within stands and boards of Norway spruce LVL.
Norway Spruce LVL
Stand2345612
N boards5555510
N ft,0888886
ft0mean87.08101.4183.0376.5065.2472.03
ft0 σ stand15.2613.8117.2416.8414.9315.19
ft,0,mean σ boards14.0212.8613.3615.8214.3111.04
N fc,0666666
fc,0,mean44.4951.3048.0841.4843.1444.67
fc,0 σ stand6.136.924.103.304.453.75
fc,0 mean σ boards4.125.382.582.043.442.80
N fm,0666666
fm,0,mean82.0794.8284.0474.2171.6073.75
fm,0 σ stand12.2212.4511.457.7810.478.68
fm,0 mean σ boards10.3810.4410.555.589.527.75
N Em,0666666
Em,0,mean10,369.5412,640.7510,952.069450.158761.549318.42
Em,0 σ stand1334.581507.151224.271148.331069.361071.28
Em,0 mean σ boards822.211059.03936.46756.16996.89789.66
N ρ666666
ρmean586.59585.67528.86551.14513.10590.91
ρ σ stand33.4534.1220.2021.1628.4624.47
ρ mean σ boards31.4621.0319.4015.8220.1514.54
Table A4. Detailed overview of sample sizes per board and per stand, the mechanical properties and the distribution of results within stands and boards of Douglas fir LVL.
Douglas Fir LVL
Stand7891011
N boards66639
N ft,055555
ft,0,mean86.7375.5384.1967.0896.26
ft,0 σ stand22.2722.1826.0519.1824.79
ft,0 mean σ board19.6416.3519.9719.1117.78
N fc,066666
fc,0,mean56.0754.2652.3158.1456.76
fc,0 σ stand9.386.888.6913.147.42
fc,0 mean, σ board6.135.947.788.876.31
N fm,033333
fm,0,mean105.8787.9082.1696.6499.73
fm,0 σ stand19.1319.6422.1527.1412.60
fm,0 mean σ boards17.9618.9416.5112.288.38
N Em,033333
Em,0,mean14,586.7912,871.6810,987.4112,409.8514,287.94
Em,0 σ stand1719.811958.522860.524243.551810.80
Em,0 mean σ boards1783.531794.211815.78825.971030.31
N fm,9033333
fm,90,mean7.556.915.778.326.46
fm,90 σ stand1.921.912.441.271.01
fm,90 mean σ board1.380.910.900.990.71
N Em,9033333
Em,90 mean873.59823.32664.48893.81785.46
Em,90 σ stand182.69134.54171.82180.25122.01
Em,90 mean σ board82.4695.5253.2686.3040.81
N ρ66666
ρmean713.20686.92641.69733.69679.14
ρ σ stand54.0775.0339.5563.2727.18
ρ mean σ boards35.1540.4932.3931.9020.85
Table A5. Spearman correlation coefficients for the mechanical properties of plywood from Norway spruce and Douglas fir.
Norway Sprucefm,90Em,g,90fc,0ft,0Density
fm,901.000.740.450.610.34
Em,900.741.000.280.420.53
fc,00.560.281.000.510.02
ft,00.610.420.511.000.08
density0.340.530.020.081.00
Douglas Fir
fm,901.000.890.300.030.50
Em,900.891.000.35−0.120.48
fc,00.300.351.00−0.410.30
ft,00.03−0.12−0.411.00−0.06
density0.500.480.30−0.061.00
Table A6. Overview of the mechanical properties of Norway spruce plywood with sample sizes, mean values, and the standard deviation of board means within a stand and the mean deviation of specimen within boards.
Norway Spruce Plywood
Stand2345612
N boards5555510
N ft,0666666
ft,0,mean41.9757.1644.7641.3435.0234.01
ft,0 σ stand10.2210.097.927.8810.647.46
ft,0 mean σ boards9.319.857.027.398.635.73
N fc,0666666
fc,0,mean24.3531.6329.4424.6227.0626.67
fc,0 σ stand2.162.042.142.162.832.41
fc,0 mean σ boards2.071.811.601.771.962.10
N fm,90666666
fm,90,mean32.8640.0134.5633.8128.2933.51
fm,90 σ stand5.954.592.443.024.045.36
fm,90 mean σ boards5.254.122.292.533.284.99
N Em,90666666
Em,90,mean3220.723733.453128.113207.482746.753241.17
Em,90 σ stand391.93390.43285.38367.44344.20445.63
Em,90 mean σ boards345.97283.26242.89182.59300.19351.38
N ρ6666612
ρmean572.18579.65530.26552.21540.19574.95
ρ σ stand22.0726.7621.6116.6233.2822.08
ρ mean σ boards18.9618.5916.9912.0526.6019.80
Table A7. Overview of the mechanical properties of Douglas fir plywood with sample sizes, mean values and the standard deviation of board means within a stand and the mean deviation of specimen within boards.
Douglas Fir Plywood
Stand7891011
N boards66639
N ft,055555
ft,0,mean35.8736.8836.5825.9142.01
ft,0 σ stand16.6916.4116.096.7916.32
ft,0 mean σ boards12.8011.8213.344.2110.82
N fc,044444
fc,0,mean40.3034.4935.0938.4136.30
fc,0 σ stand5.705.475.845.196.03
fc,0 mean σ boards4.495.824.304.253.98
N fm,033343
fm,0,mean64.0157.4759.8972.3264.96
fm,0 σ stand15.5515.3226.0124.3512.31
fm,0 mean σ boards10.4210.6914.9813.327.73
N Em,033343
Em,0,mean9515.877720.448100.509493.629216.13
Em,0 σ stand1421.422170.212584.963367.521530.08
Em,0 mean σ boards967.151080.321417.801321.30864.71
N fm,9033343
fm,90,mean41.4334.6539.8747.4543.11
fm,90 σ stand10.278.9311.9214.659.19
fm,90 mean σ boards8.866.266.028.586.29
N Em,9033343
Em,90,mean4460.443588.733931.224968.004640.50
Em,90 σ stand1058.33968.73997.551293.80656.99
Em,90 mean σ boards621.64369.40761.39675.68415.48
N ρ1210121212
ρmean716.54666.55648.38767.95675.05
ρ σ stand66.5990.3552.9449.8338.57
ρ mean σ boards41.8462.3036.5133.8924.37
Table A8. Visual veneer characteristics and quality classes according to DIN EN 635-3 [29] with the mean diameter of sound knots and knot holes of knots above 5 mm.
Norway Spruce
Stand2345612
Knot size mean [mm]26.521.332.729.429.136.4
Knot size σ stand [mm]10.87.11615.68.310.7
Achieved grade classesII, III, IVII, III, IVIII, IVIII, IVII, III, IVII, III, IV
Douglas Fir
Stand7891011
Knot size mean [mm]24.828.831.528.829.4
Knot size σ [mm]139.714.87.815.1
Achieved grade classesII, III, IVIII, IVII, III, IVIII, IVII, III, IV

References

  1. Kallakas, H.; Rohumaa, A.; Vahermets, H.; Kers, J. Effect of Different Hardwood Species and Lay-Up Schemes on the Mechanical Properties of Plywood. Forests 2020, 11, 649. [Google Scholar] [CrossRef]
  2. McGavin, R.L.; Nguyen, H.N.; Gilbert, B.P.; Dakin, T.; Faircloth, A. A comparative study on the mechanical properties of laminated veneer lumber (LVL) produced from blending various wood veneers. Bioresources 2019, 14, 9064–9081. [Google Scholar] [CrossRef]
  3. Arabi, M.; Hazrati, M.; Rostampour-Haftkhani, A. Performance of Laminated Veneer Lumber Panels from Fast-Growing Species with Different Layering Arrangements. Bioresources 2024, 19, 2546–2561. [Google Scholar] [CrossRef]
  4. Huang, Y.; Hu, J.; Peng, H.; Chen, J.; Wang, Y.; Zhu, R.; Yu, W.; Zhang, Y. A new type of engineered wood product: Cross-laminated-thick veneers. Case Stud. Const. Mat. 2024, 20, e02753. [Google Scholar] [CrossRef]
  5. Daoui, A.; Descamps, C.; Marchal, R.; Zerizer, A. Influence of veneer quality on Beech LVL mechanical properties. Maderas. Cienc. Tecnol. 2011, 13, 69–83. [Google Scholar] [CrossRef]
  6. Duriot, R.; Pot, G.; Girardon, S.; Denaud, L. New Perspectives for LVL Manufacturing from Wood of Heterogeneous Quality—Part 2: Modeling and Manufacturing of Variable Stiffness Beams. Forests 2021, 12, 1275. [Google Scholar] [CrossRef]
  7. McGavin, R.L.; Leggate, W. Comparison of Processing Methods for Small-diameter Logs: Sawing versus Rotary Peeling. Bioresources 2019, 14, 1545–1563. [Google Scholar] [CrossRef]
  8. Purba, C.Y.C.; Pot, G.; Viguier, J.; Ruelle, J.; Denaud, L. The influence of veneer thickness and knot proportion on the mechanical properties of laminated veneer lumber (LVL) made from secondary quality hardwood. Eur. J. Wood Wood Prod. 2019, 77, 393–404. [Google Scholar] [CrossRef]
  9. Frayssinhes, R.; Girardon, S.; Denaud, L.; Collet, R. Modeling the Influence of Knots on Douglas-Fir Veneer Fiber Orientation. Fibers 2020, 8, 54. [Google Scholar] [CrossRef]
  10. Hecker, M.; Becker, G. The influence of silvicultural management on surface roughness of Douglas-fir veneers. Forstw. Cbl. 1997, 116, 45–52. [Google Scholar] [CrossRef]
  11. Stefanowski, S.; Frayssinhes, R.; Pinkowski, G.; Denaud, L. Study on the in-process measurements of the surface roughness of Douglas fir green veneers with the use of laser profilometer. Eur. J. Wood Wood Prod. 2020, 78, 555–564. [Google Scholar] [CrossRef]
  12. Dupleix, A.; Denaud, L.E.; Bleron, L.; Marchal, R.; Hughes, M. The effect of log heating temperature on the peeling process and veneer quality: Beech, birch and spruce case studies. Eur. J. Wood Prod. 2013, 71, 163–171. [Google Scholar] [CrossRef]
  13. Li, W.; Zhang, Z.; Zhou, G.; Kibleur, P.; Mei, C.; Shi, J.; Van Acker, J.; Van Den Bulcke, J. The effect of structural changes on the compressive strength of LVL. Wood Sci. Tech. 2020, 54, 1253–1267. [Google Scholar] [CrossRef]
  14. Pot, G.; Denaud, L.E.; Collet, R. Numerical study of the influence of veneer lathe checks on the elastic mechanical properties of laminated veneer lumber (LVL) made of beech. Holzforschung 2014, 69, 337–345. [Google Scholar] [CrossRef]
  15. Romero, A.; Odenbreit, C. Experimental Investigation on Strength and Stiffness Properties of Laminated Veneer Lumber (LVL). Materials 2023, 16, 7194. [Google Scholar] [CrossRef] [PubMed]
  16. Gilbert, B.P.; Davies, T.E.; McGavin, R.L.; Dowse, C.J. Towards reducing the capital cost of manufacturing Laminated Veneer Lumbers: Investigating finger jointing solutions. Const. Build. Mat. 2024, 411, 134158. [Google Scholar] [CrossRef]
  17. Schönfelder, O.; Zeidler, A.; Borůvka, V.; Bílek, L. Influence of site conditions and silvicultural practice on the wood density of Scots pine (Pinus sylvestris L.)—A case study from the Doksy locality, Czech Republic. J. For. Sci. 2017, 63, 457–462. [Google Scholar] [CrossRef]
  18. Kask, R.; Pikk, J.; Kangur, A. Effect of growth conditions on wood properties of Scots pine (Pinus sylvestris L.). For. Stud. 2021, 75, 176–187. [Google Scholar] [CrossRef]
  19. Shupe, T.F.; Hse, C.Y.; Grozdits, G.A.; Choong, E.T. Effects of silvicultural practice and veneer layup on some mechanical properties of Loblolly pine plywood. For. Prod. J. 1997, 47, 101–106. [Google Scholar]
  20. Huang, S.; Wang, J.B.; Lu, J.; Dai, C.; Lei, Y.; Sun, X. Charaterizing Changbai Larch Through Veneering. Part 1: Effect of Stand Density. Bioresources 2012, 7, 2444–2460. [Google Scholar]
  21. Biblis, E.J. Comparison of flexural and shear properties of southern pine LVL and lumber from young plantation and natural stands. Ann. Sci. For. 1996, 53, 1167–1175. [Google Scholar] [CrossRef]
  22. Duriot, R.; Rescalvo, F.J.; Pot, G.; Denaud, L.; Girardon, S.; Frayssinhes, R. An insight into mechanical properites of heartwood and sapwood of large French Douglas-fir LVL. Constr. Build. Mater. 2021, 299, 123859. [Google Scholar] [CrossRef]
  23. Viguier, J.; Marcon, B.; Girardon, S.; Denaud, L. Effect of Forestry Management and Veneer Defects Identified by X-ray Analysis on Mechanical Properties of Laminated Veneer Lumber Beams Made of Beech. Bioresources 2017, 12, 6122–6133. [Google Scholar] [CrossRef]
  24. Lowell, E.C.; Todoroki, C.L.; Dykstra, D.P.; Briggs, D.G. Linking acoustic velocity of standing Douglas-fir trees to veneer stiffness: A tree-log-product study across thinning treatments. N. Z. J. For. Sci. 2014, 44, 1. [Google Scholar] [CrossRef]
  25. Schimleck, L.; Dahlen, J.; Apiolaza, L.A.; Downes, G.; Emms, G.; Evans, R.; Moore, J.; Pâques, L.; Van den Bulcke, J.; Wang, X. Non-Destructive Evaluation Techniques and what they tell us about Wood Property Variation. Forests 2019, 10, 728. [Google Scholar] [CrossRef]
  26. Höwler, K.; Seidel, D.; Krenn, T.; Berthold, D.; Ehbrecht, M.; Müller, J.; Kietz, B. Evaluation of Softwood Timber Quality—A Case Study on Two Silvicultural Systems in Central Germany. Forests 2022, 13, 1910. [Google Scholar] [CrossRef]
  27. Krenn, T.; Bertold, D.; Ritter, N.; Kietz, B. Effects of Growth and Treatment Conditions on the Quality of Norway Spruce (Picea abies L.) Sawn Timber. Forests 2024, 15, 1588. [Google Scholar] [CrossRef]
  28. Krenn, T.; Berthold, D.; Ritter, N.; Mai, C. Links between the quality of Douglas fir sawn timber and selected tree and site characteristics in Germany. Wood Mat. Sci. Eng. 2025, 1–13. [Google Scholar] [CrossRef]
  29. DIN EN 635-3; Plywood—Classification by Surface Appearance—Part 3: Softwood. DIN Media GmbH: Berlin, Germany, 1995.
  30. DIN EN 310; Wood-Based Panels; Determination of Modulus of Elasticity in Bending and of Bending Strength. DIN Media GmbH: Berlin, Germany, 1993.
  31. DIN EN ISO 527-2; Plastics—Determination of Tensile Properties—Part 2: Test Conditions for Moulding and Extrusion Plastics. DIN Media GmbH: Berlin, Germany, 2012.
  32. DIN prEN 14374; Timber Structures—Laminated Veneer Lumber (LVL)—Requirements. DIN Media GmbH: Berlin, Germany, 2016.
  33. Fox, J.; Weisberg, S. An R Companion to Applied Regression, 3rd ed.; Sage: Thousand Oaks, CA, USA, 2019; Available online: https://www.john-fox.ca/Companion/ (accessed on 16 June 2025).
  34. Fife, D.A. Flexplot: Graphically-based data analysis. Psychol. Methods 2022, 27, 477–496. [Google Scholar] [CrossRef]
  35. Wickham, H.; François, R.; Henry, L.; Müller, K.; Vaughan, D. dplyr: A Grammar of Data Manipulation. Version 1.1.4. R package. 2023. Available online: https://dplyr.tidyverse.org (accessed on 16 June 2025).
  36. Kassambara, A. rstatix: Pipe-Friendly Framework for Basic Statistical Tests. Version 0.7.2. R package. 2023. Available online: https://rpkgs.datanovia.com/rstatix/ (accessed on 16 June 2025).
  37. Hothorn, H.; Bretz, F.; Westfall, P.; Heiberger, R.M.; Schuetzenmeister, A.; Scheibe, S. multcomp: Simultaneous Inference in General Parametric Models; Version 1.4-28; CRC Press: Boca Raton, FL, USA, 2025. [Google Scholar] [CrossRef]
  38. Aho, K. asbio: A Collection of Statistical Tools for Biologists; Version 1.11; CRC Press: Boca Raton, FL, USA, 2025. [Google Scholar] [CrossRef]
  39. Menard, S. Applied Logistic Regression Analysis; Sage Publications: Thousand Oaks, CA, USA, 2001. [Google Scholar]
  40. James, G.; Witten, D.; Hastie, T.; Tibshirani, R. An Introduction to Statistical Learning: With Applications in R, 2nd ed.; Springer: New York, NY, USA, 2021. [Google Scholar] [CrossRef]
  41. Rais, A.; van de Kuilen, J.W.G.; Pretzsch, H. Growth reaction patterns of tree height, diameter, and volume of Douglas-fir (Pseudotsuga menziesii [Mirb.] Franco) under acute drought stress in Southern Germany. Eur. J. For. Res. 2014, 133, 1043–1056. [Google Scholar] [CrossRef]
  42. Kietz, B.; Müller, M.; Höwler, K.; Kroneberger, C.; Berthold, D.; Krenn, T.; Schreiber, K.; Seidel, D.; Ehbrecht, M.; Bebre, I. 2024 Project Report: Optimization of Material Paths for Softwoods from Different Silvicultural Systems by Testing the Strength Properties of Semi-Finished Products and Materials. Available online: https://www.waldklimafonds.de/index.php?id=13913&fkz=22WK314901 (accessed on 10 May 2025).
  43. Dušek, D.; Novák, J. Growth response of Douglas fir to the first early and delayed thinning. Cent. Eur. For. J. 2025, 71, 53–64. [Google Scholar] [CrossRef]
Figure 1. Rotary peeling machine setup for softwood veneers. Spindles for log fixation are positioned at the geometric center for optimized yield.
Forests 16 01040 g001
Figure 2. LVL specimen design for tensile (8 pcs), compressive (10 axial and 10 orthogonal pcs) and flexural strength tests (6 pcs.; longitudinal axis) and density samples (6 pcs).
Forests 16 01040 g002
Figure 3. Correlations of (a) tensile strength and compression strength, (b) bending strength and compression strength, and (c) bending strength and tensile strength of Norway spruce and Douglas fir LVL.
Forests 16 01040 g003
Figure 4. The mean board densities of (a) Norway spruce stands, (b) Douglas fir stands and (c) the knots within LVL boards of Douglas fir with stands ordered by median.
Forests 16 01040 g004
Figure 5. Correlations of (a) tensile strength and compression strength, (b) bending strength and compression strength and (c) bending strength and tensile strength of Norway spruce and Douglas fir plywood.
Forests 16 01040 g005
Figure 6. The mean board densities of (a) Norway spruce stands and (b) Douglas fir stands and (c) the knottiness of plywood boards of Douglas with stands ordered by median.
Forests 16 01040 g006
Figure 7. The Modulus of Elasticity of bending in the direction of the grain depending on the slenderness (ac) and crown base height (df) a with visualization of the silviculture (a,d), age group (b,e) and site water supply (c,f) of LVL boards.
Forests 16 01040 g007
Figure 8. The Modulus of Elasticity of bending in the direction of the grain depending on the slenderness (ac) and crown base height (df) with visualization of silviculture (a,d), age group (b,e), and site water supply (c,f) of plywood boards.
Forests 16 01040 g008
Figure 9. The dependence of Douglas fir plywood bending stiffness within different ranges of board density as resulting from a linear model incorporating the interaction of knot sizes and density.
Forests 16 01040 g009
Table 1. Linear models for different mechanical properties of laminated veneer lumber from (a) Norway spruce and (b) Douglas fir.
(a)Norway Spruce
Estimators Adjusted R2Model p-Value
fm0Thinning .Age group **Water supply ***intercept ***
−7.310.6−11.084.30.560.000***
CBHDR * intercept *
1.00.4 32.50.510.000***
Em0Thinning .Age group ***Water supply ***intercept ***
−1092.41838.5−1677.010,291.60.600.000***
CBHDR intercept
188.060.7 3083.00.500.000***
ft0ThinningAge group **Water supply ***intercept ***
−5.813.1−16.585.40.660.000***
CB **HDR intercept
2.50.3 24.90.590.000***
fc0Thinning .Age group **Water supply **intercept ***
−4.55.0−3.947.30.290.020*
CBHDR * intercept ***
0.00.3 22.90.310.010*
(b)Douglas Fir
Estimators Adjusted R2Model p-Value
fm0Thinning Age group Water supply *intercept ***
3.9−0.5−15.995.40.160.075.
CBHDR intercept *
0.7−0.1 89.50.000.510
Em0Thinning .Age group Water supply **intercept ***
1765.3121.0−2374.612,713.20.220.040*
CBHDR intercept
146.0−33.3 13,895.10.040.219
ft0ThinningAge group **Water supply intercept ***
10.913.1−2.575.70.180.060.
CB *HDR * intercept ***
1.4−1.1 151.00.230.010*
fc0Thinning Age group Water supplyintercept ***
0.3−1.2−2.755.80.000.590
CBHDR intercept **
0.20.1 40.60.000.439
p-value significance notation: 0 ‘***’ 0.001 ‘**’ 0.01 ‘*’ 0.05 ‘.’ 0.1 ‘ ’ 1.
Table 2. Linear models for different mechanical properties of plywood from (a) Norway spruce and (b) Douglas fir.
(a)Norway Spruce
Estimators Adjusted R2Model p-Value
fm90ThinningAge group ***Water supply ***intercept ***
−0.44.7−3.934.20.770.000***
CB ***Thinning * intercept ***
0.82.8 22.80.670.000***
Em90Thinning Age group ***Water supply ***intercept ***
90.27258.54−337.72830.820.630.000***
CB **Thinning * intercept ***
63.7266.3 1973.70.570.000***
ft0ThinningAge group ***Water supply ***intercept ***
−0.38.2−6.944.20.670.000***
CB **Thinning * intercept ***
1.45.7 25.30.540.000***
fc0Thinning Age group **Water supply intercept ***
−2.33.4−1.528.10.220.042*
CBThinning intercept ***
0.20.9 25.20.000.512
(b)Douglas Fir
Estimators Adjusted R2Model p-Value
fm90ThinningAge group Water supply *intercept ***
−6.2−0.7−0.843.90.080.215
HDR *Age group * intercept
1.210.9 −59.80.150.050.
Em90Thinning Age group Water supply *intercept ***
−415.9−73.9−252.54018.80.150.100.
HDR **Age group * intercept
123.91137.9 −6606.60.210.020*
ft0ThinningAge group Water supply intercept ***
6.07.02.632.80.020.352
HDRAge group intercept
−0.60.3 84.10.050.213
fc0Thinning Age group Water supply *intercept ***
−0.6−0.3−3.737.80.080.219
HDRAge group intercept
0.22.7 20.10.000.527
p-value significance notation: 0 ‘***’ 0.001 ‘**’ 0.01 ‘*’ 0.05 ‘.’ 0.1 ‘ ’ 1.
Disclaimer/Publisher’s Note: The statements, opinions and data contained in all publications are solely those of the individual author(s) and contributor(s) and not of MDPI and/or the editor(s). MDPI and/or the editor(s) disclaim responsibility for any injury to people or property resulting from any ideas, methods, instructions or products referred to in the content.

