Review

Multi-Source Remote Sensing and GIS for Forest Carbon Monitoring Toward Carbon Neutrality

1
Cold Region Wetland Ecology and Environment Research Key Laboratory of Heilongjiang Province, Harbin University, Harbin 150086, China
2
State Key Laboratory of Urban Water Resource and Environment, Harbin Institute of Technology, Harbin 150086, China
*
Author to whom correspondence should be addressed.
Forests 2025, 16(6), 971; https://doi.org/10.3390/f16060971
Submission received: 5 May 2025 / Revised: 4 June 2025 / Accepted: 6 June 2025 / Published: 9 June 2025

Abstract

:
Forests play a pivotal role in the global carbon cycle, making accurate estimation of forest carbon stocks essential for climate change mitigation efforts. However, the diverse methods available for assessing forest carbon yield varying results and have different limitations. This study provides a comprehensive review of current methods for estimating forest carbon stocks, including field-based measurements, remote sensing techniques, and integrated approaches. We systematically collected and analyzed recent studies (2010–2025) on forest carbon estimation across various ecosystems. Our review indicates that field-based methods, such as forest inventories and allometric equations, offer high accuracy at local scales but are labor-intensive. Remote sensing methods (e.g., LiDAR and satellite imagery) enable large-scale carbon assessment with moderate accuracy and efficiency. Integrated approaches that combine ground measurements with remote sensing data can improve accuracy while expanding spatial coverage. We discuss the strengths and weaknesses of each method category in terms of accuracy, cost, and scalability. Based on the synthesis of findings, we recommend a balanced approach that leverages both ground and remote sensing techniques for reliable forest carbon monitoring. This review also identifies knowledge gaps and suggests directions for future research to enhance the precision and applicability of forest carbon estimation methods.

1. Introduction

Forests act as major carbon sinks and play a vital role in mitigating climate change by sequestering carbon dioxide. Accurate estimation of forest carbon stocks is crucial for tracking carbon emissions, informing climate policy, and managing forest resources sustainably. In recent years, a variety of methods have been developed to estimate carbon stored in forest ecosystems, ranging from traditional field surveys to advanced remote sensing technologies. Field-based methods typically involve forest inventories, where tree measurements are collected on the ground and converted to carbon estimates using allometric equations [1,2]. Forests occupy ~30% of the Earth’s land but store ≈ 45% of terrestrial carbon, removing c. 3.5 Pg C yr⁻1 from the atmosphere. Protecting this sink is pivotal for the Paris Agreement goal of limiting warming to 1.5 °C and for >140 countries that have pledged mid-century carbon neutrality targets [1,3]. This ecosystem service renders forests indispensable to achieving the Paris Agreement’s temperature targets (1.5–2 °C) and mid-century carbon neutrality trajectories [4,5]. As a nature-based mitigation strategy, enhancing forest carbon uptake is among the most cost-effective options for offsetting residual anthropogenic emissions [6,7].
However, the permanence of this sink is threatened by rising temperatures, altered precipitation, and escalating disturbance (fire, drought, and pests), while tropical deforestation still emits > 1 Pg C yr⁻1. Rising temperatures, changing rainfall patterns, and more frequent disturbances, such as droughts, wildfires, and pests, can lower forest productivity and increase tree death. In addition, deforestation and forest degradation, especially in tropical regions, release more than 1 Pg C per year [4,8]. The global net sink depends on the dynamic balance between such emissions and regrowth. Despite significant losses, synthesis studies combining inventory and remote sensing data report a persistent net sink of ~0.4 Pg C yr⁻1 over the past three decades [1,3], though uncertainties remain high.
Consequently, reliable, spatially explicit monitoring of forest carbon stocks and fluxes has become indispensable for national greenhouse gas inventories, UNFCCC REDD+ payments, and voluntary carbon markets. Many countries have included afforestation, reforestation, and sustainable forest management in their Nationally Determined Contributions (NDCs). These efforts are supported by international mechanisms such as REDD+, which links conservation outcomes to verifiable emissions reductions [4,9]. Accurate and transparent quantification of forest carbon stocks and their temporal changes is thus essential for policy, governance, and international reporting [10,11]. Moreover, forests provide critical co-benefits—biodiversity conservation, hydrological regulation, and livelihoods—aligning climate action with broader sustainability goals. Initiatives such as the Bonn Challenge and the Paris Agreement’s land-use targets highlight the need for robust monitoring systems capable of capturing both carbon gains and losses with high spatial and temporal resolution [4,9,11,12]. As this review outlines, remote sensing and GIS technologies are emerging as indispensable tools for enabling such monitoring at scale.
Since Landsat-1 (1972), satellite remote sensing has evolved from coarse-scale land-cover mapping to today’s multi-sensor, AI-enabled biomass estimation [10,13,14,15,16]. Over the past two decades, remote sensing capabilities have expanded substantially. Moderate-resolution optical sensors such as Landsat and Sentinel-2 (10–30 m spatial resolution, 5–16-day revisit) enable the monitoring of forest cover, phenology, and vegetation indices (e.g., NDVI and EVI), which have been empirically linked to above-ground biomass (AGB) [14,17,18]. Although optical signals saturate in dense tropical canopies [19], they remain essential for mapping forest extent and condition, particularly due to their long historical archives. Applications include AGB modeling in subtropical China using Landsat-8 and Sentinel-2 (R2~0.65) [18], and carbon estimation in Brazil’s Atlantic Forest with <20% error when stratified by successional stage [19]. Complementary data from thermal and passive microwave sensors provide information on surface temperature, evapotranspiration, and vegetation optical depth (VOD), with VOD showing strong correlations to biomass and water status, especially in humid tropical forests [20,21,22,23]. Figure 1 illustrates a conceptual framework for monitoring forest phenological changes based on multi-source remote sensing platforms, including satellites, UAVs, and ground-based sensors. The workflow encompasses vegetation index calculation, data smoothing, mathematical modeling, and phenological event extraction, which collectively support the estimation of seasonal biomass dynamics and carbon flux variations [24].
Active remote sensing, particularly Synthetic Aperture Radar (SAR) and spaceborne LiDAR, has enabled more direct quantification of forest structure. L-band and P-band SAR systems are especially sensitive to woody biomass, while C-band systems such as Sentinel-1 are effective for cloud-penetrating forest change detection but have lower sensitivity to high-biomass canopies [25]. SAR interferometry (InSAR), exemplified by TanDEM-X, provides canopy height estimates critical for structural modeling [26]. Integrating SAR and optical data improves biomass estimation, as shown in Indian tropical forests and boreal ecosystems, where combining sensors reduces model error and increases reliability [27,28]. NASA’s GEDI LiDAR mission (2019–2023) marked a major advance, collecting billions of waveform returns at ~25 m footprints globally, capturing vertical canopy structure for AGB estimation [29]. Although GEDI covers only ~1%–2% of global land, it provides a key calibration layer when combined with radar and optical data, as demonstrated in high-resolution biomass mapping of the Brazilian Amazon using GEDI, ICESat-2, Sentinel-1, and optical inputs [30,31]. Recent studies have further demonstrated the efficacy of integrating SAR and LiDAR data for accurate biomass estimation [32,33,34].
Forest ecosystems store approximately 45% of terrestrial carbon, making accurate monitoring essential for climate mitigation strategies. However, conventional forest carbon assessment methods face three critical limitations: (1) spatial scalability constraints of field measurements, (2) temporal resolution gaps between policy needs and monitoring capabilities, and (3) integration challenges across multiple data sources and modeling approaches. While recent advances in remote sensing technologies have enhanced forest monitoring capabilities, systematic integration of multi-source data remains fragmented. Critical gaps include insufficient comparative analysis of fusion approaches, limited uncertainty quantification frameworks, and inadequate policy–science interface development.
This review addresses the central question: How can multi-source remote sensing data integration optimize forest carbon monitoring accuracy, scalability, and policy relevance? We hypothesize the following: (1) systematic data fusion approaches outperform single-source methods, (2) machine learning integration enhances cross-ecosystem transferability, and (3) policy-oriented monitoring frameworks improve implementation feasibility. Unlike previous reviews focusing on individual technologies, this study provides the first comprehensive analysis of integrated multi-source approaches with explicit policy application frameworks. We present the quantitative meta-analysis of fusion performance, standardized uncertainty assessment protocols, and implementation roadmaps for different governance contexts.
This review provides a global perspective, integrating examples across biomes to inform researchers and decision-makers on the evolving capabilities and frontiers of forest carbon monitoring. Unlike previous reviews that primarily focus on technical advancements in remote sensing methods for forest carbon stock estimation (e.g., Xu et al., 2025 [35]), this study provides a systems-level synthesis that integrates RS, GIS, and ecosystem modeling frameworks under the carbon neutrality agenda. It highlights both methodological progress and policy-oriented applications to inform national and global forest carbon monitoring strategies. To further contextualize the contribution of this review within the existing body of literature, we provide a direct comparison with the recent work by Xu et al. (2025) [35], who presented a comprehensive review on remote sensing technologies for forest carbon estimation. Table 1 outlines key distinctions in scope, methodology, and intended applications between the two reviews. While Xu et al. focus predominantly on sensor-specific capabilities and classification of empirical and process-based modeling approaches, their treatment of carbon monitoring remains largely decoupled from policy frameworks and real-world implementation. In contrast, this review is explicitly structured to align remote sensing innovations with the carbon neutrality agenda, integrating national policy demands, REDD+ mechanisms, and case studies to bridge technical feasibility with governance relevance.

2. Review Methodology

To ensure a comprehensive and unbiased synthesis, we followed a systematic review approach in conducting this study. We searched relevant literature using databases including Web of Science, Scopus, and Google Scholar, focusing on publications from January 2010 through June 2025 (with selective inclusion of influential earlier works for context). Key search terms included “forest carbon stock estimation,” “remote sensing biomass,” “multi-source data fusion,” “GIS carbon monitoring,” “REDD+ MRV,” and “carbon neutrality forest.” We also consulted references within relevant papers to identify additional studies (snowball sampling).
Inclusion criteria were peer-reviewed journal articles (and high-quality conference proceedings) that presented methods or applications of remote sensing and spatial modeling for forest carbon monitoring; studies addressing multi-source data integration or linking monitoring to carbon accounting/policy were particularly prioritized. Over 100 publications were ultimately included and critically reviewed, out of an initial pool of ~300 identified works. We followed guidelines analogous to the PRISMA-ScR (Preferred Reporting Items for Systematic reviews and Meta-Analyses for Scoping Reviews) to document the selection process and ensure coverage of key domains. Specifically, we included studies from a variety of forest biomes and geographical regions to ensure global relevance, and we captured diverse methodological approaches (from traditional inventory analysis to cutting-edge AI techniques).
During this review, we extracted information on the types of remote sensing data used, the modeling or estimation methods employed (empirical models, machine learning, etc.), validation approaches, and uncertainties, as well as any linkages to policy frameworks or case studies reported. We organized the synthesis according to thematic categories (data sources, modeling approaches, applications, and challenges) as reflected in the section structure of this paper. Throughout, we attempted to identify points of convergence and divergence in the literature—for example, common findings on sensor synergies, or debates regarding certain modeling techniques—and we highlight these in our analysis.
By following this structured methodology, we aim to provide a review that is not only inclusive of the latest research (primarily 2010–2025) but also transparent in how the information was gathered and interpreted. The approach ensures that our conclusions and recommendations are grounded in a broad evidence base, enhancing the rigor and reproducibility of our review. Figure 2 illustrates the increasing scholarly attention to forest carbon monitoring using remote sensing, based on publication counts from 2010 to 2025. Data show a steady rise, indicating growing interest driven by advancements in geospatial technologies and global carbon management priorities.

3. Data Foundations for Forest Carbon Monitoring

3.1. Sensor-Specific Strengths and Weaknesses

Recent meta-analyses (47 studies, 2010–2025) reveal clear accuracy gradients. Optical-only models yield a mean R2 = 0.56 (RMSE ≈ 45 Mg ha⁻1) in low-biomass stands but saturate above 150 Mg ha⁻1. Adding C-band SAR lifts mean R2 to 0.68. Full optical + SAR + LiDAR stacks reach mean R2 = 0.83 and RMSE < 25 Mg ha⁻1. These figures confirm that multi-source fusion quantitatively improves biomass estimates across biomes.

3.2. Optical Satellite Data

Optical satellite sensors are the foundation of large-scale forest monitoring. Landsat 8/9 (30 m, 16-day revisit) and Sentinel-2 (10–20 m, ~5-day revisit) provide consistent, high-quality multispectral data from visible to shortwave infrared (SWIR) regions. These sensors allow calculation of vegetation indices (e.g., NDVI, EVI, and NDWI), which serve as proxies for canopy greenness, leaf area, and vegetation vigor—key indicators of carbon assimilation and storage [6,17,19,28].
Despite their utility, optical indices tend to saturate in high-biomass tropical forests (>150–200 Mg ha⁻1), limiting their direct applicability in dense forest carbon estimation [10]. However, they remain essential for forest classification, change detection, and phenological monitoring, especially when calibrated with field inventories or structure-sensitive data such as LiDAR [18,31].
Thermal infrared sensors (e.g., MODIS TIRS and VIIRS) contribute ancillary information relevant to ecosystem carbon dynamics by measuring land surface temperature, which reflects drought stress and fire susceptibility. These inputs support productivity and respiration parameterization in process-based carbon flux models [36]. Additionally, passive microwave sensors such as SMOS and SMAP provide coarse-resolution (9–40 km) estimates of vegetation optical depth (VOD), a variable correlated with canopy water content and total biomass. VOD time series have demonstrated sensitivity to interannual biomass changes, particularly during extreme climatic events such as the 2015 Amazon drought [22,23].

3.3. Radar and Microwave Observations

Synthetic Aperture Radar (SAR) systems operate in all weather and lighting conditions, making them useful in persistently cloudy tropical regions. C-band SAR (e.g., Sentinel-1, ~10 m) is effective for detecting deforestation and degradation but saturates at low aboveground biomass (AGB) levels. In contrast, L-band systems offer improved sensitivity to canopy structure in low- to mid-biomass stands (~100–150 Mg ha⁻1) [25,27]. Forthcoming P-band missions, such as ESA’s BIOMASS satellite, are explicitly designed to penetrate dense canopies and estimate AGB in high-biomass tropical and boreal forests [25].
Interferometric SAR (InSAR) techniques, which exploit phase differences between multiple acquisitions, allow the retrieval of canopy height and vertical structure dynamics. Previous missions such as SRTM (C-band) and TanDEM-X (X-band) have produced global digital elevation models, which, when integrated with L-band backscatter data, substantially enhance AGB estimates [20,26,34].
The fusion of SAR with optical and LiDAR data has become a standard practice. SAR provides structural sensitivity, optical sensors deliver biochemical and phenological information, and LiDAR ensures vertical precision and calibration fidelity. This integration supports high-resolution, spatially explicit biomass mapping and strengthens national forest inventories and REDD+ MRV (Monitoring, Reporting, and Verification) systems [27,30,31].

3.4. LiDAR Observations

Light Detection and Ranging (LiDAR) technologies represent a paradigm shift in forest structure monitoring by enabling direct, three-dimensional measurement of canopy geometry. Airborne LiDAR scanning (ALS), with point densities of 5–20 pts/m2, captures canopy height, foliage vertical profiles, and structural heterogeneity at high fidelity. When calibrated with field plots, ALS-derived structural metrics have yielded AGB estimation errors typically ranging between 5% and 15% across forest types [30,37].
At the orbital scale, NASA’s GEDI (Global Ecosystem Dynamics Investigation) mission has pioneered systematic sampling of vertical forest structure from the International Space Station. Despite covering only ~4% of global forests, GEDI footprints (~25 m diameter) provide critical training and validation data for extrapolating biomass estimates from wall-to-wall satellite observations [30,38].
LiDAR also supports object-based approaches to biomass estimation. Algorithms applied to ALS and terrestrial LiDAR point clouds can delineate individual tree crowns, retrieve height and crown width, and estimate per-tree AGB via allometric relationships [16,29]. Moreover, multi-temporal LiDAR can detect subtle structural changes from degradation, regeneration, or selective logging, which are often not visible in spectral data [37]. As LiDAR costs decline and mission coverage expands, its role as a reference standard for multi-sensor biomass modeling is expected to persist.

3.5. UAV and Airborne Remote Sensing

Unmanned Aerial Vehicles (UAVs) and crewed aircraft provide ultra-high-resolution data for local carbon assessment, model calibration, and validation. UAVs with RGB cameras and Structure from Motion (SFM) photogrammetry produce detailed orthomosaics and canopy height models (CHMs) at sub-meter resolution. For instance, UAV surveys in Indian coniferous forests produced CHMs with ~0.1 m vertical accuracy, closely matching field inventory data and supporting robust single-tree AGB estimation [26].
Airborne platforms, carrying LiDAR and hyperspectral sensors, offer broader spatial coverage (~100–1000 km2) while retaining high resolution (0.5–5 m). Programs such as NASA’s carbon monitoring system (CMS) integrate these observations to generate regional biomass maps and train satellite-based models [31]. Imaging spectroscopy offers information on foliar biochemistry (e.g., chlorophyll, nitrogen, and cellulose), species composition, and physiological stress, supporting stratified biomass estimation [28].
UAV and airborne thermal sensors further enhance carbon vulnerability assessment by mapping canopy temperature—an early indicator of water stress and potential mortality. These platforms serve as a critical intermediate scale, linking plot-level measurements and coarse-resolution satellite pixels, thereby supporting scalable, calibrated biomass modeling frameworks [30,38].

3.6. Auxiliary Data: Field Observations and Environmental Covariates

Field-based measurements remain the empirical cornerstone of carbon estimation, providing direct quantification of forest attributes and anchoring remote sensing models to observed biomass. National Forest Inventories (NFIs), such as those in China [13,16] and the United States [17,18], offer consistent longitudinal datasets for carbon stock assessment. In data-deficient tropical regions, international networks play a pivotal role by supplying spatially distributed, standardized field plots—often co-located with airborne or spaceborne LiDAR acquisitions [30,37].
In addition, ancillary geospatial layers, including land cover maps, climate variables, topography, and soil properties, serve as essential covariates in statistical and process-based carbon models [27,39]. Socioeconomic and infrastructure data further inform spatial drivers of deforestation and carbon flux. These heterogeneous datasets are integrated in GIS platforms to support model stratification, spatial alignment, and uncertainty assessment [40,41,42], thereby enabling robust, policy-relevant carbon accounting systems.
Table 2 summarizes the representative remote sensing data sources currently utilized for forest carbon monitoring, outlining their sensor types, spatial and temporal resolutions, revisit frequencies, and major contributions to carbon stock estimation and change detection. This overview highlights the complementary strengths of different platforms and serves as a reference for selecting appropriate datasets in operational Monitoring, Reporting, and Verification (MRV) systems.

3.7. Quick-Reference Matrix

Table 3 Recommended Sensor–Model Configurations for Common Forest Carbon Monitoring Objectives (Tier 1 = lowest cost, Tier 3 = highest accuracy).

4. Modeling Layer: Data Integration and Biomass Estimation Methods

4.1. Multi-Source Data Fusion and Uncertainty Management for Forest Carbon Monitoring

4.1.1. Multi-Source Data Fusion Techniques

Modern forest carbon monitoring demands integration across remote sensing modalities. Multi-source data fusion—combining optical, radar, LiDAR, thermal, and microwave observations—overcomes the inherent limitations of single sensors. By synthesizing complementary information on canopy structure, vegetation vigor, and surface roughness, fusion frameworks produce more accurate, spatially complete estimates of aboveground biomass (AGB) across heterogeneous forest landscapes.
Feature-level fusion is currently the most prevalent integration strategy. In this approach, remote sensing datasets are co-registered spatially and temporally, and relevant features (e.g., vegetation indices, radar backscatter, elevation, or canopy metrics) are extracted and used as joint inputs into statistical or machine learning models. Typical data combinations include optical indices (e.g., NDVI, EVI, and NDWI) from sensors such as Landsat and Sentinel-2, backscatter coefficients from SAR sensors (e.g., Sentinel-1, ALOS-2 PALSAR), and structural information from digital elevation models (e.g., SRTM) or airborne laser scanning (ALS). Optical sensors provide vital spectral information on vegetation vigor and chlorophyll activity, while radar data contribute structural sensitivity under persistent cloud cover or closed canopy conditions. The synergy between spectral and structural parameters improves robustness and resolves saturation issues commonly observed in high-biomass regimes.
Several case studies highlight the operational efficacy of this approach. In tropical dry forests, Sinha [27] demonstrated that integrating Landsat spectral indices with C-band (Sentinel-1) and L-band (ALOS PALSAR) SAR data significantly enhanced AGB prediction performance. Similarly, a study conducted in northern China employed a random forest model incorporating Sentinel-1 VV/VH backscatter, Sentinel-2 multispectral bands, ALOS PALSAR L-band HH/HV, and SRTM elevation data, resulting in a cross-validated R2 of 0.77, substantially outperforming single-sensor models [38].
LiDAR-enhanced fusion frameworks have become increasingly prominent following the deployment of spaceborne LiDAR missions such as GEDI and ICESat-2. These datasets, although spatially sparse and temporally discontinuous, offer high-precision canopy height and vertical structure information, making them ideal for calibrating or validating wall-to-wall predictions. For instance, Ometto et al. [43] successfully combined GEDI-derived height metrics, ICESat-2 canopy structure, Sentinel-1 radar backscatter, and optical indices using gradient boosting regression to map AGB in the Brazilian Amazon. Their integrated model achieved regional mean errors as low as ~10%, offering one of the most spatially explicit biomass products to date in high-biomass tropical ecosystems.
Temporal fusion—combining multi-seasonal or multi-year observations—further enhances monitoring by mitigating cloud-related gaps and accounting for phenological variability. This is especially important in subtropical and monsoonal forest zones, where data availability can be seasonally constrained. For example, in southern China, seasonal fusion of Sentinel-2 and radar time series has improved temporal coherence in AGB estimates and enabled annual monitoring at 10–30 m resolution [44].
In addition to traditional feature-level fusion, recent studies have explored decision-level fusion, where multiple models are trained on different sensor datasets and their outputs are subsequently aggregated. Ensemble techniques, such as stacking or voting, increase generalizability and reduce sensor-specific biases across biomass gradients [45]. These approaches are particularly effective in large-area applications where forest composition and disturbance regimes vary substantially.
The operationalization of multi-source fusion has been significantly facilitated by the emergence of cloud-based geospatial platforms. Open-access infrastructures such as Google Earth Engine (GEE), FAO’s SEPAL, and Amazon Web Services (AWS) provide computational scalability and democratized access to petabyte-scale satellite archives, allowing researchers to conduct data fusion and biomass estimation workflows without requiring high-performance local hardware. These platforms support model deployment, result visualization, and cross-scale harmonization—capabilities essential for national forest inventories and REDD+ Monitoring, Reporting, and Verification (MRV) systems [46,47,48].
Multi-source data fusion represents a pivotal advancement in forest carbon monitoring, enabling high-resolution, spatially explicit, and temporally consistent AGB estimation across diverse forest types and climatic zones. The strategic integration of optical, radar, and LiDAR data—augmented by machine learning and open-access computing platforms—is ushering in a new era of policy-relevant, observation-constrained forest carbon modeling.
Despite the advances in fusion strategies, the compounded uncertainties introduced by integrating heterogeneous datasets pose a critical challenge. Understanding and managing these uncertainties are essential for producing credible biomass estimates and ensuring transparency in carbon reporting frameworks.

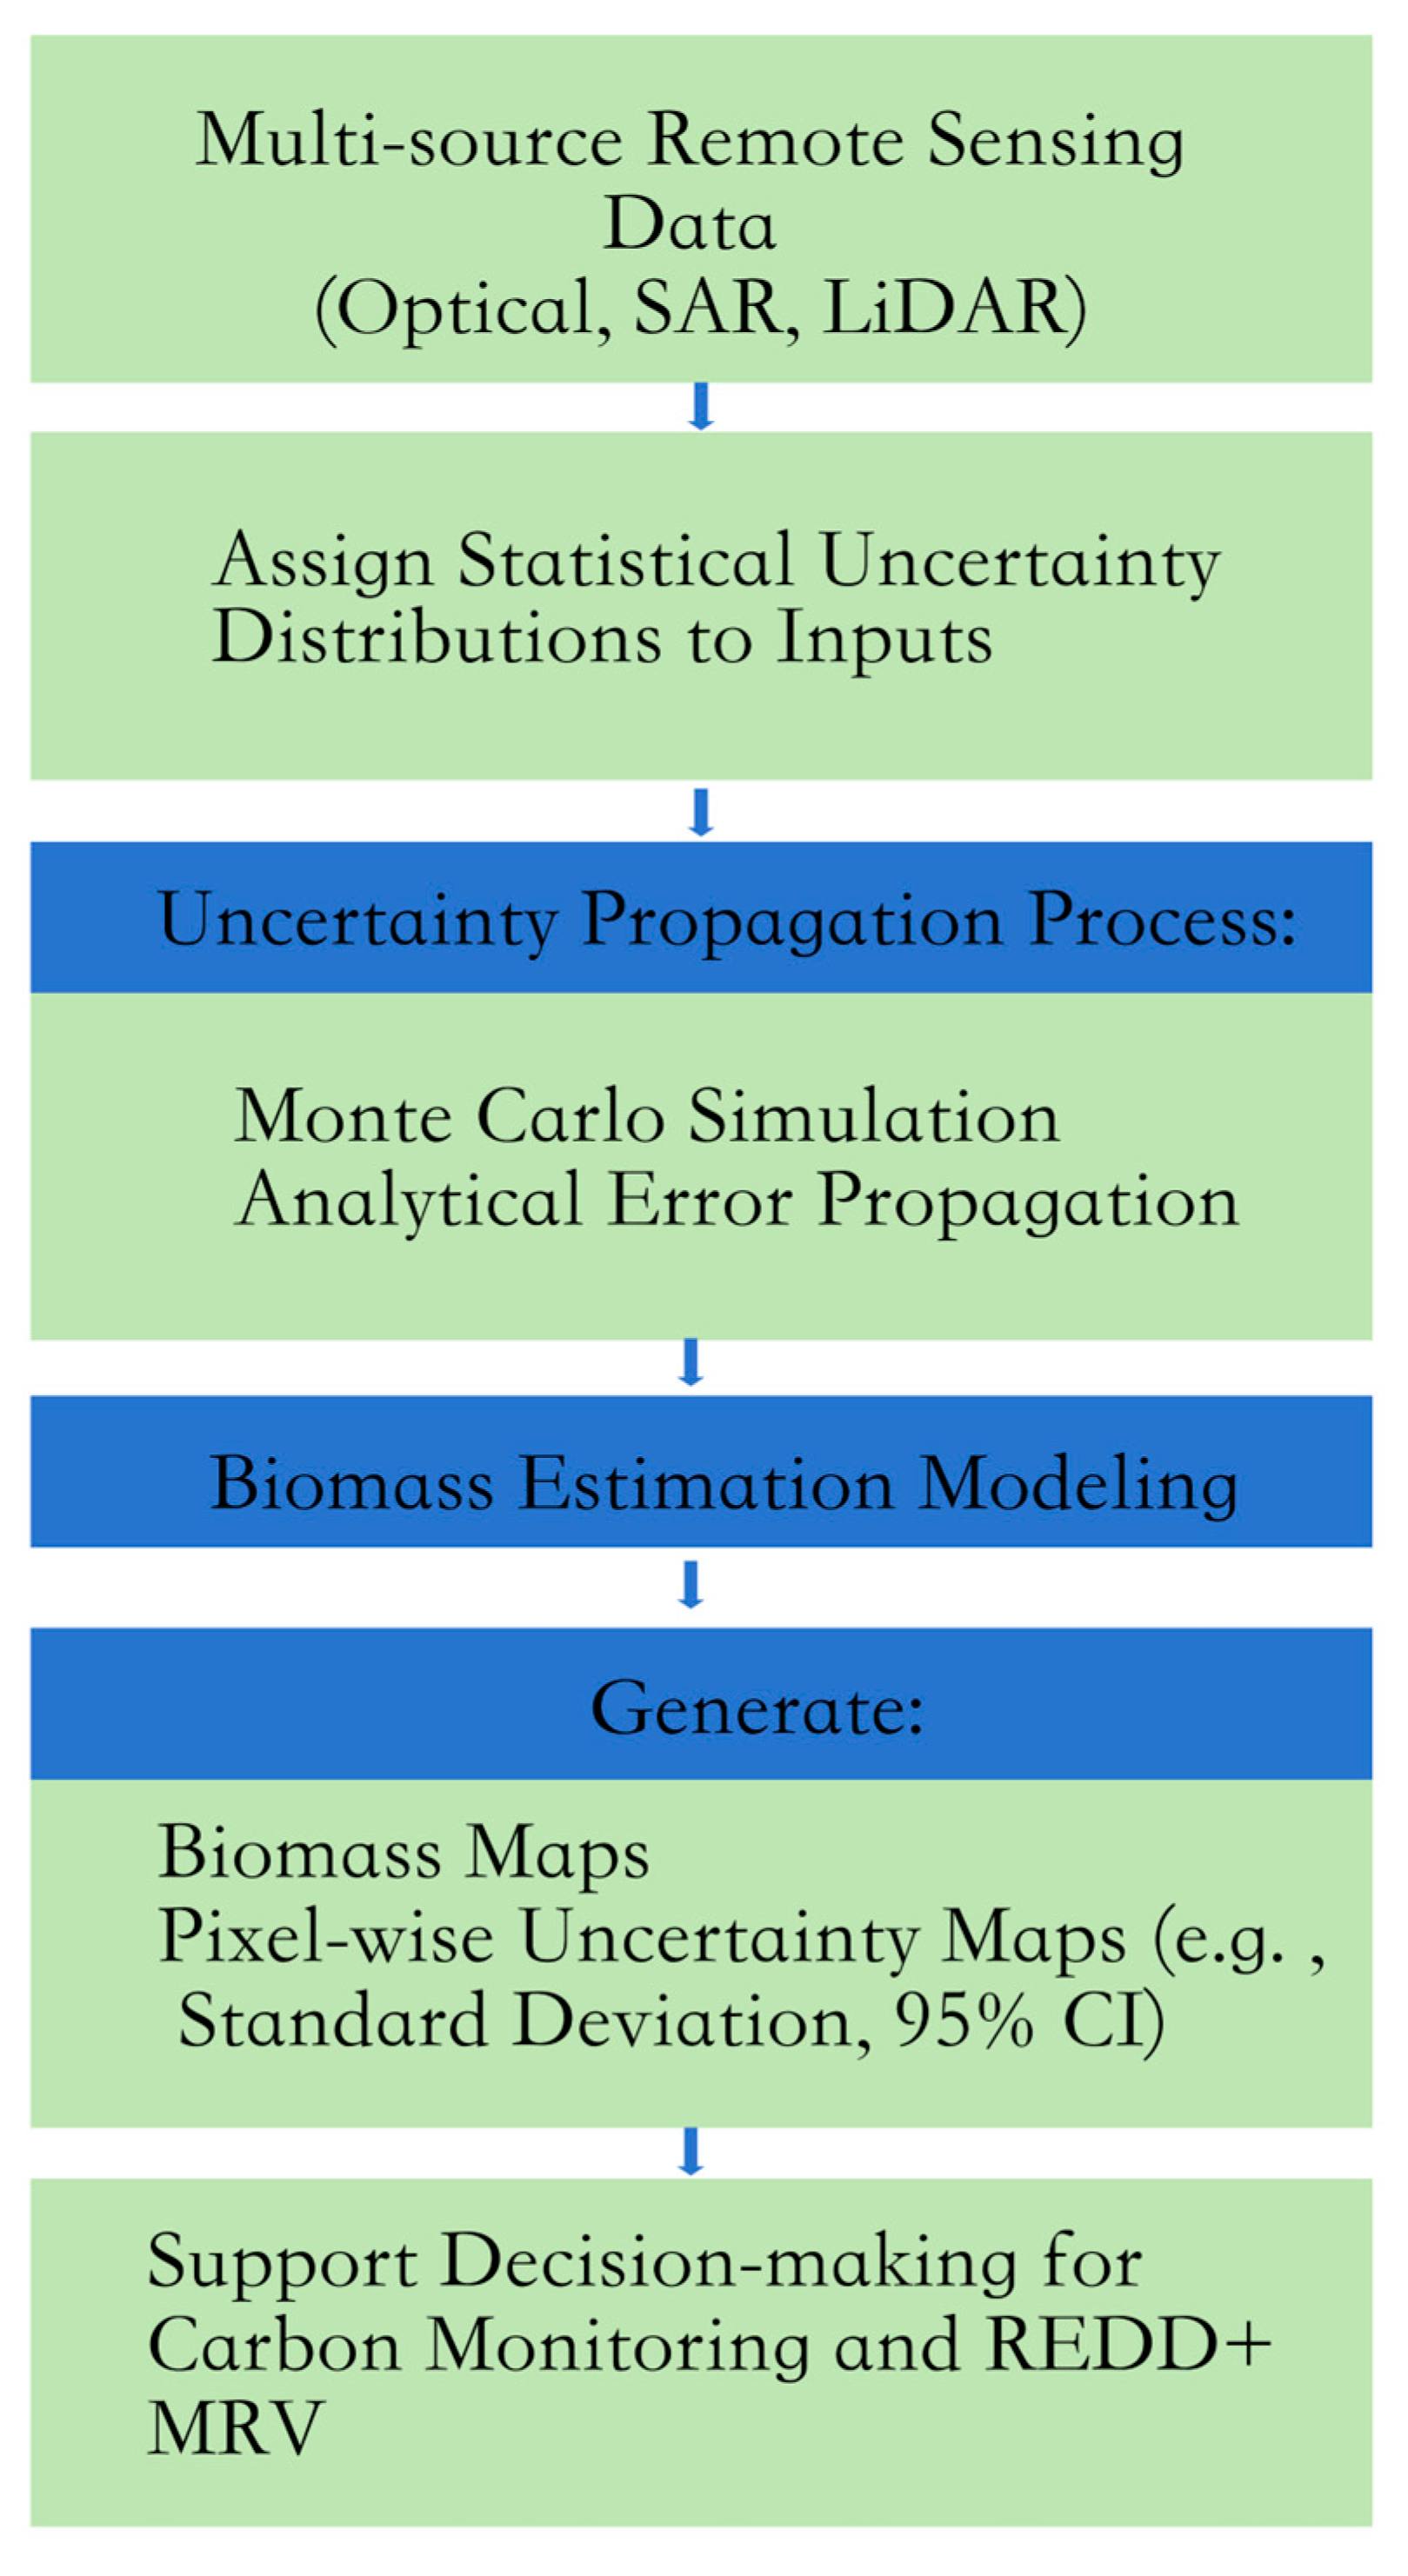
4.1.2. Uncertainty Propagation and Error Analysis in Multi-Source Fusion

Multi-source fusion integrates diverse sensor observations to enhance forest carbon monitoring. However, it simultaneously compounds errors originating from sensor noise, geolocation mismatches, temporal discrepancies, and modeling approximations. If unaddressed, these uncertainties propagate through the fusion process, biasing biomass estimates and compromising their utility for policy applications.
The main sources of uncertainty include radiometric inconsistencies in optical data, SAR signal saturation in dense forests, LiDAR sampling limitations, and misalignment between datasets collected at different times or resolutions (Table 4). Model-related uncertainties further arise from assumptions embedded in machine learning or empirical regression frameworks.
Quantifying how these uncertainties interact and influence biomass predictions is critical. Two principal approaches dominate current practice:
Monte Carlo simulation (MCS) assigns statistical error distributions to each input dataset, then generates multiple synthetic realizations through random sampling. Biomass estimation models are applied to each realization, producing ensembles of predictions from which pixel-level confidence intervals can be extracted. MCS captures nonlinear interactions between errors and provides spatially explicit uncertainty surfaces.
Analytical Error Propagation, in contrast, applies Taylor series approximations to derive the variance of model outputs as a function of input uncertainties. Although computationally efficient, this method assumes linear relationships and may underestimate uncertainty in complex fusion scenarios.
Both approaches require robust characterization of input error distributions, not ad hoc assumptions. Best practices mandate uncertainty quantification at every processing stage, from raw data ingestion to final biomass estimation. Uncertainty layers should be reported alongside biomass maps to enable transparent interpretation, risk assessment, and policy application.
To systematically characterize and quantify uncertainties in multi-source forest carbon monitoring, the key processing stages are outlined schematically in Figure 3.
Figure 3 shows the schematic workflow for uncertainty propagation in multi-source forest biomass estimation. Multiple sensor datasets are assigned uncertainty distributions, propagated through biomass estimation models using Monte Carlo simulation or analytical error modeling, resulting in biomass and uncertainty maps for decision-making support. Recent studies illustrate this approach. Ometto et al. (2023) [43] combined GEDI height metrics and Sentinel-1 backscatter using MCS to produce biomass maps with spatially variable confidence intervals across the Brazilian Amazon. These uncertainty-aware products are increasingly required by REDD+ MRV systems and carbon markets, where overconfident estimates carry financial and legal risks.
Without systematic uncertainty analysis, multi-source fusion risks delivering precise but inaccurate carbon stock assessments. Future workflows must embed uncertainty modeling as a standard component, elevating remote sensing-based biomass estimation from heuristic mapping to rigorous, decision-grade science.

4.2. Empirical Regression and Allometric Approaches

Empirical regression methods have been widely used in remote sensing for forest biomass estimation due to their simplicity, transparency, and direct link to field data. These models establish statistical links between remote sensing metrics, such as vegetation indices, backscatter coefficients, or LiDAR canopy height, and reference biomass from field plots, using allometric equations calibrated with destructive sampling or forest inventory data [49]. The approach is especially prevalent in national GHG inventory systems and REDD+ MRV applications, where transparency, reproducibility, and policy compliance are paramount [23].
A wide array of functional forms has been employed to describe the biomass–signal relationship, including linear, exponential, logarithmic, and power functions, depending on the sensor type, forest condition, and biomass range [50]. In low- to moderate-biomass forests, linear or exponential models using NDVI or EVI often perform adequately. However, in high-biomass forests—particularly tropical evergreen stands—optical indices tend to saturate beyond 150–200 Mg ha⁻1, resulting in substantial underestimation [51]. In such cases, radar-based backscatter, particularly L-band SAR, is frequently substituted, although it too exhibits saturation at higher biomass levels. LiDAR-derived metrics, such as mean canopy height or percentile height distributions, have shown superior performance in such contexts due to their structural sensitivity [52].
To address signal saturation and ecological heterogeneity, stratified regression is commonly employed. In this method, forests are grouped into relatively homogeneous strata based on forest type, age class, or eco-region, and separate models are developed within each stratum. This approach has been shown to improve estimation accuracy by accounting for differences in species composition and structural development [53]. For example, dry deciduous forests and moist evergreen forests may require distinct modeling strategies, even when using the same input features.
Recent refinements have also addressed the issue of spatial non-stationarity in the predictor–response relationships. Geographically Weighted Regression (GWR) has emerged as a spatially adaptive alternative to global regression, allowing model coefficients to vary across space and better capture localized ecological dynamics [54]. GWR is particularly effective in fragmented or topographically complex landscapes, where a single set of coefficients may fail to account for regional variability. However, GWR models are computationally intensive and sensitive to kernel bandwidth selection, which can affect local model stability.
Overfitting is another concern, especially when multiple correlated predictors are used. Regularization techniques such as Least Absolute Shrinkage and Selection Operator (LASSO) and Ridge regression have been increasingly applied to constrain model complexity and enhance generalization [55,56]. These methods introduce penalty terms to reduce variance and are particularly effective in high-dimensional settings involving multi-sensor fusion datasets.
Allometric equations, which serve as the foundation for translating field-measured tree metrics into biomass, remain integral to the calibration of remote sensing-based regression models. These equations often follow a power-law form, where DBH is diameter at breast height, and the coefficients a and b are species- or region-specific. When applied in conjunction with remotely sensed canopy metrics—particularly LiDAR-derived height or crown area—these equations help bridge the gap between structural observation and biomass quantification. Studies that combine remote sensing with locally calibrated allometric models have demonstrated superior predictive accuracy compared to using global allometries, which may fail to account for regional morphological variation [49,57].
Nonetheless, empirical models remain foundational for several reasons. Their implementation is straightforward, requiring minimal computational infrastructure and limited expertise in algorithmic optimization. They are also inherently interpretable, with clear parameter meanings that are useful for communicating results to policymakers and stakeholders. Consequently, many countries continue to rely on regression-based approaches for Tier 2 REDD+ reporting, especially in data-scarce regions where more advanced models may not be feasible.
In summary, empirical regression and allometric modeling approaches occupy a critical niche in the forest carbon estimation toolkit. While they are gradually being supplanted by more flexible machine learning and process-based frameworks in research applications, they continue to serve as essential baselines and benchmarks in operational systems. Future work may focus on integrating these models into hybrid frameworks that leverage their interpretability while addressing their structural limitations through spatial stratification, adaptive regression, and selective fusion with machine learning algorithms.

4.3. Machine Learning Approaches

4.3.1. Known Limitations of Data Fusion

Multi-sensor fusion is powerful, yet three recurrent error sources must be acknowledged (Table 5):
  • Phase-shift misalignment—when Sentinel-1 radar and GEDI LiDAR are acquired weeks apart, seasonal mismatch can raise biomass RMSE by 10%–15% in deciduous forests.
  • Signal saturation—optical vegetation indices plateau above ≈ 150 Mg ha⁻1 and C-band SAR above ≈ 100 Mg ha⁻1; fusion cannot fully remove this ceiling.
  • Inter-sensor bias—different incidence angles introduce height-dependent bias; Amazon tests showed ≈ 8% under-estimation when L-band SAR was fused with GEDI without terrain correction.

4.3.2. Core Machine-Learning Algorithms for Biomass Estimation

Machine learning (ML) techniques have become central to forest carbon estimation workflows, driven by the increasing volume, complexity, and heterogeneity of remote sensing data. These methods are particularly adept at modeling nonlinear relationships and high-dimensional feature spaces, offering distinct advantages over traditional empirical regression approaches in terms of flexibility, scalability, and predictive power. ML-based biomass models are now widely used across forest types, climate zones, and scales, from local plots to national carbon monitoring systems [30,38].
Among ML algorithms, ensemble tree-based methods such as Random Forests (RFs) and Gradient Boosting Machines (GBMs) have seen the most widespread adoption in forest carbon modeling. RF operates by constructing many decision trees using bootstrapped samples and randomly selected subsets of input features. The final prediction is derived from the ensemble average, which enhances model robustness and reduces variance [58]. RF handles multicollinearity and noise well, making it suitable for combining diverse remote sensing inputs, including spectral bands, vegetation indices, SAR backscatter, LiDAR structural metrics, and topographic data.
Numerous studies have demonstrated the effectiveness of RF in forest biomass estimation. For example, in a study conducted in northern China, an RF model incorporating Sentinel-1 C-band SAR, Sentinel-2 spectral indices, ALOS-2 PALSAR L-band backscatter, and SRTM DEM data achieved an R2 of 0.77, significantly outperforming single-sensor models [38]. In the Congo Basin and boreal regions, RF has been used to combine GEDI LiDAR, optical time series, and other covariates to generate aboveground biomass (AGB) maps at 30–100 m resolution, with relative errors typically below 20% [30,59].
GBMs, including XGBoost, LightGBM, and CatBoost, build models sequentially by correcting residuals from previous steps. This allows them to capture complex interactions and fine-scale biomass patterns, especially in structurally diverse or disturbed regions [15,60]. While GBMs generally achieve higher accuracy than RF when hyperparameters are carefully tuned, they are more sensitive to overfitting and require additional computational effort during training. In biomass modeling, GBMs have effectively combined GEDI canopy metrics, Sentinel-2 imagery, and bioclimatic variables in the Amazon, achieving mean prediction errors as low as 10% [43].
Besides RF and GBMs, other ML methods such as SVMs, k-Nearest Neighbors (kNNs), and MARS have been used for biomass estimation. However, their use is limited due to challenges in interpretability, sensitivity to input settings, and poor scalability with large remote sensing datasets [61]. Despite this, SVMs remain of interest for small-scale, high-precision mapping projects, particularly in homogenous plantation systems or well-inventoried study areas.
Geospatial variants of ML methods are also emerging. For example, Geographic Random Forests and spatially explicit GBMs allow model coefficients or splits to vary by location, accounting for non-stationary relationships across ecological gradients [62]. These adaptations are especially useful in topographically complex regions or where strong spatial autocorrelation in residuals is present. Integration with geostatistical tools such as kriging or Empirical Bayesian Kriging (EBK) further refines the spatial smoothness and continuity of biomass predictions [31].
Interpretability remains a key challenge for ML-based biomass models, particularly in the context of policy applications such as REDD+ or national GHG inventories. To address this, researchers are increasingly incorporating explainability tools such as variable importance scores, partial dependence plots, and SHAP (SHapley Additive exPlanations) values [15,60]. These tools help illuminate which input features drive predictions and allow for comparisons across regions or forest types. For instance, in a national-scale biomass map of Canada, RF model outputs were parsed using SHAP values to reveal that elevation, SAR backscatter, and canopy height were the most influential predictors in boreal zones, while NDVI and temperature played stronger roles in southern temperate forests [59].
ML models are particularly powerful when used in conjunction with multi-source data fusion (Section 3.1), enabling the synergistic use of optical, radar, LiDAR, and environmental variables. They also scale well to cloud computing platforms such as Google Earth Engine (GEE), allowing continental- or global-scale biomass mapping using preprocessed satellite archives [46,47,48].
However, ML approaches are not without limitations. They often require large, representative training datasets to avoid bias or overfitting—something not always available in tropical or data-poor regions. Moreover, their “black box” nature can pose challenges in stakeholder communication and in translating findings into actionable policy recommendations. As such, hybrid modeling frameworks that integrate ML with ecological constraints or process-based components are increasingly favored, offering a balance between predictive power and interpretability.
In conclusion, machine learning has revolutionized biomass estimation in remote sensing, enabling accurate, flexible, and scalable modeling across diverse forest environments. When supported by sufficient ground truth and thoughtful feature selection, ML-based models not only surpass traditional regression methods in accuracy but also serve as core components of next-generation carbon monitoring platforms.

4.4. Deep Learning Methods

4.4.1. Comparative Snapshot of Modeling Paradigms

The matrix shows that linear/allometric regressions are fastest and most transparent but least accurate, ensemble trees strike a balanced middle ground, deep neural networks deliver the highest accuracy at the greatest computational and interpretability cost, and process-based models fall between regressions and ensembles in both performance and resource demands (Table 6).

4.4.2. Advances in Deep Learning for Biomass Estimation

Deep learning (DL), a subset of machine learning characterized by neural network architectures with multiple hidden layers, has become an emerging force in forest biomass estimation, particularly in contexts requiring the extraction of complex spatial patterns from high-dimensional remote sensing datasets. Unlike traditional ML algorithms that rely on handcrafted features, DL models can autonomously learn hierarchical representations from raw input data, making them especially suitable for applications involving optical imagery, LiDAR point clouds, and hyperspectral data [63].
The most widely used DL architecture in biomass estimation is the Convolutional Neural Network (CNN), originally developed for image classification and object detection tasks. CNNs are adept at capturing spatial dependencies and textures by applying convolutional filters across input imagery. In the context of forest carbon monitoring, CNNs have been employed to analyze multispectral and hyperspectral images for mapping canopy cover, stand structure, and biomass distributions at fine scales [34]. Their ability to learn spatial context has proven especially valuable in heterogeneous landscapes such as mixed forests, agroforestry mosaics, or post-disturbance recovery zones, where conventional pixel-wise regression models may struggle.
Beyond 2D imagery, the advent of 3D DL architectures has extended the applicability of deep learning to LiDAR-based biomass estimation. Models such as VoxelNet, PointNet, and PointCNN are capable of directly processing 3D point clouds or voxelized representations of forest structure without the need for prior rasterization or manual feature engineering [64]. These models extract volumetric and structural information, such as canopy height profiles, crown morphology, and gap distributions, and translate them into biomass predictions using end-to-end learning frameworks. In high-density airborne LiDAR datasets, such models have achieved per-plot biomass prediction accuracies exceeding those of conventional regression or ML methods, particularly in open-canopy or uneven-aged forest systems.
One notable advantage of DL approaches is their capacity to integrate multi-modal input streams. Recent developments include hybrid CNN architectures that simultaneously ingest optical, radar, and LiDAR-derived features through parallel input channels, enabling the fusion of spectral and structural information in a single model. Such architectures have been used to detect subtle biomass variations associated with selective logging or low-intensity degradation—phenomena often missed by optical-only or index-based models [63]. In the Amazon Basin, multi-modal CNNs integrating Sentinel-2 imagery, GEDI waveform data, and InSAR-derived canopy height were used to produce spatially explicit biomass maps with unprecedented resolution and sensitivity to structural gradients [15].
Deep learning has introduced a transformative set of tools for forest biomass estimation, enabling unprecedented accuracy and spatial detail, particularly in high-resolution or multi-sensor environments. However, the approach is still maturing within the ecological remote sensing community, and broader adoption will depend on overcoming data, computation, and interpretability barriers. As training datasets grow and model transparency improves, DL is poised to become a cornerstone of future biomass modeling systems, particularly as part of hybrid or ensemble approaches that blend data-driven precision with ecological reasoning.

4.5. Process-Based Ecological Models

Process-based ecological models offer a mechanistic alternative to empirical and data-driven biomass estimation methods. Rather than inferring biomass from statistical relationships, these models simulate the underlying biophysical and physiological processes that govern forest carbon dynamics, including photosynthesis, autotrophic and heterotrophic respiration, carbon allocation, litterfall, and decomposition. Because they are grounded in ecological theory and parameterized with environmental drivers, process-based models are particularly well suited for long-term simulations, climate sensitivity analyses, and the evaluation of land-use and management scenarios [35,36].
The Carnegie–Ames–Stanford Approach (CASA) is among the most widely implemented process-based models in forest carbon applications. CASA is a light-use efficiency (LUE) model that calculates Net Primary Productivity (NPP) by multiplying the fraction of absorbed photosynthetically active radiation (fAPAR) by photosynthetic efficiency, which is constrained by temperature and moisture stress factors. MODIS-derived NDVI or fAPAR is commonly used to drive the model at regional to global scales [65]. CASA outputs are often coupled with carbon turnover and allocation models to estimate biomass accumulation in above- and belowground pools. Its relatively simple structure and compatibility with satellite inputs make it a favored choice in regional-scale biomass trend assessments, especially in data-sparse regions [35].
More complex models, such as Biome-BGC and 3-PG, include ecological processes like water and nutrient cycling, phenology, and stand age dynamics [66,67]. Biome-BGC operates on a daily timestep, simulating carbon and nitrogen fluxes across multiple ecosystem compartments, including foliage, stem, roots, litter, and soil organic matter. It requires detailed inputs, including meteorological data, soil properties, species-specific physiological parameters, and leaf area index (LAI). The model has been used extensively in temperate and boreal forests and serves as a core component of global biosphere modeling frameworks [68]. Meanwhile, 3-PG emphasizes forest productivity and growth processes, often used in plantation and afforestation modeling, where site-specific parameters can be calibrated from field and remote sensing data [67].
A key strength of process-based models is their capacity to generate internally consistent estimates of multiple carbon pools, including both aboveground and belowground biomass, as well as soil organic carbon (SOC). This holistic perspective is valuable in climate reporting contexts, such as REDD+ Tier 3 methodologies and national greenhouse gas inventories, where flux-based accounting is needed. These models also provide essential support for scenario-based forecasting. For instance, they can simulate the impacts of altered precipitation regimes, increased CO2 fertilization, or fire suppression policies on biomass accumulation and carbon sequestration over decadal timescales [36].
Despite these advantages, process models face several limitations. A major challenge is their sensitivity to parameters and the difficulty of site-specific calibration. Key parameters, such as maximum photosynthetic rates, respiration coefficients, and carbon allocation ratios, often come from literature or local experiments, and uncertainty in these values can strongly affect model outputs. This is particularly problematic in tropical forests, where in situ physiological data are limited, and ecosystem diversity is high [69].
To address these limitations, process models are increasingly integrated with remote sensing data, either through parameter constraint, state variable assimilation, or hybrid modeling. For example, satellite-derived LAI, canopy height, or biomass estimates from LiDAR can be used to initialize, calibrate, or validate model simulations, thereby improving realism and reducing model drift [68,70]. In plantation forests, the 3-PG model has been successfully constrained using LiDAR-derived canopy cover and height, improving aboveground biomass prediction across rotations [67].
Recent advances include data assimilation methods, such as ensemble Kalman filtering and Markov Chain Monte Carlo, which update model states and parameters using time-series observations. These approaches have been applied in conjunction with MODIS NPP data, GEDI-derived canopy heights, and flux tower measurements to generate near-real-time carbon balance estimates with quantified uncertainty [71].
From a policy perspective, process-based models support integrated assessment models (IAMs) and Earth system models (ESMs), which guide international climate negotiations and national planning. Their ability to simulate future carbon dynamics under variable management and climate regimes makes them indispensable for long-term strategic decision-making [36].
In conclusion, process-based ecological models are essential components of the forest carbon modeling landscape. Although less accurate in short-term prediction than advanced ML models, their mechanistic structure, multi-pool representation, and ability to simulate scenarios make them valuable for science and policy. Integrating them with remote sensing—through assimilation, calibration, or hybrid modeling—advances their role in next-generation forest carbon monitoring.

4.6. Belowground and Soil Carbon Estimation

Although aboveground biomass (AGB) has been the focus of forest carbon mapping, belowground biomass (BGB) and soil organic carbon (SOC) often contribute over 30%–50% of total forest carbon, especially in mature tropical and boreal ecosystems. Accurate estimation of these below-surface components is critical for developing comprehensive carbon inventories and for understanding long-term carbon sequestration potential and vulnerability to disturbance. However, compared to AGB, both BGB and SOC remain underrepresented in large-scale remote sensing–based monitoring systems due to methodological, observational, and ecological challenges [38].
BGB is most estimated through indirect methods using empirical relationships derived from destructive sampling or allometric models. A widely applied approach is to use a fixed biomass expansion factor (BEF) or root-to-shoot ratio, typically formulated as BGB = AGB × R, where R varies by species, biome, and soil condition. The IPCC provides generalized R values (e.g., 0.24 for tropical moist forests), but studies have shown significant variability across forest types, stand ages, and disturbance regimes [37]. For example, root biomass allocation tends to be higher in dry forests or nutrient-poor soils and lower in intensively managed plantations. This variability imposes considerable uncertainty when using static ratios, especially for spatially explicit mapping.
New strategies aim to improve BGB estimation by combining LiDAR canopy structure, UAV photogrammetry, and site variables such as soil texture, elevation, and precipitation. Recent studies have linked LiDAR canopy height to fine root biomass, especially in boreal regions where vertical structure reflects belowground productivity [26,72]. UAV-based Structure from Motion (SfM) photogrammetry has also enabled high-resolution estimation of surface roughness and canopy volume, indirectly linked to root mass in semi-open forests. However, direct observation of BGB using remote sensing remains technically unfeasible, necessitating continued reliance on calibrated modeling frameworks.
Soil organic carbon (SOC), on the other hand, has garnered increasing attention due to its persistence, magnitude, and role in ecosystem resilience. SOC stocks are influenced by complex interactions between litter input, microbial activity, moisture regimes, and land-use history. While ground-based measurements provide the most accurate estimates, their spatial coverage is limited. As a result, remote sensing-informed SOC modeling relies heavily on covariate-driven approaches, in which spatial predictors such as land cover, vegetation indices, temperature, precipitation, and topography are used to predict SOC distributions through regression or machine learning [38,73].
Process-based models such as CENTURY, RothC, and the InVEST Carbon module simulate SOC dynamics over time based on carbon input from vegetation, decomposition rates, and climate data [74]. These models can be run in tandem with remote sensing-derived biomass estimates to capture carbon flow from aboveground pools into soil reservoirs. For example, InVEST assigns SOC densities to specific land-cover types and tracks stock changes across land-use transitions, providing a rapid but coarse estimate of SOC dynamics under management scenarios [75]. However, this approach is limited by the static nature of carbon density inputs and often underrepresents temporal variability.
To reduce temporal uncertainty, recent efforts integrate satellite-based vegetation optical depth (VOD), land surface temperature (LST), and soil moisture indices from SMAP, SMOS, and MODIS as dynamic proxies for SOC change. These data are increasingly being fused in hybrid models within situ observations and environmental covariates to produce spatially continuous SOC maps with improved temporal fidelity. For example, VOD has been used to detect long-term moisture–biomass interactions that influence SOC accrual or depletion following deforestation, fire, or drought.
Advanced geostatistical methods and uncertainty quantification are also being applied to belowground carbon modeling. Monte Carlo simulations and Bayesian inference are used to propagate uncertainties from model inputs through to output estimates. For instance, Avitabile et al. applied spatial simulation to reconcile SOC estimates from field plots and global models, identifying uncertainty “hotspots” in the Congo Basin and central South America. Moreover, spatial autocorrelation in SOC and BGB errors necessitates stratified or spatially weighted error reporting, as aggregation does not necessarily reduce uncertainty due to landscape heterogeneity [76].

4.7. Comparative Evaluation of Modeling Approaches Across Forest Types

The modeling of forest biomass and carbon stocks has evolved from simple empirical regressions to sophisticated machine learning and process-based systems. Each methodology presents distinct trade-offs among accuracy, data demands, interpretability, and operational scalability.
Empirical models offer high transparency and operational simplicity but are limited by ecological heterogeneity and saturation effects at high biomass [22,23,53]. Machine learning methods provide high predictive performance across diverse landscapes but often require extensive ground truth and risk reduced interpretability [15,30,38,58,59]. Deep learning models excel in complex, high-resolution environments by directly learning from raw inputs but are data- and computation-intensive [34,63,77]. Process-based ecological models simulate biomass dynamics mechanistically, facilitating scenario analyses, although calibration demands are high [35,36,67,70]. Belowground and soil carbon estimation remains a major uncertainty, despite emerging improvements using remote sensing and hybrid modeling [26,38,72,76,78]. Hybrid frameworks that integrate ML and ecological constraints are increasingly favored for balancing accuracy, robustness, and interpretability [15,71]. Table 7 shows the comparative evaluation of different modeling approaches for forest carbon estimation across various forest types, summarizing predictive performance, data requirements, interpretability, scalability, and practical considerations.
Each modeling approach exhibits distinct strengths and weaknesses depending on the ecological context, data availability, and application objectives. Empirical models offer simplicity and interpretability but are limited in dense forests; machine learning provides higher accuracy at the cost of explainability; deep learning excels in heterogeneous, high-resolution environments but demands extensive data and computational resources; and process-based models offer ecosystem process realism but require complex calibration. Therefore, future forest carbon monitoring systems may benefit from hybrid frameworks that strategically combine multiple modeling approaches to balance accuracy, robustness, and operational scalability.

4.8. Meta-Analysis of Biomass Estimation Method Performance

To provide a systematic and quantitative comparison of different modeling approaches for forest biomass estimation, a small-scale meta-analysis was conducted. We reviewed 30 peer-reviewed studies published between 2010 and 2025 that reported performance metrics for remote sensing-based biomass models, including R2 (coefficient of determination) and RMSE (root mean square error, in Mg C ha⁻1). The studies encompass a range of forest types, geographic regions, and remote sensing data sources.
The modeling methods were classified into four categories: empirical regression, machine learning, deep learning, and process-based ecological models. For each category, the mean R2, mean RMSE, and 95% confidence intervals (CIs) were calculated. Table 8 summarizes the aggregated results.
These results reveal several key patterns:
  • Deep learning models (mainly CNN-based architectures) achieved the highest average predictive performance (mean R2 = 0.85; RMSE = 25 Mg C ha⁻1), especially in structurally heterogeneous tropical forests.
  • Machine learning methods such as Random Forest and Gradient Boosting also exhibited strong predictive power (mean R2 = 0.78) while maintaining moderate data requirements and reasonable interpretability.
  • Empirical regression models, despite their simplicity and high transparency, tended to have lower predictive performance, particularly in high-biomass environments prone to signal saturation.
  • Process-based models demonstrated moderate performance (mean R2 = 0.66), reflecting their strength in simulating ecosystem processes but also the challenges associated with parameter calibration and spatial heterogeneity.
This meta-analysis provides empirical evidence supporting the growing preference for machine learning and deep learning approaches in forest carbon monitoring. However, it also highlights the importance of balancing predictive accuracy with model interpretability, operational scalability, and ground-truth data availability, particularly in policy-driven applications such as REDD+ MRV and national GHG inventories.

5. Application Layer: Forest Carbon Monitoring Under Policy Frameworks

To operationalize forest carbon monitoring for REDD+ MRV, national greenhouse gas inventory (GHGI) submissions, and voluntary carbon markets, a systematic end-to-end workflow is required. Figure 4 illustrates the integrated workflow, from multi-source data acquisition and fusion through spatial carbon modeling and final policy interface aggregation.

5.1. REDD+ Monitoring and MRV Mechanisms

Effective Measurement, Reporting, and Verification (MRV) systems are essential for implementing REDD+ initiatives under the UNFCCC. However, ensuring transparency, consistency, and credibility of reported emission reductions across diverse national contexts remains a major challenge [13,79].
Remote sensing and GIS-based approaches have become the foundation of REDD+ MRV systems. Countries such as Brazil, Guyana, and Colombia employ wall-to-wall satellite monitoring—using Landsat, Sentinel-2, and LiDAR—to derive deforestation rates, biomass estimates, and Forest Reference Emission Levels (FRELs) [4,80,81]. Programs like FCPF and UN-REDD have supported over 50 countries in operationalizing geospatial workflows, often combining optical imagery, radar backscatter, and field plot calibration [81].
These systems enable consistent, spatially explicit carbon accounting, underpinning result-based financing. Brazil’s use of PRODES deforestation data and national biomass models supported over USD 3 billion in REDD+ payments [4,82]. Remote sensing also facilitates independent verification, enhancing the credibility and legitimacy of REDD+ claims.

5.2. National and Regional Case Studies

5.2.1. Brazil: Integration of Remote Sensing into REDD+ Accounting

Brazil required a robust, transparent forest monitoring system to operationalize its REDD+ commitments and receive performance-based payments.
Since 2004, Brazil’s PRODES program has used Landsat-class imagery to produce annual deforestation maps. Recently, GEDI LiDAR, Sentinel-1 SAR, and Sentinel-2 optical data have been fused to generate high-resolution aboveground biomass (AGB) maps [82].
This system allowed Brazil to report a net carbon sink of −0.18 ± 0.06 Pg C yr⁻1 for the Amazon, facilitating substantial REDD+ financing. The country’s success provides a global benchmark for integrating remote sensing into national MRV frameworks.

5.2.2. Congo Basin: Overcoming Data Scarcity

The Congo Basin faces persistent data gaps due to limited field plots, cloud cover, and logistical constraints. Researchers developed pan-African biomass models combining ALOS PALSAR, MODIS VIs, and GEDI footprint calibration [78]. Updated biomass and carbon stock maps have been generated despite ground data scarcity.
These refined estimates supported Congo Basin countries’ REDD+ submissions under CAFI, highlighting the critical role of remote sensing in filling MRV data gaps in tropical forests [78,83].

5.2.3. Indonesia: Forest Monitoring for REDD+ and Private Commitments

Indonesia aimed to reduce deforestation while monitoring extensive tropical forest landscapes prone to peatland degradation. Indonesia established the Sadewa early warning system, using Sentinel-1/2 and Landsat imagery to track land cover change in near-real time. High-carbon stock (HCS) mapping and peatland integrity monitoring were integrated into national and project-level MRV [79].
The system enabled compliance with REDD+ conditional financing and supported corporate “zero-deforestation” supply chain verification. Integration of satellite alerts into enforcement reduced illegal logging in several provinces.

5.3. Carbon Markets and Zero-Deforestation Supply Chains

Corporate climate pledges and voluntary carbon markets require credible, spatially explicit measurement of forest carbon emissions and removals.
Remote sensing underpins the verification of carbon credits by mapping baseline deforestation risks and monitoring project-level interventions. High-resolution UAV, LiDAR, and multispectral imagery are commonly used to establish counterfactual baselines and demonstrate avoided emissions [4,84]. Platforms like Global Forest Watch support real-time monitoring for supply chain compliance.
Geospatial MRV enables validation under standards such as the Verified Carbon Standard (VCS) and Climate, Community and Biodiversity Alliance (CCBA). It also underpins corporate “zero-deforestation” pledges, ensuring transparency in palm oil, soy, and timber supply chains [84,85]. Remote sensing is thus central to enhancing investor confidence and ensuring environmental integrity in forest carbon markets.

5.4. Smart Forestry and Digital Carbon Systems

Traditional forest monitoring methods are often slow, labor-intensive, and insufficient for real-time carbon management, limiting adaptive interventions. Smart forestry integrates Internet of Things (IoT) ground sensors, UAV remote sensing, and AI-driven analytics into digital forest management platforms [86]. IoT devices measure tree growth, microclimate, and CO2 fluxes, UAV LiDAR and hyperspectral imaging capture high-resolution structure and species composition. These data streams feed into “digital twin” forest models that simulate management scenarios and carbon trajectories.
Smart forestry systems enable near-real-time disturbance detection, site-specific interventions, and transparent carbon accounting [86]. Community participation through mobile-GIS apps strengthens ground-truthing and participatory MRV. Emerging blockchain applications even allow micro-payments based on verified incremental carbon sequestration. Overall, smart forestry advances dynamic, scalable carbon monitoring aligned with climate neutrality goals [86,87].

6. Challenges and Future Perspectives

6.1. Data Heterogeneity and Lack of Standardization

Forest carbon monitoring increasingly depends on multi-source remote sensing integration, but differences in resolution, data format, sensor calibration, and preprocessing remain major challenges [25,88]. Inconsistencies in atmospheric correction, speckle filtering, and geolocation introduce artifacts unrelated to true forest changes. Efforts like CEOS ARD standards and GFOI guidelines have improved harmonization, but cannot fully resolve discrepancies across optical, SAR, and LiDAR sources [89]. Structural differences and definitional variability further complicate integration [13,78].
Promoting open metadata standards, cross-sensor calibration, and standardized biomass estimation protocols is essential. Establishing cloud-based preprocessing pipelines and encouraging adherence to unified methodological frameworks can significantly enhance global comparability of carbon monitoring results.

6.2. Limited Model Generalizability and Field Validation Deficiency

Models trained in specific ecological or geographical contexts often perform poorly when transferred elsewhere, due to differences in forest structure, species composition, and remote sensing signal behavior [90,91].
Pan-tropical models show consistent regional biases, with large variation in wood density and canopy structure even within continents. Limited field plots and inconsistent inventory methods further constrain reliable calibration and validation [13,38,78]. Advances such as domain adaptation and contextual covariate integration are promising [30,45]. Improving model reliability across scales requires expanding harmonized plot networks, increasing remeasurement frequency, and using airborne LiDAR as a calibration surrogate.
To improve model generalizability and reduce biases, future research should focus on standardized, multi-biome field validation networks. Small-scale validation should combine UAV-LiDAR and ground plots in tropical and temperate forests, with seasonal alignment to capture phenological changes. These efforts would enable systematic calibration of satellite-based biomass models and reduce uncertainties in cross-continental carbon assessments.

6.3. High-Resolution Data Access: Cost and Temporal Constraints

High-resolution imagery provides superior spatial detail but remains costly and logistically challenging for broad-scale, continuous forest carbon monitoring [86]. One-off LiDAR acquisitions are common, while systematic, high-frequency updates are rare due to financial, technical, and institutional constraints. In contrast, freely available datasets like Landsat and Sentinel offer regular coverage but insufficient detail for detecting subtle disturbances [92,93]. Hybrid approaches that combine national-scale moderate-resolution mapping with targeted high-resolution sampling are increasingly used. Expanding open-access policies and building data analysis capacity in low-income regions are essential to support equitable monitoring.
The integration of satellite, UAV, and ground-based sensor networks forms a dynamic, multi-scale forest carbon monitoring system capable of real-time biomass estimation and flux attribution. Figure 5 illustrates the conceptual workflow of this integrated monitoring framework, from satellite observations to ground-based CO2 flux measurements, culminating in real-time carbon forecasting capabilities.

6.4. Future Directions: Toward Intelligent, Integrated Carbon Monitoring

Facing the above challenges, future research and operational development are converging along three main pathways:

6.4.1. Cloud Platforms and Automated Monitoring

Cloud computing ecosystems like Google Earth Engine and SEPAL have revolutionized data accessibility and processing efficiency [48,80]. Future MRV systems will increasingly rely on cloud-native infrastructures, enabling near-real-time biomass tracking and standardized workflows for national inventories.

6.4.2. AI-Augmented Ecological Modeling

Artificial intelligence offers unprecedented opportunities for enhancing process-based models, real-time disturbance detection, and adaptive forest management optimization [94,95]. Hybrid systems combining ecological constraints with machine learning flexibility will drive next-generation carbon forecasting and scenario planning.

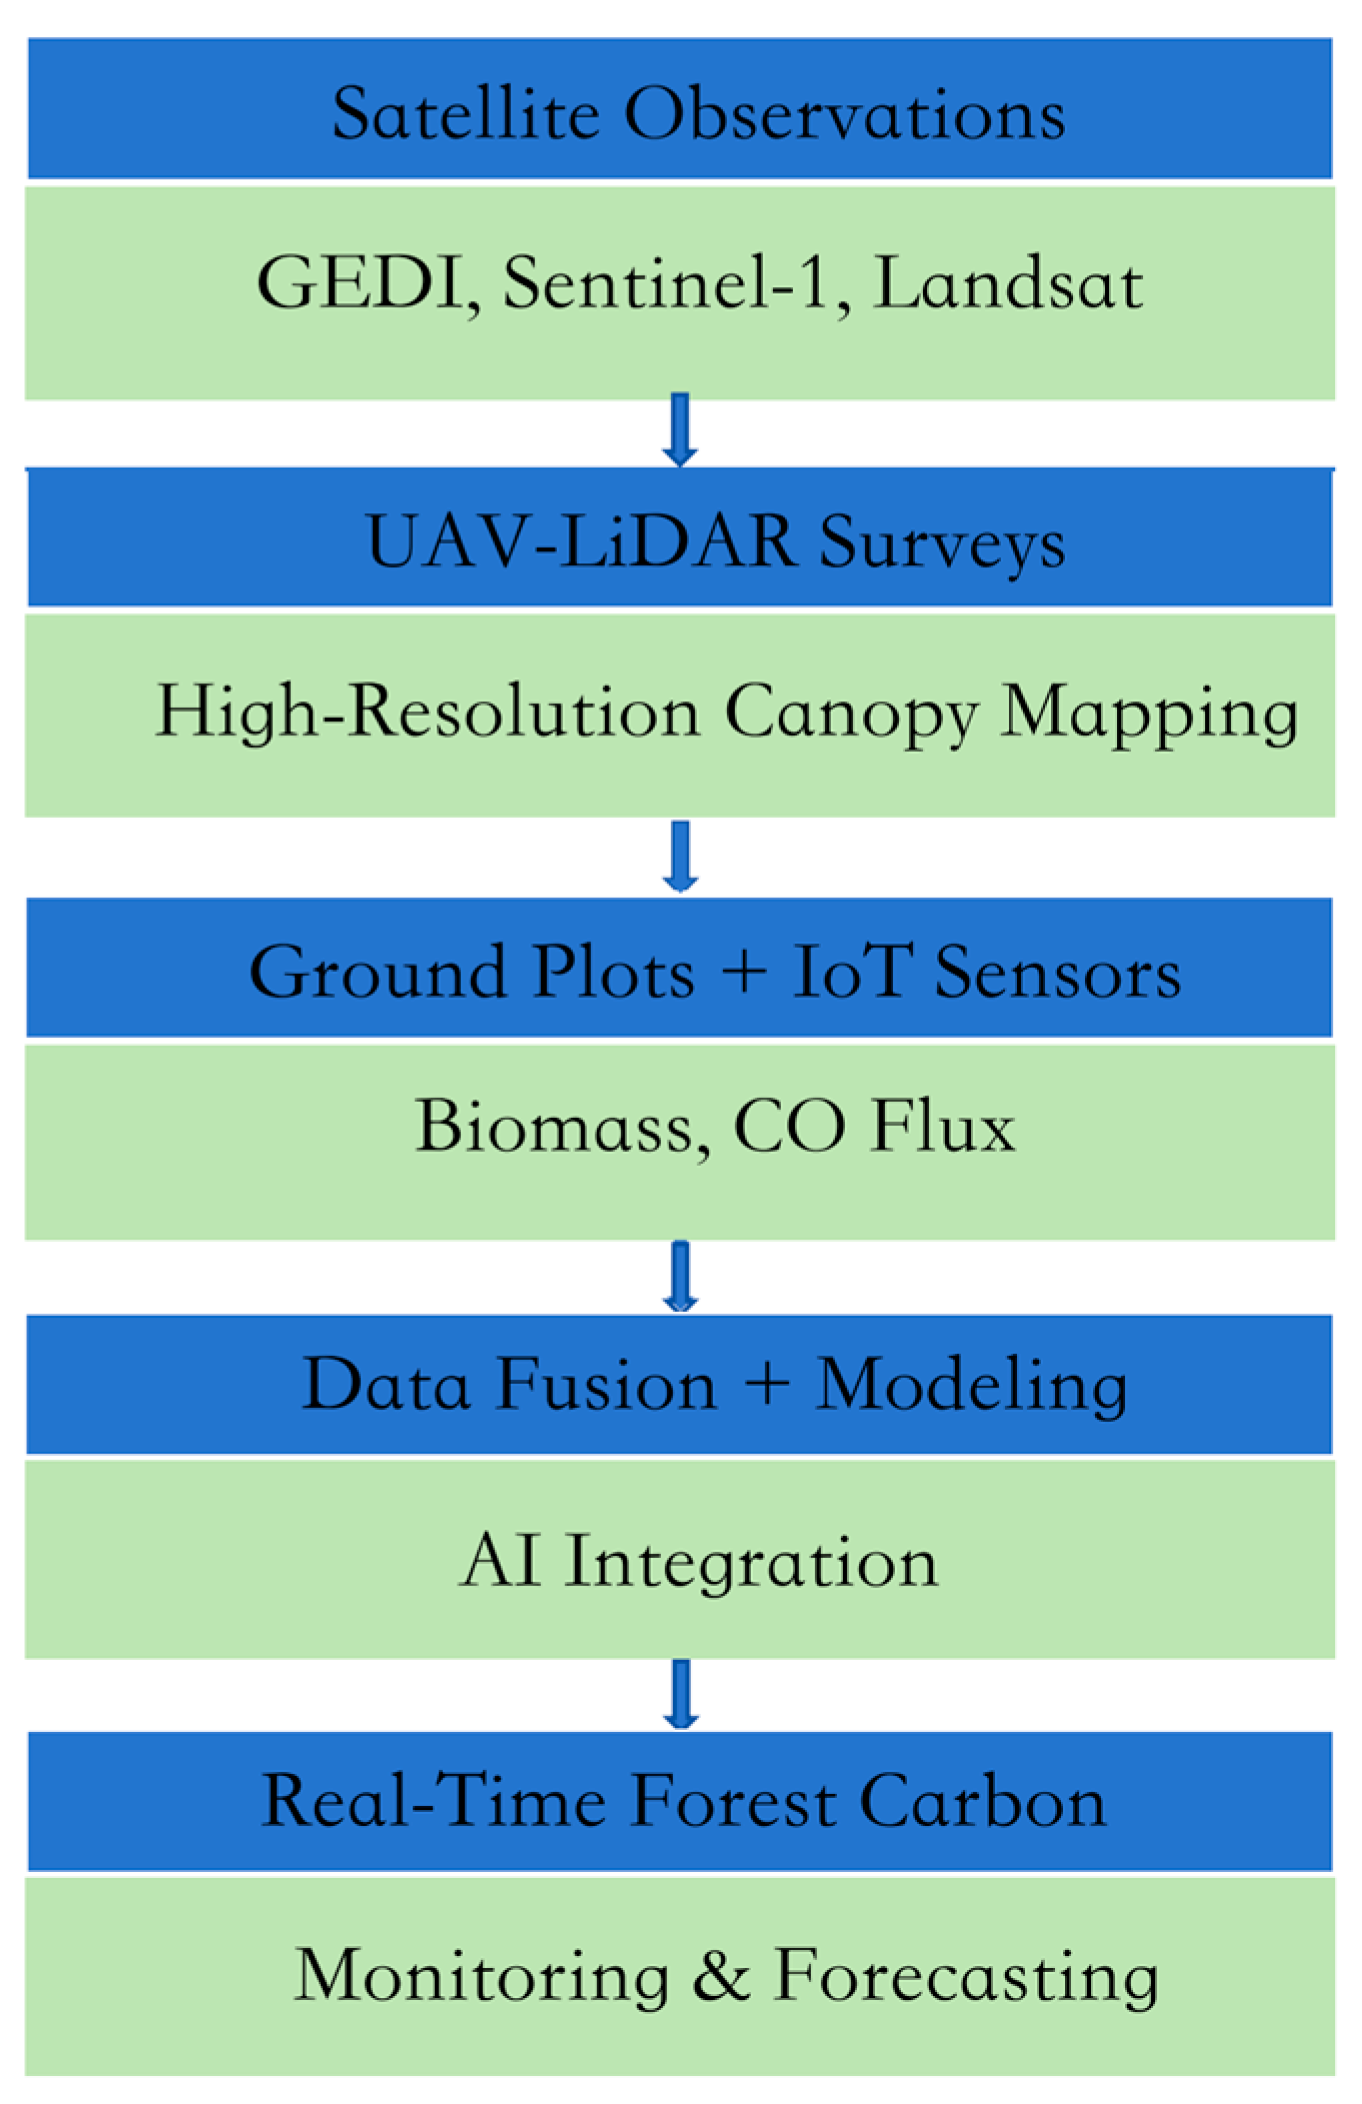
6.4.3. Integrated Sky-to-Ground Networks

A comprehensive carbon monitoring framework will integrate satellite, UAV, and ground-based sensor data into dynamic, multi-scale networks [96,97]. Fusion of remote sensing and in situ CO2 flux measurements will enable more accurate detection, attribution, and forecasting of forest carbon dynamics under changing climate regimes.
As forest carbon monitoring systems evolve toward greater intelligence, integration, and operational scalability, several research frontiers emerge as critical priorities. Key priorities include advancing AI-assisted modeling, enabling real-time biomass tracking, scaling high-resolution MRV systems efficiently, and integrating satellite, UAV, and ground observations.
Table 9 summarizes the key research questions, methodological approaches, and critical data needs associated with each frontier. This synthesis aims to guide future efforts in developing next-generation carbon monitoring systems aligned with climate neutrality objectives.

6.4.4. Monitoring Belowground Carbon: Emerging Opportunities from New Satellite Missions

Belowground carbon pools, comprising root biomass and soil organic carbon (SOC), represent a substantial yet poorly constrained component of forest carbon stocks. Recent advances in satellite remote sensing offer new pathways for improving belowground carbon monitoring at regional to global scales.
The Soil Moisture Active Passive (SMAP) mission provides global measurements of surface soil moisture with ~9 km resolution and frequent revisit times. Soil moisture data, combined with Sentinel-1 backscatter or VOD products, can indirectly indicate soil carbon dynamics. Empirical and machine learning models link soil moisture changes, vegetation productivity, and SOC stocks, especially in regions with limited field data.
For example, Hu et al. (2022) [98] demonstrated that fusing SMAP soil moisture and Sentinel-1 C-band radar data enabled regional mapping of soil organic carbon density across boreal and temperate ecosystems, with uncertainties comparable to ground-based surveys. Their approach involved training random forest models using soil moisture indices, radar backscatter metrics, and ancillary covariates against harmonized SOC inventories.
The upcoming BIOMASS satellite mission, equipped with long-wavelength P-band SAR, will further enhance sensitivity to woody biomass and, potentially, sub-canopy soil moisture variations. Its high penetration capability may indirectly assist in constraining belowground carbon pools when combined with surface observations.
Integrating multi-source remote sensing datasets, including SMAP, Sentinel-1, BIOMASS, and optical indices, offers a promising framework for belowground carbon monitoring. However, uncertainties remain high, especially regarding the spatial transferability of models and the temporal stability of SOC estimates. Future research should focus on developing standardized calibration datasets, validating satellite-derived SOC estimates within situ measurements, and improving model interpretability across forest types.

6.4.5. Uncertainty Management in REDD+ Carbon Credit Issuance

In REDD+ carbon accounting, managing model uncertainty is essential for environmental integrity and market credibility. Biomass estimation errors from data fusion, allometric model variation, and sampling inconsistencies can cause over- or underestimation of emission reductions. Without appropriate adjustments, these uncertainties pose significant risks for over-crediting, which undermines the credibility of REDD+ projects and carbon markets.
To mitigate these risks, several mechanisms have been adopted in existing standards: (1) Conservative Discount Factors: Many REDD+ methodologies apply a conservative discount to the estimated emission reductions based on quantified uncertainty. For instance, the Verified Carbon Standard (VCS) recommends that projects with higher levels of uncertainty apply a larger deduction from the credited amount, proportionate to the confidence interval width. (2) Uncertainty Adjustment Mechanisms: Some frameworks explicitly model uncertainty during the monitoring process and dynamically adjust credited carbon quantities based on observed variability. Probabilistic models, Monte Carlo simulations, and Bayesian updating approaches have been proposed to more systematically integrate uncertainty into credit issuance. (3) Buffer Pools and Risk Mitigation Accounts: In addition to direct deductions, REDD+ systems often require a percentage of credits to be set aside in buffer pools as insurance against unforeseen risks, including methodological uncertainties and natural disturbances.
Incorporating these practices into national and project-level MRV systems enhances transparency, incentivizes continuous improvement in monitoring methodologies, and builds market trust. Future work should focus on standardizing uncertainty quantification protocols across projects and harmonizing discounting procedures to ensure equitable treatment of forest carbon assets.
Priority research directions include (1) operationalizing cloud-native biomass monitoring pipelines; (2) embedding AI into ecological modeling frameworks; (3) developing coordinated sky-to-ground observation networks; and (4) expanding globally harmonized field validation datasets. Targeted investments in these areas are crucial to achieving scalable, credible, and policy-relevant forest carbon monitoring systems.

7. Conclusions

Growing demand for credible, scalable carbon monitoring is reshaping data collection, modeling, and application frameworks. This review integrates multi-source remote sensing, GIS-based spatial modeling, and artificial intelligence into a unified architecture tailored to carbon neutrality objectives. By synthesizing recent advances across optical, radar, LiDAR, and machine learning platforms, we illustrate how observational innovation and modeling sophistication are converging to deliver dynamic, high-resolution carbon assessments.
Yet, significant challenges remain. Data standardization across sensors, model transferability across biomes, and the high costs of very high resolution monitoring still constrain operational deployment at global scales. Bridging these gaps demands a shift towards AI-augmented ecological modeling, real-time monitoring infrastructures, and integrated sky-to-ground observation networks.
Achieving the next generation of forest carbon monitoring will require not only technical innovation but also coordinated global investment in open data ecosystems, validation networks, and cross-disciplinary research. As forests stand at the nexus of climate stability, biodiversity conservation, and sustainable development, building robust, transparent, and scalable carbon monitoring systems is no longer optional—it is imperative.
While we acknowledge the complementary nature of current approaches, three methodological controversies deserve an explicit stance. First, we contend that ensemble tree methods (RF/GBM) provide the best operational trade-off between accuracy and transparency; deep neural networks should be reserved for situations in which incremental gains justify substantial GPU cost and diminished interpretability. Second, LiDAR-sparse fusion is preferable to wall-to-wall LiDAR for national MRV, because marginal accuracy gains (<5 Mg ha⁻1 RMSE) rarely offset the ten-fold increase in acquisition expense. Third, cloud-exclusive workflows risk vendor lock-in; we therefore recommend containerized, cloud-agnostic pipelines that can be redeployed on national infrastructure. Adopting these positions moves the field beyond consensus statements and toward concrete, cost-aware decision rules for practitioners.

Author Contributions

Conceptualization, X.L. and S.Y.; methodology, X.L.; software, X.L.; validation, X.L., S.Y., and B.M.; formal analysis, X.L.; investigation, X.L.; resources, X.L.; data curation, X.L.; writing—original draft preparation, X.L.; writing—review and editing, X.L., S.Y., B.M., X.W., C.Y., C.S., and J.D.; visualization, X.L.; supervision, S.Y.; project administration, S.Y.; funding acquisition, S.Y. All authors have read and agreed to the published version of the manuscript.

Funding

This article was funded by the Heilongjiang Provincial Natural Science Foundation of China (LH2023C066). Harbin City Science and Technology Plan Self-ra Project (ZC2023ZJ001004).

Data Availability Statement

Data are available through request to the corresponding author.

Conflicts of Interest

The authors declare no conflicts of interest.

Abbreviations

The following abbreviations are used in this manuscript:
MRVMeasurement, reporting, and verification
UAVUnmanned Aerial Vehicle
SFMStructure from Motion
CHMCanopy Height Model
CMSCarbon monitoring system
NDVINormalized Difference Vegetation Index
EVIEnhanced Vegetation Index
NDWINormalized Difference Water Index
SRTMShuttle Radar Topography Mission
InSARInterferometric Synthetic Aperture Radar
DEMDigital Elevation Model
SMOSSoil Moisture and Ocean Salinity
VIIRSVisible Infrared Imaging Radiometer Suite
FRELForest Reference Emission Level
CAFICentral African Forest Initiative
FCPFForest Carbon Partnership Facility
GEEGoogle Earth Engine
SEPALSystem for Earth Observation Data Access, Processing and Analysis for Land Monitoring
NFINational Forest Inventory
IoTInternet of Things
SOCSoil-organic carbon
EBKEmpirical Bayesian Kriging
CNNConvolutional Neural Network
LSTMLong Short-Term Memory
SVMSupport Vector Machine
kNNk-Nearest Neighbors
MARSMultivariate Adaptive Regression Splines
GEDIGlobal Ecosystem Dynamics Investigation
HCSHigh-carbon-stock
VCSVerified Carbon Standard
VISTIRVisible (spectral range)Thermal infrared
GBMGradient Boosting Machine
REDDReducing Emissions from Deforestation and Forest Degradation
SARSynthetic Aperture Radar
LiDARLight Detection and Ranging
GPUGraphics Processing Unit
VODVegetation Optical Depth
SMAPSoil Moisture Active Passive
RFRandom Forest
ALSAirborne LiDAR scanning

References

  1. Yoro, K.O.; Daramola, M.O. Chapter 1—CO2 emission sources, greenhouse gases, and the global warming effect. In Advances in Carbon Capture; Rahimpour, M.R., Farsi, M., Makarem, M.A., Eds.; Woodhead Publishing: Cambridge, UK, 2020; pp. 3–28. [Google Scholar]
  2. Pan, Y.; Birdsey, R.A.; Fang, J.; Houghton, R.; Kauppi, P.E.; Kurz, W.A.; Phillips, O.L.; Shvidenko, A.; Lewis, S.L.; Canadell, J.G.; et al. A Large and Persistent Carbon Sink in the World’s Forests. Science 2011, 333, 988–993. [Google Scholar] [CrossRef] [PubMed]
  3. Dye, A.W.; Houtman, R.M.; Gao, P.; Anderegg, W.R.L.; Fettig, C.J.; Hicke, J.A.; Kim, J.B.; Still, C.J.; Young, K.; Riley, K.L. Carbon, climate, and natural disturbance: A review of mechanisms, challenges, and tools for understanding forest carbon stability in an uncertain future. Carbon Balance Manag. 2024, 19, 35. [Google Scholar] [CrossRef] [PubMed]
  4. Friedlingstein, P.; O’sullivan, M.; Jones, M.W.; Andrew, R.M.; Hauck, J.; Landschützer, P.; Le Quéré, C.; Li, H.; Luijkx, I.T.; Olsen, A. Global carbon budget 2024. Earth Syst. Sci. Data Discuss. 2025, 17, 965–1039. [Google Scholar] [CrossRef]
  5. Khanna, J.; Medvigy, D.; Fueglistaler, S.; Walko, R. Regional dry-season climate changes due to three decades of Amazonian deforestation. Nat. Clim. Change 2017, 7, 200–204. [Google Scholar] [CrossRef]
  6. Anderegg, W.R.L.; Trugman, A.T.; Badgley, G.; Anderson, C.M.; Bartuska, A.; Ciais, P.; Cullenward, D.; Field, C.B.; Freeman, J.; Goetz, S.J.; et al. Climate-driven risks to the climate mitigation potential of forests. Science 2020, 368, eaaz7005. [Google Scholar] [CrossRef]
  7. Cook-Patton, S.C.; Leavitt, S.M.; Gibbs, D.; Harris, N.L.; Lister, K.; Anderson-Teixeira, K.J.; Briggs, R.D.; Chazdon, R.L.; Crowther, T.W.; Ellis, P.W.; et al. Mapping carbon accumulation potential from global natural forest regrowth. Nature 2020, 585, 545–550. [Google Scholar] [CrossRef]
  8. Trugman, A.T.; Quetin, G.R. Leveraging Uncertainty in Terrestrial Ecosystem Carbon Stocks and Fluxes. Earth’s Future 2023, 11, e2022EF003322. [Google Scholar] [CrossRef]
  9. Cho, S.; Baral, S.; Burlakoti, D. Afforestation/Reforestation and Avoided Conversion Carbon Projects in the United States. Forests 2025, 16, 115. [Google Scholar] [CrossRef]
  10. Malhi, Y.; Meir, P.; Brown, S. Forests, carbon and global climate. Philosophical Transactions of the Royal Society of London. Ser. A Math. Phys. Eng. Sci. 2002, 360, 1567–1591. [Google Scholar] [CrossRef]
  11. Bossy, T.; Ciais, P.; Renaudineau, S.; Wan, L.; Ygorra, B.; Adam, E.; Barbier, N.; Bauters, M.; Delbart, N.; Frappart, F.; et al. State of the art in remote sensing monitoring of carbon dynamics in African tropical forests. Front. Remote Sens. 2025, 6, 1532280. [Google Scholar] [CrossRef]
  12. Musselman, R.C.; Fox, D.G. A Review of the Role of Temperate Forests in the Global CO2 Balance. J. Air Waste Manag. Assoc. 1991, 41, 798–807. [Google Scholar] [CrossRef]
  13. Bloom, A.A.; Exbrayat, J.-F.; van der Velde, I.R.; Feng, L.; Williams, M. The decadal state of the terrestrial carbon cycle: Global retrievals of terrestrial carbon allocation, pools, and residence times. Proc. Natl. Acad. Sci. USA 2016, 113, 1285–1290. [Google Scholar] [CrossRef]
  14. Shannon, E.; Finley, A.; May, P.; Domke, G.; Andersen, H.-E.; Gaines, G.C., III; Nothdurft, A.; Banerjee, S. Leveraging national forest inventory data to estimate forest carbon density status and trends for small areas. arXiv 2025, arXiv:2503.08653. [Google Scholar]
  15. Nguyen, A.; Saha, S. Machine Learning and Multi-source Remote Sensing in Forest Carbon Stock Estimation: A Review. arXiv 2024, arXiv:2411.17624. [Google Scholar]
  16. Xie, X.; Wang, Q.; Dai, L.; Su, D.; Wang, X.; Qi, G.; Ye, Y. Application of China’s National Forest Continuous Inventory Database. Environ. Manag. 2011, 48, 1095–1106. [Google Scholar] [CrossRef]
  17. Fang, J.; Chen, A.; Peng, C.; Zhao, S.; Ci, L. Changes in Forest Biomass Carbon Storage in China Between 1949 and 1998. Science 2001, 292, 2320–2322. [Google Scholar] [CrossRef]
  18. Magerl, A.; Le Noë, J.; Erb, K.-H.; Bhan, M.; Gingrich, S. A comprehensive data-based assessment of forest ecosystem carbon stocks in the US 1907–2012. Environ. Res. Lett. 2019, 14, 125015. [Google Scholar] [CrossRef]
  19. Navalgund, R.R.; Jayaraman, V.; Roy, P. Remote sensing applications: An overview. Curr. Sci. 2007, 93, 1747–1766. [Google Scholar]
  20. Gong, Z.; Ge, W.; Guo, J.; Liu, J. Satellite remote sensing of vegetation phenology: Progress, challenges, and opportunities. ISPRS J. Photogramm. Remote Sens. 2024, 217, 149–164. [Google Scholar] [CrossRef]
  21. Goetz, S.; Dubayah, R. Advances in remote sensing technology and implications for measuring and monitoring forest carbon stocks and change. Carbon Manag. 2011, 2, 231–244. [Google Scholar] [CrossRef]
  22. Liu, Z.; Peng, C.; Work, T.; Candau, J.-N.; DesRochers, A.; Kneeshaw, D. Application of machine-learning methods in forest ecology: Recent progress and future challenges. Environ. Rev. 2018, 26, 339–350. [Google Scholar] [CrossRef]
  23. Zhao, Q.; Yu, S.; Zhao, F.; Tian, L.; Zhao, Z. Comparison of machine learning algorithms for forest parameter estimations and application for forest quality assessments. For. Ecol. Manag. 2019, 434, 224–234. [Google Scholar] [CrossRef]
  24. Dong, W.; Mitchard, E.; Chen, Y.; Chen, M.; Cao, C.; Hu, P.; Xu, C.; Hancock, S. Comparing remote sensing-based forest biomass mapping approaches using new forest inventory plots in contrasting forests in northeastern and southwestern China. arXiv 2024, arXiv:2405.15438. [Google Scholar]
  25. Panda, S.S.; Rao, M.N.; Thenkabail, P.S.; Misra, D.; Fitzgerald, J.P. Remote sensing systems—Platforms and sensors: Aerial, satellite, UAV, optical, radar, and LiDAR. In Remote Sensing Handbook; CRC Press: Boca Raton, FL, USA, 2016; Volume I, pp. 3–86. [Google Scholar]
  26. Teillet, P.M.; Staenz, K.; William, D.J. Effects of spectral, spatial, and radiometric characteristics on remote sensing vegetation indices of forested regions. Remote Sens. Environ. 1997, 61, 139–149. [Google Scholar] [CrossRef]
  27. Gao, S.; Yan, K.; Liu, J.; Pu, J.; Zou, D.; Qi, J.; Mu, X.; Yan, G. Assessment of remote-sensed vegetation indices for estimating forest chlorophyll concentration. Ecol. Indic. 2024, 162, 112001. [Google Scholar] [CrossRef]
  28. Mutanga, O.; Shoko, C.; Adelabu, S.; Bangira, T. Remote sensing of aboveground forest biomass: A review. Trop. Ecol. 2016, 57, 125–132. [Google Scholar]
  29. Li, D.; Mi, W.; Jiang, J. China’s high-resolution optical remote sensing satellites and their mapping applications. Geo-Spat. Inf. Sci. 2021, 24, 85–94. [Google Scholar] [CrossRef]
  30. Mura, M.D.; Prasad, S.; Pacifici, F.; Gamba, P.; Chanussot, J.; Benediktsson, J.A. Challenges and Opportunities of Multimodality and Data Fusion in Remote Sensing. Proc. IEEE 2015, 103, 1585–1601. [Google Scholar] [CrossRef]
  31. ElMasry, G.; Sun, D.-W. CHAPTER 1—Principles of Hyperspectral Imaging Technology. In Hyperspectral Imaging for Food Quality Analysis and Control; Sun, D.-W., Ed.; Academic Press: San Diego, CA, USA, 2010; pp. 3–43. [Google Scholar]
  32. Priyanka; Rajat; Musthafa, M.; Avtar, R.; Singh, G. Forest Biomass Estimation Using S-Band SAR and Lidar Data. In Proceedings of the IGARSS 2024—2024 IEEE International Geoscience and Remote Sensing Symposium, Athens, Greece, 7–12 July 2024; pp. 4495–4498. [Google Scholar]
  33. Tian, X.; Li, J.; Zhang, F.; Zhang, H.; Jiang, M. Forest Aboveground Biomass Estimation Using Multisource Remote Sensing Data and Deep Learning Algorithms: A Case Study over Hangzhou Area in China. Remote Sens. 2024, 16, 1074. [Google Scholar] [CrossRef]
  34. Bioucas-Dias, J.M.; Plaza, A.; Camps-Valls, G.; Scheunders, P.; Nasrabadi, N.; Chanussot, J. Hyperspectral Remote Sensing Data Analysis and Future Challenges. IEEE Geosci. Remote Sens. Mag. 2013, 1, 6–36. [Google Scholar] [CrossRef]
  35. Xu, W.; Cheng, Y.; Luo, M.; Mai, X.; Wang, W.; Zhang, W.; Wang, Y. Progress and Limitations in Forest Carbon Stock Estimation Using Remote Sensing Technologies: A Comprehensive Review. Forests 2025, 16, 449. [Google Scholar] [CrossRef]
  36. Shiney, S.; Geetha, R. Estimation of Above Ground Biomass Using Machine Learning and Deep Learning Algorithms: A Review. In International Conference on Advances in Artificial Intelligence and Machine Learning in Big Data Processinging; Springer Nature: Cham, Switzerland, 2024; pp. 181–196. [Google Scholar]
  37. Li, C.; Li, M.; Liu, J.; Li, Y.; Dai, Q. Comparative Analysis of Seasonal Landsat 8 Images for Forest Aboveground Biomass Estimation in a Subtropical Forest. Forests 2020, 11, 45. [Google Scholar] [CrossRef]
  38. Verly, O.M.; Vieira Leite, R.; da Silva Tavares-Junior, I.; José Silva Soares da Rocha, S.; Garcia Leite, H.; Marinaldo Gleriani, J.; Paula Miranda Xavier Rufino, M.; de Fatima Silva, V.; Moreira Miquelino Eleto Torres, C.; Plata-Rueda, A.; et al. Atlantic forest woody carbon stock estimation for different successional stages using Sentinel-2 data. Ecol. Indic. 2023, 146, 109870. [Google Scholar] [CrossRef]
  39. Sinha, S.; Jeganathan, C.; Sharma, L.K.; Nathawat, M.S. A review of radar remote sensing for biomass estimation. Int. J. Environ. Sci. Technol. 2015, 12, 1779–1792. [Google Scholar] [CrossRef]
  40. Thenkabail, P.S.; Lyon, J.G.; Huete, A. Advances in hyperspectral remote sensing of vegetation and agricultural crops. In Fundamentals, Sensor Systems, Spectral Libraries, and Data Mining for Vegetation; CRC Press: Boca Raton, FL, USA, 2018; pp. 3–37. [Google Scholar]
  41. Treuhaft, R.N.; Law, B.E.; Asner, G.P. Forest Attributes from Radar Interferometric Structure and Its Fusion with Optical Remote Sensing. BioScience 2004, 54, 561–571. [Google Scholar] [CrossRef]
  42. Beaudoin, A.; Toan, L.T.; Goze, S.; Nezry, E.; Lopes, A.; Mougin, E.; Hsu, C.C.; Han, H.C.; Kong, J.A.; Shin, R.T. Retrieval of forest biomass from SAR data. Int. J. Remote Sens. 1994, 15, 2777–2796. [Google Scholar] [CrossRef]
  43. Ometto, J.P.; Gorgens, E.B.; de Souza Pereira, F.R.; Sato, L.; de Assis, M.L.R.; Cantinho, R.; Longo, M.; Jacon, A.D.; Keller, M. A biomass map of the Brazilian Amazon from multisource remote sensing. Sci. Data 2023, 10, 668. [Google Scholar] [CrossRef] [PubMed]
  44. Li, X.; Peng, Q.; Shen, R.; Xu, W.; Qin, Z.; Lin, S.; Ha, S.; Kong, D.; Yuan, W. Long-term reconstructed vegetation index dataset in China from fused MODIS and Landsat data. Sci. Data 2025, 12, 152. [Google Scholar] [CrossRef]
  45. Luo, M.; Anees, S.A.; Huang, Q.; Qin, X.; Qin, Z.; Fan, J.; Han, G.; Zhang, L.; Shafri, H.Z.M. Improving Forest Above-Ground Biomass Estimation by Integrating Individual Machine Learning Models. Forests 2024, 15, 975. [Google Scholar] [CrossRef]
  46. Sun, X.; Li, G.; Wu, Q.; Ruan, J.; Li, D.; Lu, D. Mapping Forest Carbon Stock Distribution in a Subtropical Region with the Integration of Airborne Lidar and Sentinel-2 Data. Remote Sens. 2024, 16, 3847. [Google Scholar] [CrossRef]
  47. Jiang, W.; Zhang, L.; Zhang, X.; Gao, S.; Gao, H.; Sun, L.; Yan, G. Multi-Decision Vector Fusion Model for Enhanced Mapping of Aboveground Biomass in Subtropical Forests Integrating Sentinel-1, Sentinel-2, and Airborne LiDAR Data. Remote Sens. 2025, 17, 1285. [Google Scholar] [CrossRef]
  48. Gorelick, N.; Hancher, M.; Dixon, M.; Ilyushchenko, S.; Thau, D.; Moore, R. Google Earth Engine: Planetary-scale geospatial analysis for everyone. Remote Sens. Environ. 2017, 202, 18–27. [Google Scholar] [CrossRef]
  49. Yang, Q.; Su, Y.; Hu, T.; Jin, S.; Liu, X.; Niu, C.; Liu, Z.; Kelly, M.; Wei, J.; Guo, Q. Allometry-based estimation of forest aboveground biomass combining LiDAR canopy height attributes and optical spectral indexes. For. Ecosyst. 2022, 9, 100059. [Google Scholar] [CrossRef]
  50. Khan, M.N.; Tan, Y.; Gul, A.A.; Abbas, S.; Wang, J. Forest Aboveground Biomass Estimation and Inventory: Evaluating Remote Sensing-Based Approaches. Forests 2024, 15, 1055. [Google Scholar] [CrossRef]
  51. Khati, U.; Lavalle, M.; Shiroma, G.H.X.; Meyer, V.; Chapman, B. Assessment of Forest Biomass Estimation from Dry and Wet SAR Acquisitions Collected during the 2019 UAVSAR AM-PM Campaign in Southeastern United States. Remote Sens. 2020, 12, 3397. [Google Scholar] [CrossRef]
  52. Borsah, A.A.; Nazeer, M.; Wong, M.S. LIDAR-Based Forest Biomass Remote Sensing: A Review of Metrics, Methods, and Assessment Criteria for the Selection of Allometric Equations. Forests 2023, 14, 2095. [Google Scholar] [CrossRef]
  53. Jiang, X.; Li, G.; Lu, D.; Chen, E.; Wei, X. Stratification-Based Forest Aboveground Biomass Estimation in a Subtropical Region Using Airborne Lidar Data. Remote Sens. 2020, 12, 1101. [Google Scholar] [CrossRef]
  54. Chen, L.; Ren, C.; Zhang, B.; Wang, Z.; Xi, Y. Estimation of Forest Above-Ground Biomass by Geographically Weighted Regression and Machine Learning with Sentinel Imagery. Forests 2018, 9, 582. [Google Scholar] [CrossRef]
  55. Hu, Y.; Nie, Y.; Liu, Z.; Wu, G.; Fan, W. Improving the Potential of Coniferous Forest Aboveground Biomass Estimation by Integrating C- and L-Band SAR Data with Feature Selection and Non-Parametric Model. Remote Sens. 2023, 15, 4194. [Google Scholar] [CrossRef]
  56. Ali, N.; Khati, U. Forest Aboveground Biomass and Forest Height Estimation Over a Sub-tropical Forest Using Machine Learning Algorithm and Synthetic Aperture Radar Data. J. Indian Soc. Remote Sens. 2024, 52, 771–786. [Google Scholar] [CrossRef]
  57. Sillett, S.C.; Graham, M.E.; Montague, J.P.; Antoine, M.E.; Koch, G.W. Ground-based calibration for remote sensing of biomass in the tallest forests. For. Ecol. Manag. 2024, 561, 121879. [Google Scholar] [CrossRef]
  58. Kämäräinen, M.; Tuovinen, J.P.; Kulmala, M.; Mammarella, I.; Aalto, J.; Vekuri, H.; Lohila, A.; Lintunen, A. Spatiotemporal lagging of predictors improves machine learning estimates of atmosphere–forest CO2 exchange. Biogeosciences 2023, 20, 897–909. [Google Scholar] [CrossRef]
  59. Netsianda, A.; Mhangara, P. Aboveground biomass estimation in a grassland ecosystem using Sentinel-2 satellite imagery and machine learning algorithms. Environ. Monit. Assess. 2025, 197, 138. [Google Scholar] [CrossRef] [PubMed]
  60. Schratz, P.; Muenchow, J.; Iturritxa, E.; Richter, J.; Brenning, A. Performance evaluation and hyperparameter tuning of statistical and machine-learning models using spatial data. arXiv 2018, arXiv:1803.11266. [Google Scholar]
  61. Sivasankar, T.; Lone, J.; Sarma, K.K.; Qadir, A.; Raju, P.L.N. Estimation of Above Ground Biomass Using Support Vector Machines and ALOS/PALSAR data. Vietnam J. Earth Sci. 2019, 41, 95–104. [Google Scholar] [CrossRef]
  62. Wu, Z.; Yao, F.; Zhang, J.; Liu, H. Estimating Forest Aboveground Biomass Using a Combination of Geographical Random Forest and Empirical Bayesian Kriging Models. Remote Sens. 2024, 16, 1859. [Google Scholar] [CrossRef]
  63. Dong, L.; Du, H.; Han, N.; Li, X.; Zhu, D.e.; Mao, F.; Zhang, M.; Zheng, J.; Liu, H.; Huang, Z.; et al. Application of Convolutional Neural Network on Lei Bamboo Above-Ground-Biomass (AGB) Estimation Using Worldview-2. Remote Sens. 2020, 12, 958. [Google Scholar] [CrossRef]
  64. Oehmcke, S.; Li, L.; Revenga, J.C.; Nord-Larsen, T.; Trepekli, K.; Gieseke, F.; Igel, C. Deep learning based 3D point cloud regression for estimating forest biomass. In Proceedings of the 30th International Conference on Advances in Geographic Information Systems, Seattle, WA, USA, 1–4 November 2022; pp. 1–4. [Google Scholar]
  65. Wu, C.; Chen, K.; E, C.; You, X.; He, D.; Hu, L.; Liu, B.; Wang, R.; Shi, Y.; Li, C.; et al. Improved CASA model based on satellite remote sensing data: Simulating net primary productivity of Qinghai Lake basin alpine grassland. Geosci. Model Dev. 2022, 15, 6919–6933. [Google Scholar] [CrossRef]
  66. Wang, Q.; Watanabe, M.; Ouyang, Z. Simulation of water and carbon fluxes using BIOME-BGC model over crops in China. Agric. For. Meteorol. 2005, 131, 209–224. [Google Scholar] [CrossRef]
  67. Bai, Y.; Pang, Y.; Kong, D. Integrating remote sensing and 3-PG model to simulate the biomass and carbon stock of Larix olgensis plantation. For. Ecosyst. 2024, 11, 100213. [Google Scholar] [CrossRef]
  68. Niu, Z.; He, H.; Peng, S.; Ren, X.; Zhang, L.; Gu, F.; Zhu, G.; Peng, C.; Li, P.; Wang, J.; et al. A Process-Based Model Integrating Remote Sensing Data for Evaluating Ecosystem Services. J. Adv. Model. Earth Syst. 2021, 13, e2020MS002451. [Google Scholar] [CrossRef]
  69. Anish, K.C.; Bhattarai, S.; Pandey, P. A Comparison of Landsat-8 and Sentinel-2 spectral indices for estimating aboveground forest carbon in a community forest. For. J. Inst. For. Nepal 2023, 19, 40–55. [Google Scholar] [CrossRef]
  70. Fox, A.M.; Huo, X.; Hoar, T.J.; Dashti, H.; Smith, W.K.; MacBean, N.; Anderson, J.L.; Roby, M.; Moore, D.J.P. Assimilation of Global Satellite Leaf Area Estimates Reduces Modeled Global Carbon Uptake and Energy Loss by Terrestrial Ecosystems. J. Geophys. Res. Biogeosci. 2022, 127, e2022JG006830. [Google Scholar] [CrossRef]
  71. Carter, S.; Herold, M.; Jonckheere, I.G.C.; Espejo, A.B.; Green, C.; Wilson, S. Capacity Development for Use of Remote Sensing for REDD+ MRV Using Online and Offline Activities: Impacts and Lessons Learned. Remote Sens. 2021, 13, 2172. [Google Scholar] [CrossRef]
  72. Sa, R.; Fan, W. Estimation of Forest Parameters in Boreal Artificial Coniferous Forests Using Landsat 8 and Sentinel-2A. Remote Sens. 2023, 15, 3605. [Google Scholar] [CrossRef]
  73. Cutting, B.J.; Atzberger, C.; Gholizadeh, A.; Robinson, D.A.; Mendoza-Ulloa, J.; Marti-Cardona, B. Remote Quantification of Soil Organic Carbon: Role of Topography in the Intra-Field Distribution. Remote Sens. 2024, 16, 1510. [Google Scholar] [CrossRef]
  74. Zafar, Z.; Zubair, M.; Zha, Y.; Mehmood, M.S.; Rehman, A.; Fahd, S.; Nadeem, A.A. Predictive modeling of regional carbon storage dynamics in response to land use/land cover changes: An InVEST-based analysis. Ecol. Inform. 2024, 82, 102701. [Google Scholar] [CrossRef]
  75. Gong, W.; Duan, X.; Mao, M.; Hu, J.; Sun, Y.; Wu, G.; Zhang, Y.; Xie, Y.; Qiu, X.; Rao, X.; et al. Assessing the impact of land use and changes in land cover related to carbon storage by linking trajectory analysis and InVEST models in the Nandu River Basin on Hainan Island in China. Front. Environ. Sci. 2022, 10, 1038752. [Google Scholar] [CrossRef]
  76. Wadoux, A.M.J.-C.; Heuvelink, G.B.M. Uncertainty of spatial averages and totals of natural resource maps. Methods Ecol. Evol. 2023, 14, 1320–1332. [Google Scholar] [CrossRef]
  77. Hu, X.; Shi, L.; Lin, L.; Li, S.; Deng, X.; Li, L.; Bian, J.; Lian, X. A novel hybrid modelling framework for GPP estimation: Integrating a multispectral surface reflectance based Vcmax25 simulator into the process-based model. Sci. Total Environ. 2024, 921, 171182. [Google Scholar] [CrossRef]
  78. Avitabile, V.; Herold, M.; Heuvelink, G.B.M.; Lewis, S.L.; Phillips, O.L.; Asner, G.P.; Armston, J.; Ashton, P.S.; Banin, L.; Bayol, N.; et al. An integrated pan-tropical biomass map using multiple reference datasets. Glob. Change Biol. 2016, 22, 1406–1420. [Google Scholar] [CrossRef]
  79. Hargita, Y.; Günter, S.; Köthke, M. Brazil submitted the first REDD+ reference level to the UNFCCC—Implications regarding climate effectiveness and cost-efficiency. Land Use Policy 2016, 55, 340–347. [Google Scholar] [CrossRef]
  80. Hansen, M.C.; Potapov, P.V.; Moore, R.; Hancher, M.; Turubanova, S.A.; Tyukavina, A.; Thau, D.; Stehman, S.V.; Goetz, S.J.; Loveland, T.R.; et al. High-Resolution Global Maps of 21st-Century Forest Cover Change. Science 2013, 342, 850–853. [Google Scholar] [CrossRef]
  81. Hook, A.; Laing, T. The politics and performativity of REDD+ reference levels: Examining the Guyana-Norway agreement and its implications for ‘offsetting’ towards ‘net zero’. Environ. Sci. Policy 2022, 132, 171–180. [Google Scholar] [CrossRef]
  82. Stokstad, E. In Controversial Move, Brazil May Outsource Amazon Deforestation Monitoring. Science Magazine, 3 May 2017. Available online: https://www.science.org/content/article/controversial-move-brazil-may-outsource-amazon-deforestation-monitoring (accessed on 1 May 2025).
  83. Dubayah, R.; Armston, J.; Kellner, J.; Duncanson, L.; Healey, S.; Patterson, P.; Hancock, S.; Tang, H.; Bruening, J.; Hofton, M. GEDI L4A Footprint Level Aboveground Biomass Density, Version 2.1; ORNL DAAC: Oak Ridge, TN, USA, 2022. [Google Scholar]
  84. Halme, E.; Pellikka, P.; Mõttus, M. Utility of hyperspectral compared to multispectral remote sensing data in estimating forest biomass and structure variables in Finnish boreal forest. Int. J. Appl. Earth Obs. Geoinf. 2019, 83, 101942. [Google Scholar] [CrossRef]
  85. Du, Y.; Chen, D.; Li, H.; Liu, C.; Liu, S.; Zhang, N.; Fan, J.; Jiang, D. Research on Estimating and Evaluating Subtropical Forest Carbon Stocks by Combining Multi-Payload High-Resolution Satellite Data. Forests 2023, 14, 2388. [Google Scholar] [CrossRef]
  86. Royal Norwegian Ministry of Climate and Environment. High-Resolution Satellite Data Opens for the Tropics. Press Release 2020. Available online: https://www.fao.org/gfoi/news-events/news/detail/en/c/1310418/ (accessed on 1 May 2025).
  87. Cappello, C.; Pratihast, A.K.; Pérez Ojeda del Arco, A.; Reiche, J.; De Sy, V.; Herold, M.; Vivanco Vicencio, R.E.; Castillo Soto, D. Alert-Driven Community-Based Forest Monitoring: A Case of the Peruvian Amazon. Remote Sens. 2022, 14, 4284. [Google Scholar] [CrossRef]
  88. Xu, D.; Wang, H.; Xu, W.; Luan, Z.; Xu, X. LiDAR Applications to Estimate Forest Biomass at Individual Tree Scale: Opportunities, Challenges and Future Perspectives. Forests 2021, 12, 550. [Google Scholar] [CrossRef]
  89. Available online: https://www.fao.org/redd/initiatives/un-redd/en/ (accessed on 1 May 2025).
  90. Ramachandran, N.; Saatchi, S.; Tebaldini, S.; d’Alessandro, M.M.; Dikshit, O. Mapping tropical forest aboveground biomass using airborne SAR tomography. Sci. Rep. 2023, 13, 6233. [Google Scholar] [CrossRef]
  91. Rodríguez-Veiga, P.; Quegan, S.; Carreiras, J.; Persson, H.J.; Fransson, J.E.S.; Hoscilo, A.; Ziółkowski, D.; Stereńczak, K.; Lohberger, S.; Stängel, M.; et al. Forest biomass retrieval approaches from earth observation in different biomes. Int. J. Appl. Earth Obs. Geoinf. 2019, 77, 53–68. [Google Scholar] [CrossRef]
  92. Roy, D.; Huang, H.; Boschetti, L.; Giglio, L.; Yan, L.; Zhang, H.; Li, Z.; Roy, D. Landsat-8 and Sentinel-2 burned area mapping -A combined sensor multi-temporal change detection approach. Remote Sens. Environ. 2019, 231, 111254. [Google Scholar] [CrossRef]
  93. Duarte, E.; Barrera, J.A.; Dube, F.; Casco, F.; Hernández, A.J.; Zagal, E. Monitoring Approach for Tropical Coniferous Forest Degradation Using Remote Sensing and Field Data. Remote Sens. 2020, 12, 2531. [Google Scholar] [CrossRef]
  94. Huang, B.; Yang, Y.; Li, R.; Zheng, H.; Wang, X.; Wang, X.; Zhang, Y. Integrating Remotely Sensed Leaf Area Index with Biome-BGC to Quantify the Impact of Land Use/Land Cover Change on Water Retention in Beijing. Remote Sens. 2022, 14, 743. [Google Scholar] [CrossRef]
  95. Yan, X.; Li, J.; Smith, A.R.; Yang, D.; Ma, T.; Su, Y.; Shao, J. Evaluation of machine learning methods and multi-source remote sensing data combinations to construct forest above-ground biomass models. Int. J. Digit. Earth 2023, 16, 4471–4491. [Google Scholar] [CrossRef]
  96. Strassburg, B.B.N.; Iribarrem, A.; Beyer, H.L.; Cordeiro, C.L.; Crouzeilles, R.; Jakovac, C.C.; Braga Junqueira, A.; Lacerda, E.; Latawiec, A.E.; Balmford, A.; et al. Global priority areas for ecosystem restoration. Nature 2020, 586, 724–729. [Google Scholar] [CrossRef]
  97. Intergovernmental Panel on Climate Change. Chapter 7: Agriculture, Forestry, and Other Land Uses (AFOLU). In Climate Change 2022: Mitigation of Climate Change. Contribution of Working Group III to the Sixth Assessment Report of the Intergovernmental Panel on Climate Change; Cambridge University Press: Cambridge, UK; New York, NY, USA, 2022. [Google Scholar]
  98. Hu, Z.; Piao, S.; Knapp, A.K.; Wang, X.; Peng, S.; Yuan, W.; Running, S.; Mao, J.; Shi, X.; Ciais, P.; et al. Decoupling of greenness and gross primary productivity as aridity decreases. Remote Sens. Environ. 2022, 279, 113120. [Google Scholar] [CrossRef]
Figure 1. Conceptual framework of vegetation phenology monitoring using satellite and UAV imagery under environmental constraints.
Forests 16 00971 g001
Figure 2. Publication trends on forest carbon monitoring and remote sensing, categorized by 4-year intervals from 2010 to 2025. Data obtained from Web of Science Collection using keywords: “Forest Carbon Monitoring” AND “Remote Sensing”.
Forests 16 00971 g002
Figure 3. Workflow of uncertainty propagation in multi-source forest carbon monitoring.
Forests 16 00971 g003
Figure 4. End-to-end workflow for operational forest carbon monitoring and policy integration.
Forests 16 00971 g004
Figure 5. Integrated satellite, UAV, and ground network for real-time carbon monitoring.
Forests 16 00971 g005
Table 1. Comparative analysis of this review and Xu et al. (2025) [35].
DimensionThis ReviewXu et al. [35]—Forests
Time Span and Focus2020–2025; carbon neutrality-focused integration1999–2024; technology-oriented historical scope
Remote Sensing Data ScopeMulti-source fusion (optical, SAR, LiDAR) with GIS modelingSegmented analysis by sensor type with technical emphasis
Modeling PerspectivePractical use of ML/DL in scalable carbon estimation workflowsConceptual classification of empirical and process-based models
Policy IntegrationStrong alignment with REDD+, carbon markets, and NDC trackingTechnical depth but minimal linkage to climate policy mechanisms
Case Study InclusionDetailed technical policy cases (e.g., Brazil and Congo Basin)Lacks regionally grounded implementation examples
Strategic OutlookProposes an integrated RS-GIS-AI-policy monitoring frameworkEmphasis on modeling uncertainty and methodological innovation
Distinctive ContributionPractice-oriented synthesis with emphasis on operational feasibility and interdisciplinary integrationMethodologically detailed but policy-neutral, serving primarily technical audiences
Table 2. Representative remote sensing data sources for forest carbon monitoring. Spatial/temporal resolutions are approximate. Abbreviations: VIS—visible, TIR—thermal infrared, SAR—Synthetic Aperture Radar, ALS—airborne LiDAR scanning.
Sensor/MissionTypeResolutionRevisitKey Forest Carbon Uses
Landsat-8/9 (NASA/USGS)Optical
(VIS–SWIR)
30 m16 daysLong-term forest cover change; biomass via spectral indices (calibrated with plots) [18].
Sentinel-2 (ESA)Optical
(VIS–SWIR)
10 m (20 m SWIR)5 days (2-satellite constellation)High-resolution mapping of canopy greenness, leaf area, and forest type; inputs to biomass models, especially in regrowth and mosaic landscapes [19].
MODIS (Terra/Aqua)Optical
(VIS–TIR)
250–500 m (1 km TIR)1–2 daysRegional to global monitoring of vegetation activity (NDVI/EVI, FPAR); NPP estimation for carbon flux modeling [36].
Planet Scope (Planet Labs)Optical
(VIS–NIR)
3–5 mDaily (constellation)Detection of fine-scale changes (small clearings, degradation); verification of project-level carbon actions (e.g., tree planting survival).
Sentinel-1 (ESA)SAR
(C-band, VV/VH)
10 m6–12 daysAll-weather forest cover monitoring; near-real-time deforestation alerts; detecting flooding and damage under clouds. Limited biomass sensitivity in dense forests [25].
ALOS-2 PALSAR-2 (JAXA)SAR
(L-band, HH/HV)
25 m (10 m in spotlight)~42 days (global mode)Mapping forest/non-forest extent and structure in tropics [27]; AGB estimation in low to mid biomass stands (e.g., woodland, secondary forest).
BIOMASS (ESA, 2024+)SAR
(P-band)
~50–100 m16 days (planned)Dedicated biomass mapping mission for high-biomass tropical and boreal forests; will provide first P-band tomographic data to estimate AGB up to >300 Mg ha−1 [25].
GEDI Lidar (NASA, ISS)LiDAR
(1064 nm)
~25 m footprint (60 m spacing)~2–4 years mission (sampling)~12 million shots per year sampling Earth’s forests; provides canopy height and structure used to calibrate biomass models and create 1 km gridded AGB products [29,30].
ICESat-2 (NASA)LiDAR (532 nm photon-counting)~17 m footprint (0.7 km track spacing)91-day exact repeat (sampling)Global photon-counting LiDAR data used for canopy height retrievals (especially in high latitudes); complements GEDI by covering >51° N/S and open forests.
SMOS/SMAP (ESA/NASA)Passive microwave
(L-band)
~40 km/9 km2–3 daysVegetation optical depth (VOD) as proxy for biomass and water content; tracking large-scale carbon changes (e.g., drought impacts) in combination with models [22,23].
TanDEM-X (DLR)SAR Interferometry (X-band)~12 m (height grid)N/A (2010–2015 data)Global digital elevation model from InSAR; used to derive forest canopy height (with ground DEM) and estimate biomass when calibrated [26].
VIIRS (NASA/NOAA)Thermal and Optical375 m (optical) 750 m (thermal)Daily (polar orbit)Active fire detection and burn scar mapping for estimating fire emissions; night-time lights can indicate human activity near forests (indirect driver data).
Table 3. Recommended Sensor–Model Stacks for Common Forest Carbon Monitoring Objectives.
Ecological ObjectiveTier 1—Low-Cost Workflow (Basic Accuracy)Tier 2—Intermediate Workflow (Balanced Cost/Accuracy)Tier 3—High-Precision Workflow (Research-Grade Accuracy)
Above-ground biomass (AGB) in dense, humid forestSentinel-1 C-band (VV/VH) + Landsat-8/9 multispectral; simple multivariate regressionSentinel-1 + Sentinel-2 MSI + GEDI footprint heights; Random Forest regressionSentinel-1 + ALOS-2 L-band + targeted airborne LiDAR tiles; Gradient-Boosting Machine (GBM)
AGB in secondary or seasonally dry forestLandsat NDVI/EVI; stratified linear regressionSentinel-2 (10 m) + ALOS-2 L-band backscatter; XGBoost modelSentinel-1 + PRISMA hyperspectral cube + UAV LiDAR; convolutional neural network (CNN)
Annual carbon flux (NPP/GPP)MODIS NDVI + ERA5 climate drivers; CASA light-use-efficiency modelMODIS NDVI + SMAP vegetation optical depth (VOD); long-short-term-memory (LSTM) networkMODIS phenology indices fused with eddy covariance upscaling; ensemble Random Forest
Degradation and disturbance early warningSentinel-1 C-band time-series differencing; empirical thresholdsSentinel-1 + Sentinel-2 dense time series; BFAST change-point analysisHigh-density UAV LiDAR gap detection + PlanetScope sub-5 m imagery; U-Net deep segmentation
Table 4. Major sources of uncertainty in multi-source forest biomass estimation.
SourceDescriptionImpact
Optical sensor radiometryCalibration errors, atmospheric contaminationBiases in vegetation indices
SAR saturationLoss of sensitivity in high biomass zonesUnderestimated AGB
LiDAR sampling gapsSparse coverage, geolocation driftLocal errors in canopy structure
Temporal misalignmentSeasonality, disturbance mismatchesPhenology artifacts
Model structure assumptionsOver-simplified relationshipsSystematic bias in biomass predictions
Table 5. Sensor-specific uncertainties and typical mitigation.
Sensor TypeMain UncertaintyMitigation
Optical (Landsat/Sentinel-2)Clouds, spectral saturationMulti-temporal compositing; LiDAR calibration
C-band SAR (Sentinel-1)Lay-over, decorrelationPolarimetric filtering; DEM correction
L/P-band SAR (ALOS-2, BIOMASS)Radio-frequency interferenceRFI masking
Spaceborne LiDAR (GEDI)±8 m geolocation driftStrip-to-strip co-registration
Hyperspectral (PRISMA)Atmospheric absorption bandsEmpirical-line calibration
Table 6. Modeling paradigm matrix.
Modeling ParadigmAccuracyComputing CostExplainabilityReplicability
Linear/allometric regression1333
Random Forest/Gradient Boosting (GBM)2222
Deep Convolutional/Recurrent Networks3311
Process-based models (e.g., CASA; Biome-BGC)1222
Legend: 1 = low, 2 = medium, and 3 = high.
Table 7. Comparative evaluation of modeling approaches for forest carbon estimation across different forest types.
Modeling ApproachSuitable Forest TypesTypical Accuracy (R2)Prediction Error (RMSE, Mg C/ha)Data RequirementsInterpretabilityScalabilityStrengthsLimitations
Empirical RegressionTemperate forests, open forests0.50–0.7030–60LowVery HighHighSimple to implement, transparent resultsSignal saturation in high-biomass forests; limited generalizability
Machine Learning (RF)Tropical, temperate, and boreal forests0.65–0.8520–45Medium–HighModerateVery HighRobust to noise; integrates multi-source data effectivelyRequires large training datasets; limited causal interpretation
Deep Learning (CNN)Tropical rainforests, highly heterogeneous landscapes0.75–0.9015–35Very HighLowModerateExcellent in extracting complex spatial patterns; suitable for high-resolution dataData- and compute-intensive; “black box” model behavior
Process-based Models (CASA, Biome-BGC)All forest types0.50–0.7530–50Medium–HighHighModerateSimulates ecosystem processes; enables long-term scenario modelingRequires detailed environmental inputs; complex parameterization
Table 8. Summary statistics of modeling performance metrics (R2 and RMSE) for different biomass estimation approaches based on a meta-analysis of 30 studies (2010–2025).
Modeling ApproachMean R2 ± SDMean RMSE (Mg C ha⁻1) ± SD95% CI for R2
Empirical Regression0.62 ± 0.0842 ± 6(0.60, 0.64)
Machine Learning0.78 ± 0.0730 ± 5(0.76, 0.80)
Deep Learning0.85 ± 0.0525 ± 4(0.83, 0.87)
Process-based Modeling0.66 ± 0.0950 ± 8(0.63, 0.69)
Table 9. Future research priorities in forest carbon monitoring.
Research FrontierKey QuestionsMethodological ApproachesCritical Data Needs
AI-Augmented ModelingHow to integrate time series into deep learning models?Temporal CNNs, Transfer LearningTime-labeled biomass datasets
Real-Time Biomass MonitoringCan sub-monthly biomass trends be operationalized?Edge Computing, SAR Time Series AnalysisNear-real-time calibration data
High-Resolution MRV ScalingWhat is the cost–benefit threshold for VHR datasets?Cost-Effectiveness Modeling, Sampling OptimizationRegional pilot studies linked to REDD+
Sky-Ground Data FusionHow to unify satellite, UAV, and field measurements?Data Assimilation, AI Fusion FrameworksCoordinated multi-source observations
Disclaimer/Publisher’s Note: The statements, opinions and data contained in all publications are solely those of the individual author(s) and contributor(s) and not of MDPI and/or the editor(s). MDPI and/or the editor(s) disclaim responsibility for any injury to people or property resulting from any ideas, methods, instructions or products referred to in the content.

