1. Introduction
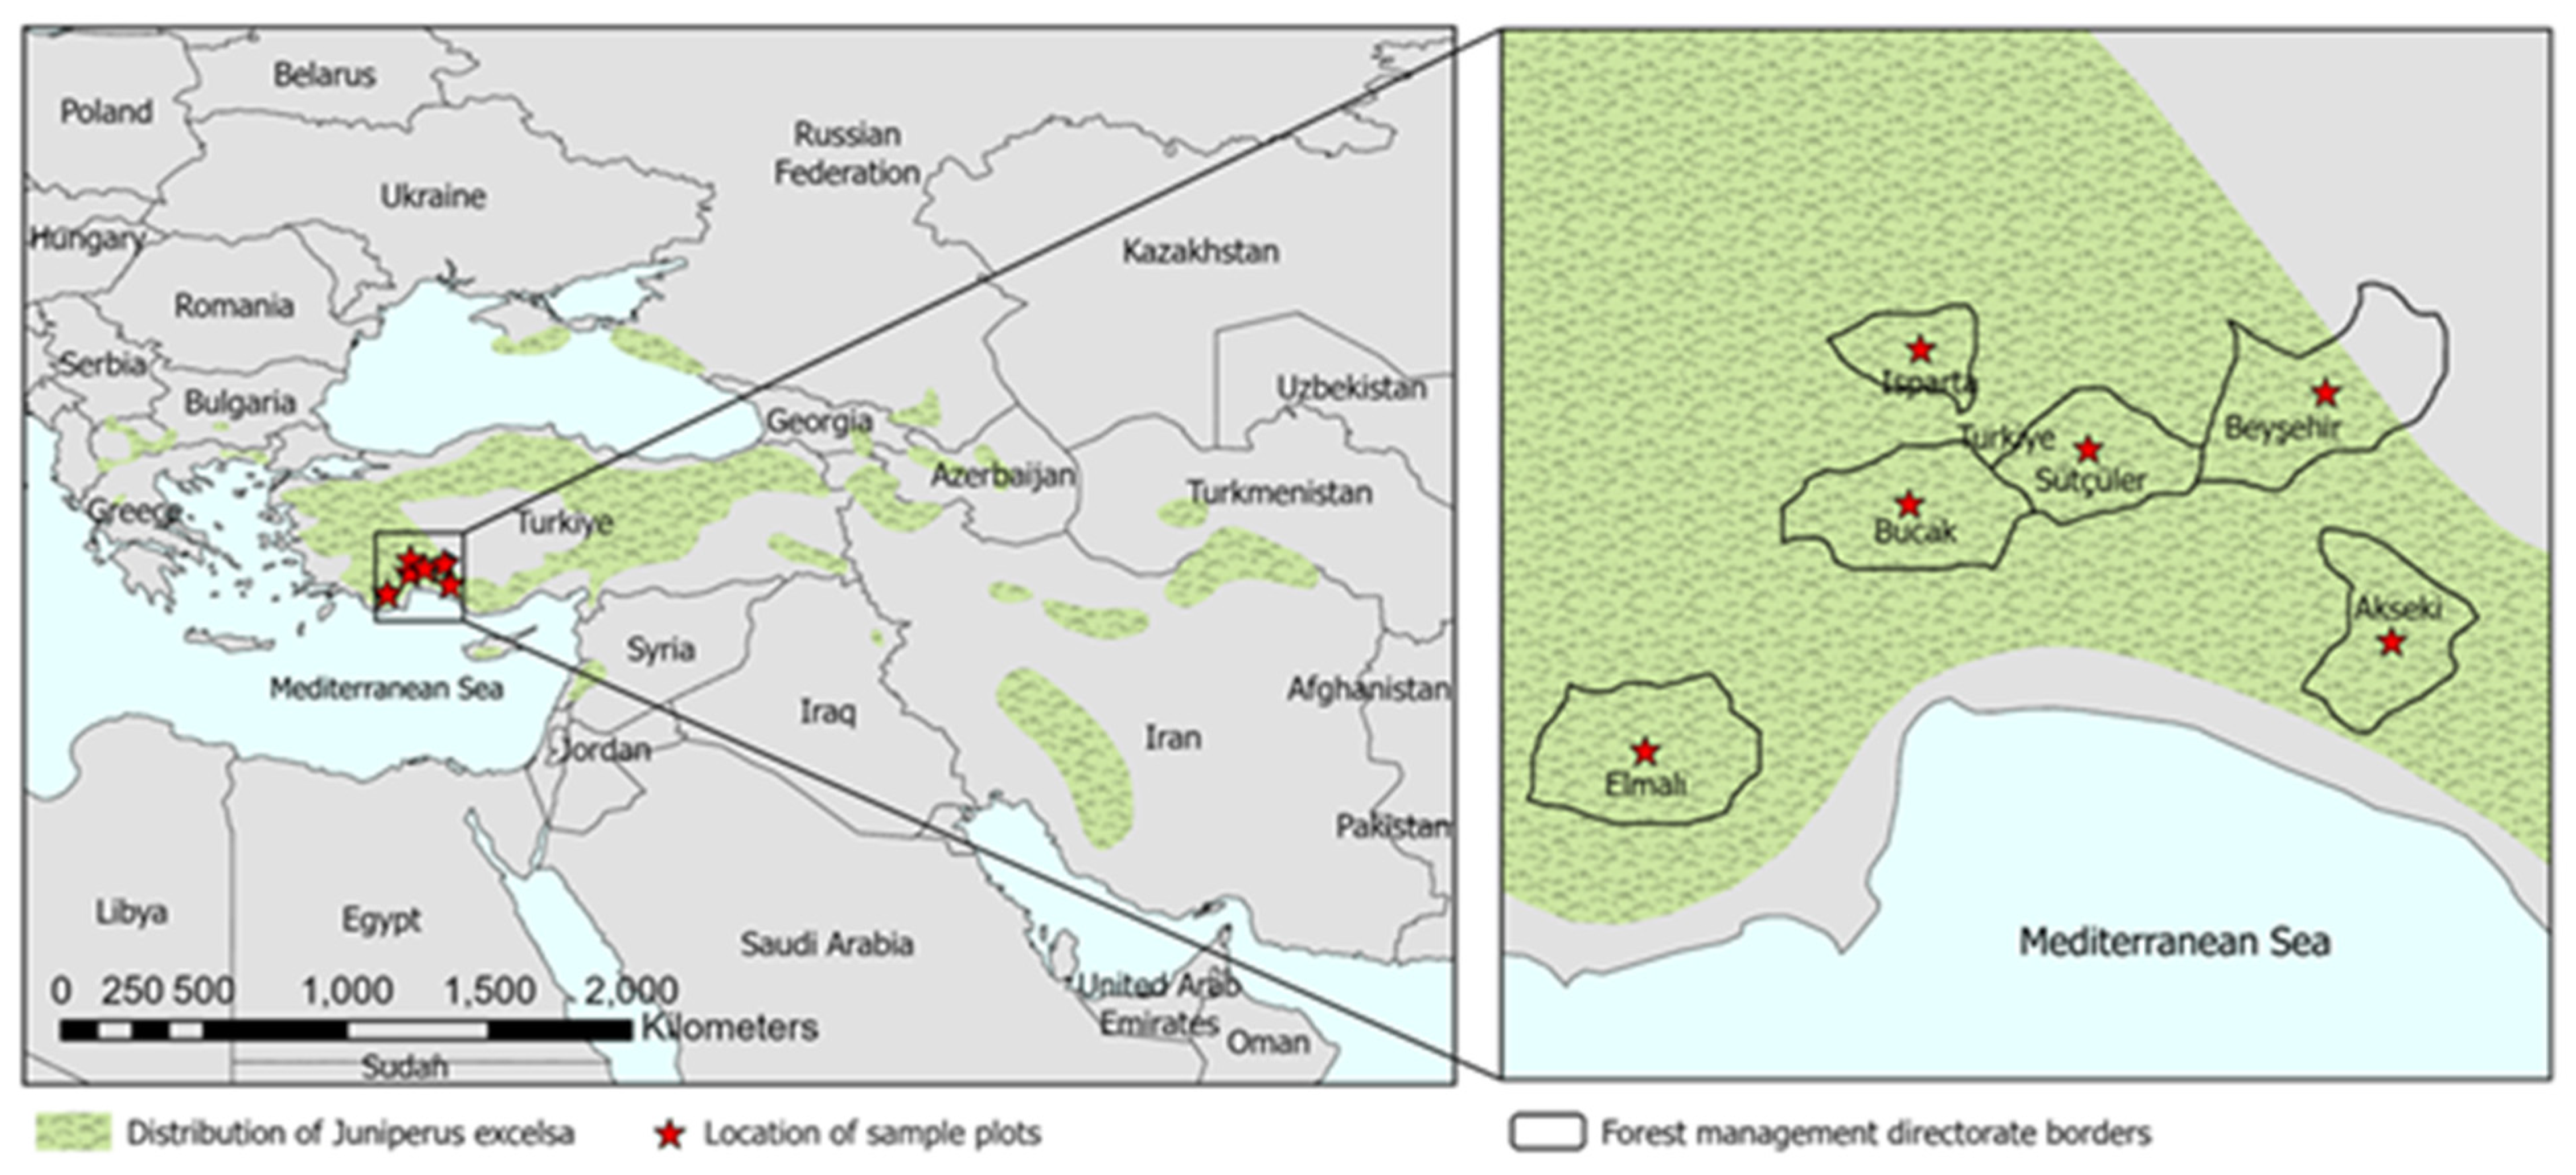
Juniperus is an economically and ecologically significant species in Türkiye, covering 1.6 million ha with a standing volume of 32.6 million m
3 [
1]. Juniper species are distributed commonly in the Taurus Mountains. Six juniper species naturally grow in Türkiye; among them, Crimean juniper (
Juniperus excelsa Bieb.) is the most common and has great economic potential. The most significant distribution area of the species worldwide is Türkiye. Therefore, it offers several environmental benefits, including conserving biodiversity, water, and soil resources. Additionally, it serves as a source of essential oils used in Türkiye’s medical and cosmetics industries.
Recently, Türkiye has adopted a novel approach to strengthen the multifunctional role of forests by developing fundamental management strategies to expand the economic, ecological, and social benefits from forests [
2]. Growth and yield prediction models are an integral component of this novel approach to create long-term plans for managing forest ecosystems and enhancing their resilience to climate change.
Height–diameter (
h–d) models are a key component of growth and yield prediction in forestry. Traditionally,
h–d models have relied solely on the diameter at breast height, which was measured 1.3 m above the ground, as the predictor variable for estimating the total height of all of the trees in an area. These models describe the relationship between total tree height (
h) and diameter at breast height (
d, measured at 1.3 m above ground), which impact forest stands [
3], and are widely used in applications such as yield estimation [
4,
5], stand structure analysis [
6], site index determination and dominant height (
H0) estimation [
4,
7], and carbon budget modeling [
8]. Moreover,
h–d models are essential for understanding the complex dynamics that define and influence forest stands [
3]. Despite their importance, data on the
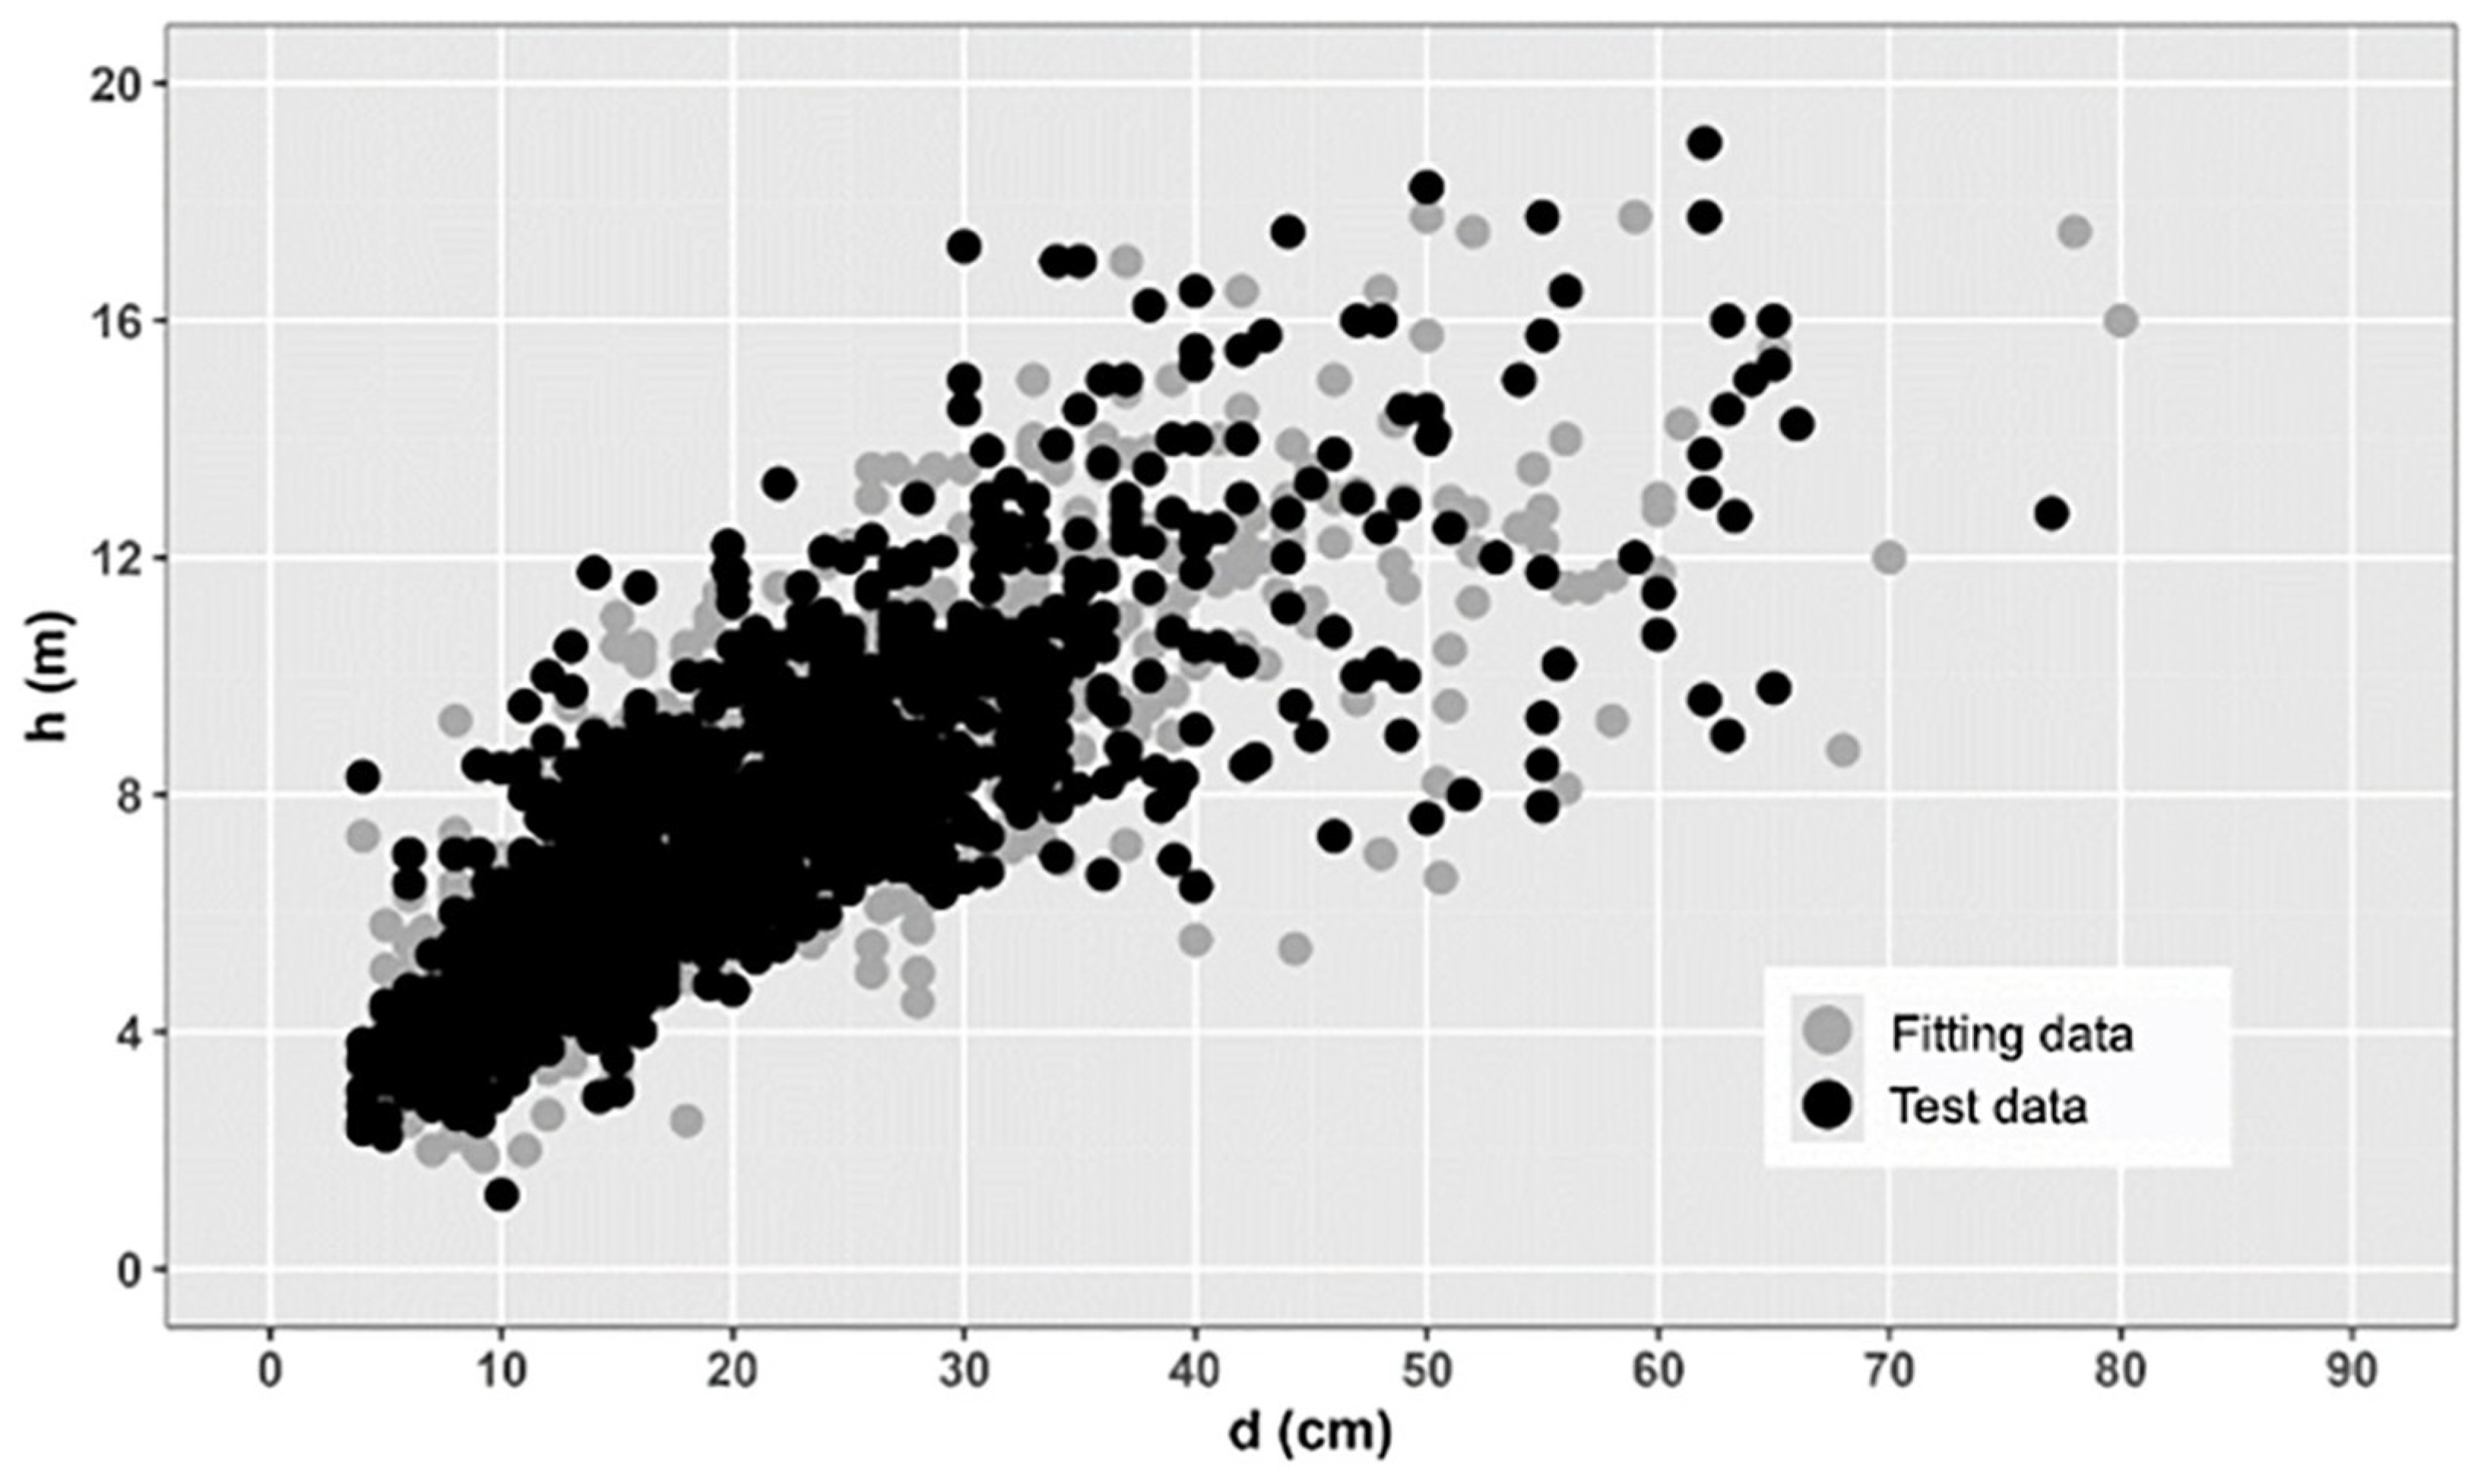
h–d relationship for Crimean juniper is limited, particularly in Türkiye. As noted by Crecente-Campo et al. [
9], measuring
h is generally more difficult and costly than measuring
d.
Numerous
h–d models have been developed for plantations and pure, even-aged stands [
10,
11]. However, a single
h–d equation is often inadequate across all stands, as the
h–d relationship varies between stands and even within the same stand over time [
4]. The conventional solution is to fit a local
h–d model for each plot, which requires extensive sampling and increases costs.
To address this, recent studies have explored alternative approaches, such as nonlinear mixed-effects (
ME) and quantile regression (
QR) models.
ME models have been widely applied in
h–d modeling efforts [
3,
12,
13,
14,
15,
16,
17,
18,
19,
20,
21,
22,
23]. These models include fixed effects, representing population-level trends, and random effects, which account for within-plot variability.
ME models are particularly effective at capturing spatial and temporal correlations by specifying covariance structures during parameter estimation [
14,
20,
24]. A key advantage of
ME models is their adaptability to local forest conditions. Random effects can be predicted using tree- or stand-level covariates, combined with a small subsample of measured heights and diameters [
16,
18,
23,
25]. Traditionally, basic or local
h–d models rely solely on diameter at breast height (1.3 m above ground) as a predictor. In contrast, generalized models include additional stand-level variables such as site index, basal area, dominant diameter (
D0), stand age, and
H0 [
13,
18,
26]. Some studies have shown that
ME models can accurately capture
h–d variability without incorporating additional stand-level predictors [
13,
15,
26,
27,
28,
29,
30]. Incorporating stand-level random effects in
ME models allows them to reflect variability among stands [
31,
32]. Moreover, calibrating existing
ME models requires significantly less sampling than building new basic models, while maintaining comparable accuracy [
19,
33]. Thus, model calibration offers an efficient and cost-effective means of achieving reliable
h–d predictions [
29].
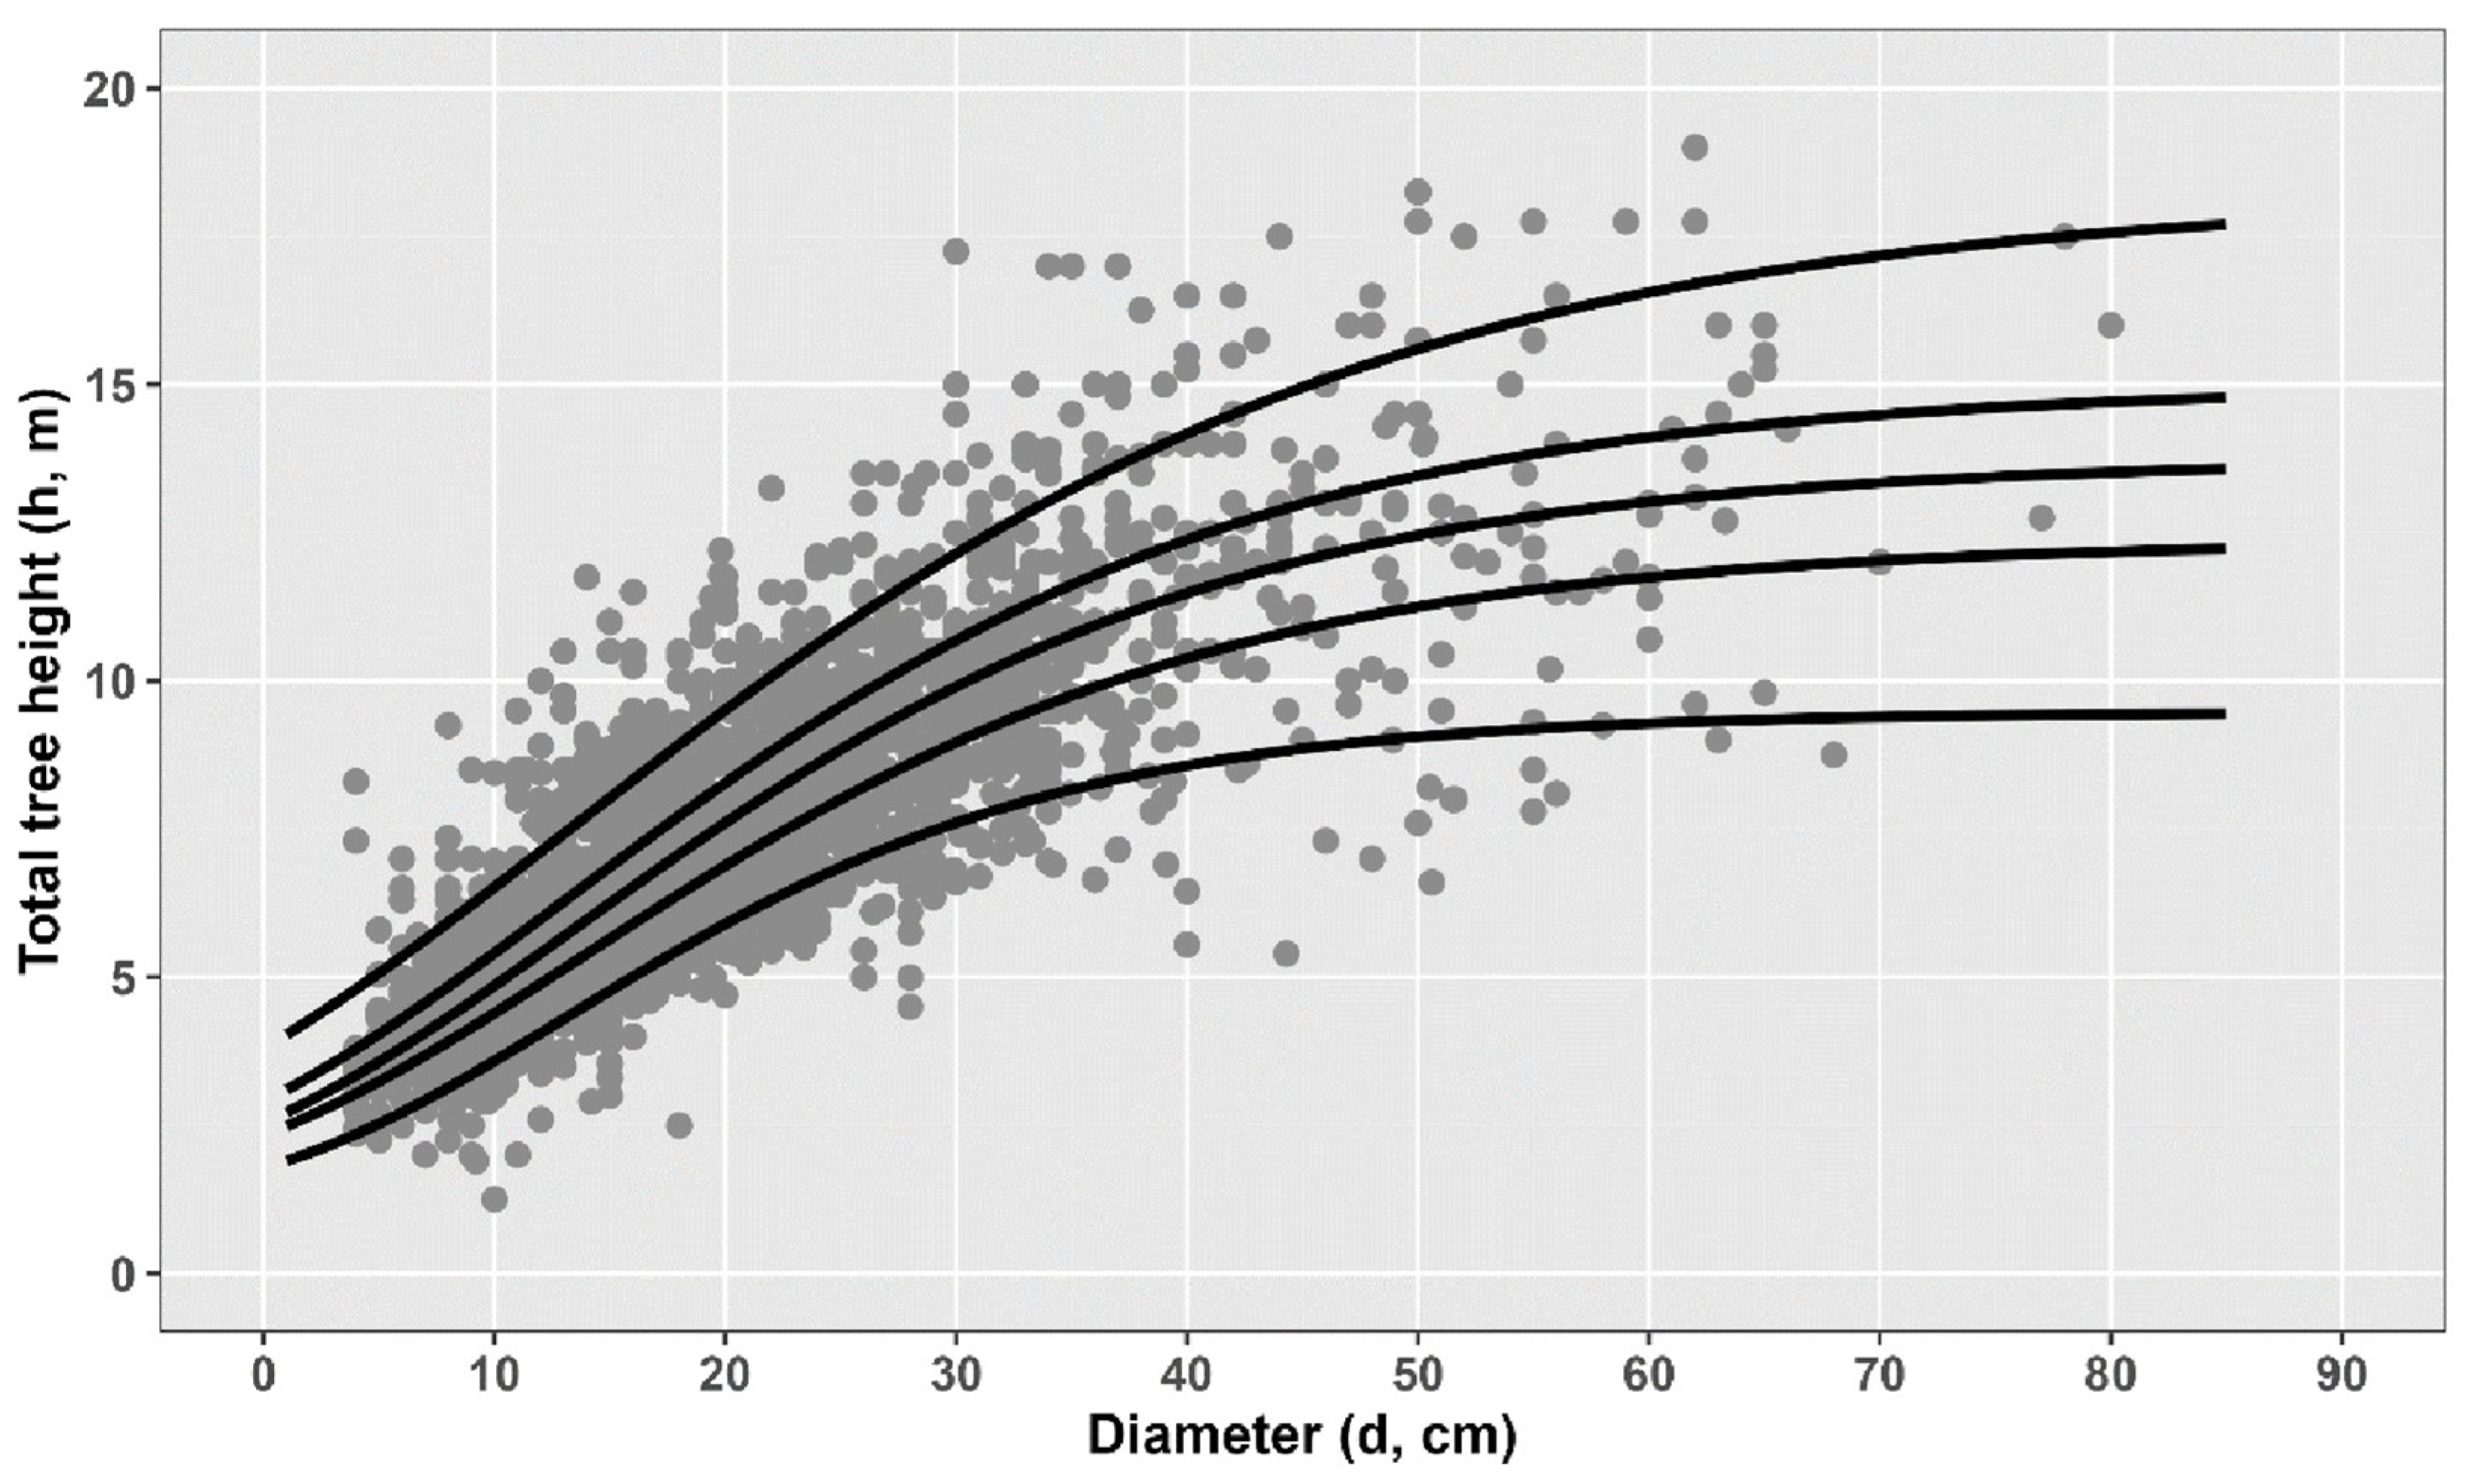
QR, originally developed by Koenker and Bassett [
34], offers a novel approach for applications in forest inventory. This method evaluates the conditional distribution of dependent variables, examining the influence of estimates across various quantiles. Unlike mean regression estimators, which only consider the conditional mean or central effects of the covariates, this approach provides a more comprehensive analysis.
QR has been effectively applied in forestry for tasks such as defining self-thinning boundaries [
35,
36], modeling maximum crown width [
37], and estimating insect infestation spread rates [
38]. It has also been used in stem diameter modeling [
39], tree
h–d relationships [
18,
22,
28,
40,
41,
42], and growth curve development [
43]. These studies show that
QR equations can model
h–d relationships across various quantiles. Similar to
ME models,
QR can achieve high prediction accuracy when calibrated. By applying dual
QR methods with two
h–d equations from different quantiles, it is possible to construct a localized
h–d equation that passes through a specific point [
18,
41].
For parameter estimation of
ME and
QR models, calibration alternatives can be tested by using different sampling patterns and varying sampling sizes within each sample plot. The advantage of different sampling scenarios in the localization of non-linear
ME h–d models has been empirically explored in previous studies. Some studies [
7,
9] suggested that it is better to choose calibration trees among the smallest trees in the sample plots. In contrast, other studies [
18] observed that the prediction performance of
ME and
QR improved with increasing sample size, with significant improvements noted in evaluation statistics for sample sizes of five or less trees.
Modeling the
h–d relationship is challenging due to the biological variability of trees across species and locations. In recent decades, machine learning (
ML) methods have emerged as effective, non-parametric alternatives to traditional regression models [
44,
45,
46,
47,
48,
49], and are capable of capturing complex data patterns. Neural networks have been successfully applied in various contexts, including Larch plantations using supervised backpropagation [
50] and multilayer networks outperforming nonlinear regression for
Pinus koraiensis in the Mengjiagang Forest Farm [
51]. Karatepe et al. [
52] found neural networks superior to fixed- and mixed-effects models for Cedar height estimation, while Ogana and Ercanli [
53] also used artificial neural networks (
ANNs) effectively in a tropical Nigerian forest with 116 species. Other studies confirmed the superiority of
ANNs over nonlinear mixed-effects (
NLME) models [
54] and explored decision trees, random forests, support vector machines [
55], and deep learning for tree height estimation in urban forests [
56].
Given the intense research interest in
h–d relationships and the need for accurate, reliable
h–d models, especially in light of the limited modeling studies on Crimean juniper and considering that the potential of
ML methods in this context remains underexplored, three
ML approaches were selected for investigation and comparison with the fixed-effects (
FE),
ME, and
QR parametric methods to develop robust
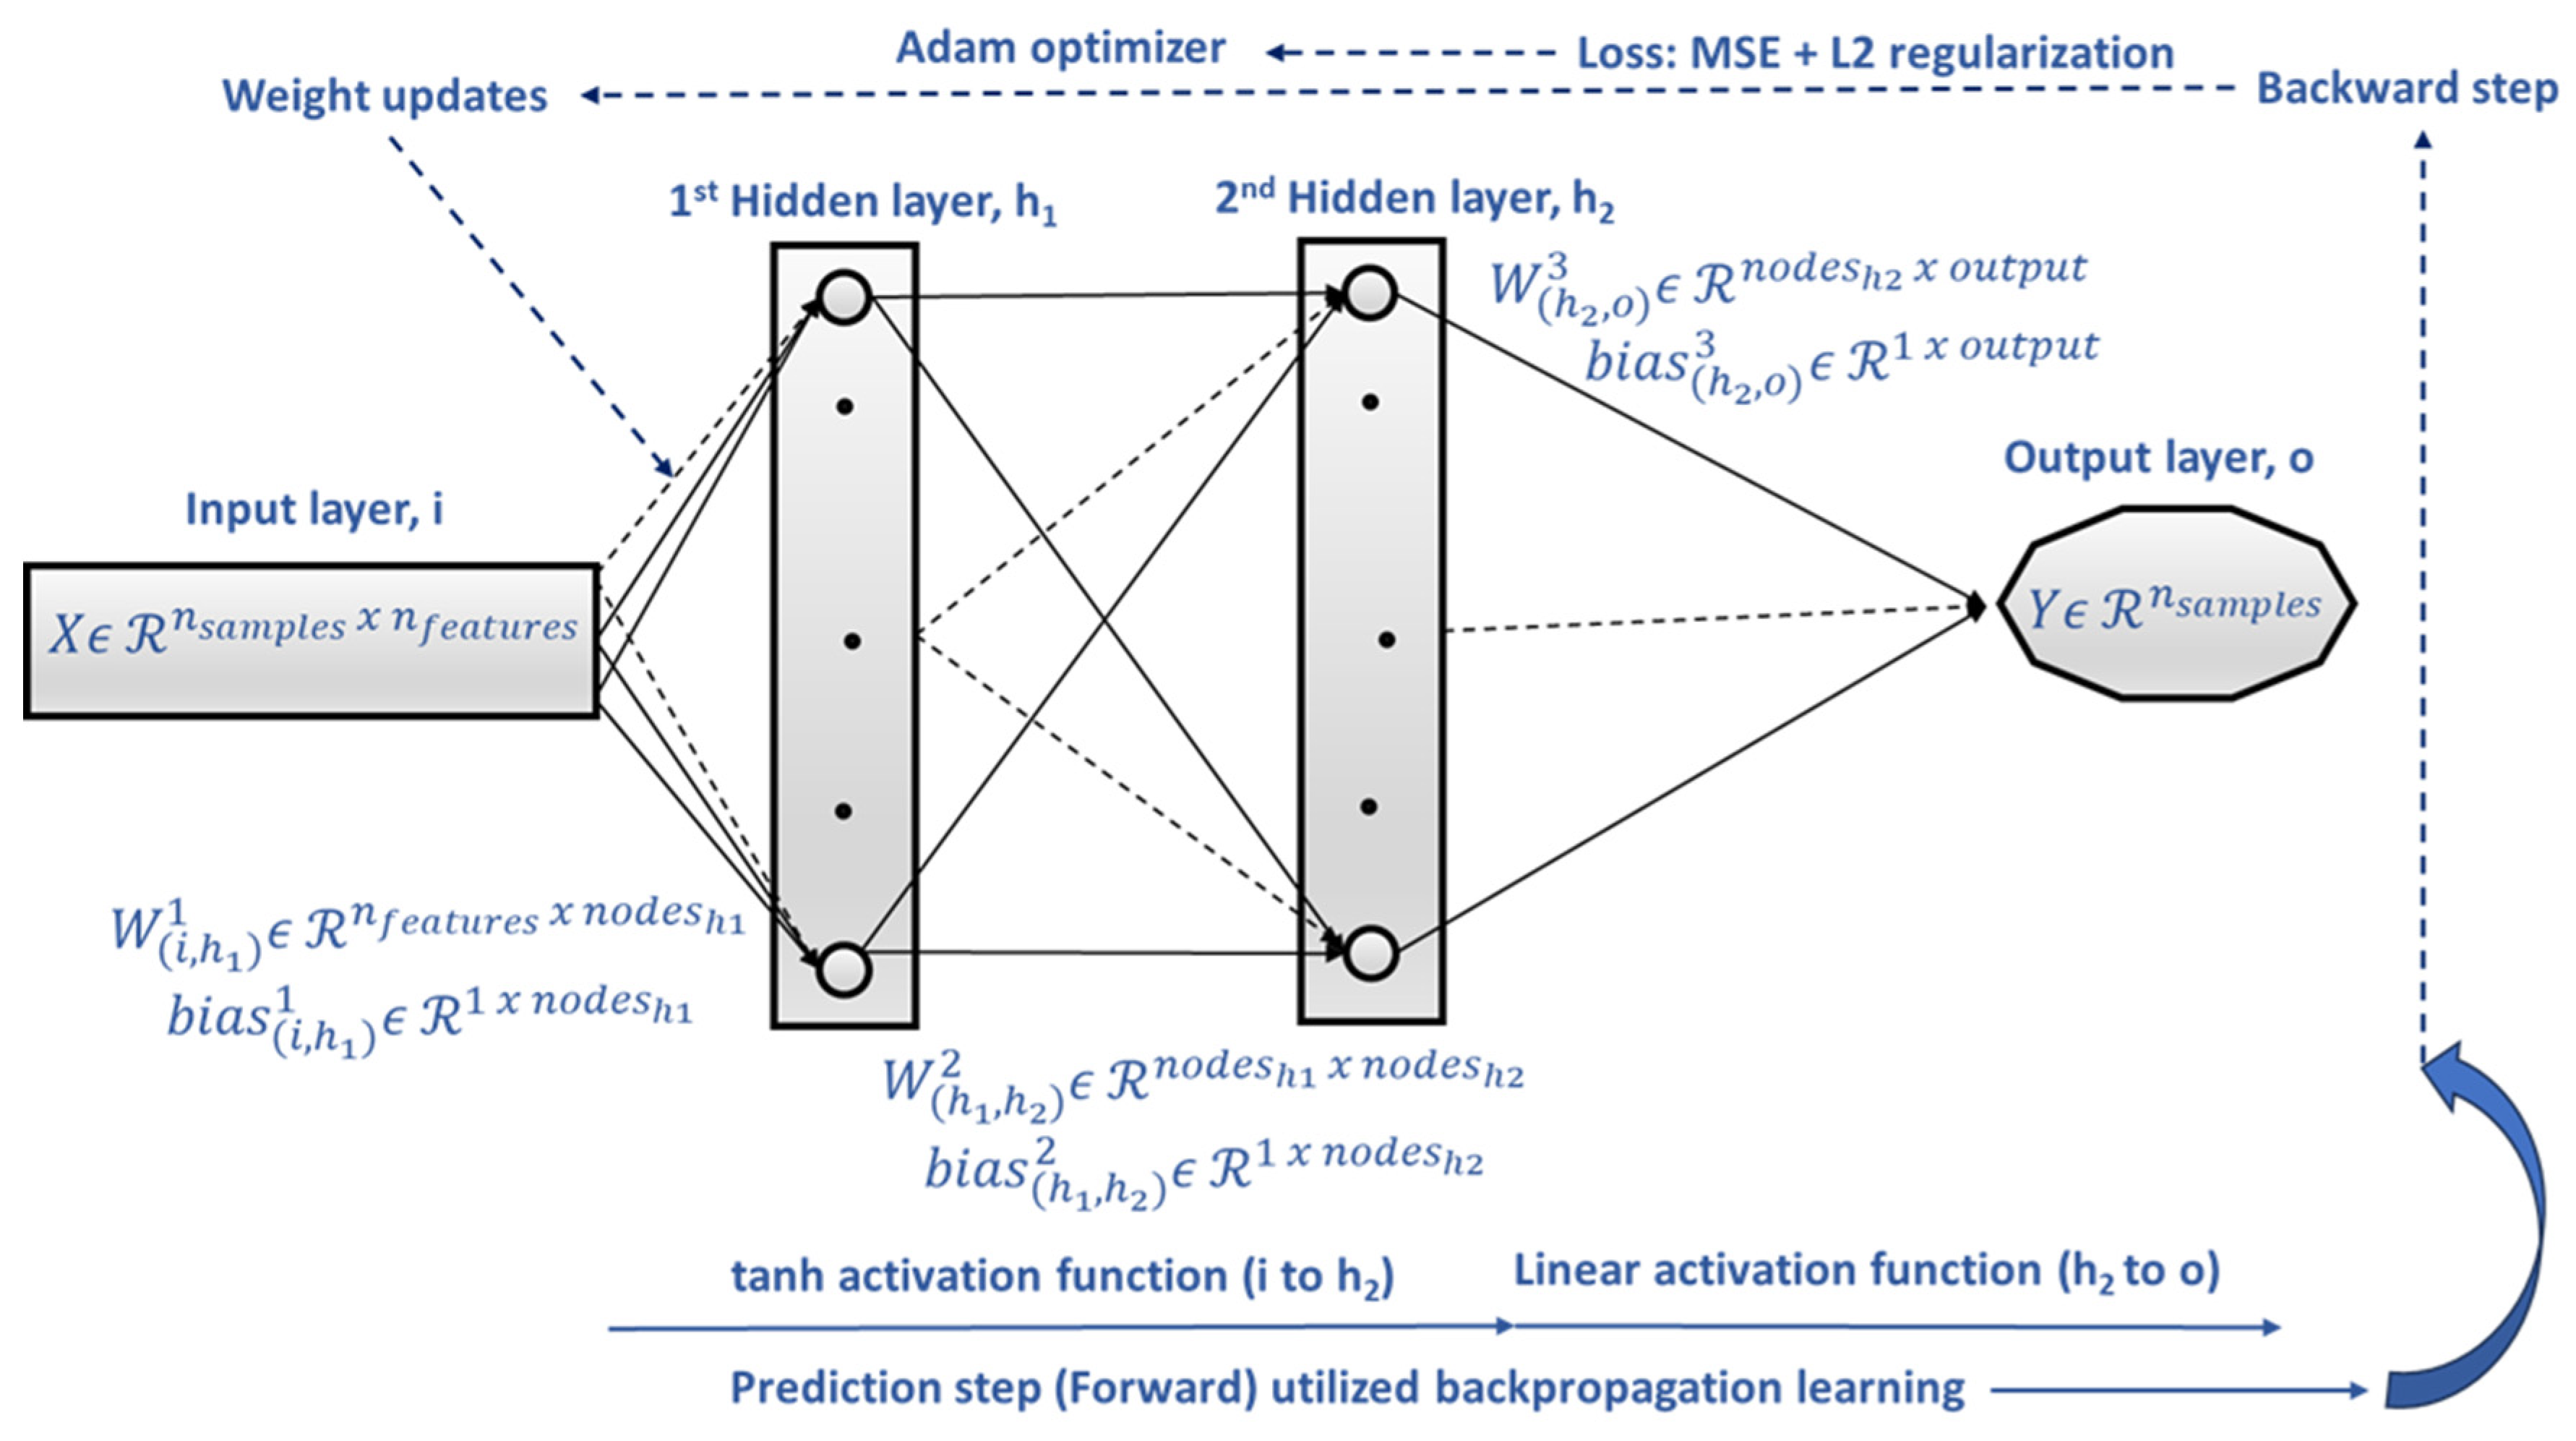
h–d models. Namely, the regression-based non-parametric shallow multilayer perceptron (
S_MLP) ANNs, the extreme gradient boost (
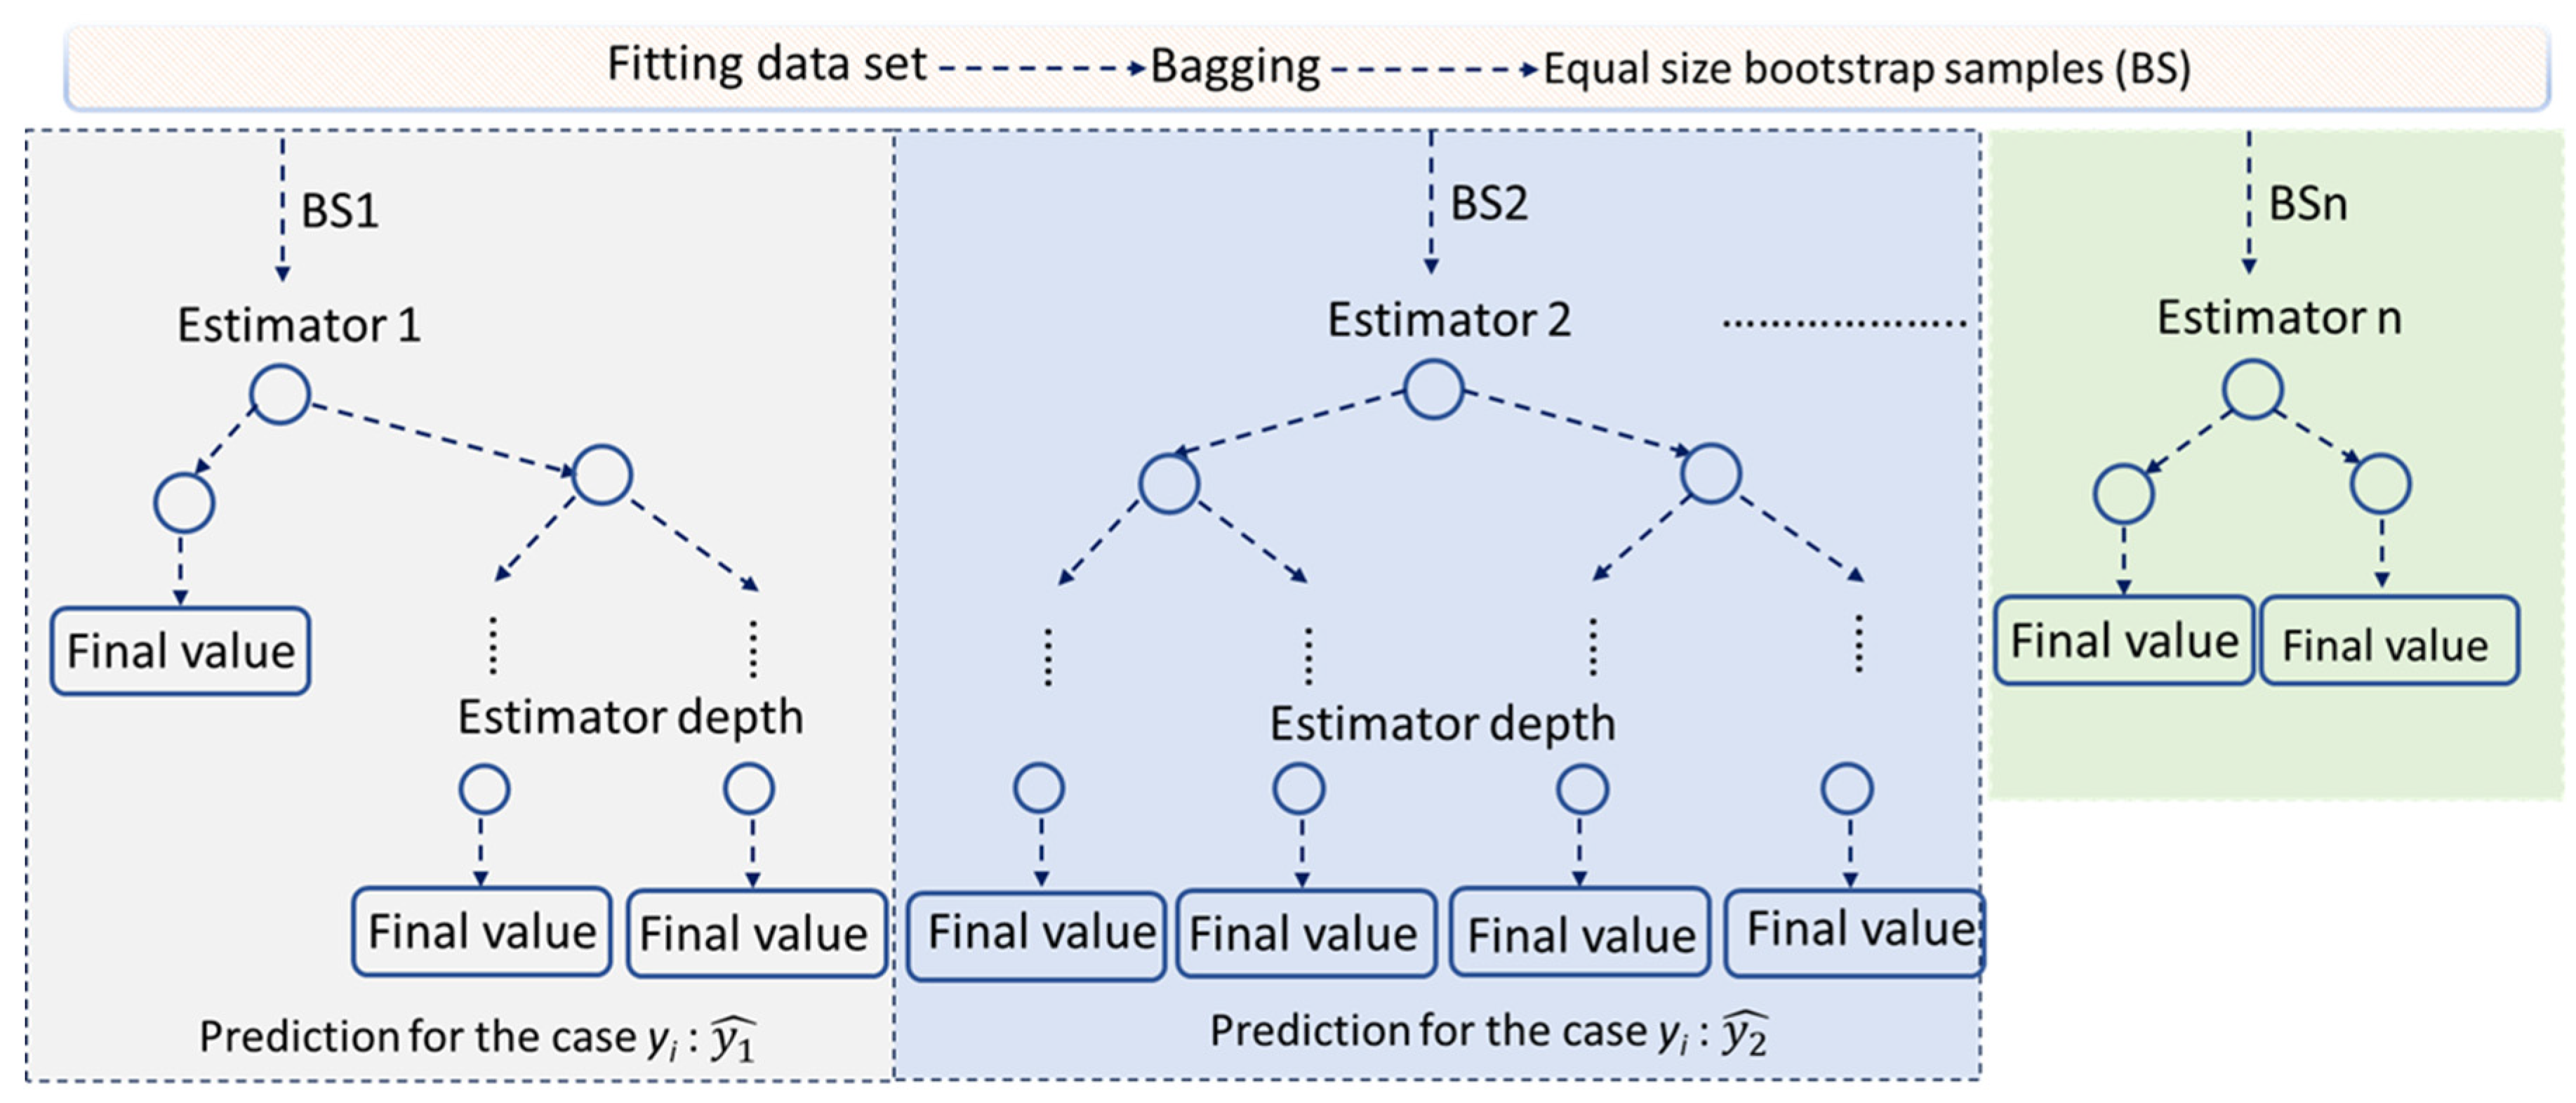
XGBoost), and the random forest (
RF) ML modeling approaches, were selected, on one hand, due to their ability to capture nonlinearity among data, and on the other hand these approaches can effectively handle moderate size datasets, both conditions frequently faced in forest datasets. Furthermore, the selected algorithms bring distinct advantages and limitations [
57,
58,
59,
60] due to their differing algorithmic foundations. These characteristics allow the selection of the most appropriate model based on the structure and complexity of the data at hand. In general, the
S_MLP approach offers smoothness in the approximation function, and it can effectively learn nonlinear relationships where complexity is present.
RF and
XGBoost techniques are both considered robust in overfitting by incorporating regularization. However, all approaches, some to a greater extent and some to a lesser extent, require effort in their hyperparameters tuning.
The objectives of this study were as follows: 1. to investigate cutting-edge ML approaches, namely S_MLP, RF, and XGBoost, that leverage diverse algorithmic strategies to develop high-precision h–d models for Juniperus excelsa (Crimean juniper) trees in the Taurus mountains, 2. to develop models that rely on a minimal number of tree variables that are easy to measure in the field, thereby enhancing their practical usefulness in forest management, 3. to conduct a comparative analysis between ML and parametric regression methodologies, 4. to calibrate ME and QR models using different sampling scenarios, and 5. to evaluate these scenarios in order to gain deeper insights into the effectiveness of each modeling approach in predicting tree height.
4. Discussion
Accurate h–d models are vital in forestry, as total tree height is essential for estimating many forest attributes, such as volume, biomass, site index, productivity, carbon storage, and windthrow risk. Their practical value is high, mainly when based on easily obtained stem measurements.
4.1. Parametric Modeling
According to the parametric modeling approaches utilized, the results obtained were consistent with past studies. Many authors have reported that calibrating the
ME model significantly enhances the accuracy of tree height predictions [
13,
17,
22,
23,
27,
89]. Consistent with the other studies [
13,
15,
28], the mixed effects basic model produced better fit statistics than the generalized
h–d models. As indicated by Huang et al. [
13], including plot-specific random parameters in the basic models helps explain the effects of many known and unknown factors related to plot-level variation to be accounted for without requiring that they be identified or measured. This study showed that the
ME basic model is sufficient to explain stand-level variations for natural Crimean juniper in Türkiye.
According to the
QR approach utilized, compared to the
FE model, all three
QR models produced better MD and MAD values when for all calibration sizes (1 <
m < 5). The results exhibited that the 3
QR was consistently worse than the 5
QR and 9
QR models. The five-
QR approach predicted tree height slightly better overall. As discussed by Bohora and Cao [
90], this could be the case of over-fitting in which the extra curves based on 0.3 and 0.7 quantiles were ineffective and might cause a minor loss in terms of performance compared to the simpler
QR system.
Zang et al. [
28] applied a generalized
h–d model at the fifty percent quantile without performing any calibration. In contrast, other studies have calibrated
QR models using a single observation, such as a measured diameter at a specific age [
90] or a measured stem diameter at a particular tree height [
38]. As indicated by Xie et al. [
41], determining the appropriate number of the pre-measured subsample trees also appears to be essential, directly affecting time and cost of the forest inventory. This study’s results showed that the base equation’s prediction ability was improved by using a subset of tree height values for each plot to calibrate the model. Earlier studies showed that an increase in sampling effort improves the ability of the models in terms of prediction [
13,
23,
89]. The current research showed that as the number of trees used for calibration of different modeling approaches increased, the fit index values of the models used increased, while MAD and RMSE values decreased. Considering the results obtained, it was concluded that four randomly selected sample trees from each sample area would be sufficient for calibration, considering the balance between increased prediction accuracy and sampling cost. Teshome et al. [
23] used 3 trees, Calama and Montero [
7] used 4 trees for calibration, Temesgen et al. [
89] suggested using between 1–15 trees for calibration, while Huang et al. [
13] suggested using 6 or more trees for calibration. Ciceu et al. [
19] and Xie et al. [
41] stated that selecting six trees from each sample area would be sufficient to calibrate different modeling approaches. On the other hand, Temesgen et al. [
26] stated that three trees from each sample area would be sufficient for calibration and that using more sample trees would not significantly affect prediction performance. Finally, Sharma and Parton [
91] stated that for model calibration in general, considering the balance between the model’s estimation performance and the cost of data collection, the use of trees ranging from four to nine trees would be appropriate.
To inform future height–diameter (
h–d) modeling studies across different tree species, a comparison of this study’s findings with previous research [
9,
12,
13,
14,
15,
16,
17,
18,
19,
26,
27,
28,
29,
53] shows that accurate and reliable tree height predictions can be achieved using
ME models, even without incorporating additional stand-level variables such as
H₀,
D₀, number of trees (
N), and
G. This holds true across diverse climatic conditions and forest structures. As a result, the
ME modeling technique has gained prominence in
h–d modeling due to its ability to effectively capture variation in tree height–diameter relationships across different forest types, species compositions, and climate zones.
Because measuring tree height is often challenging and time-consuming, particularly in tropical forests and areas with dense broad-leaved canopies where treetops are obscured, h–d models serve as a practical alternative for estimating tree heights. According to this study, the ME model outperformed the QR model in prediction accuracy. Furthermore, the predictive performance of h–d models can be significantly enhanced by calibrating them with prior information. However, when considering sampling costs such as labor and time, measuring the heights of four or five trees per sample plot is sufficient to calibrate the model effectively for both the ME and QR techniques.
4.2. ML Modeling
Since ML offers key advantages over traditional modeling, as it avoids assumptions, eliminates the need for statistical testing, and does not require calibration strategies, we explored different ML approaches that are appropriate for the data’s size and biological variability.
To ensure a fair and meaningful comparison between the
ML models and the parametric models, two types of
ML models were developed. The first type did not account for diameter variability and was designed to be directly comparable to the
FE and
QR models. The second type incorporated diameter variability among the
k sample plots as input information, making it comparable to the
ME,
MCR, and
MG models, which also utilize this variability. Following this approach, the results (
Table 7) demonstrate that the
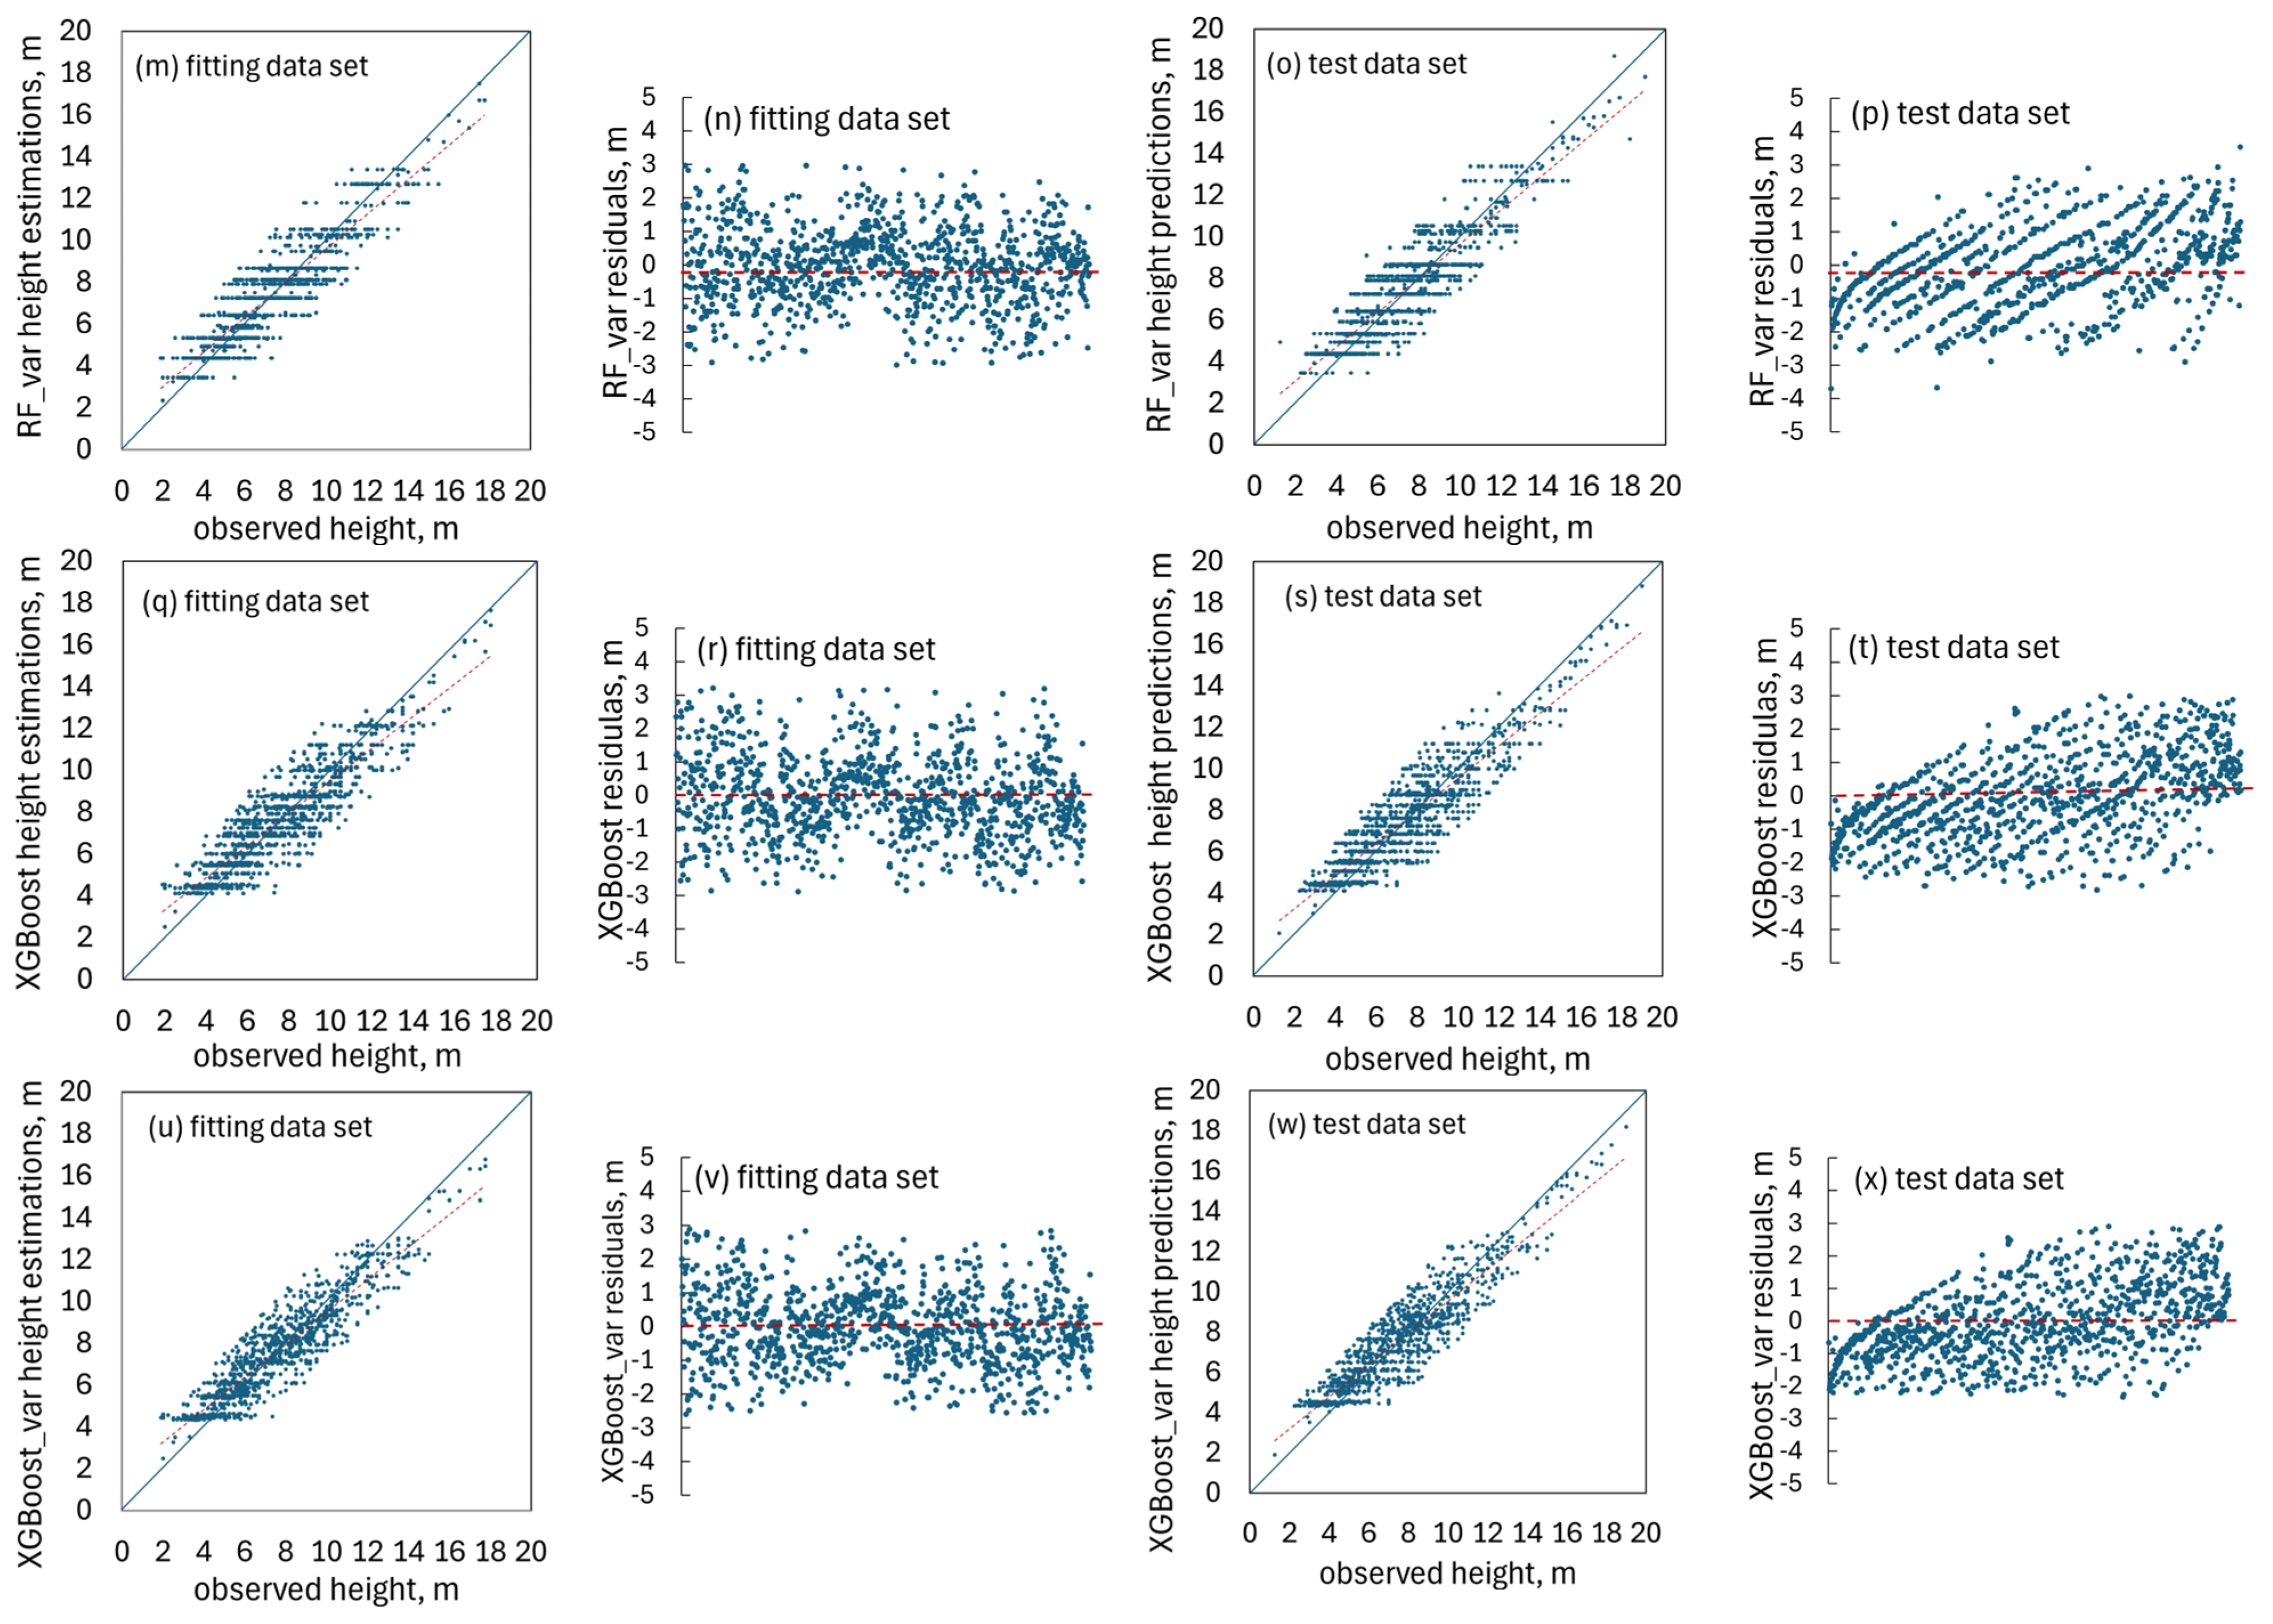
ML models outperformed under both conditions. Specifically,
ML models showed superior adaptability to the data regardless of whether or not diameter variability was included. Notably, even the
ML models that excluded diameter variability outperformed the
MCR and
MG models that did include this information (
Table 7). Furthermore, to ensure a fair comparison across all modeling approaches, predictive performance was assessed only under the condition that none of the models were calibrated (
Table 8). It was further observed that the
ML constructed models, even when using only diameter at breast height as input, outperformed the
ME models, which incorporated additional information across all calibration scenarios (
Table 7 and
Table 9).
Our results were in line with most of the current research outcomes. Zhang et al. [
92] highlighted the
XGBoost algorithm’s superiority as compared to other
ML algorithms along with its effectiveness in large-scale forest height estimation, while Fisher et al. [
93], dealing with map timber harvest types and ages, suggested the use of
XGBoost algorithm, which can effectively work with light detection and ranging (
LiDAR) metrics and forest harvest data as model predictors. On the other hand, Fareed and Numata [
94] evaluated different
ML approaches and concluded that the
RF algorithm produced the most accurate above ground biomass estimates for dense tropical canopy conditions, when tree height error correction is applied. Furthermore, recent studies have shown that finding accurate and reliable
h–d relationships is challenging, requiring new and robust methodologies to be applied for this task [
49,
50,
51,
52,
53,
54,
55]. On the other hand, parametric, semi-parametric, and
ML models were tested [
95] for
h–d model construction and it was found that the semi-parametric generalized additive model can provide the most accurate results. For this reason, further research is required across a broader range of tree species and forest attributes for the general performance and behavior of different machine learning algorithms to be explored.
4.3. Comparative Effectiveness of Modeling Approaches Used
Based on the results obtained, the
XGBoost modeling approach, without applying any calibration strategy, demonstrated the highest accuracy (
Table 7 and
Table 9) and reliability (
Table 8) among the evaluated models. Specifically, the estimation RMSE values (
Table 7) produced by the
XGBoost model were reduced by 23.3%, 8.4%, and 7.28% compared to the
FE, MCR, and
MG models, respectively, and by 2.2% and 1.6% compared to the
S_MLP and
RF models, respectively. Similarly, the
XGBoost_var model, which accounts for plot variability, achieved estimation RMSE reductions of 5.1%, 14.4%, 13.9%, and 14.7% compared to the
ME, 3
QR, 5
QR, and 9
QR models, respectively, and reductions of 3.8% and 2.6% compared to the
S_MLP_var and
RF_var models.
A consistent trend was observed in the prediction RMSE values (
Table 8), where the
XGBoost model again outperformed others, with reductions ranging from 26.5% to 1.1% relative to the
FE,
MCR, MG, S_MLP, and
RF models.
Taking into account the results derived by the ML approaches, whether they take into account the variability among plots or not, they can work very well with moderate-sized datasets, as the available dataset showed their flexibility along with their ability to handle the inherent nonlinearities of the total tree height by producing adequate h–d models. However, drawbacks are hidden behind each ML modeling technique, which has to be taken into account in order to select the most appropriate for each different task. Although it is not required for ensemble methodologies, feature scaling is used in all approaches to apply a proper methodological approach to the problem. Furthermore, shallow MPL is not as robust to overfit as the two ensemble methodologies are, while the ensemble methodologies are of higher accuracy. Still, at the same time, they require more effort and computational time for their numerous hyperparameter tunings.
Taking into account the complexity of each modeling system investigated, the requirements that must be met either in terms of field or office work, and finally taking into account the accuracy and reliability of the estimates and predictions it produced, as well as the practical application of each modeling strategy, it seems that the XGBoost can be considered as a valuable alternative to parametric modeling and a reliable technique as compared to the rest of the ML modeling techniques explored for h–d model development.
5. Conclusions
Reliable h–d model construction is fundamental in forest management practice, since it can significantly help in forest productivity assessments, carbon accounting and sustainable harvest planning and can effectively support forest growth and yield modeling. Furthermore, the combination of accurate h–d models with Unmanned Aerial Vehicles and LiDAR can enable forest monitoring and mapping, reducing field inventory efforts.
Parametric and non-parametric h–d models were developed for Juniperus excelsa (Crimean juniper) using various advanced modeling techniques, including FE, ME, QR, S_MLP, RF, and XGBoost.
Multiple calibration strategies were applied to parametric models, with the ME approach consistently outperforming others across all calibration sample sizes. Notably, ME models achieved high predictive accuracy without requiring additional stand-level covariates. The fifth quantile (5QR) model yielded the most precise predictions among the QR approaches. Among the QR models tested, the 5QR model produced the highest accuracy. Finally, expanding sample size localization from four to five trees had only a negligible impact on the accuracy of estimations for Crimean juniper, supporting that beyond a certain threshold, adding more sample trees does not significantly enhance the predictive capability of the models.
Non-parametric ML models operate independently of calibration and distributional assumptions and demonstrate strong potential in modeling the complex, nonlinear relationship between tree height and breast height diameter. Among these, XGBoost exhibited superior predictive accuracy and reliability, outperforming S_MLP, RF, and all parametric alternatives. Specifically, it reduced RMSE values by 23.3%, 8.4%, and 7.28% compared to the FE, MCR, and MG models, respectively, and by 2.2% and 1.6% compared to the S_MLP and RF models.
Given the comparative advantages in handling moderate-sized, nonlinear datasets, which is a common scenario in forest modeling, XGBoost emerges as a robust and effective tool for h–d model development, which is fundamental in forest management practice. That is, the XGBoost approach can offer a reliable alternative to traditional parametric methods. This approach is thought to be able to significantly help in forest productivity assessments, carbon accounting, sustainable harvest planning, and effectively support forest growth and yield modeling. Furthermore, combining accurate h–d models with Unmanned Aerial Vehicles and LiDAR can significantly boost forest monitoring and mapping, reducing field inventory efforts.
