Article

Genetic Analyses of a Mixed Oak Stand at the Xeric Limit of Forest Climate and Its General Consequences for In Situ Conservation Management

1
Department of Botany, Institute of Agronomy, Hungarian University of Agriculture and Life Sciences, (MATE) Villányi út 29-43, 1118 Budapest, Hungary
2
Forest Research Institute, Department of Tree Improvement, University of Sopron, Várkerület 30/A, 9600 Sárvár, Hungary
3
Department of Applied Statistics, Institute of Mathematics and Basic Science, Hungarian University of Agriculture and Life Sciences, Villányi út 29-43, 1118 Budapest, Hungary
*
Authors to whom correspondence should be addressed.
Forests 2025, 16(6), 939; https://doi.org/10.3390/f16060939
Submission received: 5 May 2025 / Revised: 29 May 2025 / Accepted: 30 May 2025 / Published: 3 June 2025
(This article belongs to the Special Issue Genetic Variation and Conservation of Forest Species)

Abstract

:
Forests in the Tolna region (Hungary) are distributed at the xeric limit of broadleaved forest zones and adapted to the arid ecological conditions of the wood-steppe climate. An 85-year-old in situ gene conservation stand of Quercus virgiliana mixed with other taxa of section Quercus was studied, which was regenerated naturally by both seedlings and coppicing. To analyze the phenotypes growing within the stand and the genetic structure of the population, a total of 138 trees were sampled. For taxonomic classification, a complex of morphological traits of oak taxa growing naturally in the region was used. Out of the 12 morphotype groups, only a few trees were classified as Q. virgiliana (eight individuals) or Q. robur (nine individuals), and the majority of the trees (121 individuals) were hybrid or introgressed phenotypes of Q. virgiliana adapted to xeric conditions by its xeromorphic traits. Despite the high number of coppiced trees (89 pcs vegetatively regenerated), the genetic variation was relatively high based on 16 nSSR markers used for analyses. Some of the trees were classified as non-autochthonous with Slavonian oak origin, both by morphological traits and SSR structure. Despite some alleles being lost, the allelic diversity of the seedling trees’ group was similar to that of the group of parent generation (coppiced trees). The spatial structure of trees supported the results of morphologic classification, and Q. virgiliana and hybrid phenotypes were growing on xeric microhabitats of the stand, mostly on southeast-facing slopes or ridges of hills. Consequently, the stand might fulfill all the in situ gene conservation requirements based on the high genetic diversity measured and the high number of xeromorphic phenotypes in the context of climate change as well.

1. Introduction

Hungary is located in the central part of the Pannonian Basin, which is affected by continental, Atlantic, and (sub)Mediterranean climatic effects. Therefore, besides deciduous forest associations, the forest-steppe ecosystems are also naturally occurring, mainly at the xeric limit of the forest vegetation zone. As a consequence of climate change, populations at the xeric limit will be further reduced or probably shift into forested vegetation zones at higher altitudes [1,2,3]. Since the Middle Ages, the forest-steppe climatic zone has been intensively used by agriculture [4], and habitats of forest-steppe ecosystems are therefore strongly reduced. Some remnants of forests or even wood pastures are left, composed dominantly of drought-tolerant oak taxa such as Quercus dalechampii Ten., Quercus virgiliana Ten. [5,6,7] The relevance of evolutionary and genetic consequences of environmental changes on forest trees’ distribution, especially at the xeric limit of forest zones, was already recognized [8] but has not been sufficiently studied yet. This study aimed to describe and analyze a remnant mixed oak forest stand at the edge of the Hungarian Great Plain.
In the temperate deciduous forest vegetation zone, taxa of the genus Quercus are the most crucial forest stand-forming species. The richness of oak species in Europe is relatively low compared to the American and Asian regions. The reasons can be rooted back to glacial periods, as the natural barrier effect of the east-west mountain ranges of the European high mountains (Pyrenees, Alps, Carpathians, etc.) caused a strong bottleneck effect on many plant species, including oak populations as well [9,10,11,12]. However, some microrefugial effects have also been observed in a few regions of Europe, such as in the Pannonian Basin [13], where various fossil data also support the hypothesis of micro- or secondary refugia [9,12,14,15]. Recently, three common oak species of Section Quercus [16] have naturally occurred in Hungary such as Quercus robur s.l., Quercus pubescens s.l., and Quercus petraea s.l. The sessile oak Quercus petraea s.l. in Hungary includes Quercus dalechampii, a taxon distributed in the Balkans and partly in the Apennine peninsula, and Quercus polycarpa Schur with an Eastern Mediterranean area distributed at the Balkan peninsula and further east (Turkey, Caucasus, and Iran) [17,18,19]. The taxonomic status of Q. dalechampii is controversial; Italian authors classified the taxon in the Q. pubescens species complex [20]. The occurrences in Southeast Europe and the Pannonian basin are considered as a sessile oak taxon classified into the Q. petraea complex, but its nomenclature is under discussion with synonyms: Quercus banatus [21,22] and Quercus aurea [22,23]. The taxonomic status of Q. virgiliana in the pubescent oak complex [17,24,25,26] and Quercus pedunculiflora K. Koch in the pedunculate oak complex (whose areas are similar to those of the previous taxa) is also disputed. These taxa from the Eastern Mediterranean region were found in semi-natural woodlands by local botanists 100–150 years ago [27,28] or are currently associated with the typical oak forest communities [29,30,31]. Hybrids and introgressed forms are also common in the Quercus section, which are not easily distinguishable by molecular genetic markers [20,32,33,34]. Nevertheless, the frequent hybridization is considered a driving force for the success of the genus Quercus [35,36].
Oaks are typically stand-forming, wind-pollinated species whose pollen is produced in large quantities and can travel long distances, even at high atmospheric levels. Several studies have been conducted to determine the effective population size and the extent of the external-internal pollen flow [37,38,39]. As in the case of other wind-pollinated species, the progeny populations are typically derived from a few dominant pollinators and mother trees, and the external pollen ratio can be as high as 60% [37,38,39,40,41,42]. External pollen effects both increase and maintain genetic diversity [37,40] and increase the chances of hybridization [33,35,39,41,43]. In the case of oaks, both factors have a strong influence, which is also reflected in the oak genome [43] and also plays a relevant role in the conservation strategies of peripheral populations [44].
Besides their well-balanced generative mating system, vegetative reproduction is the other key factor forming population structure in the case of the genus Quercus. This capability was often used when oak forests were clear-cut for timber production, and they were mostly coppiced (vegetatively regenerated) [45]. In the coppiced stands, where seed-originated trees can only occasionally be found, vegetative individuals can occur over several generations. It can be highly important for gene conservation activities, as representatives of the former natural population and its gene pool [46], whether in situ or ex situ conservation methods are used.
The conservation and use of forest genetic resources have recently reflected a growing interest. The drought-tolerant oak taxa are also in focus for the pan-European gene conservation strategies and efforts [EUFGIS database, http://portal.eufgis.org/, accessed on 28 May 2025), EUFORGEN https://www.euforgen.org/species, accessed on 28 May 2025)]. In the Tolna Region (Hungary), a complex gene conservation program for Q. virgiliana was started in 2017. According to EUFORGEN criteria, remnants of old oak forests were inventoried as possible in situ gene conservation stands. In many cases, plus trees were also selected for further ex situ gene conservation activities [7,47].
As a part of this gene conservation program, a mixed oak stand, composed partly of coppiced Q. virgiliana trees, was selected and registered as an in situ conservation stand. To verify the minimum criteria of the EUFGIS conservation units (autochthony, target species, etc.) and to study the genetic constitution of the conservation stand, individuals of all taxa of section Quercus were selected and analyzed to get answers to the following questions:
-
What is the proportion of the drought-tolerant Q. virgiliana and/or putative hybrids of other taxa of the section Quercus based on morphological traits vs. genetic markers?
-
What is the proportion of trees within the population that are of vegetative (previous parent generation) and seed (progeny generation) origin, and what is the proportion of ‘identical genotypes’ (clones)?
-
Are there any differences in the genetic structure (gene pool?) between the previous generation (coppiced trees) and the offspring generation, e.g., allele number, heterozygosity values, possible loss of alleles, or the emergence of new alleles? Are there any genetic differences due to foreign origin (planted trees)?
-
Is the spatial distribution of trees, taxa, or putatively specific genotypes influenced by any microhabitat factors (topography, exposure, soil hydrology)?
-
Finally, is the gene pool of this population suitable for effective and long-term in situ gene conservation, and what aspects and factors should be considered? What silvicultural methods should or can be applied, particularly in a landscape dominated by arable lands and meadows?

2. Materials and Methods
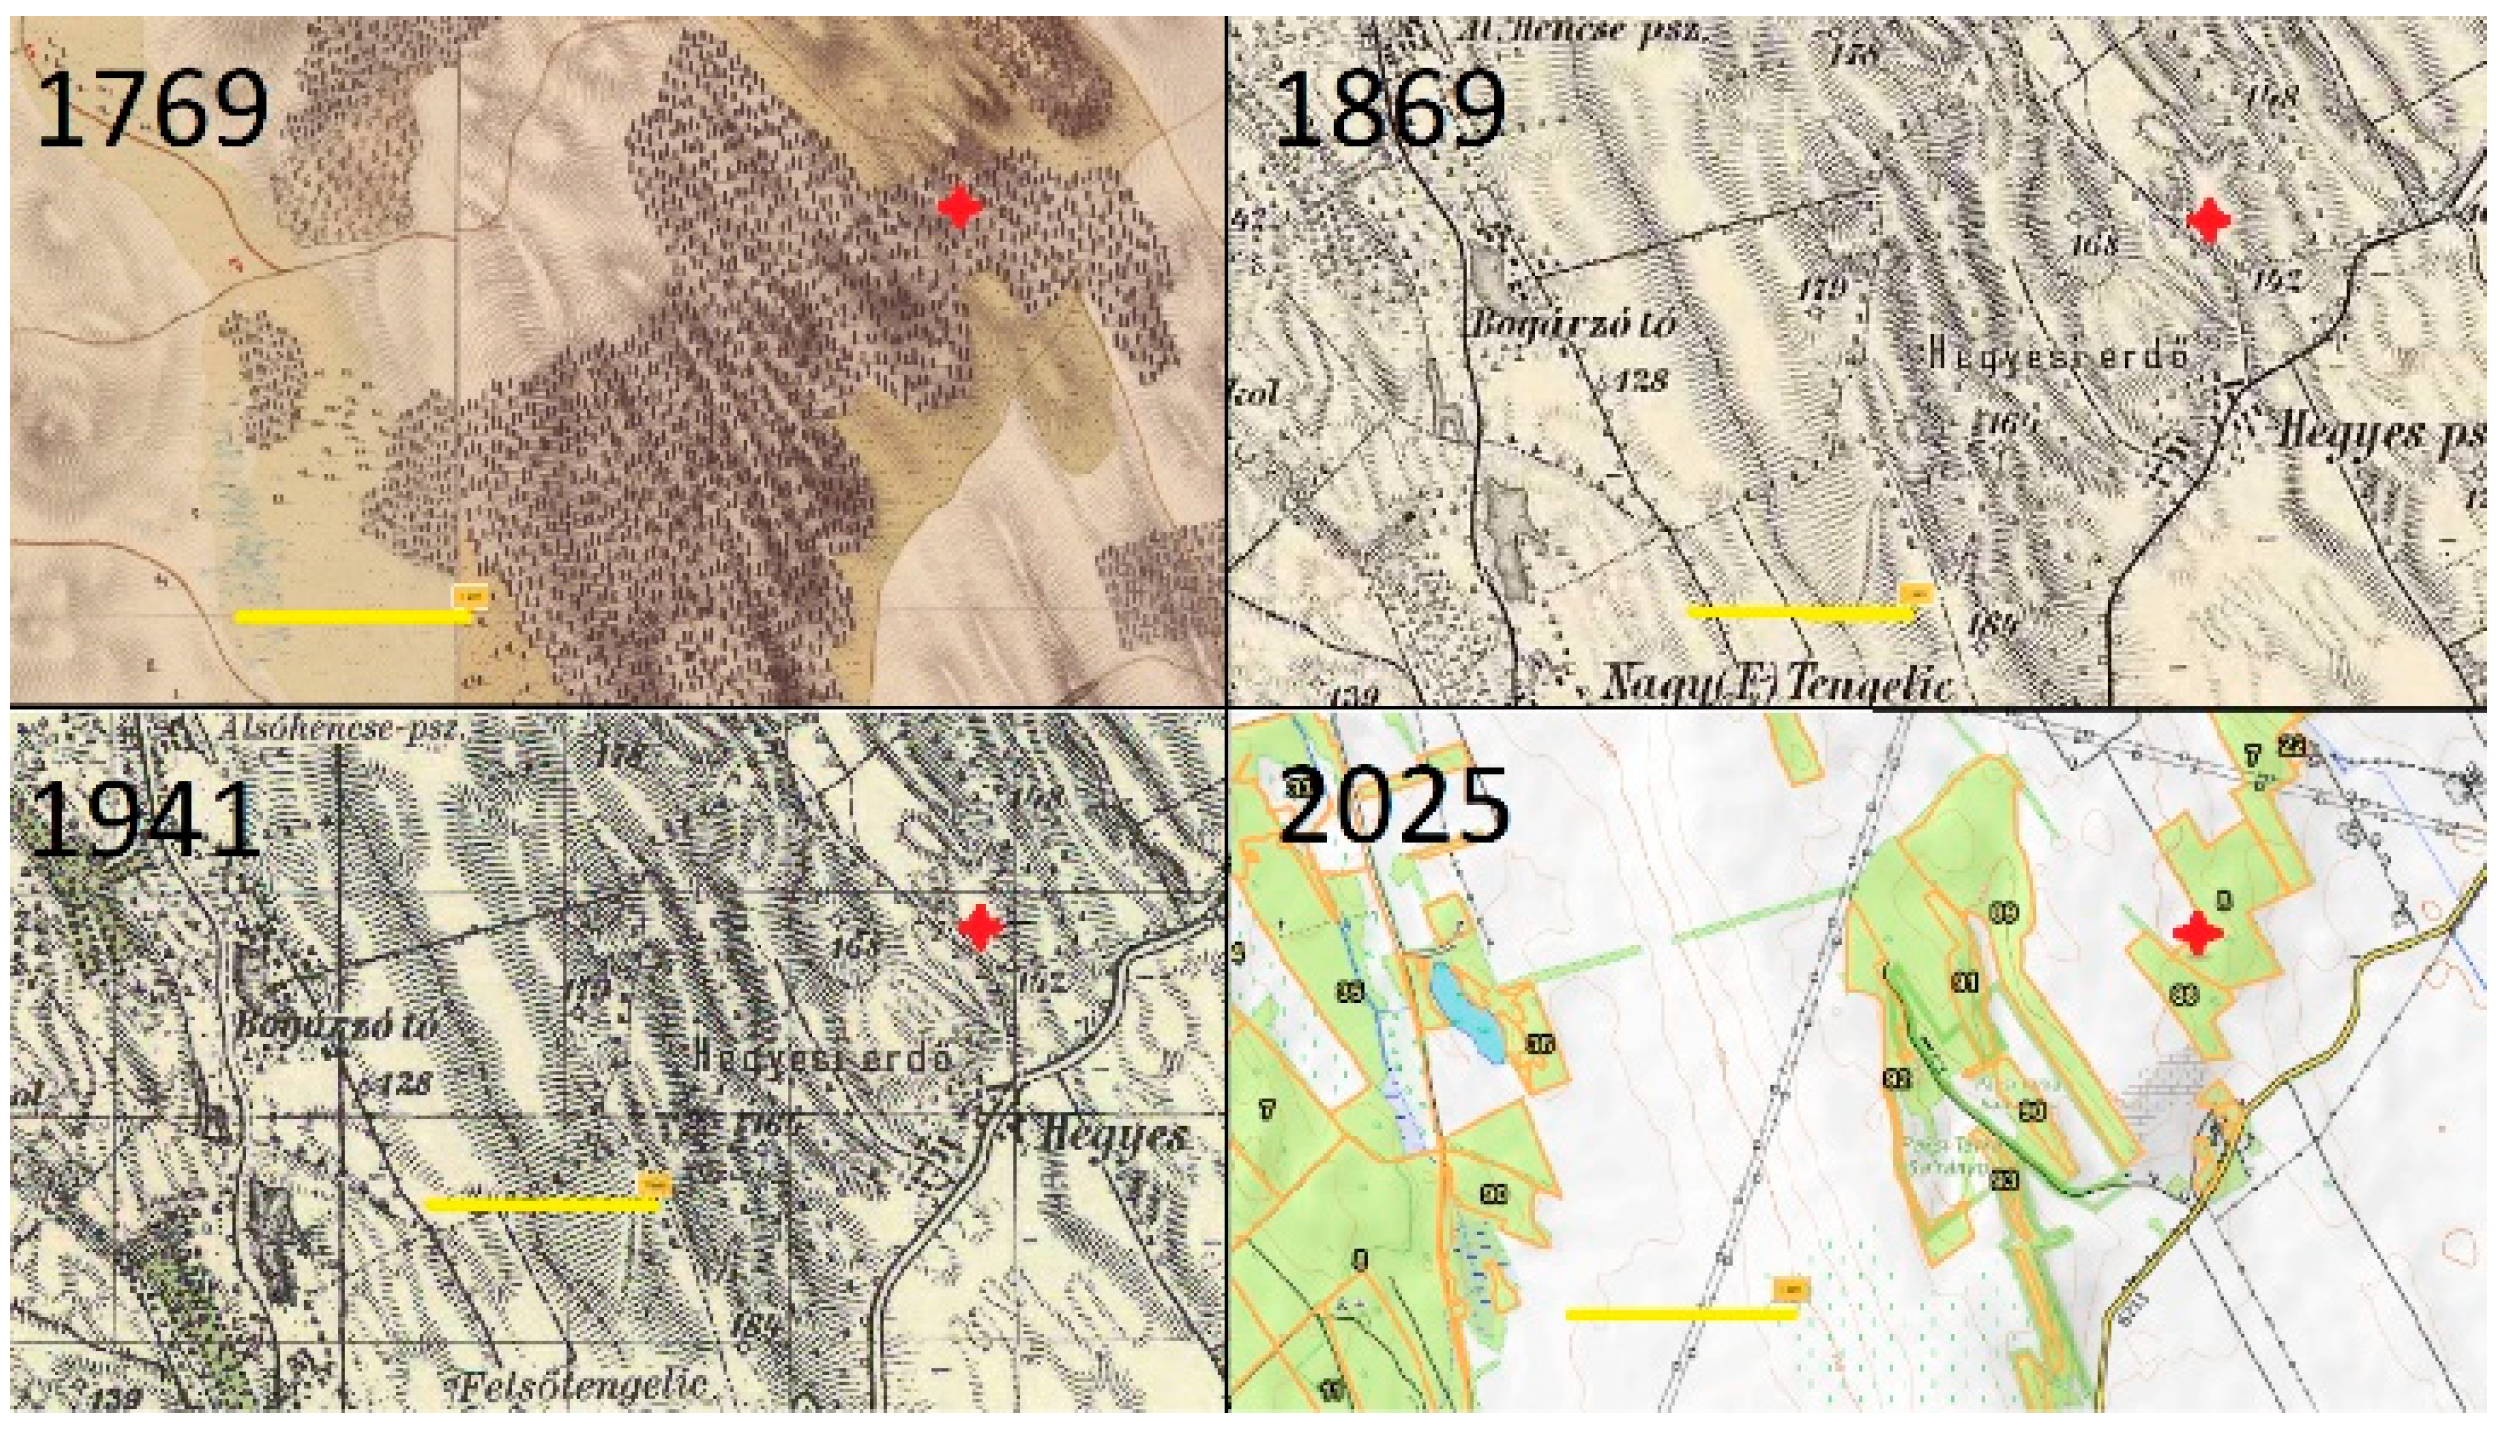
The study site is a 3 ha mixed oak stand in Pusztahencse (Tolna region, Hungary, geographical location: 46.575940° N, 18.771783° E; 136−150 m a.s.l.) The stand, managed by the Gyulaj State Forest Corporation, is composed dominantly of Q. virgiliana and its hybrids, Q. petraea s.l., Q. robur s.l. and Q. cerris individuals, was selected. The stand is surrounded by agricultural lands where the ecological conditions are not optimal for forest populations (forest-steppe climate, mean temperature of 20–21 °C in July and −1–0 °C in January, annual precipitation of 500–550 mm, admixture of calcareous sand and loess soil). Further climate information based on recent weather measurements is available at http://www.ertigis.hu (accessed on 28 May 2025).
The forest compartment (Pusztahencse 8/D) was registered as an in situ Q. virgiliana gene reserve, and a plus tree selection for ex situ purposes was also carried out. The stand is 85 years old (recorded), but due to the high proportion of coppiced trees, the estimated age might be at least 150–200 years or more. Based on the forestry management plan data, the stand was clear-cut 85 years ago and regenerated by seedlings of natural regeneration and partly by coppicing. During the regeneration and replacement period, Q. robur seedlings were artificially planted in a few patches within the stand, identified as Slavonian oak based on its phenotypic traits and specific habitus [48]. The presumably natural origin and the history of the stand can be proved based on the following historical military maps and the recent forestry database:
According to military maps, the area was part of a forest block as early as 1782. Over the past nearly 250 years, the area has been clear-cut and naturally regenerated (coppiced) several times, according to the data of forestry management plans. The historical maps record the area with the name “Hegyesi” forest (Figure 1).

2.1. Sampling of Plant Material, Analyses of Morphological Traits

A total of 138 trees were described by morphological traits, from which 97 were coppiced (vegetative origin), and 41 were saplings (seed origin). In 2019, 39 trees (IDs 21–59) were selected based on their pubescent phenotype and described as Q. virgiliana and dominantly Q. virgiliana hybrid plus trees. In 2022, 99 trees were additionally selected (IDs 61–159) and described as pure species and hybrids from the Quercus section using a standardized plus tree description sheet. The georeferences and origin (by seed vs. coppiced) were recorded (Figure 2 and Table S1). Quercus cerris individuals were excluded from the analyses as they belong to the Cerris section and do not hybridize with the taxa of the Quercus section.
When field surveys were carried out, some Q. robur trees were clearly distinct from the local genotypes and looked like Slavonian oak-type trees, based on their specific growth habitus [48]—straight trunk, spreading root, crown branches upright, etc.—described at the field survey and recorded on the description sheet.
Branches were collected from the light crown of the trees in June-July 2019 and 2022. Acorns with cups, where possible, were also collected in 2019 and 2024 for morphological description and evaluation. The taxonomic status of the trees was described based on morphological traits evaluated on-site, such as characteristics of bark, twigs, buds, leaves, flowers and fruit described for all the autochthonous oak taxa [49,50,51,52,53]. The values and rates were recorded on a field description sheet used in general for the gene conservation program [7]. All the characteristics (measured and rated) were evaluated at the same level of statistical weighting. The trees were assigned into six putative taxonomic groups (‘virgiliana’, ‘dalechampii’, ‘petraea’, ‘polycarpa’, ‘pedunculiflora’ and ‘robur’) based on aggregated values of each taxon-specific characteristic. Trees with simple taxon-specific aggregated values were classified into a single taxon group (e.g., V = virgiliana), and the trees with intermediate or mixed characteristics were clustered into a hybrid group of two species, depending on the dominance of the taxa by each (e.g., VPET = virgiliana × petraea). The trees, which were admixed of three or more taxa, were clustered into a ’hybrid’ group, depending on the dominant taxon characteristics (e.g., DH = dalechampii × virgiliana × robur).
In addition, the collected herbarium material was measured from several points of view, and all the characteristics (on-site and laboratory measurements) were merged and synthesized. Hypothetically, six taxa were expected to occur on the site. The factors studied are listed in Figure 3; for the rated characteristics we used specific value scales: 1–2 = yes/no, 1–3 = yes/somewhat/no, 1–4 = firmly/moderately/weakly/no, 1–5 = acorn color: copper/green/ochre/brown/dense multicolored and 1–5 = acorn widest part: lower third/lower third-medium/medium/medium-top third/top third, 1–6 = taxon classification: 1 = Q. virgiliana (V), 2 = Q. dalechampii (D), 3 = Q. petraea (PET), 4 = Q. polycarpa (POL), 5 = Q. pedunculiflora (PED), 6 = Q. robur (R). The field description sheets and the herbarium are available at the MATE Department of Botany.
Morphological taxon groups (138 trees) were plotted using QGIS (v 3.36.0) to examine spatial patterns, and a map was created to separate native and non-native lineages of seed and vegetative origin.

2.2. Statistical Evaluation of Taxonomic Descriptors

The dataset of morphological traits was analyzed to test the validity of taxonomic descriptors used on description sheets. A cluster analysis was performed using Ward’s hierarchical method based on calculating Euclidean distances between the individuals from 16 generative and 17 vegetative variables. The nominal variables were first encoded to binary variables, and all were scaled. After data preprocessing, statistical analyses were conducted in R using the packages (Version R 4.4.2) ‘cluster’, ‘factoextra’ [54], ‘dendextend’ [55], and ‘ggplot2’ [56]. The morphotype groups classified in the field were then visualized using a dendrogram. The resulting morphological groups, generated from the field and statistical data, were compared to verify the “visual”-based taxon descriptors.

2.3. Microsatellite Analyses

Total genomic DNA was isolated from fresh leaves following the modified CTAB procedure [57,58]. DNA concentration was measured by Qubit 4 Fluorometer (Thermo Fisher Scientific, Waltham, MA, USA) and standardized to 10 ng/µL. Sixteen SSRs were used for amplification of nuclear microsatellite loci, namely QpZAG 15, QpZAG 20, QpZAG 110, QpZAG 1/5, QpZAG 36, QrZAG 7, QpZAG 16, QpZAG 9 [59], QrZAG 11, QrZAG 112, QrZAG 87, QrZAG 96, QrZAG 30, QrZAG 101 [60], MSQ 13 and MSQ 4 [61]. Among them, for six primer pairs (QpZAG9, QpZAG1/5, QpZAG16, QrZAG7, MSQ4, QpZAG36), the universal M13 (-21) fluorescent dye label method by Schuelke [62] was applied. The GoTaq G2 Flexi (Promega, Madison, WI, USA) polymerase kit was used for the PCR. PCR protocols are summarized in Table S2. PCR fragments were separated on a 1.75% agarose gel in 1× TAE buffer, stained with GelRed (Biotium, Fremont, CA, USA). Then, fragments were diluted (up to 20-fold) for capillary electrophoresis to obtain an appropriate concentration and multiplexed by dye and size in formamide (Hi-Di, Applied Biosystems, Waltham, MA, USA) using GeneScan LIZ 500 (Applied Biosystems) internal size standard. SSR genotyping was performed on an ABI 3730 DNA Analyzer (Applied Biosystems) by BIOMI Ltd. (Gödöllő, Hungary).

2.4. Population Genetic Analyses

Following the fragment analysis, allele variants were scored by the Osiris 2.16 software (https://www.ncbi.nlm.nih.gov/osiris/overview/, accessed on 28 May 2025). The software GenAlEx 6.5 [63,64] was used to evaluate the genotypic data. The different fragments were used as allele variants to specify the unique genotypes for each sample. Seventeen samples out of the total 138 were deleted from further analysis due to missing values on more than two loci. Therefore, for the whole genetic evaluation, 121 samples were used.
First, matching genotypes were checked, searching for putative clones. The index probability of identity (PID) was calculated in GenAlEx for the applied 16 SSR markers to check the resolution of the marker set.
Population genetic analyses were carried out, applying different approaches both on the individual level and on the level of taxonomic groups.
The following main population genetic parameters were calculated in GenAlEx in the mean of the 16 markers based on the frequency values of the allele variants: number of alleles (Na), number of effective alleles (Ne), number of private alleles (Np), Shannon diversity index (I), observed heterozygosity (Ho), expected heterozygosity (He), unbiased expected heterozygosity (uHe), and the fixation index (F). The genetic distance matrix was calculated between the taxonomic groups by GenAlEx’s option of GDpop, and a principal coordinate analysis (PCoA) was derived based on the genetic distances. For the visualization of the PCoA plot, the R package ggplot2 [56] was used.
The partitioning of the molecular variance was evaluated by AMOVA in GenAlEx with 999 repetitions. The pairwise Fst values and the significance level were interpreted in a heat map matrix format using the R package ‘ggplot2’.
Individual genotypes were also evaluated using the Bayesian clustering method by STRUCTURE [65]. The cluster numbers 1–6 were tested, and the Evanno method was applied to evaluate the most probable K cluster [66] using the R package ‘pophelper’ [67]. The ancestry of the individuals was plotted using QGIS (v 3.36.0) to examine spatial genetic patterns of the stand (121 trees). Population genetic indices were also calculated for the defined clusters.
Finally, the genetic structure of the stand was also evaluated based on the reproductive origin of the individuals, dividing the samples into two main groups: autochthonous seed origin (age 85 yrs) and autochthonous vegetative origin (age min. 150–200 yrs). Four leading indices were compared in the different genetic clusters of the two main groups: the number of private alleles (Np), the observed heterozygosity (Ho), unbiased expected heterozygosity (uHe), and the fixation index (F).

2.5. Test of Autochtonity

A chloroplast microsatellite analysis was performed to verify the origin (autochthony) of some selected trees. The minimum sample number was decided based on the conceptualization of a previous haplotype study [11] to sample at least 10 trees within a stand for chloroplast haplotype analyses. According to this protocol, four putative non-autochthonous (Slavonian oak) trees (ID 92, 97, 99,147,) and seven others (ID 24, 28, 32, 80, 100, 125, 150) were chosen, considered native, containing both seedling and coppiced trees, and classified into different taxon groups. Ten chloroplast SSR markers were selected and arranged in two multiplex mixes from the cmcs-series [68], the ccmp-series [69] and the µdt/µkk-series [70]: Mix1) cmcs9 (VIC), cmcs1 (6FAM), ccmp6 (PET), cmcs8 (NED), cmcs6 (VIC), cmcs7 (6FAM), Mix2) µdt4 (PET), µdt3 (6FAM), µdt1 (VIC), µkk4 (NED). Primer pairs were synthesized with a universal M13(-21) tail on the 5’ end of the Forward primer following the description of Schulke [62] by IDT (Integrated DNA Technologies Inc., Coralville, IA, USA). Fluorescent dyes compatible with the Applied Biosystems G5 Matrix were used on the universal M13 (-21) primer 5′ end. For the PCR, the GoTaq G2 Flexi (Promega, Madison, WI, USA) polymerase kit was used, and the protocol described by Schulke [62] was applied. PCR fragments were separated on a 1.75% agarose gel in 1× TAE buffer, stained with GelRed (Biotium, Fremont, CA, USA). Then, fragments were diluted (up to 20-fold) for capillary electrophoresis to obtain an appropriate concentration and multiplexed by dye and size in formamide (Hi-Di, Applied Biosystems, Waltham, MA, USA) using GeneScan LIZ 500 (Applied Biosystems) internal size standard. SSR genotyping was performed on an ABI 3730 DNA Analyzer (Applied Biosystems) by BIOMI Ltd. (Gödöllő, Hungary).
Following the fragment analysis, allele variants were scored by the Osiris 2.16 software (https://www.ncbi.nlm.nih.gov/osiris/overview/, accessed on 28 May 2025). The software GenAlEx 6.5 [64] was used for the data analysis. The different fragments and their frequencies for each marker region were detected, followed by the specification of the unique haplotypes for each sample. A genetic distance matrix was calculated based on the stepwise mutation model for each haplotype by GenAlEx, and a principal coordinate analysis was conducted based on this matrix to represent the genetic relatedness between the detected haplotypes.
The spatial distribution of native and non-native individuals within the stand was plotted on a map.

3. Results

3.1. Phenotype Classification Based on Morphological Traits

Following a fine-scale approach, 138 trees were selected. For the on-site description, a set of morphological traits was used, focusing on the characteristics of bark, leaf, twig, bud, flowers, and fruit (if available). The characteristics of all the trees were recorded on the plus tree description sheets. Hypothetically, six taxa, such as Q. virgiliana (V), Q. dalechampii (D), Q. petraea (PET), Q. polycarpa (POL), Q. pedunculiflora (PED), and Q. robur (R) were expected to be occurring. The specified classification method, listed in Figure 3, was used for taxonomic descriptions of all the trees on-site. In the case of admixed traits, groups of transitional taxon variants were formed based on the dominance of each characteristic. The following 12 morphotype groups were determined: uniform: V(8), R(9) and transitional: DH(7), PETH(14), PETV(7), RPED(14), VH(11), VD(13), VDPET(17), VPET(19), VPETD(15), VR(4) (number of individuals per groups in brackets). Trees with any characteristics of Q. polycarpa were not detected and described on the study site, so this category was excluded from further statistical analyses.
Due to a lack of acorns during the 5-year study period, acorns could be sampled only on 75 trees out of the 138. Therefore, the characteristics of acorns were excluded from further statistical analysis. Generative traits were used only for the taxonomic classification in the field. The dataset of morphological traits, both measured and rated on all 138 trees (phenotypes), was analyzed and clustered by Ward’s hierarchical method. The multivariate morphology statistic evaluation, specifically Ward’s clustering, was a tool used to assess the effectiveness and accuracy of the original on-site description. For the clusters, a distance matrix was constructed and plotted as a dendrogram (Figure 4).
The dendrogram structure and colors were based on statistical measurements and dissections, while the labels were applied according to 12 morphotype groups classified on-site. Two small groups (incl. only four trees) were merged for statistical analysis (VR virg × rob and RV rob × virg = VR group). As a result, the 12 morphotype groups described on-site are clearly distinguished on the dendrogram.

3.2. Genetic Analyses

3.2.1. Microsatellite Analyses

All 16 nSSR markers used were well amplified and polymorphic in the sample set tested. Out of 138 trees, 121 individuals were genotyped and analyzed. Only two clone pairs were found: 110–111 (VPETD) and 149–150 (R), based on nSSR-genotyping. The low PID value (PID = 3.19 × 10⁻²⁶) indicates that the probability of random matching is negligible, so individuals with the same genotype detected can be considered as actual clones of vegetative origin. Based on the microsatellite genotyping, trees ID 97 and 99 were found to be siblings, and they were described on-site as planted non-autochthonous trees.
Using principal coordinate analysis (PCoA) derived from the genetic distance matrix of the morphotype groups, we visualized the genetic relationship and separation between the groups by considering the principal coordinates PC1 (80.33%) and PC2 (7.77%). Figure 5 shows that the R and RPED groups are well separated, with the groups that also show PET characters being relatively close to each other in the lower left quadrant and the groups that also show V and D characters being in the middle and upper left quadrants. The separation of the small groups DH(7) and PETV(5) can be a spurious result of the low sample size of the groups. The gene pools of the autochthonous ancestry genotypes are similar despite differences in phenotypic appearance, as shown by their positioning to the left of the PC1 axis.
The main diversity indices calculated from the allele frequency values were first evaluated for the field morphological groups (Table 1). Since three of the morphotype groups (PETV, R, VR) had critically low sample numbers, and two other groups (DH, V) had moderately low sample numbers, their values should be treated with caution in the comparison.
Regarding allele structure, the VPET group had the highest number of alleles observed (Na), followed by the VDPET and VPETD groups. The VPET, VPETD, and VDPET groups also had the highest values for the effective allele number (Ne), with the addition of the RPED group. Unique alleles (Np) were observed in all groups, partly due to the large marker size and diversity. However, the RPED group had an outlying (1.688) value for unique alleles. The following two groups with the highest values were PETH and VPETD (with a value of 0.625), but they were well below the value of RPED. The groups with the highest diversity expressed by the Shannon index (I) were VPET, VPETD, and VDPET.
Regarding the observed heterozygosity (Ho) indices, the highest values were found in the VD and VR groups, and the lowest were in the V and PETV groups. In terms of expected heterozygosity (He), VPET, VPETD, VDPET had the highest values. The PETV group had the lowest values for both observed and expected heterozygosity. However, heterozygosity values were balanced between groups and were high with the markers used.
Concerning the fixation index (F), a slight shift in the positive direction was observed in three cases compared to the equilibrium state around 0, indicating a homozygous surplus (i.e., fixation of some alleles) in groups V, VPET, and VDPET.
Molecular analysis of variance (AMOVA) was performed to further investigate the genetic segregation of morphological taxon groups. The variance distribution was as follows: 2% among populations, 11% among individuals, and 87% within individuals. The pairwise Fst matrix derived from the AMOVA, showing the differentiation between taxon groups, was plotted on a heatmap (Figure 6). The R and RPED groups are significantly distinct. At the same time, no significant differences can be observed between the other groups.

3.2.2. Analyses of Individual Genotypes

In the STRUCTURE analysis, the most probable cluster number was K3 according to the Evanno method out of the tested K1-6 clusters. A hidden subcluster can also be observed in the K4 clustering. Therefore, both clustering results are presented in Figure 7. Regarding the morphological classification of the samples in each cluster, cluster 1 (dark blue) group typically contains R and RPED samples, and cluster 4 (yellow) group, which appears as the fourth subcluster, mainly contains VD-type individuals. The other two large clusters, cluster 2 (light blue) and cluster 3 (red) are more heterogeneous regarding species composition. Still, the petraea type typically dominates the light blue, while the red group mainly contains virgiliana-type samples.
To gain insight into the genetic patterns of the clusters separated by STRUCTURE and to explore their differences, we also calculated the main population genetic indices along the K4 clusters (Table 2). We considered one genotype belonging to a given cluster if the value of the posterior probabilities of individual assignment reached 80%. Below this threshold, they were assigned to the mixed group (introgressed forms or true hybrids). The allele number (Na) was partly explained by the sample size of the groups, highest in the mixed group (individuals with ambiguous ancestries) and cluster 3 and lowest in clusters 4 and 2. The effective allele number (Ne) was highest in the mixed group and in clusters 3 and 1, which were also the most diverse in terms of the Shannon index (I). The unique allele number (Np) was the highest in the mixed group, followed by clusters 1 and 3. The observed heterozygosity (Ho) was the highest in cluster 1 and in the mixed group, while the expected heterozygosity (He and uHe) indices were the highest in the mixed group and cluster 3. The fixation index (F) values indicated an approximately equilibria state, with values close to 0 in the cases of clusters 1 and 2. A shift towards homozygote excess was observed in cluster 3, while a slight heterozygote excess appeared in cluster 4.

3.2.3. Genetic Structure of Coppiced vs. Seed-Originated Cohorts

We also analyzed the gene pool of the putatively parental (coppiced trees) and offspring (generative saplings) generation (Table 3). The two groups (seed/vegetative) were examined according to STRUCTURE K4 clustering, and the values of unique alleles (Np), observed heterozygosity (Ho), unbiased expected heterozygosity (uHe), and the fixation index (F) were compared. The number of unique alleles (Np) is almost equal in the clusters of the two groups, except for clusters 1 and 3. Cluster 1 has an outstandingly high number of private alleles in the seed-originated group. The observed heterozygosity (Ho) values were higher in the clusters of the vegetative group, except in the mixed group. The unbiased expected heterozygosity (uHe) exhibited different tendencies and values among groups compared to the observed heterozygosity. The fixation index, derived from the former two indices, showed a considerable heterozygote excess in the vegetative group of cluster 1, and in clusters 2 and 4 overall. The vegetative group of cluster 3 and the mixed group represented a slight homozygote excess. On the other hand, in the seed-derived group of clusters 1 and 3, as well as the mixed, a near equilibria state could be observed. Since the sample number is very limited in the case of clusters 2 and 4, as well as the vegetative group in cluster 1, we should be cautious in drawing any far-reaching conclusions. Comparison of genetic indicators between coppiced and seed-originated cohorts following the STRUCTURE K4 clustering.

3.3. Spatial Structure

The spatial position of the trees was represented on a map using the geographic coordinates in QGIS 3.36 software. Each tree was plotted with a unique pie chart corresponding to the STRUCTURE K4 grouping (Figure 8). It can be observed that cluster 1 and cluster 4 are spatially separated on the site. The trees belonging predominantly to cluster 2 and cluster 3 also show a small degree of spatial clustering.
The morphotype taxon groups were also plotted to examine spatial patterns (Figure 9).

3.4. Verification of Autochthony

Some of the seed-originated robur trees showed an apparently distinct morphotype typical for the Slavonian type. Furthermore, the nSSR markers also exhibited a remarkable difference between these two robur groups based on the private allele composition; a test of autochthony was also conducted by applying chloroplast SSR markers. The chloroplast genotypes of 11 trees included in the chloroplast DNA analysis were compared, and haplotype analysis confirmed the non-native origin of the planted Q. robur individuals. The haplotypes of these individuals differed significantly from the allele pool of the native stand, where the analyzed individuals shared identical haplotypes. Figure 10 represents the genetic distance of observed haplotypes based on principal coordinate analysis (PCoA).
Haplotypes of the individual ID 92, 97, 99, and 147 are clearly separated from the native group. Based on this result and the identical phenotype of the nine individuals of the 25 trees in the R and RPED groups, described as Slavonian oak on-site, we can conclude that these seed-originated trees are certainly non-autochthonous. Table S3 summarizes the most important differentiating nSSR markers with the private alleles, as well as the haplotype composition of the studied robur trees in the stand. The markedly different gene pool of these genotypes may also influence the strong separation of the two robur-type groups.
Finally, the autochthonous trees, the coppices and saplings, and the putatively non-autochthonous individuals were also mapped in Figure 11 to visualize the spatial structure of the population.

4. Discussion

In the very first phase of the gene conservation program, trees with Q. virgiliana morphological characters (hairiness, bark pattern, etc.) were selected within the population, a total of 39 trees. Following the plus tree selection, the whole stand was registered as an in situ gene conservation stand, although other oak taxa were occurring within the stand. In addition, a further 99 trees were sampled, resulting in 138 samples altogether, which were mapped and analyzed. All the trees included in the study belonged to the Quercus section. In contrast, all the Q. cerris trees were excluded for further taxonomic and genetic analyses. There were nine trees classified as typical Q. robur and eight Q. virgiliana individuals based on morphological traits. Indeed, most of the trees (121 in total) were classified as a hybrid and clustered into one of the hybrid groups by both morphological and genetic analyses. No trees were found, clustered exclusively as a petraea, dalechampii, polycarpa, or pedunculiflora type.
All four Q. robur trees described previously as Slavonian oak type [48] were clearly distinguished from local genotypes by both nSSR and cpSSR markers, as well as based on their growth habitus. The results of genetic analyses supported our hypothesis that non-autochthonous seedlings were introduced and presumably planted into the stand as replacements during or after the reforestation. The differences both in the nuclear and chloroplast genomes were significant (Figure 9 and Figure 10) and confirmed previous scientific evidence that chloroplast haplotypes might be a suitable tool for determining lineages of origin, even at the regional or local level [11,13]. Previous studies [13,48,71] reported that Slavonian oaks were widely planted in Hungary from the end of the 19th century up until the present. The Slavonian oak samples represented Haplotypes 4, 5, and 7, which were generally distinguishable from local native stands in Hungary [13]. Nevertheless, more detailed cp haplotype analysis and determination of the origin of the Slavonian oak trees were not part of the present study.
In the case of Slavonian oak types, the applicability of field descriptors used for plus tree selection was relatively high to distinguish the local Q. robur trees when they were surveyed. But in most cases, e.g., for Q. petraea or Q. virgiliana taxa, the applicability of field descriptors might be insufficient. Therefore, genetic analyses are definitely necessary to screen out non-autochthonous lineages within in situ gene conservation stands.
The results of both taxonomic classification and genetic analyses pointed out that Q. virgiliana forms a reproductive community with other related Quercus taxa. Most of the trees analyzed were in a continuous transition between groups of the taxa at the species level and formed hybrids. One reason for this might be a constant introgression, which can be explained by the fitness of various hybrid forms, which can use the microhabitats of the forest at this xeric limit more persistently and efficiently than the individuals of the parental species. An alternative explanation for the dominance of hybrid genotypes might be the secondary evolutionary processes specific but general to European white oak taxa [35,43].
A combined assessment of the morphological traits and genetic markers resulted in a partly similar clustering for the virgiliana and hybrid cohorts. However, the petraea and dalechampii type trees were classified into one separate cluster by morphological traits (Figure 4), while the Q. robur s.l. cohort was clearly separated by the structuring of nSSR markers (Figure 7). The robur group, including the Slavonian oak trees planted and the pedunculiflora hybrid types, was separated relatively clearly from the other taxa. This was also confirmed by the result of the principal coordinate analysis (Figure 5), where the separation of the robur group was apparent. In both cases (morphological traits and nSSR markers), the virgiliana types and their hybrids were classified into one group and formed a continuous transitory but dominant cluster of the trees. However, it was still not answered whether the hybrids were dominating within the population due to ‘optimal hybrid fitness’ or if that was a result of ongoing secondary evolutionary processes.
Based on the field descriptors’ dataset, both generative (41 trees, 30%) and vegetative regeneration (97 trees, 70%) represent a significant proportion within the stand. Nevertheless, the individuals have a low tendency to vegetative reproduction, i.e., spreading from the rootstock (increase in number of individuals or clonal reproduction) is not typical for the trees of the stand, with only two clone pairs identified. However, both strategies might have a significant role in the mating system of oak populations at the xeric limit. This is partly due to historical reasons (extensive succession in the region’s forests) and partly due to the good vegetative regeneration ability of Q. petraea s.l. and Q. pubescens s.l. taxa. Recently, the stand is recorded as 85 years old, i.e., the previous stand was clear-cut during World War II and then regenerated partly by coppices, which was a standard management method at that time. Besides the seed-originated saplings, the stand is characterized by stump sprouts and root suckers in a roughly even but completely random way (Figure 11). And the presumably seedling-deficient patches were planted with Slavonian oak individuals. Some of these were found in the valley in areas with better water supply, but also in the southwest-facing hillside part of the site, where we found Slavonian oak trees. Genetic analysis (nSSR markers) revealed a relatively low number of clones. This is in contrast to a previous study [45], where, due to long-term intensive human impacts, the proportion of clones was significantly higher, where the studied 59 Q. robur and 21 Q. petraea tree individuals shared only 14 genotypes. Based on our results, vegetative reproduction by coppicing did not radically affect the genetic structure of the population. Comparing the seed vs. vegetative origin genotypes (allele frequency, allele number, heterozygosity, or fixation index), only slight differences were found between the vegetative cohort (i.e., the parent generation) and the seed origin cohort (i.e., the offspring generation). The evolution of the number of unique alleles in two groups indicates a difference between vegetative and seed-origin individuals, with a significantly high number of unique alleles within the seed-origin path in the case of cluster 1. In contrast, for cluster 3, the opposite is true, where the vegetative origin individuals hold more unique alleles. There are no significant differences in the observed heterozygosity, but in cluster 2, cluster 3 and cluster 4, individuals of vegetative origin have higher observed heterozygosity. The fixation index indicates a slight heterozygote excess in individuals of seed origin in cluster 2 compared to vegetative origin. There is no significant difference between the seed and vegetative cohorts for the other clusters, but a shift from the homozygote excess can be observed to the equilibrium in the seed-derived generation.
Analyzing the spatial structure of the different taxonomic groups (Figure 9), despite the relatively low number of sampled trees, we can see that the virgiliana-type trees (pure and hybrids together) can typically be found on the southeast-exposed ridges and sides of the hill. In contrast, the petraea (including hybrids) types were found in western exposures and on the sides of valleys, which are less affected by direct sunlight and where air humidity may be higher than in the more light-exposed southern microsites. Autochthonous robur trees (including their hybrids) are typically found in small valleys or lower hillsides where a notable water supply can increase the soil’s productivity and make the microsite patches wetter than on ridges or steeper hillsides. Nevertheless, no clear and striking spatial taxon structure was found, probably influenced by the small sample size and relatively small area. Further studies in this geographical region would be worthwhile, with a larger area and sample size, but in habitats with similar characteristics.
Our results supported our hypothesis that the gene pool of the mixed oak population, including a high number of trees with xeromorphic characteristics, has been adapted to the xeric ecological factors of the forest-steppe climate zone. Due to the high introgression rate of Q. virgiliana, which was verified by both morphological traits and genetic markers, the local population might be tolerant to drought and heat, which are frequent climatic factors in the region [http://www.ertigis.hu, accessed on 28 May 2025]. A previous study [7] pointed out that Q. virgiliana-type oak trees on wood pastures can persist and regenerate in an arid landscape dominated by agriculture for centuries. Drought tolerance is a critical factor for the native forests distributed in the region, and native oak taxa are determinant in this context. The analyses of historical maps confirmed that there has been continuous agricultural activity in the area over several centuries, in which the forest patches, including this study area, have been determinatively shaping the landscape and probably maintaining optimal climatic conditions for arable farming, but not for forests.
Due to the expected direction and magnitude of climate change [1,3]—strong warming and drought—such mixed oak populations and their gene pool will be crucial genetic resources (high heterozygosity values, hybridization, continuous hybrid transition between basic taxa). In a large part of the Pannonian Basin, the current forest-steppe climate zone is predicted to be replaced mainly by a steppe climate. The lower region of the deciduous forest zones, dominated currently by Q. cerrisQ. petraea mixed forest communities, will be shifted in conditions typical of the forest-steppe climate the ± 200 m a.s.l. zone recently [1,2,3]. The studied population is located in this altitudinal belt, and the hybrid genotypes of Q. virgiliana, which are typical for this population, are likely to be able to adapt to further climatic changes. This mixed oak stand, with its current species composition and genetic and spatial structure, is expected to be able to fulfill all the requirements of an in situ gene conservation stand.
Within the framework of the gene conservation program, reproductive material (seed, seedling) has already been collected from most of the selected plus trees and preserved in ex situ conservation stands and seedling-seed orchards. The ex situ stands, and seed orchards were established in areas of similar habitat conditions in the region, but typically in higher altitudes, which are still in the xeric deciduous forest zone (200–300 m a.s.l.) and will probably be sustainable in the long term, despite the adverse climate change effects predicted.

5. Conclusions

As a consequence of our results related to the phenotypic traits, genetic analyses, and spatial structure of the oak trees, the following priorities are proposed for better forest management:
  • The non-autochthonous (planted) trees should be removed whenever the next thinning is carried out to preserve the adapted local gene pool as much as possible.
  • Preference should be given to trees with drought tolerance phenotypic traits of Q. virgiliana (e.g., hairiness, bark type, and oil-striped acorn) in silvicultural interventions (thinnings, natural regeneration).
  • The seed vs. vegetative origin should not be a thinning consideration for trees. Traditional practice favors trees of seed origin over coppiced trees. In addition to the criteria described in the first two points, selection should be based on each tree’s general thinning aspects or health condition.
  • The slight allelic decline in seed-originated trees (offspring generation) underlined the importance that the in situ gene conservation stands should not be maintained as an even-aged stand. Natural regeneration techniques typically carried out over a short period (3–10 years) and based on seedlings of a single crop year increase the potential for allelic loss, which may be exacerbated by the isolated and fragmented pattern of the studied gene conservation stand, which may also reduce the potential for external pollen flow.
  • If natural regeneration by seed is not possible ₋ in whole or in part ₋, the use of local reproductive material must be preferred in the case of both reforestation and replacement (assisted regeneration, assisted gene flow). However, the first two priority points should also be considered.
The success of dynamic gene conservation programs primarily depends on how the genetic diversity of the target species or population is preserved and how well the genotypes represent the gene pool of the original populations as recommended by the EUFGIS minimum requirements (http://portal.eufgis.org/genetic-conservation-units/, accessed on 28 May 2025). A further important factor is to consider all the ecological aspects, similar to natural circumstances, for the maintenance of the evolutionary capacity of the preserved population [8,44]. For example, the external pollen flow helps to maintain the adaptability of oak populations, basically by the consequences of hybrid effects [9,36,39,40,41]. Small, isolated oak populations within a large agriculture-dominated landscape, like this studied population, can interconnect larger woodlands located even at a wider distance to ensure pollen flow connection (flagstone population). Genetic information, therefore, helps both to maintain in situ reserves and to measure the effectiveness of ex situ conservation on an ongoing basis. By the use of this information, we have a chance to decide which phenotype is likely to be successful based on its underlying genotype, at present or in the future, under changing—typically warming and drying—climatic, water management, or even eroded soil conditions.

Supplementary Materials

The following are available online at: https://www.mdpi.com/article/10.3390/f16060939/s1. Table S1. Listed taxa, coordinates, on-site morphological status and origin of sampled trees, Table S2. Description of SSR markers and PCR protocols, Table S3. A complex assessment of nSSR and chloroplast haplotype pattern to analyse autochtony of robur type trees.

Author Contributions

Conceptualization, S.B. and B.P.; methodology, B.P., S.B. and K.C.; software, M.L., B.B.L., K.C. and B.P.; validation, B.P., M.L., B.B.L., K.C. and S.B.; data curation, B.P.; writing—original draft preparation, B.P., S.B., K.C., M.L. and B.B.L.; writing—review and editing, B.P., S.B., K.C., M.L. and B.B.L.; visualization, B.P. and B.B.L.; supervision, S.B.; project administration, B.P.; funding acquisition, S.B. and K.C. All authors have read and agreed to the published version of the manuscript.

Funding

This work was supported by the Research Excellence Programme of the Hungarian University of Agriculture and Life Sciences.

Data Availability Statement

Data can be provided upon request.

Acknowledgments

We thank László Gál, János Benke, Csaba Molnár and all the co-workers of Gyulaj Forestry and Hunting Pc., Tamási, Hungary and furthermore, Lajos Mózes, Mónika Sulyok, Eszter Stribik for supporting our fieldwork and data collection.

Conflicts of Interest

The authors declare no conflicts of interest.

References

  1. Czúcz, B.; Gálhidy, L.; Mátyás, C. Present and forecasted xeric climatic limits of beech and sessile oak distribution at low altitudes in Central Europe. Ann. For. Sci. 2011, 68, 99–108. [Google Scholar] [CrossRef]
  2. Mátyás, C.; Sun, G. Forests in a water limited world under climate change. Environ. Res. Lett. 2014, 9, 085001. [Google Scholar] [CrossRef]
  3. Mátyás, C.; Berki, I.; Bidló, A.; Csóka, G.; Czimber, K.; Führer, E.; Gálos, B.; Gribovszki, Z.; Illés, G.; Hirka, A.; et al. Sustainability of Forest Cover under Climate Change on the Temperate-Continental Xeric Limits. Forests 2018, 9, 489. [Google Scholar] [CrossRef]
  4. Molnár, Z.; Biró, M.; Bartha, S.; Fekete, G. Past Trends, Present State and Future Prospects of Hungarian Forest-Steppes. In Eurasian Steppes. Ecological Problems and Livelihoods in a Changing World. Plant and Vegetation; Werger, M., van Staalduinen, M., Eds.; Springer: Dordrecht, The Netherlands, 2012; Volume 6. [Google Scholar] [CrossRef]
  5. Fodor, E.; Hâruta, O.; Dorog, S. Nurse plants and the regeneration niche of tree seedlings in wood-pastures from Western and North-Western Romania. Reforesta 2018, 41–59. [Google Scholar] [CrossRef]
  6. Lőrincz, Á.; Hábenczyus, A.A.; Kelemen, A.; Ratkai, B.; Tölgyesi, C.; Lőrinczi, G.; Frei, K.; Bátori, Z.; Maák, I.E. Wood-pastures promote environmental and ecological heterogeneity on a small spatial scale. Sci. Total Environ. 2024, 906, 167510. [Google Scholar] [CrossRef] [PubMed]
  7. Bordács, S.; Pintér, B.; Horváth, C.; Benedek, L.; Ladányi, M. Relic Vergilius Oak (Quercus virgiliana Ten.) Trees Could Preserve Microhabitats of Pannonian Forest–Steppe Vegetation. Diversity 2024, 16, 401. [Google Scholar] [CrossRef]
  8. Mátyás, C.; Vendramin, G.G.; Fady, B. Forests at the limit: Evolutionary–genetic consequencesof environmental changes at the receding (xeric) edge of distribution. Report from a research workshop. Ann. For. Sci. 2009, 66, 800. [Google Scholar] [CrossRef]
  9. Petit, R.J.; Bodénès, C.; Ducousso, A.; Roussel, G.; Kremer, A. Hybridization as a mechanism of invasion in oaks. New Phytol. 2003, 161, 151–164. [Google Scholar] [CrossRef]
  10. Petit, R.J.; Brewer, S.; Bordács, S.; Burg, K.; Cheddadi, R.; Coart, E.; Cottrell, J.; Csaikl, U.M.; Van Dam, B.; Deans, J.D.; et al. Identification of refugia and post-glacial colonisation routes of European white oaks based on chloroplast DNA and fossil pollen evidence. For. Ecol. Manag. 2002, 156, 49–74. [Google Scholar] [CrossRef]
  11. Petit, R.J.; Csaikl, U.M.; Bordács, S.; Burg, K.; Coart, E.; Cottrell, J.; van Dam, B.; Deans, J.D.; Dumolin-Lapègue, S.; Fineschi, S.; et al. Chloroplast DNA variation in European white oaks. Phylogeography and patterns of diversity based on data from over 2600 populations. For. Ecol. Manag. 2002, 156, 5–26. [Google Scholar] [CrossRef]
  12. Provan, J.; Bennett, K.D. Phylogeographic insights into cryptic glacial refugia. Trends Ecol. Evol. 2008, 23, 564–571. [Google Scholar] [CrossRef] [PubMed]
  13. Bordács, S.; Popescu, F.; Slade, D.; Csaikl, U.M.; Lesur, I.; Borovics, A.; Kézdy, P.; König, A.O.; Gömöry, D.; Brewer, S.; et al. Chloroplast DNA variation of white oaks in northern Balkans and in the Carpathian Basin. For. Ecol. Manag. 2002, 156, 197–209. [Google Scholar] [CrossRef]
  14. Magyari, E.; Jakab, G.; Rudner, E.; Sümegi, P. Palynological and plant macrofossil data on Late Pleistocene short-term climatic oscillations in NE-Hungary. Acta Palaeobot. 1999, 2 (Suppl. 2), 252–264. [Google Scholar]
  15. Magyari, E.; Chapman, J.; Passmore, D.; Allen, J.; Huntley, J.; Huntley, B. Holocene persistence of wooded steppe in the Great Hungarian Plain. J. Biogeogr. 2010, 37, 915–935. [Google Scholar] [CrossRef]
  16. Denk, T.; Grimm, G.W.; Manos, P.S.; Deng, M.; Hipp, A.L. An Updated Infrageneric Classification of the Oaks: Review of Previous Taxonomic Schemes and Synthesis of Evolutionary Patterns. In Oaks Physiological Ecology. Exploring the Functional Diversity of Genus Quercus L. Tree Physiology; Gil-Pelegrín, E., Peguero-Pina, J., Sancho-Knapik, D., Eds.; Springer: Cham, Switzerland, 2017; Volume 7, pp. 13–38. [Google Scholar] [CrossRef]
  17. Bartha, D. Quercus virgiliana Ten. In (Hrsg.): Enzyklopädie der Holzgewächse. Handbuch und Atlas der Dendrologie; Schutt, P., Weisgerber, H., Schuck, H.J., Lang, U.M., Roloff, A., Eds.; Ecomed Verlagsgesellschaft: Landsberg, Germany, 2001; Band III/2/25; pp. 1–5. [Google Scholar]
  18. Bartha, D. Quercus dalechampii Ten. In (Hrsg.): Enzyklopädie der Holzgewächse. Handbuch und Atlas der Dendrologie; Schutt, P., Weisgerber, H., Schuck, H.J., Lang, U.M., Roloff, A., Eds.; Ecomed Verlagsgesellschaft: Landsberg, Germany, 2003; Band III/2/3; pp. 1–4. [Google Scholar]
  19. Matula, R. Comparison of general tree characteristics of less known oak species Quercus dalechampii Ten. and Quercus polycarpa Schur. J. For. Sci. 2008, 54, 333–339. [Google Scholar] [CrossRef]
  20. Di Pietro, R.; Conte, A.L.; Di Marzio, P.; Fortini, P.; Farris, E.; Gianguzzi, L.; Müller, M.; Rosati, L.; Spampinato, G.; Gailing, O. Does the genetic diversity among pubescent white oaks in southern Italy, Sicily and Sardinia islands support the current taxonomic classification? Eur. J. For. Res. 2021, 140, 355–371. [Google Scholar] [CrossRef]
  21. Kučera, P. New name for Central Europaean oak formerly labelled as Quercus dalechampii. Biologia 2018, 73, 313–317. [Google Scholar] [CrossRef]
  22. Kučera, P. Quercus banatus grows in Slovenia. THAISZIA J. Bot. 2019, 29, 61–69. [Google Scholar] [CrossRef]
  23. Bartha, D. A magyar tölgy (Quercus conferta Kit.) hibridjei. A nothotaxonok kritikai értékelése. Bot. Közlemények 2024, 111, 107–130. (In Hungarian) [Google Scholar] [CrossRef]
  24. Coldea, G.; Farcas, S.; Filipas, L.; Ursu, T.M.; Stoica, I.A. Syntaxonomic revision of Quercus virgiliana Ten. and Quercus pedunculiflora K. Koch forests from Romania. Studia UBB. Biol. 2010, LV.2, 39–50. [Google Scholar]
  25. Enescu, C.M.; Curtu, A.L.; Șofletea, N. Is Quercus virgiliana a distinct morphological and genetic entity among European white oaks? Turk. J. Agric. For. 2013, 37, 632–641. [Google Scholar] [CrossRef]
  26. Trinajstić, I. About the Problem of Differentiation Between the Oaks Quercus pubescens Willd. and Quercus virgiliana. (Ten.) Šumarski List 2007, 131, 57–60. [Google Scholar]
  27. Simonkai, L. Hazánk Tölgyfajai és Tölgyerdei = Quercus et Querceta Hungariae; Franklin-Társulat Nyomdája: Budapest, Hungary, 1890. 42 oldal. (In Hungarian) [Google Scholar]
  28. Soó, R. A Magyar Flóra és Vegetáció Rendszertani-Növényföldrajzi Kézikönyve I–VI; Akadémiai Kiadó: Budapest, Hungary, 1964–1980. (In Hungarian) [Google Scholar]
  29. Zólyomi, B.; Horváth, A.; Kevey, B.; Lendvai, G. Steppe woodlands with Tatarian Maple (Aceri tatarici-Quercetum pubescentis-roboris) on the great Hungarian plain and its neighbourhood. An unfinished synthesis with supplementary notes. Acta Bot. Hung. 2013, 55, 167–189. [Google Scholar] [CrossRef]
  30. Reif, A.; Schneider, E.; Oprea, A.; Laszlo Rakosy, L.; Luick, R. Romania’s natural forest types—A biogeographic and phytosociological overview in the context of politics and conservation. Tuexenia 2022, 42, 9–34. [Google Scholar] [CrossRef]
  31. Gafenco, I.M.; Pleșca, B.I.; Șofletea, N. The taxonomic structure of sessile oak (Quercus petraea (Matt.) Liebl.) in marginal populations from Eastern Romania—A bibliographic study. Rev. De Silvic. Şi Cinegetică 2023, 28, 39–45. [Google Scholar]
  32. Curtu, A.L.; Gailing, O.; Finkeldey, R. Evidence for hybridization and introgression within a species-rich oak (Quercus spp.) community. BMC Evol. Biol. 2007, 7, 218. [Google Scholar] [CrossRef]
  33. Antonecchia, G.; Fortini, P.; Lepais, O.; Gerber, S.; Legér, P.; Scippa, G.S.; Viscosi, V. Genetic structure of a natural oak community in central Italy: Evidence of gene flow between three sympatric white oak species (Quercus, Fagaceae). Ann. For. Res. 2015, 58, 205–216. [Google Scholar] [CrossRef]
  34. Pütz, J.; Jansen, S.; Reutimann, O.; Rellstab, C.; Bordács, S.; Neophytou, C. The influence of post-glacial migration and hybridization on the gene pool of marginal Quercus pubescens populations in Central Europe. Ann. Bot. 2025, 135, 867–884. [Google Scholar] [CrossRef]
  35. Leroy, T.; Roux, C.; Villate, L.; Bodénès, C.; Romiguier, J.; Paiva, J.A.P.; Dossat, C.; Aury, J.; Plomion, C.; Kremer, A. Extensive recent secondary contacts between four European white oak species. New Phytol. 2017, 214, 865–878. [Google Scholar] [CrossRef]
  36. Leroy, T.; Louvet, J.; Lalanne, C.; Le Provost, G.; Labadie, K.; Aury, J.; Delzon, S.; Plomion, C.; Kremer, A. Adaptive introgression as a driver of local adaptation to climate in European white oaks. New Phytol. 2020, 226, 1171–1182. [Google Scholar] [CrossRef]
  37. Dow, B.D.; Ashley, M.V. Microsatellite analysis of seed dispersal and parentage of saplings in bur oak, Quercus macrocarpa. Mol. Ecol. 1996, 5, 615–627. [Google Scholar] [CrossRef]
  38. Dow, B.D.; Ashley, M. High levels of gene flow in bur oak revealed by paternity analysis using microsatellites. J. Hered. 1998, 89, 62–70. [Google Scholar] [CrossRef]
  39. Gerber, S.; Chadœuf, J.; Gugerli, F.; Lascoux, M.; Buiteveld, J.; Cottrell, J.; Dounavi, A.; Fineschi, S.; Forrest, L.L.; Fogelqvist, J.; et al. High Rates of Gene Flow by Pollen and Seed in Oak Populations across Europe. PLoS ONE 2014, 9, e85130. [Google Scholar] [CrossRef]
  40. Craft, K.J.; Ashley, M.V. Pollen-mediated gene flow in isolated and continuous stand of bur oak, Quercus macrocarpa (Fagaceae). Am. J. Bot. 2010, 97, 1999–2006. [Google Scholar] [CrossRef] [PubMed]
  41. Cseke, K.; Bordács, S.; és Borovics, A. Egy elegyes tölgyes taxonómiai és genetikai szerkezetének elemzése. Erdészettudományi Közlemények 2011, 1, 95–105. (In Hungarian) [Google Scholar]
  42. Liesebach, H.; Eusemann, P.; Höltken, A.M.; Tröber, U.; Kuchma, O.; Karopka, M.; Becker, F.; Kätzel, R.; Fussi, B. Effective population size of adult and offspring cohorts as a genetic monitoring tool in two stand-forming and wind-pollinated tree species: Fagus sylvatica L. and Picea abies (L.) Karst. Conserv. Genet. 2024, 25, 739–753. [Google Scholar] [CrossRef]
  43. Leroy, T.; Rougemont, Q.; Dupouey, J.; Bodénès, C.; Lalanne, C.; Belser, C.; Labadie, K.; Le Provost, G.; Aury, J.; Kremer, A.; et al. Massive postglacial gene flow between European white oaks uncovered genes underlying species barriers. New Phytol. 2020, 226, 1183–1197. [Google Scholar] [CrossRef]
  44. Fady, B.; Aravanopoulos, F.A.; Alizoti, P.; Mátyás, C.; von Wühlisch, G.; Westergren, M.; Belletti, P.; Cvjetkovic, B.; Ducci, F.; Huber, G.; et al. Evolution-based approach needed for the conservation and silviculture of peripheral forest tree populations. For. Ecol. Manag. 2016, 375, 66–75. [Google Scholar] [CrossRef]
  45. Bakker, E.G.; Van Dam, B.C.; Van Eck, H.J.; Jacobsen, E. The Description of Clones of Quercus robur L. and Q. petraea (Matt.) Liebl. with Microsatellites and AFLP in an Ancient Woodland. Plant Biol. 2001, 3, 616–621. [Google Scholar] [CrossRef]
  46. Bordács, S.; Zhelev, P.; Schirone, B. EUFORGEN Technical Guidelines for genetic conservation and use of pubescent oak (Quercus pubescens). In European Forest Genetic Resources Programme (Euforgen); European Forest Institute: Joensuu, Finland, 2019; 6p, ISBN 978-952-5980-63-9. [Google Scholar]
  47. Bordács, S.; Gál, L. Erdészeti génmegőrzés a klímaváltozás tükrében. Erdészeti Lapok 2023, 158, 461–463. (In Hungarian) [Google Scholar]
  48. Koloszár, J. Site requirements and possibilities for planting of Slavonian oak in Hungary. Acta Fac. For. 1984, 1, 51–60. [Google Scholar]
  49. Soó, R.; Kárpáti, Z. Magyar Flóra, Harasztok—Virágos Növények; Tankönyvkiadó Budapest: Budapest, Hungary, 1968; pp. 649–652. (In Hungarian) [Google Scholar]
  50. Mátyás, V. A tölgyek dendrológiai ismertetése. In A tölgyek; Keresztesi, B., Ed.; Akadémiai Kiadó: Budapest, Hungary, 1967; pp. 51–90. (In Hungarian) [Google Scholar]
  51. Schwarz, O. Monographie der Eichen Europas und des Mittelmeergebietes. In Feddes Repertorium; Sonderbeiheft, D., Ed.; University and Research Library Catalog: Wageningen, The Netherlands, 1936. [Google Scholar]
  52. Borovics, A. A tölgyek hibridizációja, morfológiai és genetikai változatossága. Erdészeti Kut. 1998, 88, 89–108. (In Hungarian) [Google Scholar]
  53. Gencsi, I.; Vancsura, R. Dendrológia; Mezőgazda Kiadó: Budapest, Hungary, 1982; pp. 226–259. (In Hungarian) [Google Scholar]
  54. Kassambara, A.; Mundt, F. factoextra: Extract and Visualize the Results of Multivariate Data Analyses; R package Version 1.0.7. 2020. Available online: https://CRAN.R-project.org/package=factoextra (accessed on 20 May 2025).
  55. Galili, T. dendextend: An R package for visualizing, adjusting and comparing trees of hierarchical clustering. Bioinformatics 2015, 31, 3718–3720. [Google Scholar] [CrossRef]
  56. Wickham, H. ggplot2: Elegant Graphics for Data Analysis; Springer: New York, NY, USA, 2016; Available online: https://ggplot2.tidyverse.org (accessed on 20 May 2025).
  57. Dumolin, S.; Demesure, B.; Petit, R.J. Inheritance of chloroplast and mitochondrial genomes in pedunculate oak investigated with an efficient PCR method. Theor. Appl. Genet. 1995, 91, 1253–1256. [Google Scholar] [CrossRef]
  58. Bruegmann, T.; Fladung, M.; Schroeder, H. Flexible DNA isolation procedure for different tree species as a convenient lab routine. Silvae Genet. 2022, 71, 20–30. [Google Scholar] [CrossRef]
  59. Steinkellner, H.; Fluch, S.; Turetschek, E.; Lexer, C.; Streiff, R.; Kremer, A.; Burg, K.; Glössl, J. Identification and characterization of (GA/CT)n- microsatellite loci from Quercus petraea. Plant Mol. Biol. 1997, 33, 1093–1096. [Google Scholar] [CrossRef] [PubMed]
  60. Kampfer, S.; Lexer, C.; Glössl, J.; Steinkellner, H. Characterization of (GA)n Microsatellite Loci from Quercus robur. Hereditas 1998, 129, 183–186. [Google Scholar] [CrossRef]
  61. Dow, B.D.; Ashley, M.V.; Howe, H.F. Characterization of highly variable (GA/CT) n microsatellites in the bur oak, Quercus macrocarpa. Theor. Appl. Genet. 1995, 91, 137–141. [Google Scholar] [CrossRef]
  62. Schuelke, M. An economic method for the fluorescent labeling of PCR fragments. Nat. Biotechnol. 2000, 18, 233–234. [Google Scholar] [CrossRef] [PubMed]
  63. Peakall, R.O.D.; Smouse, P.E. genalex 6: Genetic analysis in Excel. Population genetic software for teaching and research. Mol. Ecol. Notes 2006, 6, 288–295. [Google Scholar] [CrossRef]
  64. Peakall, R.; Smouse, P.E. GenAlEx 6.5: Genetic analysis in Excel. Population genetic software for teaching and research—An update. Bioinformatics 2012, 28, 2537–2539. [Google Scholar] [CrossRef] [PubMed]
  65. Pritchard, J.K.; Stephens, M.; Donnelly, P. Inference of population structure using multilocus genotype data. Genetics 2000, 155, 945–959. [Google Scholar] [CrossRef] [PubMed]
  66. Evanno, G.; Regnaut, S.; Goudet, J. Detecting the number of clusters of individuals using the software structure: A simulation study. Mol. Ecol. 2005, 14, 2611–2620. [Google Scholar] [CrossRef]
  67. Francis, R.M. pophelper: An R package and web app to analyse and visualize population structure. Mol. Ecol. Resour. 2016, 17, 27–32. [Google Scholar] [CrossRef] [PubMed]
  68. Sebastiani, F.; Carnevale, S.; Vendramin, G.G. A new set of mono- and dinucleotide chloroplast microsatellites in Fagaceae. Mol. Ecol. Notes 2004, 4, 259–261. [Google Scholar] [CrossRef]
  69. Weising, K.; Gardner, R.C. A set of conserved PCR primers for the analysis of simple sequence repeat polymorphisms in chloroplast genomes of dicotyledonous angiosperms. Genome 1999, 42, 9–19. [Google Scholar] [CrossRef]
  70. Deguilloux, M.; Dumolin-Lapègue, S.; Gielly, L.; Grivet, D.; Petit, R.J. A set of primers for the amplification of chloroplast microsatellites in Quercus. Mol. Ecol. Notes 2003, 3, 24–27. [Google Scholar] [CrossRef]
  71. Solymos, R. Improvement and silviculture of oaks in Hungary. Ann. For. Sci. 1993, 50, 607–614. [Google Scholar] [CrossRef]
Figure 1. Military maps from 1782, 1869, and 1941 compared with the 2025 Forest Map of Pusztahencse 8/D (marked with a red asterisk). The yellow line is a standard one km scale.
Forests 16 00939 g001
Figure 2. The study site with the analyzed trees in Pusztahencse 8/D (without Q. cerris). The red frame on the map of Hungary (right up) shows the location of the studied plot within the country (the yellow arrow marks north).
Forests 16 00939 g002
Figure 3. Morphological traits evaluated for taxonomic classification. The measured (mm, cm) or counted (pcs) traits are indicated in blue in the table, and rated traits are indicated by shades of brown (1–2 scale, 1–3 scale, 1–4 scale, 1–5 scale, 1–6 scale).
Forests 16 00939 g003
Figure 4. The dendrogram was constructed applying Ward’s hierarchical method based on the calculation of the Euclidean distance matrix from measured and rated morphological traits. The labels are according to the 12 on-site morphotype groups. Morphotype groups on the dendrogram from left to right: DH, PETH, PETV, R, RPED, V, VH, VD, VDPET, VPET, VPETD, VR.
Forests 16 00939 g004
Figure 5. PCoA plot derived from the genetic distance between morphotype taxon groups.
Forests 16 00939 g005
Figure 6. Pairwise Fst values derived from the AMOVA analysis (Fst Values below diagonal, p values above diagonal).
Forests 16 00939 g006
Figure 7. Results of STRUCTURE K3 and K4 analysis. The coloring of the bars indicates the probability of individuals belonging to a given genetic cluster.
Forests 16 00939 g007
Figure 8. Map representation of STRUCTURE K4 clustered genotypes with pie charts of the studied trees (121 individuals).
Forests 16 00939 g008
Figure 9. The twelve morphological groups on the topography (138 individuals).
Forests 16 00939 g009
Figure 10. Genetic distance of the chloroplast haplotypes applying a PCoA plot.
Forests 16 00939 g010
Figure 11. Spatial distribution of naturally regenerated trees (orange = autochthon generative saplings), (green = autochthon vegetative coppiced), and artificially planted trees (white = non-autochthon saplings).
Forests 16 00939 g011
Table 1. Population genetic indices of the 12 on-site morphological groups (121 samples) based on the mean of the applied 16 nSSR markers.
GroupsNNaNeNpIHoHeuHeF
DH77.5635.7650.3131.8230.7680.8000.8620.047
PETH1310.0006.4910.6251.9800.7500.8070.8390.088
PETV55.4384.2540.1881.4970.7000.7280.8080.064
R45.1884.2720.5001.4930.7810.7290.833−0.079
RPED1410.3136.6361.6881.9560.7630.7870.8160.032
V87.8755.7420.3751.8200.6800.7890.8410.160
VH119.3755.8620.3751.9350.7610.8010.8390.062
VD108.5636.0320.2501.9100.8130.8130.8560.007
VDPET1510.8136.6320.4382.0320.7210.8140.8420.128
VPET1611.6257.1060.4382.1150.7270.8380.8650.139
VPETD1410.6886.6520.6252.0320.7810.8170.8480.040
VR45.7504.9180.1251.6320.8130.7730.884−0.050
Table 2. Main population genetic indices of the STRUCTURE K4 clusters (121 samples).
ClusterNNaNeNpIHoHeuHeF
cluster 11711.3756.9912.3132.0230.7680.7960.8200.034
cluster 296.4384.1600.4381.5070.7360.6950.736−0.064
cluster 33915.0007.0052.2502.1930.7310.8320.8420.128
cluster 484.4383.2390.3131.2360.7580.6500.693−0.157
mixed4816.9388.0092.4382.2970.7660.8440.8530.098
Table 3. Comparison of genetic indicators between coppiced and seed-originated cohorts following the STRUCTURE K4 clustering (n.d.—data not available).
Cluster/OriginNNpHouHeF
SeedVegSeedVegSeedVegSeedVegSeedVeg
cluster 11434.5630.3750.7630.7920.8110.7500.027−0.259
cluster 2270.3750.3130.6880.7500.7500.727−0.191−0.110
cluster 37321.6882.9380.7140.7340.8310.8400.0750.122
cluster 4260.4380.3750.7190.7710.6670.715−0.431−0.164
mixed7412.3133.2500.7950.7610.8640.8490.0100.099
Disclaimer/Publisher’s Note: The statements, opinions and data contained in all publications are solely those of the individual author(s) and contributor(s) and not of MDPI and/or the editor(s). MDPI and/or the editor(s) disclaim responsibility for any injury to people or property resulting from any ideas, methods, instructions or products referred to in the content.

