

Patch-Wise Prediction and Interpretable Analysis of Pine Wilt Disease Occurrence

Abstract
1. Introduction
- Performance Improvements through Patch-wise Modeling. By incorporating spatial context using CNN-based patch-wise modeling, the proposed method outperformed traditional point-wise models like Logistic Regression. The inclusion of neighboring area data allowed the model to better capture spatial dependencies, as evidenced by the 9.7% improvement in F1-score over point-wise predictions;
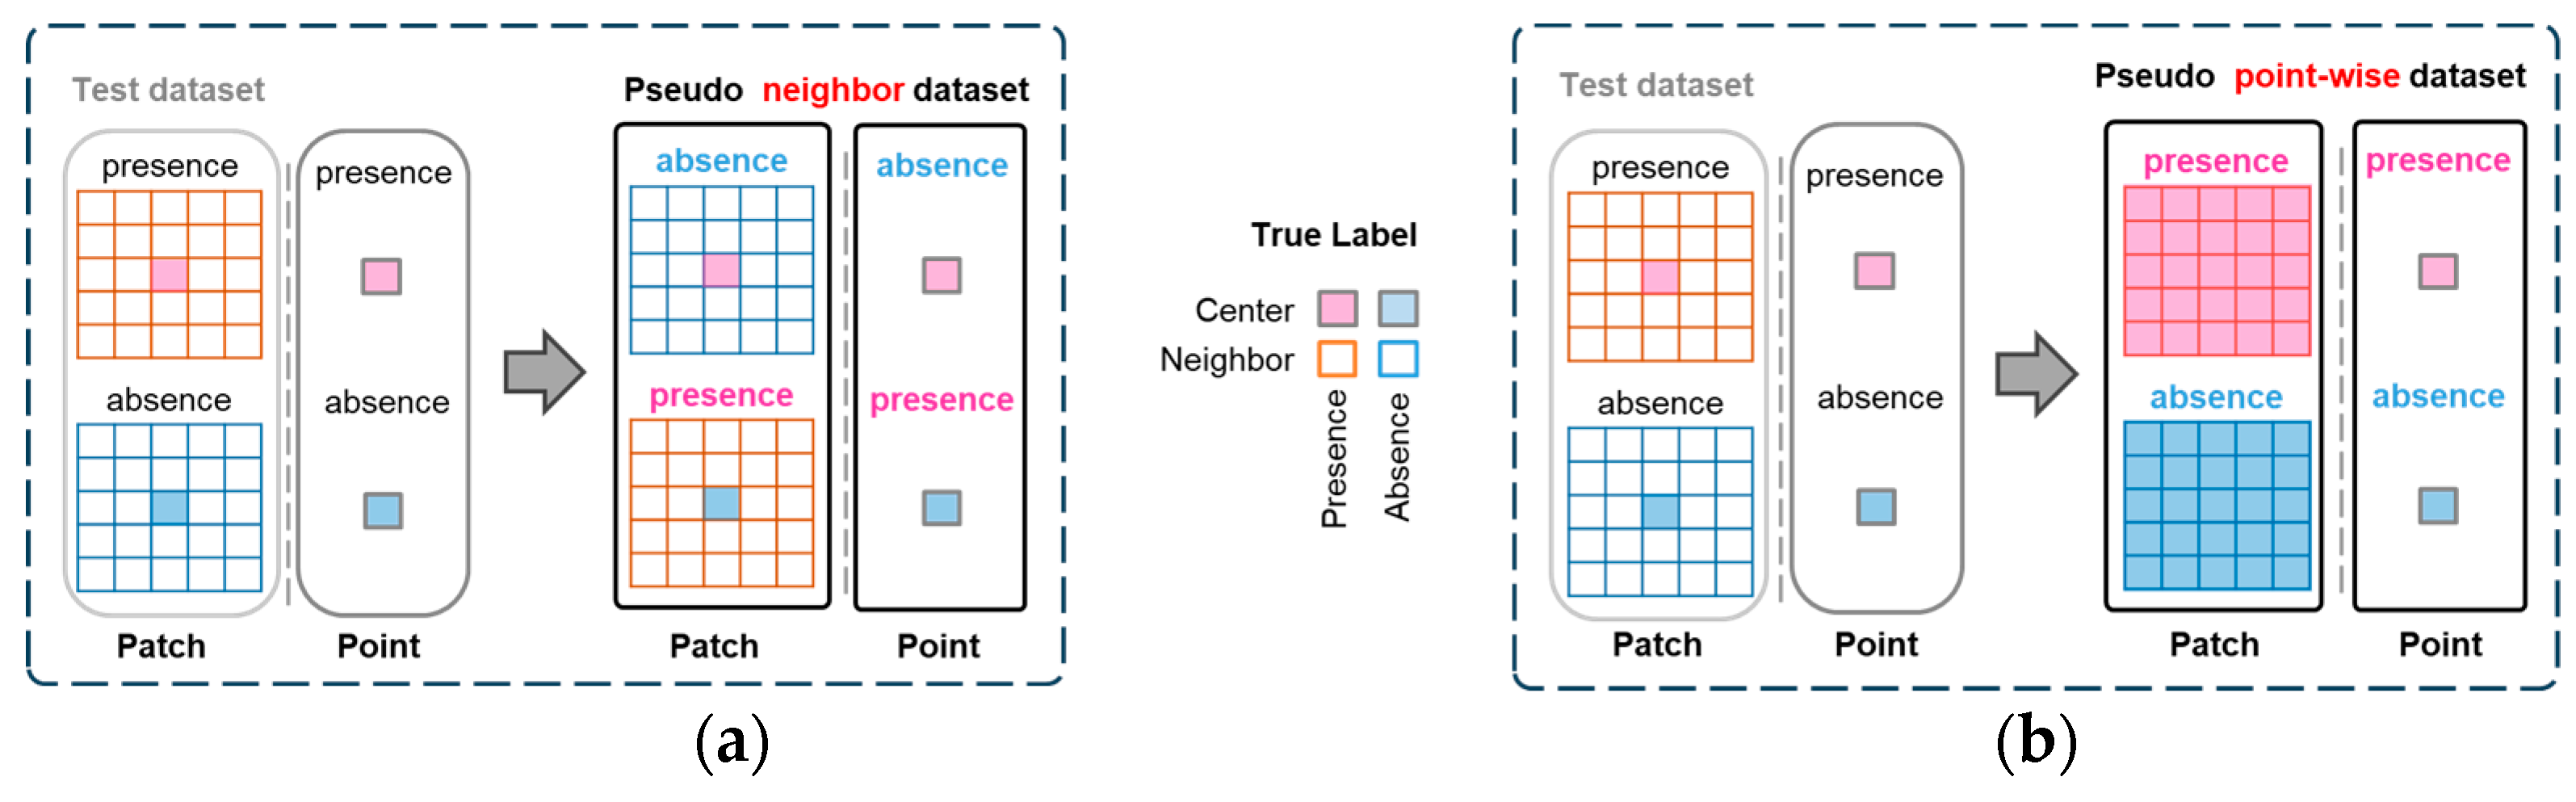
- Robustness to Perturbed Data. The pseudo-neighbor and pseudo-point-wise tests confirmed the robustness of the proposed model. While the CNN model maintained high performance even with shuffled or point-restricted data, the Logistic Regression model’s accuracy dropped significantly, highlighting the advantage of patch-wise spatial modeling;
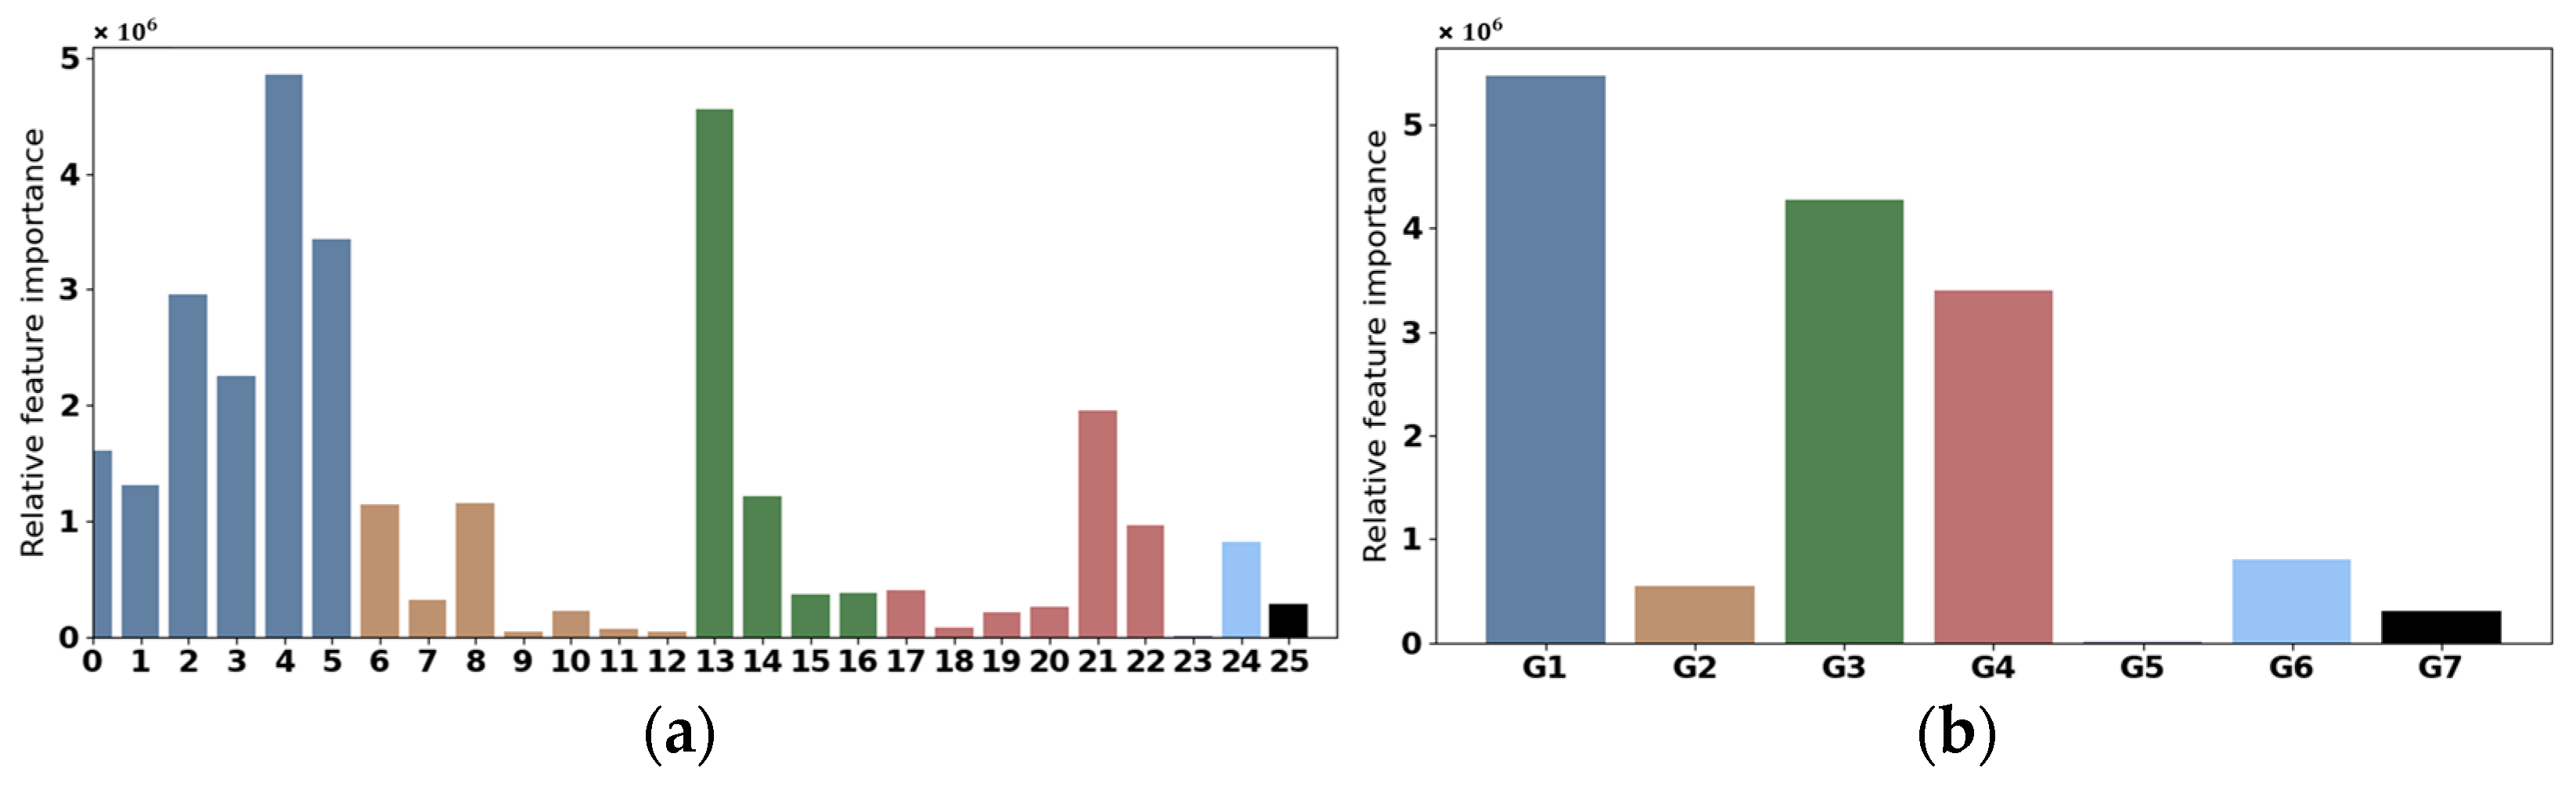
- Feature Importance Analysis. The explainability analysis using Permutation Feature Importance (PFI) revealed that meteorological features such as precipitation, maximum temperature, and minimum temperature were the most influential factors in the model’s predictions. Interestingly, features like distance to roads showed lower importance, prompting further exploration into their ecological relevance.
2. Materials
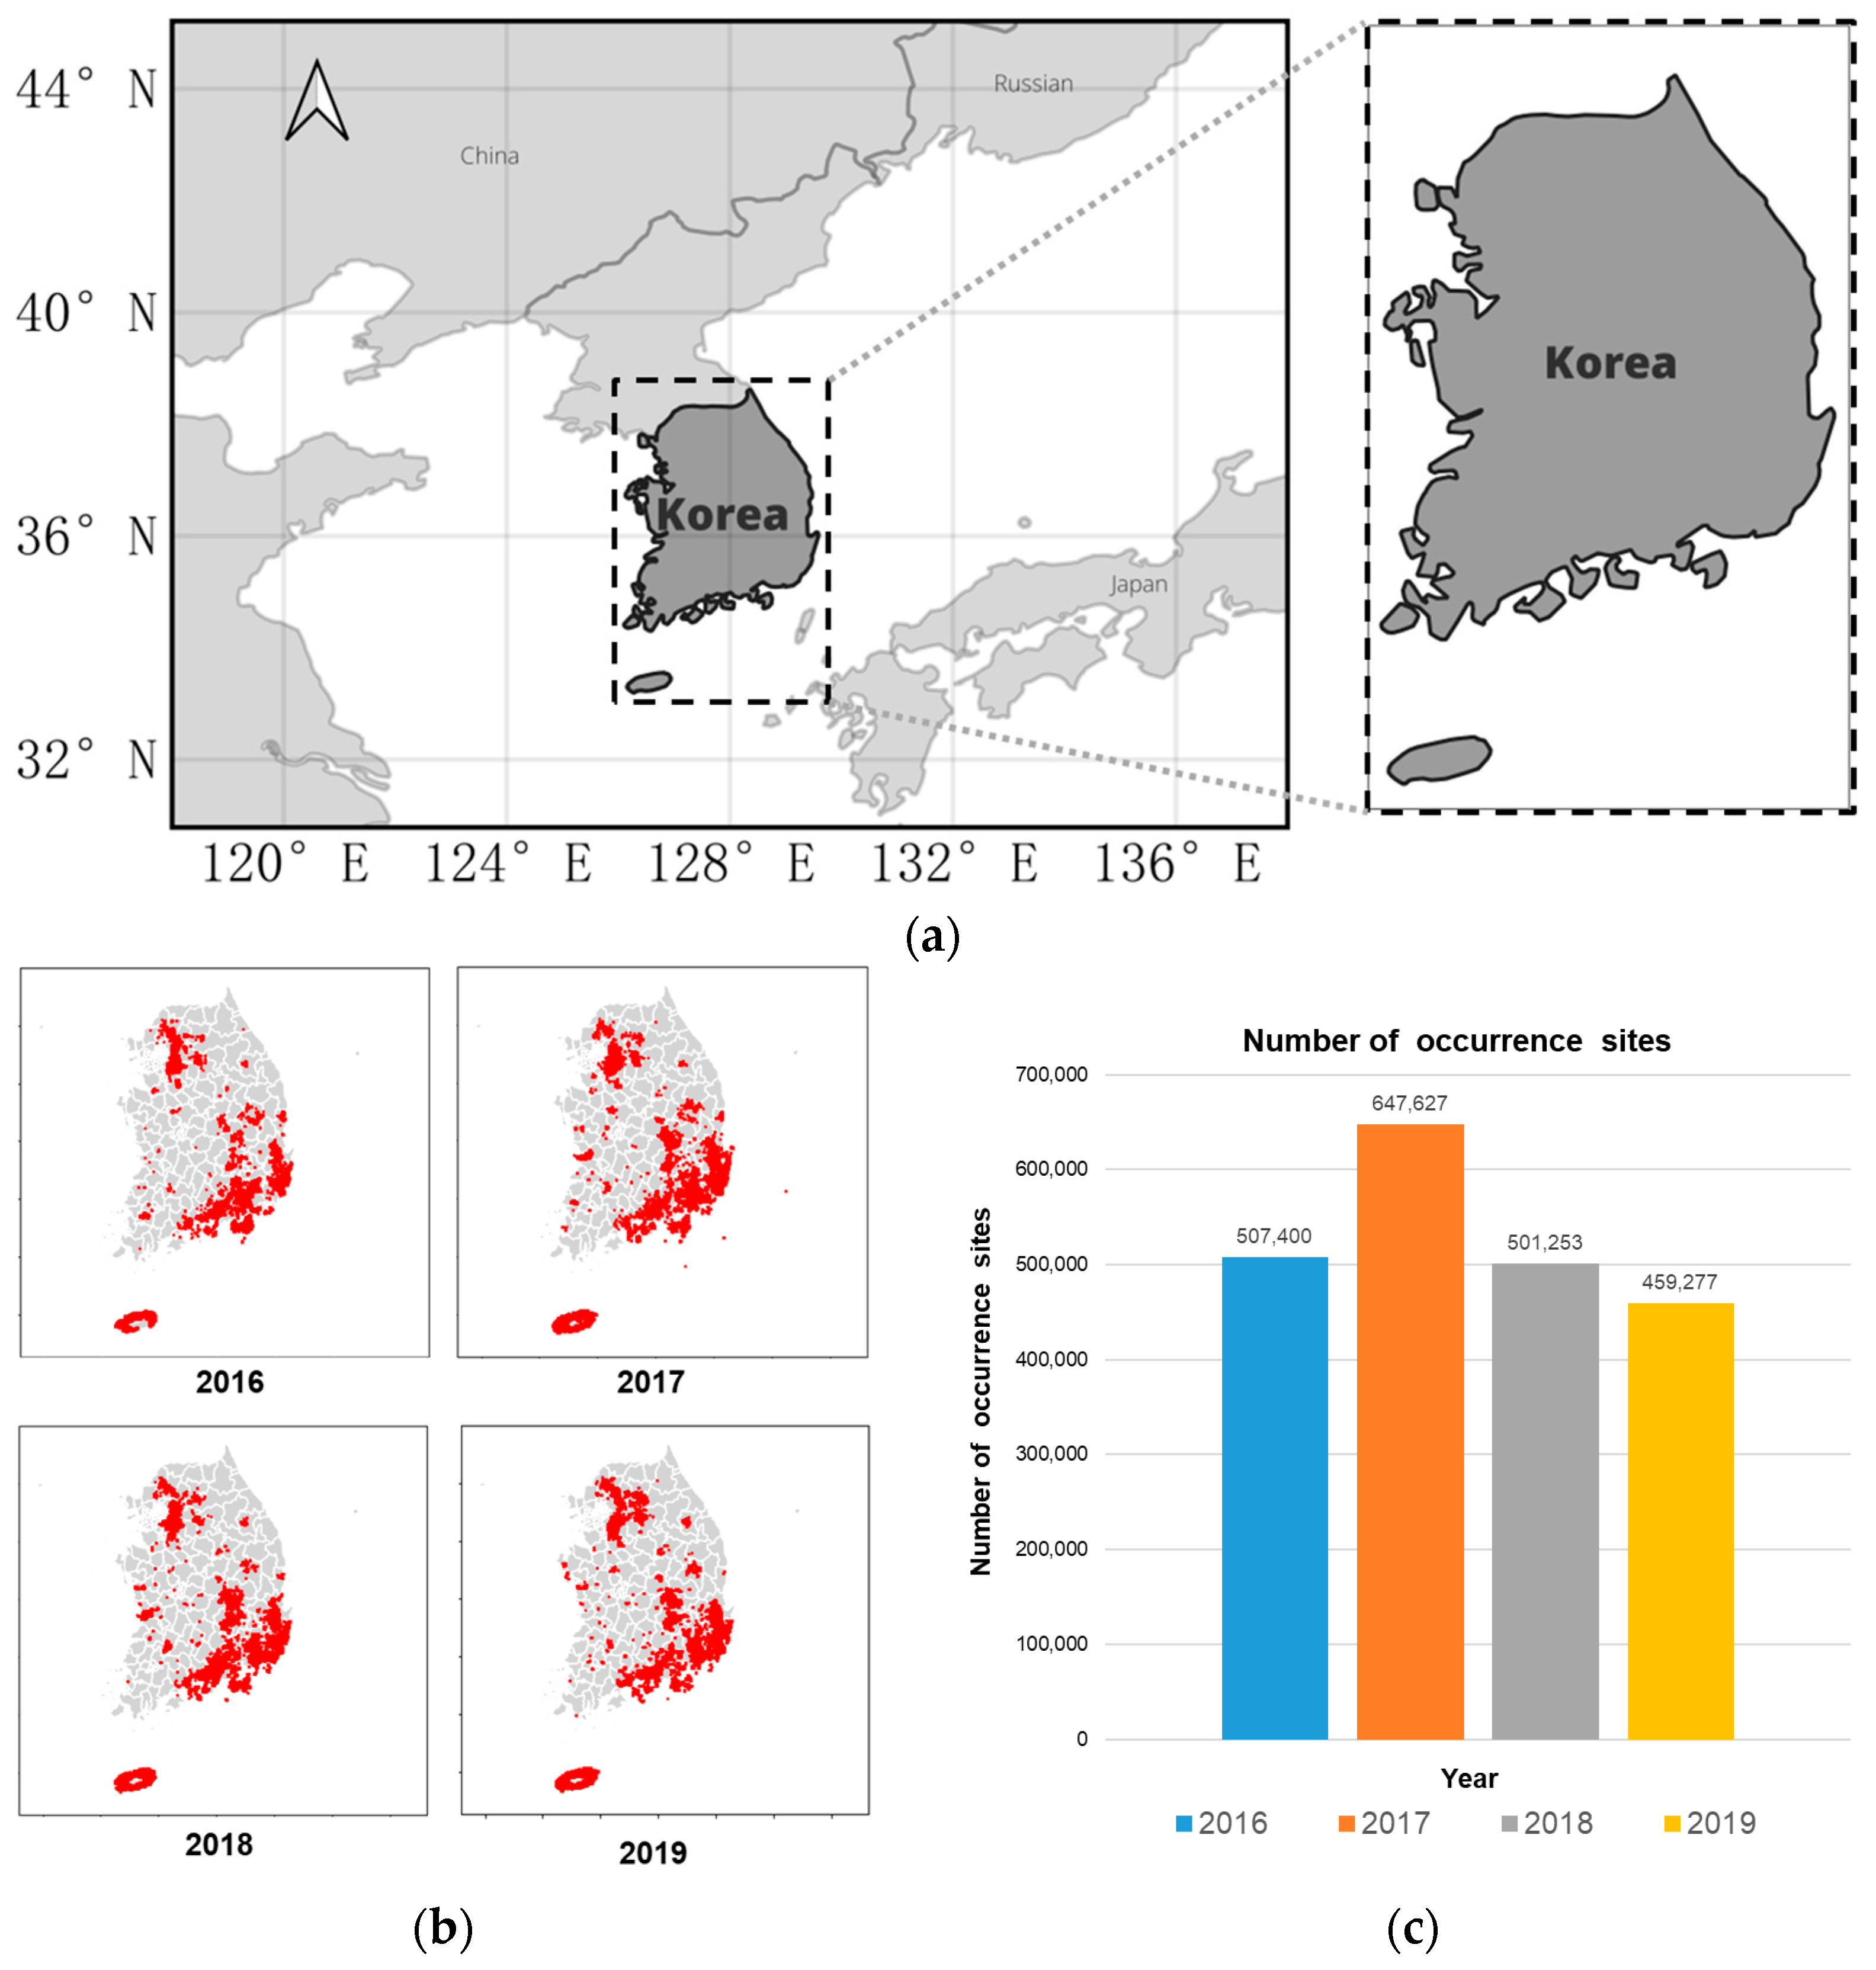
2.1. Data Collection
2.2. Raw Data Processing
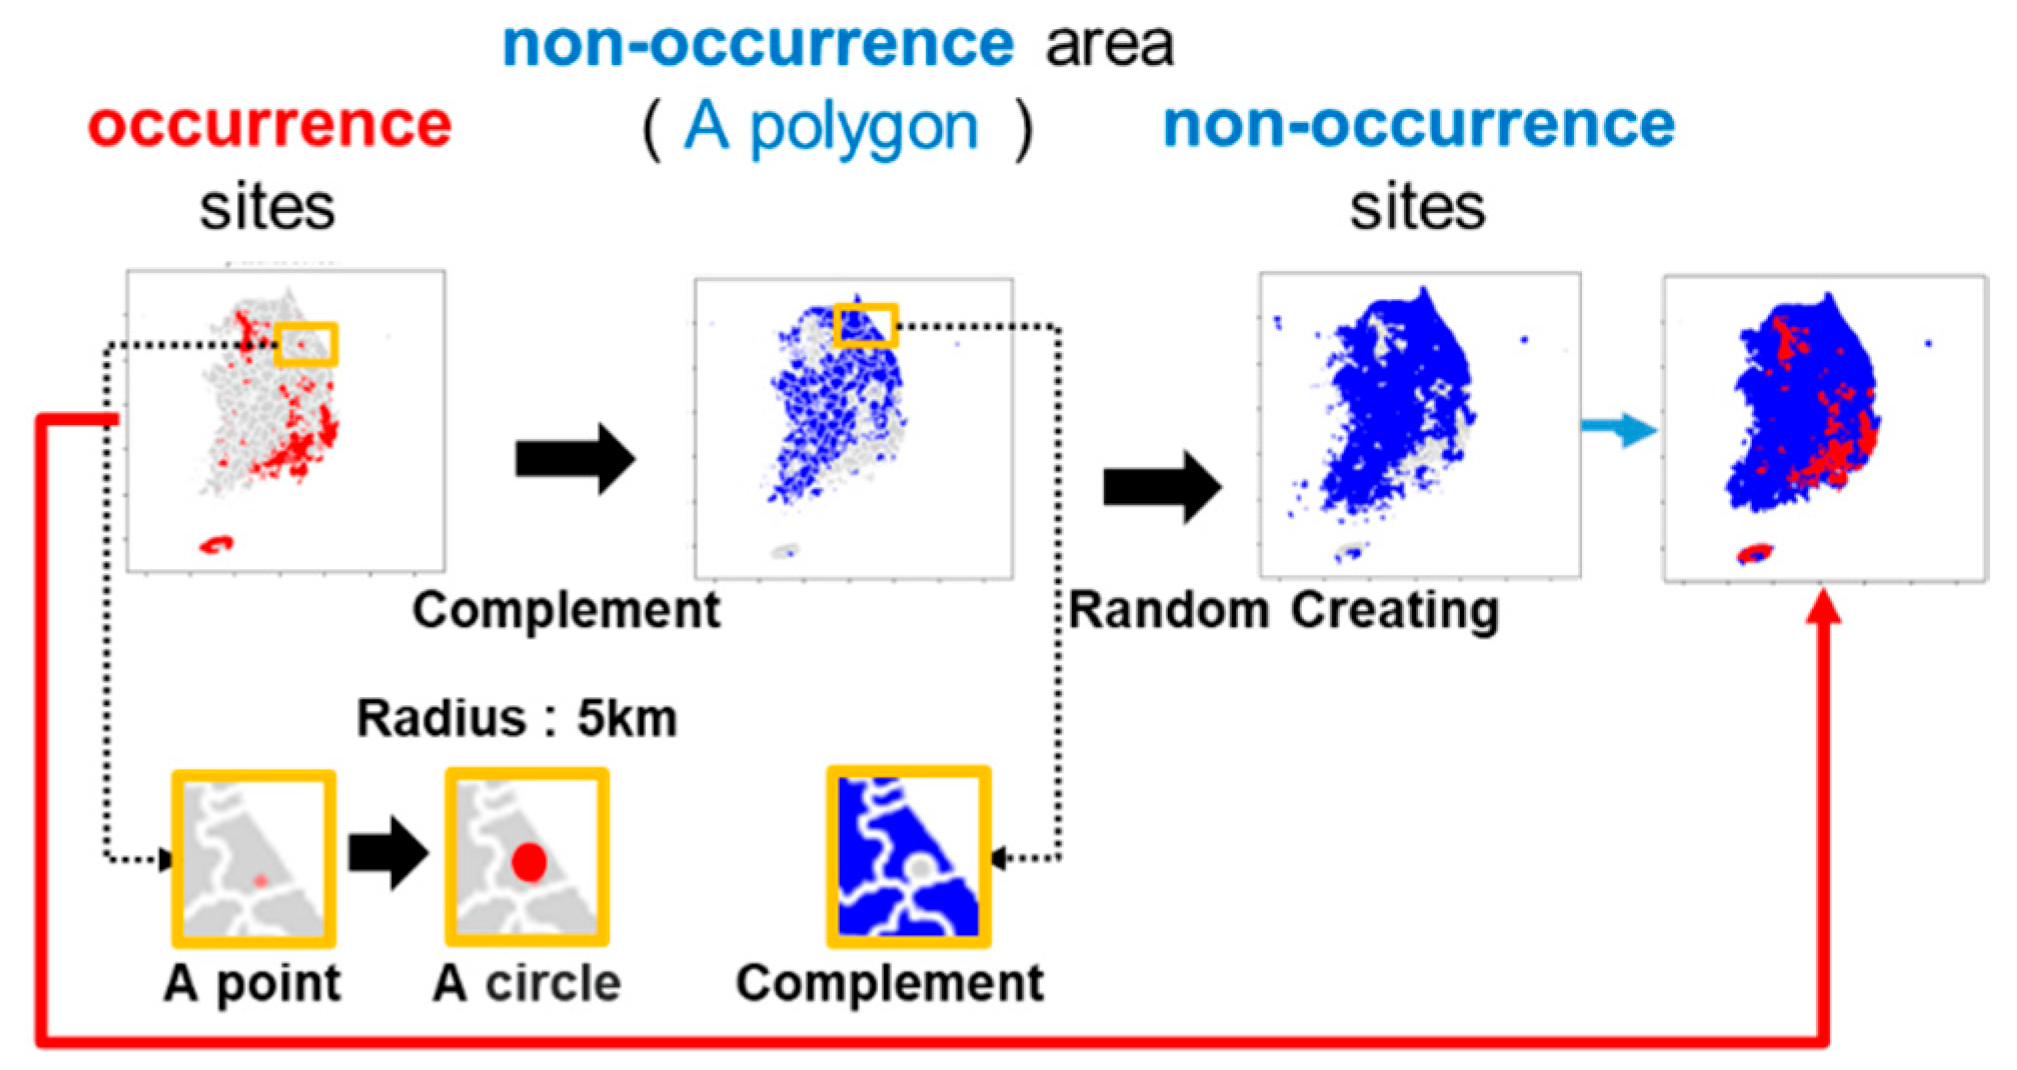
2.2.1. Non-Occurrence Site Generation
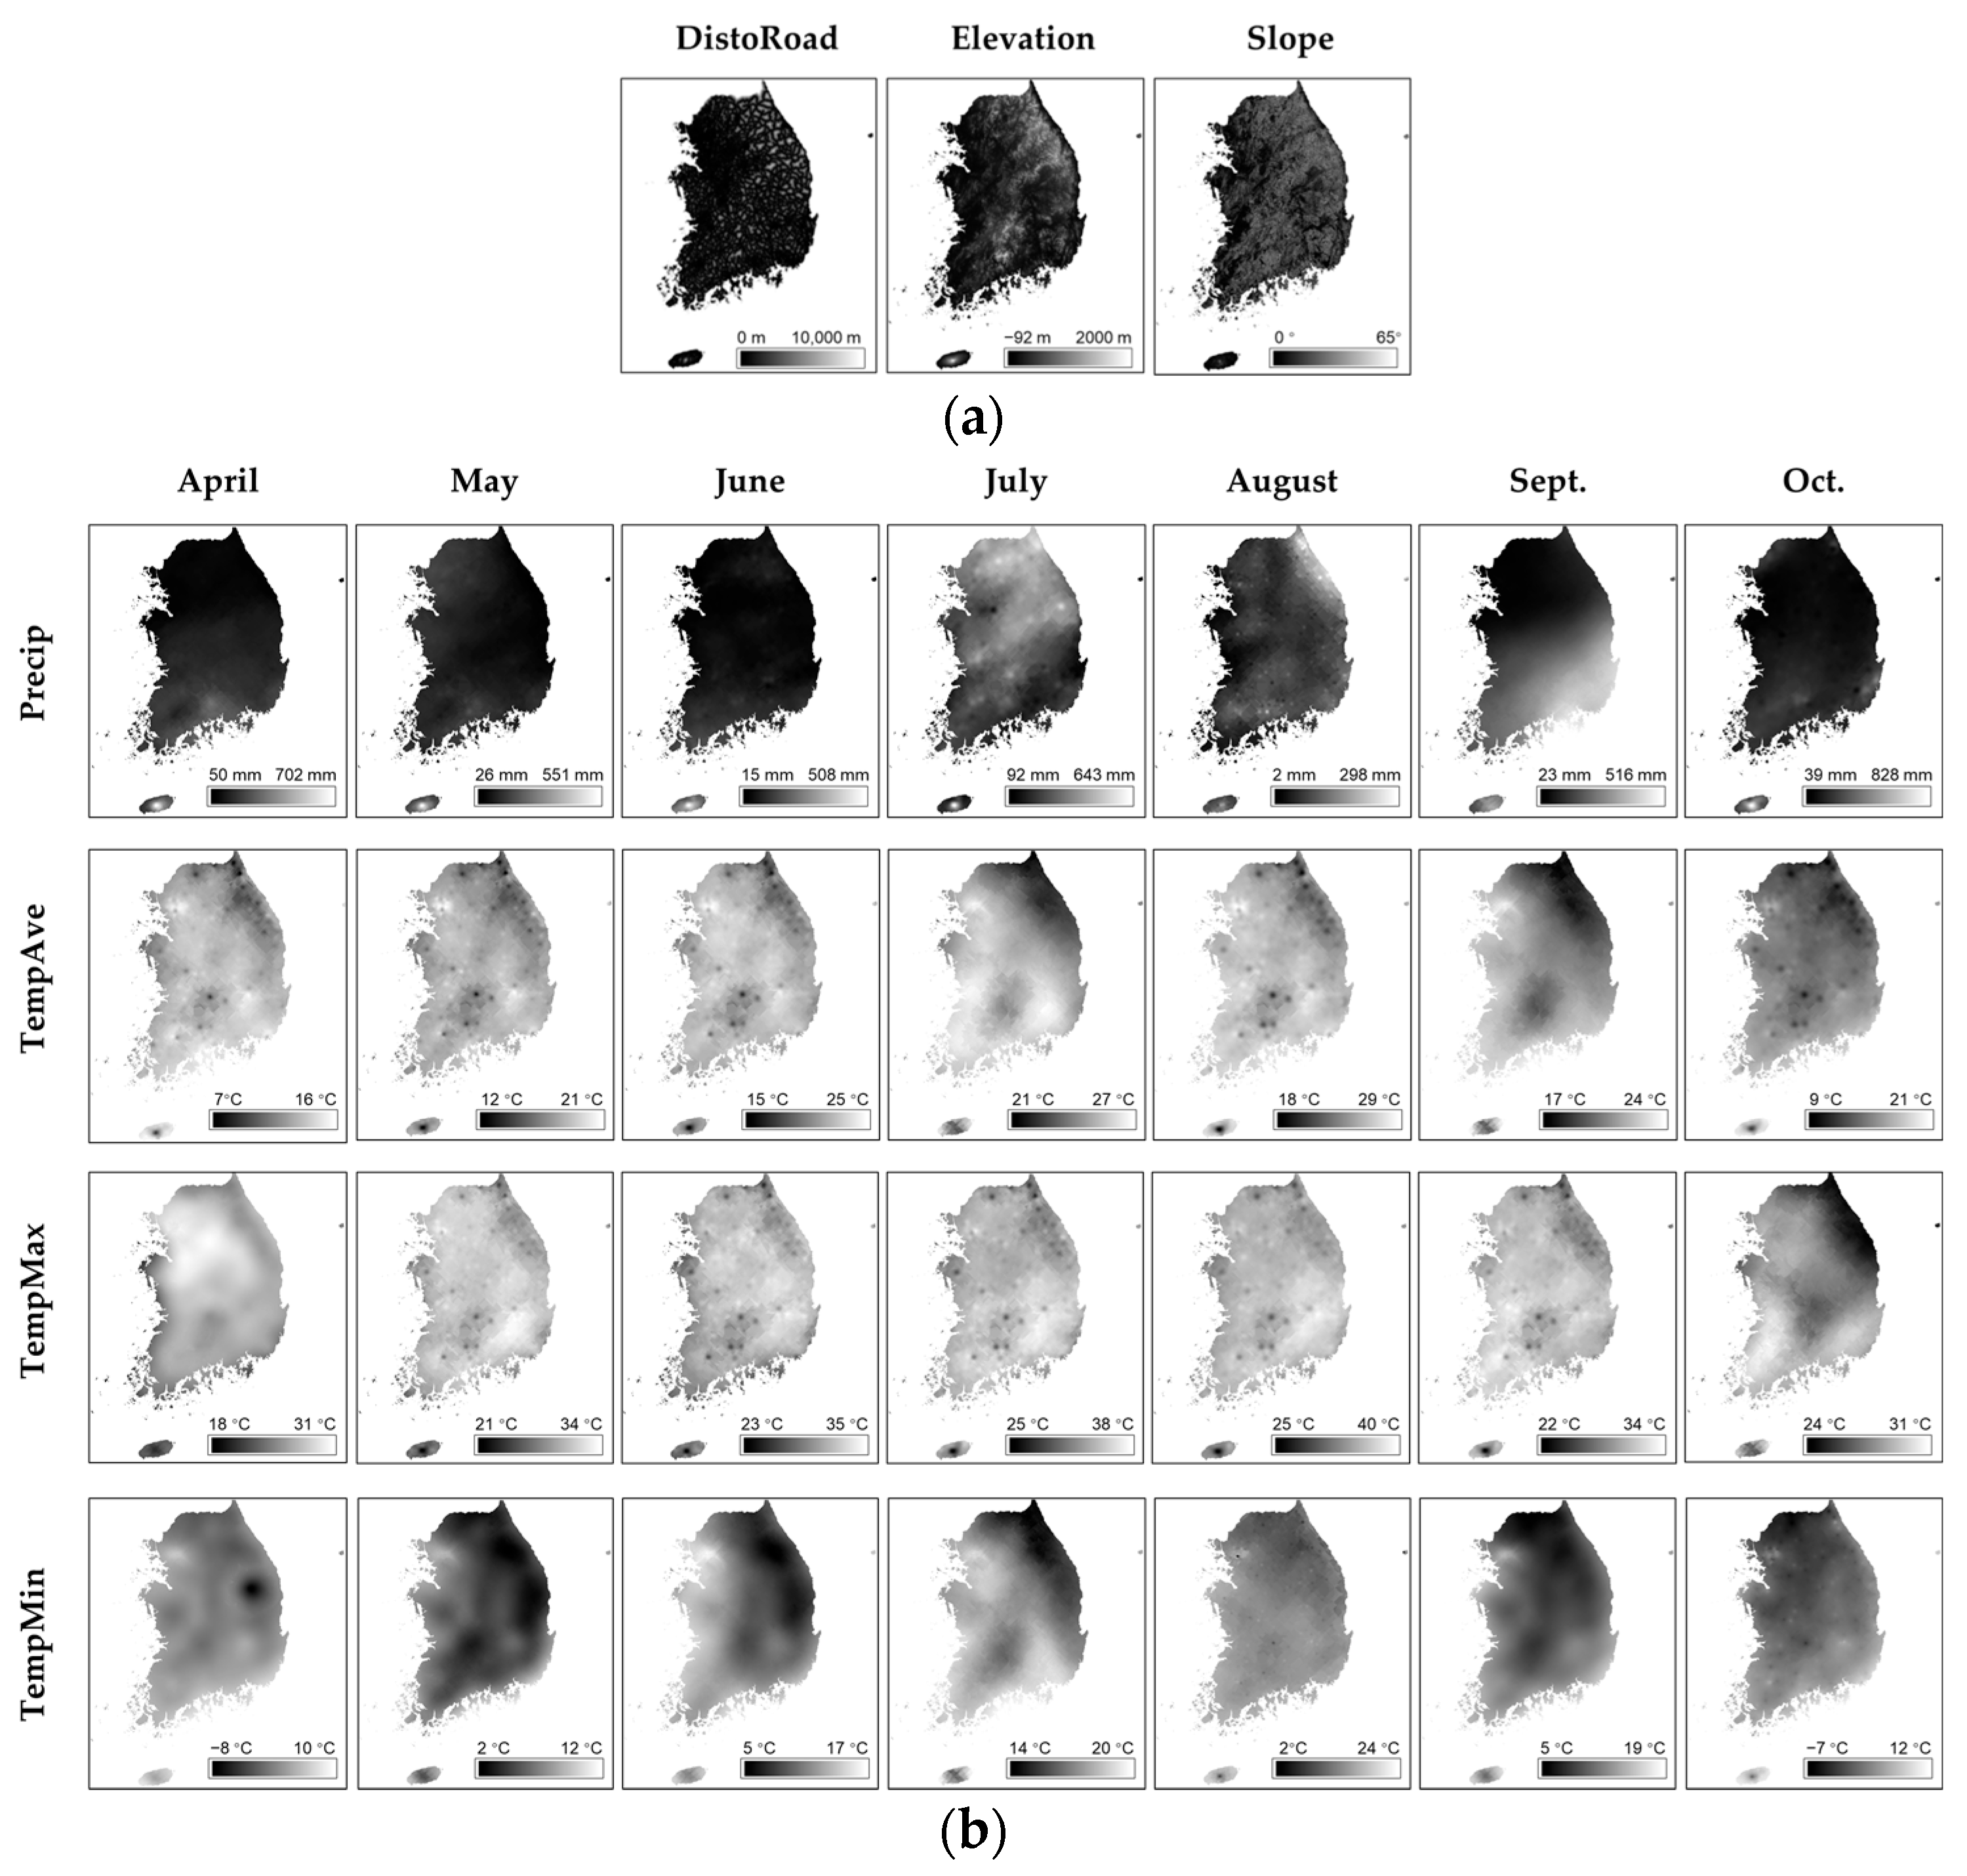
2.2.2. Features Selection
3. Methods
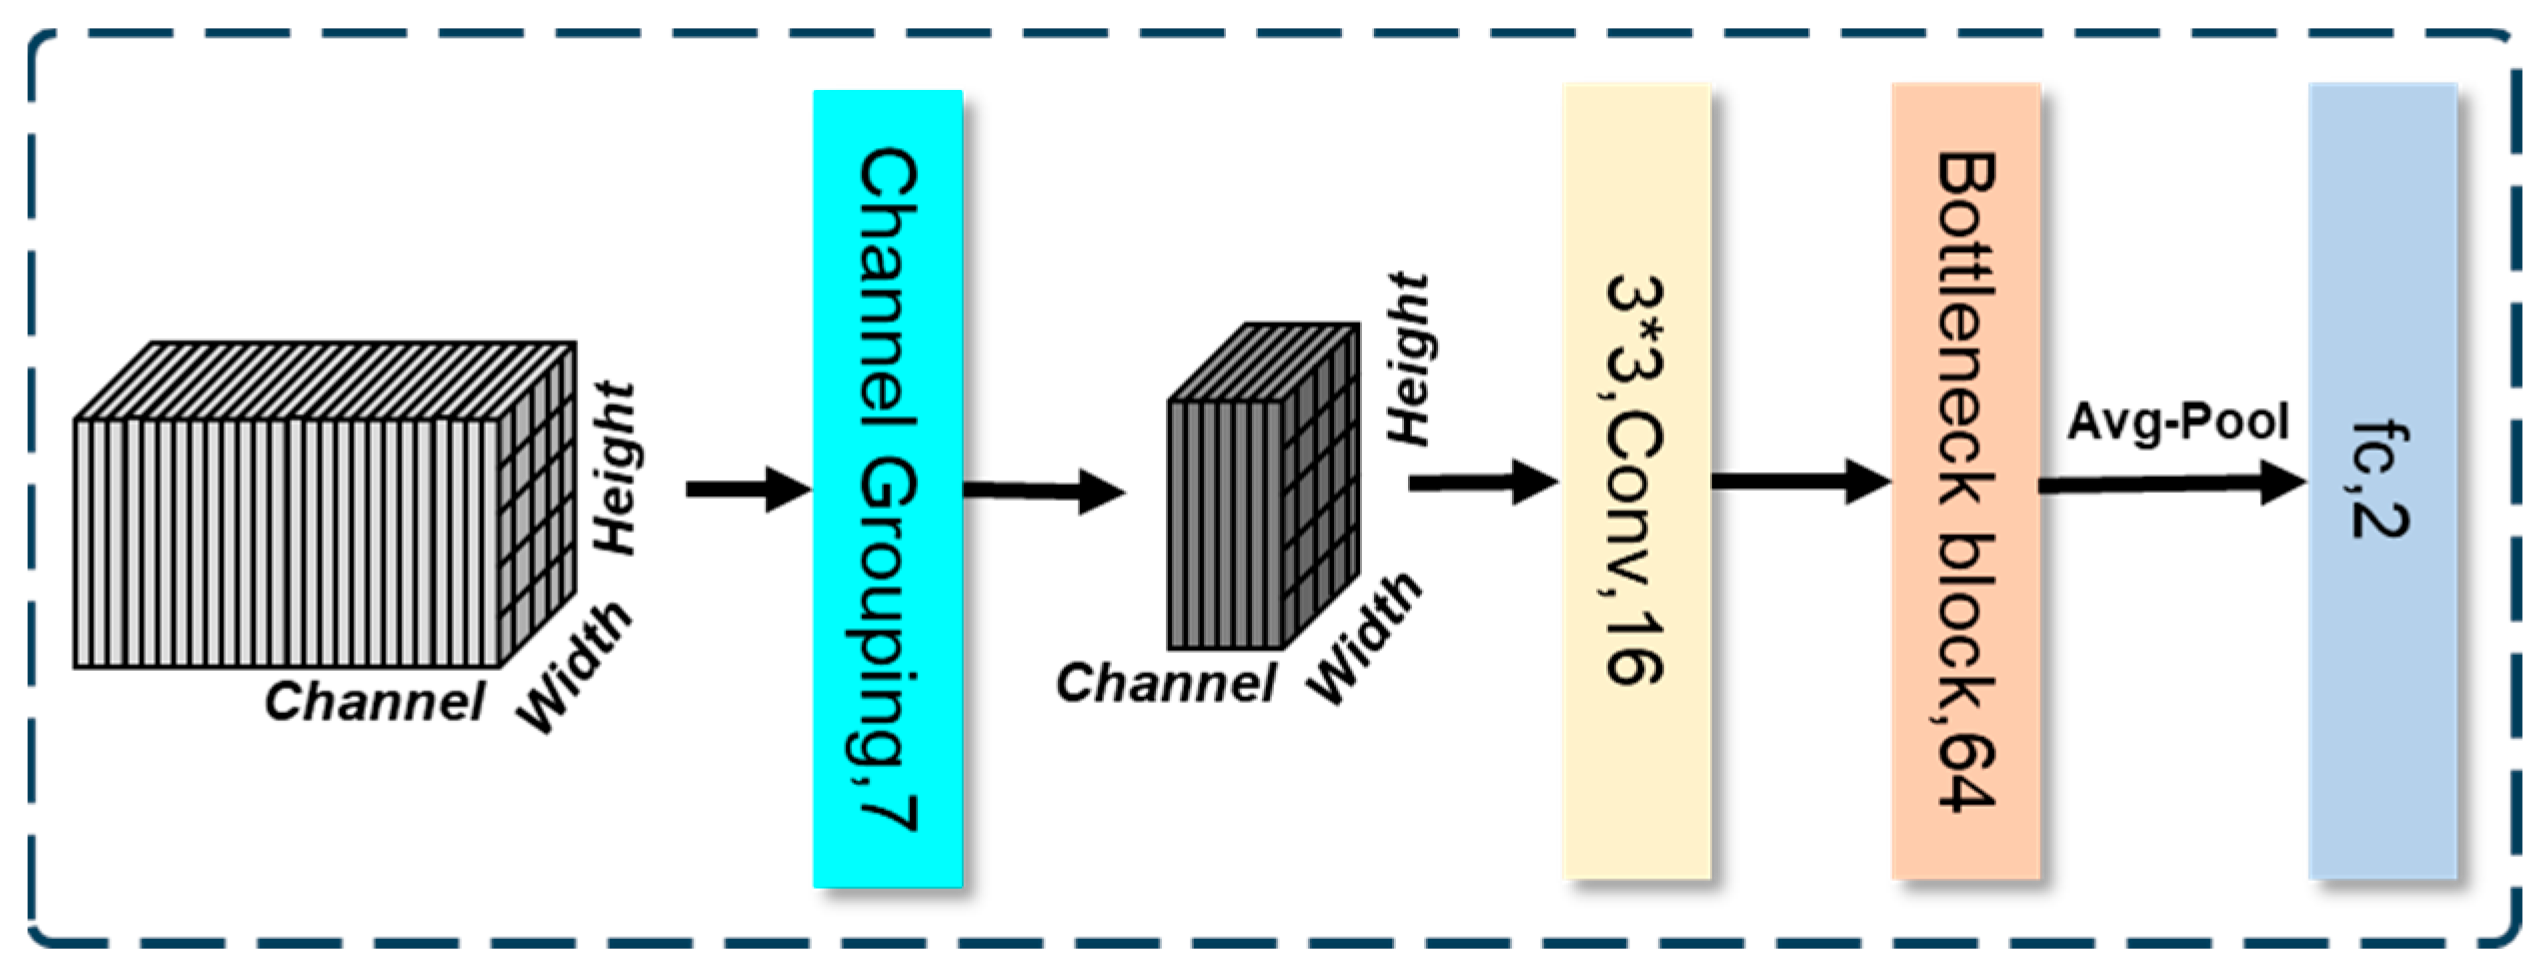
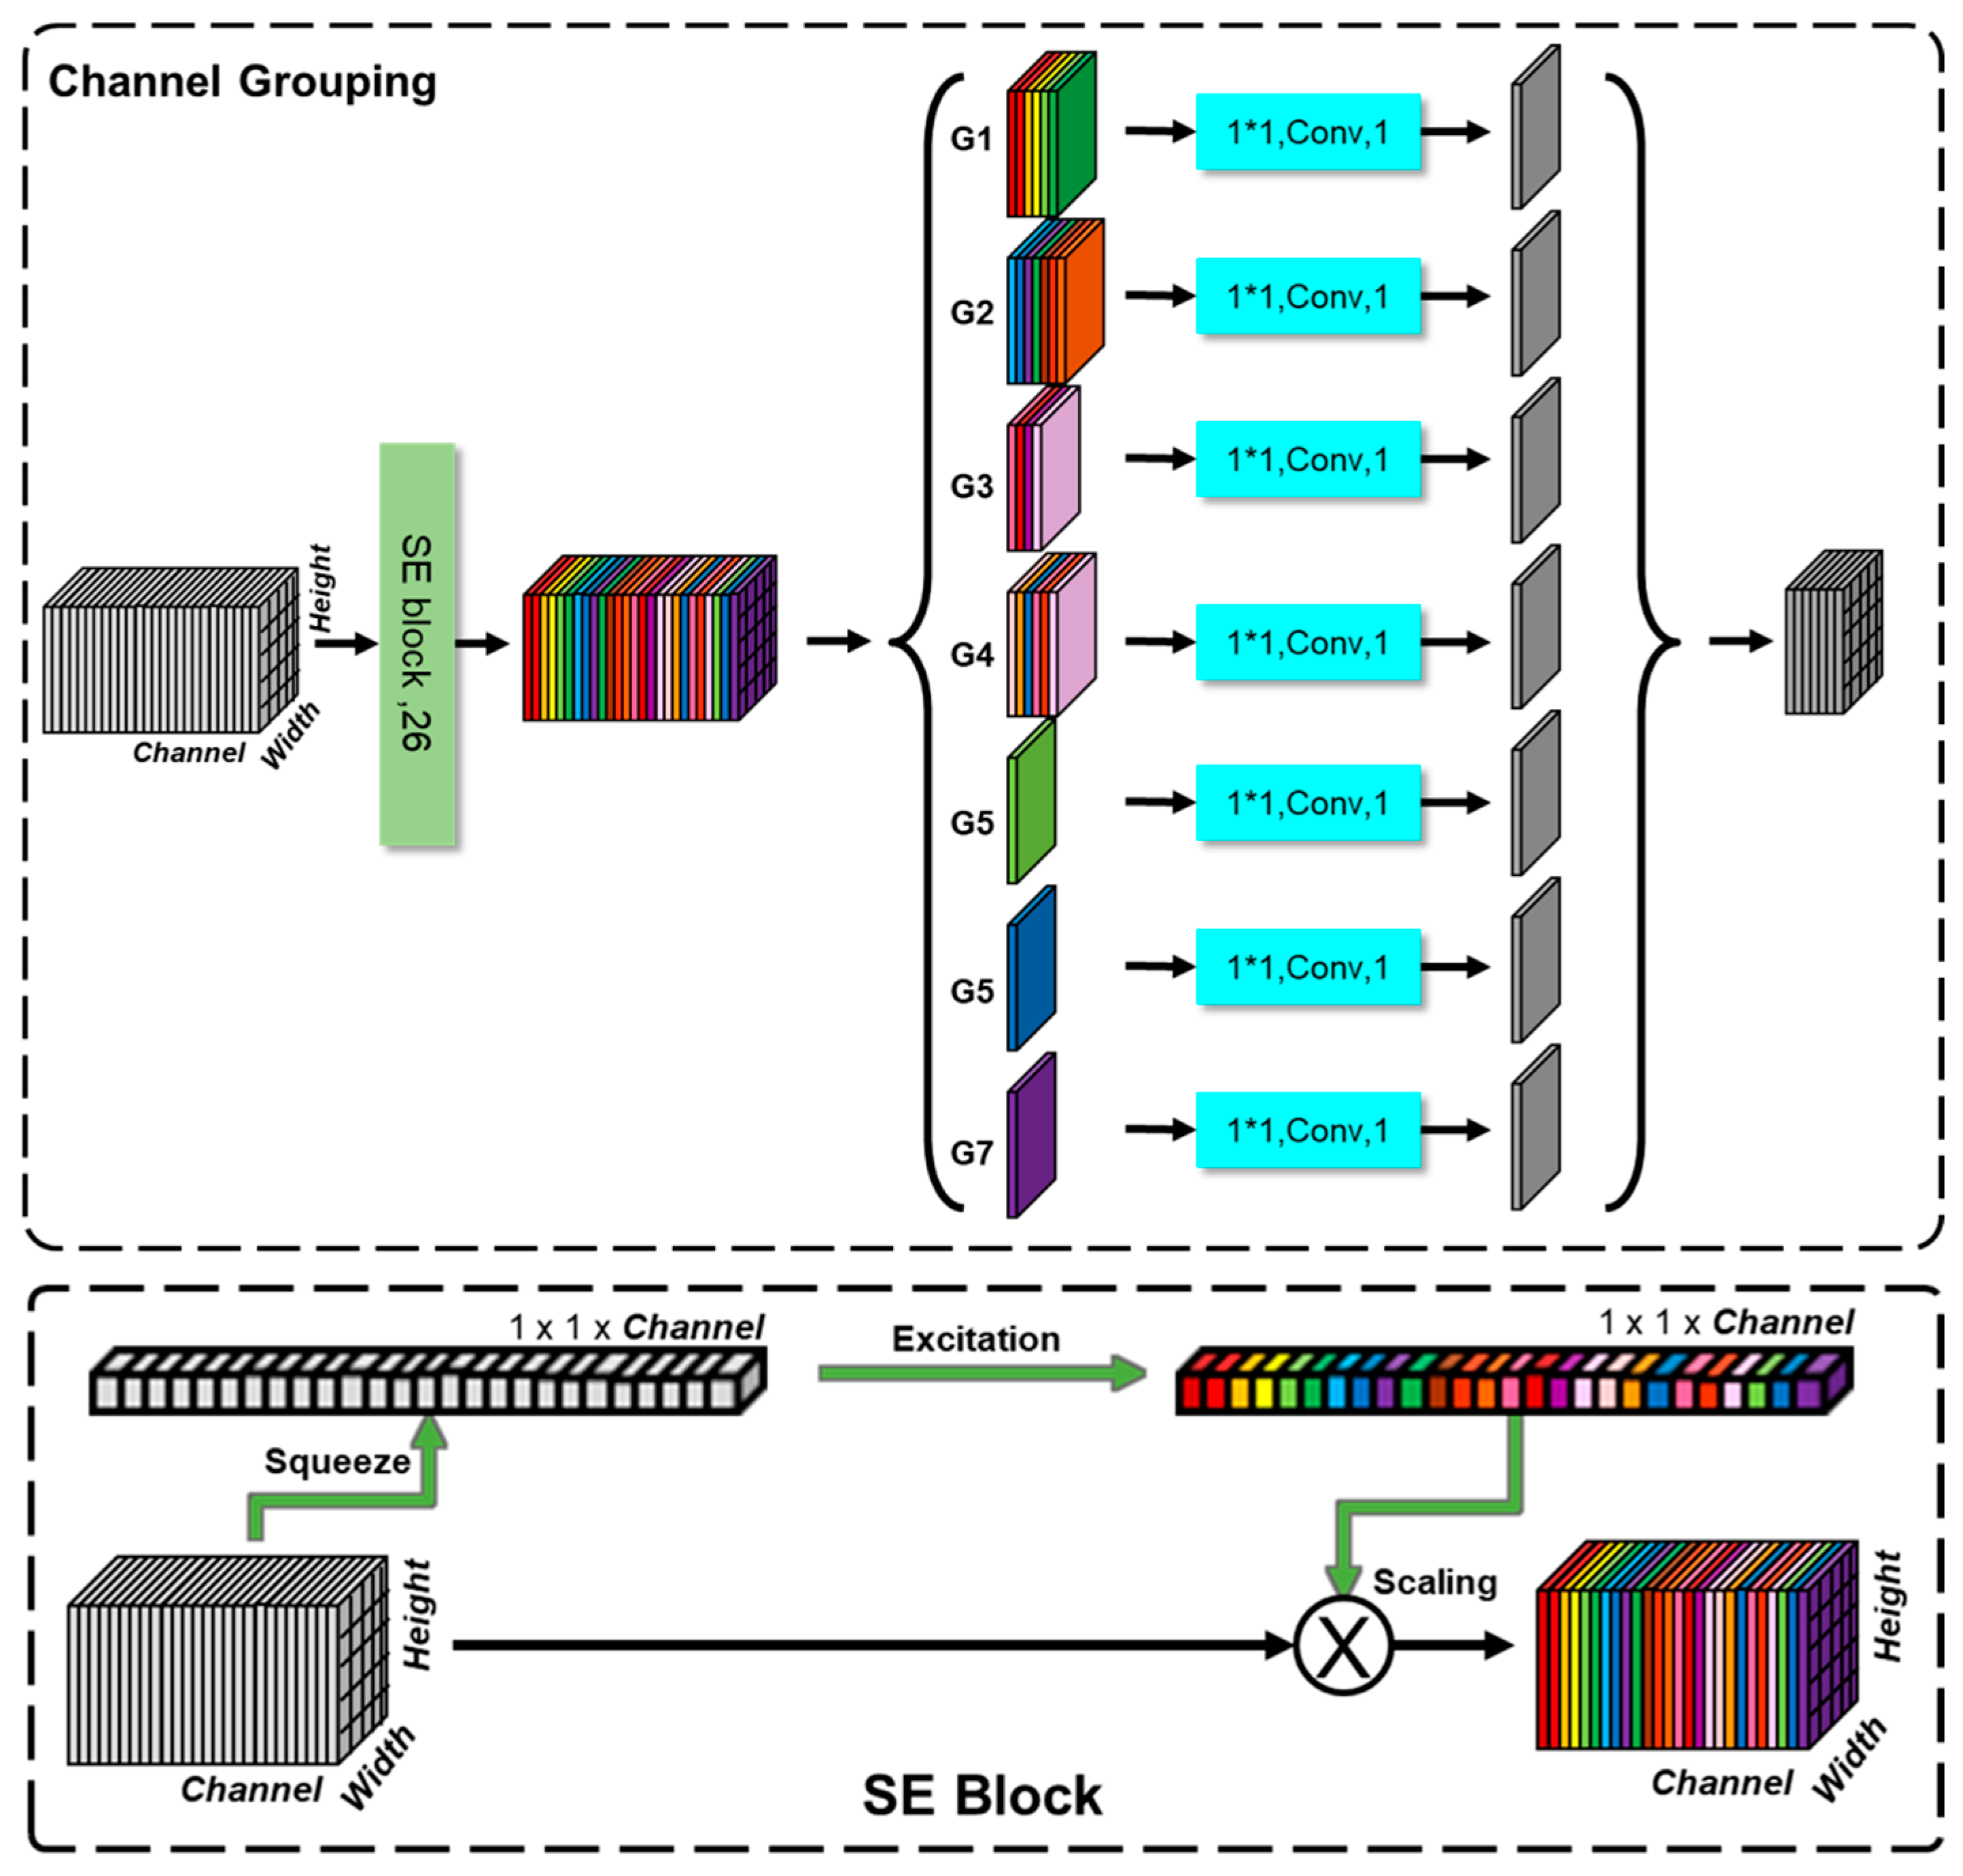
3.1. Channel Grouping
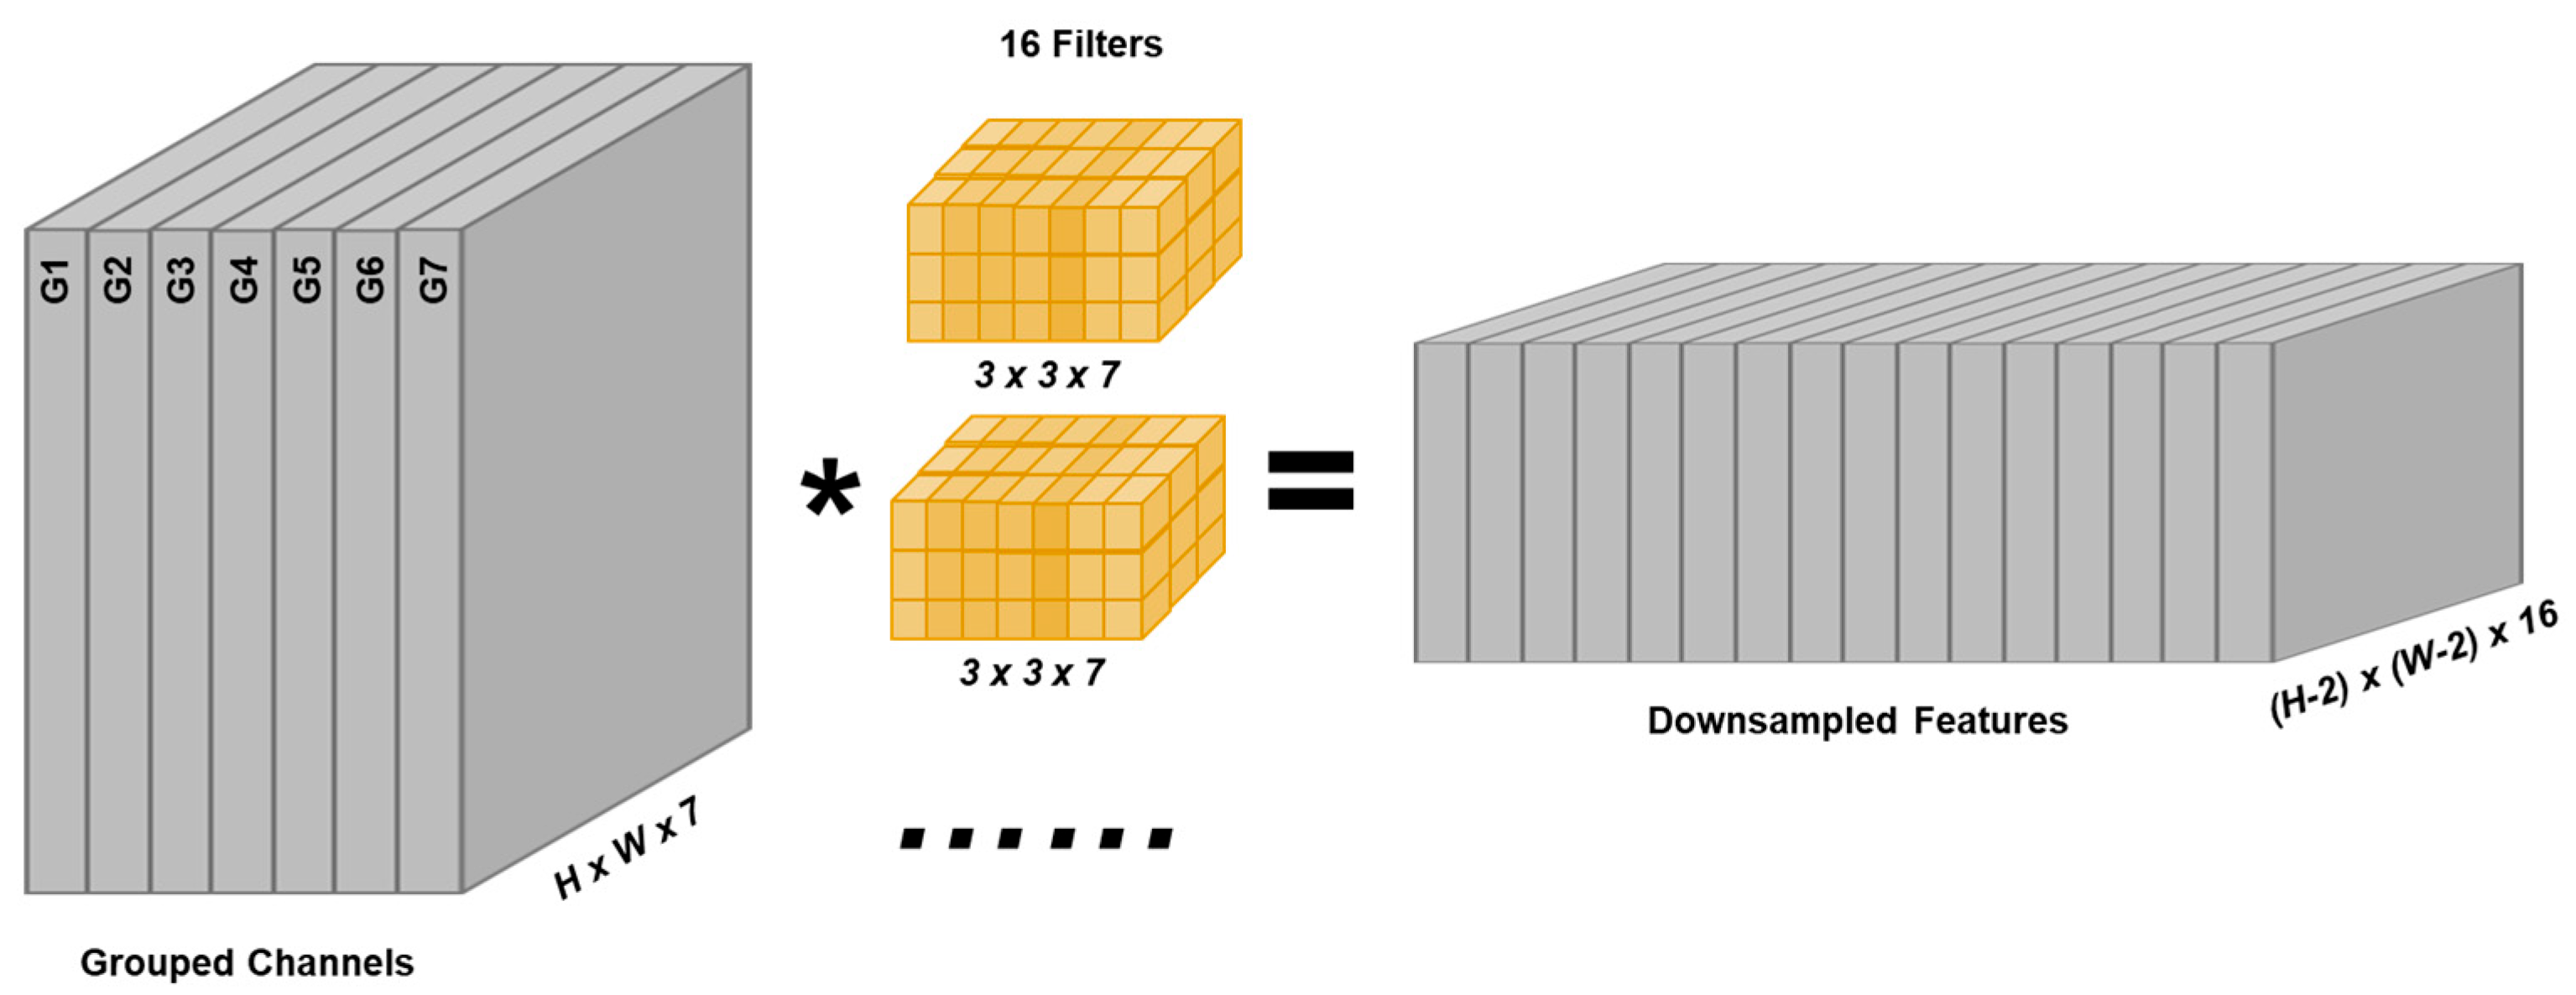
3.2. Downsampling with Increasing Number of Channels
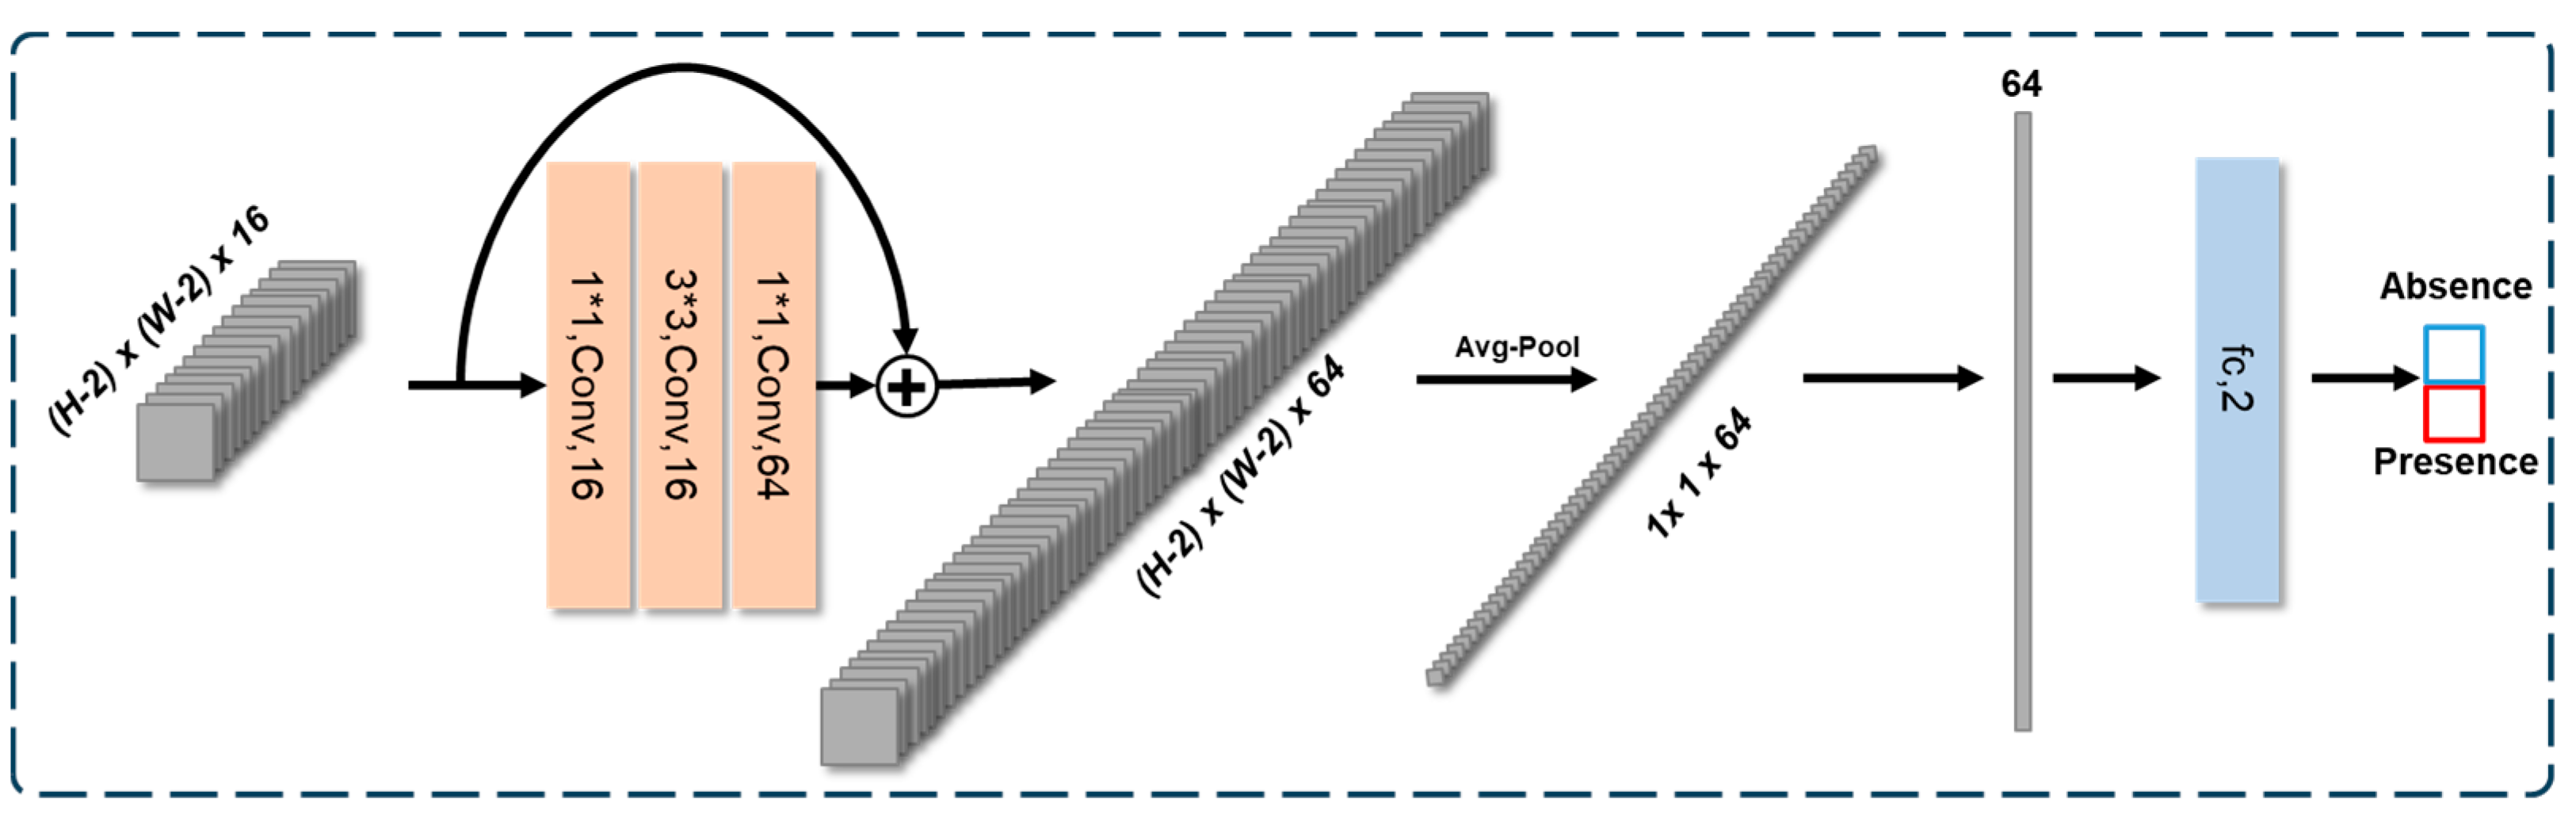
3.3. Bottleneck Block Upto FC (Fully Connected)-Based Classification Head
4. Experimental Results
4.1. Evaluation Metrics
4.2. Experiments
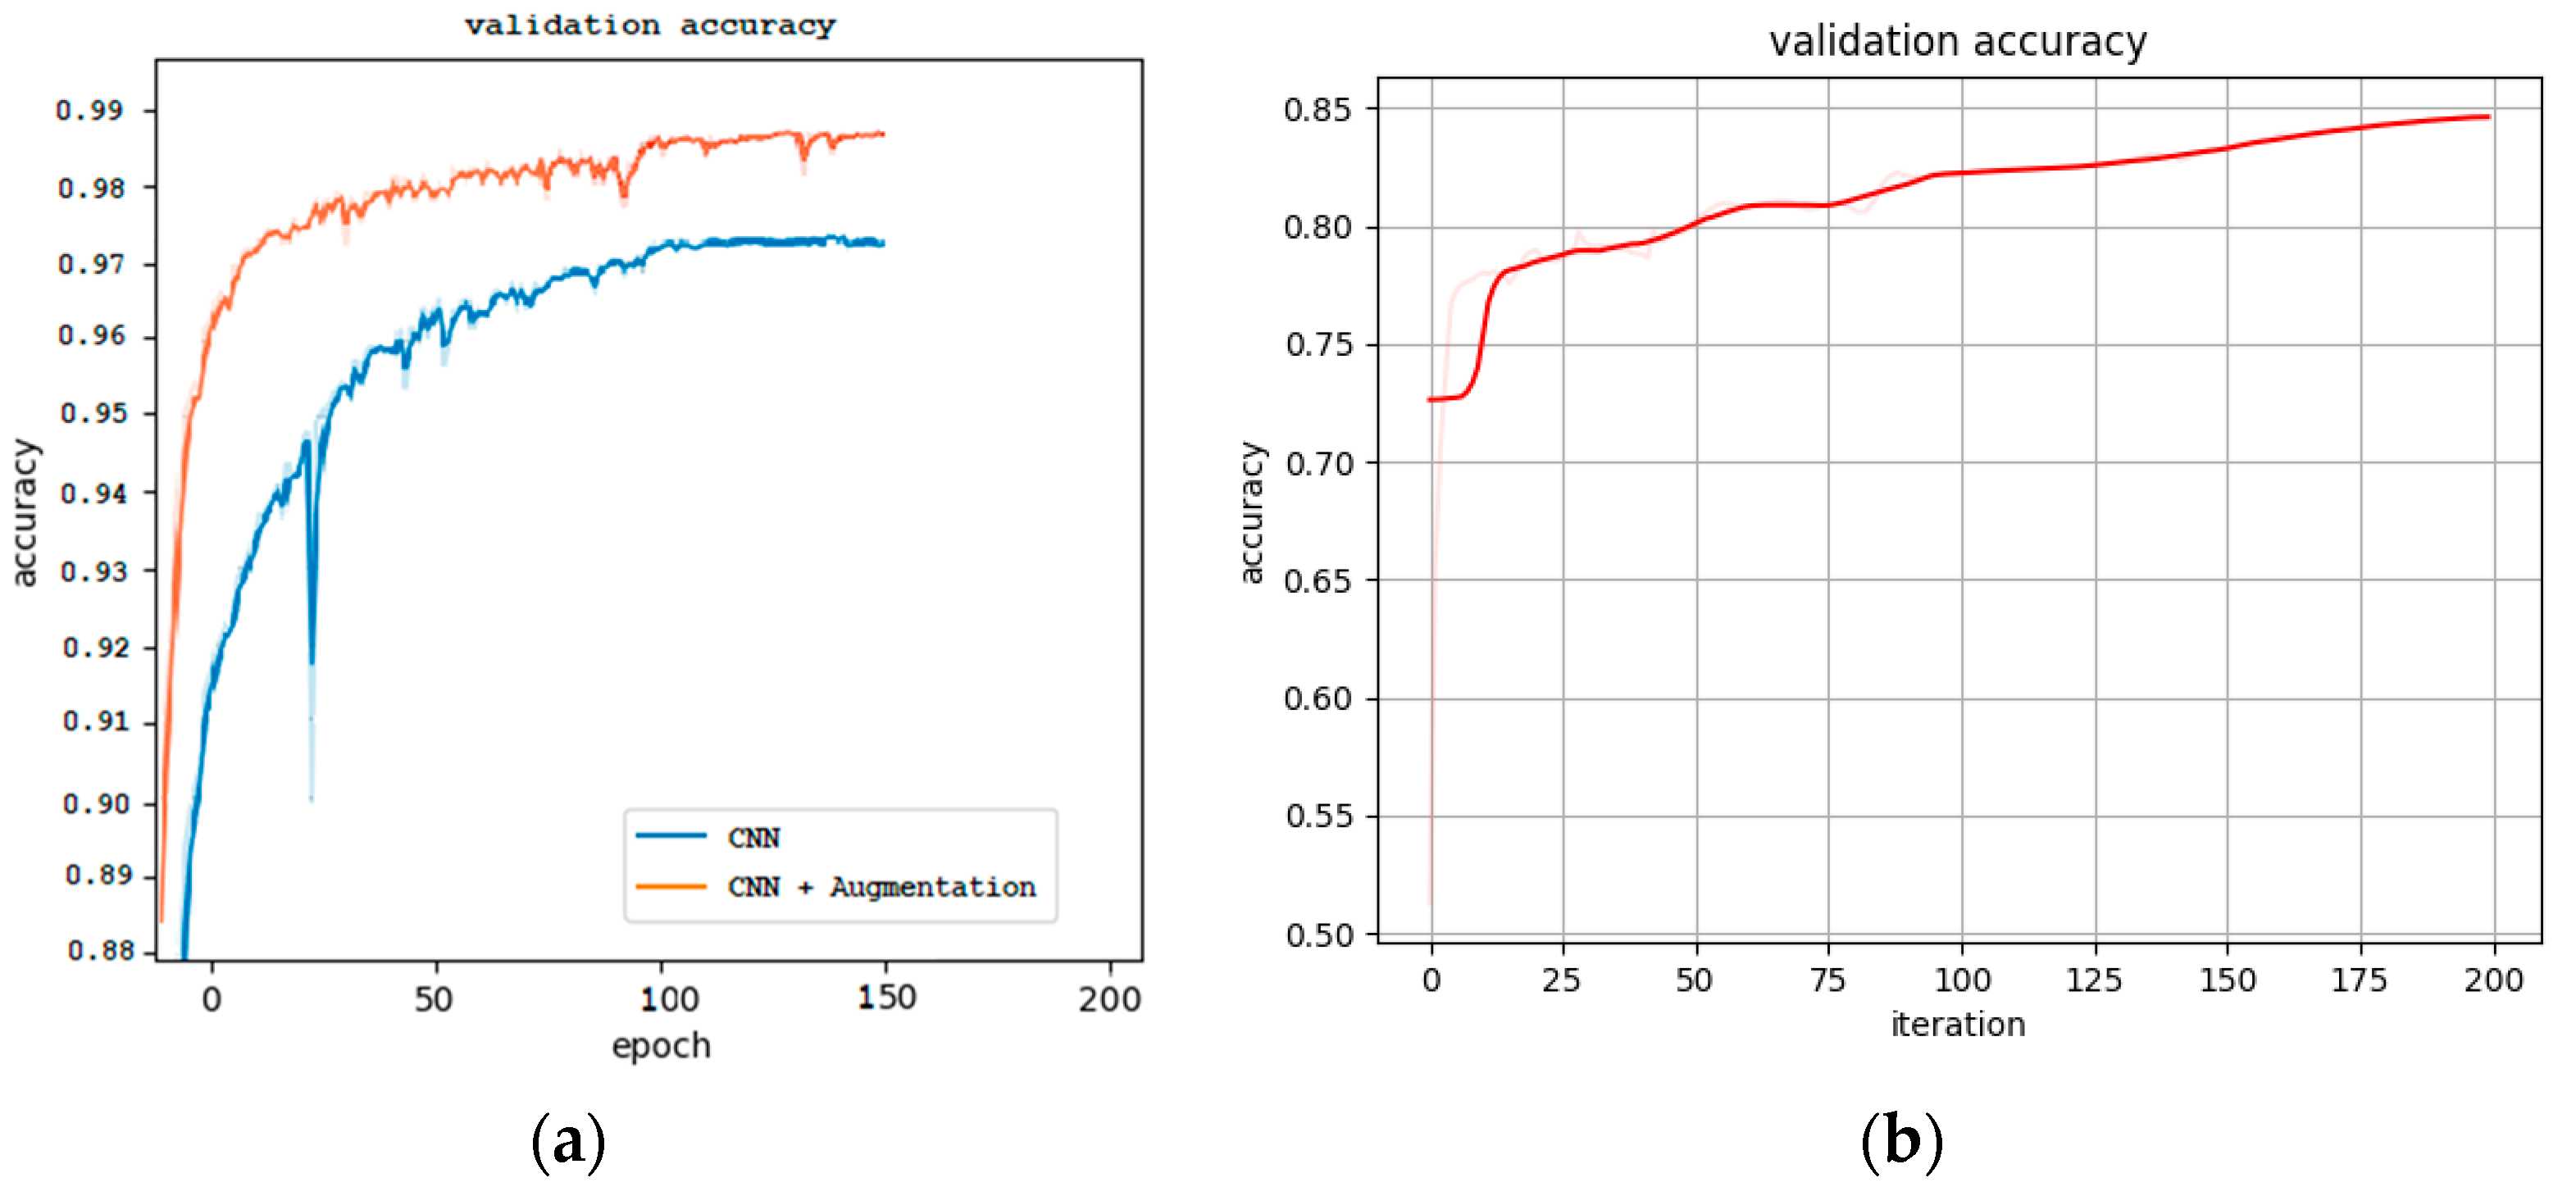
4.2.1. Model Development and Performance
4.2.2. Pseudo Neighbor Testing
4.2.3. Pseudo Point-Wise Testing
4.3. Interpretable Analysis
5. Discussion
6. Conclusions
Author Contributions
Funding
Data Availability Statement
Acknowledgments
Conflicts of Interest
References
- Khan, M.A.; Ahmed, L.; Mandal, P.K.; Smith, R.; Haque, M. Modelling the dynamics of Pine Wilt Disease with asymptomatic carriers and optimal control. Sci. Rep. 2020, 10, 11412. [Google Scholar] [CrossRef]
- Gent, D.H.; Schwartz, H.F. Validation of potato early blight disease forecast models for Colorado using various sources of meteorological data. Plant Dis. 2003, 87, 78–84. [Google Scholar] [CrossRef]
- Roubal, C.; Regis, S.; Nicot, P.C. Field models for the prediction of leaf infection and latent period of Fusicladium oleagineum on olive based on rain, temperature and relative humidity. Plant Pathol. 2013, 62, 657–666. [Google Scholar] [CrossRef]
- Valdez-Torres, J.B.; Soto-Landeros, F.; Osuna-Enciso, T.; Baez-Sanudo, M.A. Phenological prediction models for white corn (Zea mays L.) and fall armyworm (Spodoptera frugiperda J.E. Smith). Agrociencia 2012, 46, 399–410. [Google Scholar]
- Laderach, P.; Ramirez-Villegas, J.; Navarro-Racines, C.; Zelaya, C.; Martinez-Valle, A.; Jarvis, A. Climate change adaptation of coffee production in space and time. Clim. Chang. 2017, 141, 47–62. [Google Scholar] [CrossRef]
- Schwartz, M.W. Potential effects of global climate change on the biodiversity of plants. For. Chron. 1992, 68, 462–471. [Google Scholar] [CrossRef]
- Lee, D.-S.; Choi, W.I.; Nam, Y.; Park, Y.-S. Predicting potential occurrence of pine wilt disease based on environmental factors in South Korea using machine learning algorithms. Ecol. Inform. 2021, 64, 101378. [Google Scholar] [CrossRef]
- Hao, Z.; Fang, G.; Huang, W.; Ye, H.; Zhang, B.; Li, X. Risk prediction and variable analysis of pine wilt disease by a maximum entropy model. Forests 2022, 13, 342. [Google Scholar] [CrossRef]
- Yoon, S.; Jung, J.-M.; Hwang, J.; Park, Y.; Lee, W.-H. Ensemble evaluation of the spatial distribution of pine wilt disease mediated by insect vectors in South Korea. For. Ecol. Manag. 2023, 529, 120677. [Google Scholar] [CrossRef]
- Jung, J.-M.; Yoon, S.; Hwang, J.; Park, Y.; Lee, W.-H. Analysis of the spread distance of pine wilt disease based on a high volume of spatiotemporal data recording of infected trees. For. Ecol. Manag. 2024, 553, 121612. [Google Scholar] [CrossRef]
- Liu, D.; Zhang, X. Occurrence Prediction of Pine Wilt Disease Based on CA–Markov Model. Forests 2022, 13, 1736. [Google Scholar] [CrossRef]
- Zhang, B.; Ye, H.; Lu, W.; Huang, W.; Wu, B.; Hao, Z.; Sun, H. A Spatiotemporal Change Detection Method for Monitoring Pine Wilt Disease in a Complex Landscape Using High-Resolution Remote Sensing Imagery. Remote Sens. 2021, 13, 2083. [Google Scholar] [CrossRef]
- Deng, X.; Tong, Z.; Lan, Y.; Huang, Z. Detection and Location of Dead Trees with Pine Wilt Disease Based on Deep Learning and UAV Remote Sensing. AgriEngineering 2020, 2, 294–307. [Google Scholar] [CrossRef]
- Thapa, N.; Khanal, R.; Bhattarai, B.; Lee, J. Pine Wilt Disease Segmentation with Deep Metric Learning Species Classification for Early-Stage Disease and Potential False Positive Identification. Electronics 2024, 13, 1951. [Google Scholar] [CrossRef]
- Kosarevych, R.; Jonek-Kowalska, I.; Rusyn, B.; Sachenko, A.; Lutsyk, O. Analysing Pine Disease Spread Using Random Point Process by Remote Sensing of a Forest Stand. Remote Sens. 2023, 15, 3941. [Google Scholar] [CrossRef]
- Mathew, A.; Amudha, P.; Sivakumari, S. Deep learning techniques: An overview. Adv. Mach. Learn. Technol. Appl. Proc. AMLTA 2021, 2020, 599–608. [Google Scholar]
- Krizhevsky, A.; Sutskever, I.; Hinton, G.E. Imagenet classification with deep convolutional neural networks. Commun. ACM 2017, 60, 84–90. [Google Scholar]
- He, K.; Zhang, X.; Ren, S.; Sun, J. Deep residual learning for image recognition. In Proceedings of the IEEE Conference on Computer Vision and Pattern Recognition, Las Vegas, NV, USA, 27–30 June 2016; pp. 770–778. [Google Scholar]
- Koren National Information Society Agency. 2019. Available online: https://www.bigdata-forest.kr/ (accessed on 27 March 2025).
- National Geographic Information Institute of Korea. 2019. Available online: https://www.ngii.go.kr/ (accessed on 27 March 2025).
- National Spatial Data Infrastructure Portal. 2023. Available online: https://www.vworld.kr/ (accessed on 27 March 2025).
- Intelligent Transport Systems of Standard Node Link. 2019. Available online: https://www.its.go.kr/nodelink/nodelinkRef (accessed on 27 March 2025).
- Climate Information Portal of the Korea Meteorological Administration. 2017. Available online: https://www.climate.go.kr/ (accessed on 27 March 2025).
- McKnight, P.E.; Najab, J. Mann-Whitney U Test. In The Corsini Encyclopedia of Psychology; John Wiley & Sons: Hoboken, NJ, USA, 2010; p. 1. [Google Scholar]
- Park, S.-G.; Hong, S.-H.; Oh, C.-J. A Study on Correlation Between the Growth of Korean Red Pine and Location Environment in Temple Forests in Jeollanam-do, Korea. Korean J. Environ. Ecol. 2017, 31, 409–419. [Google Scholar] [CrossRef]
- Lee, D.-S.; Nam, Y.; Choi, W.I.; Park, Y.-S. Environmental factors influencing on the occurrence of pine wilt disease in Korea. Korean J. Ecol. Environ. 2017, 50, 374–380. [Google Scholar] [CrossRef]
- Hu, J.; Shen, L.; Sun, G. Squeeze-and-excitation networks. In Proceedings of the IEEE Conference on Computer Vision and Pattern Recognition, Salt Lake City, UT, USA, 18–23 June 2018. [Google Scholar] [CrossRef]
- Szegedy, C.; Liu, W.; Jia, Y.; Sermanet, P.; Reed, S.; Anguelov, D.; Erhan, D.; Vanhoucke, V.; Rabinovich, A. Going deeper with convolutions. In Proceedings of the IEEE Conference on Computer Vision and Pattern Recognition, Boston, MA, USA, 7–12 June 2015; pp. 1–9. [Google Scholar] [CrossRef]
- LaValley, M.P. Logistic regression. Circulation 2008, 117, 2395–2399. [Google Scholar] [CrossRef]
- Goutte, C.; Eric, G. A Probabilistic Interpretation of Precision, Recall and F-Score, with Implication for Evaluation. European Conference on Information Retrieval; Springer: Berlin/Heidelberg, Germany, 2005. [Google Scholar]
- MMPreTrain Contributors. OpenMMLab’s Pre-training Toolbox and Benchmark. 2023. Available online: https://github.com/open-mmlab/mmpretrain (accessed on 27 March 2025).
- Kingma, D.P. Adam: A method for stochastic optimization. arXiv 2014, arXiv:1412.6980. [Google Scholar]
- Bisong, E.; Ekaba, B. Introduction to Scikit-learn. In Building Machine Learning and Deep Learning Models on Google Cloud Platform: A Comprehensive Guide for Beginners; Apress: Berkeley, CA, USA, 2019; pp. 215–229. [Google Scholar]
- Sandler, M.; Howard, A.; Zhu, M.; Zhmoginov, A.; Chen, L.C. Mobilenetv2: Inverted residuals and linear bottlenecks. In Proceedings of the IEEE Conference on Computer Vision and Pattern Recognition, Salt Lake City, UT, USA, 18–23 June 2018; pp. 4510–4520. [Google Scholar] [CrossRef]
- Altmann, A.; Toloşi, L.; Sander, O.; Lengauer, T. Permutation importance: A corrected feature importance measure. Bioinformatics 2010, 26, 1340–1347. [Google Scholar] [CrossRef] [PubMed]
- Kokhlikyan, N.; Miglani, V.; Martin, M.; Wang, E.; Alsallakh, B.; Reynolds, J.; Melnikov, A.; Kliushkina, N.; Araya, C.; Yan, S.; et al. Captum: A unified and generic model interpretability library for pytorch. arXiv 2020, arXiv:2009.07896. [Google Scholar]
- Farashi, A.; Mohammad, A.-N. Basic Introduction to Species Distribution Modelling. Ecosystem and Species Habitat Modeling for Conservation and Restoration; Springer Nature: Singapore, 2023; pp. 21–40. [Google Scholar] [CrossRef]
- Mulla, S.; Pande, C.B.; Singh, S.K. Times series forecasting of monthly rainfall using seasonal auto regressive integrated moving average with EXogenous variables (SARIMAX) model. Water Resour. Manag. 2024, 38, 1825–1846. [Google Scholar] [CrossRef]


| Alias | Feature | Unit |
|---|---|---|
| DistoRoad | Distance to road | Meter (m) |
| Elevation | Elevation | Meter (m) |
| Slope | Slope | Degree (°) |
| #(4~10)_Precip | Monthly Precipitation | Millimeter (mm) |
| #(4~10)_TempAve | Monthly Mean temperature | Degree Celsius (°C) |
| #(4~10)_TempMax | Monthly Maximum temperature | Degree Celsius (°C) |
| #(4~10)_TempMin | Monthly Minimum temperature | Degree Celsius (°C) |
| Feature | p-value | ||||||
| DistoRoad | <0.001 | ||||||
| Elevation | <0.001 | ||||||
| Slope | 0.919 | ||||||
| (a) | |||||||
| Feature | April | May | June | July | August | Sept. | Oct. |
| Precip | <0.001 | 0.067 | <0.001 | <0.001 | <0.001 | <0.001 | <0.001 |
| TempAve | <0.001 | <0.001 | <0.001 | <0.001 | <0.001 | <0.001 | <0.001 |
| TempMax | 0.833 | <0.001 | 0.031 | <0.001 | <0.001 | 0.414 | <0.001 |
| TempMin | <0.001 | <0.001 | 0.119 | <0.001 | <0.001 | <0.001 | <0.001 |
| (b) | |||||||
| Group ID | Group Name | Feature ID List 1 | ||||||
|---|---|---|---|---|---|---|---|---|
| G1 | Precip | 0:4_Precip | 1:6_Precip | 2:7_Precip | 3:8_Precip | 4:9_Precip | 5:10_Precip | |
| G2 | TempAve | 6:4_TempAve | 7:5_TempAve | 8:6_TempAve | 9:7_TempAve | 10:8_TempAve | 11:9_TempAve | 12:10_TempAve |
| G3 | TempMax | 13:5_TempMax | 14:7_TempMax | 15:8_TempMax | 16:10_TempMax | |||
| G4 | TempMin | 17:4_TempMin | 18:5_TempMin | 19:7_TempMin | 20:8_TempMin | 21:9_TempMin | 22:10_TempMin | |
| G5 | DistoRoad | 23:DistoRoad | ||||||
| G6 | Elevation | 24:Elevation | ||||||
| G7 | Slope | 25:Slope | ||||||
| Dataset | Label | Train | Val | Test | Total |
|---|---|---|---|---|---|
| 2016 | Presence | 122,354 | 34,911 | 17,362 | 174,627 |
| Absence | 122,354 | 34,911 | 17,362 | 174,627 | |
| 2017 | Presence | 175,315 | 50,124 | 25,055 | 250,494 |
| Absence | 175,315 | 50,124 | 25,055 | 250,494 | |
| 2018 | Presence | 138,217 | 39,208 | 19,725 | 197,150 |
| Absence | 138,217 | 39,208 | 19,725 | 197,150 | |
| 2019 | Presence | 86,057 | 24,884 | 12,422 | 123,363 |
| Absence | 86,057 | 24,884 | 12,422 | 123,363 | |
| (Augmented) Dataset | Presence | 6 × 521,943 | 149,127 | 74,564 | 3,355,349 |
| Absence | 6 × 521,943 | 149,127 | 74,564 | 3,355,349 |
| Model | Dataset Type | Precision | Recall | F1-Score | Acc. 3 | #FLOPs | #Params. |
|---|---|---|---|---|---|---|---|
| LR 1 | Point-wise | 87.72 | 87.65 | 87.69 | 87.69 | 0.056 K | 0.027 K |
| CNN | Patch-wise | 97.41 | 97.41 | 97.41 | 97.41 | 56.057 K | 6.571 k |
| CNN (+Aug. 2) | Patch-wise | 98.45 | 98.45 | 98.45 | 98.45 | 56.057 K | 6.571 k |
| Model | Dataset Type | Precision | Recall | F1-Score | Acc. 1 |
|---|---|---|---|---|---|
| Logistic Regression | Point-wise | 23.20 | 21.66 | 22.41 | 24.98 |
| CNN | Patch-wise | 90.74 | 89.90 | 89.85 | 89.90 |
| Model | Dataset Type | Precision | Recall | F1-Score | Acc. 1 |
|---|---|---|---|---|---|
| Logistic Regression | Point-wise | 87.72 | 87.65 | 87.69 | 87.69 |
| CNN | Patch-wise | 97.31 | 97.31 | 97.31 | 97.31 |
Disclaimer/Publisher’s Note: The statements, opinions and data contained in all publications are solely those of the individual author(s) and contributor(s) and not of MDPI and/or the editor(s). MDPI and/or the editor(s) disclaim responsibility for any injury to people or property resulting from any ideas, methods, instructions or products referred to in the content. |
© 2025 by the authors. Licensee MDPI, Basel, Switzerland. This article is an open access article distributed under the terms and conditions of the Creative Commons Attribution (CC BY) license (https://creativecommons.org/licenses/by/4.0/).
Share and Cite
Wu, W.; Lee, J. Patch-Wise Prediction and Interpretable Analysis of Pine Wilt Disease Occurrence. Forests 2025, 16, 935. https://doi.org/10.3390/f16060935
Wu W, Lee J. Patch-Wise Prediction and Interpretable Analysis of Pine Wilt Disease Occurrence. Forests. 2025; 16(6):935. https://doi.org/10.3390/f16060935
Chicago/Turabian StyleWu, Wenqin, and Joonwhoan Lee. 2025. "Patch-Wise Prediction and Interpretable Analysis of Pine Wilt Disease Occurrence" Forests 16, no. 6: 935. https://doi.org/10.3390/f16060935
APA StyleWu, W., & Lee, J. (2025). Patch-Wise Prediction and Interpretable Analysis of Pine Wilt Disease Occurrence. Forests, 16(6), 935. https://doi.org/10.3390/f16060935