Article

Physiological Responses to Trail Difficulty in Indoor and Outdoor Forest Walking Environments

by
Sugwang Lee
1,*,
Sungmin Ryu
1,
Yeji Choi
1,
Somi Yun
2 and
Dae Taek Lee
2
1
Forest Human Service Division, National Institute of Forest Science, Seoul 02455, Republic of Korea
2
Department of Sports, Health and Rehabilitation, Kookmin University, Seoul 02707, Republic of Korea
*
Author to whom correspondence should be addressed.
Forests 2025, 16(6), 934; https://doi.org/10.3390/f16060934
Submission received: 15 January 2025 / Revised: 2 May 2025 / Accepted: 28 May 2025 / Published: 2 June 2025
(This article belongs to the Special Issue Forest, Trees, Human Health and Wellbeing: 2nd Edition)

Abstract

:
Accurate information on trail difficulty is essential for ensuring safety and enhancing the effectiveness of forest-based health and recreational activities. This study examined the physiological responses of middle-aged adults to varying trail difficulty levels across both controlled indoor and natural outdoor walking environments. A total of ten healthy individuals aged 40–50 years participated in walking tasks across three designated trail difficulty levels: Moderate, Difficult, and Very Difficult. Physiological indicators assessed included step speed (SS), step count (SC), rate of perceived exertion (RPE), heart rate (HR), oxygen saturation (OS), energy expenditure (EE), metabolic equivalents (MET), and oxygen consumption (VO2). As trail difficulty increased, HR, RPE, VO2, EE, and MET consistently showed upward trends, whereas SS and SC demonstrated significant decreases. Additionally, the outdoor setting imposed generally greater physiological demands compared to the indoor condition, suggesting that terrain complexity and elevation changes amplify physical exertion during real-world trail use. The findings contribute valuable empirical evidence for the design of individualized exercise programs, improved trail difficulty classifications, and the advancement of forest-based health promotion policies.

Graphical Abstract

1. Introduction

Forest trails have emerged as critical natural infrastructures supporting both physical and psychological health [1,2,3]. As rapid urbanization continues to reshape human living environments, maintaining physical and mental well-being increasingly depends on ensuring consistent access to natural spaces [4,5,6,7,8]. In response to this shift, national-level forest trail initiatives have been established in several countries to support health promotion and ecological engagement [9].
National trail systems have been successfully developed in countries such as the United States and have also been established and expanded in the United Kingdom and Israel [10,11]. These trail systems provide significant benefits, including the promotion of public health, community connectivity, cultural education, ecological conservation, and local economic development [12].
In South Korea, the Korea Forest Service has instituted a nationally coordinated trail framework that highlights routes of notable ecological, historical, and cultural relevance [13]. To improve trail usability and user satisfaction, a classification mechanism was introduced that categorizes trail difficulty through measurable physical criteria [14,15]. This system is designed to help users select trail routes suited to their physical condition and preferences by providing clearly defined difficulty indicators.
However, research on the standardization and scalability of trail difficulty remains limited and fragmented [16,17,18,19,20]. Although trails are generally cost-effective and make self-directed physical activities accessible to a wide range of users, those constructed in natural forest environments may present inherent risks of injury [8,21]. Inadequate information about trail difficulty can compromise user safety and increase the likelihood of accidents [20].
Although forest-based walking and hiking have been widely reported to enhance cardiovascular performance, metabolic efficiency, and psychological health [22,23,24], there remains a lack of empirical studies that specifically analyze how physiological responses differ across distinct trail difficulty categories defined by national classification standards. Existing studies indicate that outdoor trail hiking or running may induce different physiological responses compared to indoor walking or treadmill activities due to variable terrain, elevation, and environmental exposure.
In 2022, a preliminary investigation was conducted to examine this issue by measuring physiological responses such as heart rate (HR), oxygen saturation (OS), and energy expenditure (EE) in relation to trail difficulty [25]. Such data are particularly valuable in public health contexts, as providing reliable indicators of physical intensity in outdoor spaces is essential for ensuring user safety and promoting responsible engagement with natural environments [26].
This study provides valuable insights into the relationship between trail difficulty and physiological responses. However, it had limitations in terms of sample size and the range of difficulty levels examined. The continuous sequence of varying trail difficulty levels may have introduced accumulated fatigue, which should be considered as a potential factor influencing the results.
Recent studies have confirmed that trail difficulty affects physiological variables such as HR, EE, RPE, and gait, validating these metrics for measuring exercise intensity in forest settings [25,27]. Indoor settings offer control, but outdoor hiking imposes greater energy demands due to terrain and gear, which influence physiological responses in ways that are hard to replicate indoors [28,29]. Combining both environments enhances realism and reliability in evaluating trail-based exercise.
Building on these findings and addressing the limitations of the 2022 study, a more comprehensive investigation was conducted in 2023. This follow-up study aimed to provide a more detailed analysis of exercise physiological characteristics according to the national forest trail usage level. This study sought to expand the understanding of how different trail difficulties impact physiological responses, with the ultimate goal of developing evidence-based guidelines for trail users. The present study incorporates the results from the 2023 investigation to provide a comprehensive analysis of the physiological responses to walking and hiking on national forest trails with varying difficulties. By integrating these datasets, we aim to provide a robust foundation for developing tailored exercise recommendations and improving the overall management of the national forest trail system.
Previous research has shown that physiological responses such as heart rate (HR), oxygen saturation (OS), gait characteristics, energy expenditure (EE), and oxygen consumption (VO2) differ significantly according to forest trail difficulty levels, validating these metrics as appropriate indicators of exercise intensity in natural environments [25,28,30,31,32]. These findings underscore the need to provide users with accurate trail difficulty information to support safe and effective trail usage. Accordingly, several countries have adopted classification systems to quantify trail demands—some based on topographic energy equivalents [33] and others on single-track scales evaluating terrain features, slope, and obstacles [34]. In South Korea, the 2005 Forest Culture and Recreation Act and its subsequent amendments laid the legal foundation for developing a national forest trail system. By 2020, a comprehensive designation and management framework had been officially enacted to promote trail safety, user satisfaction, and environmental protection [35].
Therefore, this study was designed to test the hypothesis that forest trail difficulty levels are significantly associated with variations in physiological responses, including HR, EE, RPE, gait characteristics, and OS. Furthermore, it is hypothesized that indoor and outdoor environments may elicit distinct physiological responses due to differences in terrain complexity, environmental exposure, and gear requirements. By examining these hypotheses, this study aims to provide empirical evidence that supports the development of tailored exercise guidelines and improved management strategies for national forest trails.

2. Materials and Methods

2.1. Participants

The experiment took place from April to July 2023 with the participation of ten healthy adults aged between 40 and 50. Each individual completed both components of the study, which included outdoor walking on designated forest trail segments and indoor treadmill sessions. To minimize potential bias, participants were selected from individuals who regularly engaged in hiking activities (1–2 times per month). The number of participants (n = 10) was determined by considering the available research funding, experimental period, and the conditions required for conducting both indoor and outdoor trials. Although the sample size is relatively small, previous studies in exercise physiology have successfully conducted analyses with similar numbers of participants [36,37]. Therefore, the sample size was considered appropriate for the scope and objectives of this study.
This research was carried out by the National Institute of Forest Science, a government-affiliated body in South Korea, and was not subject to Institutional Review Board (IRB) approval in accordance with Article 2(2) of the Enforcement Rule of the Bioethics and Safety Act. The regulation specifies that research performed or commissioned by national or local authorities for the evaluation of public welfare or service programs is excluded from the definition of human subject research [38]. Before the study commenced, all participants were thoroughly briefed—both verbally and in writing—on the study’s aims, procedures, and protocols, and subsequently provided written informed consent (Appendix A) (Table 1).

2.2. Research Design

This study consisted of on-site forest trail and indoor treadmill walking experiments. All participants participated in both experiments. The experiments for each section were conducted separately rather than consecutively to ensure that the results of the previous section did not influence those of the subsequent sections in either the indoor or outdoor experiments. To prevent potential carryover effects between the outdoor and indoor experimental conditions, a minimum one-month washout period was maintained between the two experiments. The outdoor experiment was conducted during a period of mild and stable weather conditions.

2.2.1. Outdoor (Forest Trail Walking) Experiment

Prior to initiating the outdoor hiking experiment, researchers provided a comprehensive explanation of the study’s objectives and obtained completed PAR-Q forms along with signed consent from all participants (Appendix B). Resting heart rate (HR) was monitored using a Polar H10 device (Polar Electro, Kempele, Finland), positioned near the xiphoid process, with real-time data transmitted to an M400 watch and subsequently uploaded to the Polar Team Pro system for analysis. Resting oxygen saturation (OS) was assessed via a UM-P200 pulse oximeter (Union Medical, Uijeongbu-si, Republic of Korea) placed on the participant’s right index finger. To record gait-related metrics, a Stryd footpod (Stryd Inc., Boulder, CO, USA) was secured to the right shoe, and the participant’s anthropometric data, including height and weight, were input in advance into the corresponding mobile application [39]. Lastly, participants were instructed on how to download, install, and log into GPS tracking apps such as “San-gil-saem (Naduri)” or “Rambler”, and their fully equipped body weight was recorded [40,41].
Before beginning the hike, participants were instructed to complete a warm-up session that included dynamic stretching to loosen major muscles and joints. As part of the warm-up, they walked 0.1 km slowly to the starting point of the experimental section. All participants were clearly instructed to walk the 0.5 km measurement section at their natural, self-selected hiking pace without trying to move faster or slower than usual.
Following the completion of all preparatory procedures, participants began hiking on the assigned trail sections while using a single trekking pole to enhance safety. Prior to departure, ambient temperature and humidity levels were recorded, and devices including the heart rate monitor, gait tracking sensor, and GPS application were activated. During the hike, participants self-reported their perceived exertion (RPE) at 10 min intervals. To maintain natural physiological responses, the researchers accompanied participants at a consistent pace. Oxygen saturation (OS) and RPE values were measured immediately prior to the conclusion of each trail section. Participants were then provided with adequate rest until their physiological states stabilized, and the start and finish times for each segment were documented (Figure 1 and Table 2).

2.2.2. Indoor (Treadmill Walking) Experiment
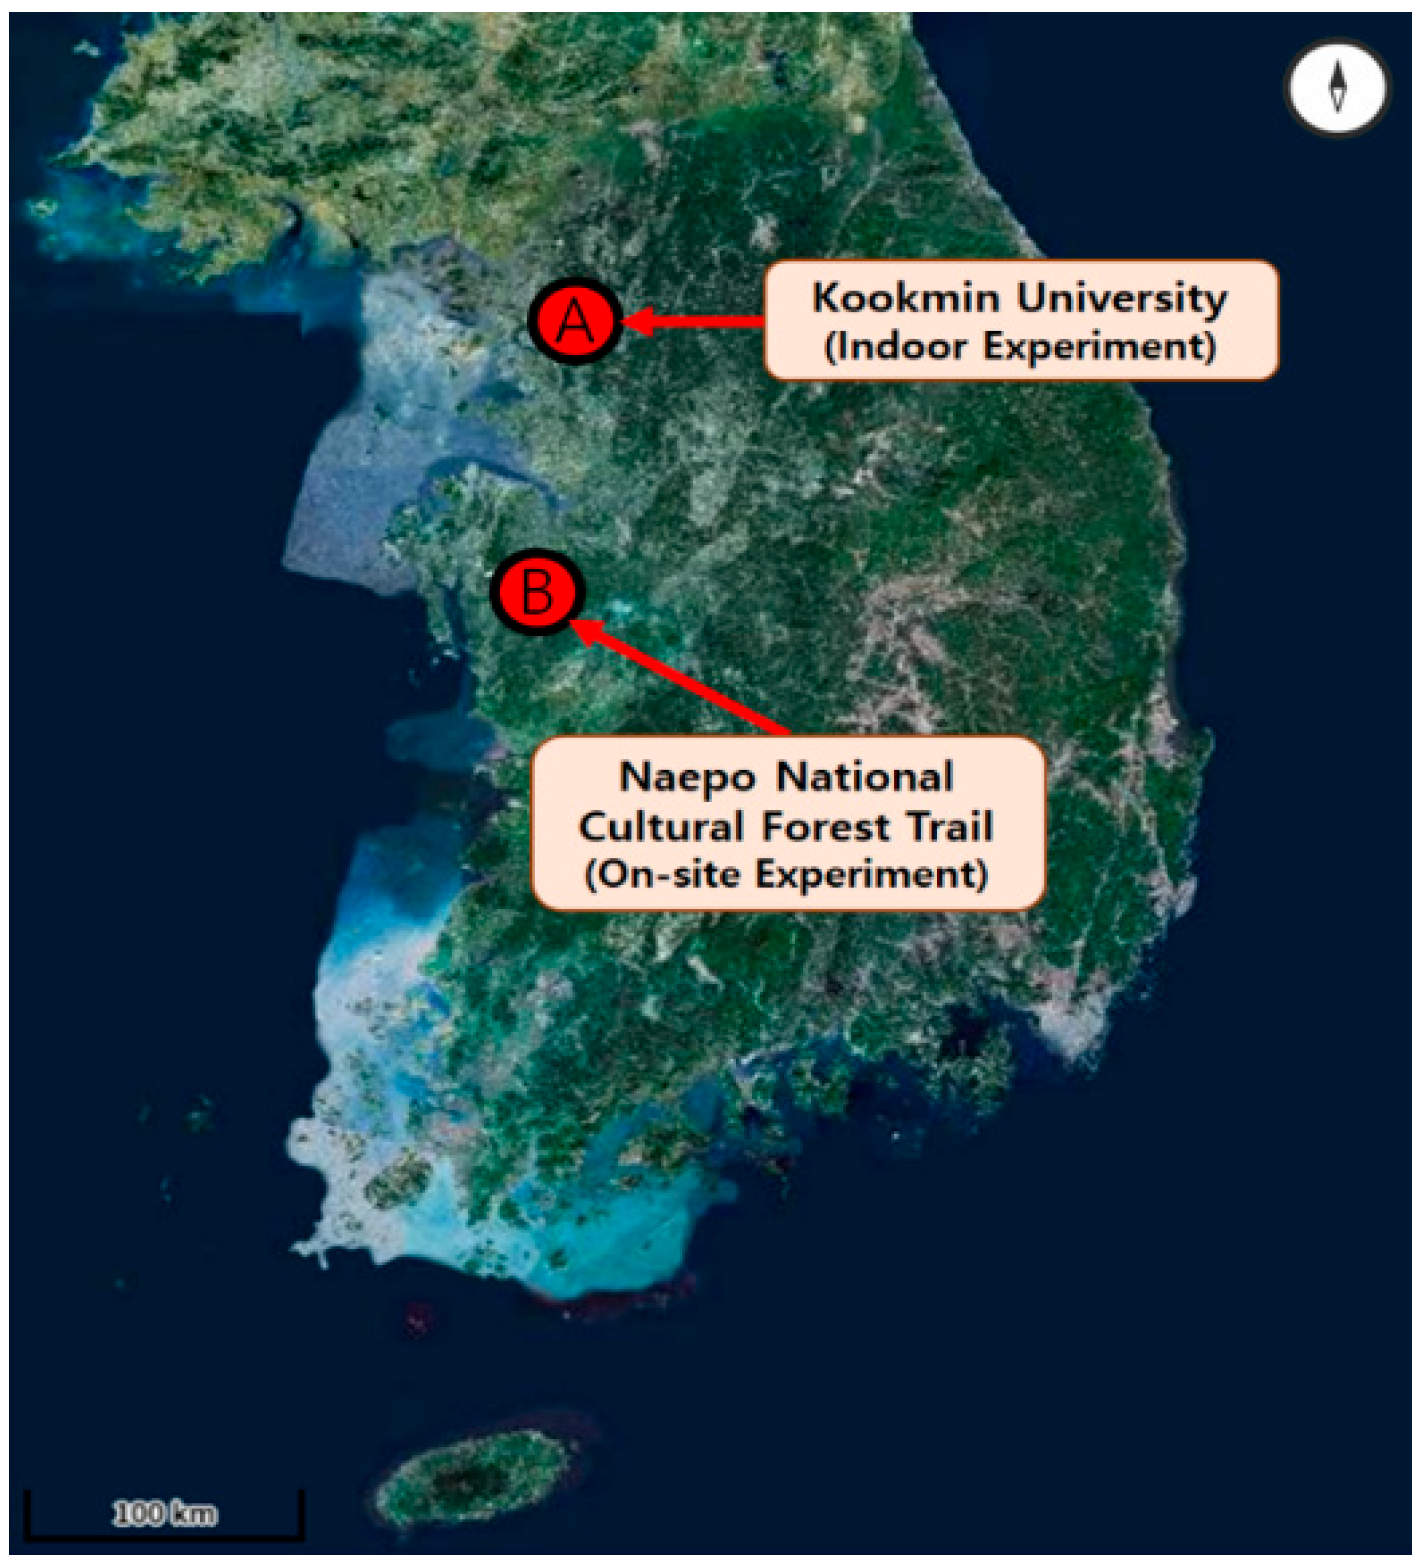
Prior to beginning the indoor treadmill walking experiment, researchers provided participants with an explanation of the study’s purpose and collected completed physical activity readiness questionnaires (PAR-Q) and signed consent forms (Appendix B). Anthropometric measurements including height, weight, and leg length were recorded, along with baseline readings of blood pressure and oxygen consumption (OC) (Figure 2). Resting heart rate (HR) was monitored using a device positioned near the xiphoid process, while oxygen saturation (OS) was assessed via a fingertip sensor on the right hand. To capture gait data, a motion sensor was securely attached to the right shoe of each participant, and the corresponding application was preloaded with height and weight data [39]. Participants were also weighed using a suspension harness connected to a portable metabolic analyzer (K5, COSMED Srl., Rome, Italy), which was used to measure VO2, EE, and MET. These metabolic variables were measured only during the indoor experiment due to equipment weight and reduced reliability in outdoor conditions [42,43]. To minimize distraction during the treadmill test, an RPE chart was placed visibly in front of the treadmill, allowing participants to report exertion levels without interrupting walking. All measurements were conducted continuously without requiring participants to stop or alter their walking speed. The experiment followed standardized protocols similar to those used in graded exercise testing, ensuring valid physiological assessment.
The speed for each difficulty level was set based on the individual hiking speeds from the onsite experiment. Specifically, the speed for Grade Moderate difficulty was set at 3.8 km/h for males and 3.4 km/h for females. This setup ensured consistency between the field and indoor experiments, while accommodating individual and group-based adjustments.
Upon completion of all preparatory steps, participants began the treadmill walking session while holding a single trekking pole for stability and safety. In order to replicate outdoor conditions and reduce environmental variability, the indoor room temperature and humidity were matched precisely to those measured during the forest trail experiment. The full procedure for the indoor trial is summarized in Table 2.

2.3. Sites

The outdoor walking experiment was carried out along the Naepo National Cultural Forest Trail, situated in Chungcheongnam Province, South Korea (Figure 3). This trail spans the cities and counties of Seosan, Hongseong, Yesan, and Dangjin, covering a total distance of about 320 km and comprising 24 individual courses. The Naepo National Cultural Forest Trail is renowned for its integration of ecological, historical, and cultural resources, including the Sudeoksa Temple, Gaya Mountain, and the traditional Korean Confucian Academy, Naepo Seowon. It was designated as a national forest trail in recognition of its historical and ecological value on 1 November 2021.
The reason for selecting Naepo National Cultural Forest Trail as the research site is that the indoor experiment was conducted in Seoul, and the participants were from the metropolitan area, making it the nearest national forest trail to the capital region. The trail difficulty levels were selected based on a previous study [25], which showed no significant differences between the moderate and difficult level. Therefore, a very difficult level was added.
Among the Naepo National Cultural Forest Trail routes, a course containing a “Very Difficult” section was first selected. Subsequently, each difficulty level section was independently chosen (non-continuous), ensuring that all sites could be reached within 30 min by car. Prior to the experiment, all selected sections were pre-surveyed to confirm that the gradient within each trail segment remained consistent according to the designated difficulty level.
This study focused on 1.5 km specific sections (500 m each) of the Naepo Cultural Forest Trail, including segments with varying difficulty levels: Moderate (Okbyeonggye), Difficult (Suribawi), and Very Difficult (Wonhyosa). These sections were selected for their representative gradients and hiking challenges to ensure that the study covered a range of physical demands (Figure 4). The selected trail sections featured diverse terrains, such as steep slope, rocky paths, and forested environments, offering a comprehensive evaluation of the physiological responses of the hikers.
The controlled indoor treadmill experiment was carried out at the Exercise Physiology Laboratory of Kookmin University (Seoul, Republic of Korea), where the ambient temperature and humidity were consistently maintained at 18.6 ± 0.2 °C and 65.7 ± 1.3%, respectively, during the study period. To replicate the conditions of the onsite hiking experiment, walking sections were designed to reflect the average speeds recorded during the field experiment (Table 3).

2.4. Research Variables

A total of 34 indicators were collected and systematically classified based on their respective data collection properties and functional roles (Appendix C).

2.5. Analysis Methods

All statistical analyses were performed using R version 4.4.3 and RStudio version 2024.12.2 + 563. To analyze the physiological responses to varying trail difficulty levels in both the indoor and outdoor environments, a comprehensive statistical analysis was conducted, focusing on SS, SC, RPE, HR, OS, VO2, EE, and MET. These metrics were analyzed across three difficulty levels (Moderate, Difficult, and Very Difficult).
Descriptive statistics (mean ± standard deviation) were computed for all physiological metrics by each difficulty level and sex to provide an overview of the data distribution. Additionally, data visualization was performed using boxplots, which enabled the identification of patterns and initial trends in response to increasing trail difficulty.
To assess how trail difficulty influenced physiological responses, separate repeated-measures ANOVAs were performed for the indoor and outdoor conditions. The assumption of sphericity was evaluated using Mauchly’s test, and if violated, adjustments were made using the Greenhouse–Geisser method. Post-hoc comparisons were conducted using Bonferroni-adjusted pairwise contrasts based on estimated marginal means.
To quantify the magnitude of physiological changes across difficulty levels, the difficulty was treated as a numeric predictor (e.g., 1, 2, 3), and linear regression models were fitted separately for the outdoor and indoor experiments. The results were visualized to provide trends in physiological responses relative to difficulty level.
All participants completed both the outdoor and indoor experiments. Paired t-tests were conducted to assess significant differences between the two environmental conditions.

3. Results

3.1. Outdoor Experiment

3.1.1. Descriptive Statistics
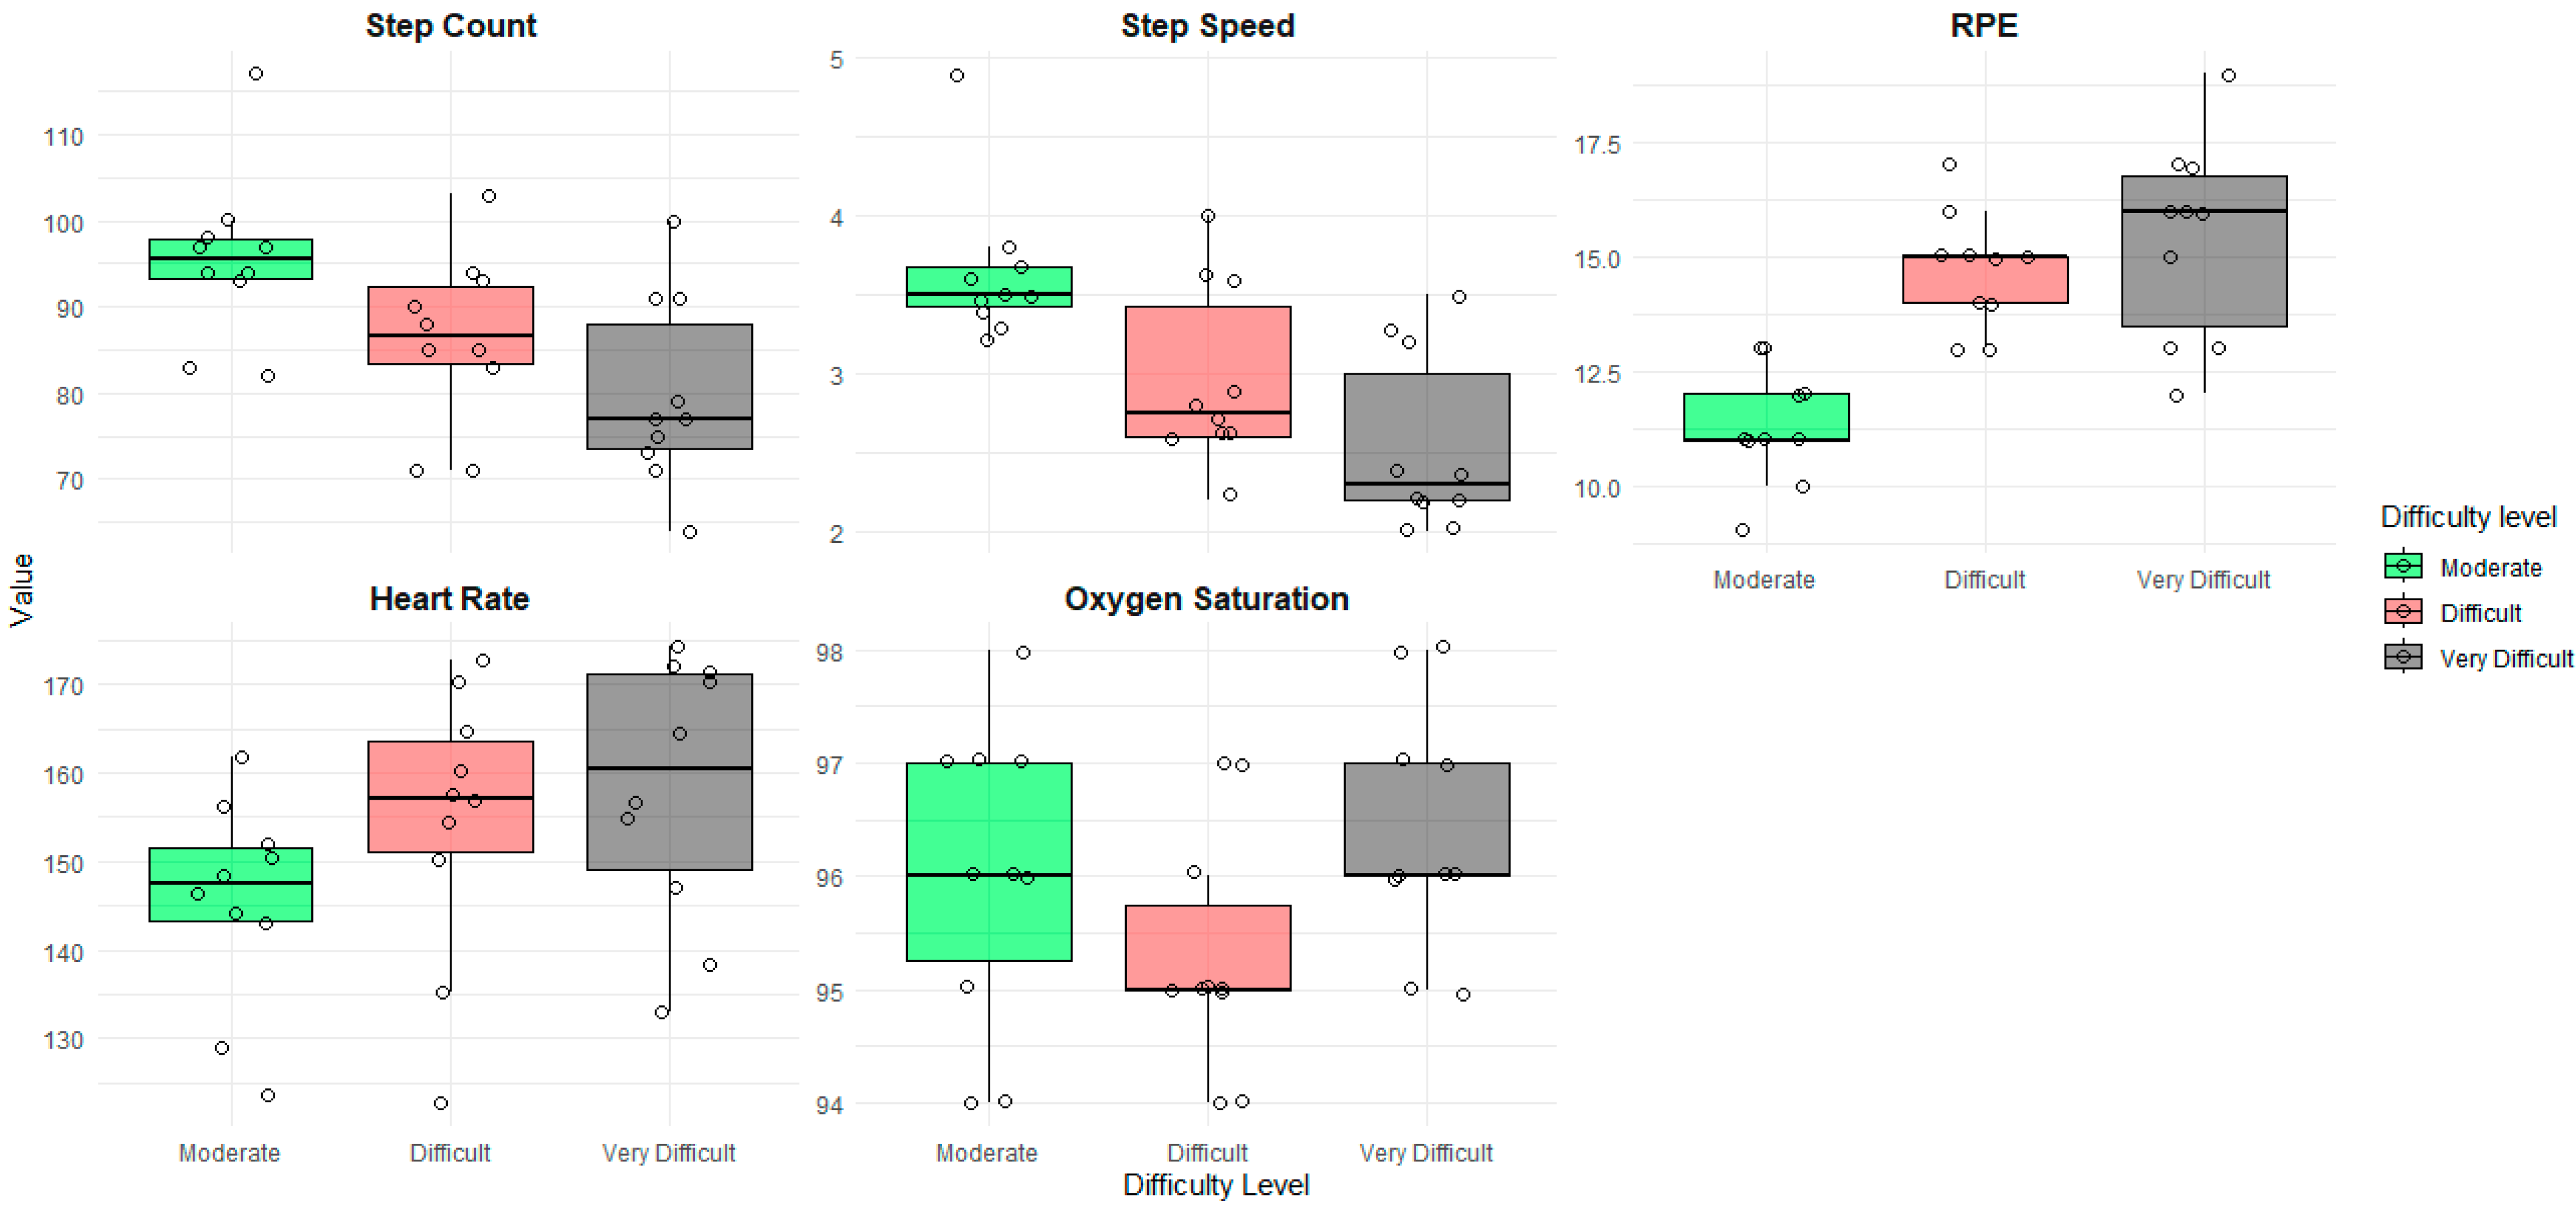
In the outdoor experiment, physiological metrics were recorded for “Moderate”, “Difficult”, and “Very Difficult” trails. Descriptive statistics (mean and standard deviation) were presented by difficulty level for the 10 participants. This study was not designed to evaluate sex or gender differences, so testing for these differences was not performed. However, to align with Sex and Gender Equity in Research (SAGER) guidelines and to support future meta-analyses, the disaggregated data are presented in Table 4 [44].

3.1.2. Boxplot

In the outdoor experiment, both SC and SS demonstrated a gradual decline as trail difficulty increased. RPE exhibited a clear upward trend with increasing difficulty, accompanied by an expansion in variability, suggesting that subjective perceptions of exertion were sensitive to changes in trail conditions. HR also increased progressively with trail difficulty, indicating a consistent physiological response to elevated physical demands in the outdoor environment. OS showed a slight decrease at the Difficult level; however, the overall variation across conditions was minimal relative to other physiological indicators. Collectively, these findings suggest that higher trail difficulty levels were associated with greater physiological strain and reduced locomotor efficiency, as reflected by slower walking speeds and lower steps (Figure 5).

3.1.3. Repeated-Measures ANOVA and Post-Hoc

RM ANOVA conducted under outdoor conditions revealed significant effects of trail difficulty on three out of five physiological variables (Table 5). SC, OS, and RPE all demonstrated statistically significant main effects (p < 0.001). Their generalized eta-squared (GES) values were 0.577, 0.308, and 0.438, respectively, indicating moderate to large effect sizes. HR showed a marginally significant trend (p = 0.051), suggesting a potential effect of difficulty level that did not reach the conventional threshold of significance. In contrast, SS did not show a statistically significant difference across difficulty levels (p = 0.118).
With Bonferroni-adjusted post-hoc comparisons, SC showed significant differences between the Moderate vs. Difficult (p < 0.001) and the Moderate vs. Very Difficult (p < 0.001), but no significant difference was found between the Difficult vs. Very Difficult (p = 0.459). This suggests that as trail difficulty increases, step count decreases up to a certain level, beyond which no further meaningful reduction occurs. RPE increased significantly across all three levels (p < 0.001). Although SC showed the largest effect size (GES = 0.577), the statistical significance was not consistent across all comparisons. In contrast, RPE demonstrated significant differences between all difficulty levels, indicating that it was the most consistently and sensitively responsive indicator to trail difficulty. Lastly, OS also showed significant differences across all comparisons—Moderate vs. Difficult (p = 0.008), Moderate vs. Very Difficult (p < 0.001), and Difficult vs. Very Difficult (p = 0.008)—demonstrating a gradual decrease in OS as trail difficulty increased.

3.1.4. Linear Regression

To further examine the relationship between trail difficulty and physiological responses, simple linear regression analyses were conducted using trail difficulty scores as predictors. The results showed significant negative associations between trail difficulty and SC (β = −7.85, p = 0.0016) and SS (β = −0.55, p < 0.001), indicating that both metrics decreased as trail difficulty increased.
For RPE, trail difficulty was positively and strongly associated (β = 2.05, p < 0.001), confirming that subjective exertion increased proportionally with trail difficulty. HR showed a marginally significant increase (β = 6.39, p = 0.0485), while OS did not exhibit a significant relationship (β = 0.20, p = 0.471), suggesting that the observed reductions in OS may not follow a strictly linear pattern.
Although several of these relationships reached statistical significance, the overall explanatory power of the models was relatively low (R2 < 0.5). This indicates that while trail difficulty does influence physiological responses, a substantial portion of the variance is likely attributable to individual differences or other external factors not captured in the current model (Figure 6).

3.2. Indoor Experiment

3.2.1. Descriptive Statistics

In the indoor experiment, physiological metrics were measured across the four trail usage grades, and the results were stratified by sex. The key metrics assessed included the EE, MET, VO2, SC, SS, RPE, HR, and OS (Table 6). This study was not designed to evaluate sex or gender differences, so testing for these differences was not performed. However, to align with SAGER guidelines and to support future meta-analyses, the disaggregated data are presented.

3.2.2. Boxplot

In the indoor experiment, most physiological variables showed clear trends across the three trail difficulty levels. As the difficulty increased, EE, MET, and VO2 exhibited a progressive rise, indicating that higher trail grades are associated with greater metabolic demand. Conversely, SC and SS consistently decreased, suggesting that participants reduced their stride frequency and pace in response to increasing physical challenges.
Among all measured variables, RPE demonstrated the most consistent and noticeable increase across difficulty levels, indicating a strong subjective awareness of physical strain as trail difficulty intensified. Heart rate (HR) tended to rise as trail difficulty increased, reaching its peak in the Very Difficult condition; however, notable variation was observed among individuals. In contrast, OS remained relatively stable across all conditions, generally fluctuating between 95% and 97%, and did not exhibit significant changes based on trail difficulty.
These findings collectively suggest that increasing trail difficulty levels lead to both objective (EE, MET, VO2) and subjective (RPE) elevations in physiological stress, while also influencing walking strategies as evidenced by reductions in SC and SS (Figure 7).

3.2.3. Repeated-Measures ANOVA and Post-Hoc

The results of the RM ANOVA indicated a statistically significant main effect of difficulty level on all physiological variables (Table 7). Overall, the effect sizes ranged from moderate to large, suggesting that trail difficulty is closely associated with physiological responses.
Bonferroni-adjusted post-hoc comparisons revealed that most physiological variables exhibited clear trends according to difficulty level. The metabolic indicators (VO2, EE, and MET) consistently increased as difficulty level rose. RPE showed a significant increase between Moderate and Very Difficult (p = 0.0012), indicating that perceived exertion rises notably at higher difficulty levels. Gait-related indicators (SC and SS) demonstrated decreasing trends, though statistical differences among higher difficulty levels were more limited. OS did not show significant differences among Moderate, Difficult, and Very Difficult conditions (p > 0.05).
When analyzed by difficulty levels, the Moderate condition showed increased responses compared to higher difficulty levels but exhibited limited significant differences. Specifically, no significant differences were found between Moderate and Difficult/Very Difficult in SC, SS, RPE, HR, or OS (p > 0.05). However, significant differences were found between Moderate and Very Difficult for VO2 (p = 0.0307) and EE (p = 0.0007), and MET was significantly lower than both Difficult and Very Difficult (p = 0.0008 and p < 0.0001, respectively). These results suggest that Moderate may represent a physiological transition point where the body begins to respond more sharply to increasing difficulty.
In the Difficult condition, no significant differences were observed compared to Moderate across most variables (p > 0.05), nor were there significant differences from Very Difficult in SC, SS, RPE, HR, or OS. However, significant differences were detected in VO2 (p = 0.0044), EE (p = 0.0420), and MET (p = 0.0003) when compared with Very Difficult, suggesting that while metabolic responses continue to increase at higher difficulty levels, subjective and some physiological indicators may plateau.
Finally, the Very Difficult condition demonstrated significantly higher values in VO2, EE, and MET compared to the Moderate and Difficult conditions, confirming it as the level with the greatest physiological load. Between the Difficult and Very Difficult conditions, none of the measured indicators—SC, SS, RPE, HR, or OS—exhibited statistically significant differences (p > 0.05).

3.2.4. Linear Regression

To further explore the effects of trail difficulty on physiological responses, simple linear regression analyses were conducted using difficulty level as a predictor. The results indicated that gait-related indicators were significantly associated with trail difficulty. Specifically, SC decreased significantly as difficulty increased (β = −6.92, p = 0.012), and SS also showed a strong negative association (β = −0.550, p < 0.001).
Among metabolic indicators, VO2 (β = 0.405, p = 0.719), EE (β = 10.1, p = 0.703), and MET (β = 0.115, p = 0.720) did not show statistically significant associations with difficulty level. This contrasts with previous findings when Easy conditions were included, and suggests that in moderate to very difficult ranges, metabolic increases may plateau or vary depending on individual adaptation.
RPE showed a positive but non-significant association with difficulty (β = 0.6, p = 0.109), and HR also increased slightly without statistical significance (β = 4.44, p = 0.178), indicating possible individual variability in perceived and cardiovascular responses at higher difficulty levels. OS did not show a significant relationship with trail difficulty (β = 0.050, p = 0.742), remaining relatively stable across conditions.
Overall, gait-related variables (SC, SS) are the most sensitive and consistent indicators of increasing trail difficulty, while metabolic and exertional responses may exhibit more nuanced or plateaued patterns in higher difficulty ranges. However, the relatively low R2 values across most models suggest that while trail difficulty may influence physiological responses, other factors such as individual variability and environmental conditions likely also play a significant role. This outcome may be attributable to the direct application of outdoor step speeds in the indoor experimental setting (Figure 8).

3.3. Comparison Between Outdoor and Indoor Experiment

To assess the differences in physiological responses across environments, paired t-tests were performed separately for each trail difficulty level, comparing indoor and outdoor conditions.
For the Moderate level, SC was significantly higher in the indoor condition compared to the outdoor condition (p = 0.0020), while RPE were significantly lower indoors (p = 0.0004). This suggests that participants perceived higher fatigue in the outdoor setting, despite exhibiting a more active gait indoors. No significant differences were found for SS, HR, OS (p > 0.05).
At the Difficult level, SC remained significantly higher in the indoor condition (p = 0.003), while OS was significantly higher in the outdoor setting (p = 0.0067), indicating more favorable oxygen saturation during outdoor walking. No significant differences were found in SS, RPE, or HR.
At the Very Difficult grade, step count (SC) was notably higher in the indoor setting (p = 0.0065), whereas all other measured variables did not display statistically significant differences between the two environments (p > 0.05). These results suggest that at higher difficulty levels, environmental effects on physiological responses may be diminished or more strongly influenced by individual variability (Table 8).

4. Discussion

This study examined how physiological responses vary across trail difficulty levels under outdoor and indoor conditions. Ten participants completed trials over three trail categories—Moderate, Difficult, and Very Difficult—allowing systematic analysis of key physiological metrics (EE, MET, VO2, SC, SS, RPE, HR, OS) relative to trail classification.
In the outdoor condition, greater difficulty levels corresponded with elevated HR and RPE values, indicating increased cardiovascular and perceptual stress. In contrast, locomotor-related measures such as SC and SS showed consistent reductions, pointing to a decrease in gait efficiency. These findings align with earlier research that identified similar patterns of response to terrain-induced workload during trail-based and inclined physical activity [25,45]. Among the evaluated indicators, RPE emerged as particularly responsive, exhibiting an approximate two-unit rise for each step up in trail difficulty (r2 = 0.50), highlighting its potential utility as a core metric for real-time exertion monitoring.
Participants were permitted to regulate their own walking speed during trials, which may partially explain the absence of significant variation in some physiological measures such as HR and OS. These results imply a degree of behavioral adaptation aimed at limiting fatigue under increasing physical demand [46,47].
This interpretation is consistent with prior literature affirming the role of RPE as a reliable index of exercise intensity in outdoor settings [32,47,48], and mirrors results reported in a 2022 study on trail-based exertion [25]. The RPE classifications observed here are also in line with Grummt (2024), who categorized RPE 11 as “light”, 12–14 as “moderate”, and 15–17 as “vigorous” activity [26]. According to this scale, moderate-rated trails in the present study corresponded to light intensity, while difficult and very difficult trails matched the moderate and vigorous bands, respectively. These observations further converge with ACSM standards, which define RPE 12–13 as moderate and 14–17 as vigorous exertion levels [49]. The results support the utility of physiologically based trail difficulty ratings in enabling users to select exercise intensities appropriate to their health goals.
In terms of public health guidance, the American College of Sports Medicine (ACSM) advises individuals to engage in at least 150 min of moderate-intensity exercise or 75 min of vigorous-intensity activity each week. Based on the present data, hiking on difficult or very difficult trails for roughly three hours per week may be adequate to fulfill these recommendations. Personalizing both trail selection and activity duration in accordance with individual characteristics could further enhance health-promoting outcomes.
Parallel trends were observed in the indoor experiment. As the simulated trail difficulty increased, EE, MET, and VO2 likewise rose, while gait-related indicators declined. Notably, several variables plateaued at the highest level, suggesting that physiological strain may stabilize once a certain difficulty threshold is reached [50].
Among all parameters assessed in the indoor context, MET was the most consistent and meaningful marker of intensity. Its standardized format, alignment with guideline-based exercise prescriptions, and ability to capture metabolic demand across difficulty levels reinforce its value as a core physiological indicator. The steady rise in MET with increased difficulty and its sensitivity to potential sex-based plateau effects further strengthen this conclusion.
As an index, MET offers both practical interpretability and scientific credibility for evaluating exercise intensity [51]. According to ACSM definitions, 1.6–2.9 METs represents light intensity, 3.0–5.9 METs corresponds to moderate, and ≥6.0 METs denotes vigorous activity [52]. In this study, the “Easy” indoor trial was classified as moderate intensity (4.11 METs), whereas the “Moderate” (7.61), “Difficult” (7.79), and “Very Difficult” (7.84) trails were all categorized as vigorous. On average, a one-level increase in difficulty was associated with a 1.14 MET rise (r2 = 0.41).
Controlled laboratory settings are frequently used in gait-related physiological studies due to logistical and environmental constraints [28,52,53,54]. Previous research has reported that outdoor environments may lead to faster walking and reduced perceived exertion compared to indoor conditions [52,55].
The current study found similar results, with RPE and MET values consistently higher indoors, especially under moderate difficulty conditions. These elevated values may reflect participants’ heightened awareness of the test setting. Of all gait indicators, only step count showed significant variation across indoor and outdoor environments, while most physiological measures remained statistically comparable. These findings suggest that even in standardized indoor protocols, cognitive demand and situational context can shape perceived intensity.
Several studies have reported that, under identical conditions, indoor exercise results in higher ratings of perceived exertion (RPE) and greater exercise intensity compared to outdoor exercise [56,57,58]. These differences have been attributed to the perception of various environmental factors outdoors, which is thought to distract individuals from internal sensations of fatigue [59].
This research represents one of the few studies to quantitatively assess physiological demands relative to forest trail difficulty. The evidence supports the role of trail difficulty classification in informing exercise prescriptions, individual fitness planning, and public trail design. RPE, SC, and SS consistently responded across both settings, indicating the feasibility of using these simple indicators to monitor exercise intensity in practical environments.
Nonetheless, several limitations must be noted. The small sample size (n = 10) restricts generalizability. Additionally, applying outdoor walking speeds in the indoor protocol may have constrained participants’ natural adjustment strategies. Finally, the influence of environmental variables such as temperature, light exposure, and trail surface was not fully controlled, which could have impacted the physiological outcomes.
Future studies should include broader and more diverse cohorts to validate these findings across populations. Incorporating factors such as seasonal changes, elevation gain, and surface complexity would enhance ecological validity. Further, employing wearable physiological monitoring systems and personalized feedback technologies may offer novel avenues for extending this research.

5. Conclusions

To verify the effectiveness of the national forest trail grading system, this research conducted both indoor and outdoor experiments to quantitatively assess how users’ physiological responses vary according to different trail difficulty levels.
To address the limitations of previous studies, non-continuous trail segments were selected, and the “Very Difficult” level was added to supplement previous experiments that showed no statistically significant differences between “Moderate” and “Difficult” grades. This study has certain limitations, including the inherent challenges of controlling experimental conditions in outdoor environments, a limited number of participants, and difficulties in regulating climatic factors; thus, these factors should be considered when interpreting the results.
The results revealed that increasing trail difficulty significantly influenced RPE, SC, and OS across both environments. RPE was identified as the most sensitive indicator in outdoor experiments, while MET showed the highest sensitivity in the indoor experiments. These findings suggest that as trail difficulty rises, physiological load increases, and participants adapt by modifying gait patterns such as reducing pace and step count to mitigate fatigue. The outdoor experiments results, in particular, demonstrated a close alignment between physiologically measured responses and the physical indicators used to define trail grades, reinforcing the reliability and practical relevance of the trail classification system.
Due to the limited existing research on the systematic classification and measurement of forest trail difficulty, this study holds particular value as a pioneering case that integrates both objective physical characteristics and physiological responses. It is expected that the findings could be applicable to forest trail systems in other countries as well. In particular, the results have the potential to contribute to the formulation of forest policies aimed at promoting public health.
Consequently, this study offers valuable foundational data for developing personalized exercise guidelines tailored to individual fitness levels and for informing policy related to forest-based health and wellness programs. Moreover, it provides empirical support for establishing a scientifically grounded national forest trail management system.
Future research should aim for a more comprehensive understanding of trail usage by considering factors such as seasonal variations, differences in responses by age, gender, and fitness level, as well as psychological responses including stress and emotional states. Furthermore, long-term follow-up studies will be needed to elucidate the cumulative effects of trail usage on physiological indicators.

Author Contributions

Conceptualization, S.L.; methodology, D.T.L.; software, S.R.; validation, Y.C. and S.L.; formal analysis, Y.C.; investigation, S.L., S.Y., and D.T.L.; resources, D.T.L.; data curation, Y.C. and S.R.; writing—original draft preparation, Y.C. and S.R.; writing—review and editing, Y.C., S.R., and S.L.; visualization, Y.C. and S.R.; supervision, S.L. and D.T.L.; project administration, S.L.; funding acquisition, S.L. All authors have read and agreed to the published version of the manuscript.

Funding

This research received no external funding.

Data Availability Statement

The original contributions presented in the study are included in the article. Further inquiries can be directed to the corresponding author.

Conflicts of Interest

The authors declare no conflicts of interest.

Abbreviations

The following abbreviations are used in this manuscript:
HRheart rate
OSoxygen saturation
SSstep speed
SCstep count
RPErate of perceived exertion
VO2oxygen consumption
EEenergy expenditure
METmetabolic equivalent

Appendix A

Figure A1 presents the original version of the participant consent form.
Figure A1. Original research participant consent form.
Forests 16 00934 g0a1

Appendix B

Original copies of the Physical Activity Readiness Questionnaire (PAR-Q) are provided below.
These documents were used during the participant screening process to assess health readiness for physical activity and research participation.
Figure A2. First page of the original PAR-Q.
Forests 16 00934 g0a2

Appendix C

Table A1 provides a detailed overview of the variables measured in this study.
Table A1. Outlines the set of variables examined throughout this research.
Physical Characteristic VariablesCardiovascular and Metabolic VariablesPhysical Variables
Gathered reference data--Trail segment length and slope
Participant-declared informationAge; heightRatings of perceived exertion (RPE)-
Empirically observed indicatorsWeight; leg lengthBaseline heart rate; baseline blood pressure; active heart rate (hiking, walking); real-time oxygen saturation; on-exercise blood pressureClimatic conditions; trail duration metrics; stride-related hiking metrics; time-on-foot data; step frequency data; walking slope
Derived values-Baseline VO2; VO2 during exertionLocomotion velocity
Adjusted parametersBody mass indexEstimated max HR; HR differential
baseline pulse pressure; average arterial pressure; dynamic PP during walking; normalized exertion level; MET level during ambulation; caloric output while walking; cardiac cost per stride; VO2 per stride; VO2 per beat
Stride length

References

  1. Tsunetsugu, Y.; Lee, J.; Park, B.J.; Tyrväinen, L.; Kagawa, T.; Miyazaki, Y. Physiological and psychological effects of viewing urban forest landscapes assessed by multiple measurements. Landsc. Urban Plan. 2013, 113, 90–93. [Google Scholar] [CrossRef]
  2. Bamwesigye, D.; Fialová, J.; Kupec, P.; Łukaszkiewicz, J.; Fortuna-Antoszkiewicz, B. Forest Recreational Services in the Face of COVID-19 Pandemic Stress. Land 2021, 10, 1347. [Google Scholar] [CrossRef]
  3. Bamwesigye, D.; Fialova, J.; Kupec, P.; Yeboah, E.; Łukaszkiewicz, J.; Fortuna-Antoszkiewicz, B.; Botwina, J. Urban Forest Recreation and Its Possible Role throughout the COVID-19 Pandemic. Forests 2023, 14, 1254. [Google Scholar] [CrossRef]
  4. Hartig, T.; Mitchell, R.; De Vries, S.; Frumkin, H. Nature and health. Annu. Rev. Public Health 2014, 35, 207–228. [Google Scholar] [CrossRef]
  5. Rogerson, M.; Wood, C.; Pretty, J.; Schoenmakers, P.; Bloomfield, D.; Barton, J. Regular Doses of Nature: The Efficacy of Green Exercise Interventions for Mental Wellbeing. Int. J. Environ. Res. Public Health 2020, 17, 1526. [Google Scholar] [CrossRef]
  6. Tyrväinen, L.; Ojala, A.; Korpela, K.; Lanki, T.; Tsunetsugu, Y.; Kagawa, T. The Influence of Urban Green Environments on Stress Relief Measures: A Field Experiment. J. Environ. Psychol. 2014, 38, 1–9. [Google Scholar] [CrossRef]
  7. Barton, J.; Pretty, J. What is the Best Dose of Nature and Green Exercise for Improving Mental Health? A Multi-Study Analysis. Environ. Sci. Technol. 2010, 44, 3947–3955. [Google Scholar] [CrossRef]
  8. Kortenkamp, K.V.; Moore, C.F.; Sheridan, D.P.; Ahrens, E.S. No Hiking Beyond This Point! Hiking Risk Prevention Recommendations in Peer-Reviewed Literature. J. Outdoor Recreat. Tour. 2017, 20, 67–76. [Google Scholar] [CrossRef]
  9. Stigsdotter, U.K.; Palsdottir, A.M.; Burls, A.; Chermaz, A.; Ferrini, F.; Grahn, P. Nature-based therapeutic interventions. In Forests, Trees and Human Health; Nilsson, K., Sangster, M., Gallis, C., Hartig, T., de Vries, S., Seeland, K., Schipperijn, J., Eds.; Springer: Dordrecht, The Netherlands, 2011; pp. 309–342. [Google Scholar] [CrossRef]
  10. Timothy, D.J.; Boyd, S.W. Tourism and Trails: Cultural, Ecological and Management Issues; Channel View Publications: Bristol, UK, 2015; Volume 64. [Google Scholar]
  11. Downs, T.C. The National Trials System: A Model Partnership Approach to Natural Resources Management. Environ. Law Report. News Anal. 2000, 30, 10091. [Google Scholar]
  12. Ravinsky Raichel, N.; Yahel, H. Planning Challenges and Opportunities in the Conservation of National Trails: The Case of the Israel National Trail. Land 2024, 13, 1449. [Google Scholar] [CrossRef]
  13. Kim, H.; Lee, Y.W.; Choi, K.H.; Choi, J.H.; Shin, H.J.; Lee, S.G. An analysis on the status of forest trails in Korea. J. Korean For. Soc. 2016, 105, 142–150. [Google Scholar]
  14. Korea Forest Service. Second Basic Plan for Forest Trail Development and Management; Korea Forest Service: Daejeon, Republic of Korea, 2022. [Google Scholar]
  15. Lee, S.; Lee, J.; Kim, G. Guide for Calculating Forest Trail Usage Grades (Difficulty); National Institute of Forest Science: Seoul, Republic of Korea, 2022. [Google Scholar]
  16. Yamaki, K.; Shoji, Y. Classification of Trail Settings in an Alpine National Park Using the Recreation Opportunity Spectrum Approach. In Policies, Methods and Tools for Visitor Management—Proceedings of the Second International Workshop, Rovaniemi, Finland, 16–20 June 2004; Finnish Forest Research Institute: Helsinki, Finland, 2004; p. 318. [Google Scholar]
  17. Sievänen, T. (Ed.) Metlan Työraportteja/Working Papers of the Finnish Forest Research Institute; Finnish Forest Research Institute; Volume 2, Helsinki, Finland, 2004. [Google Scholar]
  18. Hugo, M.L. A Comprehensive Approach towards the Planning, Grading and Auditing of Hiking Trails as Ecotourism Products. Curr. Issues Tour. 1999, 2, 138–173. [Google Scholar] [CrossRef]
  19. Saayman, M.; Viljoen, A. Who Are Wild Enough to Hike a Wilderness Trail? J. Outdoor Recreat. Tour. 2016, 14, 41–51. [Google Scholar] [CrossRef]
  20. Calbimonte, J.P.; Martin, S.; Calvaresi, D.; Cotting, A. A Platform for Difficulty Assessment and Recommendation of Hiking Trails. In Information and Communication Technologies in Tourism 2021, Proceedings of the ENTER 2021 eTourism Conference, Online, 19–22 January 2021; Springer: Cham, Switzerland, 2021; pp. 90–100. [Google Scholar] [CrossRef]
  21. Thomson, C.; Lesser, I. It’s All Relative: The Role of Cardiorespiratory Fitness in Hiking Trail Difficulty. Sci. Sports 2025, 40, 65–74. [Google Scholar] [CrossRef]
  22. Park, B.J.; Tsunetsugu, Y.; Kasetani, T.; Kagawa, T.; Miyazaki, Y. The physiological effects of Shinrin-yoku (taking in the forest atmosphere or forest bathing): Evidence from field experiments in 24 forests across Japan. Environ. Health Prev. Med. 2010, 15, 18–26. [Google Scholar] [CrossRef]
  23. Lee, J.; Tsunetsugu, Y.; Takayama, N.; Park, B.J.; Li, Q.; Song, C.; Komatsu, M.; Ikei, H.; Tyrväinen, L.; Kagawa, T.; et al. Influence of forest therapy on cardiovascular relaxation in young adults. Evid. Based Complement. Alternat. Med. 2014, 2014, 834360. [Google Scholar] [CrossRef]
  24. Shin, W.S.; Yeoun, P.S.; Yoo, R.W.; Shin, C.S. The influence of forest experience on psychological health. J. Korean For. Soc. 2013, 102, 117–123. [Google Scholar]
  25. Choi, Y.; Lee, S.; Yun, S.; Lee, D.T. Examination of exercise physiological traits according to usage grade of national forest trails. Forests 2024, 15, 1853. [Google Scholar] [CrossRef]
  26. Grummt, M.; Hafermann, L.; Claussen, L.; Jahn, I.; Winkler, J.; Grützmacher, J.; Niebauer, J. Rating of Perceived Exertion: A Large Cross-Sectional Study Defining Intensity Levels for Individual Physical Activity Recommendations. Sports Med. Open 2024, 10, 71. [Google Scholar] [CrossRef]
  27. Kim, C.; Kim, J.; Song, I.; Yi, Y.; Park, B.-J.; Song, C. The Effects of Forest Walking on Physical and Mental Health Based on Exercise Prescription. Forests 2023, 14, 2332. [Google Scholar] [CrossRef]
  28. Fattorini, L.; Pittiglio, G.; Federico, B.; Pallicca, A.; Bernardi, M.; Rodio, A. Workload Comparison Between Hiking and Indoor Physical Activity. J. Strength Cond. Res. 2012, 26, 2883–2889. [Google Scholar] [CrossRef] [PubMed]
  29. Eisenberger, L.; Mayr, B.; Beck, M.; Venek, V.; Kranzinger, C.; Menzl, A.; Jahn, I.; Sareban, M.; Oberhoffer-Fritz, R.; Niebauer, J. Assessment of Exercise Intensity for Uphill Walking in Healthy Adults Performed Indoors and Outdoors. Int. J. Environ. Res. Public Health 2022, 19, 16662. [Google Scholar] [CrossRef] [PubMed]
  30. Shin, J.W.; Choi, J.H. The Effects of Viewing the Forest Landscape on Physiological and Psychological Status in Radiologists. J. People Plants Environ. 2017, 20, 283–291. [Google Scholar] [CrossRef]
  31. Kang, H.K.; Back, S.J. Effect of Urban Agriculture Experience Program on the Mental Health of the Elderly. J. People Plants Environ. 2017, 20, 1–6. [Google Scholar] [CrossRef]
  32. Janeczko, E.; Bielinis, E.; Wójcik, R.; Woźnicka, M.; Kędziora, W.; Łukowski, A.; Elsadek, M.; Szyc, K.; Janeczko, K. When urban environment is restorative: The effect of walking in suburbs and forests on psychological and physiological relaxation of young Polish adults. Forests 2020, 11, 591. [Google Scholar] [CrossRef]
  33. Calbimonte, J.P.; Martin, D.; Calvaresi, D. Participatory environmental sensing for quality of life monitoring using mobile phones. In Participatory Sensing, Opinions and Collective Awareness; Springer: Cham, Switzerland, 2020; pp. 213–236. [Google Scholar]
  34. Marion, J.L.; Wimpey, J. Assessing the influence of sustainable trail design and maintenance on soil loss. J. Environ. Manag. 2017, 189, 46–57. [Google Scholar] [CrossRef]
  35. Korea Forest Service. Forest Recreation Act. 2020. Available online: http://www.law.go.kr/ (accessed on 10 January 2025).
  36. Toda, H.; Maruyama, T.; Tada, M. Indoor vs. Outdoor Walking: Does It Make Any Difference in Joint Angle Depending on Road Surface? Front. Sports Act. Living 2020, 2, 119. [Google Scholar] [CrossRef]
  37. Taylor, K.L.; Fitzsimons, C.; Mutrie, N. Objective and Subjective Assessments of Normal Walking Pace, in Comparison with that Recommended for Moderate Intensity Physical Activity. Int. J. Exerc. Sci. 2010, 3, 87–96. [Google Scholar] [CrossRef]
  38. Korea Ministry of Health and Welfare. Enforcement Rule of the Bioethics and Safety Act. Available online: https://www.law.go.kr/법령/생명윤리및안전에관한법률시행규칙/(20240821,01048,20240816)/제2조 (accessed on 29 April 2025).
  39. Stryd. Stryd (Version 8.15.54) [Mobile app]. Google Play. 2024. Available online: https://play.google.com/store/apps/details?id=com.stryd.pioneer&hl=en_US (accessed on 10 January 2025).
  40. San-gil-saem[Naduri]; NETGENETECH Ltd. San-gil-saem (Version 2.9.3) [Mobile app]. Onestore. 2024. Available online: https://m.onestore.co.kr/ko-kr/apps/appsDetail.omp?prodId=0000764451 (accessed on 10 January 2025).
  41. Rambler (Hike, Walk, Travel, Bike, Map, Application); Bientus, Inc. Rambler (Version 2.64.15) [Mobile app]. Google Play. 2024. Available online: https://play.google.com/store/apps/details?id=com.bientus.cirque.android&hl=ko&gl=US (accessed on 10 January 2025).
  42. Ross, R.; ALDuhishy, A.; González-Haro, C. Validation of the Cosmed K4b2 Portable Metabolic System During Running Outdoors. J. Strength Cond. Res. 2020, 34, 124–133. [Google Scholar] [CrossRef]
  43. Costello, K.; Woods, D.; Toulouse, A.; Davis, P.R. Comparisons of Portable Metabolic Sensors During Outdoor Cycling: 188 Board #26 May 29 9:30 AM–11:00 AM. Med. Sci. Sports Exerc. 2019, 51, 36–37. [Google Scholar] [CrossRef]
  44. Heidari, S.; Babor, T.F.; De Castro, P.; Tort, S.; Curno, M. Sex and Gender Equity in Research: Rationale for the SAGER Guidelines and Recommended Use. Res. Integr. Peer Rev. 2016, 1, 2. [Google Scholar] [CrossRef] [PubMed]
  45. Manning, J.W.; Montes, J.; Stone, T.M.; Rietjens, R.W.; Young, J.C.; DeBeliso, M.; Navalta, J.W. Cardiovascular and Perceived Exertion Responses to Leisure Trail Hiking. J. Outdoor Recreat. Educ. Leadersh. 2015, 7, 83–92. [Google Scholar] [CrossRef]
  46. Majed, L.; Ibrahim, R.; Lock, M.J.; Jabbour, G. Walking Around the Preferred Speed: Examination of Metabolic, Perceptual, Spatiotemporal and Stability Parameters. Front. Physiol. 2024, 15, 1357172. [Google Scholar] [CrossRef] [PubMed]
  47. Julius, L.M.; Brach, J.S.; Wert, D.M.; VanSwearingen, J.M. Perceived Effort of Walking: Relationship with Gait, Physical Function and Activity, Fear of Falling, and Confidence in Walking in Older Adults with Mobility Limitations. Phys. Ther. 2012, 92, 1268–1277. [Google Scholar] [CrossRef]
  48. Rejeski, W.J. The Perception of Exertion: A Social Psychophysiological Integration. J. Sport Psychol. 1981, 3, 305–320. [Google Scholar] [CrossRef]
  49. U.S. Department of Health and Human Services. Physical Activity Guidelines for Americans; U.S. Department of Health and Human Services: Washington, DC, USA, 2018. [Google Scholar]
  50. Schantz, P.; Salier Eriksson, J.; Rosdahl, H. The Heart Rate Method for Estimating Oxygen Uptake: Analyses of Reproducibility Using a Range of Heart Rates from Commuter Walking. Eur. J. Appl. Physiol. 2019, 119, 2655–2671. [Google Scholar] [CrossRef]
  51. Jetté, M.; Sidney, K.; Blümchen, G. Metabolic Equivalents (METS) in Exercise Testing, Exercise Prescription, and Evaluation of Functional Capacity. Clin. Cardiol. 1990, 13, 555–565. [Google Scholar] [CrossRef]
  52. Schmitt, A.C.; Baudendistel, S.T.; Lipat, A.L.; White, T.A.; Hass, C.J. Walking Indoors, Outdoors, and on a Treadmill: Gait Differences in Healthy Young and Older Adults. Gait Posture 2021, 90, 468–474. [Google Scholar] [CrossRef]
  53. Schmitt, A.C.; Baudendistel, S.L.; Lipat, A.L.; White, T.; Hass, C.J. Differences in Indoor, Outdoor, and Treadmill Walking in Healthy Young Adults. Med. Sci. Sports Exerc. 2019, 51, 700. [Google Scholar] [CrossRef]
  54. Tamburini, P.; Storm, F.; Buckley, C.; Bisi, M.C.; Stagni, R.; Mazzà, C. Moving from Laboratory to Real Life Conditions: Influence on the Assessment of Variability and Stability of Gait. Gait Posture 2018, 59, 248–252. [Google Scholar] [CrossRef]
  55. Willen, C.; Lehmann, K.; Sunnerhagen, K. Walking Speed Indoors and Outdoors in Healthy Persons and in Persons with Late Effects of Polio. J. Neurol. Res. 2013, 3, 62–67. [Google Scholar] [CrossRef]
  56. Krinski, K.; Machado, D.G.S.; Lirani, L.S.; DaSilva, S.G.; Costa, E.C.; Hardcastle, S.J.; Elsangedy, H.M. Let’s Walk Outdoors! Self-Paced Walking Outdoors Improves Future Intention to Exercise in Women with Obesity. J. Sport Exerc. Psychol. 2017, 39, 145–157. [Google Scholar] [CrossRef] [PubMed]
  57. Joseph, R.P.; Maddock, J.E. Observational Park-Based Physical Activity Studies: A Systematic Review of the Literature. Prev. Med. 2016, 89, 257–277. [Google Scholar] [CrossRef] [PubMed]
  58. Calogiuri, G.; Litleskare, S.; Fagerheim, K.A.; Rydgren, T.L.; Brambilla, E.; Thurston, M. Experiencing Nature Through Immersive Virtual Environments: Environmental Perceptions, Physical Engagement, and Affective Responses During a Simulated Nature Walk. Front. Psychol. 2018, 8, 2321. [Google Scholar] [CrossRef]
  59. Potteiger, J.A.; Schroeder, J.M.; Goff, K.L. Influence of Music on Ratings of Perceived Exertion during 20 Minutes of Moderate Intensity Exercise. Percept. Mot. Ski. 2000, 91, 848–854. [Google Scholar] [CrossRef]
Figure 1. Visual documentation of participants engaged in the forest trail walking experiment.
Forests 16 00934 g001
Figure 2. Images depicting participants during the indoor treadmill experiment: (a) Pre-experiment blood pressure measurement; (b) walking on a declined treadmill.
Forests 16 00934 g002
Figure 3. Geographic map of South Korea indicating the experimental sites: (A) the outdoor forest trail walking location and (B) the indoor treadmill walking facility.
Forests 16 00934 g003
Figure 4. Trail maps of the Naepo National Cultural Forest Trail showing designated walking segments by difficulty rating, total distance, and mean gradient.
Forests 16 00934 g004
Figure 5. Boxplot of physiological metrics by difficulty level under outdoor conditions.
Forests 16 00934 g005
Figure 6. Linear regression for trail difficulty on physiological responses under outdoor conditions.
Forests 16 00934 g006
Figure 7. Boxplot of physiological metrics by difficulty level under indoor conditions.
Forests 16 00934 g007
Figure 8. Linear regression for trail difficulty on physiological responses under indoor conditions.
Forests 16 00934 g008
Table 1. Physical characteristics of the study participants (mean ± standard deviation).
VariablesTotal (n = 10)Male (n = 5)Female (n = 5)
Age (years)48.2 ± 6.746.0 ± 7.450.4 ± 6.0
Height (cm)166.7 ± 9.6173.8 ± 6.8159.5 ± 5.6
Weight (kg)70.0 ± 9.975.4 ± 11.664.7 ± 3.9
Body mass index (kg/m2)25.4 ± 2.524.9 ± 2.126.0 ± 3.1
Leg length (cm)87.7 ± 4.287.1 ± 4.988.2 ± 3.8
Table 2. Procedural flow for forest trail outdoor tests and indoor treadmill trials.
Outdoor Forest Trail Walking Indoor Treadmill Walking
Delivery of study overview and informed consent; completion of physical activity readiness form; setup of devices and installation of necessary mobile applications; initial assessment of baseline heart rate (HR) and oxygen saturation (OS); weighing participants with all equipment; logging temperature and humidity data from the trail environmentPreparationDelivery of study purpose and collection of informed consent; completion of physical activity readiness form; anthropometric data collection (height, weight, leg length); configuration of devices and installation of required applications; initial measurements of resting blood pressure and oxygen saturation (OS); recording total body weight with all gear attached
Activation of electronic HR monitors, gait tracking devices, and GPS apps; participants reported perceived exertion (RPE) at 10 min intervalsExperiment startInitialization of metabolic analyzer, heart rate monitor, and gait tracking sensor
Collection of OS and RPE data prior to completing each segmentAt the 200 m and 400 m points of each segmentAssessment of OS, blood pressure, and perceived exertion (RPE)
Collection of OS and RPE data prior to completing each segmentRight before the end of each segmentAssessment of OS, blood pressure, and perceived exertion (RPE); documentation of ambient indoor temperature and humidity
Logging time of segment completionEnd of each segmentTime-stamping segment end using a marker for respiratory gas measurement
Deactivation and data-saving from HR monitor, gait tracker, and GPS toolsExperiment endTermination and data-saving from metabolic analyzer, HR monitor, and gait recording device
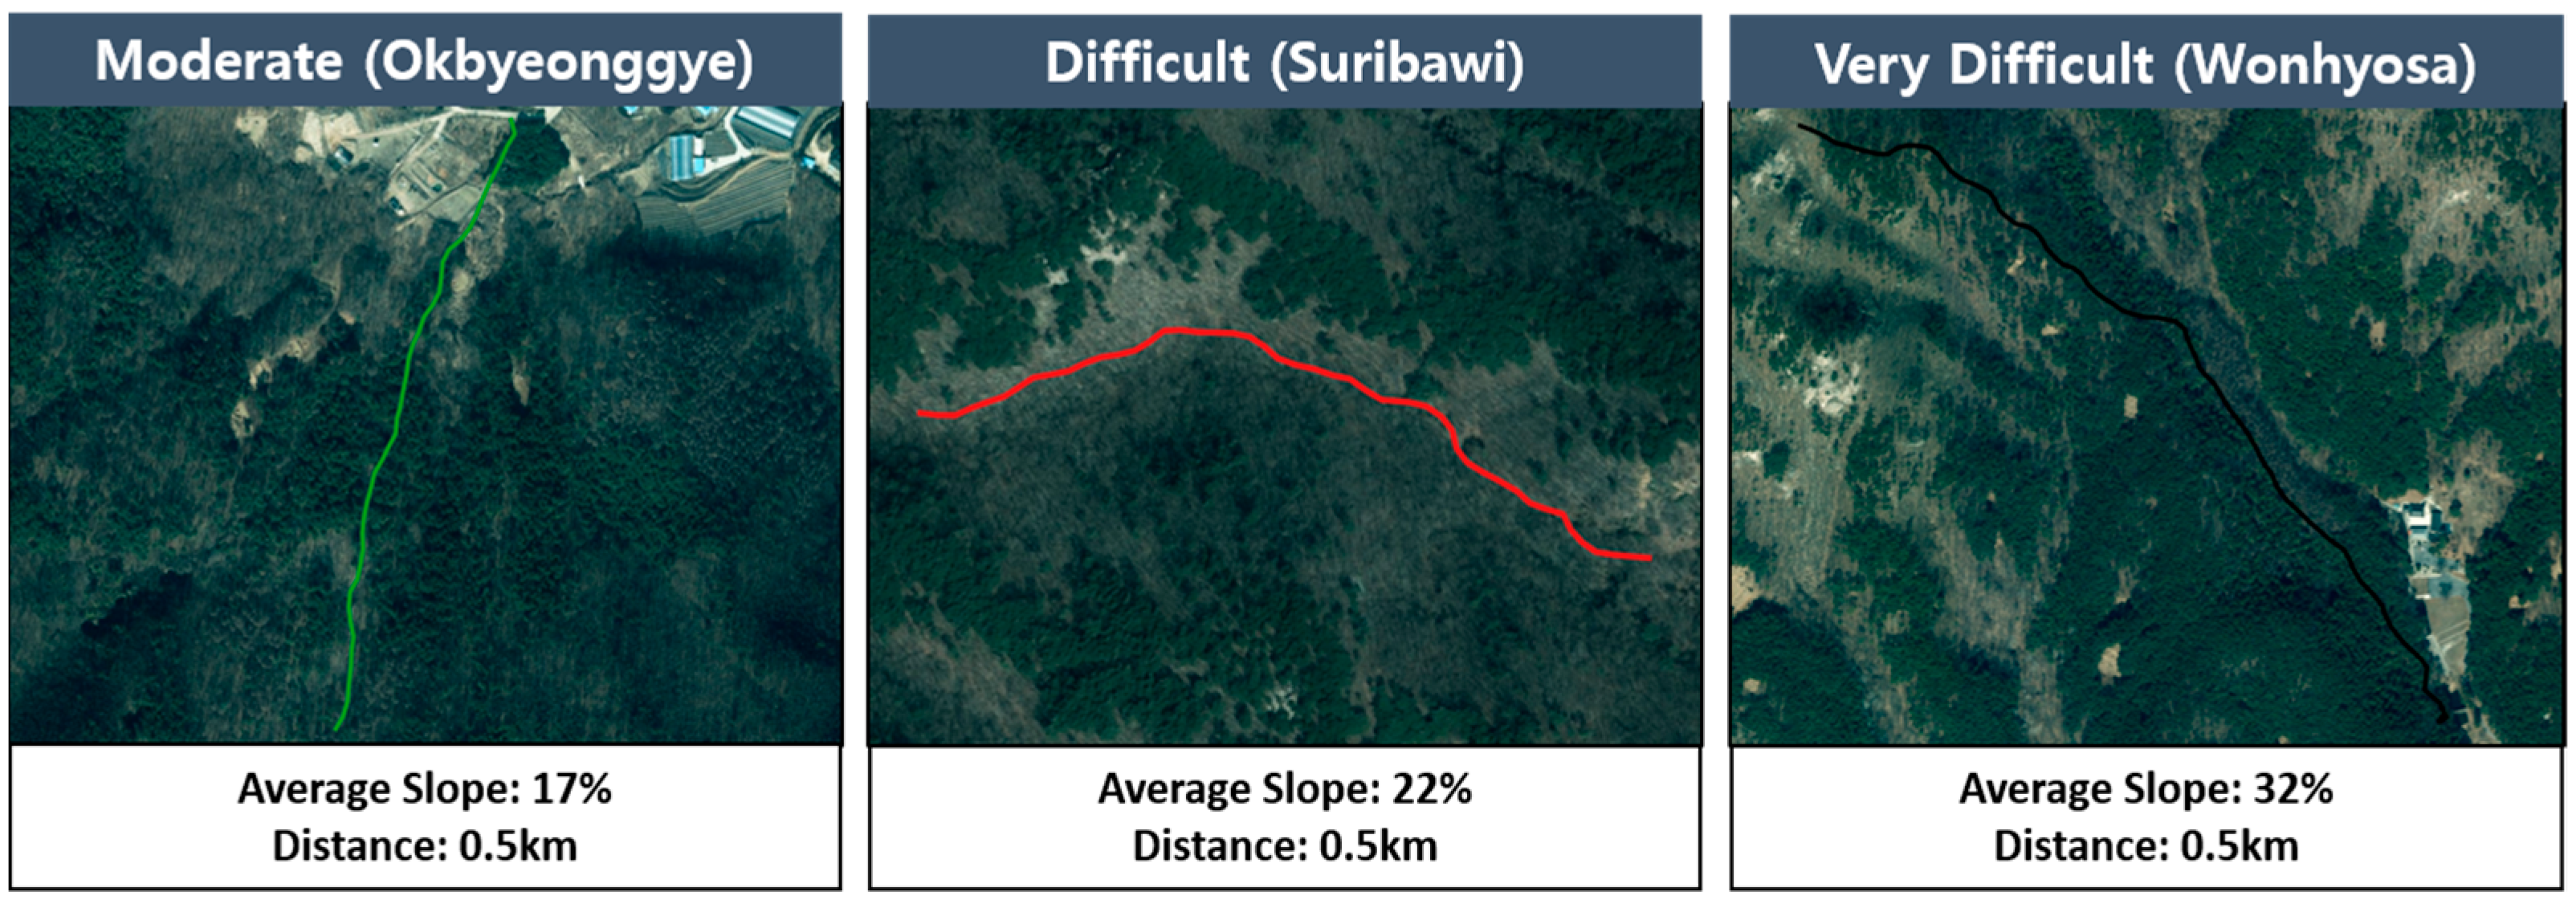
Table 3. Details of slope and walking distance settings applied during the indoor treadmill experiment.
GradeSlope (%) and Distance (km)
Moderate17 and 0.5
Difficult22 and 0.5
Very Difficult27 and 0.5
Table 4. Descriptive statistics of outdoor experiment (mean ± standard deviation).
GradeGenderSCSSRPEHROS
ModerateTotal
(n = 10)
95.50
±9.68
3.64
±0.48
11.30
±1.25
145.46
±11.61
96.00
±1.33
Male
(n = 5)
97.20
±12.66
3.88
±0.58
10.80
±1.10
137.22
±10.26
96.00
±1.58
Female
(n = 5)
93.80
±6.57
3.40
±0.16
11.80
±1.30
153.70
±5.30
96.00
±1.22
DifficultTotal
(n = 10)
86.30
±9.90
2.96
±0.57
14.70
±1.25
154.45
±15.40
95.30
±1.06
Male
(n = 5)
88.80
±12.21
3.34
±0.56
14.00
±1.00
153.98
±13.48
95.00
±0.71
Female
(n = 5)
83.80
±7.46
2.58
±0.25
15.40
±1.14
154.92
±18.75
95.60
±1.34
Very
Difficult
Total
(n = 10)
79.80
±10.91
2.54
±0.57
15.40
±2.17
158.24
±14.84
96.40
±1.07
Male
(n = 5)
85.00
±13.91
2.96
±0.52
14.80
±1.64
157.84
±16.23
96.40
±1.52
Female
(n = 5)
74.60
±2.61
2.12
±0.11
16.00
±2.65
158.64
±15.22
96.40
±0.55
SC, step count (steps/min); SS, step speed (km/h); RPE, rate of perceived exertion (score); HR (beats/min); OS (%).
Table 5. Results of the RM ANOVA and post-hoc analyses.
ClassificationSCSSRPEHROS
RM ANOVA
(n = 10)
F-value48.64 ***2.4164.19 ***3.5428.87 ***
GES0.580.150.440.140.31
Bonfferoni-adjusted pairwise comparison (mean difference)
Moderate—Difficult−3.4 ***-0.68 ***-9.2 **
Moderate—Very Difficult−4.1 ***-1.10 ***-15.7 ***
Difficult—Very Difficult−0.7-0.42 ***-6.5 **
significant difference: ** p < 0.01, *** p < 0.001.
Table 6. Descriptive statistics of the indoor experiment (mean ± standard deviation).
GradeGenderEEMETVO2SCSSRPEHROS
ModerateTotal
(n = 10)
567.67
±103.39
7.61
±1.12
26.65
±3.94
107.30
±10.05
3.63
±0.49
14.30
±1.70
150.36
±13.90
95.90
±0.32
Male
(n = 5)
635.84
±51.06
8.10
±0.94
28.44
±3.24
103.78
±10.40
3.88
±0.60
13.40
±1.14
139.42
±9.35
95.80
±0.45
Female
(n = 5)
499.50
±88.66
7.12
±1.04
24.86
±3.63
110.82
±8.39
3.38
±0.16
15.20
±1.60
161.30
±6.20
96.00
±0.00
DifficultTotal
(n = 10)
580.55
±105.67
7.79
±1.40
27.37
±4.92
98.58
±13.21
2.97
±0.56
14.60
±1.71
150.95
±13.77
96.40
±0.84
Male
(n = 5)
668.12
±19.22
8.56
±1.38
30.10
±4.87
96.56
±10.83
3.34
±0.56
14.20
±1.64
145.12
±14.12
95.80
±0.84
Female
(n = 5)
492.98
±66.84
7.02
±0.90
24.64
±3.11
100.60
±14.57
2.60
±0.19
15.00
±1.67
156.78
±10.67
97.00
±0.00
Very
Difficult
Total
(n = 10)
587.84
±143.72
7.84
±1.75
27.46
±6.09
93.45
±11.58
2.53
±0.55
15.50
±1.51
159.24
±15.76
96.00
±0.67
Male
(n = 5)
707.02
±7.32
9.02
±1.39
31.62
±4.77
92.52
±9.68
2.92
±0.54
15.00
±1.58
154.68
±22.08
95.60
±0.55
Female
(n = 5)
468.66
±93.44
6.66
±1.08
23.30
±3.74
94.38
±12.82
2.14
±0.12
16.00
±1.26
163.80
±3.90
96.40
±0.49
EE, energy expenditure (kcal/h); MET, metabolic equivalent (METs); VO2, oxygen consumption (ml/kg/min); SC, step count (steps/min); SS, step speed (km/h); RPE, rate of perceived exertion (score); HR (beats/min); OS (%).
Table 7. Results of the ANOVA and post-hoc analyses.
ClassificationEEMETVO2SCSSRPEHROS
RM ANOVA
(n = 10)
F-value28.20 ***51.59 ***39.32 ***48.01 ***85.33 ***10.94 ***54.94 ***48.58 ***
GES0.320.610.640.640.770.250.610.64
Bonfferoni-adjusted pairwise comparison (Mean difference)
Moderate—Difficult8.72 *0.66 ***−0.3−0.18−0.59−0.5−12.88−0.72
Moderate—Very Difficult13.85 ***1.10 ***−1.2 *−0.23−8.88−0.1−20.17−0.81
Difficult—Very Difficult5.13 *0.44 ***−0.9 **−0.05−8.290.4−7.29−0.09
significant difference: * p < 0.05, ** p < 0.01, *** p < 0.001.
Table 8. Paired t-test results comparing indoor and outdoor conditions for each trail difficulty level.
GradeSCSSRPEHROS
Moderate4.26 **−0.555.38 ***1.71−0.25
Difficult4.01 **1.00−0.21−1.013.497 **
Very Difficult3.52 **−0.5570.180.22−1.00
significant difference: ** p < 0.01, *** p < 0.001.
Disclaimer/Publisher’s Note: The statements, opinions and data contained in all publications are solely those of the individual author(s) and contributor(s) and not of MDPI and/or the editor(s). MDPI and/or the editor(s) disclaim responsibility for any injury to people or property resulting from any ideas, methods, instructions or products referred to in the content.

