

Mapping Priority Areas for Urban Afforestation Based on the Relationship Between Urban Greening and Social Vulnerability Indicators

 ,
,  ,
,  ,
,  , and
, and
Abstract
1. Introduction
2. Materials and Methods
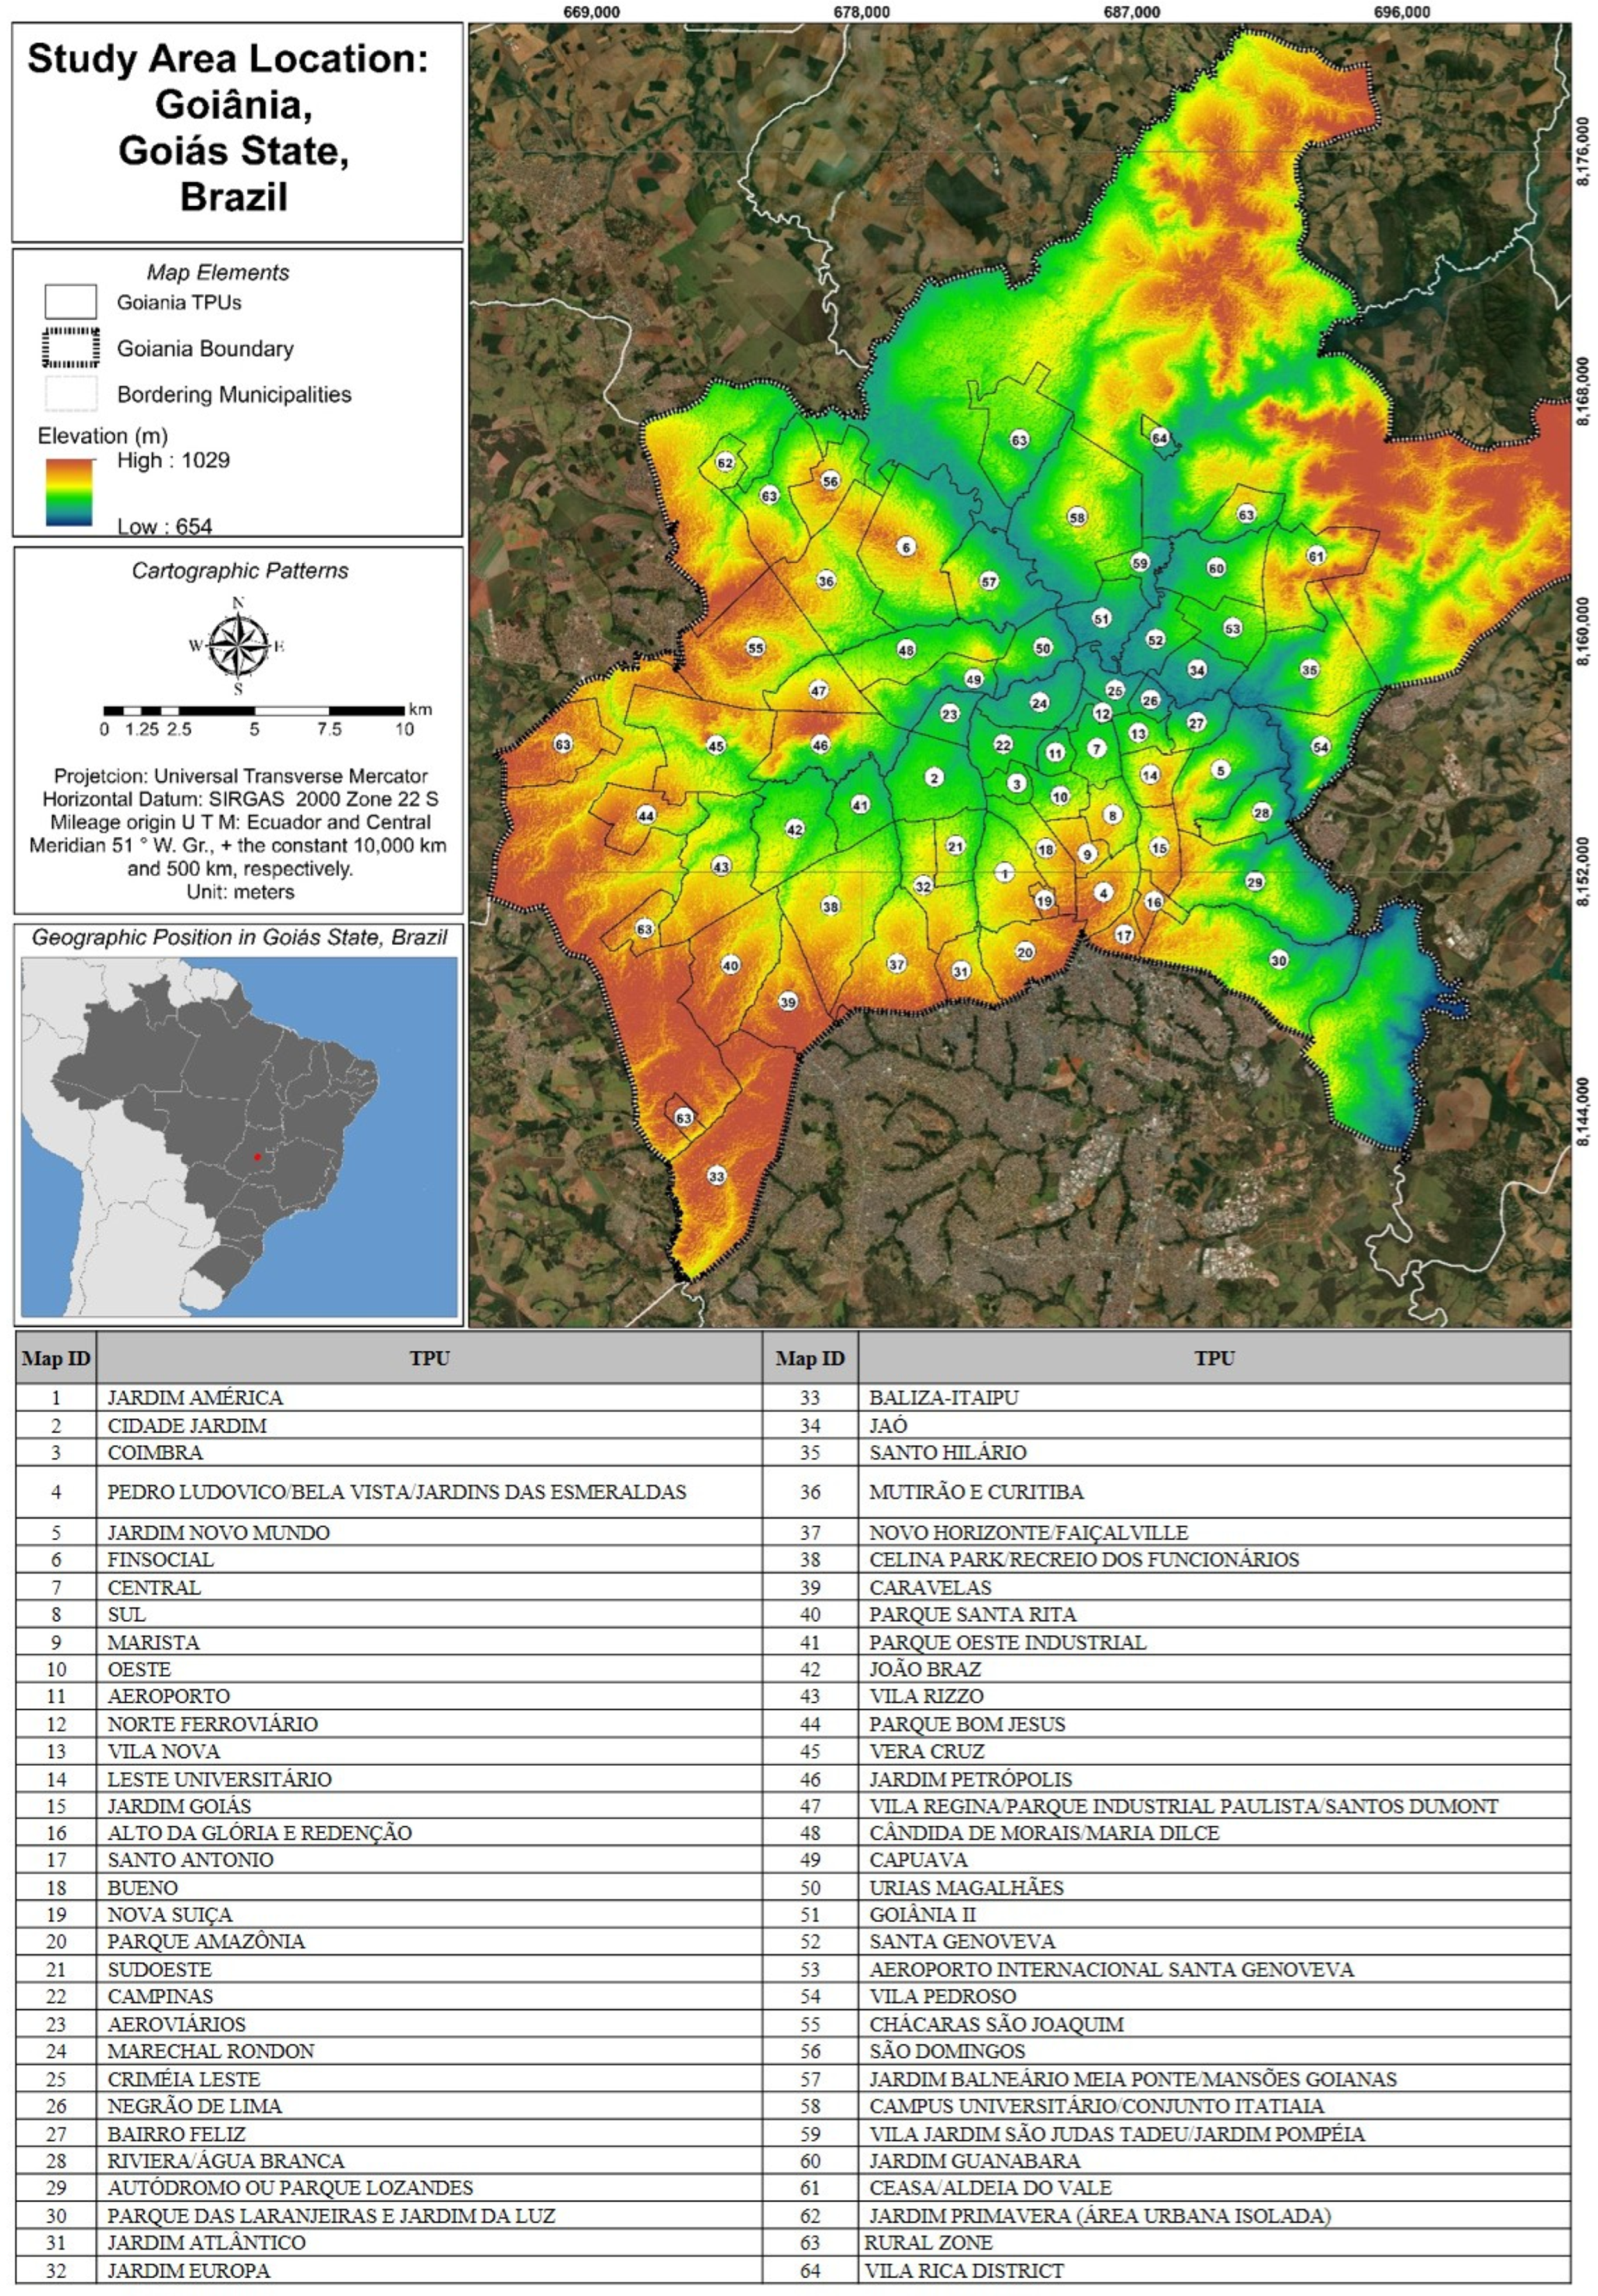
2.1. Study Area
2.2. Data Used
2.2.1. China–Brazil Earth Resources Satellite-4A (CBERS-4A) Imagery
2.2.2. Goiânia Territorial Planning Units (TPUs)
2.2.3. Census Data
2.3. Methods
2.3.1. Urban Greening Mapping
2.3.2. Social Vulnerability
2.3.3. Mapping Priority Areas for Urban Afforestation
3. Results
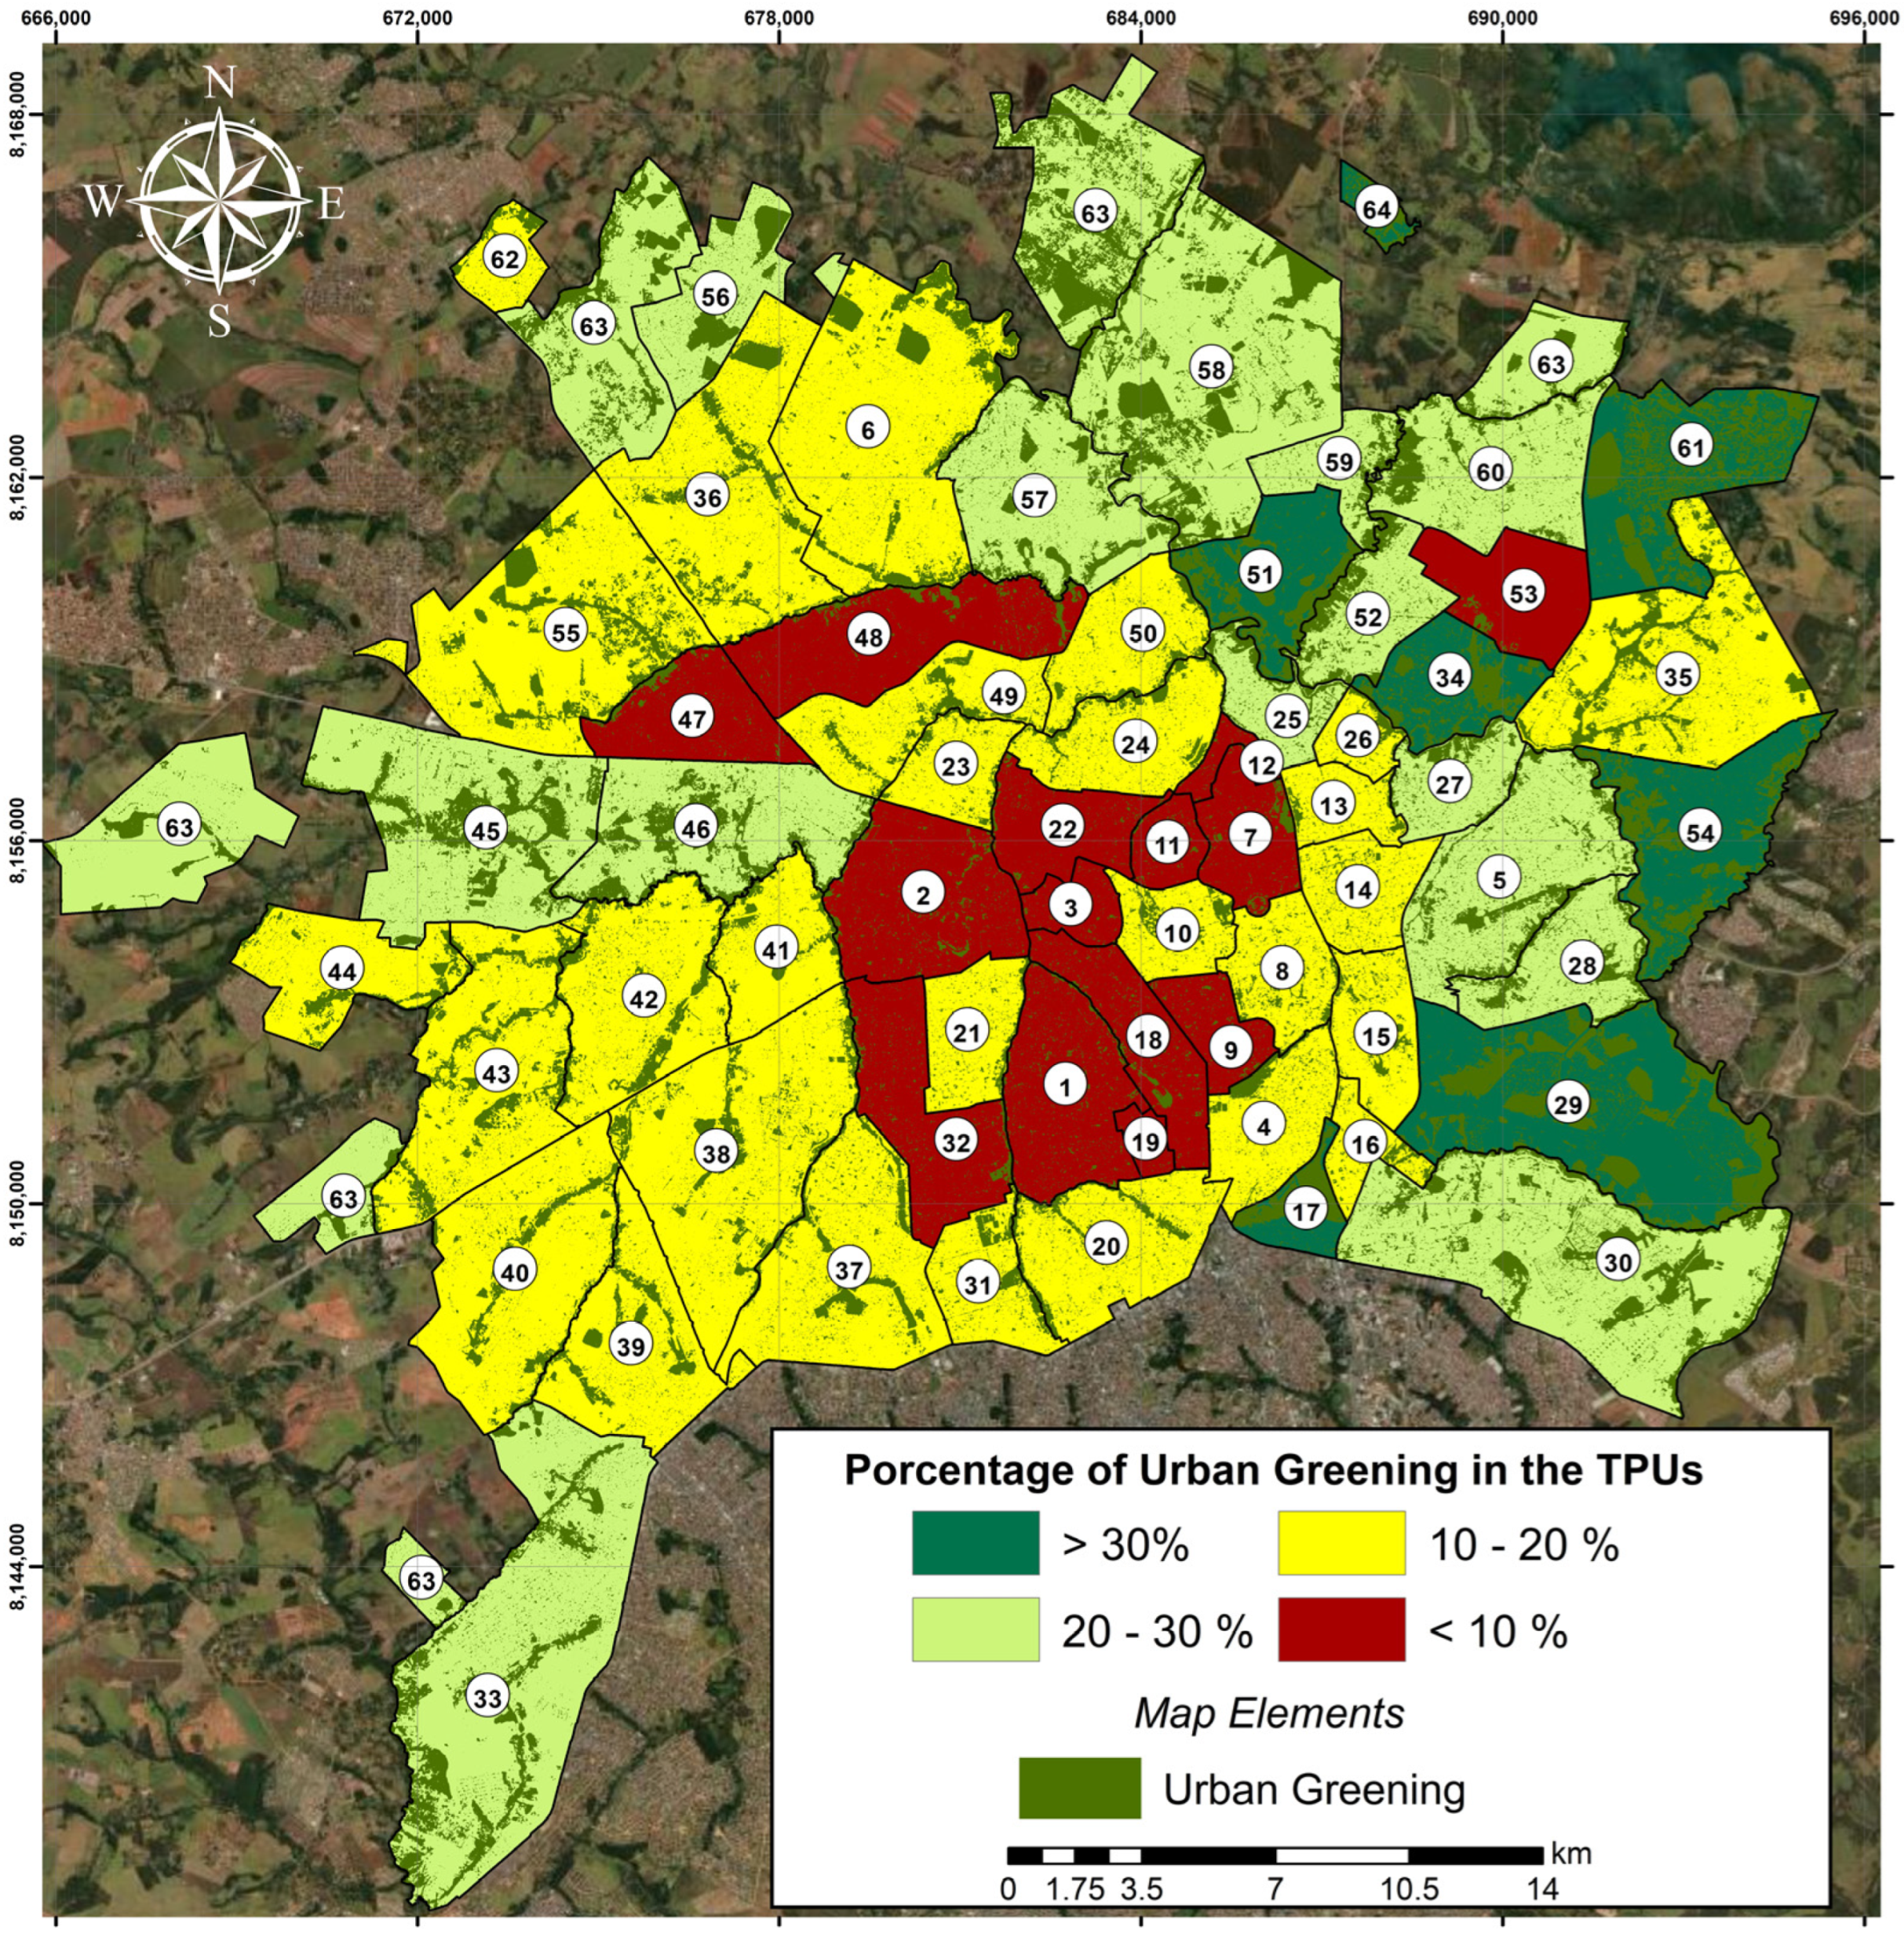
3.1. Urban Greening Map
3.2. Social Vulnerability Map
3.3. Priority Areas for Urban Afforestation
4. Discussion
5. Theoretical and Political Implications
6. Limitations and Directions for Future Work
7. Conclusions
Supplementary Materials
Author Contributions
Funding
Data Availability Statement
Conflicts of Interest
Abbreviations
| GIS | Geographic Information System |
| TPUs | Territorial Planning Units |
| CBERS-4A | China–Brazil Earth Resources Satellite 4A |
| NDVI | Normalized Digital Vegetation Index |
| UN | United Nations |
| SDG | Sustainable Development Goals |
| US | United States |
| MNDWI | Modified Normalized Difference Moisture Index |
| AWEI | Automated Water Extraction Index |
| TB | Total Biomass |
| TCS | Total Carbon Stock |
| CO2eq | Carbon Dioxide Equivalent |
| UHI | Urban Heat Island |
| PGA | Public Green Areas |
| INPE | National Institute for Space Research (Instituto Nacional de Pesquisas Espaciais) |
| IBGE | Brazilian Institute of Geography and Statistics (Instituto Brasileiro de Geografia e Estatística) |
| CRESDA | China Centre for Resources Satellite and Data Application |
| WPM | Wide-Scan Panchromatic and Multispectral Camera |
| MUX | Multispectral Camera |
| WFI | Wide Field Imager |
| DOS | Dark-Object Subtraction |
| NIR | Near-Infrared |
| Red | Red band |
| FAPESP | São Paulo Research Foundation (Fundação de Amparo à Pesquisa do Estado de São Paulo) |
| CNPq | Brazilian National Council for Scientific and Technological Development (Conselho Nacional de Desenvolvimento Científico e Tecnológico) |
| AEB | Brazilian Space Agency (Agência Espacial Brasileira) |
References
- UN—United Nations. World Population Prospects 2022. Summary of Results; UN: New York, NY, USA, 2022. [Google Scholar]
- UN—United Nations. World Urbanization Prospects: The 2018 Revision; Population Division, Ed.; United Nations. Department of Economic and Social Affairs: New York, NY, USA, 2019; ISBN 9211483190. [Google Scholar]
- Angel, S.; Parent, J.; Civco, D.L.; Blei, A.M. Atlas of Urban Expansion—The 2016 Edition, Volume 1: Areas and Densities; NYU Urban Expansion Program at New York University, UN-Habitat, and the Lincoln Institute of Land Policy: Cambridge, MA, USA, 2016; ISBN 978-1-55844-243-6. [Google Scholar]
- Barros, J. Exploring Urban Dynamics in Latin American Cities Using an Agent-Based Simulation Approach. In Agent-Based Models of Geographical Systems; Springer: Dordrecht, The Netherlands, 2012; pp. 571–589. [Google Scholar]
- García-Ayllón, S. Rapid Development as a Factor of Imbalance in Urban Growth of Cities in Latin America: A Perspective Based on Territorial Indicators. Habitat Int. 2016, 58, 127–142. [Google Scholar] [CrossRef]
- UN—United Nations. Human Development Report 2021–2022: Uncertain Times, Unsettled Lives: Shaping Our Future in a Transforming World. Available online: https://hdr.undp.org/content/human-development-report-2021-22 (accessed on 28 September 2024).
- Selwyn, B. A Green New Deal for Agriculture: For, within, or against Capitalism? J. Peasant. Stud. 2021, 48, 778–806. [Google Scholar] [CrossRef]
- Bowler, D.E.; Buyung-Ali, L.; Knight, T.M.; Pullin, A.S. Urban Greening to Cool Towns and Cities: A Systematic Review of the Empirical Evidence. Landsc. Urban Plan. 2010, 97, 147–155. [Google Scholar] [CrossRef]
- Dover, J.W. Green Infrastructure; Routledge: London, UK, 2015; ISBN 9781136330742. [Google Scholar]
- Magalhães, L.M.S. Arborização e Florestas Urbanas-Terminologia Adotada Para a Cobertura Arbórea Das Cidades Brasileiras. Sér. Téc. Floresta Ambiente 2006, 0, 23–26. [Google Scholar]
- Konijnendijk, C.C. Evidence-Based Guidelines for Greener, Healthier, More Resilient Neighbourhoods: Introducing the 3–30–300 Rule. J. For. Res. 2023, 34, 821–830. [Google Scholar] [CrossRef]
- Lima, B.V.; Amaral, R.D.d.A.M.; Souza, C.A.; Longo, M.H.C. Perception about Urban Forest and Its Influence on Well-Being in Workplaces. Ambiente Soc. 2023, 26, e02201. [Google Scholar] [CrossRef]
- Hedblom, M.; Gunnarsson, B.; Iravani, B.; Knez, I.; Schaefer, M.; Thorsson, P.; Lundström, J.N. Reduction of Physiological Stress by Urban Green Space in a Multisensory Virtual Experiment. Sci. Rep. 2019, 9, 10113. [Google Scholar] [CrossRef]
- WHO—World Health Organization. Urban Green Spaces and Health; WHO: Copenhagen, Denmark, 2016. [Google Scholar]
- Lepczyk, C.A.; Aronson, M.F.J.; Evans, K.L.; Goddard, M.A.; Lerman, S.B.; MacIvor, J.S. Biodiversity in the City: Fundamental Questions for Understanding the Ecology of Urban Green Spaces for Biodiversity Conservation. Bioscience 2017, 67, 799–807. [Google Scholar] [CrossRef]
- Ives, C.D.; Lentini, P.E.; Threlfall, C.G.; Ikin, K.; Shanahan, D.F.; Garrard, G.E.; Bekessy, S.A.; Fuller, R.A.; Mumaw, L.; Rayner, L.; et al. Cities Are Hotspots for Threatened Species. Glob. Ecol. Biogeogr. 2016, 25, 117–126. [Google Scholar] [CrossRef]
- Junior, D.P.M.; Bueno, C.; da Silva, C.M. The Effect of Urban Green Spaces on Reduction of Particulate Matter Concentration. Bull. Environ. Contam. Toxicol. 2022, 108, 1104–1110. [Google Scholar] [CrossRef]
- Yoo, S.-Y.; Kim, T.; Ham, S.; Choi, S.; Park, C.-R. Importance of Urban Green at Reduction of Particulate Matters in Sihwa Industrial Complex, Korea. Sustainability 2020, 12, 7647. [Google Scholar] [CrossRef]
- Esperon-Rodriguez, M.; Rymer, P.D.; Power, S.A.; Barton, D.N.; Cariñanos, P.; Dobbs, C.; Eleuterio, A.A.; Escobedo, F.J.; Hauer, R.; Hermy, M.; et al. Assessing Climate Risk to Support Urban Forests in a Changing Climate. Plants People Planet 2022, 4, 201–213. [Google Scholar] [CrossRef]
- Aram, F.; Higueras García, E.; Solgi, E.; Mansournia, S. Urban Green Space Cooling Effect in Cities. Heliyon 2019, 5, e01339. [Google Scholar] [CrossRef] [PubMed]
- Kitha, J.; Lyth, A. Urban Wildscapes and Green Spaces in Mombasa and Their Potential Contribution to Climate Change Adaptation and Mitigation. Environ. Urban 2011, 23, 251–265. [Google Scholar] [CrossRef]
- Yang, Q.; Gao, D.; Song, D.; Li, Y. Environmental Regulation, Pollution Reduction and Green Innovation: The Case of the Chinese Water Ecological Civilization City Pilot Policy. Econ. Syst. 2021, 45, 100911. [Google Scholar] [CrossRef]
- Privitera, R.; Evola, G.; La Rosa, D.; Costanzo, V. Green Infrastructure to Reduce the Energy Demand of Cities. In Urban Microclimate Modelling for Comfort and Energy Studies; Springer International Publishing: Cham, Switzerland, 2021; pp. 485–503. [Google Scholar]
- Zimmermann, E.; Bracalenti, L.; Piacentini, R.; Inostroza, L. Urban Flood Risk Reduction by Increasing Green Areas for Adaptation to Climate Change. Procedia Eng. 2016, 161, 2241–2246. [Google Scholar] [CrossRef]
- Bobo Merga, B.; Tabor, K.W.; Melka, G.A. Analysis of the Cooling Effects of Urban Green Spaces in Mitigating Micro-Climate Change Using Geospatial Techniques in Adama City, Ethiopia. Sustain. Environ. 2024, 10, 2350806. [Google Scholar] [CrossRef]
- Mabon, L.; Shih, W.-Y. Mapping the Socio-Political Landscape of Heat Mitigation through Urban Greenspaces: The Case of Taipei Metropolis. Environ. Urban. 2019, 31, 552–574. [Google Scholar] [CrossRef]
- Kondo, M.; Fluehr, J.; McKeon, T.; Branas, C. Urban Green Space and Its Impact on Human Health. Int. J. Environ. Res. Public Health 2018, 15, 445. [Google Scholar] [CrossRef]
- Çetin, Ç.; Karafakı, F.C. The Influence of Green Areas on City-Dwellers’ Perceptions of Air Pollution: The Case of Nigde City Center. J. Environ. Biol. 2020, 41, 453–461. [Google Scholar] [CrossRef]
- Maas, J.; Verheij, R.A.; Groenewegen, P.P.; De Vries, S.; Spreeuwenberg, P. Green Space, Urbanity, and Health: How Strong Is the Relation? J. Epidemiol. Community Health 2006, 60, 587–592. [Google Scholar] [CrossRef] [PubMed]
- Wolch, J.R.; Byrne, J.; Newell, J.P. Urban Green Space, Public Health, and Environmental Justice: The Challenge of Making Cities ‘Just Green Enough’. Landsc. Urban Plan. 2014, 125, 234–244. [Google Scholar] [CrossRef]
- Otto, I.M.; Reckien, D.; Reyer, C.P.O.; Marcus, R.; Le Masson, V.; Jones, L.; Norton, A.; Serdeczny, O. Social Vulnerability to Climate Change: A Review of Concepts and Evidence. Reg. Environ. Change 2017, 17, 1651–1662. [Google Scholar] [CrossRef]
- Ford, J.D.; Pearce, T.; McDowell, G.; Berrang-Ford, L.; Sayles, J.S.; Belfer, E. Vulnerability and Its Discontents: The Past, Present, and Future of Climate Change Vulnerability Research. Clim. Change 2018, 151, 189–203. [Google Scholar] [CrossRef]
- Mah, J.C.; Penwarden, J.L.; Pott, H.; Theou, O.; Andrew, M.K. Social Vulnerability Indices: A Scoping Review. BMC Public Health 2023, 23, 1253. [Google Scholar] [CrossRef]
- Maleknia, R. How Perception of Environmental and Social Justice Drive Citizen’s Satisfaction and Intention to Engage with Urban Forests Management? Heliyon 2025, 11, e41274. [Google Scholar] [CrossRef]
- da Silva, R.G.P.; Lima, C.L.; Saito, C.H. Urban Green Spaces and Social Vulnerability in Brazilian Metropolitan Regions: Towards Environmental Justice. Land Use Policy 2023, 129, 106638. [Google Scholar] [CrossRef]
- Kronenberg, J.; Haase, A.; Łaszkiewicz, E.; Antal, A.; Baravikova, A.; Biernacka, M.; Dushkova, D.; Filčak, R.; Haase, D.; Ignatieva, M.; et al. Environmental Justice in the Context of Urban Green Space Availability, Accessibility, and Attractiveness in Postsocialist Cities. Cities 2020, 106, 102862. [Google Scholar] [CrossRef]
- Plüschke-Altof, B.; Sooväli-Sepping, H. Contested Urban Green Spaces and Environmental Justice in Northern Europe. In Whose Green City? Springer International Publishing: Cham, Switzerland, 2022; pp. 1–16. [Google Scholar]
- Ribeiro, F.P.; Sartori, R.A.; Sales, G.P.d.S.; Rajão, H. Who Has the Right to Urban Green Areas? Environmental Justice in a Brazilian Metropolis. Hist. Ambient. Latinoam. Y Caribeña (HALAC) Rev. Solcha 2024, 14, 295–325. [Google Scholar] [CrossRef]
- De Haas, W.; Hassink, J.; Stuiver, M. The Role of Urban Green Space in Promoting Inclusion: Experiences from the Netherlands. Front. Environ. Sci. 2021, 9, 618198. [Google Scholar] [CrossRef]
- Buhaug, H.; Urdal, H. An Urbanization Bomb? Population Growth and Social Disorder in Cities. Glob. Environ. Change 2013, 23, 1–10. [Google Scholar] [CrossRef]
- Capps, K.A.; Bentsen, C.N.; Ramírez, A. Poverty, Urbanization, and Environmental Degradation: Urban Streams in the Developing World. Freshw. Sci. 2016, 35, 429–435. [Google Scholar] [CrossRef]
- Cuchi, T.; Bobrowski, R.; Wężyk, P.; Breunig, F.M.; Pesck, V.A. Contributions to a Global Understanding of Socioenvironmental Justice Related to Urban Forest: Trends from Brazilian Cities in the Southeastern Paraná State. Urban For. Urban Green. 2024, 95, 128322. [Google Scholar] [CrossRef]
- Jennings, V.; Browning, M.H.E.M.; Rigolon, A. Urban Green Space at the Nexus of Environmental Justice and Health Equity. In Urban Green Spaces; Springer: Cham, Switzerland, 2019; pp. 47–69. [Google Scholar]
- Koprowska, K. Environmental Justice in the Context of Urban Green Space Availability. Acta Univ. Lodz. Folia Oeconomica 2020, 6, 141–161. [Google Scholar] [CrossRef]
- Jennings, V.; Larson, L.; Yun, J. Advancing Sustainability through Urban Green Space: Cultural Ecosystem Services, Equity, and Social Determinants of Health. Int. J. Environ. Res. Public Health 2016, 13, 196. [Google Scholar] [CrossRef]
- Anguelovski, I. (In)Justice in Urban Greening and Green Gentrification. In The Barcelona School of Ecological Economics and Political Ecology; Springer: Cham, Switzerland, 2023; pp. 235–247. [Google Scholar]
- Knoble, C.; Yu, D. Bridging the Gap: Analyzing the Relationship between Environmental Justice Awareness on Twitter and Socio-Environmental Factors Using Remote Sensing and Big Data. Remote Sens. 2023, 15, 5510. [Google Scholar] [CrossRef]
- Batista, D.A.M.; Maciel, E.A.; Machado, D.L.; Coelho, C.P.; Guilherme, F.A.G. Urban Greening Dynamics in a Brazil Central City as a Subsidy for Public Policies. Urban Ecosyst. 2023, 26, 845–856. [Google Scholar] [CrossRef]
- IBGE—Instituto Brasileiro de Geografia e Estatística (Brazilian Institute of Geography and Statistics). Demographic Census 2022 (Censo Demográfico 2022); IBGE—Instituto Brasileiro de Geografia e Estatística (Brazilian Institute of Geography and Statistics): Rio de Janeiro, Brazil, 2023.
- IBGE—Instituto Brasileiro de Geografia e Estatística (Brazilian Institute of Geography and Statistics). Cities and States (‘Cidades e Estados’): Goiânia (GO). Available online: https://www.ibge.gov.br/cidades-e-estados/go/goiania.html (accessed on 28 September 2024).
- IBGE—Instituto Brasileiro de Geografia e Estatística (Brazilian Institute of Geography and Statistics). Census Sector Grid. Available online: https://www.ibge.gov.br/geociencias/organizacao-do-territorio/malhas-territoriais/26565-malhas-de-setores-censitarios-divisoes-intramunicipais.html (accessed on 28 September 2024).
- INPE—Instituto Nacional de Pesquisas Espaciais (National Institute for Space Research). China–Brazil Earth Resources Satellite Program (CBERS) 04A. Available online: https://www.gov.br/inpe/pt-br/programas/cbers/sobre-o-cbers-1/cbers-04a (accessed on 28 September 2024).
- Rocha, B.O.; Körting, T.S.; Namikawa, L.M. Processamento de Imagens Dos Satélites Brasileiros CBERS-4 e CBERS-4A Para Respostas Rápidas a Desastres. Rev. Bras. Cartogr. 2024, 76, 1–17. [Google Scholar] [CrossRef]
- Chavez, P.S. An Improved Dark-Object Subtraction Technique for Atmospheric Scattering Correction of Multispectral Data. Remote Sens. Environ. 1988, 24, 459–479. [Google Scholar] [CrossRef]
- Rouse, J.W.; Haas, R.H.; Schell, J.A.; Deering, D.W. Monitoring Vegetation System in the Great Plains with ERTS 1974; NASA: Washington, DC, USA; pp. 309–317.
- Moreno, R.; Ojeda, N.; Azócar, J.; Venegas, C.; Inostroza, L. Application of NDVI for Identify Potentiality of the Urban Forest for the Design of a Green Corridors System in Intermediary Cities of Latin America: Case Study, Temuco, Chile. Urban For. Urban Green. 2020, 55, 126821. [Google Scholar] [CrossRef]
- Huang, S.; Tang, L.; Hupy, J.P.; Wang, Y.; Shao, G. A Commentary Review on the Use of Normalized Difference Vegetation Index (NDVI) in the Era of Popular Remote Sensing. J. For. Res. 2021, 32, 1–6. [Google Scholar] [CrossRef]
- Costa, M.A.; Marguti, B.O. Atlas Da Vulnerabilidade Social Nos Municípios Brasileiros; Instituto de Pesquisa Econômica Aplicada: Brasília, Brazil, 2015.
- de Medeiros, C.N.; de Souza, M.J.N. Metodologia Para Mapeamento Da Vulnerabilidade Socioambiental: Caso Do Município de Caucaia, Estado Do Ceará. REDE 2016, 10, 54–73. [Google Scholar]
- IBGE—Instituto Brasileiro de Geografia e Estatística (Brazilian Institute of Geography and Statistics). Censo Demográfico: 2010, 2011. Available online: https://www.ibge.gov.br/estatisticas/sociais/saude/9662-censo-demografico-2010.html?edicao=9758 (accessed on 23 August 2024).
- Moreira, J.d.F.R.; da Silva, C.A. Urban Landscape and Green Areas: Context of the Urbans Parks of Goiânia. Bol. Goiano Geografia 2012, 32, 239–254. [Google Scholar]
- EPA—Environmental Protection Agency. Environmental Justice. Available online: https://www.epa.gov/environmentaljustice (accessed on 21 August 2024).
- Pereira, L.M. Desigualdades Socioespaciais de Goiânia-Go: Análise Com Base Nos Setores Censitários Subnormais. Ph.D. Thesis, Universidade Federal de Minas Gerais, Gerais, Brazil, 2019. [Google Scholar]
- Ferreira, D.C.; Ratts, A.R. A Segregação Racial Em Goiânia: Representação Dos Dados de Cor Ou Raça (IBGE, 2010). Ateliê Geogr. 2018, 11, 170. [Google Scholar] [CrossRef]
- Zhou, W.; Yu, W.; Zhang, Z.; Cao, W.; Wu, T. How Can Urban Green Spaces Be Planned to Mitigate Urban Heat Island Effect under Different Climatic Backgrounds? A Threshold-Based Perspective. Sci. Total Environ. 2023, 890, 164422. [Google Scholar] [CrossRef] [PubMed]
- Gómez, N.J.; Velázquez, G.A. Asociación Entre Los Espacios Verdes Públicos y La Calidad de Vida En El Municipio de Santa Fe, Argentina. Cuad. De Geogr. Rev. Colomb. Geogr. 2018, 27, 164–179. [Google Scholar] [CrossRef]
- Al Mamun, A. Identification and Monitoring the Change of Land Use Pattern Using Remote Sensing and GIS: A Case Study of Dhaka City. IOSR J. Mech. Civ. Eng. 2013, 6, 20–28. [Google Scholar] [CrossRef]
- Moysés, A.; da Silva, E.R.; Borges, E.d.M.; Da Ribeiro, M.G. Formação Urbana Ao Empreendedorismo Imobiliário: A Nova Face Da Metrópole Goianiense. Mercat.-Rev. De Geogr. UFC 2007, 6, 37–50. [Google Scholar]
- Marinho, C.B. Região sul de Goiânia: Um Lugar Valorizado na Metrópole*. GEOUSP Espaço Tempo (Online) 2006, 10, 113. [Google Scholar] [CrossRef]
- Teobaldo Neto, A.; Medeiros, L.C. Índice de Vulnerabilidad Social Urbana En Goiás: La Geografía de Los Riesgos y La Desigualdad Social. Rev. Bras Geogr. 2022, 67, 3–32. [Google Scholar] [CrossRef]
- Fortunato, R.A.; Lima, C.A.; Gonçalves, L.P. Processos Urbanos Relacionados: Periferização e Produção de Habitação Social No Núcleo Da Região Metropolitana de Curitiba. Rev. Direito Cid. 2021, 13, 1239–1268. [Google Scholar] [CrossRef]
- Cymbalista, R. Moradia Popular, Ocupações e Propriedade No Centro de São Paulo: A Trajetória de Uma Família e de Um Edifício / Low Income Housing, Squatting and Property in Downtown São Paulo: The Trajectory of a Family and a Building. Rev. De Direito Da Cidade 2020, 12, 508–527. [Google Scholar] [CrossRef]
- Resende, S.C.P.; Reis, A.C.R. Expansão Urbana e Sistemas de Áreas Verdes. Cad. Arquitetura Urbanismo 2022, 28, 198–240. [Google Scholar] [CrossRef]
- Leite, A.S.G. Sustentabilidade Urbana e Vulnerabilidade Social: O Sistema de Espaços Livres Públicos Na Perspectiva Da Configuração Urbana Em Três Cidades Brasileiras. Ph.D. Thesis, Universidade de Brasília, Brasília, Brazil, 2021. [Google Scholar]
- Carlos, A.F.A. Da “Organização” à “Produção” Do Espaço No Movimento Do Pensamento Geográfico. In Produção do Espaço Urbano: Agentes e Processos, Escalas e Desafios; Contexto: São Paulo, Brazil, 2010; pp. 1–234. [Google Scholar]
- Weirich, R.A.; Calil, F.N.; Monteiro, M.M.; Gonçalves, B.B.; Silva Neto, C.D.M.e.; Venturoli, F. Arborização Urbana Para Mitigação Das Condições Microclimáticas Em Goiânia, Goiás. Rev. Ecol. Nutr. Florest.-ENFLO 2015, 3, 48–58. [Google Scholar] [CrossRef]
- Goiânia Municipality Goiânia Urban Forestry Master Plan. Available online: https://www.goiania.go.gov.br/html/gabinete_civil/sileg/dados/legis/2024/lc_20240124_000000374.html (accessed on 28 September 2024).
- Oliveira, I.I.; Alonso, R.R.P. A Importância de Uma Gestão Ambiental Pública Eficiente Na Implantação Da Arborização Urbana Do Município de Goiânia. Rev. UniAraguaia Pós-Grad. 2019, 2, 88–98. [Google Scholar]
- de Sousa, R.E.C.; de Castro, R.M.J.C. Áreas verdes urbanas de goiânia e seu uso pela população como formas de lazer e práticas saudáveis. In Hospitalidade; Alta Performance: Goiânia, GO, Brazil, 2022; Volume 1, pp. 219–242. [Google Scholar] [CrossRef]
- Niemets, K.; Kravchenko, K.; Kandyba, Y.; Kobylin, P.; Morar, C. World Cities in Terms of the Sustainable Development Concept. Geogr. Sustain. 2021, 2, 304–311. [Google Scholar] [CrossRef]
- Caiche, D.T.; Peres, R.B.; Schenk, L.B.M. Floresta Urbana, Soluções Baseadas Na Natureza e Paisagem: Planejamento e Projeto Na Cidade de São Carlos (SP). Rev. Labverde 2021, 11, 121–149. [Google Scholar] [CrossRef]
- Lafortezza, R.; Carrus, G.; Sanesi, G.; Davies, C. Benefits and Well-Being Perceived by People Visiting Green Spaces in Periods of Heat Stress. Urban For. Urban Green. 2009, 8, 97–108. [Google Scholar] [CrossRef]


| Data | Source | Year |
|---|---|---|
| CBERS-4A images | National Institute for Space Research (INPE) | 2022 |
| Goiânia Territorial Planning Units (TPUs) | Brazilian Institute of Geography and Statistics (IBGE) | 2010 |
| Census Data | Brazilian Institute of Geography and Statistics (IBGE) | 2010 |
| Percentage of Urban Greening in the TPUs | Priority for Afforestation | Description | Assigned Value to Urban Greening Percentage Classes |
|---|---|---|---|
| <10 | High | Areas where access to ecosystem services provided by urban greening is highly restricted, being a local indicator of improper environmental justice for citizens and low resilience to climate change. In this context, the priority for afforestation projects in such areas is maximum. | 40 |
| 10–20 | Moderate to High | Areas that represent a transition range between poor and moderate conditions for the provision of ecosystem services by urban greening in the context of environmental justice. Resilience is still considered low and afforestation projects have high priority. | 30 |
| 20–30 | Moderate to Low | Areas with an acceptable presence of urban greening but still need vegetation improvements to contribute to an effective supply of ecosystem services for environmental justice. | 20 |
| >30 | Low | Areas where urban forests and green spaces have a greater capacity to provide ecosystem services to their residents, indicating positive resilience in facing climate change and greater positive influence on environmental justice. | 10 |
| Indicators That Compose the Diagnosis of Social Vulnerability | ||
|---|---|---|
| Cluster | Parameter | Description |
| Housing and sanitation | Percentage of non-owned households | Owned homes imply less vulnerability as they avoid the impacts of rent payment. |
| Percentage of households without access to the water supply network | Household quality indicator regarding basic sanitation | |
| Percentage of households without solid waste collection | Household quality indicator regarding basic sanitation | |
| Percentage of households without access to electricity supply | Household quality indicator regarding economic development | |
| Percentage of households without access to the sewerage network | Household quality indicator regarding basic sanitation | |
| Percentage of households with 5 (five) or more residents | Home comfort indicator | |
| Income | Percentage of households with per capita income below 2 minimum wages | Quality of life indicator, considering that per capita income below 2 minimum wages results in social risk and decreased well-being. |
| Education | Percentage of literate people aged 15 years or older | Minimum educational quality indicator |
| Social Vulnerability Value | Social Vulnerability Classes |
|---|---|
| >0.367 | high vulnerability |
| 0.319–0.367 | moderate to high vulnerability |
| 0.285–0.319 | moderate to low vulnerability |
| <0.285 | low vulnerability |
| Urban Greening Percentage Classes | Social Vulnerability | |||
|---|---|---|---|---|
| 1 | 2 | 3 | 4 | |
| 10 | 11 | 12 | 13 | 14 |
| 20 | 21 | 22 | 23 | 24 |
| 30 | 31 | 32 | 33 | 34 |
| 40 | 41 | 42 | 43 | 44 |
| Resulting Values | Map Legend | Classes of Priority for Afforestation |
|---|---|---|
| 34, 43, 44 | High Priority | |
| 14, 23, 24, 33, 42 | Moderate to High Priority | |
| 13, 22, 31, 32, 41 | Moderate to Low Priority | |
| 11, 12, 21 | Low Priority |
Disclaimer/Publisher’s Note: The statements, opinions and data contained in all publications are solely those of the individual author(s) and contributor(s) and not of MDPI and/or the editor(s). MDPI and/or the editor(s) disclaim responsibility for any injury to people or property resulting from any ideas, methods, instructions or products referred to in the content. |
© 2025 by the authors. Licensee MDPI, Basel, Switzerland. This article is an open access article distributed under the terms and conditions of the Creative Commons Attribution (CC BY) license (https://creativecommons.org/licenses/by/4.0/).
Share and Cite
Guerrero, J.V.; Escobar-Silva, E.V.; Almeida, C.M.d.; Caiche, D.; dos Santos, A.M.; Nunes, F.G. Mapping Priority Areas for Urban Afforestation Based on the Relationship Between Urban Greening and Social Vulnerability Indicators. Forests 2025, 16, 936. https://doi.org/10.3390/f16060936
Guerrero JV, Escobar-Silva EV, Almeida CMd, Caiche D, dos Santos AM, Nunes FG. Mapping Priority Areas for Urban Afforestation Based on the Relationship Between Urban Greening and Social Vulnerability Indicators. Forests. 2025; 16(6):936. https://doi.org/10.3390/f16060936
Chicago/Turabian StyleGuerrero, João Vitor, Elton Vicente Escobar-Silva, Cláudia Maria de Almeida, Daniel Caiche, Alex Mota dos Santos, and Fabrízia Gioppo Nunes. 2025. "Mapping Priority Areas for Urban Afforestation Based on the Relationship Between Urban Greening and Social Vulnerability Indicators" Forests 16, no. 6: 936. https://doi.org/10.3390/f16060936
APA StyleGuerrero, J. V., Escobar-Silva, E. V., Almeida, C. M. d., Caiche, D., dos Santos, A. M., & Nunes, F. G. (2025). Mapping Priority Areas for Urban Afforestation Based on the Relationship Between Urban Greening and Social Vulnerability Indicators. Forests, 16(6), 936. https://doi.org/10.3390/f16060936