Article

Summer Drought Delays Leaf Senescence and Shifts Radial Growth Towards the Autumn in Corylus Taxa

by
Kristine Vander Mijnsbrugge
1,*,
Art Pareijn
1,
Stefaan Moreels
1,
Sharon Moreels
1,
Damien Buisset
1,
Karen Vancampenhout
2 and
Eduardo Notivol Paino
3
1
Department of Forest Ecology and Management, Research Institute for Nature and Forest, 9500 Geraardsbergen, Belgium
2
Department of Earth and Environmental Sciences, KU Leuven Campus Geel, Kleinhoefstraat 4, 2440 Geel, Belgium
3
Department for Environment, Agricultural and Forest Systems, Agri-Food Research and Technology Centre of Aragon (CITA), 50059 Zaragoza, Spain
*
Author to whom correspondence should be addressed.
Forests 2025, 16(6), 907; https://doi.org/10.3390/f16060907
Submission received: 28 April 2025 / Revised: 18 May 2025 / Accepted: 27 May 2025 / Published: 28 May 2025
(This article belongs to the Section Forest Meteorology and Climate Change)

Abstract

:
Background: Understanding the mechanisms by which woody perennials adapt to extreme water deficits is important in regions experiencing increasingly frequent and intense droughts. Methods: We investigated the effects of drought severity in the shrubs Corylus avellana L., C. maxima Mill., and their morphological intermediate forms, all from local Belgian origin, and C. avellana from a Spanish-Pyrenean origin. Potted saplings in a common garden were not receiving any water for a duration of 30 days in July 2021 and developed a range of visual stress symptoms. We assessed responses across the various symptom categories. Results: Droughted plants senesced later than the controls (up to 6 days). The most severely affected plants disproportionately displayed the longest delay (21 days). The delayed leaf senescence was reflected in the subsequent bud burst which was delayed for the droughted plants, with again the largest delay observed for the most severely affected plants. Interestingly, radial growth shifted towards the autumn among the drought-treated plants, suggesting compensation growth after growing conditions normalized. The Spanish-Pyrenean provenance, characterized by smaller plants with smaller leaves, developed visual drought symptoms later than the local provenance during the drought. Conclusions: The results indicate that severe early summer drought, followed by rewatering, not only diminishes radial growth but also prolongs the growth period, and delays leaf senescence. A prolonged time frame for radial growth and a delayed leaf senescence indicate a longer period in which carbon is incorporated in woody tissue or in non-structural carbohydrates. This can help the fine tuning of carbon sequestration modeling. The Pyrenean provenance, adapted to high altitude, holds an advantage under water-limited conditions.

1. Introduction

Prolonged and intensified drought conditions have already contributed to rising tree mortality in forests [1,2] and have heightened susceptibility to additional biotic and abiotic stressors [3,4]. In addition, trees that are exposed to drought become more vulnerable to secondary pathogens [5]. The way trees recover from drought stress will play a more important role in the future when extreme climate events will increase in frequency and severity, which will have long lasting effects on forest functioning [6]. After a drought, its effects can continue to persist in various ways [7]. These lingering effects following a drought, known as “drought legacies” [8], have been observed across multiple aspects of various ecosystems including influences on carbon and nitrogen cycling, growth, phenology, species composition, herbivory, and soil properties (reviewed by [6]).
Drought stress induces several adjustments in trees. Stomatal closure is the first reaction, which is reversible [9]. Under prolonged drought stress, trees have to compromise between hydraulic safety (avoiding hydraulic failure) and carbon uptake (physiological maintenance) [10]. Drought stress can trigger early leaf senescence, which functions as an adaptive strategy to reduce nutrient loss and improve survival chances [11]. This drought-induced senescence involves chlorophyll breakdown followed by leaf abscission and can resemble the visual appearance of seasonal autumn senescence [12]. As this process progresses, nutrients from the earliest senescing leaves are redistributed in the plant to support still-functioning essential organs, such as remaining leaves, flowers, or fruits [11]. Under severe drought conditions, rapid leaf shedding may occur to avoid catastrophic xylem embolism, when air bubbles block the xylem conduits [13]. In this case, nutrient resorption may be hampered, resulting in net nutrient losses and potentially jeopardizing long-term tree health [12]. In various woody angiosperms, browning of leaves correlated with declining leaf water potential, indicating that reduced hydraulic conductivity played a key role in progressive leaf mortality [14,15]. When severe drought persists, trees finally dy. Drought-induced tree mortality has been related to xylem hydraulic failure among multiple tree species, whereas evidence of carbon starvation, an imbalance between carbohydrate demand and supply, as a cause of death was not universal [16].
The capability of a tree for post-drought recovery depends on the severity of stress exposure. If no structural damage occurred, physiological functions can resume upon rehydration [17]. However, when the drought caused tissue damage, energy and carbon must be redistributed within the plant, often resulting in incomplete recovery and reduced future growth [17]. Severe drought-induced defoliation leads to dieback in parts of the crown and an increased risk of tree mortality in the following years [9]. Nevertheless, some species exhibit compensatory recovery, where growth reductions or physiological impairments are counterbalanced by increased investment in alternative tissues or processes [17]. For example, Fagus sylvatica L. saplings have been observed to delay autumnal leaf senescence following drought stress, extending photosynthetic activity [18]. Post-drought compensatory growth has been documented in several species, including oak (Quercus spp.) [19,20] and Douglas fir (Pseudotsuga menziesii (Mirb.) Franco [21], suggesting that under favorable conditions after the drought, trees can partially offset lost growing time.
Leaf phenology in woody species influences the global carbon assimilation in temperate and boreal forests [22,23]. Environmental change can drive selection on the timing of spring leaf unfolding and autumn leaf senescence, potentially influencing future population dynamics [24]. These key phenological events in trees are thus adaptive and display inter-population variation in response to local environmental conditions [25]. The timing of spring bud burst exhibits a predominant response to temperature [26], whereas the timing of autumnal leaf senescence is mainly responsive to temperature and day length [27,28]. When comparing these two phenophases, bud burst was found to be more genetically determined than leaf senescence [29]. In contrast to bud burst, the environmental determinants of autumnal leaf senescence remain less well understood [30]. Still, a thorough understanding of the key processes regulating spring bud burst and autumn leaf senescence under water-limited conditions is important for accurately forecasting future carbon fluxes.
In this study, we investigated drought-induced responses in the Corylus taxa. Corylus avellana L., commonly known as hazel or common hazel, is a widespread and ecologically significant shrub species native to Europe and Western Asia [31]. It occurs throughout most of South-Central Europe, extending northwards to southern Scandinavia and eastwards to the central Ural Mountains, the Caucasus, and northwestern Iran. Hazel typically grows in forest margins and openings, and is often part of the forest understory [31]. Frequently, it is found in scrubs and hedgerows. This species thrives in various soil conditions, preferring neutral to alkaline, nutrient-rich soils. C. avellana has also been cultivated for centuries due to its edible kernels, and this long-term selection has led to the development of varieties with larger nuts [32,33].
Corylus maxima Mill. is native in southeastern Europe and southwestern Asia. The species is non-indigenous to Belgium but was planted as an ornamental [34]. C. avellana and C. maxima can hybridize [35]. While the morphology of the leaves is similar, nut morphology differs between the two species. In C. maxima, nuts are long and the tubular involucre in which the nuts reside measures two times the length of the nut. In C. avellana, the involucre is short and it surrounds from three-quarters up to the total length of the nut, but no more [34].
We conducted an experiment in which young potted plants were subjected to summer drought stress through complete water withholding, followed by a saturating rewatering. The drought period was halted when a variety of visual drought symptoms were observed among the treated plants. In this way, the drought response and recovery could be examined in plants, ranging from no visual stress symptoms to plants exhibiting severe leaf shedding. In the common garden, two origins of C. avellana were present: a Belgian (local) and a Spanish-Pyrenean population. Also, a Belgian population of C. maxima and a Belgian population of morphological intermediate forms between C. avellana and C. maxima were included. We hypothesized that (i) plants would exhibit drought-induced alterations in growth patterns and in subsequent phenological events, and that (ii) the responses would be taxa- and/or origin-dependent. We assessed the onset of visible stress symptoms, drought-induced changes in growth, post-drought recovery dynamics, autumn leaf senescence, and bud burst in the next spring.

2. Materials and Methods
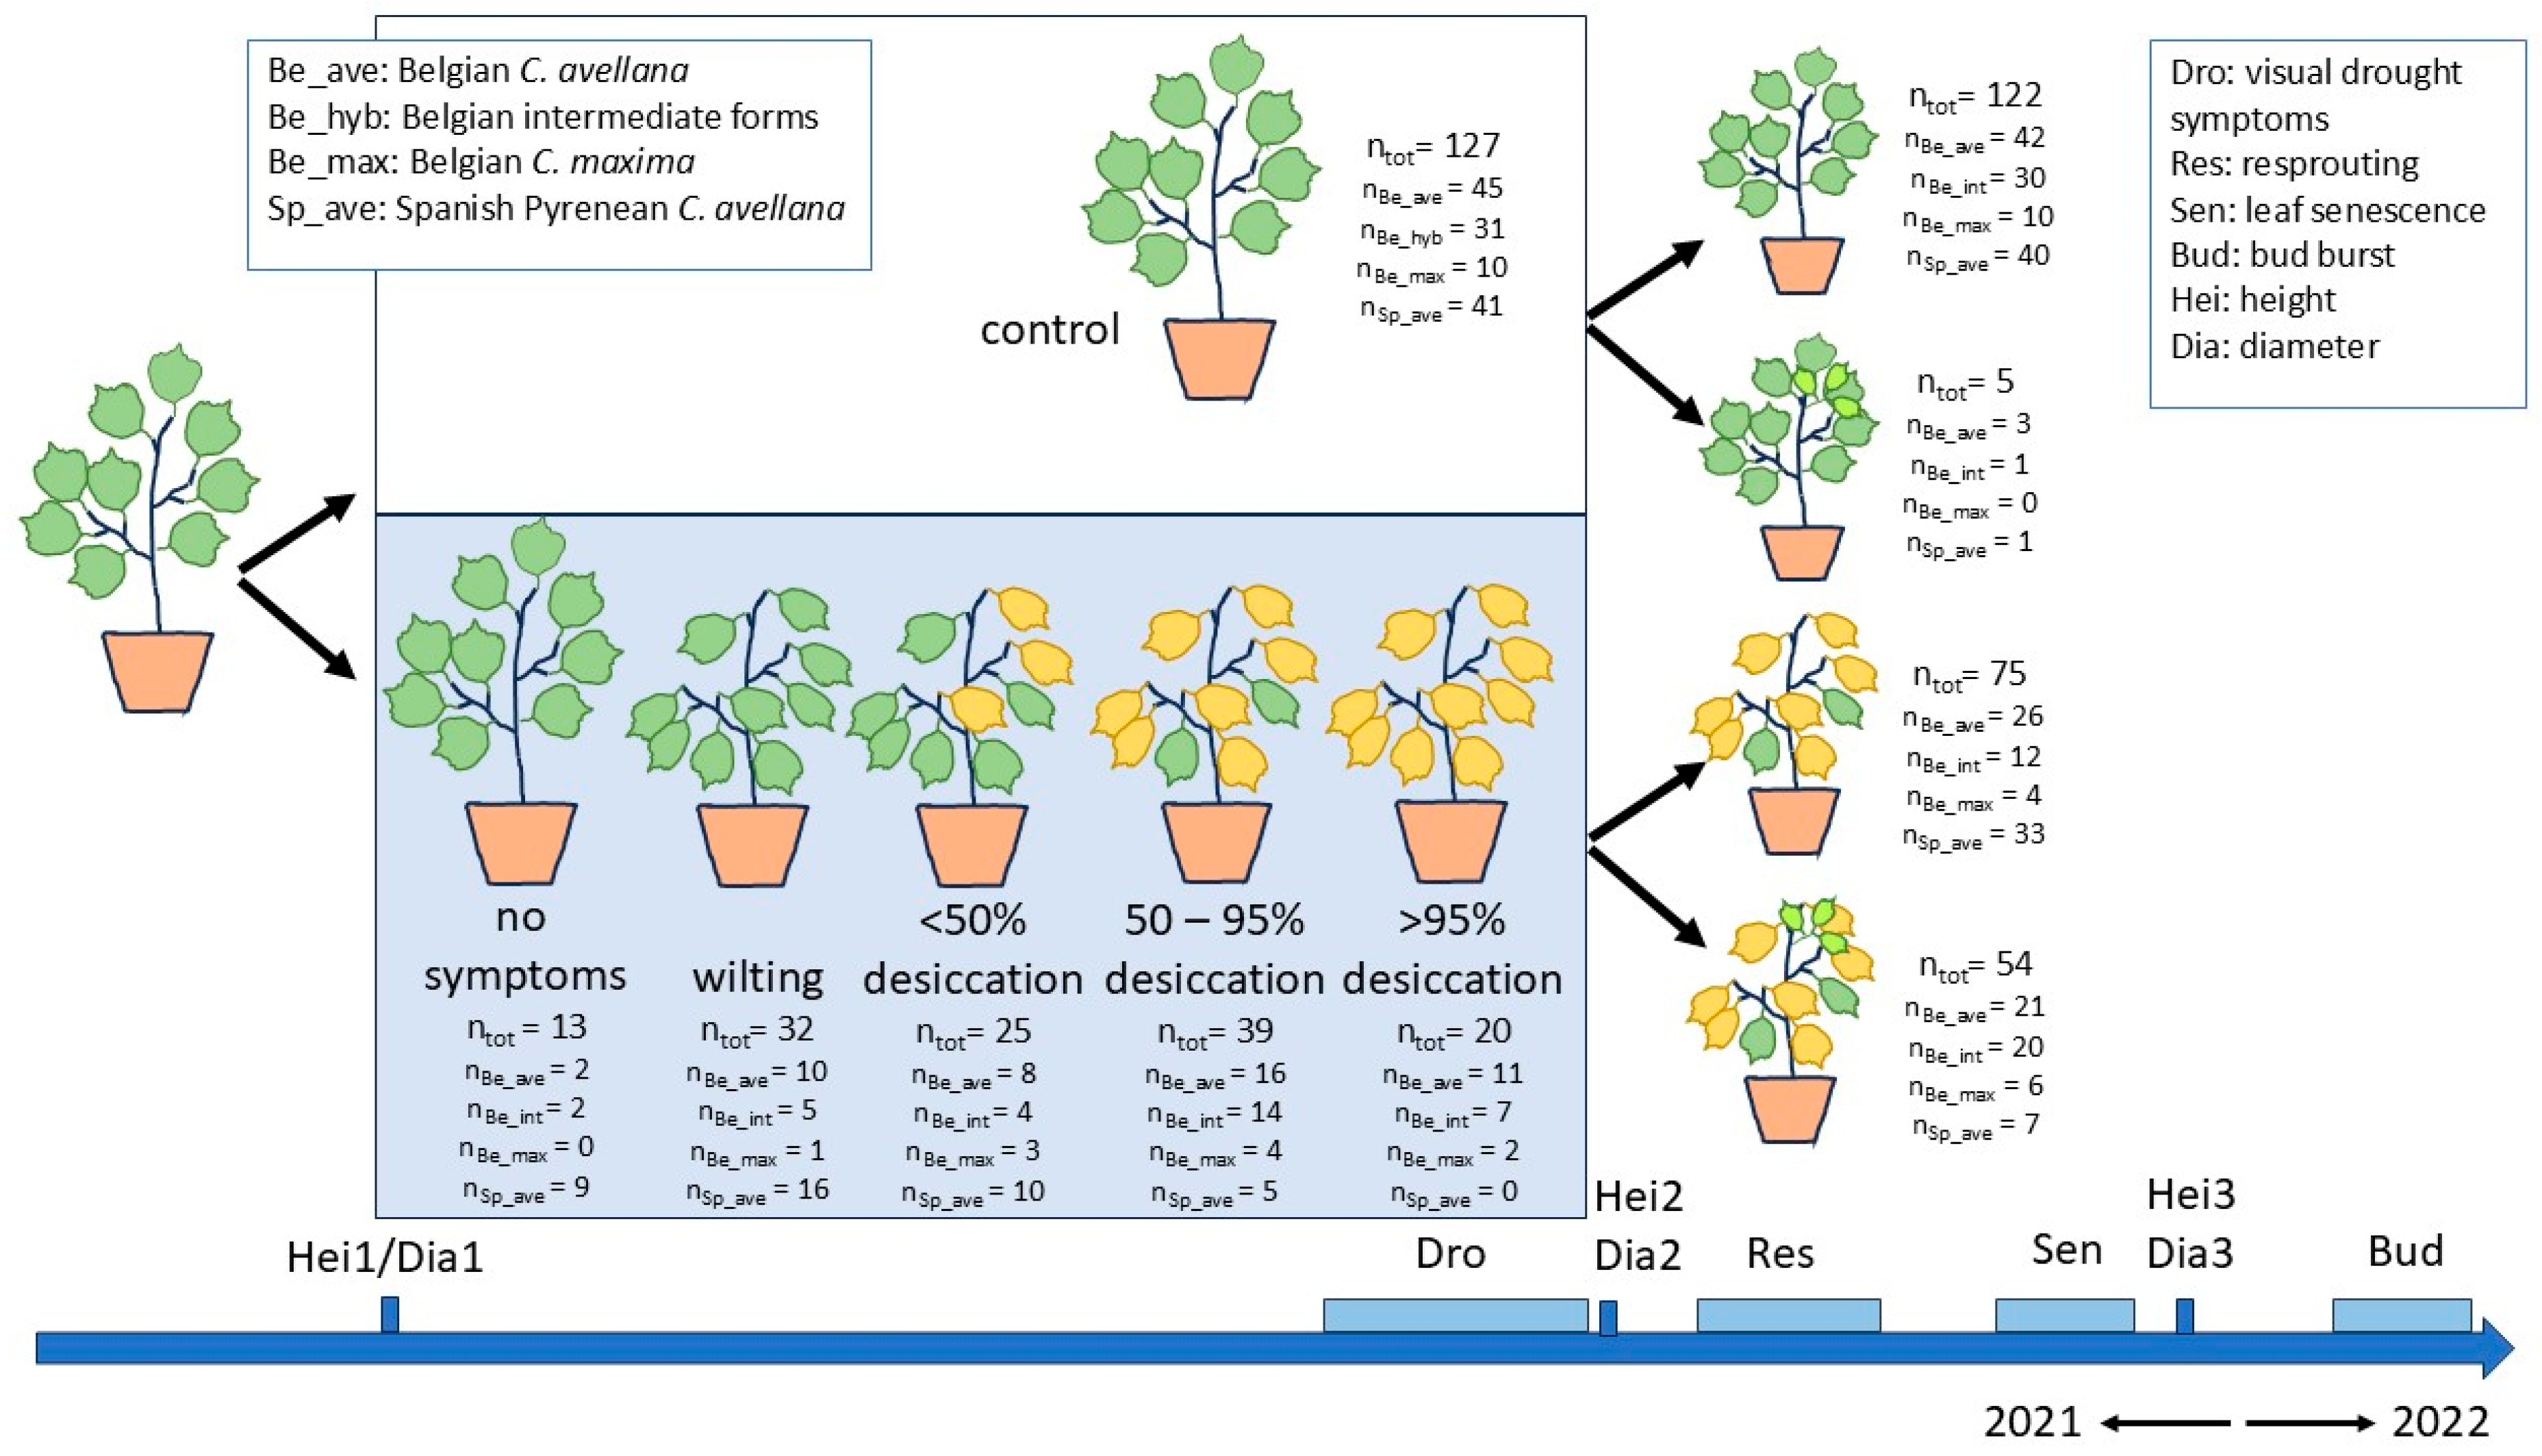
2.1. Plant Material

We established a common garden consisting of 256 potted Corylus spp. plants, with 92 and 81 C. avellana originating from Belgium (Lat 50.947929, Lon 3.765214 24, Alt 24 m) and from the Spanish Pyrenees (Lat 42.630049, Lon −0.169068, Alt 1270 m), respectively, with, additionally from Belgium, 20 C. maxima plants (Lat 50.992723, Lon 3.775170, Alt 19 m) and 63 plants derived from mother shrubs with intermediate morphology between C. avellana and C. maxima (Lat 50.965736, Lon 3.693461, Alt 10 m). Intermediate forms of the mother shrubs were evaluated based on the size of nuts and involucres. The local climate, day length (Figure S1), and seed collection procedures for each region and taxon were previously described [36]. In brief, nuts were collected in 2016 and germinated in 2017. The seedlings were grown in forestry trays (54.5 × 31 cm, 28 cells) and later on in pots. Standard nursery potting soil was used (NPK 12 + 14 + 24 at 1.5 kg/m3, 20% organic matter, pH 5.0–6.5, electrical conductivity of 450 µS/cm, and 25% dry matter content) with no added fertilizer.
In 2018, seedlings were exposed to a temperature treatment. The effects of this treatment were gone by 2020 [36]. In 2019, plants were transferred to 1 L pots and an outdoor common garden was established on a container field at the Research Institute for Agriculture and Fisheries (Melle, Belgium). The different regions and taxa were intermingled randomly (single tree plot). In early 2020, the plants were transferred into 4 L pots. It should be noted that the same size of the pots created uniform growing conditions for the underground parts of all plants, although root growth was also restricted to the available volume of the pots.

2.2. Drought Treatments

In June 2021, all 256 plants were relocated to a greenhouse. A drought experiment was conducted from 29 June to 29 July 2021. At the beginning and at the end of this period, all plants (control and drought-treated) were completely hydrated. For this, pots were immersed during the night in a basin with the water level 5 cm above the bottom of the pots. The next morning, the excess water drained naturally, and pots approximated field capacity.
Throughout the drought, half of the plants were regularly watered by experienced technicians (control group, n = 127), while the other half received no water (drought-treated group, n = 129). The two regions (Belgian and Spanish-Pyrenean) and three taxa (C. avellana, C. maxima, and group of intermediate forms) were equally distributed between the control group and the droughted group (Figure 1) and intermingled at random. The drought treatment was terminated when various visible drought stress symptoms, ranging from no symptoms up to nearly total desiccation, were obvious among the treated plants (Figure 1). Termination of the treatment at this point also avoided mortality. Inevitably, the control plants were separated spatially from the drought-treated plants during the treatment. The putative bias that this could have caused was considered negligible.
After the drought treatment, all plants were maintained under well-watered conditions in the greenhouse until January 2022. Then, the plants were planted at a test site in Grimminge, Belgium. All treatment groups were randomly intermingled following a single tree plot design.

2.3. Observations and Measurements

A series of measurements and observations were conducted. Pots were weighed at the start of the experiment and approximately weekly throughout the treatment period (Figure 2). The decrease in pot weight indicated the water shortage that the droughted plants experienced.
Plant height and stem diameter were measured at the beginning of the treatment (29 June), one week after ending the treatment (9 August), and again when the plants had entered winter rest (8 December). For height, only the living part of the stem was measured (some plants lost height due to the drought). The stem diameter was measured 2 cm above the soil using a measuring rod. Change in height and diameter were calculated for the period of drought (subtracting measurements on 29 June from 9 August) and for the post-drought period (subtracting measurements on 9 August from 8 December).
Among the droughted plants, visual stress symptoms (wilting and desiccation of the leaves) were assessed during the treatment period on 19, 22, 26, and 29 July. The scoring system was as follows: (1) normal plant, (2) leaves wilting, not yet desiccating, (3) less than 50% desiccated leaves, (4) 50%–95% desiccated leaves, and (5) more than 95% of leaves desiccated (Figure 1). All observation were performed by the same person, avoiding any inter-observer bias. All plants survived the treatment.
The appearance of new shoots, called “resprouting”, in the young crowns was scored after the drought in all plants, both controls and drought-treated, using the following scoring scale: (1) normal buds, (2) leaves emerging, not yet unfolding, (3) leaves unfolding, (4) small unfolded leaves, (5) enlarging leaves and shoot growth. Resprouting was assessed on 9 and 16 August, after which no further resprouting was observed. From the observation on 16 August, a binary variable was generated (0 = no resprouting (score 1); 1 = resprouting (scores > 1)).
The development of small new shoots with newly formed leaves at the base of the stem after the treatment was observed separately using an absence/presence variable on 23 August.
Autumn leaf senescence was monitored as follows: (1) green leaves, (2) light green leaves, (3) <50% yellowing leaves, (4) <50% of leaves becoming brown, and (5) majority of the leaves becoming brown [36]. Senescence was recorded on 19 October, 8 November, and 9 December.
In the spring of 2022, bud burst was monitored as follows: (1) normal winter buds, (2) buds swelling, (3) buds opening, first leaves emerging but not yet unfolding, (4) leaves unfolding, and (5) leaves unfolded [36]. Bud burst was assessed on 17 and 28 March, and 14 and 25 April. For leaf senescence as well as for bud burst, a mean score was assigned to each plant based on the evaluation of the entire young crown (i.e., all non-desiccated leaves or all buds).
For all the control plants, two damage-free leaves were selected, one on a representative long shoot at the top of the plant and one on a representative short shoot located centrally on the plant, in the summer of 2021. The leaf lamina length and widest width were measured.
From the control group, 69 plants were randomly selected (18 Belgian C. avellana, 21 Spanish-Pyrenean C. avellana, 21 Belgian intermediate forms, and 9 Belgian C. maxima). Stomatal density and stomatal length were counted and measured on the underside of a representative leaf that was sampled on a short shoot located centrally on the plant. A translucent nail varnish imprint was made on the central area of the leaf, avoiding any veins. The imprints were examined using a Keyence VHX-7000 digital microscope (Keyence Corporation, Osaka, Japan). For each imprint, stomata were counted in two randomly selected 0.0454 mm2 squares, and five randomly chosen stomata were measured within each square.

2.4. Statistics

We conducted all statistical analyses using R version 4.4.3. [37]. Linear models were employed for height, diameter, and their increments, and relative chlorophyll content, as well as for leaf size and stomatal size measurements. For the absence or presence of post-drought resprouting, we applied logistic regression models [38]. Cumulative logistic regression, in the ordinal package [39], was applied to analyze phenological observations (visual stress symptoms, resprouting, leaf senescence, and bud burst). Figures were generated with ggplot2 [40]. Where applicable, repeated measurements on the same plants were accounted for by using mixed-effects models with a unique plant identifier as a random effect. Mixed-effects models are particularly suited for ecological data as they account for nested structures, handle unbalanced datasets, and incorporate random effects [41]. In specific cases, the data from different treatment groups were pooled. In all such cases, this was done because of too few plants in the individual groups to allow statistical processing.
At the start of the experiment, height (Hei1) and diameter (Dia1) were modeled for all plants to assess any initial growth differences between the regions and taxa (RegTax: Belgian C. avellana, Spanish-Pyrenean C. avellana, Belgian intermediates, and Belgian C. maxima). The same formula structure was applied, with HD indicating both Hei1 and Dia1:
HD = β0 + β1RegTax
The leaf morphological traits lamina length (Lle) and lamina widest width (Lww), both on short and long shoots, were measured on all control plants to examine the influence of the region of origin and/or the taxon. The same formula structure was applied, with LA indicating both Lle and Lww:
LA = β0 + β1RegTax
The leaf morphological traits stomatal density (Sde) and stomatal size (Ssi) were counted and measured on a subset of control plants to examine the influence of the region of origin and/or the taxon. The same formula structure was applied, with ST indicating both Sde and Ssi:
ST = β0 + β1RegTax
The development of visual drought symptoms (Dro) was modeled with the probability (p) of maximally reaching a given drought score level as a function of the day of observation (Day), the region and taxon (RegTax), and initial height (Hei1):
(pDro/1 − pDro) = β0 − β1Day − β2RegTax − β3Hei1
For post-drought resprouting (Res), we focused on whether plants resprouted or not (Res1) and the timing of resprouting (Res2). For all plants, both controls and drought-treated, the likelihood of resprouting in the young crowns after the end of the treatment (pRes1) was modeled using logistic regression. The model examined the influence of drought symptoms (Dro), the region and taxon (RegTax), and initial height (Hei1). For the Dro variable, all control plants got a score of 1, indicating no visual drought symptoms.
(pRes1/1 − pRes1) = β0 + β1Dro + β2RegTax + β3Hei1
For the plants displaying resprouting after the treatment (n = 54 for stressed plants, n = 5 for control plants, Figure 1), the timing of resprouting (Res2) was modeled. Due to the small number of resprouting plants across the different visual drought symptom categories, the lower drought scores were pooled: no to mild symptoms (pooled Dro scores 1, 2, and 3, n = 10), and severe symptoms (pooled Dro scores 4 and 5, n = 44). Additionally, as too few plants remained in the different regions of origin and taxa, this variable was not retained in the model. The model included Day (the day of observation), Dro_adj (the adjusted symptoms variable with the pooled scores), and Hei1 (the initial height):
(pRes2/1 − pRes2) = β0 − β1Day − β2Dro_adj − β3Hei1
For all plants, the likelihood of forming new shoots at the base of the stem (pSst) after the treatment was modeled, examining the influence of drought symptoms using the variable with the pooled drought scores as defined above (Dro_adj), and the initial height (Hei1).
(pSst/1 − pSst) = β0 − β1Dro_adj − β2Hei1
Leaf senescence (Sen) was modeled for both control and droughted plants. The probability of maximally reaching a given senescence score on a given day (pSen) was modeled as a function of Day, Dro (including control plants with a Dro score of 1), the region and taxon (RegTax), and Hei3 (the height of the plants at winter rest):
(pSen/1 − pSen) = β0 − β1Day − β2Dro − β3RegTax − β4Hei3
The calculation of the day when half of the plants in a given drought score group maximally reached a given senescence score (Day50%) was based on the model statistics:
Day50% = (β0 − β2 − β3 − β4mHei3)/β1
with mHei3 indicating the mean height in winter.
The modeled time span between two groups with different drought symptoms was calculated by subtracting their respective Day50% values.
Bud burst (Bud) in the following spring was modeled with Day, Dro (including the control plants with Dro score 1), the region and taxon (RegTax), and Hei3 (the height of the plants at the end of the growing season):
(pBud/1 − pBud) = β0 − β1Day − β2Dro − β3RegTax − β4Hei3
By applying linear mixed models, the change in height (Hin) and diameter (Din) over time were modeled. The data included the change in height/diameter between the beginning and the end of the treatment, and the change in height/diameter between the end of the treatment and the end of the growing season. We do not use the term increment as the height diminished for the more severely affected plants. The models included the time variable (Tim, categorical with two levels: during the treatment and after), the visual drought symptoms (Dro, with the controls having score 1), the region and taxon (RegTax), and the initial height (Hei1) or diameter (Dia1).
Hin = β0 + β1Tim + β2Dro + β3TimDro + β4RegTax + β5Hei1
Din = β0 + β1Tim + β2Dro + β3TimDro + β4RegTax + β5Dei1
The interaction term between the time variable (Tim) and the drought score level (Dro) allowed that the ratio between the change in height/diameter in the first period (drought) and the change in height/diameter in the second period (post-drought) could vary among the different drought score levels.

3. Results

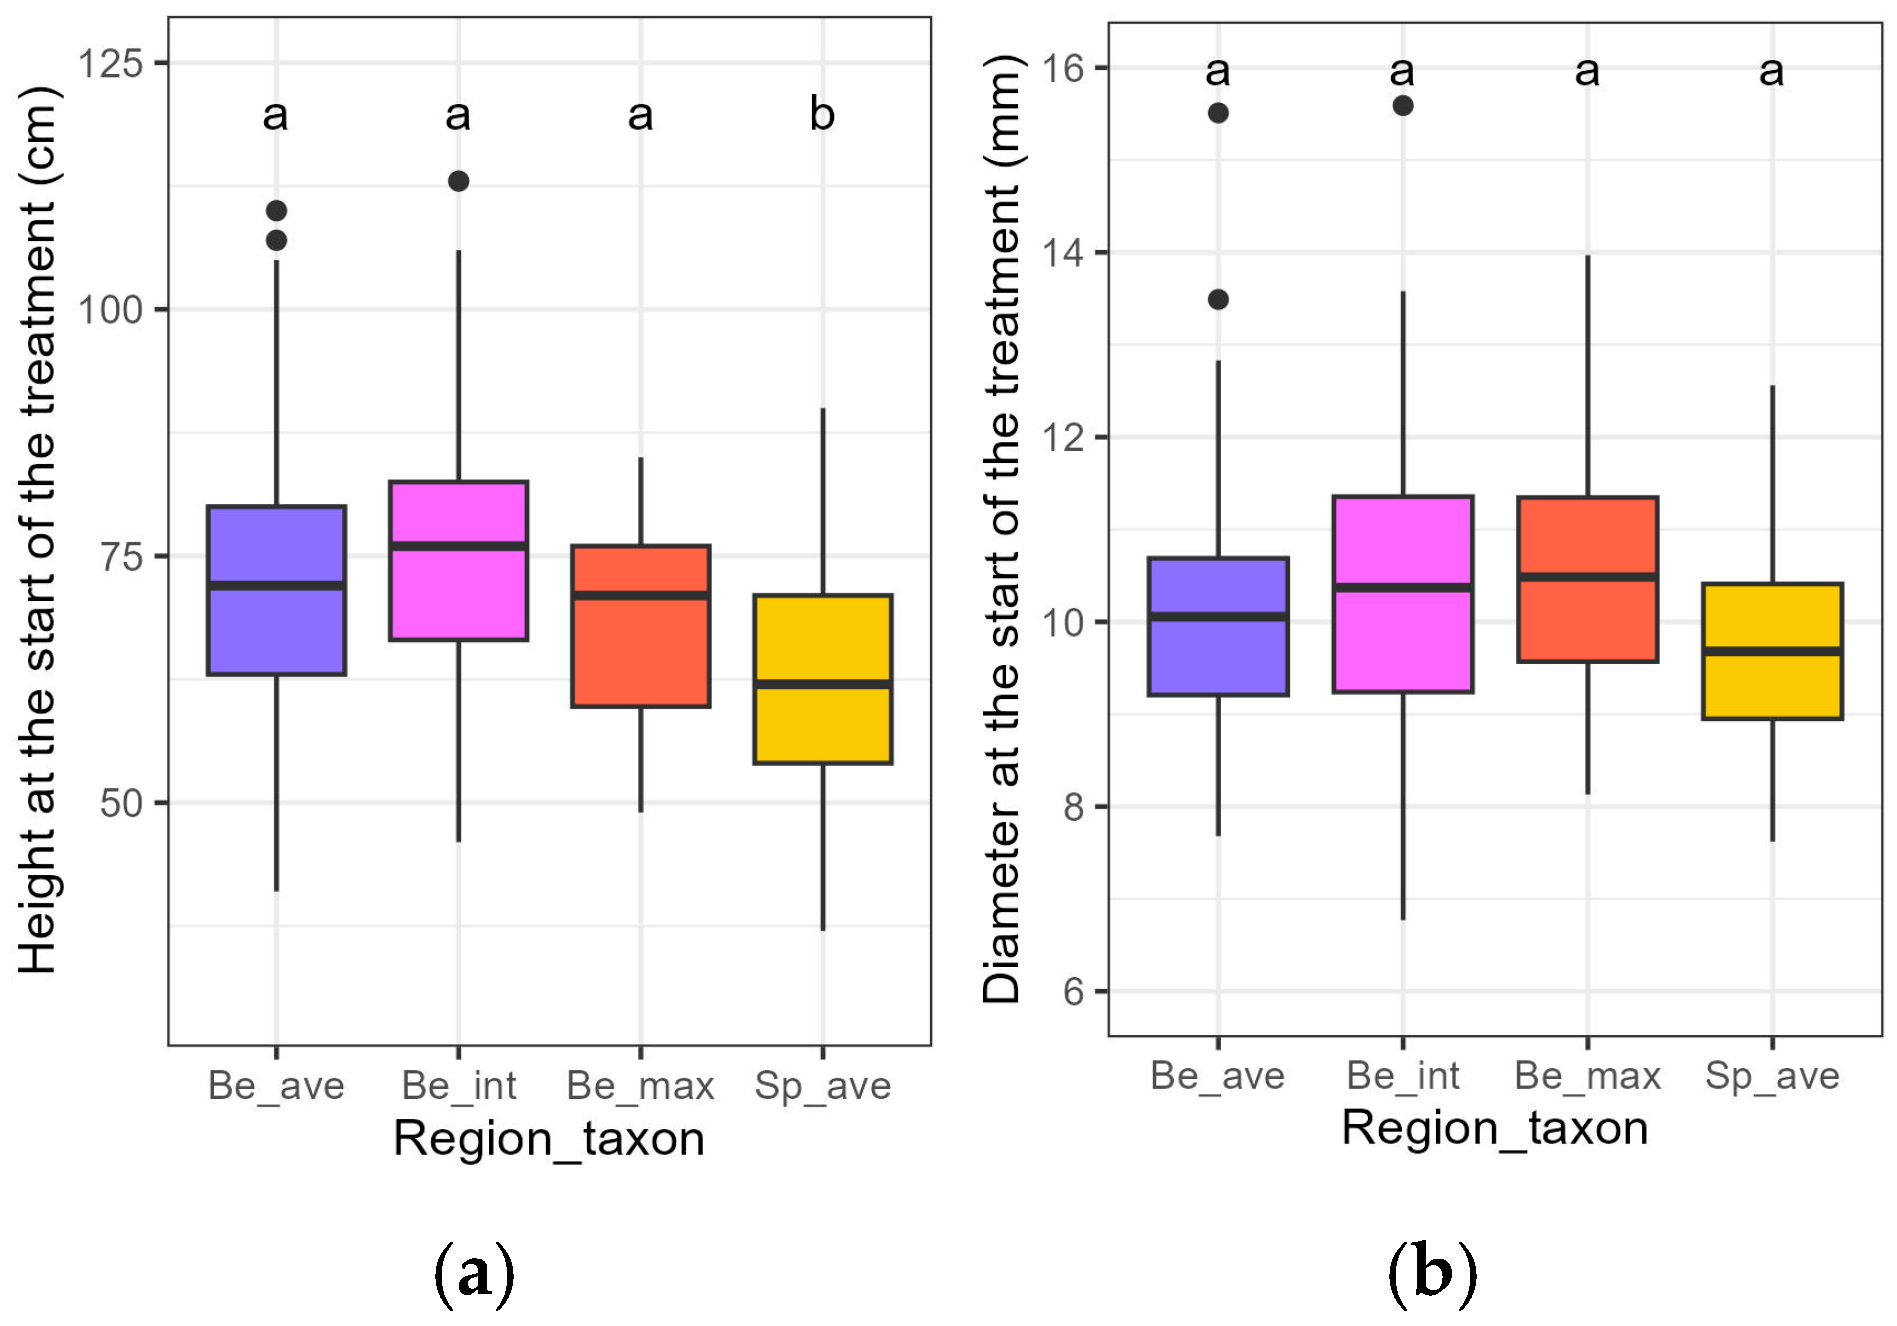
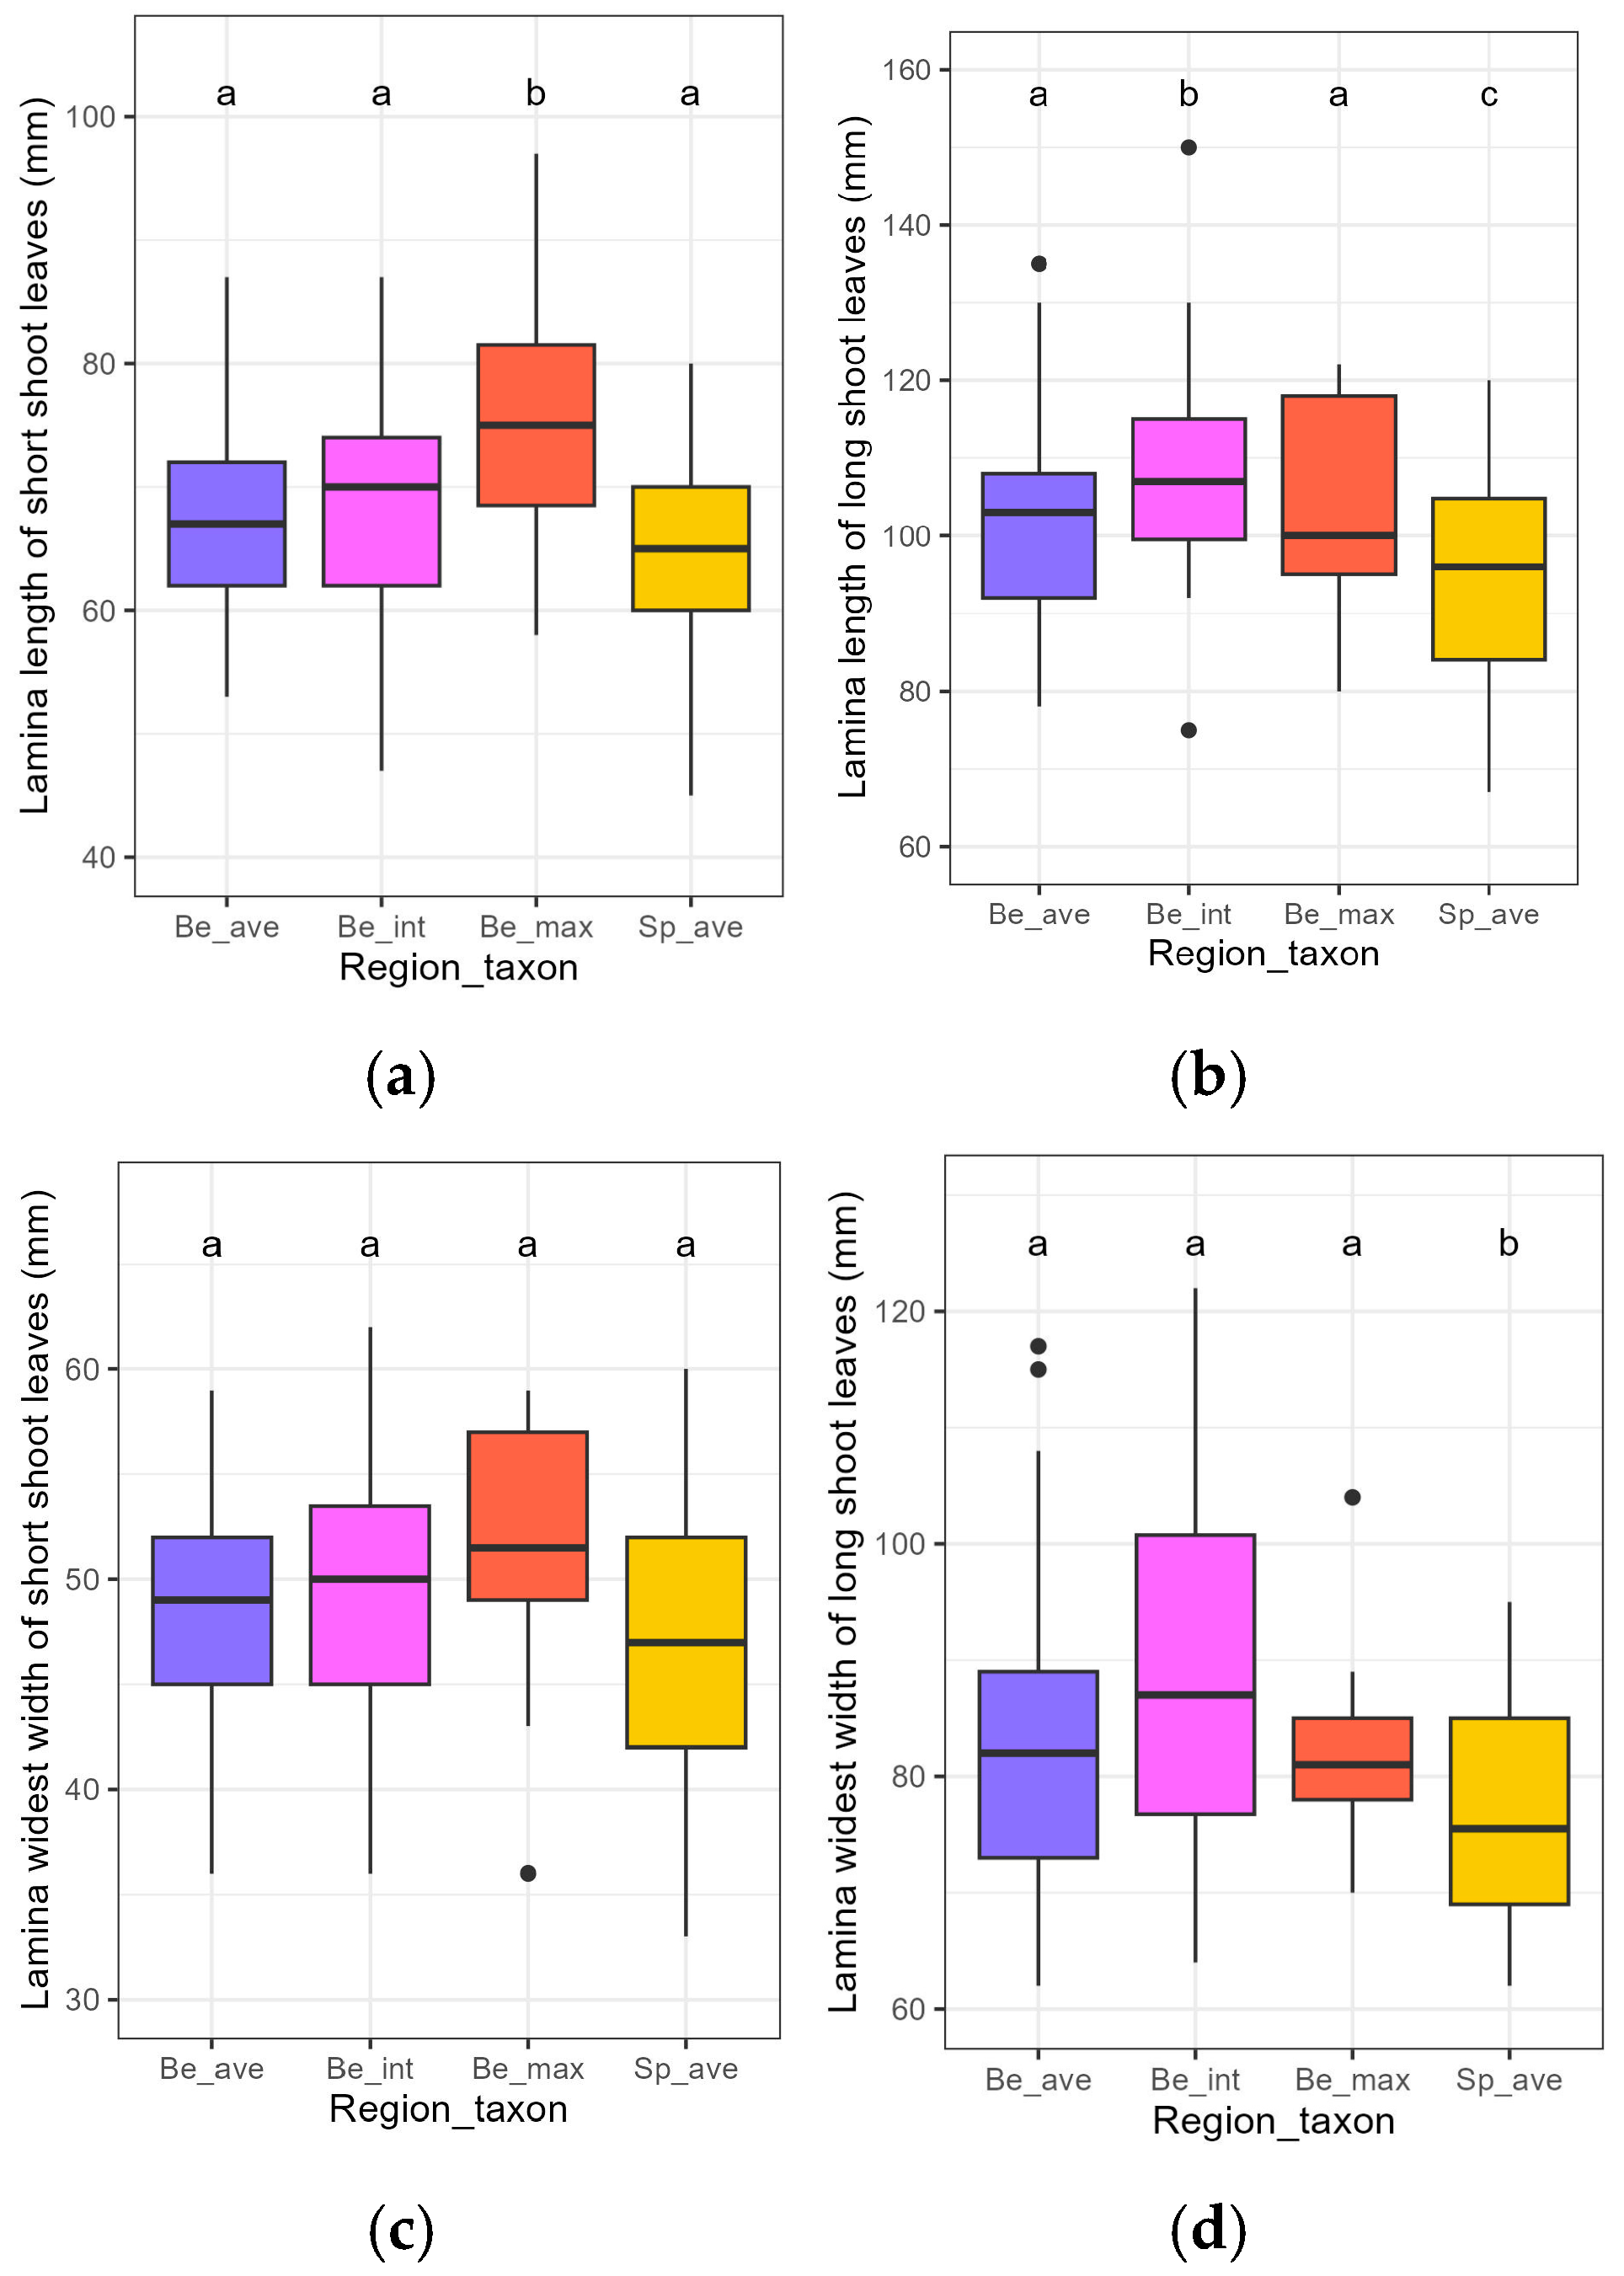
3.1. Initial Traits of the Plants

Before the treatment, plants from the different Belgian taxa did not differ from each other in height. Only the Spanish-Pyrenean C. avellana was significantly smaller than the Belgian C. avellana (significant region-taxon in Table 1, Figure 3a). For stem diameter, none of the region-taxa differed significantly from the Belgian C. avellana (Table 1, Figure 3b). Several leaf morphological variables differed slightly among the region-taxa (Figure 4, Table 2). Short shoot leaves were longer for the Belgian C. maxima, whereas the long shoots leaves were longer for the Belgian morphological intermediates and smaller for the Spanish-Pyrenean C. avellana when compared with the Belgian C. avellana. When looking at the maximum width of the leaves, only the long shoot leaves were less wide for the Spanish-Pyrenean C. avellana.
Stomatal density and stomatal length in the Belgian C. avellana showed no significant differences compared to the other region-taxa (Figure S2, Table S1).

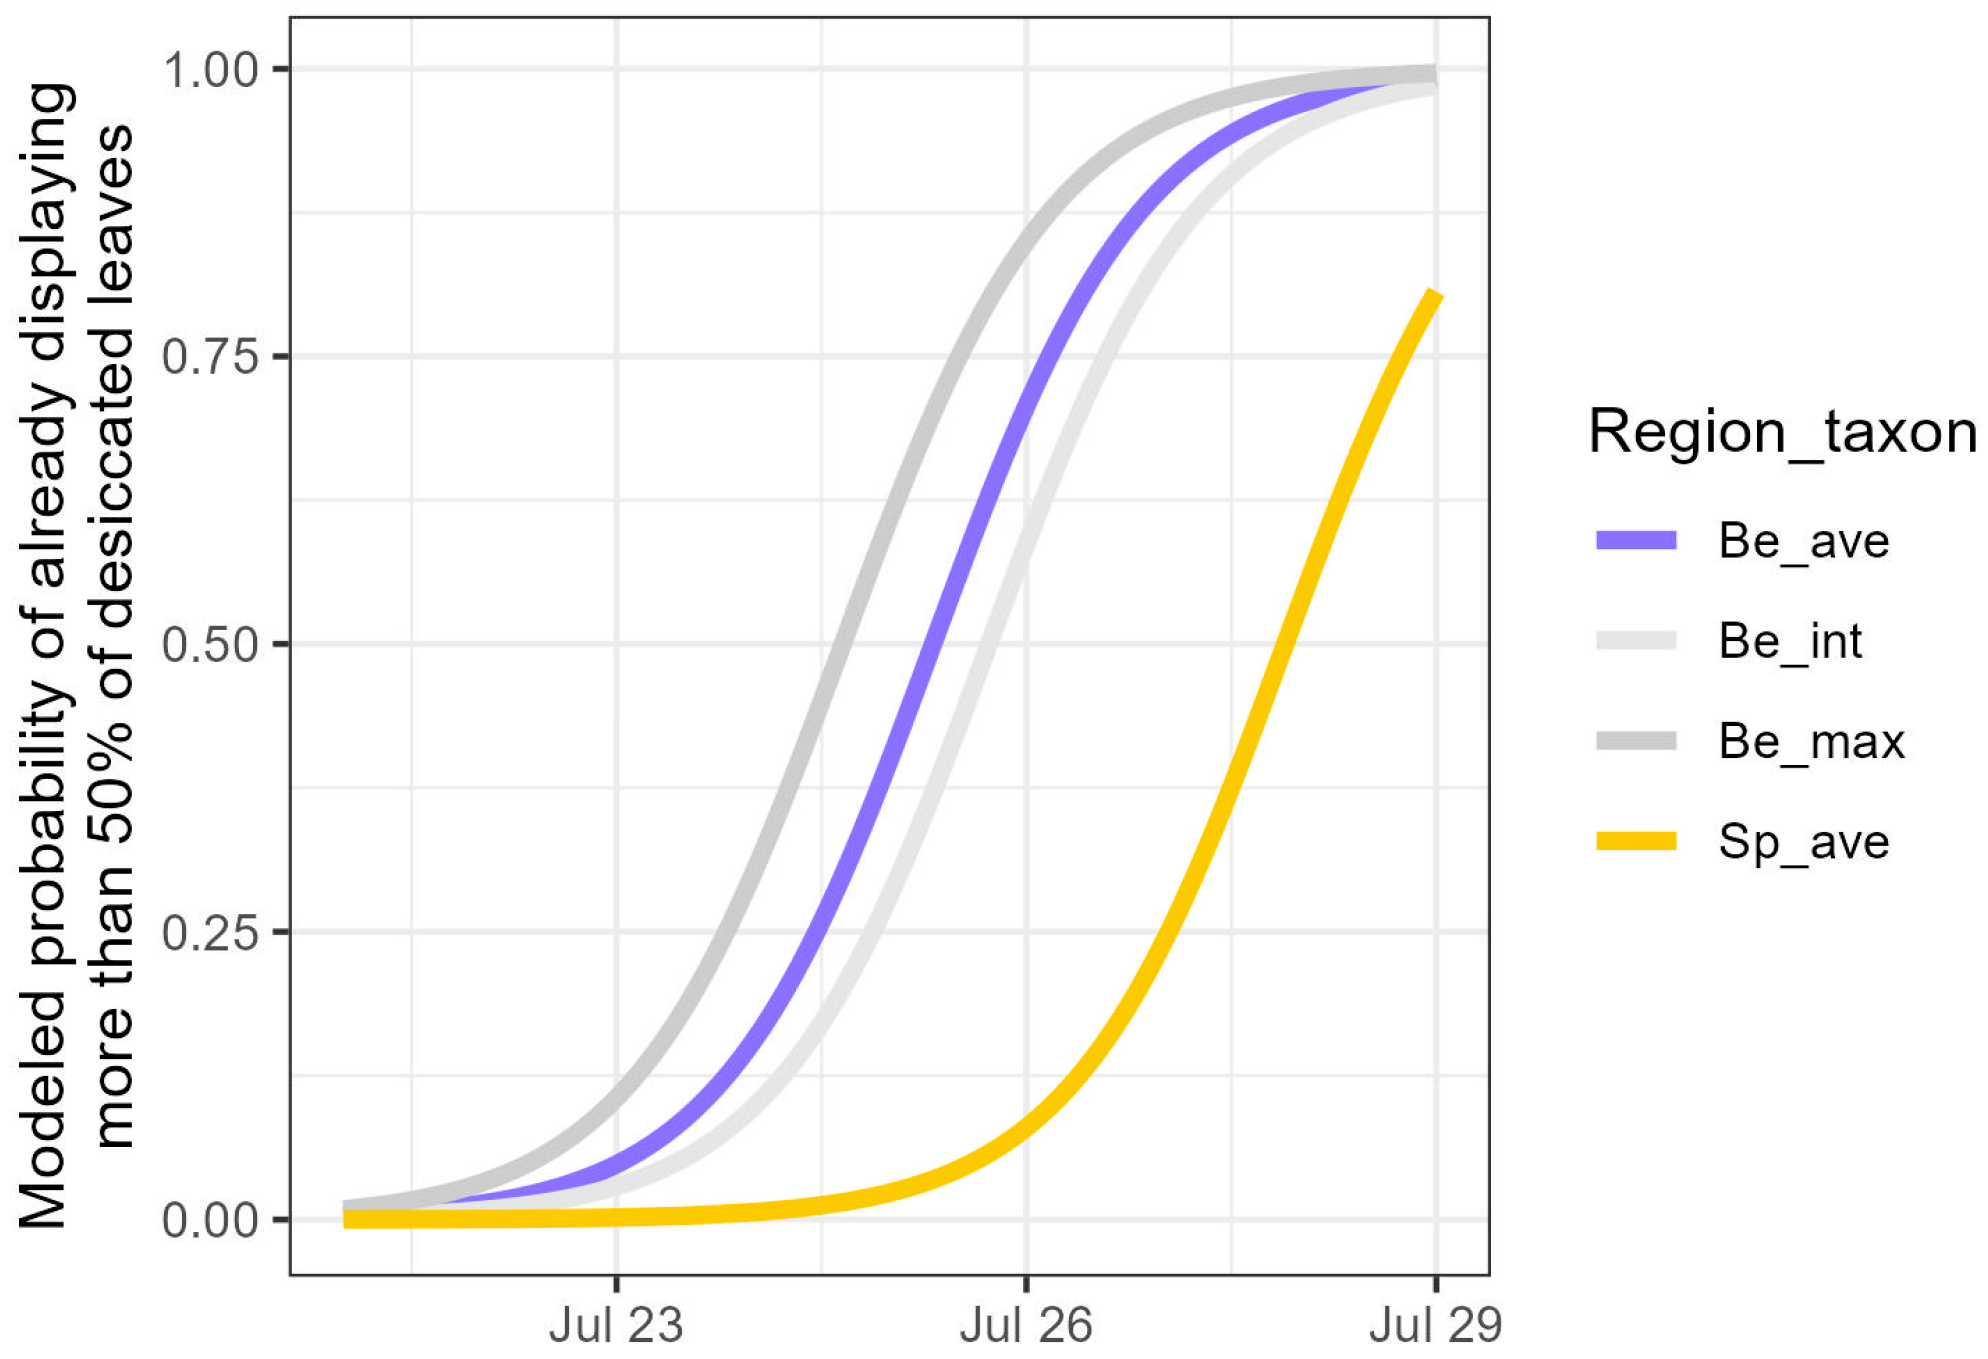
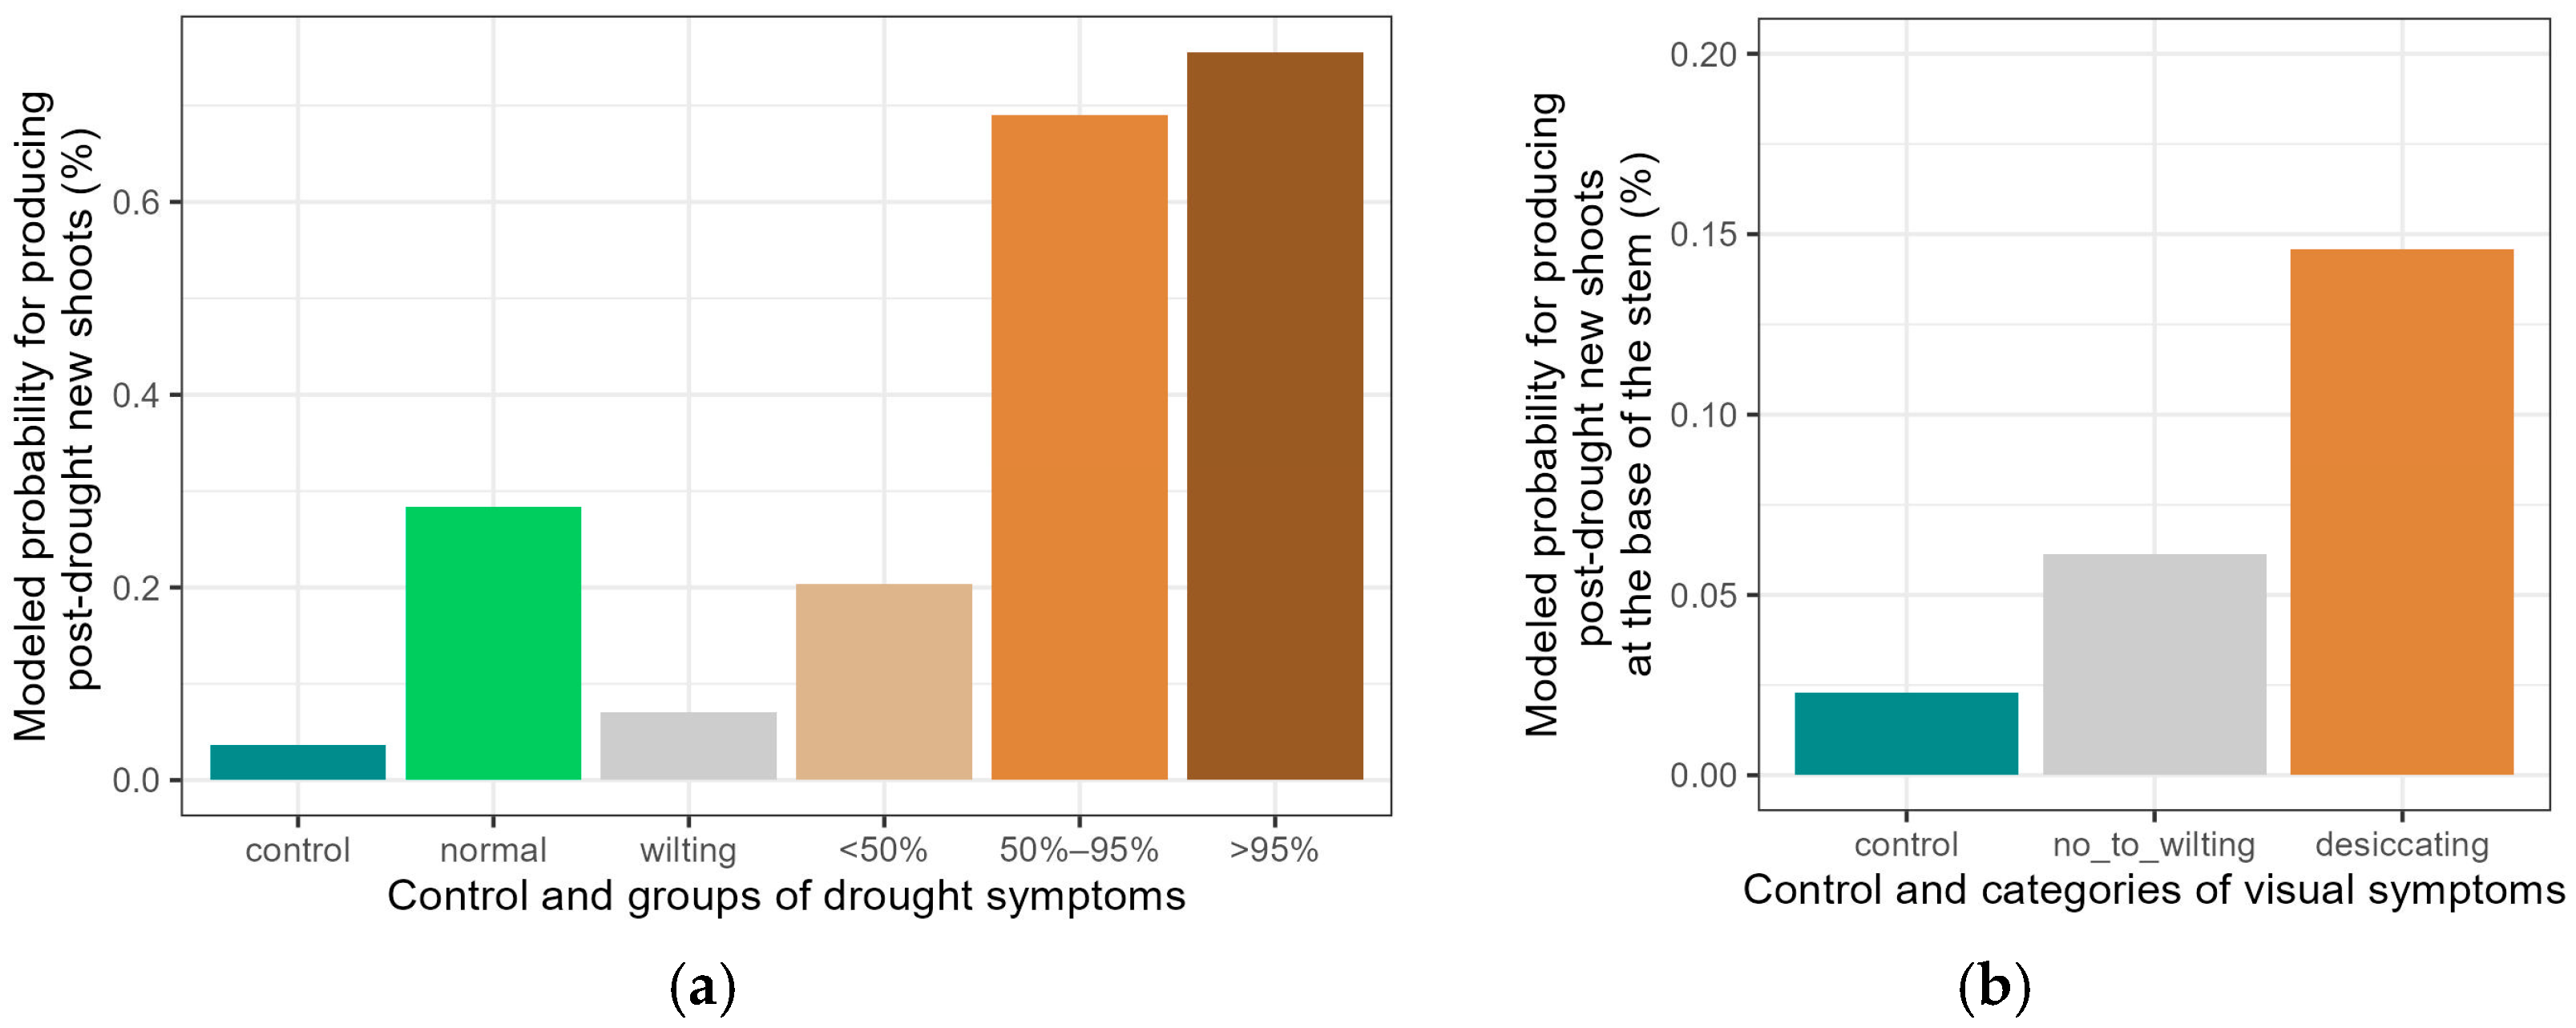
3.2. Development of Visual Drought Symptoms and Post-Drought Resprouting

Visual drought symptoms began to appear during the water withholding period and were assessed at short time intervals. Plants from the Spanish-Pyrenean C. avellana developed symptoms significantly later than those from the Belgian taxa (significant region-taxon in Table 3, Figure 5).
After the treatment, some of the drought-treated plants resprouted on the branches of the young crowns. A few plants among the controls displayed the same resprouting. Only 3.9% of the control plants produced such new shoots, whereas in the drought-treated group, this was 58.1%. When compared to the controls, most of the categories of visual drought symptoms showed a significantly higher likelihood of post-drought resprouting (significant drought scores in Table 4), with the more severely affected plants (>50% of leaves desiccated by the drought) displaying a higher probability (Figure 6a). No differentiation was detected in resprouting ability among the different region-taxa (Table 4).
Next, we considered only plants that resprouted. Because of the restricted number of resprouting plants in the different groups of drought symptoms, these were pooled into a category with no to mild drought symptoms (scores 1, 2, and 3) and a category of more severely affected plants (scores 4 and 5). The severely affected plants displayed an earlier resprouting compared to the controls (significant visual drought symptoms in Table S2 and Figure S3).
We also looked at shoots appearing at the base of the stem. Among the controls, only 2.3% of the plants produced post-drought new shoots at the base of the stem, whereas this was 10% among the drought-treated plants. When modeled, it appeared that only the plants severely affected by the drought produced significantly more shoots at the base of the stem (Table 4 and Figure 6b).

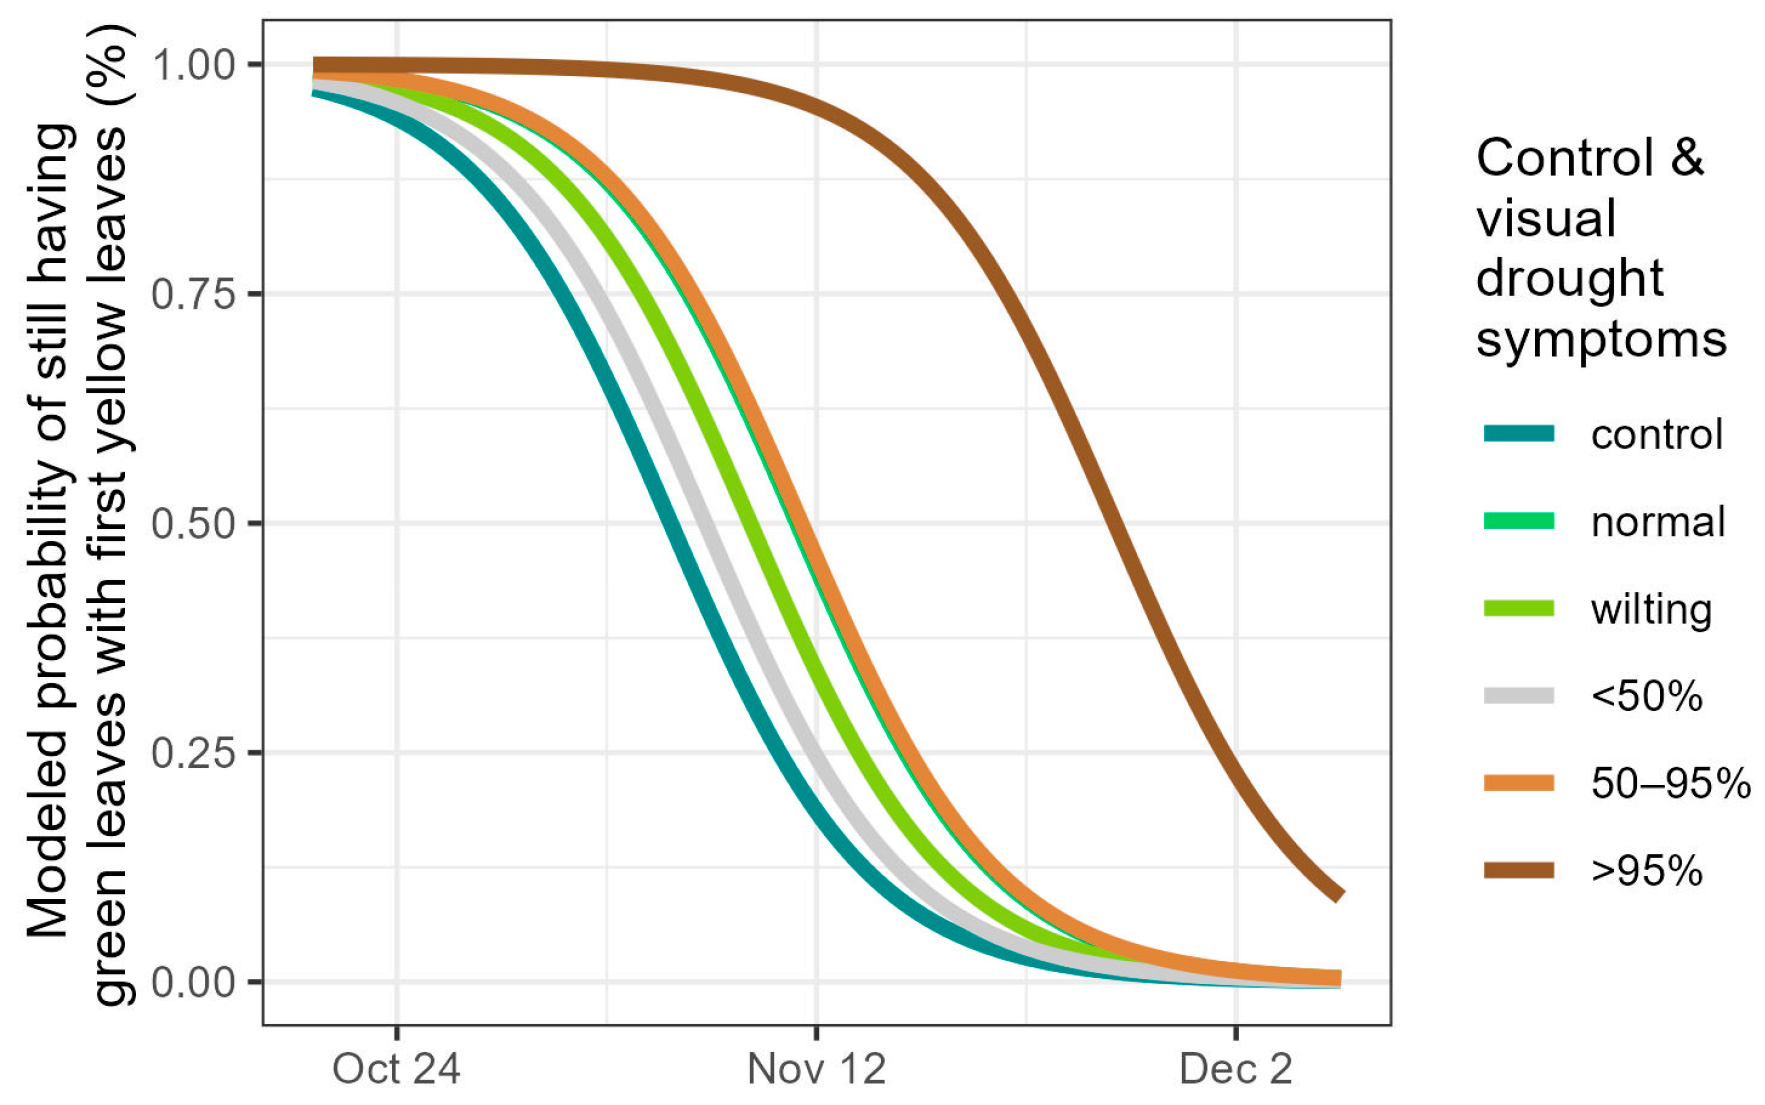
3.3. Autumn Leaf Senescence

The analysis of autumn leaf senescence focused on the comparison between the controls and the groups corresponding to the different levels of visual drought symptoms. Nearly all groups of drought-treated plants, including the group that did not develop visual symptoms during the drought, were characterized by a delayed leaf senescence (significant drought symptom groups in Table 5 and Figure 7). While leaf senescence for most of these groups was between 3.8 and 6.2 days later than the controls, the group that displayed the most severe drought symptoms (>95% desiccated leaves) during the treatment displayed leaf senescence 21.2 days later than the controls.

3.4. Spring Bud Burst

In the spring following the year of the drought treatment, nearly all groups of plants corresponding to the different categories of drought symptoms exhibited a delayed bud burst when compared to the controls (significant scores of drought symptoms in Table 5 and Figure 8a). The group that developed no visual symptoms during the drought displayed only a tendency for a later bud burst (p-value = 0.051 in Table 5 and Figure 8a). Similar to leaf senescence, bud burst was especially delayed in the group that had developed the most severe visual symptoms (Figure 8a).
Bud burst across the different regions and taxa was also examined. No difference in timing was detected between the Spanish-Pyrenean and Belgian C. avellana, but C. maxima, and to a lesser extent the morphological intermediates, were earlier than the Belgian C. avellana (significant region-taxa in Table 5 and Figure 8b).

3.5. Change in Height and Diameter

The change in height during and after the treatment was modeled to look for influences of the water withholding. All the drought-treated plants grew less in height compared to the controls during the treatment period (significant visual drought symptom scores in Table 6, and Figure 9a and Figure S4a). For the drought scores of wilting leaves, less than 50%, between 50% and 95%, and more than 95% desiccated leaves (scores 2, 3, and 4), the interaction term between the time variable and the drought score was significant (Table 6), indicating that the proportion of height growth (or height loss) between the two time periods differed from the control group.
When considering the different regions and taxa, height growths in the Spanish-Pyrenean C. avellana and in the Belgian C. maxima were significantly smaller than the Belgian C. avellana (significant region-taxa in Table 6).
The change in stem diameter of the plants during and after the treatment was modeled. All drought-treated plants displayed a reduced radial growth during the treatment in comparison to the controls (significant visual drought symptom scores in Table 6 and Figure 9b). For the control plants, no radial growth was detected anymore in the second time period (after the treatment, Figure 9b). However, the interaction terms between the time variable and the visual drought symptom groups were significant (Table 6), indicating that the proportion of radial growth between the two time periods for these groups of plants differed from the controls. Both the modeled data (Figure 9b) and the raw data (Figure S4b) showed that radial growth in the drought-treated plants was not only reduced during the drought treatment (first period), but was also partly shifted towards the autumn (second period).
No differences in radial growth were detected between the Belgian C. avellana and the other regions and taxa (Table 6).

4. Discussion

During the drought, leaf wilting and curling progressed rapidly toward widespread leaf desiccation. The severity of the desiccation influenced post-drought processes, such as new shoot formation during recovery, partial stem dieback, radial growth dynamics, and autumnal senescence. We found an alteration in the growth pattern. The radial growth was diminished by the drought treatment, and this diminished growth was achieved within a prolonged growing period. Leaf senescence was delayed in the droughted plants, with the most severely affected plants being disproportionately late. Finally, visual drought symptoms appeared later in the Pyrenean provenance.

4.1. Development of Visual Symptoms and Resprouting

During the drought, the Spanish-Pyrenean provenance developed visual stress symptoms significantly later than the local provenance of C. avellana. The plants of this non-local provenance remained less high and developed smaller leaves than the local one. While all grown in a common garden setting, this implicated that size differences were genetically controlled. Most probably, the smaller sizes resulted in a smaller leaf area of the saplings, contributing to the later occurrence of stress symptoms during the drought. Other aspects, such as variation in stomatal control or deviating hydraulic features, may have added to this result. The smaller size of the Spanish-Pyrenean provenance, when compared to more northernly located but lower altitudinal provenances, has been observed for the other common shrub species Prunus spinosa L. [42]. Intra-species studies along altitudinal clines have shown that a smaller leaf size is an adaptation to lower temperatures, stronger wind exposure, and more intense solar irradiation at higher altitudes [43]. Based on our results, we can hypothesize that in extreme drought conditions at lower altitudes, the smaller sizes can turn out advantageous. Evidently, longer term observations of fitness should support this hypothesis.
Post-drought resprouting is a response that has been documented in woody species [44]. Whereas drought symptoms developed later on the Spanish-Pyrenean C. avellana, no differences between the provenances and taxa were observed in the ability to resprout after the drought treatment. This result disagrees with post-drought resprouting in P. spinosa, where the local provenance displayed a stronger resprouting compared to a Spanish-Pyrenean and a Swedish provenance [42], suggesting that the ability to resprout when conditions normalize after a severe drought is species- and/or provenance-dependent.
Post-drought resprouting is known to be modulated by stress severity [17,45]. Our results corroborate this: the stronger the visual stress symptoms develop, the higher the chance of post-drought resprouting, particularly for the plants that lost more than half of their foliage due to desiccation. The resprouting not only concerned the formation of new shoots with leaves in the young crowns of the saplings, but also more development of new shoots at the base of the stem. Finally, it should be noted that a small amount of resprouting plants were also present among the controls. This can easily be attributed to the natural tendency of C. avellana to produce shoots in support of its multi-stemmed habitus. However, an induction by the immersion overnight in a water basin at the beginning and at the end of the treatment cannot be excluded.

4.2. Drought Affecting Sapling Size

How the drought treatment influenced the height of the plants followed our expectations. The drought significantly reduced the height growth of the saplings, including those not yet showing any visual symptoms at the end of the drought, giving expression to the vulnerability of growth to drought. Moreover, the most heavily affected saplings (>95% of desiccated leaves) had lost height due to the upper parts of the stems dying off. Partial crown dieback after drought is a common phenomenon in trees [9].
As concerns radial growth, we observed a shift towards the autumn in the drought-treated plants. Radial growth in temperate trees typically peaks early in the growing season [46,47]. The onset of radial growth within a growing season in in situ mature trees (central Europe) was found to be less variable than the end of the radial growth [46], suggesting that trees may have the capacity to prolong or shorten the radial growth depending on the growing conditions. Furthermore, daily radial growth in situ was constrained by moisture, both in air and soil, in several tree species, including the coniferous species Picea abies (L.) H. Karst, Pinus sylvestris L., and Abies alba Mill., and the deciduous species Fagus sylvatica L., Fraxinus excelsior L., Quercus petraea Liebl., and Quercus pubescens Willd. [46]. In our experiment, the control plants still displayed radial growth in July (during the treatment) but not any more afterwards (August till the end of the growing season). In comparison, the drought-treated saplings were able to partly shift radial growth to the period after the treatment, corroborating the finding that the end of the radial growth is less strictly determined than the beginning. While the overall radial growth of the total growing season was diminished in the drought-treated plants, the amount of radial growth that the treated plants did accomplish was completed within a longer time frame, which extended towards the autumn. The shifted radial growth can be considered as a compensation for the lost time during the drought. Post-drought compensation growth has already been described. For instance, after a period of drought during the growing season, Quercus petraea seedlings display a higher chance to produce an extra shoot [20]. This type of compensatory growth can be an inherent physiological mechanism [45], and in the more severely affected plants, it may result from trees attempting to repair the drought-damaged water transport tissue [48].

4.3. Autumnal Leaf Senescence and Subsequent Spring Bud Burst

Four out of five groups of plants, categorized according to the developed visual drought symptoms, displayed a delayed leaf senescence. This phenomenon of post-drought delayed leaf senescence has already been described for several woody species (e.g., Quercus petraea [49] and Cornus sanguinea L. [50]). Delayed senescence may prolong photosynthesis, facilitating the recovery from carbon deficits induced by the drought [51]. Interestingly, the most heavily affected plants by the drought in our experiment displayed the longest delay of 3 weeks, which may suggest that the extended photosynthesis in these plants may present a rather extreme response, necessary to increase the chances of survival despite a higher risk on damage due to early autumn frost or a new drought period [52]. It is tempting to hypothesize that the prolonged photosynthesis is needed to meet the high demand for carbon to restore damaged hydraulic conductivity, which is highly probable in these saplings displaying severe visual damage symptoms [17]. Alternatively, this strong delay may represent a stress-induced malfunctioning. Together, this result does not support a linear relation between the severity of the drought symptoms and the delay in leaf senescence but rather indicates a tipping point beyond which the delay becomes disproportional. This result may challenge the modeling of this phenological event under predicted climate change scenarios.
In our experiment, drought-induced delayed leaf senescence correlated with a delayed bud burst in the subsequent spring. Interestingly, the most severely affected plants displayed the largest delay. It is also tempting to hypothesize that non-structural carbohydrate dynamics may play an important role, as a strong relation was found between these carbohydrates and the timing of spring bud burst [53]. Although the timing of leaf senescence did not differentiate among the different regions of origin and the different taxa, the timing of bud burst did. The earlier bud burst for C. maxima and the morphological intermediates mainly indicates a non-local origin of the horticultural mother plants.

5. Conclusions

We investigated the responses of a widespread shrub species to an imposed early summer drought that resulted in various categories of visually expressed stress symptoms. Interestingly, we found not only a reduction in radial growth during the drought period, but also a shift of radial growth towards the autumn, which can be considered as compensation growth. We found that leaf senescence was delayed in the droughted plants, with the most severely affected group of plants displaying a delay which was 3.4 to 5.6 times larger compared to the other drought-treated groups of plants. Both aspects should be considered in carbon cycle models under climate change scenarios. The importance of these findings is underscored by the prediction that climate change will increase extreme climatic events, including severe droughts [54]. The Spanish-Pyrenean provenance grew less in height, but not in diameter, when compared to the local provenance. Together with smaller leaf sizes, this provenance consequently developed drought symptoms later than the local one. Although the climatic conditions at the home site of the Spanish-Pyrenean provenance are harsher than the local conditions in Belgium, the adaptation of this provenance to a higher altitude may turn out advantageous in drought-prone conditions at lower altitudes.

Supplementary Materials

The following supporting information can be downloaded at https://www.mdpi.com/article/10.3390/f16060907/s1: Figure S1: Monthly maximum and minimum temperature, monthly precipitation, and day length at the home sites of the Belgian and Spanish-Pyrenean provenance; Figure S2: Stomatal density (a) and stomatal size (b) according to the region of origin and the taxon. Be_ave: Belgian Corylus avellana, Be_int: Belgian intermediate forms, Be_max: Belgian C. maxima, Sp_ave: Spanish-Pyrenean C. avellana; Figure S3: Modeled timing of resprouting. Control plants are the standard to which plants are compared that developed no to mild (wilting of the leaves and less than 50% desiccated leaves) stress symptoms and plants that developed severe stress symptoms (more than 50% desiccated leaves); Figure S4: Mean and standard deviation of measured plant height (a) and stem diameter (b) at the beginning and at the end of the treatment, and at the end of the growing season, for the controls and for the different scores of visual drought symptoms that developed during the drought treatment; Table S1: Test statistics for the leaf morphological traits stomatal density and stomatal size on short shoot leaves of a subset of control plants. The Belgian C. avellana is the standard to which the Belgian intermediate forms (Be_int), the Belgian C. maxima (Be_max), and the Spanish-Pyrenean C. avellana (Sp) are compared to; Table S2: Test statistics for the modeling of the timing of post-drought resprouting, among the categories of pooled visual drought symptoms. Control plants are the standard to which the pooled groups of visual drought symptoms (Dro) are compared to: no to mild symptoms (normal, wilting, and <50% desiccated leaves), and severe symptoms (50%–95% and >95% desiccated leaves). Hei1 is the initial plant height.

Author Contributions

Conceptualization, K.V.M., A.P., E.N.P., and K.V.; methodology, K.V.M., E.N.P., D.B., K.V., A.P., S.M. (Sharon Moreels), and S.M. (Stefaan Moreels); investigation, A.P., D.B., S.M. (Sharon Moreels), and S.M. (Stefaan Moreels); validation, K.V.M.; formal analysis, K.V.M., D.B., and K.V.; data curation, D.B., K.V.M., S.M. (Stefaan Moreels), and S.M. (Sharon Moreels); writing—original draft preparation, K.V.M. and D.B.; writing—review and editing, K.V.M., K.V., D.B., A.P., and E.N.P.; supervision, K.V.M., K.V., and E.N.P. All authors have read and agreed to the published version of the manuscript.

Funding

This research received no external funding.

Data Availability Statement

https://doi.org/10.5281/zenodo.15296618 (accessed on 26 May 2025).

Acknowledgments

We sincerely thank Marc Schouppe and Nico De Regge for their support in caring for the plants.

Conflicts of Interest

The authors declare no conflicts of interest.

References

  1. Hartmann, H.; Bastos, A.; Das, A.J.; Esquivel-Muelbert, A.; Hammond, W.M.; Martínez-Vilalta, J.; McDowell, N.G.; Powers, J.S.; Pugh, T.A.M.; Ruthrof, K.X.; et al. Climate Change Risks to Global Forest Health: Emergence of Unexpected Events of Elevated Tree Mortality Worldwide. Annu. Rev. Plant Biol. 2022, 73, 673–702. [Google Scholar] [CrossRef] [PubMed]
  2. Hammond, W.M.; Williams, A.P.; Abatzoglou, J.T.; Adams, H.D.; Klein, T.; López, R.; Sáenz-Romero, C.; Hartmann, H.; Breshears, D.D.; Allen, C.D. Global field observations of tree die-off reveal hotter-drought fingerprint for Earth’s forests. Nat. Commun. 2022, 13, 1761. [Google Scholar] [CrossRef] [PubMed]
  3. Breda, N.; Huc, R.; Granier, A.; Dreyer, E. Temperate forest trees and stands under severe drought: A review of ecophysiological responses, adaptation processes and long-term consequences. Ann. For. Sci. 2006, 63, 625–644. [Google Scholar] [CrossRef]
  4. Lindner, M.; Maroschek, M.; Netherer, S.; Kremer, A.; Barbati, A.; Garcia-Gonzalo, J.; Seidl, R.; Delzon, S.; Corona, P.; Kolstrom, M.; et al. Climate change impacts, adaptive capacity, and vulnerability of European forest ecosystems. For. Ecol. Manag. 2010, 259, 698–709. [Google Scholar] [CrossRef]
  5. Haavik, L.J.; Billings, S.A.; Guldin, J.M.; Stephen, F.M. Emergent insects, pathogens and drought shape changing patterns in oak decline in North America and Europe. For. Ecol. Manag. 2015, 354, 190–205. [Google Scholar] [CrossRef]
  6. Müller, L.M.; Bahn, M. Drought legacies and ecosystem responses to subsequent drought. Glob. Change Biol. 2022, 28, 5086–5103. [Google Scholar] [CrossRef]
  7. Frank, D.; Reichstein, M.; Bahn, M.; Thonicke, K.; Frank, D.; Mahecha, M.D.; Smith, P.; Van der Velde, M.; Vicca, S.; Babst, F. Effects of climate extremes on the terrestrial carbon cycle: Concepts, processes and potential future impacts. Glob. Change Biol. 2015, 21, 2861–2880. [Google Scholar] [CrossRef]
  8. Vilonen, L.; Ross, M.; Smith, M.D. What happens after drought ends: Synthesizing terms and definitions. New Phytol. 2022, 235, 420–431. [Google Scholar] [CrossRef]
  9. Walthert, L.; Ganthaler, A.; Mayr, S.; Saurer, M.; Waldner, P.; Walser, M.; Zweifel, R.; von Arx, G. From the comfort zone to crown dieback: Sequence of physiological stress thresholds in mature European beech trees across progressive drought. Sci. Total Environ. 2021, 753, 141792. [Google Scholar] [CrossRef]
  10. Sterck, F.J.; Song, Y.; Poorter, L. Drought- and heat-induced mortality of conifer trees is explained by leaf and growth legacies. Sci. Adv. 2024, 10, eadl4800. [Google Scholar] [CrossRef]
  11. Munne-Bosch, S.; Alegre, L. Die and let live: Leaf senescence contributes to plant survival under drought stress. Funct. Plant Biol. 2004, 31, 203–216. [Google Scholar] [CrossRef] [PubMed]
  12. Marchin, R.; Zeng, H.; Hoffmann, W. Drought-deciduous behavior reduces nutrient losses from temperate deciduous trees under severe drought. Oecologia 2010, 163, 845–854. [Google Scholar] [CrossRef] [PubMed]
  13. Hochberg, U.; Windt, C.W.; Ponomarenko, A.; Zhang, Y.-J.; Gersony, J.; Rockwell, F.E.; Holbrook, N.M. Stomatal Closure, Basal Leaf Embolism, and Shedding Protect the Hydraulic Integrity of Grape Stems. Plant Physiol. 2017, 174, 764–775. [Google Scholar] [CrossRef] [PubMed]
  14. Blackman, C.J.; Brodribb, T.J.; Jordan, G.J. Leaf hydraulics and drought stress: Response, recovery and survivorship in four woody temperate plant species. Plant Cell Environ. 2009, 32, 1584–1595. [Google Scholar] [CrossRef]
  15. Blackman, C.J.; Creek, D.; Maier, C.; Aspinwall, M.J.; Drake, J.E.; Pfautsch, S.; O’Grady, A.; Delzon, S.; Medlyn, B.E.; Tissue, D.T.; et al. Drought response strategies and hydraulic traits contribute to mechanistic understanding of plant dry-down to hydraulic failure. Tree Physiol. 2019, 39, 910–924. [Google Scholar] [CrossRef]
  16. Adams, H.D.; Zeppel, M.J.B.; Anderegg, W.R.L.; Hartmann, H.; Landhäusser, S.M.; Tissue, D.T.; Huxman, T.E.; Hudson, P.J.; Franz, T.E.; Allen, C.D.; et al. A multi-species synthesis of physiological mechanisms in drought-induced tree mortality. Nat. Ecol. Evol. 2017, 1, 1285–1291. [Google Scholar] [CrossRef]
  17. Ruehr, N.K.; Grote, R.; Mayr, S.; Arneth, A. Beyond the extreme: Recovery of carbon and water relations in woody plants following heat and drought stress. Tree Physiol. 2019, 39, 1285–1299. [Google Scholar] [CrossRef]
  18. Arend, M.; Sever, K.; Pflug, E.; Gessler, A.; Schaub, M. Seasonal photosynthetic response of European beech to severe summer drought: Limitation, recovery and post-drought stimulation. Agric. For. Meteorol. 2016, 220, 83–89. [Google Scholar] [CrossRef]
  19. Spiess, N.; Oufir, M.; Matusikova, I.; Stierschneider, M.; Kopecky, D.; Homolka, A.; Burg, K.; Fluch, S.; Hausman, J.F.; Wilhelm, E. Ecophysiological and transcriptomic responses of oak (Quercus robur) to long-term drought exposure and rewatering. Environ. Exp. Bot. 2012, 77, 117–126. [Google Scholar] [CrossRef]
  20. Turcsán, A.; Steppe, K.; Sárközi, E.; Erdélyi, É.; Missoorten, M.; Mees, G.; Vander Mijnsbrugge, K. Early summer drought stress during the first growing year stimulates extra shoot growth in oak seedlings (Quercus petraea). Front. Plant Sci. 2016, 7, 193. [Google Scholar] [CrossRef]
  21. Kaya, Z.; Adams, W.T.; Campbell, R.K. Adaptive significance of intermittent shoot growth in Douglas-fir seedlings. Tree Physiol. 1994, 14, 1277–1289. [Google Scholar] [CrossRef] [PubMed]
  22. Zohner, C.M.; Mo, L.D.; Pugh, T.A.M.; Bastin, J.F.; Crowther, T.W. Interactive climate factors restrict future increases in spring productivity of temperate and boreal trees. Glob. Change Biol. 2020, 26, 4042–4055. [Google Scholar] [CrossRef] [PubMed]
  23. Keenan, T.F.; Gray, J.; Friedl, M.A.; Toomey, M.; Bohrer, G.; Hollinger, D.Y.; Munger, J.W.; O’Keefe, J.; Schmid, H.P.; Wing, I.S.; et al. Net carbon uptake has increased through warming-induced changes in temperate forest phenology. Nat. Clim. Chang. 2014, 4, 598–604. [Google Scholar] [CrossRef]
  24. Savolainen, O.; Pyhäjärvi, T.; Knürr, T. Gene Flow and Local Adaptation in Trees. Annu. Rev. Ecol. Evol. Syst. 2007, 38, 595–619. [Google Scholar] [CrossRef]
  25. Alberto, F.J.; Aitken, S.N.; Alia, R.; Gonzalez-Martinez, S.C.; Hanninen, H.; Kremer, A.; Lefevre, F.; Lenormand, T.; Yeaman, S.; Whetten, R.; et al. Potential for evolutionary responses to climate change-evidence from tree populations. Glob. Change Biol. 2013, 19, 1645–1661. [Google Scholar] [CrossRef]
  26. Zohner, C.M.; Benito, B.M.; Svenning, J.-C.; Renner, S.S. Day length unlikely to constrain climate-driven shifts in leaf-out times of northern woody plants. Nat. Clim. Chang. 2016, 6, 1120–1123. [Google Scholar] [CrossRef]
  27. Delpierre, N.; Dufrêne, E.; Soudani, K.; Ulrich, E.; Cecchini, S.; Boé, J.; François, C. Modelling interannual and spatial variability of leaf senescence for three deciduous tree species in France. Agric. For. Meteorol. 2009, 149, 938–948. [Google Scholar] [CrossRef]
  28. Rosenthal, S.I.; Camm, E.L. Photosynthetic decline and pigment loss during autumn foliar senescence in western larch (Larix occidentalis). Tree Physiol. 1997, 17, 767–775. [Google Scholar] [CrossRef]
  29. Vander Mijnsbrugge, K.; Moreels, S. Varying Levels of Genetic Control and Phenotypic Plasticity in Timing of Bud Burst, Flower Opening, Leaf Senescence and Leaf Fall in Two Common Gardens of Prunus padus L. Forests 2020, 11, 1070. [Google Scholar] [CrossRef]
  30. Gallinat, A.S.; Primack, R.B.; Wagner, D.L. Autumn, the neglected season in climate change research. Trends Ecol. Evol. 2015, 30, 169–176. [Google Scholar] [CrossRef]
  31. Enescu, C.; Durrant, T.; de Rigo, D.; Caudullo, G. Corylus avellana in Europe: Distribution, habitat, usage and threats. In European Atlas of Forest Tree Species; Publication Office of the European Union: Luxembourg, 2016. [Google Scholar]
  32. Ferreira, J.J.; Garcia-González, C.; Tous, J.; Rovira, M. Genetic diversity revealed by morphological traits and ISSR markers in hazelnut germplasm from northern Spain. Plant Breed. 2010, 129, 435–441. [Google Scholar] [CrossRef]
  33. Campa, A.; Trabanco, N.; Pérez-Vega, E.; Rovira, M.; Ferreira, J.J. Genetic relationship between cultivated and wild hazelnuts (Corylus avellana L.) collected in northern Spain. Plant Breed. 2011, 130, 360–366. [Google Scholar] [CrossRef]
  34. Čokeša, V.; Pavlović, B.; Stajic, S.; Poduška, Z.; Jović, Đ. Corylus, L.: Its diversity, geographical distribution and morpho-anatomical characteristics with special reference to the systematic classification and phylogenics of Turkish hazel (Corylus colurna L.). Sustain. For. Collect. 2020, 81–82, 1–17. [Google Scholar] [CrossRef]
  35. Palmé, A.E. Chloroplast DNA variation, postglacial recolonization and hybridization in hazel, Corylus avellana. Mol. Ecol. 2002, 11, 1769–1779. [Google Scholar] [CrossRef]
  36. Vander Mijnsbrugge, K.; Malanguis, J.M.; Moreels, S.; Turcsán, A.; Paino, E.N. Stimulation, Reduction and Compensation Growth, and Variable Phenological Responses to Spring and/or Summer & Autumn Warming in Corylus Taxa and Cornus sanguinea L. Forests 2022, 13, 654. [Google Scholar] [CrossRef]
  37. R_Core_Team. R: A Language and Environment for Statistical Computing; R Foundation for Statistical Computing: Vienna, Austria, 2022. [Google Scholar]
  38. Bates, D.; Machler, M.; Bolker, B.M.; Walker, S.C. Fitting Linear Mixed-Effects Models Using lme4. J. Stat. Softw. 2015, 67, 1–48. [Google Scholar] [CrossRef]
  39. Christensen, R.H.B. Ordinal: Regression Models for Ordinal Data. R Package Version 2015.6-28. Available online: http://www.cran.r-project.org/package=ordinal/ (accessed on 15 February 2021).
  40. Wickham, H. ggplot2: Elegant Graphics for Data Analysis; Springer: New York, NY, USA, 2016. [Google Scholar]
  41. Zuur, A.; Ieno, E.; Walker, N.; Saveliev, A.; Smith, G. Mixed Effects Models and Extensions in Ecology with R; Springer: New York, NY, USA, 2009. [Google Scholar]
  42. Vander Mijnsbrugge, K.; Moreels, S.; Moreels, S.; Buisset, D.; Vancampenhout, K.; Notivol Paino, E. Influence of Summer Drought on Post-Drought Resprouting and Leaf Senescence in Prunus spinosa L. Grow. A Common Garden. Plants 2025, 14, 1132. [Google Scholar]
  43. Liu, W.; Zheng, L.; Qi, D. Variation in leaf traits at different altitudes reflects the adaptive strategy of plants to environmental changes. Ecol. Evol. 2020, 10, 8166–8175. [Google Scholar] [CrossRef]
  44. Zeppel, M.J.B.; Harrison, S.P.; Adams, H.D.; Kelley, D.I.; Li, G.; Tissue, D.T.; Dawson, T.E.; Fensham, R.; Medlyn, B.E.; Palmer, A.; et al. Drought and resprouting plants. New Phytol. 2015, 206, 583–589. [Google Scholar] [CrossRef]
  45. Gessler, A.; Bottero, A.; Marshall, J.; Arend, M. The way back: Recovery of trees from drought and its implication for acclimation. New Phytol. 2020, 228, 1704–1709. [Google Scholar] [CrossRef]
  46. Etzold, S.; Sterck, F.; Bose, A.K.; Braun, S.; Buchmann, N.; Eugster, W.; Gessler, A.; Kahmen, A.; Peters, R.L.; Vitasse, Y.; et al. Number of growth days and not length of the growth period determines radial stem growth of temperate trees. Ecol. Lett. 2022, 25, 427–439. [Google Scholar] [CrossRef] [PubMed]
  47. Puchalka, R.; Prislan, P.; Klisz, M.; Koprowski, M.; Gricar, J. Tree-ring formation dynamics in Fagus sylvatica and Quercus petraea in a dry and a wet year. Dendrobiology 2024, 91, 1–15. [Google Scholar] [CrossRef]
  48. Trugman, A.T.; Detto, M.; Bartlett, M.K.; Medvigy, D.; Anderegg, W.R.L.; Schwalm, C.; Schaffer, B.; Pacala, S.W. Tree carbon allocation explains forest drought-kill and recovery patterns. Ecol. Lett. 2018, 21, 1552–1560. [Google Scholar] [CrossRef]
  49. Vander Mijnsbrugge, K.; Turcsan, A.; Maes, J.; Duchene, N.; Meeus, S.; Steppe, K.; Steenackers, M. Repeated Summer Drought and Re-watering during the First Growing Year of Oak (Quercus petraea) Delay Autumn Senescence and Bud Burst in the Following Spring. Front. Plant Sci. 2016, 7, 419. [Google Scholar] [CrossRef]
  50. Vander Mijnsbrugge, K.; Vandepitte, J.; Moreels, S.; Mihaila, V.-V.; De Ligne, L.; Notivol, E.; Van Acker, J.; Van den Bulcke, J. Timing of autumnal leaf senescence in a common shrub species depends on the level of preceding summer drought symptoms. Environ. Exp. Bot. 2023, 216, 105539. [Google Scholar] [CrossRef]
  51. Pflug, E.E.; Buchmann, N.; Siegwolf, R.T.W.; Schaub, M.; Rigling, A.; Arend, M. Resilient Leaf Physiological Response of European Beech (Fagus sylvatica L.) to Summer Drought Drought Release. Front. Plant Sci. 2018, 9, 187. [Google Scholar] [CrossRef]
  52. Estiarte, M.; Peñuelas, J. Alteration of the phenology of leaf senescence and fall in winter deciduous species by climate change: Effects on nutrient proficiency. Glob. Change Biol. 2015, 21, 1005–1017. [Google Scholar] [CrossRef]
  53. Blumstein, M.; Oseguera, M.; Caso-McHugh, T.; Des Marais, D.L. Nonstructural carbohydrate dynamics’ relationship to leaf development under varying environments. New Phytol. 2024, 241, 102–113. [Google Scholar] [CrossRef]
  54. Anonymous. Klimaatrapport 2020. Van Klimaatinformatie tot Klimaatdiensten; Koninklijk Meteorologisch Institutuut: Brussels, Belgium, 2020. [Google Scholar]
Figure 1. Schematic representation of the investigation. Droughted plants are categorized according to the developed visual stress symptom scores: no symptoms, wilting of the leaves, less than 50%, 50% to 95%, and more than 95% of leaves desiccated. The number of plants is indicated for each category, including a subdivision according to the taxon and region of origin. After the drought, a division is made according to whether plants resprouted or not. Be_ave: Belgian Corylus avellana, Be_int: Belgian intermediate forms, Be_max: Belgian C. maxima, Sp_ave: Spanish-Pyrenean C. avellana, Dro: visual drought symptoms, Res: post-drought resprouting, Sen: leaf senescence, Bud: bud burst, Hei: height, Dia: diameter.
Forests 16 00907 g001
Figure 2. Box plots of the weight of the pots for control and droughted plants, according to the region of origin and taxon. Be_ave: Belgian Corylus avellana, Be_int: Belgian intermediate forms, Be_max: Belgian C. maxima, Sp_ave: Spanish-Pyrenean C. avellana.
Forests 16 00907 g002
Figure 3. Box plots of plant height (a) and diameter (b) at the start of the experiment, according to the region of origin and taxon. Be_ave: Belgian Corylus avellana, Be_int: Belgian intermediate forms, Be_max: Belgian C. maxima, Sp_ave: Spanish-Pyrenean C. avellana. Different small letters indicate significant differences.
Forests 16 00907 g003
Figure 4. Box plots of leaf morphological traits: lamina length on short shoots (a) and long shoots (b), and lamina widest width on short shoots (c) and long shoots (d), according to the region of origin and taxon. Be_ave: Belgian Corylus avellana, Be_int: Belgian intermediate forms, Be_max: Belgian C. maxima, Sp_ave: Spanish-Pyrenean C. avellana. Different small letters indicate significant differences.
Forests 16 00907 g004
Figure 5. Modeled development of visual drought symptoms according to the region of origin and taxon. Be_ave: Belgian Corylus avellana, Be_int: Belgian intermediate forms, Be_max: Belgian C. maxima, Sp_ave: Spanish-Pyrenean C. avellana. Groups not significantly differing from the Belgian C. avellana are in gray.
Forests 16 00907 g005
Figure 6. Probability of post-drought resprouting among control plants and the different scores of symptoms: normal (no symptoms), wilting of the leaves, less than 50%, 50% to 95%, and more than 95% of leaves desiccated (a). Resprouting at the base of the stem with no_to_wilting including pooled scores of symptom scores normal and wilting of the leaves, and desiccating, including pooled scores of less than 50%, 50% to 95%, and more than 95% of leaves desiccated (b). Scores not significantly differing from the control are in gray.
Forests 16 00907 g006
Figure 7. Modeled timing of autumnal leaf senescence with visual drought symptom scores: normal (no symptoms), wilting of the leaves, less than 50%, 50% to 95%, and more than 95% of leaves desiccated. Scores not significantly differing from the control are in gray.
Forests 16 00907 g007
Figure 8. Modeled bud burst for the control and drought-treated plants according to the drought categories: normal (no symptoms), wilting of the leaves, less than 50%, 50% to 95%, and more than 95% of leaves desiccated (a), and according to the region of origin and the taxon; Be_ave: Belgian Corylus avellana, Be_int: Belgian intermediate forms, Be_max: Belgian C. maxima, and Sp_ave: Spanish-Pyrenean C. avellana (b). Categories that do not significantly differ from the control (a) or from the Belgian C. avellana (b) are displayed in gray.
Forests 16 00907 g008
Figure 9. Modeled change in height (a) and diameter (b) during and after the treatment. Visual drought symptom scores: normal (no symptoms), wilting of the leaves, less than 50%, 50% to 95%, and more than 95% of leaves desiccated. D: during the treatment, A: after the treatment.
Forests 16 00907 g009
Table 1. Test statistics for the plant height and diameter before the treatment. The Belgian intermediate forms (Be_int), the Belgian C. maxima (Be_max), and the Spanish-Pyrenean C. avellana (Sp_ave) are compared to the Belgian C. avellana (standard).
Initial HeightInitial Diameter
VariableEstimateStd. Errort-Valuep-ValueEstimateStd. Errort-Valuep-Value
(Intercept)72.241.4051.69<0.001 ***0.100.0072.16<0.001 ***
Be_int2.292.191.040.2980.000.001.200.233
Be_max−4.543.31−1.370.1710.000.001.110.267
Sp_ave−10.522.04−5.15<0.001 ***0.000.00−1.870.062
*** p < 0.001.
Table 2. Test statistics for leaf lamina length and lamina widest width on short and long shoots of the control plants. The Belgian intermediate forms (Be_int), the Belgian C. maxima (Be_max), and the Spanish-Pyrenean C. avellana (Sp) are compared to the Belgian C. avellana (standard).
Lamina LengthLamina Widest Width
Location on the PlantVariableEstimateStd. Errort-Valuep-ValueEstimateStd. Errort-Valuep-Value
Short shoot(Intercept)67.311.3250.96<0.001 ***48.620.9650.71<0.001 ***
Be_int0.722.070.350.7280.511.500.340.736
Be_max8.893.102.870.005 **2.382.251.060.292
Sp_ave−2.681.91−1.400.164−2.281.39−1.640.103
Long shoot(Intercept)102.162.0649.64<0.001 ***82.911.9542.42<0.001 ***
Be_int6.593.222.040.043 *5.223.061.710.091
Be_max0.965.040.190.8500.314.790.070.948
Sp_ave−6.913.00−2.300.023 *−7.292.85−2.560.012 *
*** p < 0.001; ** p < 0.01; * p < 0.05.
Table 3. Test statistics for the development of stress symptoms during the drought. The Belgian C. avellana is the standard to which the Belgian intermediate forms (Be_int), the Belgian C. maxima (Be_max), and the Spanish-Pyrenean C. avellana (Sp) are compared to. Day is the day of observation, Hei1 is the initial height.
VariableEstimateStd. Errorz-Valuep-Value
Day−1.290.11−11.92<0.001 ***
Be_int0.531.020.520.602
Be_max−0.851.53−0.560.578
Sp_ave3.321.043.190.001 **
Hei1−0.260.04−6.67<0.001 ***
*** p < 0.001; ** p < 0.01.
Table 4. Test statistics for the chance of resprouting after the treatment, both in the young crown and at the base of the stem. For the young crown: controls are the standard to which the groups of drought symptoms (Dro) are compared to: normal (no symptoms), wilting of the leaves, less than 50%, 50% to 95%, and more than 95% of leaves desiccated. For the base of the stem: controls are the standard to which the pooled groups of drought symptoms are compared to: no to mild symptoms (normal, wilting, and <50% desiccated leaves), and severe symptoms (50%–95% and >95% desiccated leaves). The Belgian C. avellana is the standard to which the Belgian intermediate forms (Be_int), the Belgian C. maxima (Be_max), and the Spanish-Pyrenean C. avellana (Sp) are compared to. Hei1 is the initial height.
Location on the PlantVariableEstimateStd. Errorz-Valuep-Value
Young crown(Intercept)−3.781.41−2.680.007 **
Dro_normal2.360.912.600.009 **
Dro_wilting0.710.900.780.433
Dro_ < 50%1.920.692.770.006 **
Dro_50%–95%4.090.596.93<0.001 ***
Dro_ > 95%4.420.745.95<0.001 ***
Be_int0.440.510.870.387
Be_max0.310.760.410.681
Sp_ave−0.360.58−0.620.533
Hei10.010.020.400.687
Base stem(Intercept)−4.441.65−2.700.007 **
Dro_no-mild1.030.821.260.208
Dro_severe1.990.692.890.004 **
Hei10.010.020.480.635
*** p < 0.001; ** p < 0.01.
Table 5. Test statistics for the modeling of leaf senescence. The different scores of drought symptoms (Dro) are compared to the control plants (standard). The Belgian C. avellana is the standard to which the Belgian intermediate forms (Be_int), the Belgian C. maxima (Be_max), and the Spanish-Pyrenean C. avellana (Sp) are compared to. Day is the day of observation, and Hei3 is the plant height in winter.
Autumn Leaf SenescenceSpring Bud Burst
VariableEstimateStd. Errorz-Valuep-ValueEstimateStd. Errorz-Valuep-Value
Day0.210.0116.38<0.001 ***−0.380.02−19.87<0.001 ***
Dro_normal−1.280.46−2.770.006 **1.370.701.950.051
Dro_wilting−0.810.33−2.480.013 *1.620.493.33<0.001 ***
Dro_ < 50%−0.350.35−1.000.3181.400.522.680.007 **
Dro_50%–95%−1.320.32−4.19<0.001 ***2.090.474.42<0.001 ***
Dro_ > 95%−4.500.51−8.87<0.001 ***4.350.686.42<0.001 ***
Be_int0.460.261.780.075−1.670.38−4.37<0.001 ***
Be_max−0.360.40−0.900.366−4.760.62−7.67<0.001 ***
Sp_ave0.440.261.680.0930.290.380.750.453
Hei30.040.017.25<0.001 ***0.040.015.03<0.001 ***
*** p < 0.001; ** p < 0.01; * p < 0.05.
Table 6. Test statistics for the change in height and change in diameter in controls and droughted plants. Two time periods (Tim) are included: during and after the treatment. The period during the treatment is the standard to which the period after the treatment is compared to. The control group is the standard to which the different scores of drought symptoms (Dro) are compared to: normal (no symptoms), wilting of the leaves, less than 50%, 50% to 95%, and more than 95% of leaves desiccated. The Belgian C. avellana is the standard to which the Belgian intermediate forms (Be_int), the Belgian C. maxima (Be_max), and the Spanish-Pyrenean C. avellana (Sp) are compared to. Hei1 and Dia1 are the initial plant height and diameter.
TraitVariableValueStd. ErrorDFt-Valuep-Value
Change in height(Intercept)26.613.042508.76<0.001 ***
Tim−18.571.12250−16.64<0.001 ***
Dro_normal−6.452.97246−2.170.031 *
Dro_wilting−9.422.00246−4.72<0.001 ***
Dro_ < 50%−9.762.16246−4.51<0.001 ***
Dro_50%–95%−15.121.82246−8.32<0.001 ***
Dro_ > 95%−21.352.41246−8.87<0.001 ***
Be_int−0.611.24246−0.490.625
Be_max−4.951.88246−2.630.009 **
Sp_ave−3.251.24246−2.620.009 **
Hei1−0.030.04246−0.680.500
Tim:Dro_normal6.733.662501.840.067
Tim:Dro_wilting10.142.492504.07<0.001 ***
Tim:Dro_ < 50%7.652.752502.780.006 **
Tim:Dro_50%–95%9.402.302504.08<0.001 ***
Tim:Dro_ > 95%−3.583.03250−1.180.239
Change in diameter(Intercept)3.100.402507.79<0.001 ***
Tim−1.380.14250−9.95<0.001 ***
Dro_normal−0.670.33246−2.070.040*
Dro_wilting−0.800.22246−3.62<0.001 ***
Dro_ < 50%−0.650.24246−2.660.008 **
Dro_50%–95%−1.000.20246−4.91<0.001 ***
Dro_ > 95%−0.910.27246−3.390.001 **
Be_int0.240.132461.900.058
Be_max0.160.192460.830.406
Sp_ave−0.110.12246−0.910.365
Dia1−0.170.04246−4.67<0.001 ***
Tim:Dro_normal1.050.462502.300.022 *
Tim:Dro_wilting1.110.312503.60<0.001 ***
Tim:Dro_ < 50%0.930.342502.710.007 **
Tim:Dro_50%–95%1.340.292504.68<0.001 ***
Tim:Dro_ > 95%0.930.382502.480.014*
*** p < 0.001; ** p < 0.01; * p < 0.05.
Disclaimer/Publisher’s Note: The statements, opinions and data contained in all publications are solely those of the individual author(s) and contributor(s) and not of MDPI and/or the editor(s). MDPI and/or the editor(s) disclaim responsibility for any injury to people or property resulting from any ideas, methods, instructions or products referred to in the content.

