Abstract
Boreal forests have historically been regarded as some of the largest terrestrial carbon (C) sinks. However, increased soil organic matter (SOM) decomposition due to forest harvesting and post-harvest silviculture (e.g., site preparation, planting, and managing for competing vegetation) may exacerbate the effects of climate warming and shift boreal forests from being C sinks to C sources. We used an established stand-scale, fully replicated, experimental study to identify how two levels of forest management (harvesting = Harvest Only, and harvesting with post-harvest silviculture = Harvest Plus) influence SOC dynamics at three boreal forest sites varying in soil texture. Each site was surveyed for forest floor (litter and F/H horizons) and mineral soils pre-harvest (0) and 5, 14, and 20 years post-harvest. We predicted that sites harvested and left to revegetate naturally would have the lowest SOC stocks after 20 years, as sites that were planted and managed for competing vegetation would recover faster and contribute to a larger nutrient pool, and that the sand-dominated site would have the largest SOC losses following harvest due to the inherently lower ability of sand soils to chemically and/or physically protect SOC from decomposition following harvest. Over a 20-year period, both forest management treatments generally resulted in reduced total (litter, F/H, and mineral horizon) SOC stocks compared with the control: the Harvest Only treatment reduced overall SOC stocks by 15% at the silt-dominated site and 31% at the clay-dominated site but increased overall SOC stocks by 4% at the sand-dominated site, whereas the Harvest Plus treatment reduced overall SOC stocks by 32% at the sand- and silt-dominated sites and 5% at the clay-dominated site. This suggests that harvesting and leaving plots to revegetate naturally on sand-dominated sites and harvesting followed by post-harvest silviculture on clay-dominated sites may minimize total SOC losses at similar sites, though a full replicated field experiment is needed to test this hypothesis. Most treatment effects in this study were observed only in the second decade post-harvest (14 and 20 years post-harvest), highlighting the importance of long-term field experiments on the effects of forest harvesting and post-harvest silviculture. This research improves our understanding of the relationship between C dynamics, forest management, and soil texture, which is integral for developing sustainable management strategies that optimize C sequestration and contribute to the resilience of boreal forest ecosystems in the face of climate change.
1. Introduction
Soils store more carbon (C) than any other terrestrial pool, storing approximately 1500 Gt C to one-meter depth, which is 2× more than the atmosphere (750 Gt) and 3× more than plants and animals (560 Gt) [1]. Boreal forests play a key role in the global C cycle, containing about one third of the world’s terrestrial C stores, most of which (~60%) are stored within the first 30 cm as soil organic matter (SOM) [2,3]. Historically, boreal forests have been recognized as C sinks [4], with SOM inputs being greater than SOM outputs. Inputs mainly come from vegetation [5], and outputs are largely due to biological transformations that mineralize soil organic C (SOC) within SOM as energetic resource and release carbon dioxide (CO2) [6]. However, accelerated SOM decomposition due to climate change may reduce belowground C accumulation and shift boreal forests from being C sinks to C sources [7].
At the same time, forest management practices, including harvesting and post-harvest silviculture (i.e., site preparation, planting, and/or chemical vegetation control) can also impact C dynamics in boreal forests. Harvesting may increase soil temperatures [8] by removing aboveground organic C inputs (e.g., litter) that act as a natural buffer from solar radiation [9]. Also, mechanical disturbances from harvesting and site preparation may increase soil compaction by decreasing macropore space [10], offering wetter conditions that favor anaerobic bacteria [11], which can increase soil respiration and cause SOC loss [12]. Similarly, the mechanical mixing of forest floor litter into underlying mineral soil during site preparation (e.g., disc trenching) may stimulate its decomposition relative to litter on the soil surface, reducing SOC stocks [13]. Following harvesting and site preparation, losses in SOC are greatest in forest floor horizons (i.e., litter, fragmented (F) and humic (H)) and upper mineral soil (e.g., 0–30 cm) [14]; however, site preparation can reduce SOC losses or even increase SOC in the upper mineral soil, as these measurements would include litter from forest floor horizons that has been translocated to the underlying mineral soil, especially in the short-term [13]. While post-harvest management associated with replanting, reseeding, and vegetation control can lead to SOC inputs that exceed losses in the long-term [15,16], the short-term effects can be idiosyncratic [17]. For example, initial harvesting and site preparation reduces organic inputs to soil and enhances decomposition rates [14], but site preparation, planting, and the removal of competition with herbicides may improve aboveground vegetation growth and increase SOC input to soil in the long term (see [16]).
Canada has 367 million hectares of forest, including 25% of the world’s boreal forest [18], with approximately 42% of all forest land being certified to sustainable forest management (SFM) standards [19]. SFM is an approach to managing forests such that the long-term viability of forest ecosystems is met while meeting the economic and socio-political needs of present and future generations. Post-harvest practices of SFM include replanting or natural regeneration, soil protection and management, and adaptive management, where management is modified based on specific local conditions at a site (e.g., soil physiochemical properties) and validated by continued monitoring and research [20]. At the same time, site preparation (e.g., disc trenching) and the use of herbicides such as glyphosate to control competing vegetation to ensure tree growth is common [21,22].
Soils in the boreal forests of Canada are relatively young, beginning to form following the last glacial retreat (~17,000 to 6000 years old), and they are generated from two broad classes of parent materials—acidic, coarse-textured (e.g., sand-sized particles) glacial deposits derived from igneous rock and neutral-to-alkaline, loamy (i.e., a mixture of sand, silt, and clay-sized particles) glacial deposits derived from sedimentary rocks [23]. These parent materials are geological deposits that determine the minerals that the soils are formed on and thus affect soil texture, as well as other soil physiochemical properties such as pH, moisture, and nutrient availability. Soil texture is one important factor determining the size of SOC stocks by affecting decomposition via physicochemical mechanisms between the mineral matrix and SOM (e.g., [24]). Soils with a high clay content have a larger surface area and availability of binding sites for SOM and better aggregation and structural and chemical stability, which can protect SOM (and thus SOC) from decomposition by occluding it within aggregates or forming organo-mineral complexes [25]. Conversely, sandy soils dominated by coarse quartz grains have a limited number of binding sites for SOM [26], making them inherently low in SOC and other nutrients [27], and they may be particularly vulnerable to SOC loss following harvest and site preparation. Resultingly, soil texture and SOC stocks are often indicators of how sensitive a site is to mineral SOC losses following harvesting [28].
Understanding the relationship between C dynamics, forest management, and soil texture is essential for developing sustainable management strategies that optimize C sequestration and contribute to the resilience of boreal forest ecosystems in the face of climate change. Although soil texture appears to play a role in C dynamics following forest harvesting [28], few studies cover a range of soil textures or address potential texture-specific mechanisms underlying SOC loss following harvest and post-harvest silviculture [14]. This is especially true for long-term studies in the boreal forest (but see [29]), as SOC recovery may not be evident for decades after post-harvest silviculture practices meant to improve regeneration success are implemented (e.g., site preparation, planting, removal of competition via herbicides) [14]. Thus, the objectives of this study were as follows: (1) quantify SOC stocks in the forest floor (litter and F/H horizons) and mineral soil (0–30 cm depth) horizons at three boreal forest sites that vary in soil textures (sand-, silt-, and clay-dominated) pre-harvest (0) and 5, 14, and 20 years post-harvest, and (2) determine if two silviculture treatments (harvesting and harvesting with post-harvest silviculture) affect SOC stocks in forest floor and mineral soil pools 5, 14, and 20 years post-harvest. In achieving this, we aim to further our understanding of how typical forest management practices in Canadian boreal forests affect SOC stocks in the long term, especially in mineral soil horizons, and to gain a better understanding of inherent soil physiochemical properties that may drive site-specific responses.
Harvesting and site preparation are well established to reduce organic C inputs to soil and enhance decomposition rates [14]; thus, we hypothesized that they would result in lower forest floor and mineral SOC compared to unharvested controls across all sites. However, we did hypothesize that harvesting without post-harvest silviculture would result in the highest decomposition rates and lowest SOC 20 years post-harvest, as these plots would experience slower vegetation recovery than vegetation in plots where the site was prepared, planted, and managed for competing vegetation [16]. Finally, we hypothesized that the clay-dominated site would have the largest mineral SOC stocks and that these SOC repositories would be less impacted by harvesting and site preparation compared to sandy soils due to the inherent physiochemical properties of clay soils that protect SOC from decomposition, yet the effects from forest harvest and subsequent management practices would still be evident 20 years post-harvest.
2. Materials and Methods
2.1. Study Area
This study was conducted in three boreal forest sites near Sioux Lookout (50°01′ N, 91°28′ W), Timmins (48°21′ N, 81°18′ W), and Kapuskasing (49°09′ N, 82°28′ W), Ontario, Canada. These sites are part of the larger NEBIE Experimental Plot Network, established in 2001 by the Ontario Ministry of Natural Resources (OMNR) as a stand-scale research project across major forest types and soil textures in Ontario’s managed forest (see [30,31] for full details). The three NEBIE sites included in this study are even-aged, fire-origin boreal forest stands, but each represents a different predominant soil texture (Sioux Lookout = sand-dominated, Timmins = silt-dominated, and Kapuskasing = clay-dominated). A detailed description of the sites is given in Table 1.

Table 1.
Pre-harvest (2001) site characteristics. Climate data were obtained from Environment Canada climate normals (1991–2020), except for the silt-dominated site, which had data available from 2009–2020 [32]. Parent material data were obtained from [33]. For understory vegetation, only the three most abundant species are mentioned.
2.2. Experimental Design
From the fall of 2001 to the summer of 2002, each site was divided into four blocks spaced < 5 km apart that maximized environmental variation between blocks and minimized environmental variation within blocks based on soil type, plant composition, and topography [31]. Within each block, three plots (100 m × 200 m, plus a 20 m buffer zone) were randomly assigned to a forest management treatment with a range in management intensity: Control (no harvest), Harvest Only (harvest without post-harvest silviculture), and Harvest Plus (harvest with post-harvest silviculture) (N = 4 per treatment). The Control was designed to have the same conditions as natural regeneration, and treatments were designed to manipulate species composition, with varying regeneration targets for the desired tree species or species combinations (e.g., Harvest Only: 40% stocking; Harvest Plus: 80% stocking) [34]. The Harvest Only and Harvest Plus plots were clearcut-harvested between summer 2002 (Sioux Lookout and Timmins) and fall 2003 (Kapuskasing). At all sites, clearcutting was carried out using full-tree logging to roadside.
Following harvest, no further forest management was conducted in the Harvest Only plots; however, post-harvest silviculture (site preparation, planting, and chemical vegetation control) occurred in the Harvest Plus plots. One to two years post-harvest, approximately 7–16% of the Harvest Plus plots were mechanically site-prepared via scarification using a 2-string skidder configuration, each string with a shark fin barrel and 4 m spiked anchor chain at the sand-dominated site or disc trenching at the silt- and clay-dominated sites. Two to three years post-harvest, aerial seeding (50,000 seeds ha−1) of jack pine (Pinus banksiana Lamb.) at the sand-dominated site, planting (2200 stems ha−1) of white spruce (Picea glauca [Moench.] Voss) at the silt-dominated site, and planting (3200 stems ha−1) of a white and black spruce (Picea mariana [Mill] B.S.P.) mix at the clay-dominated site was carried out to establish a goal of 2000–3000 trees ha−1. Five to six years post-harvest, there were refill plant efforts to achieve stocking of 80% desirable species regeneration at each site (sand-dominated site: 9000 jack pine seedlings, with an average of 550 trees ha−1; silt-dominated site: 730 white spruce trees ha−1; clay-dominated site: 1275 black spruce trees ha−1); this was based on an assessment of 2 m× 2 m quadrats with at least one tree, equating to 2500 trees ha−1. Finally, vegetation management using aerial (clay-dominated site) or backpack application (silt-dominated site) of glyphosate (VisionTM) herbicide (Helena Chemical Company, Collierville, TN, USA) was used to control broadleaved trees and shrubs after three years and five to seven years post-harvest, respectively. No vegetation control was required at the sand-dominated site.
2.3. Forest Floor and Mineral Horizon Sampling
Forest floor horizons (litter and F/H) and the upper mineral soil horizon (0–30 cm depth) were sampled in early summer (June/July) pre-harvest (0) and 5, 14, and 20 years post-harvest at all sites. Within each treatment plot, a permanent 20 m× 20 m grid was established, and three subplots were randomly assigned within the grid. Within each subplot, litter horizon samples (i.e., easily recognized dead material such as leaves and twigs) [35] were collected in a 15 cm × 15 cm square in four randomly selected locations. Any living material (e.g., moss and grass) and materials > 2.5 cm diameter (coarse woody debris) were not collected. F/H horizon samples (i.e., partially and/or fully decomposed organic materials) [35] were collected within the same locations as the litter samples by cutting around the 15 cm × 15 cm square and removing the partially and/or fully decomposed organic materials to the depth of the mineral soil.
Mineral soil samples were collected using a one-piece Dutch auger in the same four locations as the litter and F/H samples. Mineral soil was collected 10 cm at a time, starting at a depth of 0 cm (i.e., where the F/H horizon ends and the mineral soil horizon begins) down to a depth of 30 cm and deposited into freezer bags. The sides of the auger were cleaned between samples to prevent contamination by other soil or surface organic matter. Mineral soil bulk density was assessed in an area adjacent to each soil sampling subplot (n = 3 per plot). The area was cleared of the forest floor to expose the underlying mineral soil, and the top 0–30 cm of mineral soil was collected incrementally using a stainless-steel soil corer (r = 2.65 cm, h = 15.30 cm). All soil horizon samples (forest floor and mineral) were cold-stored at 4 °C prior to analysis.
2.4. Sample Processing
Fresh litter and F/H samples were oven-dried at 70 °C and periodically weighed (to the nearest 0.01 g) until a constant weight was reached (for approximately 24–72 h depending on the wetness of the sample). SOC contents in the litter horizon were estimated as 50.8% and 49.4% dry mass for the boreal conifer (sand-dominated) and boreal mixed-wood (silt- and clay-dominated) sites, respectively, which were established from the Dryad wood C content database [36] using average stem wood C content of 20 conifer (for the sand-dominated site) and 20 conifer and 27 angiosperm (for the silt- and clay-dominated sites) tree species in Canada. SOM (%) in the F/H samples was measured via loss-on-ignition (LOI) at 550 °C for 16 h and then converted to SOC using a conversion factor of 0.56 [37]. SOC in the litter and F/H layers was then converted to Mg ha−1 using the estimated dry mass (g) and sample area size (225 cm2).
Upper mineral soil bulk density samples were oven-dried at 105 °C for 48 h (or until a constant weight was reached), and the auger mineral samples were air-dried at 20–25 °C for 2 weeks. Fresh upper mineral soil auger samples (0–10, 10–20, and 20–30 cm) from the same subplots were then air-dried at 20–25 °C for 2 weeks prior to analysis. Any clods in the air-dried samples were broken apart by hand or with a rubber mallet, then sieved to 2 mm, homogenized, and ground for 2 min with a Retech mortar and pestle. Upper mineral soil samples were analyzed for moisture content, organic matter content (to measure SOC), pH, and total nitrogen (TN). Moisture content was assessed by oven-drying 10 g of upper mineral soil at 105 °C for 24 h or until a constant weight was reached. Moisture content was calculated using the following equation:
where WWT is the wet weight of the soil (g), and DWT is the dry weight of the soil (g). The organic matter content of mineral soil samples (~10 g) was measured via LOI at 550 °C for 16 h. SOM content was then used to calculate SOC (g kg−1) using a conversion factor of 0.56, and a structural water loss correction factor of 0.075 was used to avoid over-estimating SOM (and therefore SOC) for the clay dominated-site [37]. The total nitrogen (TN; g kg−1) of the mineral soil samples was measured using a Vario ISOTOPE Cube EA-IRMS (Elementar Analysis Systems GmbH, Langenselbold, Germany). Upper mineral SOC was converted from g kg−1 to Mg ha−1 using depth (10 cm) and bulk density (g cm−3).
2.5. Twentieth-Year Litterfall and Decompositon
Twenty years post-harvest, litter traps and litter bags were implemented to measure litterfall and decomposition, respectively. Three litter traps (50 cm × 50 cm) were installed within each treatment plot at each site (one per soil sampling subplot; n = 36). Litter traps were made from untreated lumber with 1 mm2 fiberglass mesh (flyscreen mesh) stapled to the bottom of the trap. Litter traps were located 5 m from the NW corner grid post in the direction of the subplot center. Where the ground was sloped, the trap followed the contours of the ground. If tree trunks, tree roots greater than 10 cm high, other plants or trails made it difficult to securely place the trap there, it was moved to the nearest possible location (within 2 m of original position). Eleven litter bags were deployed within each treatment plot at each site (n = 132). Litter bags consisted of oven-dry Whatman No. 1 (11.0 cm) cellulose filter paper (Cytiva, Maidstone, UK) within a 10 cm × 10 cm fiberglass mesh (flyscreen mesh) bag. Filter papers were cut into quarters, oven-dried at 60 °C for 72 h, and weighed to the nearest 0.0001 g. The filter papers were approximately 0.2 g DWT. The mesh bag was created using two identical fiberglass mesh squares sealed together at the edges using a TISH-200 Impulse Sealer (Electric Heating Equipment Co., Ltd., Taipei, Taiwan). Litter bags were located 50 cm from the NW corner grid post in the direction of the subplot center. Litter bags were deployed on the soil surface using a pin flag to secure the litterbag to the ground (ensuring the cellulose paper remained undamaged).
After one year, the contents of the litter traps and litter bags were collected in paper bags and stored at 4 °C until analysis. Any adherent soil particles on the litter bags were gently removed. Tree trunks/branches greater than 5 cm in diameter were not collected; instead, their measurements were recorded, and their weight (g) was estimated using the following equation:
where W is the weight of the wood in Mg, V is the volume (m3), and S is the oven-dry specific gravity of the species [38]. For branches longer than 50 cm in length, parts that were outside of the edges of the litter trap were cut off and not collected. The contents of the litter traps and litter bags were dried in an oven at 70 °C for two weeks, and dry weights (g) were recorded. Litterfall (Mg ha−1 yr−1) was estimated using dry weights and trap size, and decomposition (% mass remaining) was estimated by calculating the percentage mass loss of the cellulose filter paper.
W = V × S,
2.6. Statistical Analysis
All statistical analyses were performed using the R statistical software version 4.1.3 [39]. Separate linear mixed-effects models (LMEs) were used to determine if the SOC stocks in litter, F/H, and mineral soils were different among treatments and sites. Models were fitted using the lmer function in the package ‘lme4’ [40] with predictor variables of treatment (Control, Harvest Only, and Harvest Plus), year (5, 14, and 20 years post-harvest), and site (sand-, silt-, and clay-dominated). Subplots were nested within blocks and treated as random effects, as was the effect of year. Similar LMEs were used to determine if the percentage change in total (litter, F/H, and mineral) SOC was different among treatments from pre-harvest (0) to 20 years post-harvest and to see if litterfall and decomposition were different among treatments 20 years post-harvest; in these models, the effect of year was not included. Type III mixed analysis of variances (ANOVAs) with Satterthwaite’s approximation for degrees of freedom were used to calculate p values of LMEs. If main effects (effects of treatment, year, and/or site) were significant (p < 0.05) for an LME, post hoc pairwise comparisons using Tukey’s adjusted p-values (p.adj) were computed at 95% confidence using the package ‘emmeans’ [41]. Linearity of the relationship between the predictor and the response and homogeneity of error variance were tested visually (see [42]). Normality of errors was assessed visually by plotting the residuals in histograms and normal probability plots and statistically using Shapiro–Wilk’s normality test, where a bell-shaped distribution, residuals falling along a straight line, and p > 0.05 indicated that errors were normally distributed. For all LMEs, the outcome variable (SOC) was log-transformed (if necessary) to meet assumptions of normality. Spearman’s rank-order correlation was used to determine if there was a correlation between decomposition and soil moisture, and these data were plotted using the package ‘ggplot2’.
3. Results
3.1. Forest Floor (L and F/H) and Mineral Horizon SOC Stocks Following Forest Harvesting with and Without Post-Harvest Silviculture
Forest floor (litter and F/H) and mineral soil horizon SOC stocks pre-harvest (0) and 5, 14, and 20 years post-harvest are shown in Figure 1 and Figure 2. Prior to harvest, the F/H and mineral soil horizons were similar across the treatment plots, with the largest SOC stocks being in the F/H (37.1–43.2 Mg ha−1) and mineral (49.2–53.4 Mg ha−1) and the smallest stocks being in the litter horizon (1.7–4.5 Mg ha−1) at all sites. Generally, both the Harvest Only and Harvest Plus treatments resulted in reduced SOC socks in all horizons 5, 14, and 20 years post-harvest compared with the Control. However, no treatment effects were observed in the first decade following harvest; all treatment effects occurred 14 or 20 years post-harvest, and at the sand-dominated site, the Harvest Only treatment had slightly larger SOC stocks compared with the Control and Harvest Plus treatment over time. The SOC stocks in all horizons were significantly different among the sites (litter: F2,63 = 3.67; p = 0.027; F/H: F2,63 = 309.62; p < 0.001; mineral: F2,63 = 62.21; p < 0.001), driven by significantly larger litter SOC at the sand-dominated site 20 years post-harvest compared with the clay-dominated site (p.adj < 0.001), significantly larger F/H SOC at the clay-dominated site in all years compared with the sand- and silt-dominated sites (p.adj < 0.001), and significantly larger mineral SOC at the silt-dominated sites compared with the other two sites 5 and 14 years post-harvest and the silt- and clay-dominated sites compared with the sand-dominated site 20 years post-harvest.
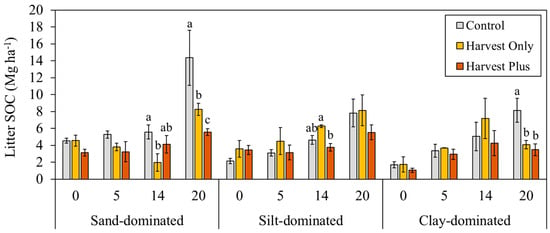
Figure 1.
Average (±SE) soil organic carbon (SOC; Mg ha−1) in the litter horizon pre-harvest (0) and 5, 14, and 20 years post-harvest by silviculture treatment (Control, Harvest Only, and Harvest Plus) at three boreal forest sites varying in mineral soil texture: sand-dominated (Sioux Lookout), silt-dominated (Timmins), and clay-dominated (Kapuskasing) in Ontario, Canada (n = 4). Different lowercase letters indicate statistically significant differences from Tukey’s honest significant difference (HSD) test (pairwise comparisons between each treatment and the Control) within each site and year (p.adj < 0.05).
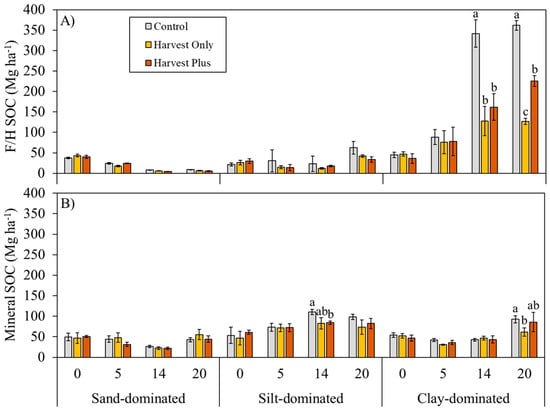
Figure 2.
Pre-harvest average (±SE) soil organic carbon (SOC; Mg ha−1) in the (A) F/H and (B) mineral horizon (0–30 cm depth) pre-harvest (0) and 5, 14, and 20 years post-harvest by silviculture treatment (Control, Harvest Only, and Harvest Plus) at three boreal forest sites varying in mineral soil texture: sand-dominated (Sioux Lookout), silt-dominated (Timmins), and clay-dominated (Kapuskasing) in Ontario, Canada (n = 4). Different lowercase letters indicate statistically significant differences from Tukey’s honest significant difference (HSD) test (pairwise comparisons between each treatment and the Control) within each site and year (p.adj < 0.05).
SOC stocks in the litter horizon generally increased over time (F2,63 = 33.81; p < 0.001), although three way-mixed ANOVA determined there was a significant two-way interaction between treatment and post-harvest year (F4,63 = 3.70; p = 0.006) and site and post-harvest year (F4,63 = 2.77; p = 0.029). Specifically, at the sand- and clay-dominated sites, litter SOC was significantly higher in the Control compared with both treatments 20 years post-harvest (p.adj < 0.05) (Figure 1). Similarly, three-way mixed ANOVA determined that F/H SOC stocks were significantly different among the treatments (F2,63 = 42.10; p < 0.001), where F/H SOC was generally highest in the Control treatments across all post-harvest years; however, the effects were site-dependent (two-way interaction between site and treatment; F4,63 = 23.58; p < 0.001). Specifically, significant treatment effects were only observed at the clay-dominated site, where F/H SOC was significantly higher in the Control compared with the Harvest Only (p.adj < 0.001) and Harvest Plus (p.adj < 0.001) treatments 14 and 20 years post-harvest, and F/H SOC was significantly higher in the Harvest Plus treatment compared with the Harvest Only treatment (p.adj < 0.001) 20 years post-harvest (Figure 2A). Mineral soils revealed similar results to the forest floor horizons, where both the Harvest Only and Harvest Plus treatments significantly reduced SOC stocks at the silt- and clay-dominated sites (F2,63 = 4.17; p = 0.020) but not at the sand-dominated site (p = 0.602), driven by a significant interaction between treatment and site (F4,63 = 18.40; p < 0.001) (Figure 2B). At the silt-dominated site, the Harvest Only treatment had the smallest SOC stocks compared with the Control and Harvest Plus treatment 14 and 20 years post-harvest (Figure 2); however, significant differences were observed 14 years post-harvest only (p.adj = 0.044). SOC stocks were also significantly lower in the Harvest Only treatment at the clay-dominated site 20 years post-harvest (p.adj = 0.023), but at the sand-dominated site, no significant treatment differences were observed. Both treatments did not affect mineral soil physical and chemical properties (i.e., bulk density, moisture, pH, total nitrogen) 5, 14, and 20 years post-harvest (Table 2).
Table 2.
Upper mineral soil (0–30 cm) physiochemical variables (average ± SE; N = 36) 5, 14, and 20 years post-harvest. No significant differences between treatments were found following three-way mixed analysis of variance. N/A = data not available. Different lowercase letters indicate statistically significant differences from Tukey’s honest significant difference (HSD) test (pairwise comparisons between each treatment and the Control) within each site and year (p.adj < 0.05).
3.2. Long-Term (20 Year) Effects of Forest Management on Overall SOC Stocks
The percentage changes in total SOC (forest floor and mineral soil horizon SOC stocks) from pre-harvest (0) to 20 years post-harvest were significantly different among the treatments, driven by significantly larger losses in overall SOC at the sand-dominated site in the Harvest Plus treatment (70% ± 8) compared with the Control (38% ± 10) and Harvest Only (34% ± 15) treatment (F2,27 = 4.56; p = 0.025), with the Harvest Only treatment resulting in the smallest net loss in SOC over time (Figure 3). No treatment effect on total SOC (p > 0.05) was observed at either the silt- or clay-dominated sites, and all treatments resulted in increased SOC over 20 years at these sites. However, the harvesting treatments did have lower net gains in SOC at both sites, with the Harvest Plus treatments having the smallest net gain at the silt-dominated site (22% ± 16) compared with the Control (54% ± 24) and Harvest Only treatment (39% ± 23) and the Harvest Only treatment having the smallest net gain at the clay-dominated site (47% ± 15) compared with the Control (78% ± 17) and Harvest Plus treatment (73% ± 28). The percent changes in total SOC were thus significantly different among the sites (F2,27 = 13.54; p < 0.001), driven by increases in SOC over time at the silt-and clay-dominated sites compared with losses in SOC at the sand-dominated site in all horizons (p.adj < 0.001).
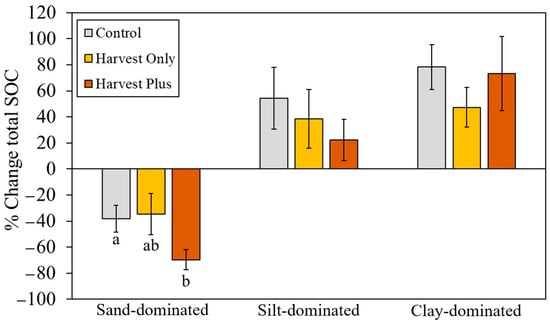
Figure 3.
Average (±SE) percentage change in total (forest floor and mineral) soil organic carbon (SOC) from pre-harvest (0) to 20 years post-harvest by silviculture treatment (Control, Harvest Only, and Harvest Plus) at three boreal forest sites varying in mineral soil texture: sand-dominated (Sioux Lookout), silt-dominated (Timmins), and clay-dominated (Kapuskasing) in Ontario, Canada (n = 4). Different lowercase letters indicate statistically significant differences from Tukey’s honest significant difference (HSD) test (pairwise comparisons between each treatment and the Control) within each site (p.adj < 0.05).
In the forest floor specifically, the Harvest Only treatment reduced forest floor SOC stocks by 147%, 25%, and 25% at the sand-, silt-, and clay-dominated sites, respectively (Figure 4A). Post-harvest silviculture resulted in smaller forest floor SOC losses at the sand- (21%) and clay-dominated (4%) sites but larger forest floor losses at the silt-dominated site (53%), whereas in the mineral horizon, the Harvest Only treatment increased SOC stocks by 32% at the sand-dominated site and reduced SOC stocks by 9% and 27% at the silt- and clay-dominated sites, and the Harvest Plus treatment increased SOC stocks by 2% and 4% in the sand- and clay-dominated sites but reduced SOC stocks by 19% at the silt-dominated site (Figure 4B).
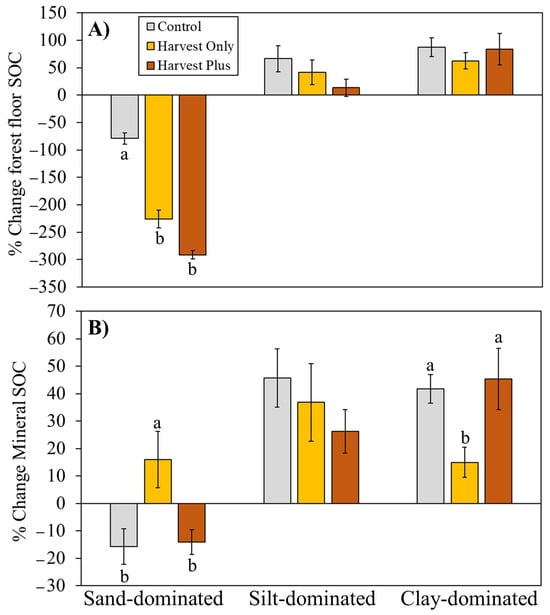
Figure 4.
Average (±SE) percentage change in (A) forest floor (litter and F/H horizons) and (B) mineral horizon soil organic carbon (SOC) from pre-harvest (0) to 20 years post-harvest by forest management treatment (Control, Harvest Only, and Harvest Plus) at three boreal forest sites varying in mineral soil texture: sand-dominated (Sioux Lookout), silt-dominated (Timmins), and clay-dominated (Kapuskasing) in Ontario, Canada (n = 4). Different lowercase letters indicate statistically significant differences from Tukey’s honest significant difference (HSD) test (pairwise comparisons between each treatment and the Control) within each site (p.adj < 0.05).
3.3. Long-Term (20th Year) Effects of Forest Management on Litterfall and Decomposition
There was a significant effect of forest management treatment on litterfall, where litterfall was highest in the Control compared with both treatments (F2,27 = 3.83; p = 0.026; Table 3). The Harvest Only treatment reduced litterfall by 81% and 22% in the sand- and silt-dominated sites, respectively, but did not change litterfall at the clay-dominated site after 20 years. The Harvest Plus treatment reduced litterfall by 38%, 18%, and 38% at the sand-, silt-, and clay-dominated sites. Although the treatment effects varied slightly by site, there was no interaction effect between treatment and site (F4,27 = 1.90; p = 0.118). Comparisons among sites revealed that litterfall was highest at the silt-dominated site, intermediate at the clay-dominated site, and lowest at the sand-dominated site after 20 years (two-way mixed ANOVA; F2,27 = 29.22; p < 0.001)
Table 3.
Average (± SE) dry mass of litterfall (Mg ha−1 yr−1) and decomposition (% mass lost) in the sand-, silt, and clay-dominated boreal forest sites 20 years post-harvest. Different lowercase letters indicate statistically significant differences from Tukey’s honest significant difference (HSD) test (pairwise comparisons between each treatment and the Control) within each site (p.adj < 0.05).
There was a significant effect of treatment (two-way mixed ANOVA; F2,27 = 6.59; p = 0.005; Table 3) on decomposition at the silt- and clay-dominated sites; however, there was also a significant two-way interaction between treatment and site (F4,27 = 4.48; p = 0.007), and no effect of treatment on decomposition was observed at the sand-dominated site (F2,27 = 2.48; p = 0.345). There was also a moderate positive linear association between decomposition and soil moisture 20 years post-harvest (Spearman’s rank correlation; ρ(34) = 0.45; p = 0.006). For both the sand- and silt-dominated sites, both treatments had higher rates of decomposition compared with the Control, though the differences were only significant at the silt-dominated site, where both treatments had 2.5× higher decomposition rates compared with the Control (p.adj < 0.001). The Harvest Only treatment also significantly increased the rate of decomposition at the clay-dominated site (p.adj = 0.043) relative to the Control; however, the Harvest Plus treatment did not change the rate of decomposition relative to the Control (p > 0.05) and was significantly lower compared with the Harvest Only treatment (p.adj < 0.001). Comparisons among sites revealed that the sand-dominated site had significantly lower decomposition compared with the other two sites (two-way mixed ANOVA; F2,27 = 17.82; p < 0.001).
4. Discussion
We hypothesized that the forest management treatments would result in lower SOC values in the long term; over a 20-year period, both forest management treatments generally resulted in reduced total (litter, F/H, and mineral horizon) SOC stocks compared with the control, with the treatment effects being observed only in the second decade post-harvest (14 and 20 years post-harvest). One exception was the sand-dominated site, where the harvest without post-harvest silviculture treatment increased the total SOC stocks after 20 years, although no significant treatment effect was observed. Treatment differences in later years were mainly driven by reduced litter SOC in the harvest with post-harvest silviculture treatment (e.g., site-prepared, planted, and managed for competing vegetation) and reduced forest floor and mineral SOC in the harvesting treatment that was left to revegetate naturally. We also hypothesized that the harvest without post-harvest silviculture treatment would have the lowest SOC stocks; indeed, after 20 years, the F/H and mineral horizon SOC stocks showed signs of recovery in the harvest with post-harvest silviculture treatment, where the stocks were similar to the control. However, the magnitude of the response varied across sites, likely due to inherent mineral soil physiochemical differences across the sites (e.g., bulk density, moisture, pH, and total nitrogen). The sand-dominated site had the smallest total SOC stocks and lost total SOC over time in all treatments, whereas the other two sites increased their overall SOC stocks over time.
It has been widely reported that the forest floor (i.e., litter and F/H) is more directly impacted by silviculture treatments such as harvesting compared with the underlying mineral soil, with these effects being more pronounced in boreal versus temperate forests [28]. Estimates of these reductions in SOC following harvest in conifer/mixed forests are approximately 20–38% in forest floor organic horizons [43,44]. The observed losses in our study were generally within the range of previously reported values in both the harvesting without post-harvest silviculture (~25%) at two of the sites and the harvesting with post-harvest silviculture for all three sites (4%–53%). The exception was at the sand-dominated site, where reductions of 147% were observed in the harvesting without post-harvest silviculture treatment compared with the control. Although this percentage loss seems high, the sand-dominated site had inherently lower SOC in the forest floor horizon, and actual SOC losses were less than 50 Mg ha−1 SOC over the twenty-year period. In the mineral soil, the changes in SOC stocks 20 years post-harvest were similar to that of the forest floor horizon in the harvest without post-harvest silviculture treatment, which is larger than average reported values (3%–9%; [44]), ranging from +32% at the sand-dominated site to −27% at the clay-dominated site. Post-harvest silviculture improved the recovery of mineral SOC at the sand- (2%) and clay (4%)-dominated sites compared with the control but reduced mineral SOC at the silt-dominated site by 19%.
In the reviews [28] and [45] on the effects of forest harvesting on soil productivity, both reviews suggested that changes in mineral SOC following harvesting and post-harvest silviculture may be due to the translocation of carbon into mineral soils instead of mineralization to CO2, explaining why increases or no change in SOC are sometimes observed in upper mineral soil horizons. Similarly, [46] attributed SOC values in the upper mineral soil following mechanical site preparation to the displacement of the forest floor and mixing of the forest floor and mineral pools during mechanical site preparation. This is supported by the authors of [47], who report forest floor SOC stocks decreasing with harvest intensity, while the depth of the forest floor was not significantly different between harvested and uncut coniferous forests, suggesting a mixing of mineral soils into the forest floor (and presumably vice versa). In our study, the percentage losses of SOC in the forest floor at the clay-dominated site (4%) were similar to the percentage gains of SOC in the mineral soil (4%) in the harvesting with post-harvesting silviculture treatment, suggesting translocation of SOC as a possible mechanism at that site.
Following harvest, SOC stocks in the forest floor typically decrease by several mechanisms: physical removal and/or translocation, decreased litter inputs with the removal of vegetation, and/or changes in the rates of decomposition with increased microbial respiration under altered abiotic conditions. The removal of aboveground vegetation via clearcut harvesting not only reduces carbon inputs to a system, but it can also increase surface and mineral soil exposure to direct solar radiation, increasing soil temperatures and, in turn, increasing soil respiration and decomposition [48,49,50]. In our study, harvesting increased the rate of decomposition at the silt- and clay-dominated sites but did not change the rate of decomposition at the sand-dominated site. Reduced or no change in decomposition following harvest has also been reported [51,52,53]. It is likely that decomposition decreases in the surface litter following harvest due to drying from exposure to wind and sunlight, while decomposition simultaneously increases in the F/H layer following harvest due to increased temperature and moisture [13,54]. Indeed, our study showed a positive correlation with moisture and decomposition across the study sites.
Site preparation has been shown to exacerbate SOC losses due to increased decomposition following harvesting. [29] reported 20%–50% smaller SOC stocks in the forest floor after 10 years and suggested that this was a result of enhanced decomposition of woody debris that had either been buried in the forest floor following site preparation, making it more accessible for soil microbes [13], or become fragmented by machinery, promoting decomposition, or both. In the plots that were site-prepared and managed for vegetation, we found increased decomposition at the silt-dominated site but no change and decreased decomposition at the sand- and clay-dominated sites, respectively. Twenty years post-harvest, the vegetation had had time to establish, and fast-growing species (e.g., jack pine at the sand-dominated site and Alnus incana (L.) Moench at the clay-dominated site) may have already experienced crown closure [55,56], leading to increased shading and decreased soil temperatures, which may have decreased the decomposition rates.
Planting may also be considered as a site disturbance that can increase SOC mineralization [15] through exposure of protected SOM to microbial degradation [57] and exacerbate losses of SOC on the forest floor. However, observations of increased respiration have also been attributed to revegetation and increased respiration associated with plant root growth verses microbial respiration [58] while also increasing the amount of carbon inputs to the forest floor. Correspondingly, herbicide use has been shown to decrease SOC in the forest floor by up to 20% [59], as vegetation suppression removes these C inputs. However, the effects of herbicides such as glyphosate are often short-lived [60] being degraded by microbes, and by 14 years post-harvest (7–9 years post-harvest management), the vegetation would have had plenty of time to re-establish on the plots regardless of the site preparation methods. After 20 years, the plots that were managed for vegetation had reduced litter SOC stocks at all sites but showed no differences with control plots for the bulk of the belowground SOC (F/H and mineral horizons), regardless of site. However, F/H and mineral SOC stocks were lowest in the plots left to regenerate naturally following harvest at the clay-dominated site, suggesting that the long-term effects of post-harvest silviculture resulted in relatively smaller SOC losses at this site.
At the same time, physical disturbance during post-harvest silviculture such as compaction can decrease microbial biomass [61] and suppress decomposition in mineral soils [62] while also increasing carbon losses through DOC leaching [63]. That said, the SOC stocks in the mineral soil at the clay-dominated site were lowest in the less intensive forest management treatment (i.e., harvest without post-harvest silviculture) 20 years post-harvest; this could be a result of site preparation in the most intensive treatment mixing carbon from the forest floor into the upper mineral soil [45], but it could also be due to other post-harvest management strategies. The silt- and clay-dominated sites in this study were planted with Picea spp. seedlings 1–2 years following site preparation, and competing vegetation was managed with glyphosate afterwards in the post-harvest silviculture treatment. Although the physical process of planting following site preparation may lead to soil disturbance and increase carbon mineralization in the short-term [15], seedling performance and carbon storage generally increase following site preparation over time, and this may balance or outweigh soil carbon losses overall ([64], but see [59,65]).
Many mechanisms likely contributed to the altered SOC stocks following forest harvest and post-harvest silviculture in our study, including reduced litterfall or changes to litterfall diversity, increased decomposition, changes in microbial biomass and functional diversity, translocation of carbon from the forest floor to the underlying mineral soil, and influx of carbon from dead roots and/or microbes. Further study is needed to assess the weight of each contribution. Inherently different mineral soil physiochemistry, driven by differences in mineralogy and texture at each site, likely contributed to the differing magnitudes of responses to treatments across the sites, though we had no replicates for the soil texture (sand-, silt-, and clay-dominated) and no concrete conclusions can be drawn among the sites.
5. Conclusions
The results in the current study provide valuable insight into how various harvesting and post-harvest silviculture techniques (i.e., clearcut harvesting, mechanical site preparation, planting, and vegetation management using herbicides) affect belowground SOC stocks in both the short and long term in boreal forests and offer insight into how soil texture can play a role in altering the magnitude of these effects. Most forest management studies are short-term (i.e., <1–5 years post-harvest); in this study, most treatment differences were observed from 14 to 20 years post-harvest, highlighting the importance of conducting long-term field experiments in boreal ecosystems. At all sites, both harvesting treatments resulted in smaller total SOC stocks 20 years post-harvest compared with control plots, though the treatment effects seemed to be site-specific. At the clay-dominated site, post-harvest management improved the recovery of SOC stocks lost due to harvesting over time, whereas at the sand-dominated site, post-harvest management depleted SOC stocks compared with the other treatment, and leaving plots to regenerate naturally resulted in smaller SOC losses compared with the control over time. This suggests that sand-dominated sites, with inherently low SOC, may be more susceptible to SOC loss following harvest with post-harvest silviculture compared with more fine-textured sites, but this hypothesis should be confirmed using replicated texture sites. Nevertheless, it seems imperative that silviculture strategies consider site-specific soil properties. Understanding the relationship between C dynamics, forest management, and soil texture is essential for developing sustainable management strategies that optimize carbon sequestration and contribute to the resilience of boreal forest ecosystems in the face of climate change.
Author Contributions
Conceptualization, H.D.D. and Z.L.; methodology, H.D.D. and F.W.B.; formal analysis, H.D.D.; resources, F.W.B. and Z.L.; writing—original draft preparation, H.D.D.; writing—review and editing, H.D.D. and Z.L.; visualization, H.D.D. and Z.L.; supervision, Z.L.; project administration, Z.L. and F.W.B.; funding acquisition, H.D.D., Z.L. and F.W.B. All authors have read and agreed to the published version of the manuscript.
Funding
This work is funded in part by a Natural Sciences and Engineering Research Council of Canada Scholarship (No. 570146-2022) awarded to Holly Deighton, Natural Sciences and Engineering Research Council of Canada Grant (No. 05901-2019) awarded to Dr. Zoë Lindo, and Western University Carbon Solutions Grant awarded to Dr. Zoë Lindo. The NEBIE plot network is supported by Ontario Ministry of Natural Resources and Forestry, Living Legacy Trust, and Forestry Futures Trust.
Data Availability Statement
The data presented in this study are available on request from the corresponding author.
Acknowledgments
We acknowledge Tembec Inc., Domtar Corporation, and Buchanan Forest Products Ltd. for developing and implementing the harvesting and silviculture strategies. We also thank Ondaadiziwin Forest Management Inc., Obishikokaang Resources Corporation, and hme Enterprises, Ltd., for continuing forest operations at the Sioux Lookout site and Green First for forest operations on the Timmins and Kapuskasing sites. We acknowledge John, Amy, Ray, and Riley for field data collections and data management at 5 and 14 years post-harvest. We are grateful for all the support from summer students who have collected NEBIE plot network data over the years.
Conflicts of Interest
Authors declare no conflicts of interest.
Abbreviations
The following abbreviations are used in this manuscript:
| C | Carbon |
| SOM | Soil organic matter |
| SOC | Soil organic carbon |
| F | Fragmented |
| H | Humic |
| CO2 | Carbon dioxide |
| SFM | Sustainable forest management |
| LOI | Loss-on-ignition |
| DWT | Dry weight equivalent |
References
- Crowther, T.W.; Van Den Hoogen, J.; Wan, J.; Mayes, M.A.; Keiser, A.D.; Mo, L.; Averill, C.; Maynard, D.S. The global soil community and its influence on biogeochemistry. Science 2019, 365, eaav0550. [Google Scholar] [CrossRef] [PubMed]
- Pan, Y.; Birdsey, R.A.; Fang, J.; Houghton, R.; Kauppu, P.E.; Kurz, W.A.; Phillips, O.L.; Shvidenko, A.; Lewis, S.L.; Canadell, J.G.; et al. A large and persistent carbon sink in the world’s forests. Science 2011, 333, 988–993. [Google Scholar] [CrossRef] [PubMed]
- Powlson, D.S.; Whitmore, A.P.; Goulding, K.W.T. Soil carbon sequestration to mitigate climate change: A critical re-examination to identify the true and the false. Eur. J. Soil Sci. 2011, 62, 42–55. [Google Scholar] [CrossRef]
- Vanhala, P.; Bergström, I.; Haaspuro, T.; Kortelainen, P.; Holmberg, M.; Forsius, M. Boreal forests can have a remarkable role in reducing greenhouse gas emissions locally: Land use-related and anthropogenic greenhouse gas emissions and sinks at the municipal level. Sci. Total Environ. 2016, 557–558, 51–57. [Google Scholar] [CrossRef]
- Paul, E.A. The nature and dynamics of soil organic matter: Plant inputs, microbial transformations, and organic matter stabilization. Soil Biol. Biochem. 2016, 98, 109–126. [Google Scholar] [CrossRef]
- Kyaschenko, J.; Clemmensen, K.E.; Karltun, E.; Lindahl, B.D. Below-ground organic matter accumulation along a boreal forest fertility gradient relates to guild interaction within fungal communities. Ecol. Lett. 2017, 20, 1546–1555. [Google Scholar] [CrossRef]
- Bradshaw, C.J.A.; Warkentin, I.G. Global estimates of boreal forest carbon stocks and flux. Glob. Planet. Change 2015, 128, 24–30. [Google Scholar] [CrossRef]
- Hashimoto, S.; Suzuki, M. The impact of forest clear-cutting on soil temperature: A comparison between before and after cutting, and between clear-cut and control sites. J. For. Res. 2004, 9, 125–132. [Google Scholar] [CrossRef]
- Devine, W.D.; Harrington, C.A. Influence of harvest residues and vegetation on microsite soil and air temperatures in a young conifer plantation. Agric. For. Meteorol. 2007, 145, 125–138. [Google Scholar] [CrossRef]
- Startsev, A.D.; McNabb, D.H. Effects of skidding on forest soil infiltration in west-central Alberta. Can. J. Soil Sci. 2000, 80, 617–624. [Google Scholar] [CrossRef]
- Schnurr-Pütz, S.; Bååth, E.; Guggenberger, G.; Drake, H.L.; Kirsten, K. Compaction of forest soil by logging machinery favours occurrence of prokaryotes. FEMS Microbiol. Ecol. 2006, 58, 503–516. [Google Scholar] [CrossRef] [PubMed]
- Fujii, K.; Funakawa, S.; Hayakawa, C.; Kosaki, T. Effects of clearcutting and girdling on soil respiration and fluxes of dissolved organic carbon and nitrogen in a Japanese cedar plantation. For. Ecol. Manag. 2021, 498, 119520. [Google Scholar] [CrossRef]
- Prescott, C.E.; Reid, A.; Wu, S.Y.; Nilsson, M.-C. Decomposition rates of surface and buried forest-floor material. Can. J. For. Res. 2017, 47, 1140–1144. [Google Scholar] [CrossRef]
- Mayer, M.; Prescott, C.E.; Abaker, W.E.A.; Augusto, L.; Cécillon, L.; Ferreira, G.W.D.; James, J.; Jandl, R.; Katzensteiner, K.; Laclau, J.-P.; et al. Tamm Review: Influence of forest management activities on soil organic carbon stocks: A knowledge synthesis. For. Ecol. Manag. 2020, 466, 118127. [Google Scholar] [CrossRef]
- Jandl, R.; Lindner, M.; Vesterdal, L.; Bauwens, B.; Baritz, R.; Hagedorn, F.; Johnson, D.W.; Minkkinen, K.; Byrne, K.A. How strongly can forest management influence soil carbon sequestration? Geoderma 2007, 137, 253–268. [Google Scholar] [CrossRef]
- Mjöfors, K.; Strömgren, M.; Nohrstedt, H.-Ö.; Johansson, M.-B.; Gärdenäs, A.I. Indications that site preparation increases forest ecosystem carbon stocks in the long term. Scand. J. For. Res. 2017, 32, 717–725. [Google Scholar] [CrossRef]
- Pan, P.; Zhao, F.; Ning, J.; Zhang, L.; Ouyang, X.; Zang, H. Impact of understory vegetation on soil carbon and nitrogen dynamic in aerially seeded Pinus massoniana plantations. PLoS ONE 2018, 13, e0191952. [Google Scholar] [CrossRef]
- Natural Resources Canada. The State of Canada’s Forests: Annual Report 2023; Natural Resources Canada: Ottawa, ON, Canada, 2023; 104p, Available online: https://natural-resources.canada.ca/sites/nrcan/files/forest/sof2023/NRCAN_SofForest_Annual_2023_EN_accessible-vf.pdf (accessed on 12 April 2024).
- Certification Canada. Forest Management Certification in Canada: 2022 Year-End Status Report Canada. Forest Products Association of Canada. 18p. Available online: https://certificationcanada.org/wp-content/uploads/2023/05/2022-Yearend-SFM-Certification-Detailed-Report.pdf (accessed on 12 April 2024).
- Foster, B.C.; Wang, D.; Keeton, W.S.; Ashton, M.S. Implementing sustainable forest management using six concepts in an adaptive management framework. J. Sustain. For. 2010, 29, 79–108. [Google Scholar] [CrossRef]
- Campbell, R.A. Herbicide use for forest management in Canada: Where we are and where we are going. For. Chron. 1990, 66, 355–360. [Google Scholar] [CrossRef]
- Natural Resources Canada. Forest Herbicide Research. Canadian Forest Service—Great Lakes Forestry Centre. Bulletin 53. Available online: https://publications.gc.ca/collections/collection_2012/rncan-nrcan/Fo122-1-53-2012-eng.pdf (accessed on 14 May 2024).
- Pennock, D.J. Soil genesis. In Digging into Canadian Soils; Krzic, M., Walley, F., Diochon, A., Paré, M.C., Farrell, R., Eds.; Canadian Society of Soil Science: Pinawa, MB, Canada, 2021; pp. 13–65. ISBN 978-0-88880-670-3. [Google Scholar]
- von Lützow, M.; Kögel-Knabner, I.; Ludwig, B.; Matzner, E.; Flessa, H.; Ekschmitt, K.; Guggenberger, G.; Marschner, B.; Kalbitz, K. Stabilization mechanisms of organic matter in four temperate soils: Development and application of a conceptual model. J. Plant Nutr. Soil Sci. 2008, 171, 111–124. [Google Scholar] [CrossRef]
- Schweizer, S.A.; Mueller, C.W.; Höschen, C.; Ivanov, P.; Kögel-Knabner, I. The role of clay content and mineral surface area for soil organic carbon storage in an arable toposequence. Biogeochemistry 2021, 156, 401–420. [Google Scholar] [CrossRef]
- Angst, G.; Pokorný, J.; Mueller, C.W.; Prater, I.; Preusser, S.; Kandeler, E.; Meador, T.; Straková, P.; Hájek, T.; van Buiten, G.; et al. Soil texture affects the coupling of litter decomposition and soil organic matter formation. Soil Biol. Biochem. 2021, 159, 108302. [Google Scholar] [CrossRef]
- Huang, M.; Zettl, J.D.; Barbour, L.; Elshorbagy, A.; Cheng Si, B. The impact of soil moisture availability on forest growth indices for variably layered coarse-textured soils. Ecohydrology 2013, 6, 214–227. [Google Scholar] [CrossRef]
- Thiffault, E.; Hannam, K.D.; Paré, D.; Titus, B.; Hazlett, P.W.; Maynard, D.G.; Brais, S. Effects of forest biomass harvesting on soil productivity in boreal and temperate forests—A review. Environ. Rev. 2011, 19, 278–309. [Google Scholar] [CrossRef]
- Piirainen, S.; Finér, L.; Starr, M. Changes in forest floor and mineral soil carbon and nitrogen stocks in a boreal forest after clear-cutting and mechanical site preparation. Eur. J. Soil Sci. 2015, 66, 735–743. [Google Scholar] [CrossRef]
- Bell, F.W.; Shaw, M.; Dacosta, J.; Newmaster, S.G. The NEBIE plot network: Background and experimental design. For. Chron. 2017, 93, 87–94. [Google Scholar] [CrossRef]
- Searle, E.B.; Bell, F.W.; Dacosta, J.; Deighton, H.D. Effects of silvicultural treatments on post-harvesting residual tree mortality. For. Ecol. Manag. 2022, 506, 119974. [Google Scholar] [CrossRef]
- Environment Canada. 1991–2020 Canadian Climate Normals. 2024. Available online: https://climate.weather.gc.ca/climate_normals/ (accessed on 22 November 2022).
- Wester, M.C.; Benson, B.L.; Crins, W.J.; Uhlig, P.W.C.; Gray, P.A. The Ecosystems of Ontario, Part 2: Ecodistricts; Science and Research Technical Report TR-26; Ontario Ministry of Natural Resources and Forestry, Science and Research Branch: Peterborough, ON, Canada, 2018; 474p. [Google Scholar]
- Bell, F.W.; Parton, J.; Stocker, N.; Joyce, D.G.; Reid, D.E.B.; Wester, M.; Kayahara, G.; Towill, B. Developing a silvicultural framework and definitions for use in forest management planning and practice. For. Chron. 2008, 84, 678–693. [Google Scholar] [CrossRef]
- Soil Classification Working Group. The Canadian System of Soil Classification, 3rd ed.; Agriculture and Agri-Food Canada Publications 1646 (Revised); National Research Council of Canada: Ottawa, ON, Canada, 1998; 187p, ISBN 0-660-17404-9.
- Thomas, S.C.; Martin, A.R. Carbon content of tree tissues: A synthesis. Forests 2012, 3, 332–352. [Google Scholar] [CrossRef]
- Hoogsteen, M.J.J.; Lantinga, E.A.; Bakker, E.J.; Groot, J.C.J.; Tittonell, P.A. Estimating soil organic carbon through loss on ignition: Effects of ignition conditions and structural water loss. Eur. J. Soil Sci. 2015, 66, 320–328. [Google Scholar] [CrossRef]
- Woodall, C.W.; Heath, L.S.; Domke, G.M.; Nichols, M.C. Methods and Equations for Estimating Aboveground Volume, Biomass, and Carbon for Trees in the U.S. Forest Inventory; General Technical Report NRS-26; United States Department of Agriculture, Forest Service, Northern Research Station: Newtown Square, PA, USA, 2010; 30p.
- R Core Team. R: A Language and Environment for Statistical Computing; R Foundation: Kaysville, UT, USA, 2024; Available online: https://ringo.ams.stonybrook.edu/images/2/2b/Refman.pdf (accessed on 22 January 2025).
- Bates, D.; Mächler, M.; Bolker, B.; Walker, S. Fitting linear mixed-effects models using lme4. J. Stat. Softw. 2015, 67, 1–48. [Google Scholar] [CrossRef]
- Lenth, R.; Lenth, M.R. Package ‘lsmeans’. Am. Stat. 2018, 34, 216–221. [Google Scholar] [CrossRef]
- Zuur, A.F.; Ieno, E.N.; Elphick, C.S. A protocol for data exploration to avoid common statistical problems. Methods Ecol. Evol. 2010, 1, 3–14. [Google Scholar] [CrossRef]
- Nave, L.E.; Vance, E.D.; Swanston, C.W.; Curtis, P.S. Harvest impacts on soil carbon storage in temperate forests. For. Ecol. Manag. 2010, 259, 857–866. [Google Scholar] [CrossRef]
- James, J.; Harrison, R. The effect of harvest on forest soil carbon: A meta-analysis. Forests 2016, 7, 308. [Google Scholar] [CrossRef]
- Achat, D.L.; Fortin, M.; Landmann, G.; Ringeval, B.; Augusto, L. Forest soil carbon is threatened by intensive biomass harvesting. Sci. Rep. 2015, 5, 15991. [Google Scholar] [CrossRef]
- Schmidt, M.G.; Macdonald, S.E.; Rothwell, R.L. Harvesting and site preparation effects on soil chemical properties. Can. J. Soil Sci. 1996, 76, 531–540. [Google Scholar] [CrossRef]
- Lindo, Z.L.; Visser, S. Microbial biomass, nitrogen and phosphorus mineralization, and mesofauna in boreal conifer and deciduous forest floors following partial and clear-cut harvesting. Can. J. For. Res. 2003, 33, 1610–1620. [Google Scholar] [CrossRef]
- Hart, G. Humus Depths Under Cut and Uncut Northern Hardwood Forests; Forest Research Notes No. 113; Forest Service U.S. Department of Agriculture, Northeastern Forest Experiment Station: Upper Darby, PV, USA, 1961; 4p. Available online: https://www.govinfo.gov/content/pkg/GOVPUB-A13-PURL-gpo44280/pdf/GOVPUB-A13-PURL-gpo44280.pdf (accessed on 21 January 2025).
- Covington, W.W. Changes in forest floor organic matter and nutrient content following clear cutting in northern hardwoods. Ecology 1981, 62, 41–48. Available online: https://www.jstor.org/stable/1936666 (accessed on 22 January 2025). [CrossRef]
- Mayer, M.; Sandén, H.; Rewald, B.; Godbold, D.L.; Katzensteiner, K. Increase in heterotrophic soil respiration by temperature drives decline in soil organic carbon stocks after forest windthrow in a mountainous ecosystem. Funct. Ecol. 2017, 31, 1163–1172. [Google Scholar] [CrossRef]
- Binkley, D. Does forest removal increase rates of decomposition and nitrogen release? For. Ecol. Manag. 1984, 8, 229–233. [Google Scholar] [CrossRef]
- Prescott, C.E.; Blevins, L.L.; Staley, C.L. Effects of clear-cutting on decomposition rates of litter and forest floor in forests of British Columbia. Can. J. For. Res. 2000, 30, 1751–1757. [Google Scholar] [CrossRef]
- Giasson, M.-A.; Coursolle, C.; Margolis, H.A. Ecosystem-level CO2 fluxes from a boreal cutover in eastern Canada before and after scarification. Agric. For. Meteorol. 2006, 140, 23–40. [Google Scholar] [CrossRef]
- Yanai, R.D.; Currie, W.S.; Goodale, C.L. Soil carbon dynamics after forest harvest: An ecosystem paradigm reconsidered. Ecosystems 2003, 6, 197–212. [Google Scholar] [CrossRef]
- Vincent, A.B. Growth and numbers of speckled alder following logging of black spruce peatlands. For. Chron. 1964, 40, 515–518. [Google Scholar] [CrossRef]
- Morris, D.M.; Reid, D.E.B.; Kwiaton, M.; Hunt, S.L.; Gordon, A.M. Comparing growth patterns of jack pine and black spruce in mixed natural stands and plantations. Écoscience 2014, 21, 1–10. [Google Scholar] [CrossRef]
- Kristensen, H.L.; Debosz, K.; McCarty, G.W. Short-term effects of tillage on mineralization of nitrogen and carbon in soil. Soil Biol. Biochem. 2003, 35, 979–986. [Google Scholar] [CrossRef]
- Londo, A.J.; Messina, M.G.; Schoenholtz, S.H. Forest harvesting effects on soil temperature, moisture, and respiration in a bottomland hardwood forest. Soil Sci. Soc. Am. J. 1999, 63, 637–644. [Google Scholar] [CrossRef]
- Burgess, D.; Baldock, J.A.; Wetzell, S.; Brand, D.G. Scarification, fertilization and herbicide treatment effects on planted conifers and soil fertility. Plant Soil 1995, 168–169, 513–522. [Google Scholar] [CrossRef]
- Borggaard, O.K.; Gimsing, A.L. Fate of glyphosate in soil and the possibility of leaching to ground and surface waters: A review. Pest Manag. Sci. 2008, 64, 441–456. [Google Scholar] [CrossRef]
- Frey, B.; Kremer, J.; Rüdt, A.; Sciacca, S.; Matthies, D.; Lüscher, P. Compaction of forest soils with heavy logging machinery affects soil bacterial community structure. Eur. J. Soil Biol. 2009, 45, 312–320. [Google Scholar] [CrossRef]
- Tan, X.; Chang, S.X.; Kabzems, R. Effects of soil compaction and forest floor removal on soil microbial properties and N transformations in a boreal forest long-term soil productivity study. For. Ecol. Manag. 2005, 217, 158–170. [Google Scholar] [CrossRef]
- Nieminen, M. Export of dissolved organic carbon, nitrogen and phosphorus following clear-cutting of three Norway spruce forests growing on drained peatlands in southern Finland. Silva Fenn. 2004, 38, 123–132. [Google Scholar] [CrossRef]
- Löf, M.; Dey, D.C.; Navarro, R.M.; Jacobs, D.F. Mechanical site preparation for forest restoration. New For. 2012, 43, 825–848. [Google Scholar] [CrossRef]
- Sartori, F.; Markewitz, D.; Borders, B.E. Soil carbon storage and nitrogen and phosphorous availability in loblolly pine plantations over 4 to16 years of herbicide and fertilizer treatments. Biogeochemistry 2007, 84, 13–30. [Google Scholar] [CrossRef]
Disclaimer/Publisher’s Note: The statements, opinions and data contained in all publications are solely those of the individual author(s) and contributor(s) and not of MDPI and/or the editor(s). MDPI and/or the editor(s) disclaim responsibility for any injury to people or property resulting from any ideas, methods, instructions or products referred to in the content. |
© 2025 by the authors. Licensee MDPI, Basel, Switzerland. This article is an open access article distributed under the terms and conditions of the Creative Commons Attribution (CC BY) license (https://creativecommons.org/licenses/by/4.0/).