Abstract
Phosphorus (P) is a pivotal element in plant energy metabolism and growth, and P limitation is widespread among plants in nature. However, our understanding of how epiphytes allocate P and adapt to P-deficient environments remains limited. We selected an obligate epiphyte Pyrrosia sheareri from a subtropical forest as our research subject. We compared its carbon (C)–nitrogen (N)–P ecological stoichiometry, P fractions, and morphological and physiological traits under the two habitats (trunk-epiphytic and rock-epiphytic). We also constructed a plant trait network method (PTN) that includes 62 traits to explore the co-variation characteristics of plant traits across the whole plant and identify the hub traits. We found that the following: (1) Habitat type significantly affects plant P concentration, with trunk-epiphytic plants having higher P concentration than rock-epiphytic plants. Pyrrosia sheareri may be more strongly limited by P according to the results of C-N-P ecological stoichiometry. (2) Epiphytic habitats significantly affect plant P fractions but do not influence the relative allocation of P fractions. (3) Compared with rock-epiphytic plants, trunk-epiphytic plants adopt a root resource-acquisition strategy rather than relying on leaves. (4) P-related indicators link ecological stoichiometry with morphological and physiological traits and are hub traits in PTN. Overall, P. plays a key functional role in the environmental acclimatization of Pyrrosia sheareri, highlighting the morphological and physiological adaptability of epiphytes to various habitats in terms of P availability, allocation, and storage.
1. Introduction
Phosphorus (P) plays a key role in various aspects of plant biology, including genetics (DNA), transcription (RNA), cell membrane structure (phospholipids), energy transfer (ATP, ADP, NADPH), and the regulation of protein functions (phosphorylated proteins) [1,2,3,4]. These functions directly impact plant physiology, morphology, and growth [1,5,6,7]. However, natural plant growth is often constrained by limited P availability [4,7,8,9,10]. Epiphytes, which grow on other plants or rocks without soil contact, face particular challenges in P acquisition due to their distance from mineral-rich soil [11,12,13]. Despite this, our understanding of how epiphytes allocate P and adapt to P-deficient environments remains limited.
Leaf carbon (C)–nitrogen (N)–P ecological stoichiometric ratios are key indicators of nutrient limitations [8,14,15,16]. For ground-based vascular plants, a leaf N:P ratio above 16 suggests P limitation, below 14 indicates N limitation, and intermediate values imply co-limitation [17,18]. Many epiphytes have leaf N:P ratios below 10, leading some researchers to believe they are N-limited [12,19,20,21]. However, resorption ratios provide another perspective: ratios of N resorption to P resorption above 1 suggest N limitation, while those below 1 indicate P limitation [22]. A recent study of subtropical forest epiphytes shows that most have leaf N resorption to P resorption ratios below 1, implying P limitation [21]. This highlights the need for further research on P limitation in epiphytes, especially in different epiphytic habitats.
In plants, P sequential chemical extraction method is used to separate and measure five functional P fractions, namely orthophosphate P (Pi), nucleic acid P (PN), lipid P (PL), low-molecular-weight metabolites P (PM), and residual P (PR) [2,3,4]. Pi can be transported within plant cells, tissues, and organs to regulate the absorption, transport, and allocation of phosphorus in plants [1]. Studies have shown that the concentration of inorganic phosphate (Pi) in plant vacuoles can account for up to 80% of the total cellular Pi, serving as phosphorus storage and buffering the changes in Pi concentration in the cytoplasm [1,2]. The higher the phosphorus supply to the plant, the greater the proportion of Pi in the vacuoles [1,7,23]. PN, which originates from DNA and RNA, is responsible for the storage and transcription of genetic information [2,5]. The higher the PN content, the more actively the plant grows [23,24,25]. PL comes from phospholipids, which are a major component of cell membranes and help maintain the stability of the cell membrane [2,24]. PM originates from energy-transferring compounds such as ATP, ADP, and NADPH, indicating the metabolic activity of plants [5,23,24]. PR originates from phosphorylated proteins and other phosphorus compounds that remain after extraction [2,5]. Therefore, changes in the concentrations and proportions of P fractions reflect the utilization and P allocation by plants under specific P supply conditions. A few studies have confirmed that the P fractionation method has potential value in exploring environmental P limitations, plant P allocation and utilization, and linking physiological and morphological traits [7,24,25].
Furthermore, the plant trait network (PTN), constructed through correlations among plant traits, could map and integrate the co-variation in traits across different plant organs, and helps identify hub traits [26,27]. Currently, the PTN approach has been used at multiple scales to explore the co-variation in plant traits and their responses to the environment. Applied at various scales, it has revealed intraspecific trait variation in populations, key traits in crop domestication, interspecific patterns in wetland species, and shifts in tundra and forest ecosystems [28,29,30,31,32]. Therefore, the PTN is an appropriate method for exploring the co-variation characteristics of epiphytes and identifying central traits.
Obligate epiphytes, growing on tree trunks or rocks and unable to thrive in mineral soil naturally, are ideal for studying plant adaptation to nutrient-poor habitats and expanding our knowledge of plant adaptation to special habitats [12,33,34]. To explore nutrient limitation in epiphytes and the co-variation in nutrients with functional traits, we selected Pyrrosia sheareri (epiphytic on tree trunks or stone surfaces), an obligatory epiphytic fern from subtropical montane forests as our research subject. By using C-N-P ecological stoichiometry, P fractionation, and PTN method, we explored the nutrient limitation characteristics of Pyrrosia sheareri under the two epiphytic habitats and identified hub traits. Stemflow from tree trunks is often rich in N and P nutrients and plays an important role in the redistribution of forest nutrients [35,36]. Compared with plants growing on rocks, plants on tree trunks are more likely to benefit from this nutrient-rich stemflow, maybe leading to an increase in nutrient content in plant organs and significant differences in P component allocation and functional traits [1,2,4]. Therefore, we proposed the following hypotheses: 1. The habitat type significantly affects P concentrations in plant organs, with plants in the trunk-epiphytic subpopulation having higher P concentrations than rock-epiphytic plants. 2. Compared with plants in the rock-epiphytic subpopulation, trunk-epiphytic plants allocate more P to Pi and PN. 3. Trunk-epiphytic plants adopt a resource-acquisition strategy (e.g., higher leaf net photosynthetic rate and specific root length). 4. P-related indicators link C-N-P ecological stoichiometry with morphological and physiological traits and are hub traits in PTN.
2. Materials and Methods
2.1. Study Site
The study area was situated in Weining County, northwest Guizhou Province, China, within the Yunnan–Kweichow Plateau. This region has a mean elevation of 2200 m and experiences a subtropical monsoon humid climate, characterized by an annual mean temperature of approximately 11.3 °C, an average annual precipitation of 871.8 mm, and a mean relative humidity of 77.8%. The climax vegetation here is evergreen broad-leaved forests, with sclerophyllous oaks as the dominant species [37]. However, due to historical logging activities and agricultural expansion, most of these oak forests have been lost [38].
Our research site (26°56′25″ N, 104°25′9″ E; 2460 m a.s.l.) is centrally located within Weining County and features an old-growth oak forest (Figure 1). This forest has been traditionally preserved by local villagers as fengshui woods and has received enhanced protection from the forestry department in recent years.
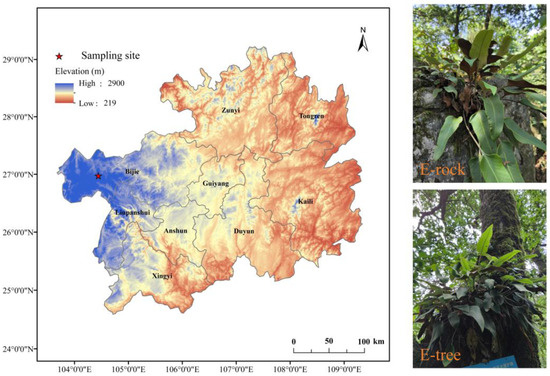
Figure 1.
Map of study site (red star) and natural habitat photographs of Pyrrosia sheareri plants growing epiphytically on rock (E-rock) and on tree trunk (E-tree).
The dominant plant species in this forest is Quercus rehderiana Hand.-Mazz. (Flora of China), a tall arbor [38]. The region is characterized by perennial fog and high humidity, creating favorable conditions for epiphytic plants. Notable epiphytes include Pyrrosia sheareri (Baker) Ching, Lepisorus contortus (Christ) Ching, Usnea diffracta Vain (Flora of China), and various lichens. Among these, Pyrrosia sheareri (Flora of China), a fern, is the most abundant epiphyte in the Quercus rehderiana forest, thriving not only on tree trunks (Quercus rehderiana—the bark is grayish-brown, relatively rough, and occurs in long or thin irregular plates, peeling off in scales) but also on limestone surfaces (mainly composed of calcium carbonate, typically gray, dense, and massive, and fizzes upon contact with acid) (Figure 1).
2.2. Field Sampling Design and Sampling
In July 2024, during the active plant growth period, we established five 20 m × 20 m quadrats within the forest plot, with each quadrat spaced at least 30 m apart. In each quadrat, we selected three healthy Pyrrosia sheareri plants growing epiphytically on tree trunks and three growing on rocks for the measurement of leaf physiological traits and sampling.
After measuring leaf physiological traits, we collected three tree trunk-growing Pyrrosia sheareri plants and separated them into leaves, stems, and roots. Each organ was rinsed three times with distilled water to remove impurities and soil. The samples were then divided into three parts: the first portion was stored in a plastic-sealed bag at 4 °C for morphological and physiological measurements; the second portion was placed in a kraft paper bag for element content determination; and the third portion was stored in a 50 mL centrifuge tube with dry ice at −80 °C for P fraction analysis. The collection process for rock-growing Pyrrosia sheareri plants was identical.
2.3. Measurement of Morphological and Physiological Traits of Leaf, Stem, and Root
2.3.1. Leaf Traits
In July 2024, during the growing season, we conducted field measurements of leaf photosynthetic parameters on sunny mornings between 9:00 and 11:00, using a portable photosynthesis and fluorescence system (Yaxin-1105, Yaxin, Beijing, China). Measurements were taken under controlled conditions: light intensity was set at 1500 μmol m−2 s−1 using the instrument’s artificial light source, incoming CO₂ concentration was maintained at 400 ppm, and temperature was kept at 25 °C. Prior to each measurement, leaves were allowed to acclimate to these conditions for 15 min. For each Pyrrosia sheareri plant, 3 intact leaves were selected for measurement, and data were averaged to obtain a single sample value. The parameters measured included net photosynthetic rate (Pn, μmol m−2 s−1), transpiration rate (Tr, mmol m−2 s−1), and water use efficiency (WUE, calculated as Pn/Tr, μmol mmol−1).
In the laboratory, we further analyzed leaf morphological and physiological traits using samples preserved in plastic-sealed bags [39,40]. For each sample, 8 to 10 leaves were selected, wiped dry, and used to measure leaf thickness (LT, μm), leaf dry matter content (LDMC, %), and specific leaf area (SLA, cm2/g). LT was measured using an optical microscope (Leica DM2500, Leica Mikrosysteme Vertrieb GmbH, Wetzlar, Germany) after histological sectioning. SLA was calculated by dividing leaf area (measured with an HP Scanjet M231 scanner and ImageJ2 software) by leaf mass (measured with an electronic balance precise to 0.0001 g). LDMC was calculated as the ratio of leaf dry mass to fresh mass, with dry mass obtained by drying leaves at 70 °C for 48 h and weighing them with the same balance
2.3.2. Stem Traits
In our study, we assessed two key stem physiological traits: stem dry matter content (SDMC, %) and stem tissue density (STD, g cm−3) [39]. For SDMC, we collected three 3–5 cm long stem segments from the plastic-sealed samples, dried their surfaces with absorbent paper, and weighed them fresh using an electronic balance (precision 0.0001 g). The segments were then oven-dried at 70 °C for 72 h and re-weighed to obtain dry mass. SDMC was calculated as the ratio of dry mass to fresh mass. For STD, we collected three similar stem segments, dried their surfaces, and measured their volume using water displacement in a glass beaker. The segments were then dried at 70 °C for 72 h and weighed again. STD was calculated as the ratio of dry mass to volume.
2.3.3. Root Traits
We measured six important root morphological traits, including specific root length (SRL, cm g−1), specific root surface area (SRA, cm2 g−1), root tissue density (RTD, g cm−3), mean root diameter (RD, mm), number of root tips per unit mass (NRT, no. g−1), and number of root branches per unit mass (NRB, no. g−1) [28,41,42]. We selected an intact root system sample from the plastic-sealed bag and measured root length, surface area, volume, root diameter (RD), number of root tips (NRT), and number of root branches (NRB) using a root scanning and analysis system (DJ-GX02, Dianjiang Technology Co., Ltd., Shanghai, China). The root sample was then dried at 70 °C for 72 h and weighed using an electronic balance. Specific root length (SRL), specific root area (SRA), and root diameter (RD) were calculated by dividing root length, surface area, and diameter by root dry mass, respectively.
2.4. Measurement of C-N-P Ecological Stoichiometry in Leaf, Stem, and Root
The dried leaf, stem, and root samples were ground into fine powder using a crusher and then sifted through a 60-mesh sieve [38]. N and C concentrations were measured using a Dumas-type combustion C-N elemental analyzer (Vario MAX CN, Elementar Analysensysteme GmbH, Langenselbold, Germany), and P concentration was measured using an inductively coupled plasma atomic emission spectrometer (iCAP 7400, Thermo Fisher Scientific, MA, USA). We obtained concentrations for leaf C (L-TC), leaf N (L-TN), leaf P (L-TP), stem C (S-TC), stem N (S-TN), stem P (S-TP), root C (R-TC), root N (R-TN), and root P (R-TP). We then calculated the following ratios: leaf C/N (L-C/N), C/P (L-C/P), and N/P (L-N/P); stem C/N (S-C/N), C/P (S-C/P), and N/P (S-N/P); and root C/N (R-C/N), C/P (R-C/P), and N/P (R-N/P).
2.5. Analyses of Phosphorus Fractions
Leaf P was fractionated into five forms following Tsujii et al.’s method (2024) [5]: orthophosphate P (Pi), nucleic acid P (PN), lipid P (PL), low-molecular-weight metabolites P (PM), and residual P (PR). Leaf, stem, and root samples were stored at −80 °C, then freeze-dried for 7 days and ground into powder. For Pi measurement, 25 mg of powdered sample was dissolved in glacial acetic acid and analyzed using the molybdenum blue method. For PL, PN, PR, and primary metabolite P (including Pi and PM) measurements, 50 mg of leaf powder was sequentially extracted with appropriate reagents. PM concentration was calculated by subtracting Pi from primary metabolite P. We obtained the following P fractions: leaf Pi (L-Pi), leaf PN (L-PN), leaf PL (L-PL), leaf PM (L-PM), leaf PR (L-PR), stem Pi (S-Pi), stem PN (S-PN), stem PL (S-PL), stem PM (S-PM), stem PR (S-PR), root Pi (R-Pi), root PN (R-PN), root PL (R-PL), root PM (R-PM) and root PR (R-PR). We then calculated the percentage of each P fraction relative to total P concentration in each organ: L-PPi (L-Pi/L-TP), L-PPN (L-PN/L-TP), L-PPL (L-PL/L-TP), L-PPM (L-PM/L-TP), L-PPR (L-PR/L-TP), S-PPi (S-Pi/S-TP), S-PPN (S-PN/S-TP), S-PPL (S-PL/S-TP), S-PPM (S-PM/S-TP), S-PPR (S-PR/S-TP), R-PPi (R-Pi/R-TP), R-PPN (R-PN/R-TP), R-PPL (R-PL/R-TP), R-PPM (R-PM/R-TP), and R-PPR (R-PR/R-TP).
2.6. Data Analysis
We used Student’s t-tests in IBM SPSS Statistics for Windows, version 27.0 (IBM Corp., Armonk, NY, USA) to compare Pyrrosia sheareri plants in different habitats (E-tree: epiphytic on tree trunks vs. E-rock: epiphytic on rock surfaces) based on C-N-P ecological stoichiometry, P fractions and proportions, and morphological and physiological traits. Before analysis, we tested group variances using Levene’s test and log-transformed data if the homogeneity condition was not met. One-way ANOVA and multiple comparisons (Duncan) were used to test differences in C-N-P ecological stoichiometry and P fractions and proportions among different plant organs (leaves, stems, and roots). Then, we performed principal component analysis (PCA) on morphological and physiological traits to reduce dimensionality and identify adaptive strategies of Pyrrosia sheareri in different habitats. All plots were created using OriginPro 2024b (OriginLab Corporation, Northampton, MA, USA). Differences were considered to be statistically significant at p < 0.05.
In addition, we used plant trait networks (PTNs) to integrate all organ-level indicators and identify hub traits. The construction and visualization of PTNs were carried out using the MultiTraits package in R version 4.4.3 (R Core Team 2025). The data were log-transformed before the construction of a PTN. To avoid spurious correlations among plant traits, we set significance thresholds of |Pearson’s r| > 0.2 and p < 0.05. To describe the importance of traits within FTN, we used two parameters to quantify the hub traits—the degree (k) and betweenness (B). Specifically, the MultiTraits package used the False Discovery Rate (FDR) method to strictly adjust p-values, reducing false-positive linkages in the PTN [43].
3. Results
3.1. Variation in C-N-P Ecological Stoichiometry Between Rock-Epiphytic and Trunk-Epiphytic Habitats
When comparing rock-epiphytic and trunk-epiphytic habitats, no significant differences (Figure 2A) were found in C concentrations across all plant organs (leaf, stem, and root). However, stem N concentration was significantly higher (Figure 2B) in trunk-epiphytic habitats than in rock-epiphytic habitats, with no significant differences observed in leaves and roots. Notably, trunk-epiphytic conditions exhibited significantly higher P concentrations than rock-epiphytic conditions across all plant organs (Figure 2C). Correspondingly, trunk-epiphytic conditions had significantly lower stem C/N ratios than rock-epiphytic conditions, while no significant differences were found in leaves and roots (Figure 2D). Trunk-epiphytic conditions also had significantly lower C/P ratios in all organs compared to rock-epiphytic conditions (Figure 2E). Additionally, trunk-epiphytic conditions showed significantly lower N/P ratios in leaves and stems than rock-epiphytic conditions, with no significant differences in roots (Figure 2F).
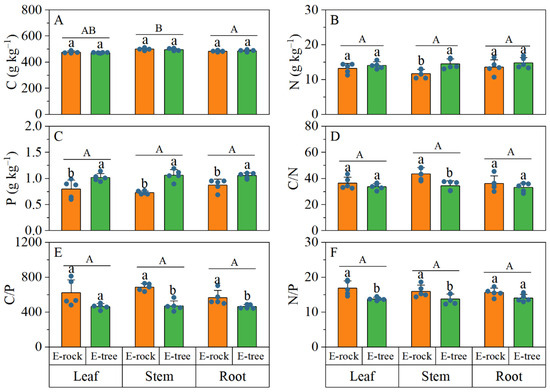
Figure 2.
Differences in C-N-P ecological stoichiometry of plant organs between rock-epiphytic (E-rock) and trunk-epiphytic (E-tree) habitats. (A), carbon (C) concentration; (B), nitrogen (N) concentration; (C), phosphorus (P) concentration; (D), C/N ratio; (E), C/P ratio; (F), N/P ratio. Different lowercase letters indicate significant differences in parameters between E-rock and E-tree conditions. Different uppercase letters indicate significant differences in parameters among different plant organs (leaf, stem and root).
When comparing C-N-P ecological stoichiometry among different plant organs, significant difference was only found in C concentration (Figure 2). Specifically, C concentration was the highest in stems, followed by roots, then leaves (stem > root > leaf).
3.2. Variation in P Fractions and Proportions Between Rock-Epiphytic and Trunk-Epiphytic Habitats
When comparing plants in rock-epiphytic and trunk-epiphytic habitats, trunk-epiphytic plants had significantly higher Pi and PL concentrations in leaves and stems, with no significant root differences (Figure 3A–D). Trunk-epiphytic plants also showed higher PM in stems, though this was not significant in leaves and roots (Figure 3B). All organs of trunk-epiphytic plants had higher PN concentrations (Figure 3C). Additionally, trunk-epiphytic plants had higher PR in roots, with no significant differences in leaves and stems (Figure 3E). The proportions of Pi and PN in leaves, stems, and roots did not show significant differences between the two epiphytic habitats (Figure 4A,C). Compared with rock-epiphytic plants, trunk-epiphytic plants had a higher proportion of PM but a lower proportion of PR (Figure 4B,E). The proportion of PL was significantly different only in stems, with rock-epiphytic plants having a higher proportion than trunk-epiphytic plants (Figure 4D).
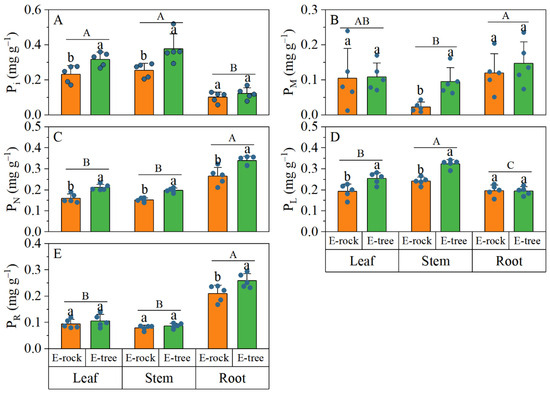
Figure 3.
Differences in proportions of phosphorus (P) fractions to total P concentration of plant organs between rock-epiphytic (E-rock) and trunk-epiphytic (E-tree) habitats. (A), orthophosphate P (Pi) concentration; (B), low-molecular-weight metabolites P (PM) concentration; (C), nucleic acid P (PN) concentration; (D), lipid P (PL) concentration; (E), residual P (PR) concentration. Different lowercase letters indicate significant differences in parameters between E-rock and E-tree conditions. Different uppercase letters indicate significant differences in parameters among different plant organs (leaf, stem, and root).
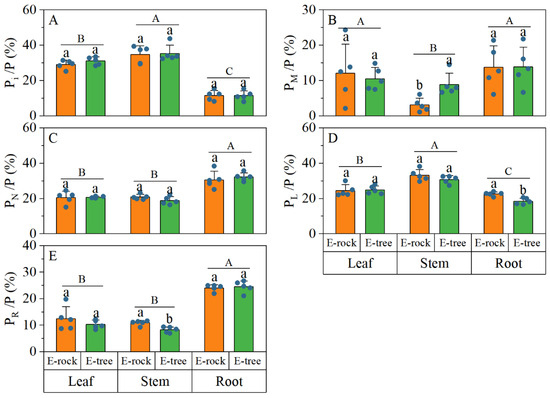
Figure 4.
Differences in relative phosphorus (P) allocations in P fractions of plant organs between rock-epiphytic (E-rock) and trunk-epiphytic (E-tree) habitats. (A), percentage of orthophosphate P (Pi) to P; (B), percentage of low-molecular-weight metabolites P (PM) to P; (C), percentage of nucleic acid P (PN) to P; (D), percentage of lipid P (PL) to P; (E), percentage of residual P (PR) to P. Different lowercase letters indicate significant differences in parameters between E-rock and E-tree conditions. Different uppercase letters indicate significant differences in parameters among different plant organs (leaf, stem, and root).
Comparisons of phosphorus fraction concentrations among different organs revealed the following (Figure 3): the Pi concentration in leaves and stems was higher than that in roots; the PM concentration in roots was greater than that in stems, but there was no significant difference between leaf PM and the other organs; roots had higher PN and PR concentrations than leaves and stems; and the PL concentration was highest in stems, followed by leaves, and then roots (stem > leaf > root). When comparing the proportions of P fractions among different plant organs, it was found that the proportion of Pi in leaves and stems was significantly higher than in roots (Figure 4A). Conversely, the proportions of PN and PR were significantly higher in roots than in leaves and stems (Figure 4C,E). The proportion of PM was significantly higher in roots than in stems (Figure 4B), with no significant difference in leaves compared to stems and roots. The proportion of PL was the highest in stems (Figure 4D), followed by leaves, then roots (stem > leaf > root).
3.3. Variation in Morphological and Physiological Traits Between Rock-Epiphytic and Trunk-Epiphytic Habitats
No significant differences were found in SLA, Pn, Tr, and WUE between rock-epiphytic and trunk-epiphytic plants in their leaves (Figure 5B,D–F). However, trunk-epiphytic plants exhibited higher LDMC and LT in their leaves compared to rock-epiphytic plants (Figure 5A,C). In terms of stem traits, no significant differences were observed in SDMC and STD between the two groups (Figure 5G,H). For root traits, trunk-epiphytic plants had higher SRL, RTD, NRT, and NRB, but lower SRA and RD compared to rock-epiphytic plants (Figure 6).
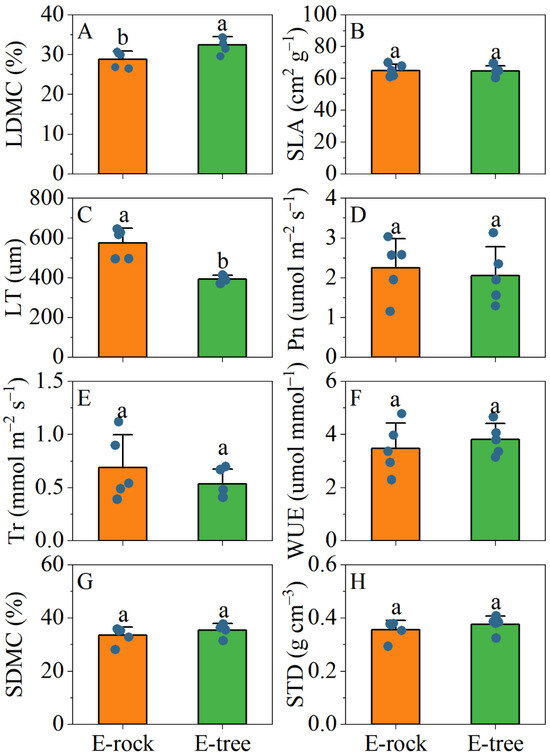
Figure 5.
Differences in leaf (A–F) and stem (G,H) morphological and physiological traits between rock-epiphytic (E-rock) and trunk-epiphytic (E-tree) habitats. LDMC, leaf dry matter content; SLA, specific leaf area; LT, leaf thickness; Pn, leaf net photosynthetic rate; Tr, leaf transpiration rate; WUE, leaf water use efficiency; SDMC, stem dry matter content; STD, stem tissue density. Different lowercase letters indicate significant differences in parameters between E-rock and E-tree conditions.
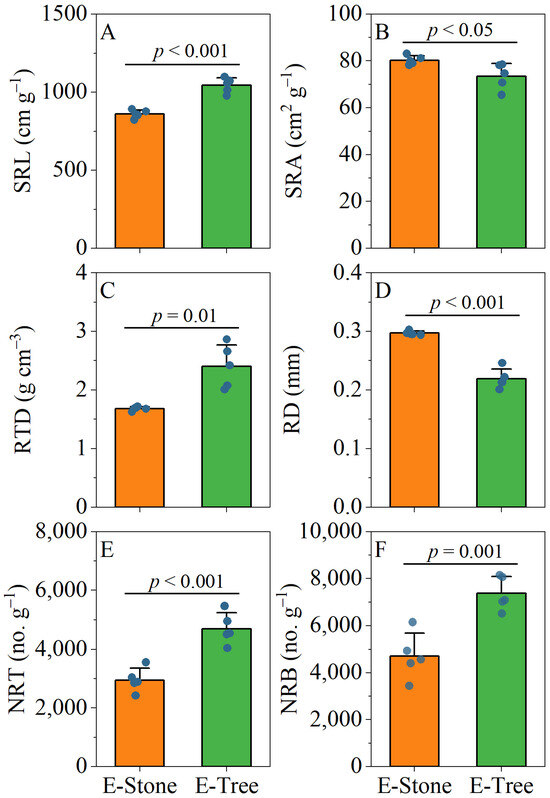
Figure 6.
Differences in root morphological traits between rock-epiphytic (E-rock) and trunk-epiphytic (E-tree) habitats. (A), specific root length (SRL); (B), specific root surface area (SRA); (C), root tissue density (RTD); (D), mean root diameter (RD); (E), number of root tips per unit mass (NRT); (F), number of root branches per unit mass (NRB). Different lowercase letters indicate significant differences in parameters between E-rock and E-tree conditions.
The PCA sheds light on the distinct adaptive strategies of Pyrrosia sheareri in different epiphytic habitats, with PC1 and PC2 explaining 47.4% and 28.1% of the variance, respectively (Figure 7). Tree-epiphytic plant was clustered on the positive side of PC1 and PC2, characterized by higher values in SRL, NRT, NRB, RTD, and LDMC. In contrast, rock-epiphytic plant was positioned on the negative side of PC1 and PC2, associated with thicker leaves (LT), higher RD, and greater SRA.
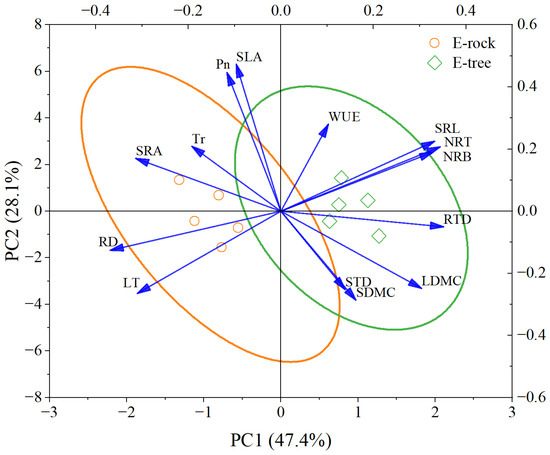
Figure 7.
Principal component analysis biplot for morphological and physiological traits across sampling plots belonging to rock-epiphytic (E-rock) and trunk-epiphytic (E-tree) habitats. LDMC, leaf dry matter content; SLA, specific leaf area; LT, leaf thickness; Pn, leaf net photosynthetic rate; Tr, leaf transpiration rate; WUE, leaf water use efficiency; SDMC, stem dry matter content; STD, stem tissue density; SRL, specific root length; SRA, specific root surface area; RTD, root tissue density; RD, mean root diameter; NRT, number of root tips per unit mass; NRB, number of root branches per unit mass.
3.4. Correlations of Plant Traits and Hub Traits
In the PTN, a total of 42 plant traits (nodes) formed 58 significant links (edges). Among them, the leaf P-related traits (L-TP, L-Pi, L-PN), the stem P fraction (S-PL), the root ecological stoichiometry (R-TP, R-C/N, R-C/P), and the root morphological traits (SRL, RTD, RD, NRT, NRB)—a total of 12 plant traits—all had high degree values and high betweenness values (Figure 8 and Figure 9). Notably, five P-related traits (L-Pi, L-PN, S-PL, R-TP, R-C/P) were among the top three in either degree (k) values or betweenness (B) values (Figure 8 and Figure 9).

Figure 8.
Plant trait networks (PTNs) among phosphorus (P) fractions, C-N-P ecological stoichiometry, and morphological and physiological traits. Abbreviations are referred to in Table 1.
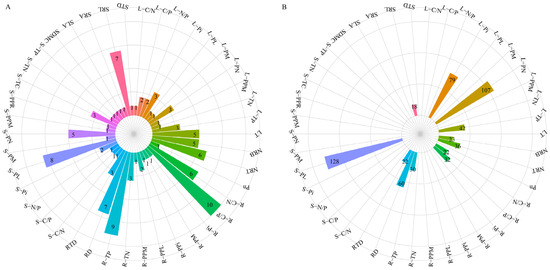
Figure 9.
Two parameters of plant trait networks (PTNs) to quantify the hub traits. (A), degree (k); (B), betweenness (B). Abbreviations are referred to in Table 1.
We found that L-TP was significantly positively correlated with L-Pi (r = 0.86), which in turn was positively associated with L-PN (r = 0.90) and L-PL (r = 0.88). S-TC was significantly positively correlated with S-Pi (r = 0.94). However, in the PTN, the C-N-P ecological stoichiometry was not significantly related to any P fractions in roots (Figure 8 and Table S1).
In the roots, the C-N-P ecological stoichiometry was closely related to root morphological traits. Specifically, R-TP was significantly positively correlated with SRL (r = 0.94), NRT (r = 0.88), and NRB (r = 0.90), and significantly negatively correlated with RD (r = −0.93). In contrast, R-C/P was significantly negatively correlated with SRL (r = −0.95), NRT (r = −0.88), and NRB (r = −0.91), and significantly positively correlated with RD (r = 0.93). However, in leaves and stems, the C-N-P ecological stoichiometry did not show significant relationships with the other plant traits (Figure 8 and Table S1).
R-PPL was significantly positively correlated with RD (r = 0.88) and negatively correlated with RTD (r = −0.87). However, no direct significant relationships were found between P fractions and proportions and functional traits, neither in leaves nor in stems (Figure 8 and Table S1).
In the PTN, significant trait relationships were observed among different plant organs. Specifically, L-PN was significantly positively correlated with S-PL (r = 0.87). S-PL was significantly positively correlated with SRL (r = 0.88), NRT (r = 0.87), R-TN (r = 0.87), and R-TP (r = 0.91), and significantly negatively correlated with R-C/P (r = −0.91) and R-C/N (r = −0.88). Similarly, S-PN was significantly positively correlated with R-TN (r = 0.90) and R-TP (r = 0.95), and significantly negatively correlated with R-C/P (r = −0.94) and R-C/N (r = −0.90). In addition, S-Pi (r = 0.89) was significantly positively correlated with NRB (Figure 8 and Table S1).
4. Discussion
4.1. The Impact of Epiphytic Habitat on P Limitation
Our first hypothesis was that epiphytic habitats significantly affect plant P concentration, and trunk-epiphytic plants have higher P concentration than rock-epiphytic plants. This hypothesis was supported by results of C-N-P ecological stoichiometry in plant organs. The trunk-epiphytic habitat exhibited significantly higher P concentrations than the rock-epiphytic habitat across all plant organs (leaf, stem, and root; Figure 2). At the same time, the impact of epiphytic habitat on N concentration was only significant in stems (Figure 2).
Our results might offer us two insights. First, Pyrrosia sheareri tend to absorb more P and store it in various organs when in a suitable habitat. Compared to N, Pyrrosia sheareri had a greater demand for P. The lower N/P ratios in leaves and stems of Pyrrosia sheareri in the trunk-epiphytic habitat also indicated that the plant prefers to obtain more P rather than N. Studies on bromeliad epiphytes have shown that leaves can continuously absorb and maintain high concentrations of P [13,44,45]. Researchers believe that the large amounts of P in epiphyte leaves are not involved in metabolic processes [11,44]. Therefore, changes in leaf P concentration in epiphytes do not necessarily reflect P limitation [11]. However, in this study, the mean values of N and P in the leaves of Pyrrosia sheareri were 13.62 g kg−1 and 0.90 g kg−1, respectively (Figure 2). These values are lower than the global average values for N and P in terrestrial plant leaves [9,15,16,46]. They are also lower than the mean values of N and P in leaves of 10 subtropical forest epiphytes and 99 epiphytic vascular plants in tropical rainforests reported in previous studies [12,21]. It is worth noting that the N and P concentrations in epiphyte leaves vary greatly among different studies [12,13,21,47]. Therefore, Pyrrosia sheareri did not exhibit luxury consumption of P, and changes in leaf P concentration could indicate P limitation in different habitats. Furthermore, the mean value of the N/P ratio in the leaves of Pyrrosia sheareri was 15.31 (Figure 2). For terrestrial vascular plants, a leaf N:P ratio greater than 16 is considered to indicate P limitation, while a ratio less than 14 indicates N limitation. Ratios in between suggest co-limitation by both N and P [17,18]. Fertilization experiments on epiphyte Vriesea sanguinolenta suggest that a leaf N/P ratio greater than 13 indicates P limitation [44]. Therefore, in this study, Pyrrosia sheareri might be more strongly limited by P.
Compared to the rock-epiphytic habitat, the trunk-epiphytic habitat provided more P for Pyrrosia sheareri. This may be due to the rich nutrients contained in stem flow and decomposing bark, and it is worth noting that stemflow generally provides more N than P [35,36]. N is a mineral element that does not originate from mineral soil, and plants can obtain atmospheric N through N-fixing microorganisms [13,19]. A similar comparative study found that the epiphyte Tillandsia capillaris on trees had lower N than plants on cables, despite having similar microbial compositions and nitrogenase activity [13]. This evidence suggests that, compared to the rock-epiphytic habitat, the asynchronous absorption of N and P by Pyrrosia sheareri in the trunk-epiphytic habitat was not due to insufficient N supply, but rather because Pyrrosia sheareri tend to absorb more P in the trunk-epiphytic habitat. This result implies that Pyrrosia sheareri was limited by P, and that P might play an important role in its growth and metabolic processes.
4.2. The Impact of Epiphytic Habitat on Relative P Allocations in P Fractions
Our second hypothesis was that epiphytic habitats significantly affected plant P fractions, and trunk-epiphytic plants allocated more P to Pi and PN. This hypothesis was not supported by results of relative P allocations in P fractions. Indeed, compared with rock-epiphytic habitat, the tissues of trunk-epiphytic Pyrrosia sheareri had higher concentrations of Pi, PN, and PL, especially in leaves and stems (Figure 3). However, there were no significant differences in the ratios of Pi, PN, and PL (except in roots) to total P among the organs of Pyrrosia sheareri under the two epiphytic habitats (Figure 4). The increasing P concentration altered the concentrations of P fractions but did not change their relative allocations (Figure 8). Different P fractions represent different functional components of P [2,5]. Pi is used for P transport, storage, and regulation of cytoplasmic P concentration [1]. When P supply is sufficient, plants allocate more P to Pi [1,5,7,24]. Similarly, the more active the cell division, the higher the proportion of PN [24,25]. A higher PL indicates better cell membrane stability [2]. Therefore, these results offer us two insights. First, plants in the trunk-epiphytic habitat did not absorb P excessively and stored it in the form of Pi. In other words, Pyrrosia sheareri was limited by P in both habitats, a finding consistent with the results of C-N-P stoichiometry. Second, in our study site, the relative allocation of Pi, PN, and PL was relatively stable. It is a trade-off in plant P allocation among cytoplasmic P homeostasis regulation, growth, and cell membrane stability [24,25]. Additionally, trunk-epiphytic plants had a higher proportion of PM and a lower proportion of PR (Figure 4). This means that in the trunk-epiphytic habitat, plants allocated more P to energy metabolism (ATP, ADP, and NADPH), indicating that photosynthesis and respiration are more active in this habitat [5,7,25]. PR originates from phosphorylated proteins and other phosphorus compounds that remain after extraction, and its physiological and ecological roles require further investigation [2].
Different plant organs have different functions and metabolic activities, needing different relative allocations of P fractions [8,9,23]. The proportions of Pi and PL were the highest in stems, followed by leaves, and then roots (stem > leaf > root). This may be related to the transport function of the stem [48]. The proportion of PM was the highest in leaves and roots, followed by stems, and may be related to the higher photosynthetic or respiratory activity in leaves and roots [8,48]. The proportions of PN and PR were the highest in roots, followed by leaves and stems. This indicates that root tissues are engaged in vigorous cell division and protein transcription, but the role of PR is not clear [2,42]. Currently, research on P fractions mostly focuses on plant leaves, while there is a lack of understanding regarding the allocation strategies, regulatory roles, and influencing factors of relative allocations of P fractions in different plant organs [2,3].
4.3. The Impact of Epiphytic Habitat on Morphological and Physiological Traits
Our third hypothesis was that epiphytic habitats had significant effects on morphological and physiological traits, and compared with rock-epiphytic plants, trunk-epiphytic plants adopted a resource-acquisition strategy (e.g., higher Pn and SRL). This hypothesis was partly supported by results of functional traits. Among the eight leaf and stem functional traits, only LT was affected by habitat type, with rock-epiphytic plants having thicker leaves (Figure 5). In contrast, all six root traits were significantly influenced by habitat type (Figure 6).
Our results indicate that Pyrrosia sheareri had no significant differences in leaf and stem water storage capacity, maximum photosynthetic rate, and water use efficiency between the two epiphytic habitats [39,41,45,49]. There were no significant differences in water supply between the two habitats. Moreover, the increase in leaf P concentration and the decrease in N/P ratio did not significantly affect the leaf net photosynthesis rate. Previous studies have suggested that there is a coupling relationship between leaf N and P content and photosynthetic rate as well as SLA [8,9,30]. However, this coupling was not observed in Pyrrosia sheareri. In the future, clarifying why the increase in leaf P concentration does not significantly enhance the photosynthetic rate will help to gain a deeper understanding of the biological mechanisms of C-N-P ecological stoichiometry [8,44]. Habitat type had a significant impact on the root traits of Pyrrosia sheareri. Plants in the trunk-epiphytic habitat had higher SRL, NRT, and NRB, and smaller RD (Figure 6). This indicates that plants in this habitat tend to develop finer but denser and more complex root systems [42,50,51]. These characteristics are advantageous for plants to acquire nutrients and water. Obviously, the changes in root traits supported our research hypothesis (3). It is worth noting that in studies of the root economic spectrum, RD is usually positively correlated with RTD, which is contrary to our findings [42,50,51]. This discrepancy may arise because the root diameter of Pyrrosia sheareri is very small (with an average of 0.26 mm). Due to the allometric relationship between the root cortex and stele, thicker absorptive roots have a thicker cortex and lower tissue density, resulting in a negative correlation between RD and RTD [52]. Overall, compared with rock-epiphytic plants, trunk-epiphytic plants adopt a root resource-acquisition strategy rather than relying on leaves. The specific pathways through which Pyrrosia sheareri acquires nutrients in the two habitats require further investigation, such as root exudates and mycorrhizal infection [42,48,52].
4.4. The Importance of P in PTN
A PTN can link all the traits of an entire plant to explore the interactions and co-variation relationships among plant traits [26,27,53]. In this study, we constructed a PTN among P fractions, C-N-P ecological stoichiometry, and morphological and physiological traits to explore the relationships among indicators and identify hub traits. Our fourth hypothesis was that P-related indicators link ecological stoichiometry with morphological and physiological traits and were hub traits in PTN. This hypothesis was completely supported by results of the PTN. Five P-related traits (L-Pi, L-PN, S-PL, R-TP, R-C/P) were hub traits according to our results. These traits link leaf, stem, and root traits of Pyrrosia sheareri. In plant functional trait research, the co-variation relationships among traits of different organs (leaves, stems, and roots) have always been a focal point [28,41,48,54]. First, this result indicated that P played an important role in Pyrrosia sheareri‘s adaptation to the epiphytic habitat, once again supporting the conclusion that Pyrrosia sheareri was limited by P. Second, P fractions might play a key role in linking the plant traits of different organs and regulating the co-variation in these traits to adapt to the environment.
Our results indicated a close link between C-N-P ecological stoichiometry and root morphological traits, but this relationship was not observed in leaves and stems. Previous studies have suggested that a universal leaf economic spectrum and stem economic spectrum exist in terrestrial plants, but there is no one-dimensional root economic spectrum [9,48,50,51]. This is contrary to our findings. Of course, our study is just a small case, but it suggests that in future research on plant economic spectra, factors such as plant species, intraspecific variation, and habitat types may need to be considered [28,30,45,47].
5. Conclusions
This study assessed differences in C-N-P ecological stoichiometry, P fractions, and morphological and physiological traits in Pyrrosia sheareri between trunk- and rock-epiphytic habitats, finding that the following: Total P concentration and fractions were significantly affected by habitat. Trunk-epiphytic plants showed higher total P and P fraction concentrations but did not allocate more P to Pi and PN. Compared with plants in the rock-epiphytic subpopulation, trunk-epiphytic plants adopted a root resource-acquisition strategy. The research also demonstrated that P-related indicators acted as hub traits connecting C-N-P ecological stoichiometry with plant morphology and physiology traits. Our findings highlighted P’s key role in the environmental acclimatization of Pyrrosia sheareri and provided new insights into understanding epiphytes’ environmental adaptability from a P perspective.
Vascular epiphytes, though receiving less research attention than their importance warrants due to low biomass proportion and sampling difficulty, play crucial roles in forest ecosystems, particularly in tropical and subtropical regions. To resist environmental stress, Pyrrosia plants produce higher amounts of secondary metabolites such as flavonoids in their leaves. Therefore, most Pyrrosia plants have good medicinal value [55,56]. Given their potentially weak adaptability to rapid environmental changes, more research is needed to understand their adaptation mechanisms to unique habitats and global environmental changes, ensuring the protection of epiphyte diversity and the integrity of forest ecosystem structure and function.
Supplementary Materials
The following supporting information can be downloaded at: https://www.mdpi.com/article/10.3390/f16060903/s1, Table S1: Correlations of plant trait networks (PTNs) among phosphorus (P) fractions, C-N-P ecological stoichiometry, and morphological and physiological traits. Abbreviations are referred to in the Methods Section.
Author Contributions
Conceptualization, B.H.; Data Curation, C.H.; Formal Analysis, C.H., T.F. and Y.C.; Investigation, T.F., X.B. and W.L.; Methodology, B.H.; Project Administration, S.Z. and B.H.; Supervision, S.Z.; Visualization, S.Z., C.H. and Y.C.; Writing—Original Draft, S.Z., C.H. and X.B.; Writing—Review and Editing, W.L. and B.H. All authors conceived ideas for this study. All authors have read and agreed to the published version of the manuscript.
Funding
This work was funded by the National Natural Science Foundation of China (grant number 31560059), the Guizhou Provincial Science and Technology Project (grant numbers qiankehejichu-ZK-[2022]yiban167 and ZK-[2024]key077), the Bijie Science and Technology Project (grant numbers bikelianhe [2023]22 and bikelianhe [2023]10), Guizhou Province High-Level Innovative Talent Project (Project No. BiKeRenCaiHe [2025] 7), and the Young Science and Technology Talent Development Project of the Guizhou Provincial Department of Education (grant numbers Qianjiaohe KY [2022]120 and Qianjiaohe KY [2022]123).
Data Availability Statement
The authors declare that they have no known competing financial interests or personal relationships that could have appeared to influence the work reported in this paper.
Conflicts of Interest
The authors declare no conflicts of interest.
References
- Xu, L.; Zhao, H.; Wan, R.; Liu, Y.; Xu, Z.; Tian, W.; Ruan, W.; Wang, F.; Deng, M.; Wang, J.; et al. Identification of vacuolar phosphate efflux transporters in land plants. Nat. Plants 2019, 5, 84–94. [Google Scholar] [CrossRef] [PubMed]
- Suriyagoda, L.D.B.; Ryan, M.H.; Gille, C.E.; Dayrell, R.L.C.; Finnegan, P.M.; Ranathunge, K.; Nicol, D.; Lambers, H. Phosphorus fractions in leaves. New Phytol. 2023, 237, 1122–1135. [Google Scholar] [CrossRef] [PubMed]
- Lambers, H. Phosphorus Acquisition and Utilization in Plants. Annu. Rev. Plant Biol. 2022, 73, 17–42. [Google Scholar] [CrossRef] [PubMed]
- Chan, C.; Liao, Y.Y.; Chiou, T.J. The Impact of Phosphorus on Plant Immunity. Plant Cell Physiol. 2021, 62, 582–589. [Google Scholar] [CrossRef]
- Tsujii, Y.; Atwell, B.J.; Lambers, H.; Wright, I.J. Leaf phosphorus fractions vary with leaf economic traits among 35 Australian woody species. New Phytol. 2024, 241, 1985–1997. [Google Scholar] [CrossRef]
- Liu, S.T.; Gille, C.E.; Bird, T.; Ranathunge, K.; Finnegan, P.M.; Lambers, H. Leaf phosphorus allocation to chemical fractions and its seasonal variation in south-western Australia is a species-dependent trait. Sci. Total Environ. 2023, 901, 166395. [Google Scholar] [CrossRef]
- Lambers, H.; Finnegan, P.M.; Laliberté, E.; Pearse, S.J.; Ryan, M.H.; Shane, M.W.; Veneklaas, E.J. Phosphorus Nutrition of Proteaceae in Severely Phosphorus-Impoverished Soils: Are There Lessons To Be Learned for Future Crops? Plant Physiol. 2011, 156, 1058–1066. [Google Scholar] [CrossRef]
- Yu, Q.; Ni, X.; Cheng, X.; Ma, S.; Tian, D.; Zhu, B.; Zhu, J.; Ji, C.; Tang, Z.; Fang, J. Foliar phosphorus allocation and photosynthesis reveal plants’ adaptative strategies to phosphorus limitation in tropical forests at different successional stages. Sci. Total Environ. 2022, 846, 157456. [Google Scholar] [CrossRef]
- Wright, I.J.; Reich, P.B.; Westoby, M.; Ackerly, D.D.; Baruch, Z.; Bongers, F.; Cavender-Bares, J.; Chapin, T.; Cornelissen, J.H.C.; Diemer, M.; et al. The worldwide leaf economics spectrum. Nature 2004, 428, 821–827. [Google Scholar] [CrossRef]
- Cunha, H.F.V.; Andersen, K.M.; Lugli, L.F.; Santana, F.D.; Aleixo, I.F.; Moraes, A.M.; Garcia, S.; Di Ponzio, R.; Mendoza, E.O.; Brum, B.; et al. Direct evidence for phosphorus limitation on Amazon forest productivity. Nature 2022, 608, 558–562. [Google Scholar] [CrossRef]
- Zotz, G.; Hietz, P.; Einzmann, H.J.R. Functional ecology of vascular epiphytes. Annu. Plant Rev. Online 2021, 4, 869–906. [Google Scholar] [CrossRef]
- Zhang, T.T.; Liu, W.Y.; Hu, T.; Tang, D.D.; Mo, Y.X.; Wu, Y. Divergent Adaptation Strategies of Vascular Facultative Epiphytes to Bark and Soil Habitats: Insights from Stoichiometry. Forests 2021, 12, 16. [Google Scholar] [CrossRef]
- Abril, A.B.; Bucher, E.H. A comparison of nutrient sources of the epiphyte Tillandsia capillaris attached to trees and cables in Cordoba, Argentina. J. Arid Environ. 2009, 73, 393. [Google Scholar] [CrossRef]
- Liu, J.; Fang, X.; Tang, X.; Wang, W.; Zhou, G.; Xu, S.; Huang, W.; Wang, G.; Yan, J.; Ma, K.; et al. Patterns and controlling factors of plant nitrogen and phosphorus stoichiometry across China’s forests. Biogeochemistry 2019, 143, 191–205. [Google Scholar] [CrossRef]
- Han, W.; Fang, J.; Guo, D.; Zhang, Y. Leaf nitrogen and phosphorus stoichiometry across 753 terrestrial plant species in China. New Phytol. 2005, 168, 377–385. [Google Scholar] [CrossRef]
- Elser, J.J.; Fagan, W.F.; Denno, R.F.; Dobberfuhl, D.R.; Folarin, A.; Huberty, A.; Interlandi, S.; Kilham, S.S.; McCauley, E.; Schulz, K.L.; et al. Nutritional constraints in terrestrial and freshwater food webs. Nature 2000, 408, 578–580. [Google Scholar] [CrossRef]
- Koerselman, W.; Meuleman, A.F.M. The Vegetation N:P Ratio: A New Tool to Detect the Nature of Nutrient Limitation. J. Appl. Ecol. 1996, 33, 1441–1450. [Google Scholar] [CrossRef]
- Elser, J.J.; Fagan, W.F.; Kerkhoff, A.J.; Swenson, N.G.; Enquist, B.J. Biological stoichiometry of plant production: Metabolism, scaling and ecological response to global change. New Phytol. 2010, 186, 593–608. [Google Scholar] [CrossRef]
- Su, T.H.; Zhou, C.Y.; Sun, W.; Jia, T.; Hu, T.; Li, Z.F.; Pu, X.Y.; Lu, Z.Y.; Li, S. Greater differentiation in nitrogen sources is essential for co-occurring epiphytes under low-nitrogen canopy conditions. Environ. Exp. Bot. 2023, 215, 105509. [Google Scholar] [CrossRef]
- Costa, D.S.; Zotz, G.; Hemp, A.; Kleyer, M. Trait patterns of epiphytes compared to other plant life-forms along a tropical elevation gradient. Funct. Ecol. 2018, 32, 2073–2084. [Google Scholar] [CrossRef]
- Liu, Y.; Sun, W.; Jia, T.; Su, T.H.; Wu, S.S.; Zhou, C.Y.; Mo, Y.X.; Qi, J.H.; Lu, Z.Y.; Li, S. Leaf Nutrient Resorption of Vascular Epiphytes Is Regulated by Stoichiometry and Nutrient Limitation Control Strategies. Plant Cell Environ. 2025, 48, 4550–4563. [Google Scholar] [CrossRef] [PubMed]
- Du, E.; Terrer, C.; Pellegrini, A.F.A.; Ahlström, A.; van Lissa, C.J.; Zhao, X.; Xia, N.; Wu, X.; Jackson, R.B. Global patterns of terrestrial nitrogen and phosphorus limitation. Nat. Geosci. 2020, 13, 221–226. [Google Scholar] [CrossRef]
- Yan, L.; Zhang, X.; Han, Z.; Pang, J.; Lambers, H.; Finnegan, P.M. Responses of foliar phosphorus fractions to soil age are diverse along a 2 Myr dune chronosequence. New Phytol. 2019, 223, 1621–1633. [Google Scholar] [CrossRef]
- Han, Z.; Shi, J.; Pang, J.; Yan, L.; Finnegan, P.M.; Lambers, H. Foliar nutrient allocation patterns in Banksia attenuata and Banksia sessilis differing in growth rate and adaptation to low-phosphorus habitats. Ann. Bot. 2021, 128, 419–430. [Google Scholar] [CrossRef]
- Fan, Y.; Lambers, H.; Sayer, E.J.; Li, Y.; Li, Y.; Zhang, J.; Li, Z.; Hu, Z.; Li, H.; Wang, J.; et al. Variation in leaf phosphorus fractions reflects plant adaptations and distribution in low-phosphorus tropical forests. Funct. Ecol. 2025, 39, 621–634. [Google Scholar] [CrossRef]
- Li, Y.; Liu, C.; Sack, L.; Xu, L.; Li, M.; Zhang, J.; He, N. Leaf trait network architecture shifts with species-richness and climate across forests at continental scale. Ecol. Lett. 2022, 25, 1442–1457. [Google Scholar] [CrossRef]
- He, N.; Li, Y.; Liu, C.; Xu, L.; Li, M.; Zhang, J.; He, J.; Tang, Z.; Han, X.; Ye, Q.; et al. Plant Trait Networks: Improved Resolution of the Dimensionality of Adaptation. Trends Ecol. Evol. 2020, 35, 908–918. [Google Scholar] [CrossRef]
- Wei, B.; Zhang, D.; Wang, G.; Liu, Y.; Li, Q.; Zheng, Z.; Yang, G.; Peng, Y.; Niu, K.; Yang, Y. Experimental warming altered plant functional traits and their coordination in a permafrost ecosystem. New Phytol. 2023, 240, 1802–1816. [Google Scholar] [CrossRef]
- Medeiros, C.D.; Trueba, S.; Henry, C.; Fletcher, L.R.; Lutz, J.A.; Alonzo, R.M.; Kraft, N.J.B.; Sack, L. Simplification of woody plant trait networks among communities along a climatic aridity gradient. J. Ecol. 2025, 113, 896–912. [Google Scholar] [CrossRef]
- Li, Y.; Mo, Y.-X.; Cui, H.-L.; Zhang, Y.-J.; Dossa, G.G.O.; Tan, Z.-H.; Song, L. Intraspecific plasticity and co-variation of leaf traits facilitate Ficus tinctoria to acclimate hemiepiphytic and terrestrial habitats. Tree Physiol. 2024, 44, tpae007. [Google Scholar] [CrossRef]
- Li, X.; Li, Z.; Xu, Z.; Lu, Z.; Fan, Z.; Chen, Y.; Zhang, S. Leaf trait networks shift toward high modularity during the succession of a subtropical forest, in southwest China. Ecol. Indic. 2024, 166, 112490. [Google Scholar] [CrossRef]
- Lei, Z.; Li, Z.; Wright, I.J.; Chhajed, S.; Zhang, W.; He, D.; Zhang, Y. Network Architecture of Leaf Trait Correlations Has Shifted Following Crop Domestication. Plant Cell Environ. 2025, 48, 4444–4454. [Google Scholar] [CrossRef] [PubMed]
- Hollenbeck, E.C.; Sax, D.F. Experimental evidence of climate change extinction risk in Neotropical montane epiphytes. Nat. Commun. 2024, 15, 6045. [Google Scholar] [CrossRef]
- Chen, Q.; Lu, H.-Z.; Liu, W.-Y.; Wu, Y.; Song, L.; Li, S. Obligate to facultative shift of two epiphytic Lepisorus species during subtropical forest degradation: Insights from functional traits. For. Ecol. Manag. 2019, 435, 66–76. [Google Scholar] [CrossRef]
- Schroth, G.; Elias, M.E.A.; Uguen, K.; Seixas, R.; Zech, W. Nutrient fluxes in rainfall, throughfall and stemflow in tree-based land use systems and spontaneous tree vegetation of central Amazonia. Agric. Ecosyst. Environ. 2001, 87, 37–49. [Google Scholar] [CrossRef]
- Eaton, J.S.; Likens, G.E.; Bormann, F.H. Throughfall and Stemflow Chemistry in a Northern Hardwood Forest. J. Ecol. 1973, 61, 495–508. [Google Scholar] [CrossRef]
- Cui, E.; Lu, R.; Xu, X.; Sun, H.; Qiao, Y.; Ping, J.; Qiu, S.; Lin, Y.; Bao, J.; Yong, Y.; et al. Soil phosphorus drives plant trait variations in a mature subtropical forest. Glob. Change Biol. 2022, 28, 3310–3320. [Google Scholar] [CrossRef]
- Bai, X.-L.; Feng, T.; Zou, S.; He, B.; Chen, Y.; Li, W.-J. Differences in Leaf Functional Traits of Quercus rehderiana Hand.-Mazz. in Forests with Rocky and Non-Rocky Desertification in Southwest China. Forests 2024, 15, 1439. [Google Scholar] [CrossRef]
- Pérez-Harguindeguy, N.; Díaz, S.; Garnier, E.; Lavorel, S.; Poorter, H.; Jaureguiberry, P.; Bret-Harte, M.S.; Cornwell, W.K.; Craine, J.M.; Gurvich, D.E.; et al. New handbook for standardised measurement of plant functional traits worldwide. Aust. J. Bot. 2016, 64, 715–716. [Google Scholar] [CrossRef]
- Cornelissen, J.H.C.; Lavorel, S.; Garnier, E.; Díaz, S.; Buchmann, N.; Gurvich, D.E.; Reich, P.B.; Steege, H.T.; Morgan, H.D.; van der Heijden, M.G.A.; et al. A handbook of protocols for standardised and easy measurement of plant functional traits worldwide. Aust. J. Bot. 2003, 51, 335–380. [Google Scholar] [CrossRef]
- Ye, Z.; Mu, Y.; Van Duzen, S.; Ryser, P. Root and shoot phenology, architecture, and organ properties: An integrated trait network among 44 herbaceous wetland species. New Phytol. 2024, 244, 436–450. [Google Scholar] [CrossRef] [PubMed]
- Wang, S.; Comas, L.H.; Reich, P.B.; McCormack, M.L.; Phillips, R.P.; Gu, J.; Sun, T. Variation of root resource acquisition and conservation strategies in a temperate forest is linked with plant growth forms. Tree Physiol. 2025, 45, tpaf027. [Google Scholar] [CrossRef] [PubMed]
- Benjamini, Y.; Hochberg, Y. Controlling the False Discovery Rate: A Practical and Powerful Approach to Multiple Testing. J. R. Stat. Soc. Ser. B Methodol. 1995, 57, 289–300. [Google Scholar] [CrossRef]
- Wanek, W.; Zotz, G. Are vascular epiphytes nitrogen or phosphorus limited? A study of plant 15N fractionation and foliar N:P stoichiometry with the tank bromeliad Vriesea sanguinolenta. New Phytol. 2011, 192, 462–470. [Google Scholar] [CrossRef]
- Petter, G.; Wagner, K.; Wanek, W.; Sánchez Delgado, E.J.; Zotz, G.; Cabral, J.S.; Kreft, H. Functional leaf traits of vascular epiphytes: Vertical trends within the forest, intra- and interspecific trait variability, and taxonomic signals. Funct. Ecol. 2016, 30, 188–198. [Google Scholar] [CrossRef]
- Reich, P.B.; Oleksyn, J. Global patterns of plant leaf N and P in relation to temperature and latitude. Proc. Natl. Acad. Sci. USA 2004, 101, 11001–11006. [Google Scholar] [CrossRef]
- Wagner, K.; Wanek, W.; Zotz, G. Functional Traits of a Rainforest Vascular Epiphyte Community: Trait Covariation and Indications for Host Specificity. Diversity 2021, 13, 97. [Google Scholar] [CrossRef]
- Fortunel, C.; Fine, P.V.A.; Baraloto, C. Leaf, stem and root tissue strategies across 758 Neotropical tree species. Funct. Ecol. 2012, 26, 1153–1161. [Google Scholar] [CrossRef]
- Moore, A.F.P.; Antoine, J.; Bedoya, L.I.; Medina, A.; Buck, C.S.; Van Stan, J.T.; Gotsch, S.G. Drought decreases water storage capacity of two arboreal epiphytes with differing ecohydrological traits. Sci. Total Environ. 2023, 894, 164791. [Google Scholar] [CrossRef]
- Roumet, C.; Birouste, M.; Picon-Cochard, C.; Ghestem, M.; Osman, N.; Vrignon-Brenas, S.; Cao, K.F.; Stokes, A. Root structure–function relationships in 74 species: Evidence of a root economics spectrum related to carbon economy. New Phytol. 2016, 210, 815–826. [Google Scholar] [CrossRef]
- de la Riva, E.G.; Querejeta, J.I.; Villar, R.; Pérez-Ramos, I.M.; Marañón, T.; Galán Díaz, J.; de Tomás Marín, S.; Prieto, I. The Economics Spectrum Drives Root Trait Strategies in Mediterranean Vegetation. Front. Plant Sci. 2021, 12, 773118. [Google Scholar] [CrossRef] [PubMed]
- Kong, D.; Wang, J.; Wu, H.; Valverde-Barrantes, O.J.; Wang, R.; Zeng, H.; Kardol, P.; Zhang, H.; Feng, Y. Nonlinearity of root trait relationships and the root economics spectrum. Nat. Commun. 2019, 10, 2203. [Google Scholar] [CrossRef] [PubMed]
- Hietz, P.; Wagner, K.; Nunes Ramos, F.; Cabral, J.S.; Agudelo, C.; Benavides, A.M.; Cach-Pérez, M.J.; Cardelús, C.L.; Chilpa Galván, N.; Erickson Nascimento da Costa, L.; et al. Putting vascular epiphytes on the traits map. J. Ecol. 2022, 110, 340–358. [Google Scholar] [CrossRef]
- Li, X.L.; Zhou, J.; Du, H.Q.; Peng, F.; Zhong, H.; Wu, Y.; Luo, J.; Sun, S.; Ming, Y.X.; Sun, H.; et al. Plant nutrient-acquisition strategies contribute to species replacement during primary succession. J. Ecol. 2025, 113, 988–1003. [Google Scholar] [CrossRef]
- He, K.; Fan, L.-L.; Wu, T.-T.; Du, J. A new xanthone glycoside from Pyrrosia sheareri. Nat. Prod. Res. 2019, 33, 2982–2987. [Google Scholar] [CrossRef]
- Fan, Y.; Feng, H.; Liu, L.; Zhang, Y.; Xin, X.; Gao, D. Chemical Components and Antibacterial Activity of the Essential Oil of Six Pyrrosia Species. Chem. Biodivers. 2020, 17, e2000526. [Google Scholar] [CrossRef]

Disclaimer/Publisher’s Note: The statements, opinions and data contained in all publications are solely those of the individual author(s) and contributor(s) and not of MDPI and/or the editor(s). MDPI and/or the editor(s) disclaim responsibility for any injury to people or property resulting from any ideas, methods, instructions or products referred to in the content. |
© 2025 by the authors. Licensee MDPI, Basel, Switzerland. This article is an open access article distributed under the terms and conditions of the Creative Commons Attribution (CC BY) license (https://creativecommons.org/licenses/by/4.0/).