Article

Mango Inflorescence Detection Based on Improved YOLOv8 and UAVs-RGB Images

1
School of Intelligent Manufacturing, Hunan University of Science and Engineering, Yongzhou 425199, China
2
Hunan Engineering Research Center for Smart Agriculture (Fruits and Vegetables) Information Perception and Early Warning, Yongzhou 425199, China
3
Hunan Provincial Higher Education Institutions Key Laboratory of Small and Micro Intelligent Agricultural Machinery Equipment and Application, Yongzhou 425199, China
4
College of Agricultural Unmanned Systems, China Agricultural University, Beijing 100091, China
*
Author to whom correspondence should be addressed.
These authors contributed equally to this work and should be considered co-first authors.
Forests 2025, 16(6), 896; https://doi.org/10.3390/f16060896 (registering DOI)
Submission received: 11 April 2025 / Revised: 9 May 2025 / Accepted: 23 May 2025 / Published: 27 May 2025

Abstract

:
During the flowering period of mango trees, pests often hide in the inflorescences to suck sap, affecting fruit formation. By accurately detecting the number and location of mango inflorescences in the early stages, it can help target-specific spraying equipment to perform precise pesticide application. This study focuses on mango panicles and addresses challenges such as high crop planting density, poor image quality, and complex backgrounds. A series of improvements were made to the YOLOv8 model to enhance performance for this type of detection task. Firstly, a mango panicle dataset was constructed by selecting, augmenting, and correcting samples based on actual agricultural conditions. Second, the backbone network of YOLOv8 was replaced with FasterNet. Although this led to a slight decrease in accuracy, it significantly improved inference speed and reduced model parameters, demonstrating that FasterNet effectively reduced computational complexity while optimizing accuracy. Further, the GAM (Global Attention Module) attention mechanism was introduced as an attention module in the backbone network to enhance feature extraction capabilities. Experimental results indicated that the addition of GAM improved the average precision by 2.2 percentage points, outperforming other attention mechanisms such as SE, CA, and CBAM. Finally, the model’s bounding box localization ability was enhanced by replacing the loss function with WIoU, which also accelerated model convergence and improved the mAP@.5 metric by 1.1 percentage points. Our approach demonstrates a discrepancy of less than 10% compared to manual counted results.

1. Introduction

Mango (Mangifera indica), a vital economic crop in tropical and subtropical regions, holds significant market value. However, the warm and humid climates typical of mango-growing areas foster diverse and rapidly proliferating pest populations, posing severe threats to cultivation [1]. Expanding cultivation has intensified pest-related losses in recent years.
Among these pests, flower-inhabiting thrips critically impair fruit set. Adults and nymphs conceal themselves within inflorescences, feeding on sap and causing bud deformation, petal browning, and poor pollination, ultimately reducing fruit yield. However, their minute size (1–2 mm) and cryptic coloration—often blending with flower clusters—hinder visual detection [2].
To address this, remote sensing via drones offers a promising solution. By capturing high-resolution orchard images during flowering and deploying deep learning models to map inflorescence distribution, growers can indirectly infer thrips hotspots. This approach supports precision pesticide applications using variable-rate sprayers, minimizing chemical use while enhancing pest control efficacy.
Recent advances in deep learning have revolutionized agricultural applications, including crop phenotyping and disease detection, through robust, high-efficiency algorithms. Nevertheless, challenges persist in complex orchard environments, where factors like occlusions, lighting variations, wind interference, and small target sizes degrade detection accuracy.
Inflorescence recognition, as a proxy for thrips monitoring, faces difficulties due to dense planting, suboptimal imaging conditions, and cluttered backgrounds. Modern deep learning-based detectors fall into two categories: two-stage algorithms (e.g., R-CNN [3], Fast R-CNN [4], and Faster R-CNN [5]) that first propose regions of interest before classification, and one-stage methods (e.g., SSD [6], YOLO [7], and RetinaNet [8]) that perform direct localization and classification. While these frameworks exhibit strong feature extraction and generalization capabilities, optimizing their performance for small, obscured targets in dynamic field conditions remains an active research frontier.
The YOLO series of algorithms is currently considered the state-of-the-art (SOTA) model in object detection tasks. The early version, YOLOv1, was introduced by Redmon and colleagues. However, YOLOv1 was not fully matured and often exhibited issues such as inaccurate localization and low detection accuracy. Building upon YOLOv1, researchers proposed YOLOv2, which utilized high-resolution training classification networks and adopted the Darknet-19 model. Despite these improvements, YOLOv2 could only predict one object per grid cell. YOLOv3 enhanced its architecture by integrating multi-scale fusion and hierarchical feature maps, enabling accurate detection of objects across different sizes. This optimization boosts performance while improving adaptability for small-object recognition in challenging scenarios.
Several advancements have been made to YOLO-based algorithms. For example, Yu Bowen et al. [9] introduced a deformable convolution-improved ResNet50-D as the feature extraction network for YOLOv3, adding a dual-attention mechanism and feature reconstruction module. Pang et al. [10] used drone imagery as training data and built an image recognition system for orange trees using YOLOv3. Guo et al. [11] proposed using the 4x downsampled feature maps output by the original YOLOv3 network for detection, and added residual units to the network’s residual blocks. An enhanced YOLOv3 model was utilized by Tian et al. [12] for identifying apples across various developmental phases in orchard environments, where conditions such as fluctuating lighting, complex backgrounds, apple overlap, and dense branches posed additional challenges. Kuznetsova and colleagues [13] developed an orchard apple detection system utilizing YOLOv3, incorporating customized preprocessing and post-processing methods.
Other notable improvements include the work of Chen et al. [14], who enhanced YOLOv5 by incorporating GhostNet and introduced the CA (Channel Attention) mechanism, as well as GSConv in the Neck layer for feature information fusion. Cai et al. [15] adapted YOLOv5 by embedding the ECA (Efficient Channel Attention) mechanism in the SPPS layer and CSP (Cross-Stage Partial) layer. Hu et al. [16] improved YOLOv5 by integrating additional feature extraction modules prior to every detection head and substituting the standard bounding box loss with SIoU (Scaled Intersection over Union). Meanwhile, Zhao et al. [17] incorporated a finer detection layer, optimized anchor box configurations, and employed an IoU-driven confidence loss to reduce errors such as false negatives and occlusions in wheat spike detection.
A deep learning approach for detecting lychee pest infestations was introduced by Ye Jin and colleagues [18]. The method employed a BP (Backpropagation) neural network algorithm, which iteratively trained a pest identification model. Through continuous optimization and adjustments, the model achieved an accuracy of over 95% on the samples in the dataset. Holdout cross-validation results showed a hit rate of 86.21% and precision of 89.14%, with a misdetection rate of 8.67%.
To address the issue of reduced detection precision within intricate environmental contexts and the need to improve adaptability to low-power environments, Wen Tao et al. [19] proposed a lightweight algorithm that improved YOLOv8. This algorithm integrated the MSBlock module with the C2f module and applied a heterogeneous convolution approach to the backbone network. Additionally, an efficient local attention mechanism was introduced, and the loss function was improved. Experimental results indicated that, compared to YOLOv8n, the MES-YOLO detection algorithm improved the mAP@0.5 by 2.1%, reduced the computational load from 8.2 G to 6.5 G, and had only 62% of the parameters of the YOLOv8n model.
However, these algorithms still face challenges in real-world environments, such as target and background occlusion, difficulty in distinguishing similar colors and shapes, and the interference of natural factors like lighting and wind on crop recognition. As a result, the precision remains insufficient, particularly for small object detection. This paper will focus on the precise identification of mango panicles, aiming to improve and optimize detection algorithms. Based on the data obtained from the improved detection algorithms, a mango yield estimation model will be constructed.

2. Materials and Methods

2.1. Data Acquisition

The remote sensing image dataset of the mango orchard was acquired using the DJI Mavic2 (DJI Innovation, Shenzhen, China). The collection site was located in a mango orchard in Yazhou District, Sanya City, Hainan Province, China (Longitude: 109°18′9256″ E, Latitude: 18°42′2153″ N), as shown in Figure 1. The UAVs were flown at an altitude of 5 m, equipped with an onboard camera resolution of 0.1 cm/pixel, and a total of 1000 original images were captured.

2.2. Improved YOLOv8 Model

YOLOv8 represents the newest iteration in the YOLO (You Only Look Once) family of object detection algorithms, succeeding earlier versions such as YOLOv3 and YOLOv5. It brings significant improvements in performance, speed, and accuracy. YOLOv8 continues to follow the design philosophy of the YOLO series, which utilizes a single neural network for end-to-end object detection. YOLOv8 implements a range of enhancements across multiple stages, including initial image processing, feature capture, feature integration, and the selection and optimization of detection boundaries. The framework executes four key operational phases:
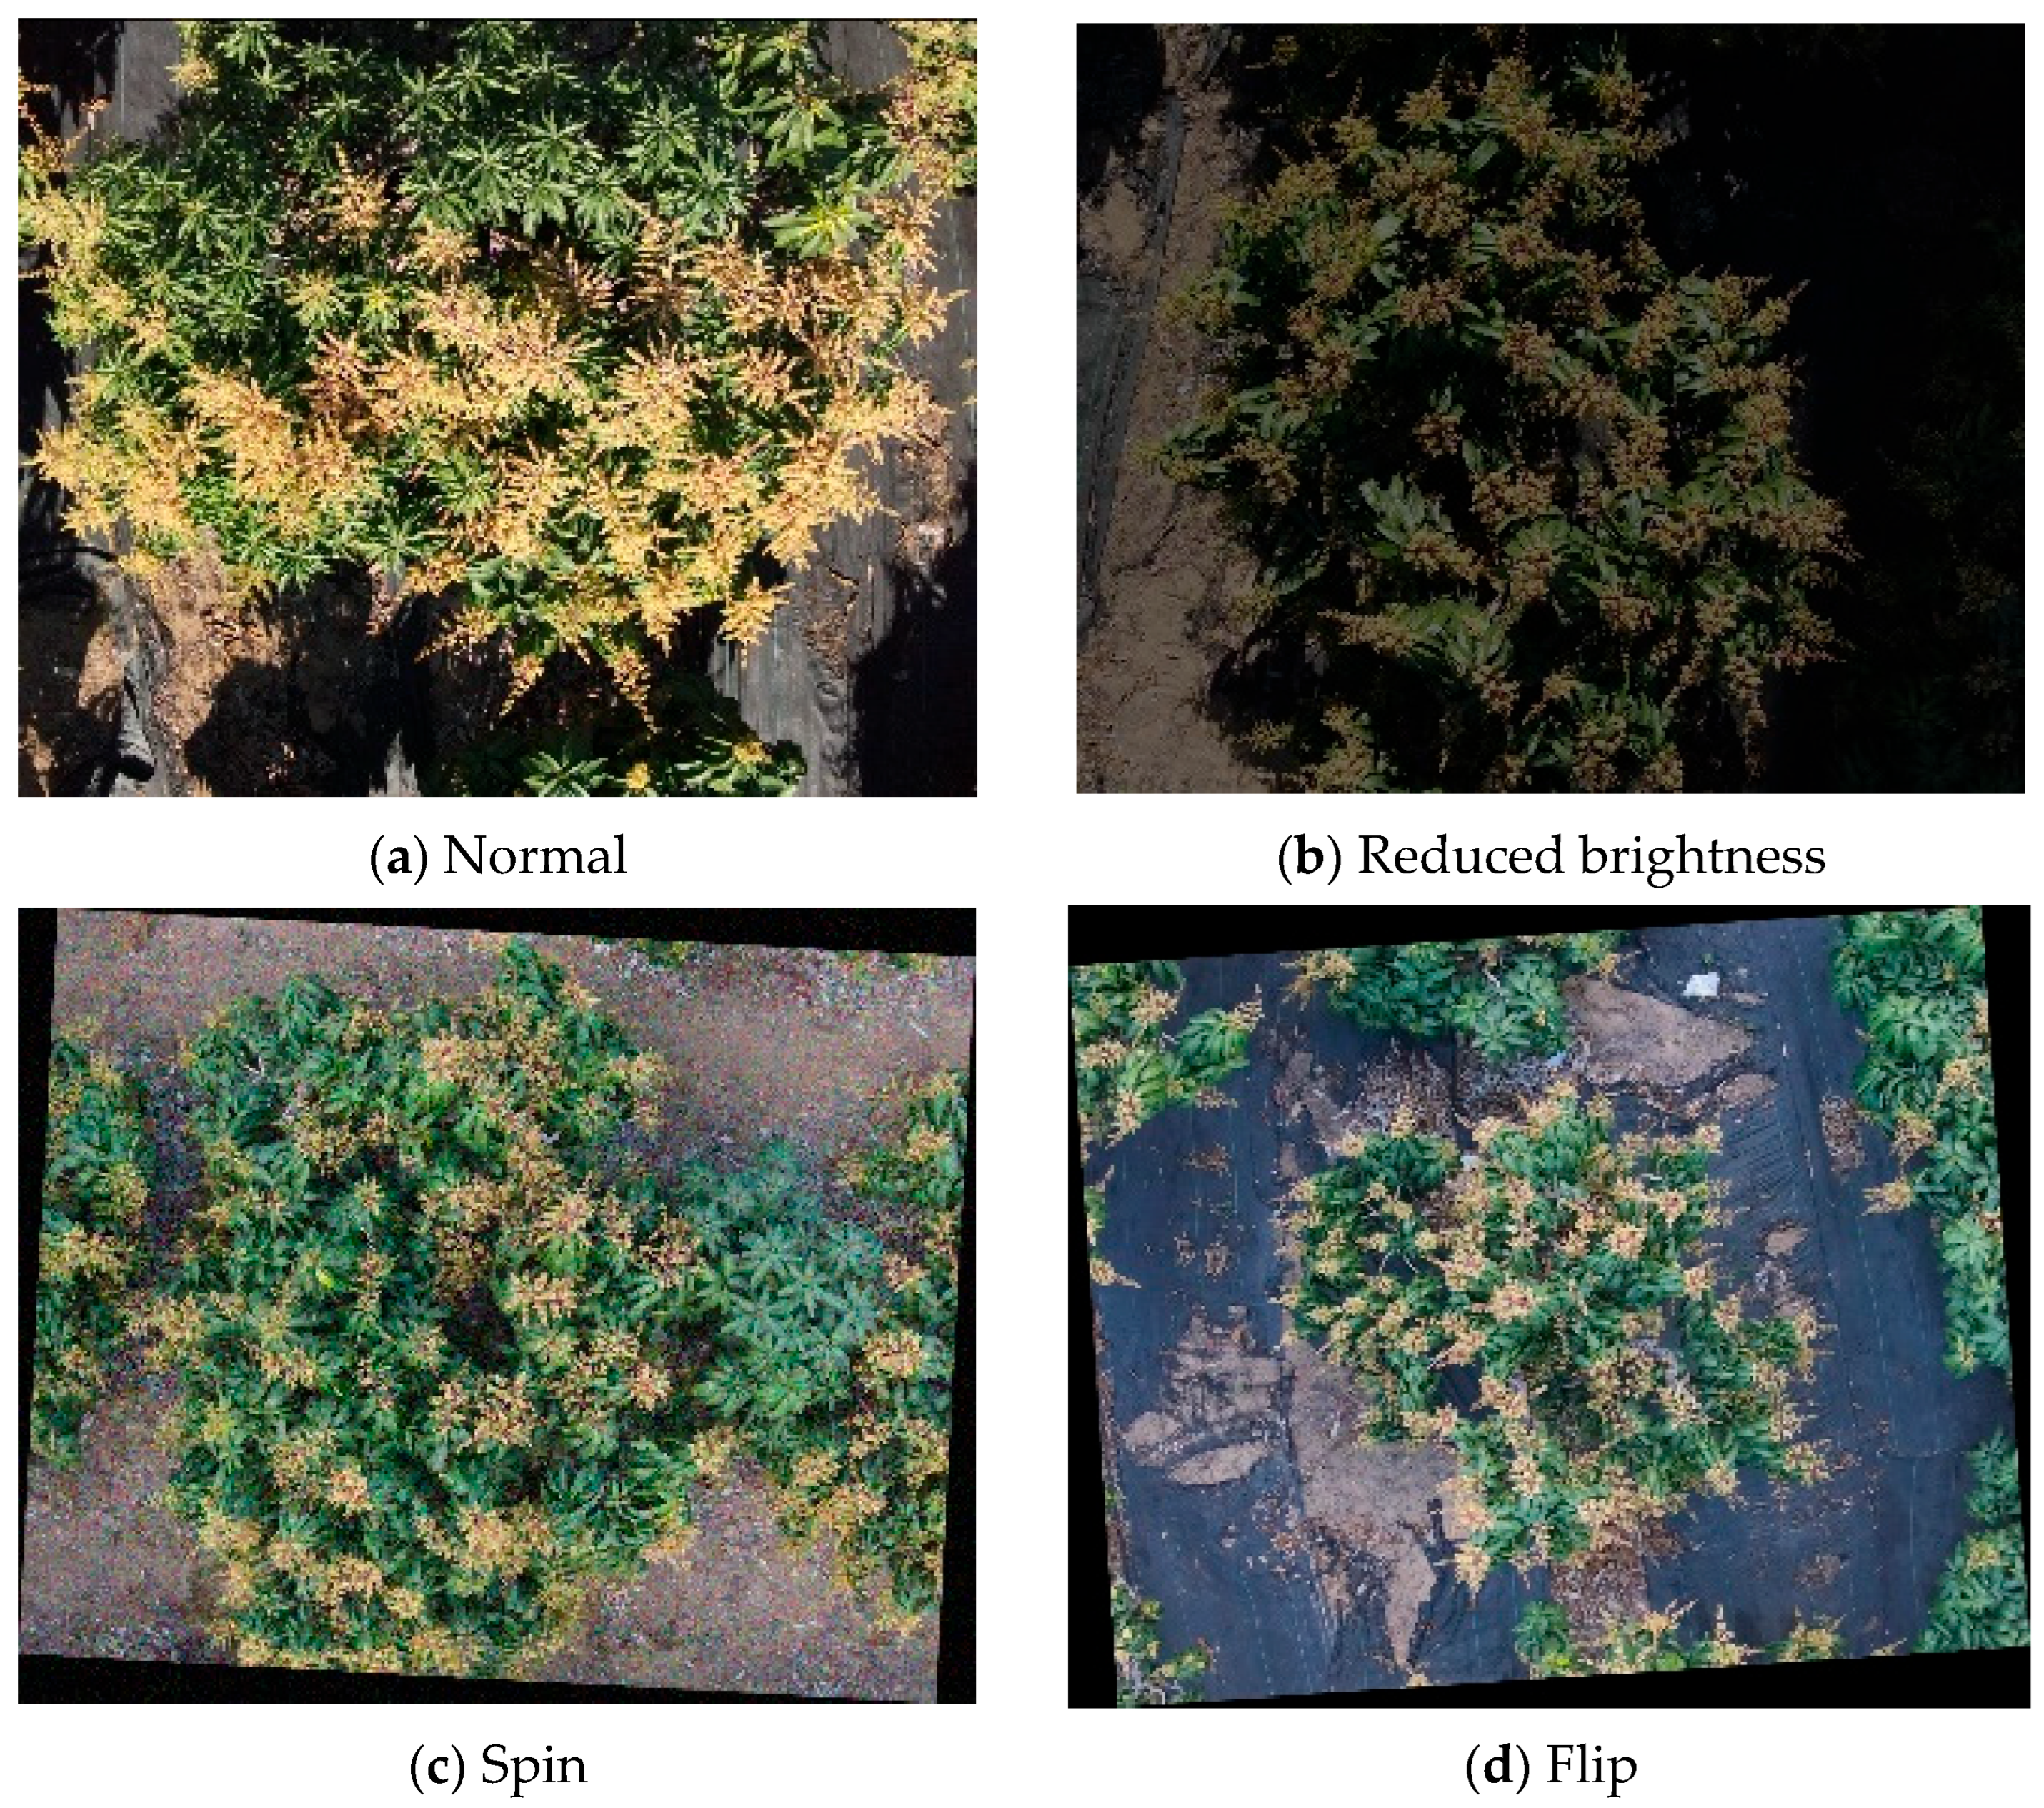
  • Image Preprocessing: YOLOv8 typically resizes the input image to a fixed size (e.g., 640 × 640). The image pixels are usually normalized to a range between [0, 1] or [−1, 1]. Data augmentation techniques are used to improve the model’s generalization ability, including: random cropping, random rotation, random flipping, and color adjustments (such as variations in brightness and contrast).
  • Feature Extraction: CSPDarknet is an improved version of Darknet. By modifying the network structure, CSPDarknet reduces computational complexity while retaining sufficient feature information. The input image is processed through various layers, including convolutional layers, activation functions (e.g., ReLU or Leaky ReLU), and pooling layers. These operations generate feature maps at different scales, which capture essential information from the image, such as edges, textures, and colors.
  • Feature Fusion: YOLOv8 employs the PANet (Path Aggregation Network) feature fusion technique. This method combines feature maps of different scales by weighted aggregation and uses Skip Connections to directly link lower-layer feature maps with higher-layer ones. This allows YOLOv8 to leverage more low-level features to enhance detection performance.
  • Head: The head module employs a modern Decoupled-Head architecture, enhancing performance by isolating classification and regression tasks. Additionally, it transitions from an Anchor-Based to an Anchor-Free framework. Unlike earlier versions, YOLOv8 eliminates dependency on preset anchor boxes, instead generating direct predictions for an object’s position and category from every feature map pixel (or key point).
Our methodology followed the same four-stage framework as YOLOv8, but incorporated a global attention mechanism to optimize Step 2, particularly by refining the backbone network’s C2f module. This integration allowed adaptive focus on target areas, significantly boosting detection precision for densely clustered objects. Furthermore, we redesigned the loss function to strengthen bounding box localization and accelerate network convergence. The architectural overview of our enhanced YOLOv8 is illustrated in Figure 2. The core component of the C2f-Faster module is Partial Convolution (PConv), which performs convolution on only 1/4 of the input channels while directly preserving the remaining 3/4, thereby reducing computational overhead. The input/output channel dimensions of the FasterBlock remain consistent with the original Bottleneck to ensure compatibility. Although skip connections are retained in the C2f module, the number of stacked FasterBlocks is reduced from 3 to 1 to accelerate inference.

2.2.1. FasterNet Module

The C2f module used in YOLOv8 contains a bottleneck structure, which helps improve network training speed and enhances feature extraction capabilities. However, YOLOv8 uses an excessive number of concatenated Bottleneck structures, resulting in a significant computational overhead and leading to excessive channel information redundancy. Modern lightweight architectures employ depthwise or group convolutions to efficiently capture spatial features while lowering computational demands and memory usage [20]. Nevertheless, although these techniques decrease floating-point operations (FLOPs), they introduce higher memory access overhead, which can impact operator efficiency.
Subsequently, MicroNet further decomposes and sparsifies the network, reducing FLOPs to extremely low levels, but fragmented computation results in inefficiencies. FasterNet [21] was designed to improve network inference speed by using a novel neural network structure that primarily utilizes Partial Convolution (PConv) and Pointwise Convolution (PWConv) techniques. The structure of FasterNet Block is depicted in Figure 3.
This study proposed a PConv to simultaneously reduce computational redundancy and memory access. It only applied ordinary convolution to some of the input channels to extract spatial features, while the rest of the channels remained unchanged. For continuous memory access, we only used the first or the last consecutive Cp channels as representatives for calculating the entire feature map. Without losing generality, we only considered the case where the input and output feature maps had the same number of channels. Therefore, the FLOP of a PConv is:
h   ×   w   ×   k 2   ×   C p 2
When the common value r = C p C   =   1 4 is adopted, the FLOPs of a PConv is 1 16 of that of an ordinary Conv. In addition, the memory access of PConv is also less.
h   ×   w   ×   2 C P   +   k 2   ×   C p 2     h   ×   w   ×   2 C P
Therefore, the FasterBlock from FasterNet is used to replace the Bottleneck module in YOLOv8’s C2f module, achieving a more lightweight network structure.

2.2.2. GAM Attention Mechanism

In recent years, the attention mechanism has seen significant advancements, especially within Natural Language Processing (NLP) and Computer Vision (CV). By mimicking human cognitive focus—such as visual or auditory selectivity—it enables models to prioritize critical data segments when handling extensive inputs, enhancing overall efficiency. This approach is extensively utilized across diverse applications, spanning image categorization, object identification, language translation, and audio processing.
In computer vision, attention mechanisms are typically implemented through self-attention or a combination of global and local attention mechanisms to enhance the network’s focus on important areas within an image. For example, Transformer models [22] (such as DETR) and some variations of Convolutional Neural Networks (CNNs) (like SENet and CBAM) have incorporated attention mechanisms. Self-Attention establishes global relationships between different regions of an image, allowing the model to capture long-distance dependencies. Each pixel or feature point is weighted and combined based on the features of other pixels in the image, thus, paying more attention to critical local features. In some modern CNNs, both local and global attention mechanisms are combined and used in conjunction with convolutional layers. For instance, the SE (Squeeze-and-Excitation) module enhances the representation of important features by adaptively weighting the channels, improving image classification and object detection performance.
When attention mechanisms are applied solely along the channel dimension, they can be inefficient in suppressing unimportant pixels, as seen in SE (Squeeze-and-Excitation) [23]. To tackle this issue, scholars have integrated channel and spatial attention mechanisms, exemplified by the CBAM (Convolutional Block Attention Module) [24]. Yet, this method overlooks interdependencies between channels and spatial axes, potentially resulting in cross-dimensional data loss. For enhancement, a novel strategy was introduced, employing attention weighting across three axes—channels, width, and height—to boost computational effectiveness. To enhance the interaction between these dimensions, the GAM (Global Attention Mechanism) [25] is used to capture important features from all three dimensions, thereby avoiding information loss and improving detection efficiency. This attention mechanism is based on a redesign of the CBAM submodules, and its structure is shown in Figure 4.
For a given input feature F 1 R C × H × W , the intermediate feature F 2 and the output feature F 3 are:
F 2   =   M c ( F 1 ) F 1
F 3   =   M s ( F 2 ) F 2
The feature maps for channel attention and spatial attention are denoted as M c and M s , respectively, where indicates element-wise multiplication.
As illustrated in Figure 5, the GAM consists of two attention submodules: channel and spatial. The channel attention component utilizes a 3D architecture to maintain dimensional integrity, along with a dual MLP to enhance cross-dimensional interactions between channel and spatial features. Meanwhile, the spatial attention submodule employs convolutional layers to integrate spatial data. To avoid feature degradation, this module omits max pooling, ensuring the preservation of feature map details.
The GAM is inserted at the output of the C2f-Faster module, applying channel-spatial joint attention weighting to the feature maps extracted by C2f-Faster.

2.2.3. Loss Function Improvement

YOLOv8 network uses CIoU to predict the frame coordinate loss LCIoU, and its calculation is as in
L C I o U   =   L I o U   +   ( x     x g t ) 2   +   ( y     y g t ) 2 W g 2   +   H g 2   +   α v
α   =   v L I o U + v
v   =   4 π 2 ( a r c t a n w h     a r c t a n w g t h g t ) 2
L I o U   =   W i H i w h   +   w g t h g t     W i H i
In the given formula, α serves as a weighting factor designed to adjust the significance of various samples or objectives, ensuring a more precise evaluation of model effectiveness. The function v quantifies the aspect ratio, assessing the proportionality between height and width. The CIoU loss integrates an adjustment parameter to enhance the model’s ability to discern object contours accurately. Additionally, it accounts for the diagonal measurement of the bounding box, refining localization accuracy.
CIoU also includes the bounding box’s aspect ratio as a penalty component in the loss function, promoting faster regression convergence. Nevertheless, when the model stabilizes at a fixed width-to-height relationship between predicted and actual boxes, it may hinder simultaneous adjustments to the predicted box’s dimensions during optimization.
Consequently, this research adopted WIoU—a dynamic, non-monotonic focusing mechanism—as an alternative to CIoU. Equation (9) outlines the WIoU computation method.
L W I o U   =   r R W I o U L W I o U ,   R W I o U [ 1 , e ) ,   L W I o U [ 1 , e ]
In the formula, the distance-sensitive R W I o U mechanism enhances the L W I o U of standard anchor boxes, where R W I o U ranges between 1 and e , substantially boosting L W I o U values. A dynamic focusing factor r is applied to prioritize moderately performing anchor boxes. This variable coefficient modulates the alignment between predicted and ground truth bounding boxes. Unlike static focusing methods, this adaptive mechanism permits flexible calibration across varying IoU intervals, allowing for finer-grained assessment of model accuracy.
R W I o U is defined as Equation (10), and r is defined as Equation (11).
R W I o U   =   e x p ( ( x     x g t ) 2   +   ( y     y g t ) 2 W g 2   +   H g 2 )
r   =   β δ α β δ
In the equation β = L I o U L I o U ¯ [ 0 , + ] , L I o U ¯ represents the dynamic moving average. When the dynamic moving average is large, it causes the parameter updates to be slow, leading to overly conservative bounding box regression results that struggle to adapt to changes in the target’s position, causing the detection box to deviate from the target’s true location. On the other hand, when the dynamic moving average is small, it may cause the parameter updates to be too sensitive, leading to large fluctuations in the bounding box regression results, causing the detection box to oscillate around the target and failing to consistently capture the accurate position of the target. Therefore, an appropriate dynamic moving average should be selected to maintain both the accuracy and stability of the detection box, ensuring that the bounding box accurately regresses to the target’s location. The hyperparameters α and δ can be fine-tuned to enhance the model’s performance and generalization capability.
Compared to CIoU, WIoU not only removes the aspect ratio penalty term but also allows the use of a non-monotonic focusing coefficient to dynamically adjust the weight of the matching degree. This provides a better way to evaluate the performance of the object detection model and optimize its performance. Therefore, employing WIoU as the loss function enhances the model’s fish detection performance.

2.3. Dataset Construction

2.3.1. Construction of Mango Tidbits Data Set

The mango flower cluster dataset used in this study was designed based on the actual agricultural conditions in Hunan Province and the specific project requirements. The process of constructing the dataset primarily consisted of four main steps: mango flower cluster image collection, sample augmentation and correction, dataset division, and dataset format conversion.

2.3.2. Mango Tidbits Data

Our work focuses on the recognition of mango flower clusters in the natural environment of mango tree canopies. The original flower cluster data types are shown in Figure 6, primarily addressing complex orchard environments. These environments include challenges such as similar colors and complex shapes, lighting variations in natural scenes, and occlusions between leaves and flower clusters.

2.3.3. Sample Expansion and Revision

After filtering and augmentation, the mango flower cluster dataset consists of a total of 1846 samples, which are divided into training, validation, and test sets at a ratio of 8:1:1. Data augmentation is applied by performing a series of random transformations (such as flipping, cropping, rotating, scaling, color adjustment, and translation) on the original training images, as shown in Figure 7. These transformations generate a large number of new samples with varying viewpoints, sizes, lighting conditions, and backgrounds. These variations simulate the diverse forms and environmental changes that objects may encounter in the real world, allowing the model to be exposed to more varied scenarios during the training phase, thus, improving its adaptability to different situations.

2.3.4. Dataset Format Conversion

Since the annotation format given by the tidbits data set is JSON format, the original annotation file needs to be converted into a TXT format file that the YOLO model can use. This study uses Python scripts to format annotations in batches.

2.4. Test Platform and Training Schedule

This research employed Python as the primary programming language, with the enhanced neural network architecture developed using the PyTorch (version 1.13.0) platform. The project’s foundational code was adapted from Ultralytics’ publicly available YOLOv8 implementation. Training parameters included 200 epochs and a batch size of 64. For optimization, Stochastic Gradient Descent (SGD) was utilized.
The learning rate scheduling strategy was designed as follows: During the warm-up phase (first 3 epochs), the learning rate was linearly increased from 0.001 to 0.01 to mitigate initial training instability. Subsequently, a cosine annealing schedule was applied from epoch 4 to 200 (final learning rate = 0.0001) to balance convergence and fine-tuning requirements. The optimizer settings included SGD with a momentum of 0.937 and weight decay of 0.0005.
The experiments began with the YOLOv8s.pt model, pre-trained on the extensive COCO8 dataset. A comprehensive breakdown of the experimental setup is provided in Table 1.

3. Results and Analysis

3.1. Model Ablation Test and Analysis

3.1.1. Comparative Test and Analysis of Improved FasterNet Module

To verify the efficacy of the incorporated FasterNet component in this research, the YOLOv8 network was used as the base network, with all parameters held constant except for the backbone network. MobileNetV3 [26], GhostNet [27], and ShuffleNetV2 [28] were used to replace the lightweight feature extraction backbones, and the training results of different backbones were compared. We analyzed the performance of each model across the entire training cycle in terms of key metrics, including precision, recall, mean average precision (mAP), parameter count (Params), and inference time (ms). The trends of precision and recall over 200 epochs are illustrated in Figure 8, while the remaining metrics are summarized in Table 2.
As can be observed from Figure 8, the YOLOv8-FasterNet model demonstrated superior performance compared to other models in terms of both precision and recall. Furthermore, the YOLOv8-FasterNet achieved the highest F1-score of 0.92 for flower fragment detection, indicating optimal balance in the precision-recall curve.
Table 2 demonstrates that YOLOv8-FasterNet surpasses MobileNetV3, GhostNet, and ShuffleNetV2 in both mAP@0.5 and mAP@0.5:0.95 metrics. Furthermore, integrating FasterNet reduced the model’s parameters by 29.16% (down to 3.8 MB) and cut inference time by 9.7 ms (reaching 3.8 ms) relative to the other networks. While accuracy was comparable to MobileNetV3, YOLOv8-FasterNet exceeded GhostNet and ShuffleNetV2 by 0.4 to 1 points in mAP. These findings confirm that YOLOv8-FasterNet delivers enhanced feature extraction, optimal performance, and greater alignment with this study’s objectives.

3.1.2. Comparative Experiment and Analysis of GAM and Other Attention Mechanisms

In the attention ablation experiment, this study analyzed the performance differences between the GAM attention mechanism and other mechanisms, including Channel Attention Mechanism (Squeeze and Excitation Networks, SE), Coordinate Attention Mechanism (CA), and Spatial-Channel Attention Mechanism (Convolutional Block Attention Module, CBAM). For this analysis, only the corresponding attention mechanism replaced the GAM attention mechanism to build models with the respective attention mechanisms. The loss function used in all models was the SIoU loss function, and the training environment and parameters were consistent with those used for YOLOv8-GAM.
As shown in Table 3, the ablation study on attention mechanisms revealed that most variants contributed marginally to enhancing YOLOv8’s accuracy. In contrast, the proposed GAM approach attained superior results compared to alternative methods.
The experiment demonstrates that the simultaneous use of the GAM attention mechanism for normalization and channel attention significantly enhanced model performance. The layered structure of the GAM played a crucial role in preventing the GAM layer from overly suppressing obvious channel features or excessively enhancing ambiguous channel features. As shown in the attention mechanism comparison experiment in Table 3, the models incorporating other attention mechanisms showed almost no improvement in the performance of YOLOv8, and in some cases, even a decrease in accuracy. The CBAM attention mechanism showed a slight improvement, but the mAP was 0.7% lower compared to the GAM attention mechanism used in this study. This suggested that combining the strengths of GAM and CBAM leads to the best performance metrics. The experimental results were shown in Figure 9.
The GAM attention mechanism demonstrates superior capability in extracting small target features compared to the CBAM attention mechanism, and it achieves a higher average precision overall.

3.1.3. Loss Function Comparison

The YOLOv8 framework employs the CIoU loss function for bounding box regression. Despite its effectiveness, CIoU requires intricate calculations, including angle discrepancies, center-point distances, and aspect ratios, which can hinder training efficiency. Additionally, in scenarios involving occlusions or varying object scales, CIoU exhibits lower stability than alternative loss functions.
A comparative study evaluated the convergence behavior of YOLOv8 using four loss functions: CIoU, DIoU, GIoU, and WIoU. Figure 10 illustrates the outcomes. GIoU achieved the highest final loss value and the slowest convergence. DIoU yielded marginally better results than GIoU, while CIoU further reduced the loss slightly but converged faster than GIoU. Notably, WIoU demonstrated rapid convergence within the initial 10 epochs, achieving a substantially lower loss than the other methods.

3.1.4. Ablation Test

To assess the performance of different enhanced components in mango flower detection, ablation studies were performed with YOLOv8 serving as the reference model. The evaluation considered key measures including mean average precision (mAP), parameter count (Params), and processing speed (ms) as benchmark criteria.
As shown in Table 4, compared to Experiment 1, Experiment 2 replaced the backbone network of YOLOv8 with FasterNet. This resulted in a slight decrease of 0.1 percentage points in accuracy, but a significant reduction in both inference speed and the number of parameters. FasterNet employs efficient lightweight convolution modules and depthwise separable convolutions, reducing the model’s computational load and parameter count while maintaining detection accuracy. In particular, when dealing with more complex object detection tasks, FasterNet achieved faster inference speeds by reducing redundant computations and optimizing feature extraction, making it especially suitable for edge computing and real-time processing scenarios.
Compared to the baseline model (Experiment 1), the introduction of GAM in Experiment 3 improved mAP@.5 from 90.1% to 92.3% (+2.2 points) while increasing parameters by only 21% (from 26.3 MB to 31.8 MB). This demonstrated that GAM effectively enhances the model’s focus on critical feature representations. The performance gain suggested superior target discrimination capability, particularly in mitigating complex background interference during floral object detection. Furthermore, the results indicated that GAM facilitated more efficient feature integration during both training and inference phases, enabling better utilization of hierarchical visual patterns. The marginal inference time increase (from 5.4 ms to 6.5 ms, +20.4%) remained reasonable given the significant accuracy improvement.
In Experiment 4, the loss function was updated to WIoU, building on the framework of Experiment 1. This modification led to a 1.1% rise in average precision, demonstrating that the model prioritizes boundary prediction and overlap management more effectively during training. Such refinement enables the detector to achieve superior localization and identification of targets, ultimately boosting its accuracy and robustness.

3.1.5. SOTA Model Comparison Test

To demonstrate the advantages of our proposed model, we conducted a comparative analysis with several state-of-the-art (SOTA) models, including YOLOv8n, YOLOv8l, DETR-R50 [29], RT-DETR-L, and MobileViT-XXS [30]. The key performance metrics are summarized in Table 5.
As shown in Table 5, under the same computational cost (18.1MB parameters), our method achieved a 1.9 percentage point higher mAP@0.5 than RT-DETR-L. Compared with the lightweight Transformer (MobileViT-XXS), our approach demonstrated a 5.7% improvement in accuracy while maintaining faster inference speed.

3.2. Practicality Test of Edge Device Deployment

To objectively evaluate the effectiveness and practical utility of the proposed mango inflorescence detection algorithm, the system was deployed on an NVIDIA Jetson Xavier NX platform (NVIDIA Corporation). A total of 150 mango trees in the orchard were randomly selected, with each tree assigned a unique identifier. The number of inflorescence clusters on each tree was manually recorded and subsequently compared with the algorithm’s detection results, as presented in Figure 11. This comparative analysis provided a quantitative assessment of the algorithm’s performance under real-world field conditions.
Five trees were randomly selected, and each tree was measured five times using the proposed method. The average values were calculated, along with the standard deviation (σ) and 95% confidence interval. Additionally, the mean processing time of the edge device over five trials was recorded. The results are presented in Table 6.
As illustrated in Figure 10 and Table 6, the proposed algorithm achieves automatic detection with a standard deviation within 10% compared to manual counting results. The 95% confidence interval was [49.76, 52.24], and the predicted number of inflorescences was generally slightly lower than that obtained by manual counting. The maximum mean processing time is 15.2 ms.

4. Conclusions

This research investigated mango flower detection, tackling difficulties including dense crop arrangements, low-quality images, and intricate environmental conditions. Enhancements were made to the YOLOv8 framework to optimize its performance for such scenarios. Key findings include:
  • A specialized dataset for mango bloom identification was developed, incorporating selective sampling, data augmentation, and manual adjustments to align with real-world farming conditions and project needs.
  • FasterNet was integrated as the backbone network in place of YOLOv8’s default structure. Although precision saw a marginal decline of 0.1%, notable improvements were observed in processing speed and parameter efficiency. This highlights FasterNet’s ability to streamline computational demands while maintaining accuracy through advanced architectural design. The Global Attention Mechanism (GAM) was implemented within the feature extraction framework, creating a more effective structure. Tests revealed that GAM boosted average precision by 2.2% over the baseline YOLOv8 model, surpassing alternative attention approaches like SE, CA, and CBAM. Replacing the CIoU loss function with WIoU (Weighted Intersection over Union) improved bounding box localization. WIoU accelerated convergence by refining the alignment between predicted and actual boxes, leading to a 1.1% increase in mAP@.5 performance.
  • Our proposed automatic detection algorithm, based on UAV-RGB imagery and an improved YOLOv8 architecture, was deployed on edge devices for practical evaluation. The results demonstrated a deviation of less than 10% compared to manual counting, indicating the practical applicability and feasibility of this approach.
The lightweight characteristics of FasterNet provide a solid foundation for edge deployment. However, future work could explore TensorRT-based quantization and structured pruning techniques to further optimize the algorithm for low-power UAV computing platforms. Additionally, since the current findings are based on specific fruit varieties and lighting conditions, further data collection in diverse orchards is necessary to expand the dataset and validate the model’s robustness in more complex environments.

Author Contributions

Conceptualization, J.X., X.P. and L.W.; methodology, J.X. and L.W.; software and algorithm, J.X. and X.P.; validation, L.C.; formal analysis, J.X. and L.W.; investigation, L.C., Q.T. and Z.Z.; resources, Y.T. and X.L.; data curation, L.W.; writing—original draft preparation, J.X. and L.W.; writing—review and editing, X.L. and L.W.; visualization, W.C.; supervision, L.W.; project administration, L.W.; funding acquisition, L.W. All authors have read and agreed to the published version of the manuscript.

Funding

This work was supported in part by the Scientific Research Project of the Natural Science Foundation of Hunan Province, Grant Number 2024JJ6226, Grant Number 2025JJ70506 and Grant Number 2023JJ50419. This work was also partly supported by the Scientific Research Fund of Hunan Provincial Education Department, Grant Number 23A0581 and Grant Number 24B0755. Linhui Wang and Jiayi Xiao contributed equally to this work. Xiaolin Liang is the corresponding author.

Data Availability Statement

Data are contained within the article.

Acknowledgments

The authors gratefully acknowledge the support and would like to thank the Hunan Engineering Research Center for Smart Agriculture (Fruits and Vegetables) Information Perception and Early Warning for their provision of equipment support.

Conflicts of Interest

The authors declare no conflict of interest.

References

  1. Venkata, R.R.P.; Gundappa, B.; Chakravarthy, A.K. Pests of mango. In Pests and Their Management; Springer: Singapore, 2018; pp. 415–440. [Google Scholar]
  2. Han, D.Y.; Li, L.; Niu, L.; Chen, J.; Zhang, F.; Ding, S.; Fu, Y. Spatial Distribution Pattern and Sampling of Thrips on Mango Trees. Chin. J. Trop. Crops 2019, 40, 323–327. [Google Scholar]
  3. Li, J.; Lin, L.; Tian, K.; Al, A. Detection of leaf diseases of balsam pear in the field based on improved Faster R-CNN. Trans. Chin. Soc. Agric. Eng. 2020, 36, 179–185. [Google Scholar]
  4. Girshick, R. Fast R-CNN. In Proceedings of the International Conference on Computer Vision, Santiago, Chile, 7–13 December 2015. [Google Scholar]
  5. Ren, S.; He, K.; Girshick, R.; Sun, J. Faster R-CNN: Towards real-time object detection with region proposal networks. In Proceedings of the Advances in Neural Information Processing Systems, Montreal, QC, Canada, 7–12 December 2015. [Google Scholar]
  6. Liu, W.; Anguelov, D.; Erhan, D.; Szegedy, C.; Reed, S.; Fu, C.; Berg, A. SSD: Single shot multibox detector. In Proceedings of the Computer Vision–ECCV 2016: 14th European Conference, Amsterdam, The Netherlands, 8–16 October 2016. [Google Scholar]
  7. Redmon, J.; Divvala, S.; Girshick, R.; Farhadi, A. You only look once: Unified, real-time object detection. In Proceedings of the IEEE Conference on Computer Vision and Pattern Recognition, Las Vegas, NV, USA, 26 June–1 July 2016. [Google Scholar]
  8. Lin, T.; Goyal, P.; Girshick, R.; He, K.; Dollar, P. Focal loss for dense object detection. In Proceedings of the IEEE International Conference on Computer Vision, Venice, Italy, 22–29 October 2017. [Google Scholar]
  9. Yu, B.; Lü, M. Improved YOLOv3 algorithm and its application in military target detection. J. Ordnance Eng. 2022, 43, 345–354. [Google Scholar]
  10. Peng, H.; Li, Z.; Zou, X.; Wang, H.; Xiong, J. Research on litchi image detection in orchard using UAV based on improved YOLOv5. Expert Syst. Appl. 2025, 263, 125828. [Google Scholar] [CrossRef]
  11. Guo, B.; Wang, B.; Zhang, Z.; Wu, S.; Li, P.; Hu, L. Improved YOLOv3 crop target detection algorithm. J. Agric. Big Data 2024, 6, 40–47. [Google Scholar]
  12. Tian, Y.; Yang, G.; Wang, Z.; Wang, H.; Li, E.; Liang, Z. Apple detection during different growth stages in orchards using the improved YOLO-V3 model. Comput. Electron. Agric. 2019, 157, 417–426. [Google Scholar] [CrossRef]
  13. Kuznetsova, A.; Maleva, T.; Soloviev, V. Using YOLOv3 Algorithm with Pre- and Post-Processing for Apple Detection in Fruit-Harvesting Robot. Agronomy 2020, 10, 1016. [Google Scholar] [CrossRef]
  14. Chen, C.; Peng, C.; Cheng, Y.; Wang, Y.; Zou, S. Research on food crop and weed recognition based on lightweight YOLOv5. Agric. Technol. 2023, 43, 36–40. [Google Scholar]
  15. Cai, Z.; Cai, Y.; Zeng, F.; Yue, X. Rice panicle recognition based on improved YOLOv5 in field. J. South China Agric. Univ. 2024, 45, 108–115. [Google Scholar]
  16. Hu, J.; Li, G.; Mo, H.; Lv, Y.; Qian, T.; Chen, M.; Lu, S. Crop node detection and internode length estimation using an improved YOLOv5 model. Agriculture 2023, 13, 473. [Google Scholar] [CrossRef]
  17. Zhao, J.; Zhang, X.; Yan, J.; Qiu, X.; Yao, X.; Tian, Y.; Zhu, Y.; Cao, W. A wheat spike detection method in UAV images based on improved YOLOv5. Remote Sens. 2021, 13, 3095. [Google Scholar] [CrossRef]
  18. Ye, J.; Qiu, W.; Yang, J.; Yi, W.; Ma, Z. A deep learning-based lychee pest identification method. Lab. Res. Explor. 2021, 40, 29–32. [Google Scholar]
  19. Wen, T.; Wang, T.; Huang, S. Crop and Amaranth detection algorithm based on improved YOLOv8: MES-YOLO. Comput. Eng. Sci. 2024, 14, 29888. [Google Scholar]
  20. Chen, F.; Li, S.; Han, J.; Ren, F.; Yang, Z. Review of Lightweight Deep Convolutional Neural Networks. Arch Comput. Methods Eng. 2024, 31, 1915–1937. [Google Scholar] [CrossRef]
  21. Chen, J.; Kao, S.; He, H.; Zhou, W.; Wen, S.; Lee, C.H.; Chan, S.H.G. Run, Don’t Walk: Chasing Higher FLOPS for Faster Neural Networks. arXiv 2023, arXiv:2303.03667. [Google Scholar]
  22. Vaswani, A.; Shazeer, N.; Parmar, N.; Uszkoreit, J.; Jones, L.; Gomez, A.N.; Kaiser, Ł.; Polosukhin, I. Attention is all you need. In Proceedings of the 31st International Conference on Neural Information Processing Systems, Long Beach, CA, USA, 4–9 December 2017. [Google Scholar]
  23. Hu, J.; Shen, L.; Sun, G. Squeeze-and-Excitation Networks. In Proceedings of the IEEE Conference on Computer Vision and Pattern Recognition, Salt Lake City, UT, USA, 18–23 June 2018. [Google Scholar]
  24. Woo, S.; Park, J.; Lee, J.-Y.; Kweon, I.S. CBAM: Convolutional Block Attention Module. In Proceedings of the European Conference on Computer Vision (ECCV), Munich, Germany, 8–14 September 2018. [Google Scholar]
  25. Zhang, X.; Xu, R.; Yu, H.; Zou, H.; Cui, P. Gradient Norm Aware Minimization Seeks First-Order Flatness and Improves Generalization. In Proceedings of the IEEE/CVF Conference on Computer Vision and Pattern Recognition, Vancouver, BC, Canada, 18–22 June 2023. [Google Scholar]
  26. Gupta, R.; Jain, S.; Kumar, M. Enhanced Thermal Object Detection and Classification with MobileNetV3: A Cutting-Edge Deep Learning Solution. In Proceedings of the 2024 15th International Conference on Computing Communication and Networking Technologies (ICCCNT), Kamand, India, 24–28 June 2024. [Google Scholar]
  27. Zhang, H.; Li, Y. GhostStereoNet: Stereo Matching from Cheap Operations. In Proceedings of the 2024 4th International Conference on Computer Science, Electronic Information Engineering and Intelligent Control Technology (CEI), Guangzhou, China, 8–10 November 2024. [Google Scholar]
  28. Zhou, H.; Su, Y.; Chen, J.; Li, J.; Ma, L.; Liu, X.; Lu, S.; Wu, Q. Maize Leaf Disease Recognition Based on Improved Convolutional Neural Network ShuffleNetV2. Plants 2024, 13, 1621. [Google Scholar] [CrossRef] [PubMed]
  29. Carion, N.; Massa, F.; Synnaeve, G.; Usunier, N.; Kirillov, A.; Zagoruyko, S. End-to-End Object Detection with Transformers. In Proceedings of the Computer Vision–ECCV 2020, Glasgow, UK, 23–28 August 2020. [Google Scholar]
  30. Mehta, S.; Rastegari, M. Mobilevit: Light-weight, general-purpose, and mobile-friendly vision transformer. arXiv 2021, arXiv:2110.02178. [Google Scholar]
Figure 1. Dataset collection using UAVs. (a) Hainan province geographical location; (b) Sanya City geographical coordinates; (c) UAVs-RGB image dataset.
Forests 16 00896 g001
Figure 2. The network structure diagram of enhanced YOLOv8.
Forests 16 00896 g002
Figure 3. The Structure of FasterNet Block.
Forests 16 00896 g003
Figure 4. GAM structure diagram.
Forests 16 00896 g004
Figure 5. GAM attention submodule.
Forests 16 00896 g005
Figure 6. Mango tidbits data set.
Forests 16 00896 g006
Figure 7. Enhanced dataset.
Forests 16 00896 g007
Figure 8. Changes in the precision and recall indicators of each backbone network.
Forests 16 00896 g008
Figure 9. Comparison of the effect of GAM and CBAM attention mechanisms.
Forests 16 00896 g009
Figure 10. Comparison of loss functions.
Forests 16 00896 g010
Figure 11. Comparison between automatically detected and manually counted.
Forests 16 00896 g011
Table 1. Experimental configuration.
ProjectParams
Operating systemWindows-10-10.0.18362-SP0
CPUIntel(R) Xeon(R) Gold 6130 CPU @ 2.10 GHz
GPUNVIDIA Quadro RTX 8000
CUDA version12.1
Python versionpython3.12
Deep learning modelYolov8s.pt
Table 2. Comparison of the results of the backbone network.
Backbone NetworkmAP@.5/%mAP@.5:.95/%Params/MBTime/ms
YOLOv8-FasterNet90.070.78.052.4
MobileNetV390.169.237.2112.1
GhostNet89.668.115.537.7
ShuffleNetV289.067.811.856.2
Table 3. Performance comparison tests of GAM and other attention mechanisms.
ModelmAP@.5/%mAP@.5:.95/%Params/MbTime/ms
YOLOv890.171.026.35.4
YOLOv8-SE84.251.929.56.2
YOLOv8-CA81.458.428.75.1
YOLOv8-CBAM91.666.330.16.7
YOLOv8-GAM92.372.731.86.5
Table 4. Ablation test.
ExperimentBaseline ModelFasterNetGAMWIoUmAP@.5/%mAP@.5:.95/%Params/MBTime/ms
1YOLOv8 90.171.026.35.4
2YOLOv8 90.070.78.052.4
3YOLOv8 92.372.731.86.5
4YOLOv8 91.270.032.46.1
5YOLOv8 93.774.813.73.2
6YOLOv8 93.170.912.84.7
7YOLOv8 92.871.234.67.1
8YOLOv894.074.418.14.2
Table 5. Performance comparison with SOTA models.
NumModelmAP@.5/%mAP@.5:.95/%Params
/MB
Time
/ms
1YOLOv8n87.270.13.11.8
2YOLOv8l91.572.543.48.2
3DETR-R5089.771.241.215.3
4RT-DETR-L92.172.632.06.5
5MobileViT-XXS88.370.95.63.4
6This study94.075.118.14.2
Table 6. Statistical results and performance metrics.
Tree IDAutomatic
Detected
Manual Counted σ 95% Confidence
Intervals
Mean Time/ms
2188,88,89,90,89910.836[87.76, 89.84]14.2
1347,47,48,49,48490.836[46.76, 48.84]14.3
3850,50,52,51,52521.000[49.76, 52.24]15.0
8486,87,86,86,88880.894[85.49, 87.71]13.8
10570,70,71,72,71740.836[69.76, 71.84]15.2
Disclaimer/Publisher’s Note: The statements, opinions and data contained in all publications are solely those of the individual author(s) and contributor(s) and not of MDPI and/or the editor(s). MDPI and/or the editor(s) disclaim responsibility for any injury to people or property resulting from any ideas, methods, instructions or products referred to in the content.

