Article

Separating Biomass Gains and Losses of Planted Forest and Natural Forest and Their Contributions to Forest Biomass Carbon Storage in China for 2005–2020

1
National Meteorological Center, China Meteorological Administration, Beijing 100081, China
2
Guangxi Institute of Meteorological Science, Nanning 530022, China
3
State Key Laboratory of Severe Weather Meteorological Science and Technology, Chinese Academy of Meteorological Sciences, Beijing 100081, China
4
Environmental Sciences Department, University of Virginia, Charlottesville, VA 22904-4123, USA
*
Author to whom correspondence should be addressed.
Forests 2025, 16(6), 884; https://doi.org/10.3390/f16060884 (registering DOI)
Submission received: 20 March 2025 / Revised: 9 May 2025 / Accepted: 21 May 2025 / Published: 23 May 2025
(This article belongs to the Special Issue Monitoring Forest Change Dynamic with Remote Sensing)

Abstract

:
Quantifying the spatio-temporal dynamics of forest biomass in both natural and planted forests over large areas has proven challenging. Using a remote sensing data-based method, this study presents a novel approach to separate the biomass gains and losses of planted forests and natural forests and to quantify their independent contributions to total forest biomass changes. Annual forest biomass data were calculated using 1 km spatial resolution maps of planted and natural forests in China for 2005–2020. Planted forest biomass increased substantially from 1.81 Pg C in 2005 to 3.11 Pg C in 2020 at a rate of 0.086 Pg C yr−1. In contrast, natural forests remained relatively stable at 6.44 Pg C over the same period. Driven largely by extensive afforestation efforts, planted forests accounted for 100% of the increase in China’s forest biomass. Notably, 86.2% of the planted forest biomass and 70.3% of the natural forest biomass were located in southern China, which has a warmer climate. The area’s expansion of newly planted forests (i.e., young forests) contributed all of the total increase in biomass carbon storage (1.30 Pg C) in the planted forest category from 2005 to 2020. Forests planted before 2005 with mid-to-old tree age, together with natural forests, played a minor role in the total increase in forest biomass in China during this period. This is likely due to forest harvesting and natural disasters in these forests offsetting the growth of natural forests and mid-to-old-age planted forests over the 2005 to 2020 interval. This study highlights the complex and distinct biomass dynamics of planted and natural forests in China, which are subject to both human management and natural disturbances.

1. Introduction

Atmospheric CO2 concentration has increased from 278 ppm in 1750, the start of the industrial era, to 423.4 ppm in 2024 [1]. This increase is attributed to huge anthropogenic emissions from fossil fuel combustion, cement production, and gas flaring, which have exceeded the capacity of the terrestrial biosphere and the ocean to absorb atmospheric CO2 [2]. This increase, coupled with other increases in greenhouse gases such as methane and nitrous oxide, has produced potential consequences, including planetary warming [2,3].
The year 2023 is considered the hottest year on record, with the global mean temperature nearly surpassing the 1.5 °C warming threshold for the first time, primarily due to anthropogenic greenhouse gas warming superimposed on the strong El Niño of 2023 [4]. To reduce the risk of critical impacts of global warming on human society and natural ecosystems, the Intergovernmental Panel on Climate Change (IPCC) has recommended holding the global average temperature increase below 2 °C above pre-industrial levels by reducing global CO2 emissions and implementing sustained global mitigation [5].
To mitigate global warming, natural climate solutions (NCSs), particularly forest-based solutions, have been proposed because global forests absorb a large amount of atmospheric CO2 and function as an enduring carbon sink, equivalent to almost half of the fossil-fuel emissions [6]. Reforestation, including natural forest regeneration and plantations, has been identified as a high-potential option for carbon sequestration [7,8].
Significant greening has been observed in China and India, driven by afforestation and agricultural intensification, respectively [8]. In China, forest biomass carbon storage has increased significantly through national-scale afforestation and reforestation projects [7,9,10] intended to support national carbon neutrality initiatives [11].
It is important to distinguish between natural and planted forests when evaluating the ecological, climatic, and socio-economic impacts of forests. Management practices in planted forests, such as tree species selection and fertilization, can enhance forest growth and biomass accumulation compared to natural forests [12]. However, analyses indicate that a combination of plantations and natural forest regeneration may be more cost-effective for climate change mitigation in low- and middle-income countries [13]. Thus, it is critical to quantify the spatio-temporal dynamics of forest biomass in both natural and planted forests over large areas.
Recent studies have focused on characterizing the differences between natural and planted forests in China [10,14]. For example, the vegetation index EVI2 showed that greening trends were 7.0% lower in planted forests compared to natural forests in southern China [14]. National Forest Inventory (NFI) data from China over the past 40 years indicate significant increases in forest carbon storage for both natural and planted forests [10].
However, few studies have reported spatio-temporal changes in biomass for planted and natural forests through the use of forest models. Land ecosystem model simulations at a resolution of 0.5 × 0.5 degrees show an expected rapid forest expansion in China, producing substantial biomass carbon accumulation over the last four decades [15]. Natural forests account for 65%, and planted forests produce 35% of this accumulation [15]. Satellite mapping has detected a doubling of planted forest area in China from 1990 to 2020, leading to a substantial increase in planted forest carbon storage estimated by using a carbon density-biomass equation [16,17].
While forests are important for their carbon sequestration, they also serve as an essential resource for timber products. Forests are vulnerable to disturbances such as fire, wind, forest diseases, and insect pests, which result in losses of forest biomass and area for natural and planted forests [18]. These complex disturbances pose challenges to forest biomass simulations that do not account for disturbance [15,17].
To date, remote sensing techniques have not been used to separate forest biomass between planted and natural forests. Remote sensing methods, using optical data, lidar signals, and microwave data trained by using field samples of forest biomass, have been developed to quantify spatio-temporal changes in forest biomass and provide insights into biomass dynamics under disturbance [19,20,21,22,23]. By integrating multi-source remote sensing data with intensive field measurements, Chen et al. [21] produced continuous above- and below-ground estimates of forest biomass carbon stocks from 2002 to 2021 across China at a spatial resolution of 1 km.
Furthermore, the spatial distribution of planted and natural forests has been independently investigated using 30 m resolution satellite data, based on their significant textural and spectral differences in satellite images [16,24]. For China, natural and planted forests were mapped at a 30 m resolution every five years from 1990 to 2020 using Landsat images and intensive field samples [16]. The development of these remote sensing technologies provides an opportunity to distinguish between the biomass of planted and natural forests, allowing studies of their respective dynamics.
The aim of this study is to investigate how much planted and natural forests differ in terms of biomass carbon stocks. We present a novel approach based on remotely sensed data to separate forest biomass between planted and natural forests and take disturbance effects into account. Our study utilizes forest biomass data and forest type maps derived from remote sensing. We investigate the biomass dynamics of planted and natural forests in China from 2005 to 2020 at 1 km spatial resolution. In addition, we explore the latitudinal variation in biomass changes for both planted and natural forests.

2. Materials and Methods

2.1. Above- and Below-Ground Forest Biomass in China for 2005–2020

Above- and below-ground forest biomass carbon pools for China between 2002 and 2021 at a spatial resolution of 1 km were generated by integrating multiple remote sensing observations with intensive field measurements using regression and machine learning approaches [21]. A benchmark map of forest above-ground biomass (AGB) was first produced by calibrating a synthetic aperture radar (SAR)-based AGB map in China with massive field measurements of AGB during 2011–2015. The mean tree cover (TCmean) was calculated from the MODIS vegetation continuous field (VCF) data for the same period of 2011–2015. For each grid, a regression equation was built between the benchmark AGB and TCmean using a searching window size of up to 9 × 9 grids until the regression yielded valid coefficients. This regression equation was then used to estimate the AGB time series for 2002–2021 based on the primary predictor of TCmean derived from the MODIS VCF data [21].
To generate the below-ground biomass (BGB) time series, a random forest (RF) model was developed using in situ AGB and BGB records at forest plots along with the AGB time series. Forest stand age, forest type, AGB, mean annual temperature (MAT), temperature seasonality (standard deviation of monthly temperature), mean annual precipitation (MAP), and precipitation seasonality (coefficient of variation in monthly precipitation) at 8182 plots were adopted as predictors of the forest plot BGB in training 10-fold RF models using MATLAB R2021a software (MathWorks Co., Ltd., Natick, MA, USA). The number of regression trees was set to 500. Further evaluation shows that the resultant RF model achieved a predictive R2 of 0.89 and an RMSE of 6.3 t ha−1 [21]. As a result, the forest BGB time series for 2002–2021 were estimated by using the RF model with inputs of the estimated annual AGB, annual forest type maps [25], and forest stand age maps [26], along with the climatic variables from the WorldClim v2.1dataset [27].
The result shows that China’s forest biomass increased at a rate of 0.114 Pg C per year from 2002 to 2021, with average stocks of AGB and BGB being 8.6 Pg C and 2.2 Pg C, respectively. These results were consistent with previous estimates based on massive field investigations [21]. For a more detailed description of the 1 km above- and below-ground forest biomass data, please refer to the work of Chen et al. [21].

2.2. Natural and Planted Forest Maps in China

Natural and planted forest maps for China were generated every five years from 1990 to 2020 using a random forest (RF) classification framework. This framework utilized a combination of the Landsat-4/5/7/8/9 satellite-surface reflectance archive and 178,530 field samples [16]. The process involved several steps: the preparation of training and testing samples, the calculation of the feature sets from the satellite data, the training of the RF model, forest classification, and accuracy assessment.
For the classification of planted and natural forests, 178,530 forest plot samples were selected, including 93,626 vegetation survey samples and 84,904 forest plot samples from 2010 to 2020 labelled as natural and planted forests. Among these samples, 70% were used to train the RF classification model, while the remaining 30% served as test samples. These training and validating samples were evenly distributed across the forest region in China [16].
In total, 220 features were derived for each five-year period, encompassing multi-spectral, textural, temporal, and topographical features to discriminate between planted and natural forests. The spectral features included the surface reflectance at blue, green, red, near-infrared, and shortwave infrared bands of the Landsat images, along with various derived vegetation indices such as NDVI, EVI, SAVI, MSAVI, and BSI.
The temporal features were calculated from the time series of Landsat images based on harmonic analysis and included amplitude, magnitude, phase, and root mean square error. The textural features consisted of angular second moment, contrast, correlation, difference entropy, dissimilarity, difference variance, entropy, inverse difference moment, inertia, max correlation coefficient, cluster prominence, cluster shade, and variance derived from the Landsat images. Finally, the topographical features included elevation, slope, and aspect derived from Shuttle Radar Topography Mission (SRTM) digital elevation data [16].
The RF approach was employed to classify natural and planted forests by taking into account the spectral features, the textural features, and the temporal features derived from the time series of Landsat satellite images and the topographical features. The RF classified each pixel from an ensemble of 100 decision trees constructed by iterative training on random samples taken from the training data [16].
Three methods were employed to evaluate the accuracy of the forest maps. First, classification accuracy was assessed using a widely adopted approach based on overall accuracy (OA), user accuracy (UA), and producer accuracy (PA) through a confusion matrix. The field validation samples were acquired using a systematic random sampling approach. Cross-validation was employed with an output of the confusion matrix and OA ranging from 77.33% to 81.78%.
Second, the areas of natural and planted forests were compared with the National Forest Inventory-based statistical data across different provinces. This comparison revealed significant linear relationships (p < 0.01) with the coefficients of determination (R2) ranging from 0.76 to 0.87 for planted forests and from 0.81 to 0.89 for natural forests, covering the period from 2000 to 2020 [16].
Third, the time series of planted forest maps was resampled to a 1 km resolution to match the 1 km resolution of the existing planted forest map digitized from the report of the 7th National Forest Resource Inventory (2004–2008). The comparison indicated that the new map for 2005 was spatially consistent with the digitized inventory map. Evaluations indicated a high level of reliability for both the natural and planted forest maps [16].
Forests were defined according to a tree height above 5 m and a canopy cover exceeding 15% within a 30 m resolution pixel. The resultant maps revealed that the planted forest area increased by 447,500 km2 from 1990 to 2020, and the area of natural forests decreased by 219,100 km2 [16].
A more detailed description of the natural and planted forest maps at both a 30 m and 1 km resolution every five years from 1990 to 2020 can be found in the reference of Cheng et al. [16]. The planted forest maps in China were also used to estimate the biomass storage of China’s planted forests at a 0.1° grid scale from 1990 to 2020 using a carbon density method [17].

2.3. Forest Inventory Data

The 9th (2014–2018) China Forest Resources Inventories provide provincial-scale data for forest biomass [28], which was used in this study to evaluate the estimated forest biomass in 2015.

2.4. Above-Ground Forest Biomass Product for 2010

The global forest above-ground biomass product (AGBsantoro) at a spatial resolution of 1 ha for 2010 was estimated from high-resolution satellite observations of synthetic aperture radar (SAR) backscatter [29]. It was validated by using an extensive database of 110,897 AGB measurements from field inventory plots, which shows that AGBsantoro captured well the spatial patterns and magnitude of AGB. The root mean square difference (RMSD) between AGBsantoro and the field inventory AGB relative to the mean value of the reference AGB was 92.1%. AGBsantoro was adopted in the evaluation of the forest above-ground biomass in 2010 and used in this study.

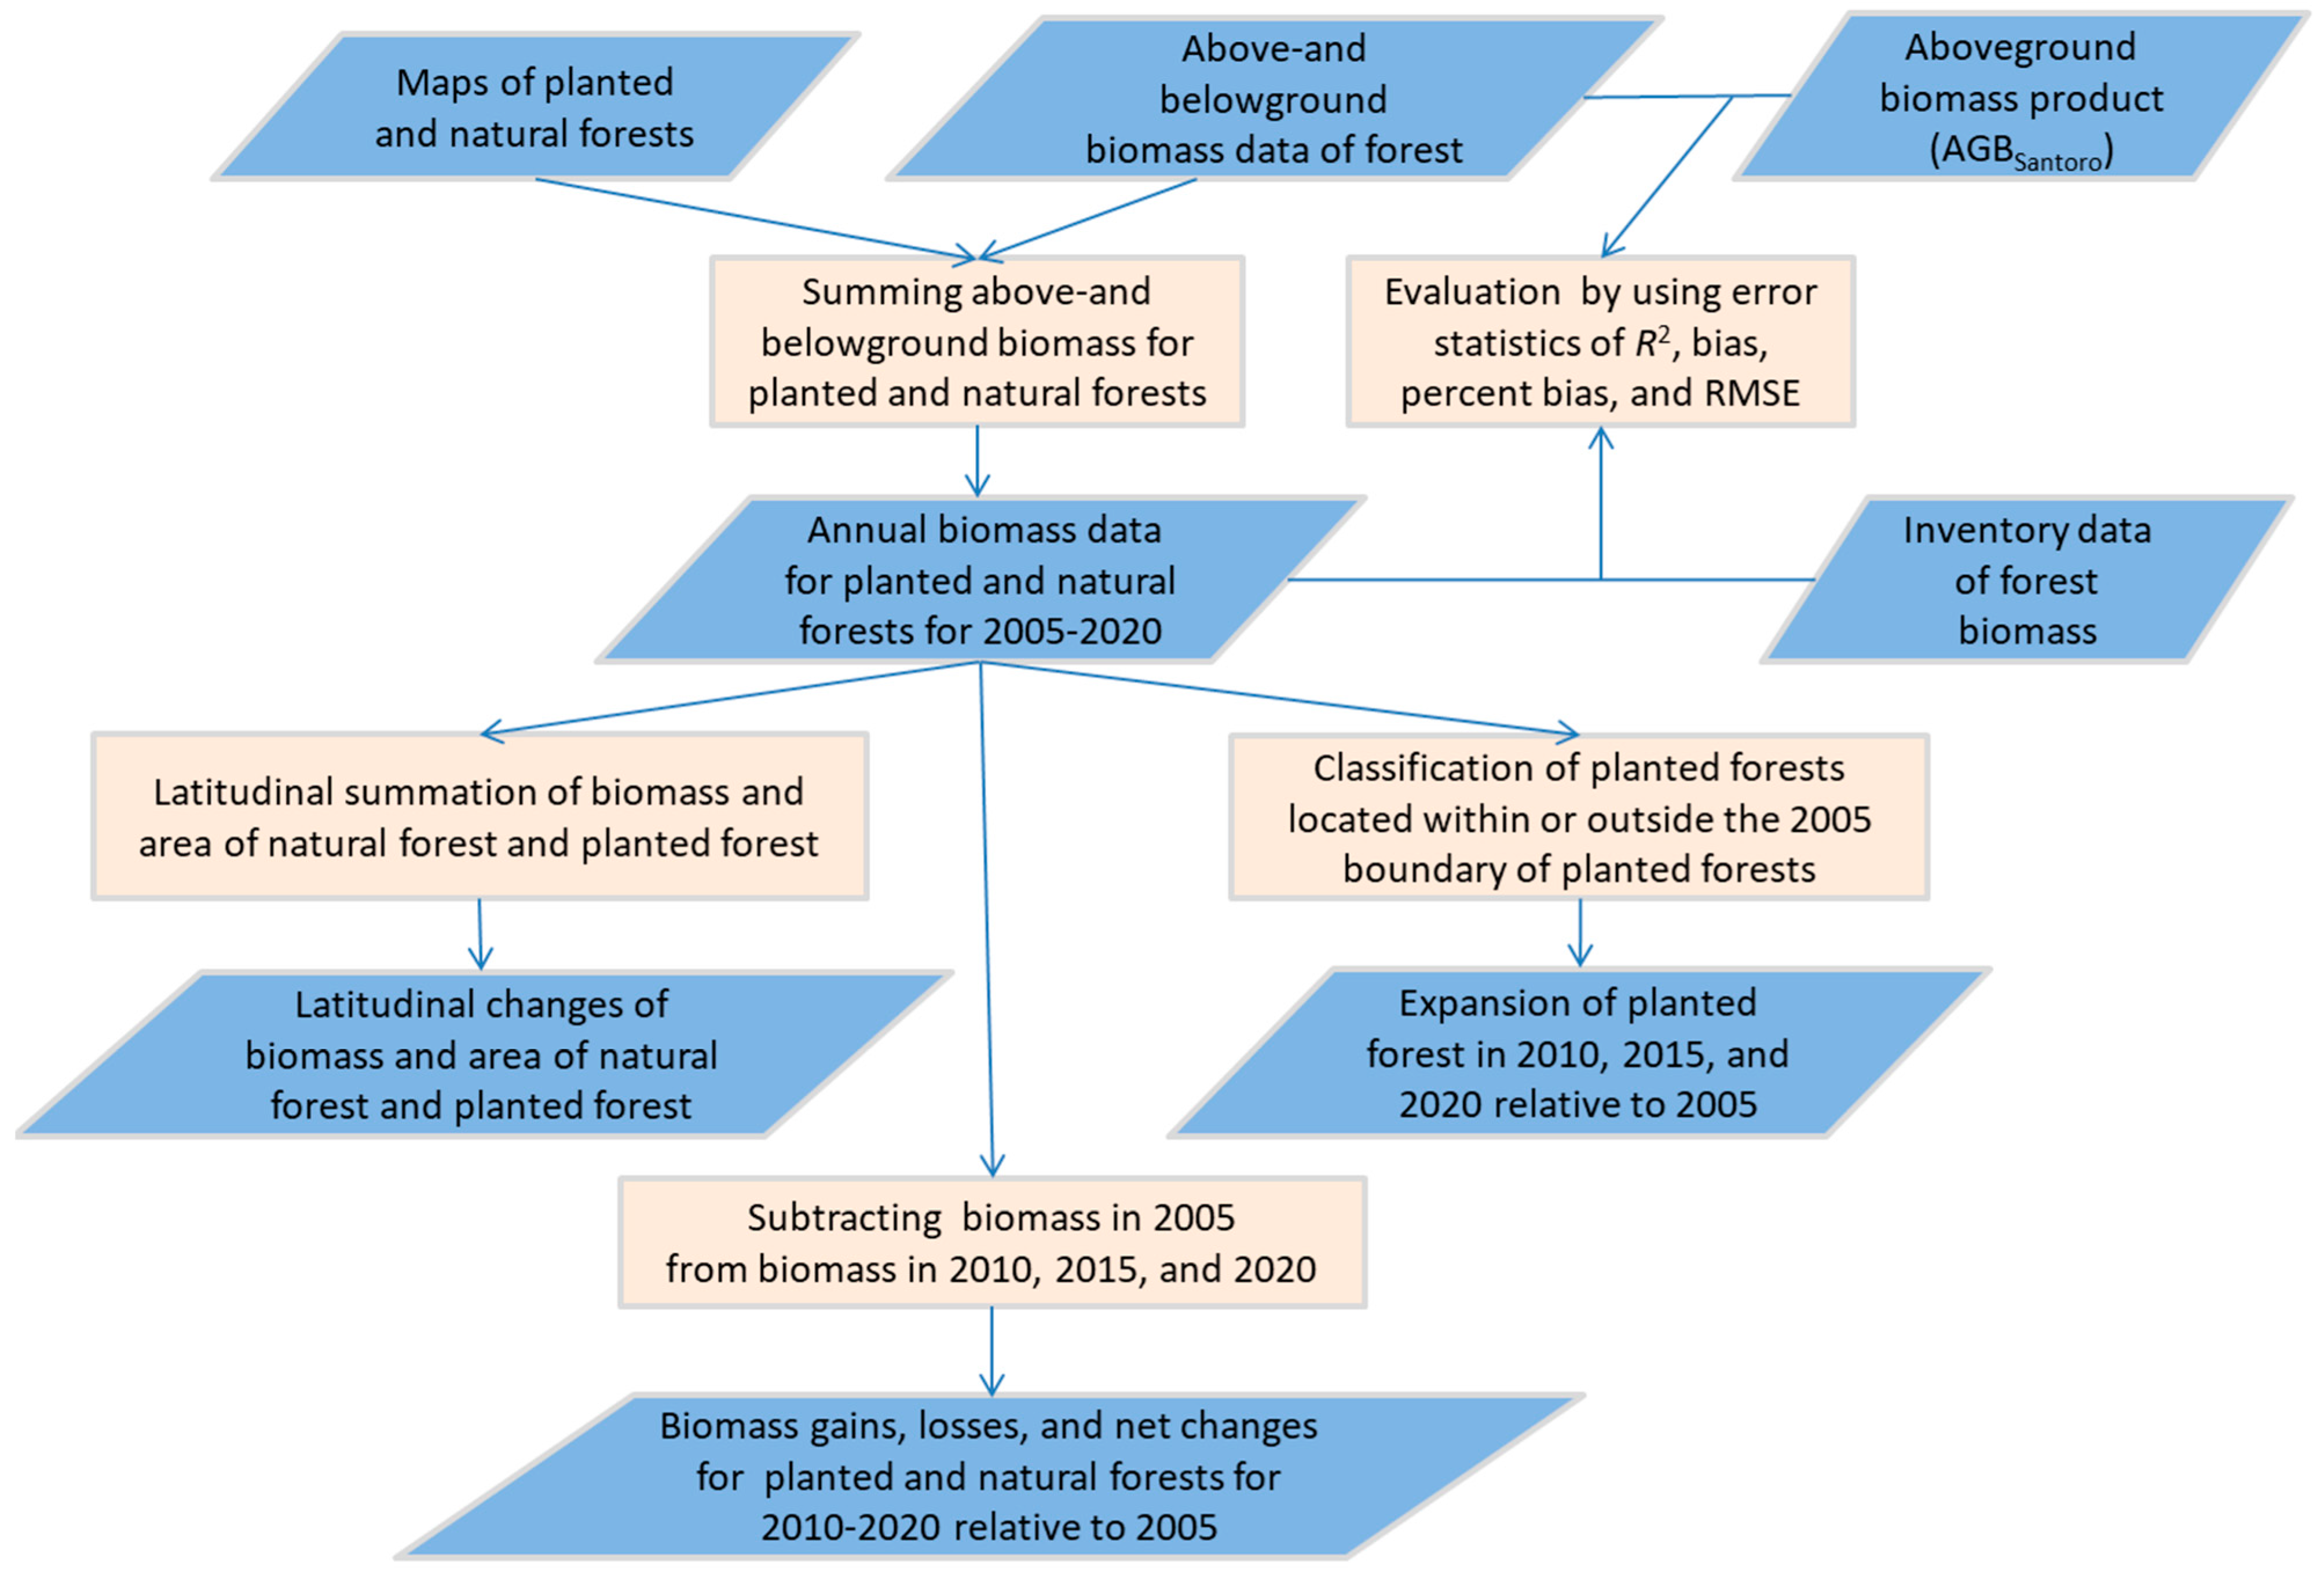
2.5. Data Processing

The employed workflow consists of data processing and the steps to separate biomass gains and losses of planted forest and natural forest (Figure 1). The annual forest biomass for planted and natural forests was calculated as the sum of above-ground and below-ground biomass in China every five years for 2005, 2010, 2015, and 2020, according to the planted and natural forest maps at a 1 km spatial resolution [16]. The 2010 AGBsantoro was re-gridded to a spatial resolution of 1 km and was adopted in the assessment of above-ground biomass in China used in this study. The data processing, calculations, and mapping were carried out using IDL 8.2 software (NV5 Geospatial Software, Suffolk, VA, USA) and ArcGIS 9.3 software (Environmental Systems Research Institute, Redlands, CA, USA) on a local computer.

2.6. Methods

The annual biomass for natural forests, planted forests, and total forests in China was aggregated from the pixel value for the years 2005, 2010, 2015, and 2020. The interannual biomass changes were analyzed in relation to the area changes in planted forests and natural forests. The individual contributions of planted and natural forests to the total biomass changes were quantified for each of the years 2005, 2010, 2015, and 2020.
Using the 2005 biomass data as a benchmark, the study calculated the biomass gains (Bgain), losses (Bloss), and net changes (Bnet) for both planted and natural forests for the years 2010, 2015, and 2020 at the grid level. This was carried out by subtracting the biomass from 2005 (Figure 1). Further analysis examined the impact of these gains and losses on the net changes in biomass for both planted and natural forests between 2005 and 2020.
B g a i n = k = 1 n ( B y e a r , k B 2005 , k )   w h e n   ( B y e a r , k B 2005 , k )
B l o s s = k = 1 n ( B y e a r , k B 2005 , k )   w h e n   ( B y e a r , k < B 2005 , k )
B n e t = B g a i n + B l o s s
where Bgain, Bloss, and Bnet are the biomass gains, losses, and net changes for planted forest, natural forest, and forest, respectively, n is the total number of pixels, Byear is the biomass in the sample year (i. e., 2010, 2015, and 2020), and B2005 is the biomass in 2005 as a benchmark.
Error statistics of R2, bias (i.e., estimated value minus observed value), percent bias (i.e., 100 × bias divided by observed value), and root mean square error (RMSE) were adopted in the evaluation of above-ground forest biomass in 2010 against AGBsantoro and the forest biomass in 2015 against the 9th inventory-based biomass (Figure 1).

3. Results

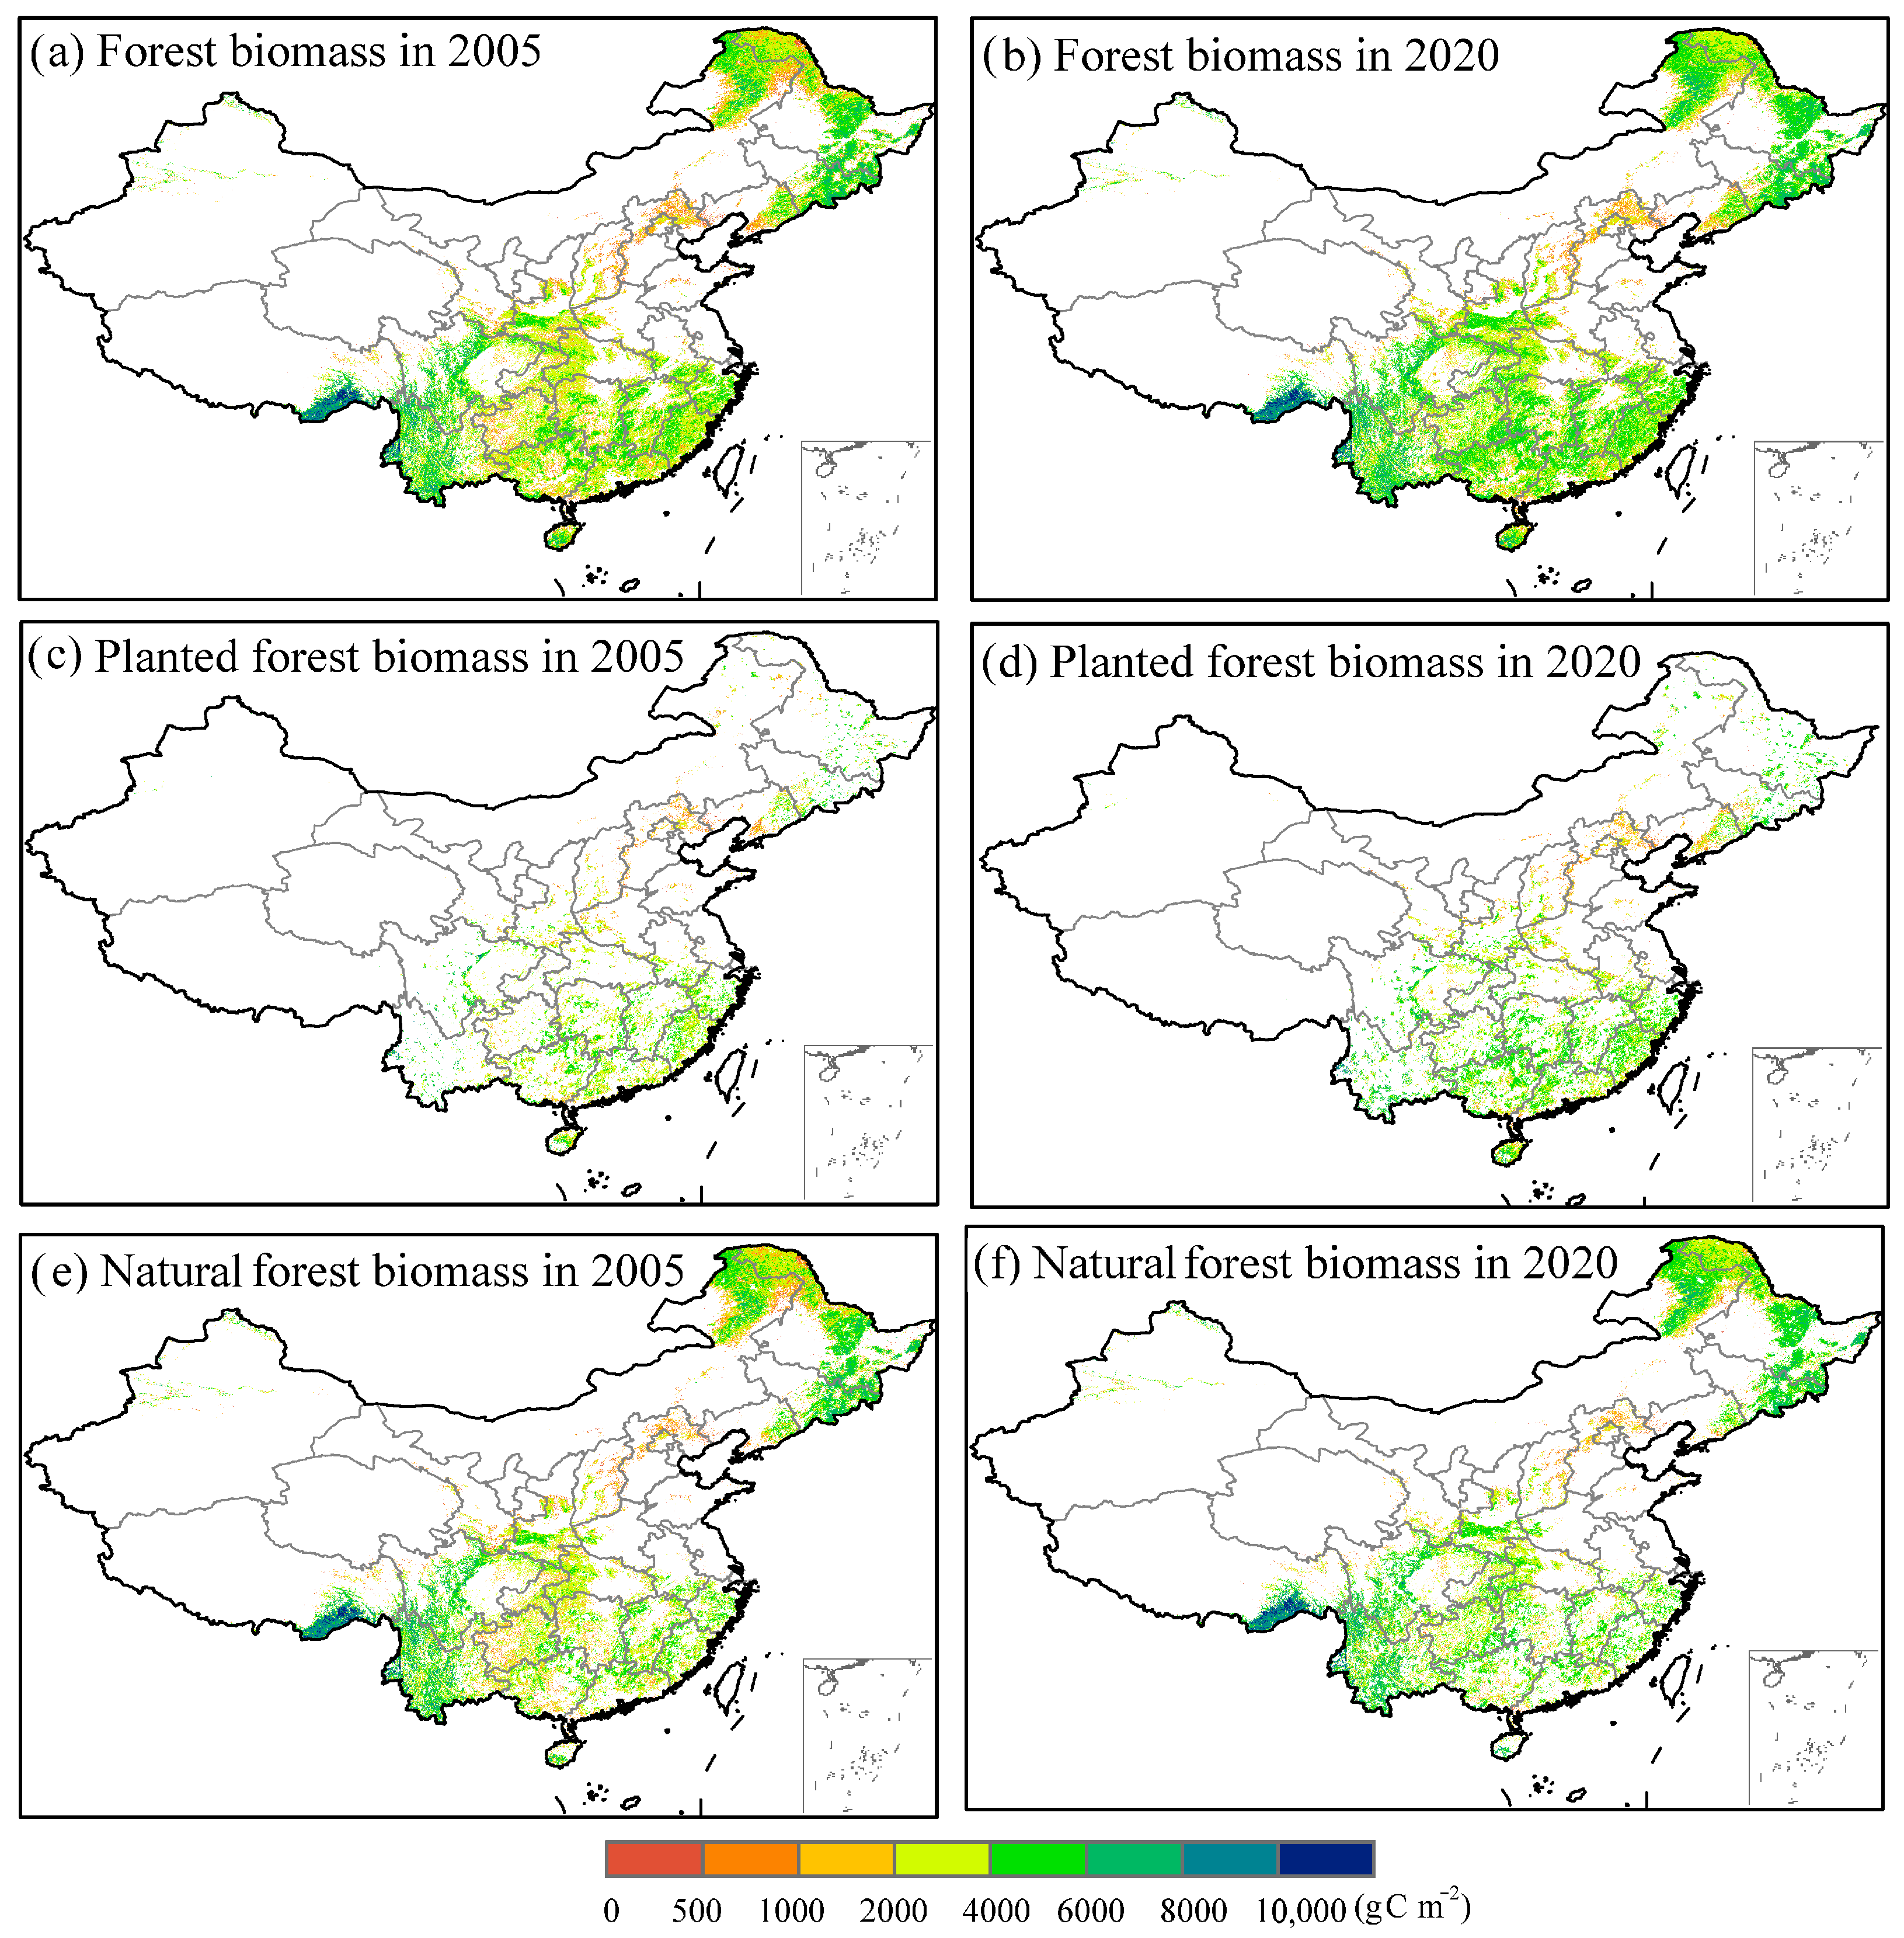
3.1. Distribution of Mean Planted and Natural Forest Biomass for 2005–2020

For the period 2005–2020, planted forests were mainly distributed in southern China, where they occupied a small area compared to natural forests (Figure 2). On average, 86.2% of planted forest biomass and 70.3% of natural forest biomass were distributed in southern China (i.e., 18° N–35° N), with a small proportion of planted forest biomass (13.8%) and natural forest biomass (29.7%) located in northern China (Table 1). Planted forest biomass with a carbon density above 4000 g C m−2 was mainly located in southern China, and natural forest biomass with a carbon density over 4000 g C m−2 was mainly located in northeastern China and southwestern China.

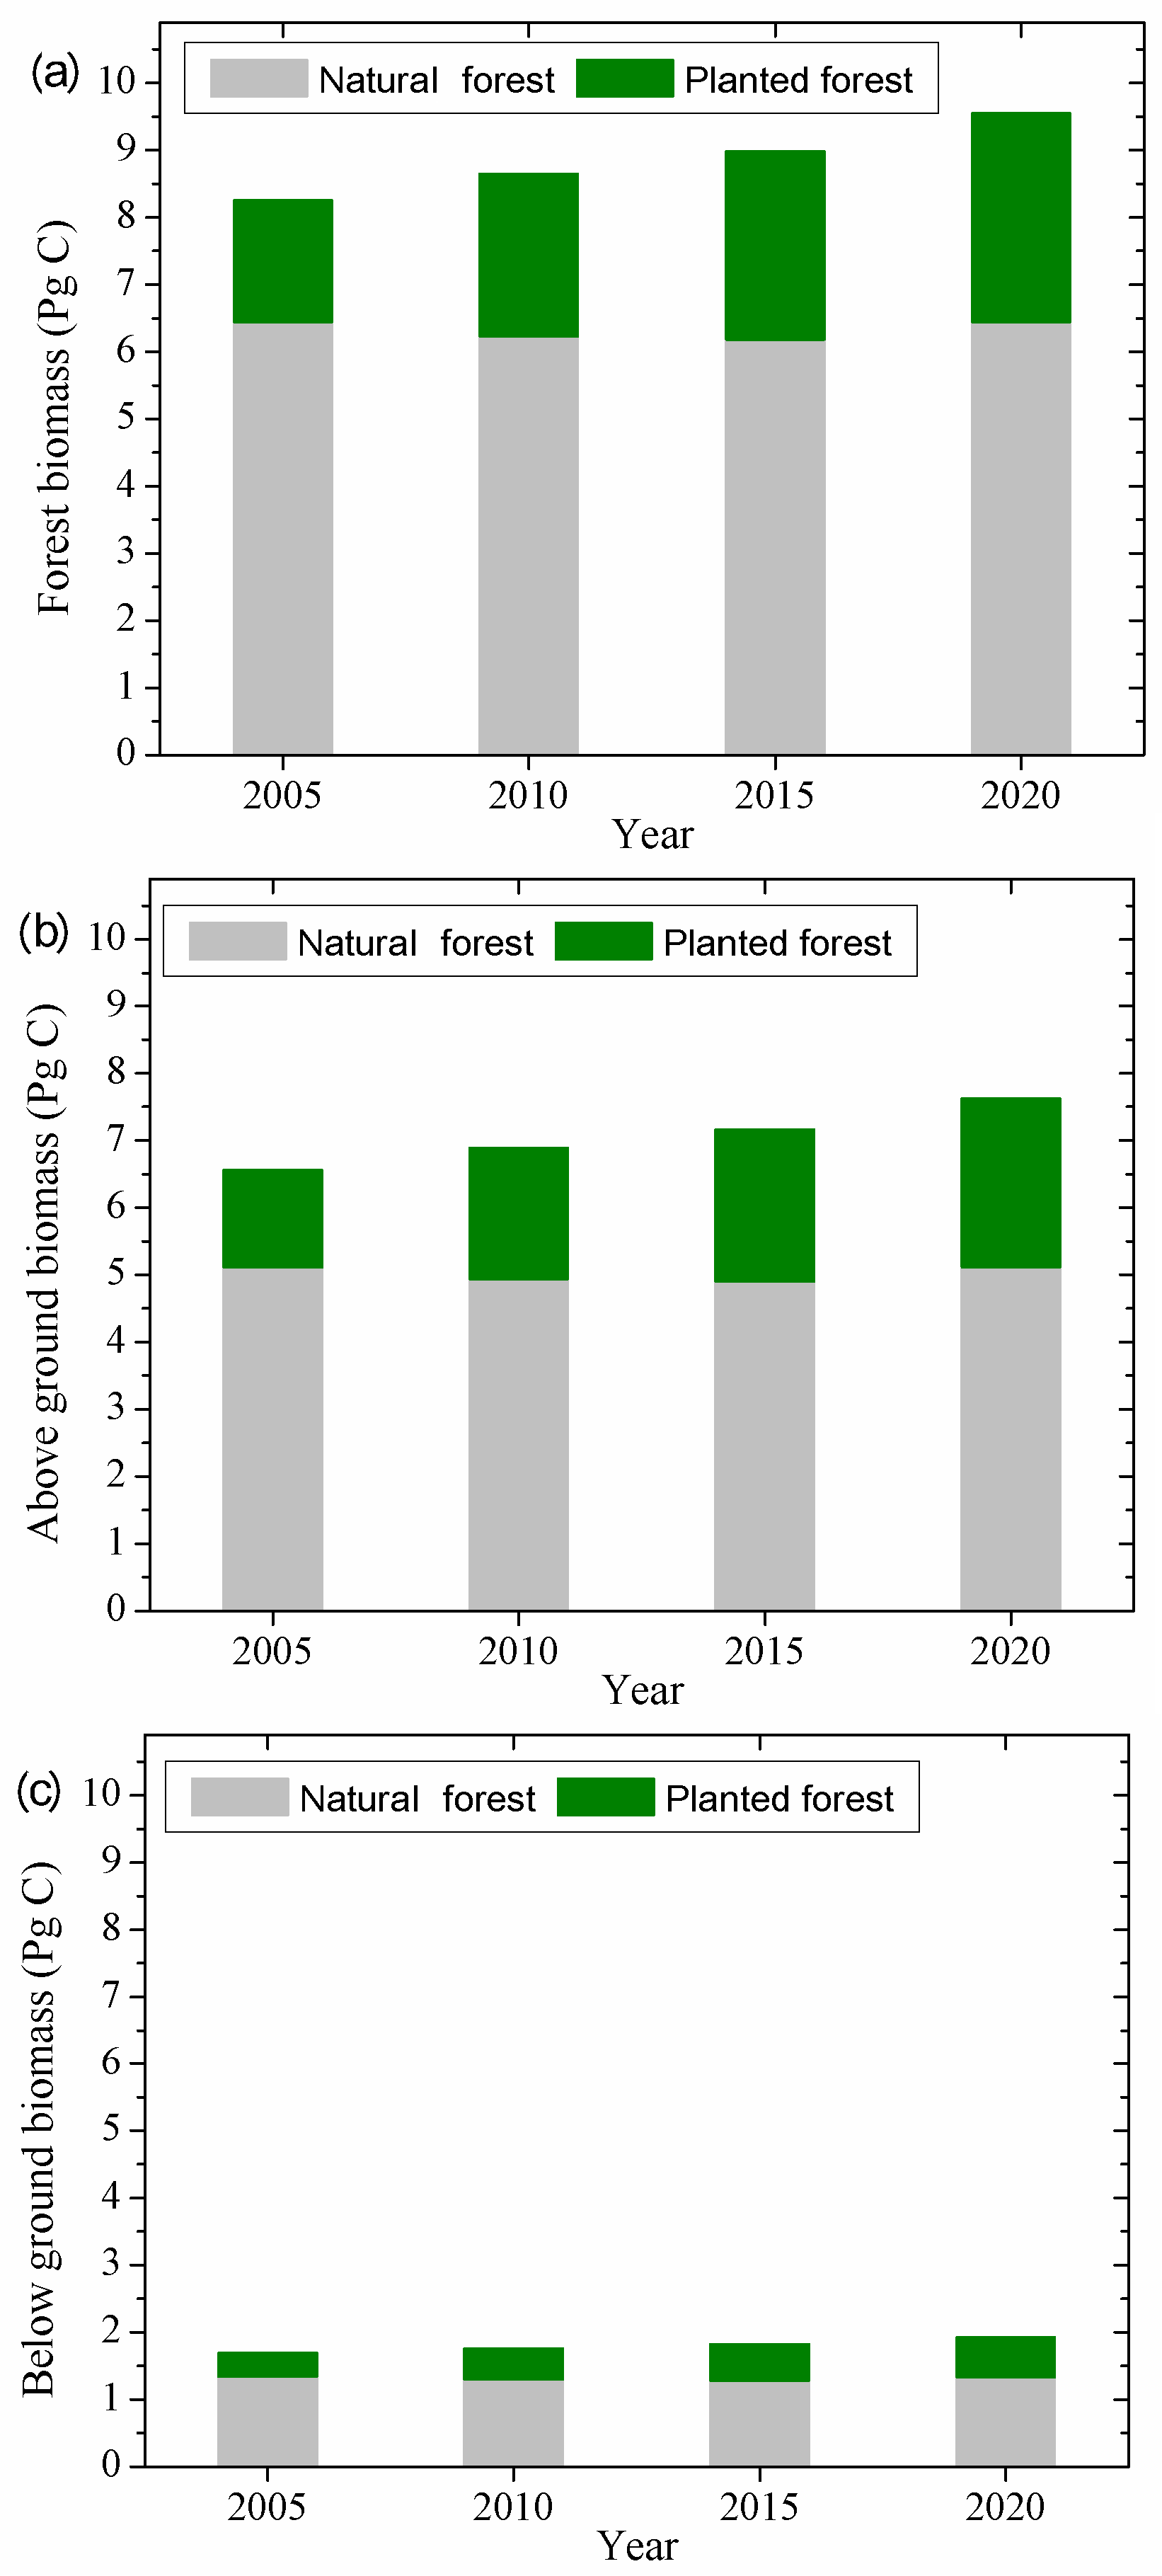
3.2. Interannual Changes in Forest Biomass, Above-Ground Biomass, and Below-Ground Biomass for Planted and Natural Forest Between 2005 and 2020

Forest biomass, above-ground biomass (AGB), and below-ground biomass (BGB) for planted forests and natural forests between 2005 and 2020 were calculated (Figure 3 and Table 2). The total forest biomass accumulated from planted and natural forests increased by 15.7% from 8.26 Pg C in 2005 to 9.56 Pg C in 2020. AGB and BGB increased from 6.56 Pg C and 1.69 Pg C in 2005 to 7.63 Pg C and 1.93 Pg C in 2020, respectively. Natural forests occupied a substantial proportion of the total forest biomass, with an average of 71.2% between 2005 and 2020 (Figure 3a). Planted forests comprised a minor proportion of the total forest biomass, with an average of 28.8% (Figure 3a). However, planted forests dominated the increase in total forest biomass as well as in AGB and BGB from 2005 to 2020. For instance, planted forest biomass increased by 71.8% from 1.81 Pg C in 2005 to 3.11 Pg C in 2020. In contrast, natural forests maintained a rather stable biomass of 6.44 Pg C, with a small variation between 2005 and 2020 (Table 2). Figure 4 shows that total forest and planted forest biomass often had higher carbon density in 2020 compared to 2005, while natural forest biomass remained relatively stable.

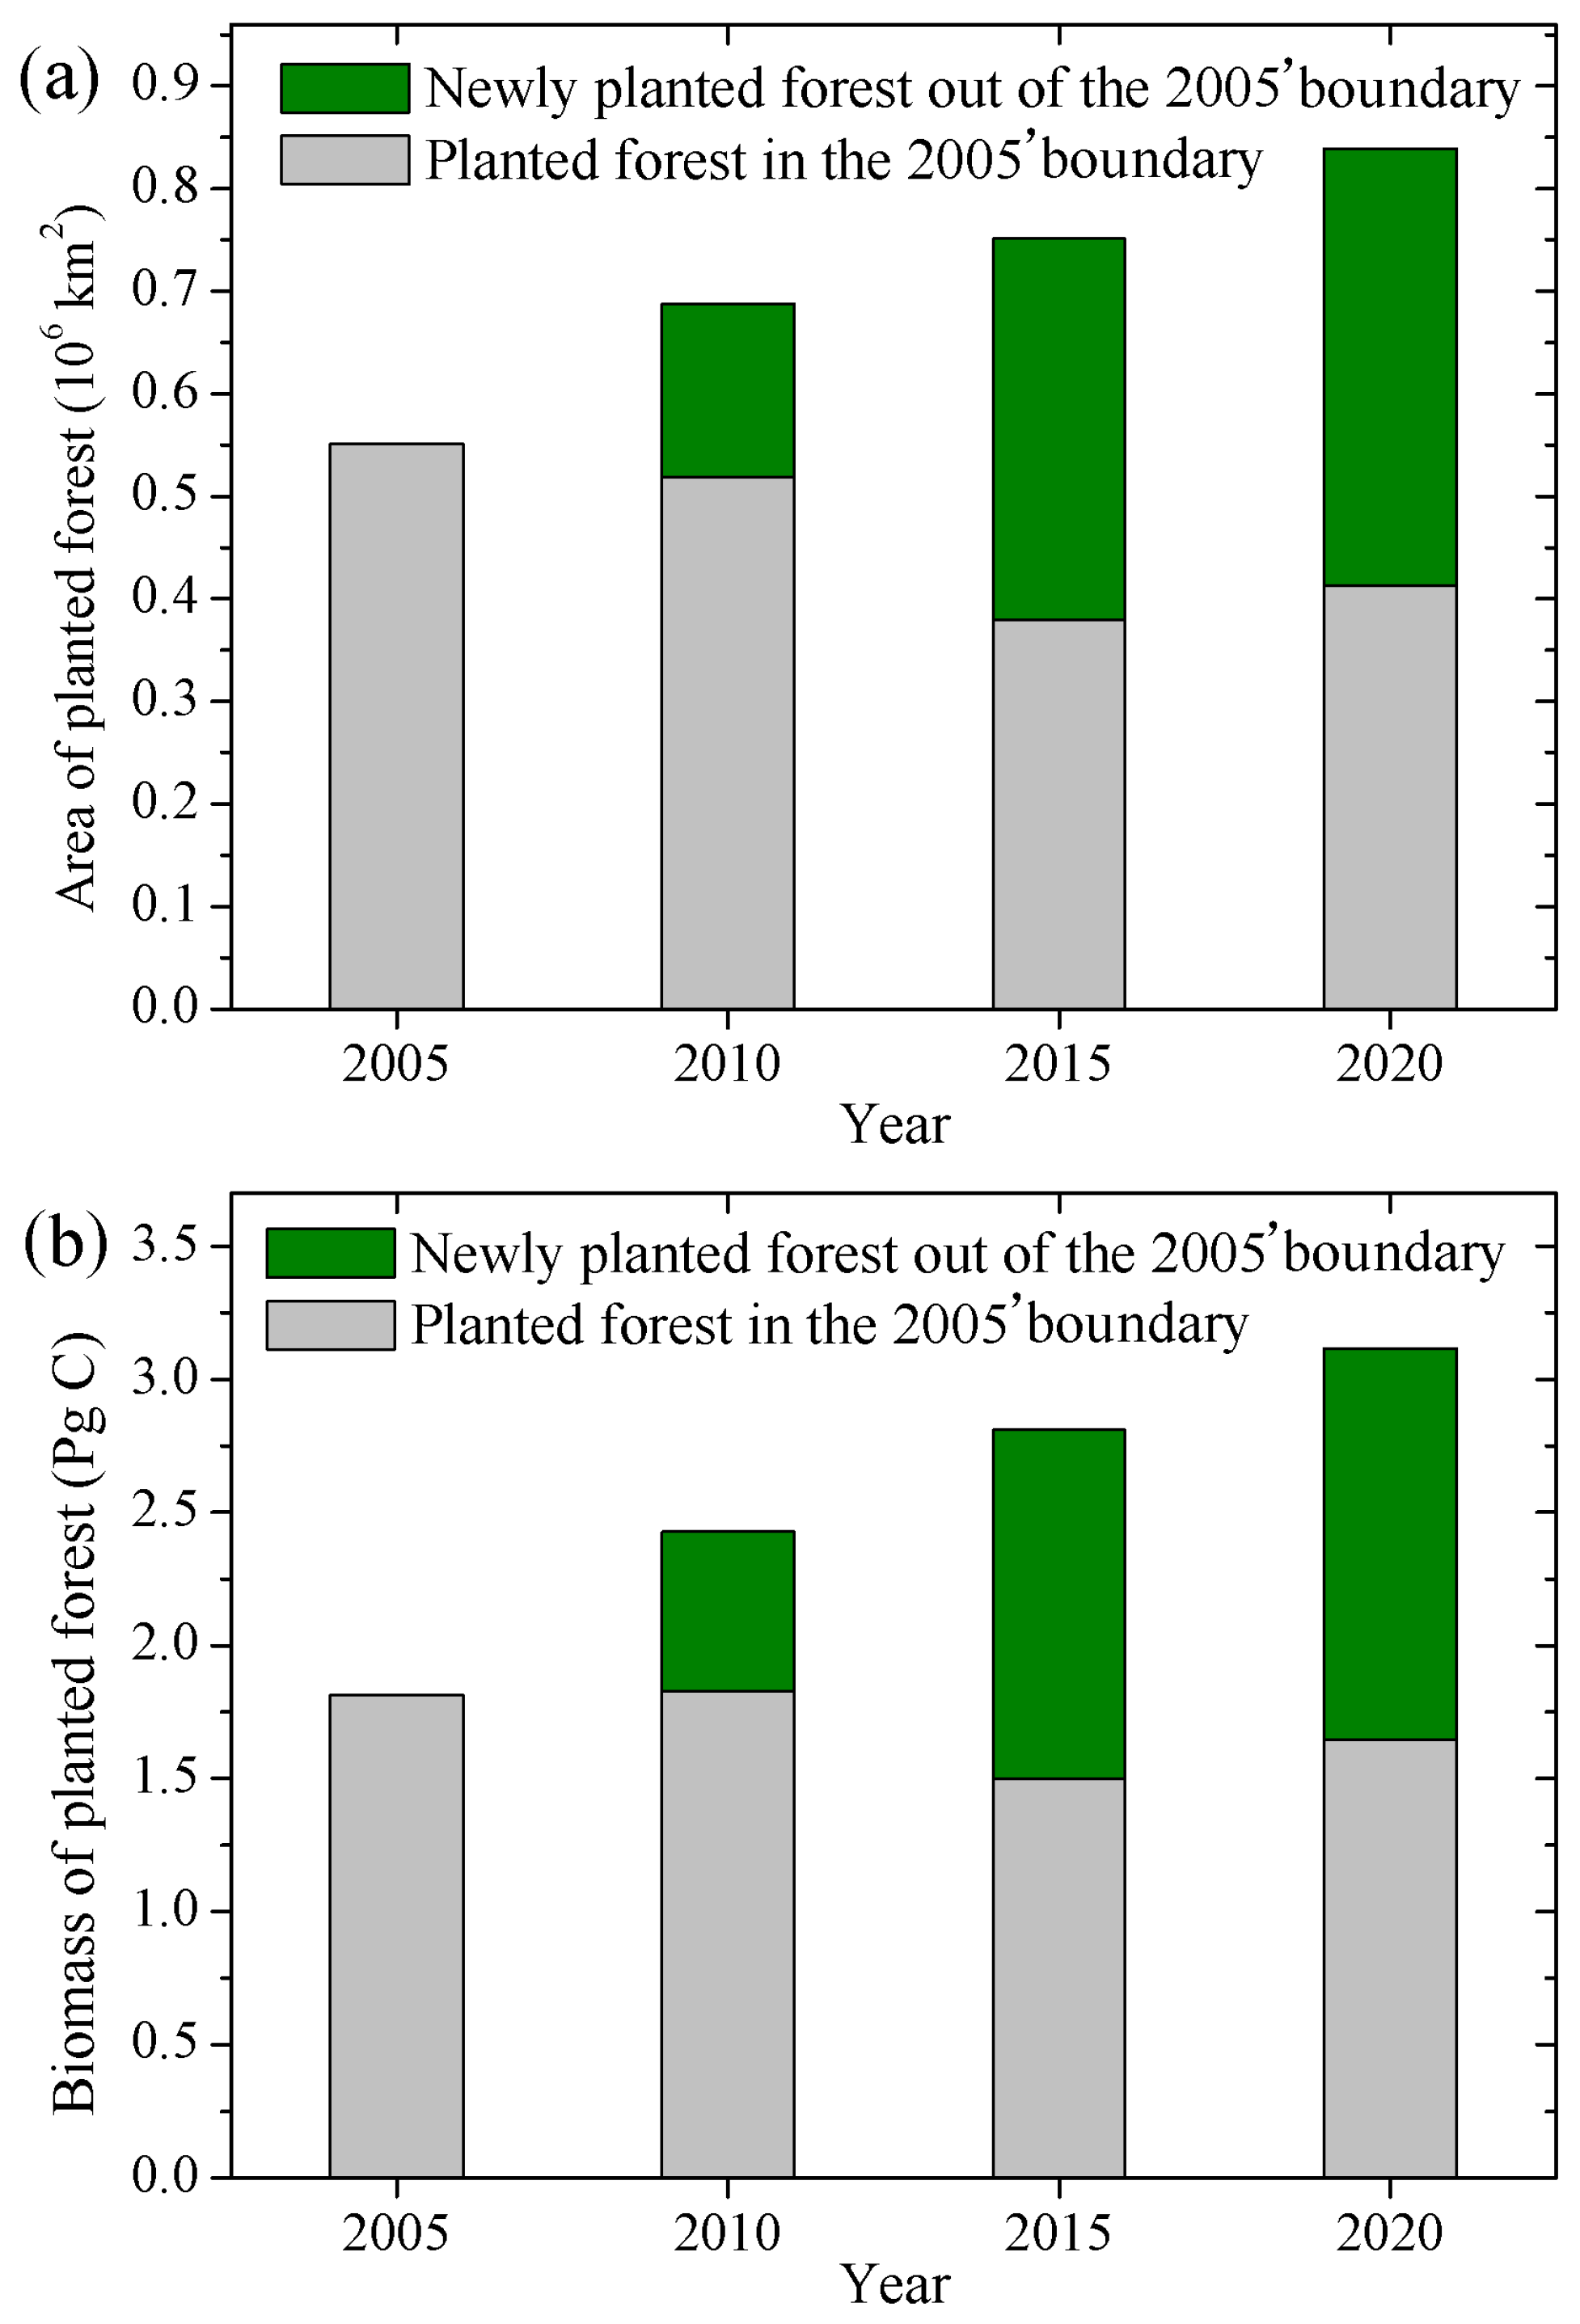
3.3. Interannual Changes in Forest Area for Planted and Natural Forest Between 2005 and 2020

Planted and natural forests showed contrasting changes in forest area between 2005 and 2020. Figure 5a shows that forest area increased by 4.6% from 2.26 × 10⁶ km2 in 2005 to 2.37 × 10⁶ km2 in 2020, mainly due to the expansion of planted forest that increased by 52.2% from 0.55 × 10⁶ km2 in 2005 to 0.84 × 10⁶ km2 in 2020. In contrast, natural forests shrank by −10.7% from 1.71 × 10⁶ km2 in 2005 to 1.53 × 10⁶ km2 in 2020.
Natural and planted forests had a coordinated change in area proportion and biomass proportion (Figure 5b). Natural forests indicated a decreased proportion of area and biomass from 2005 to 2020. In contrast, planted forests had an increased proportion of area and biomass from 2005 to 2020. Overall, natural forests showed a decreasing trend in area proportion and biomass proportion in contrast to the increasing trend for planted forests in China.

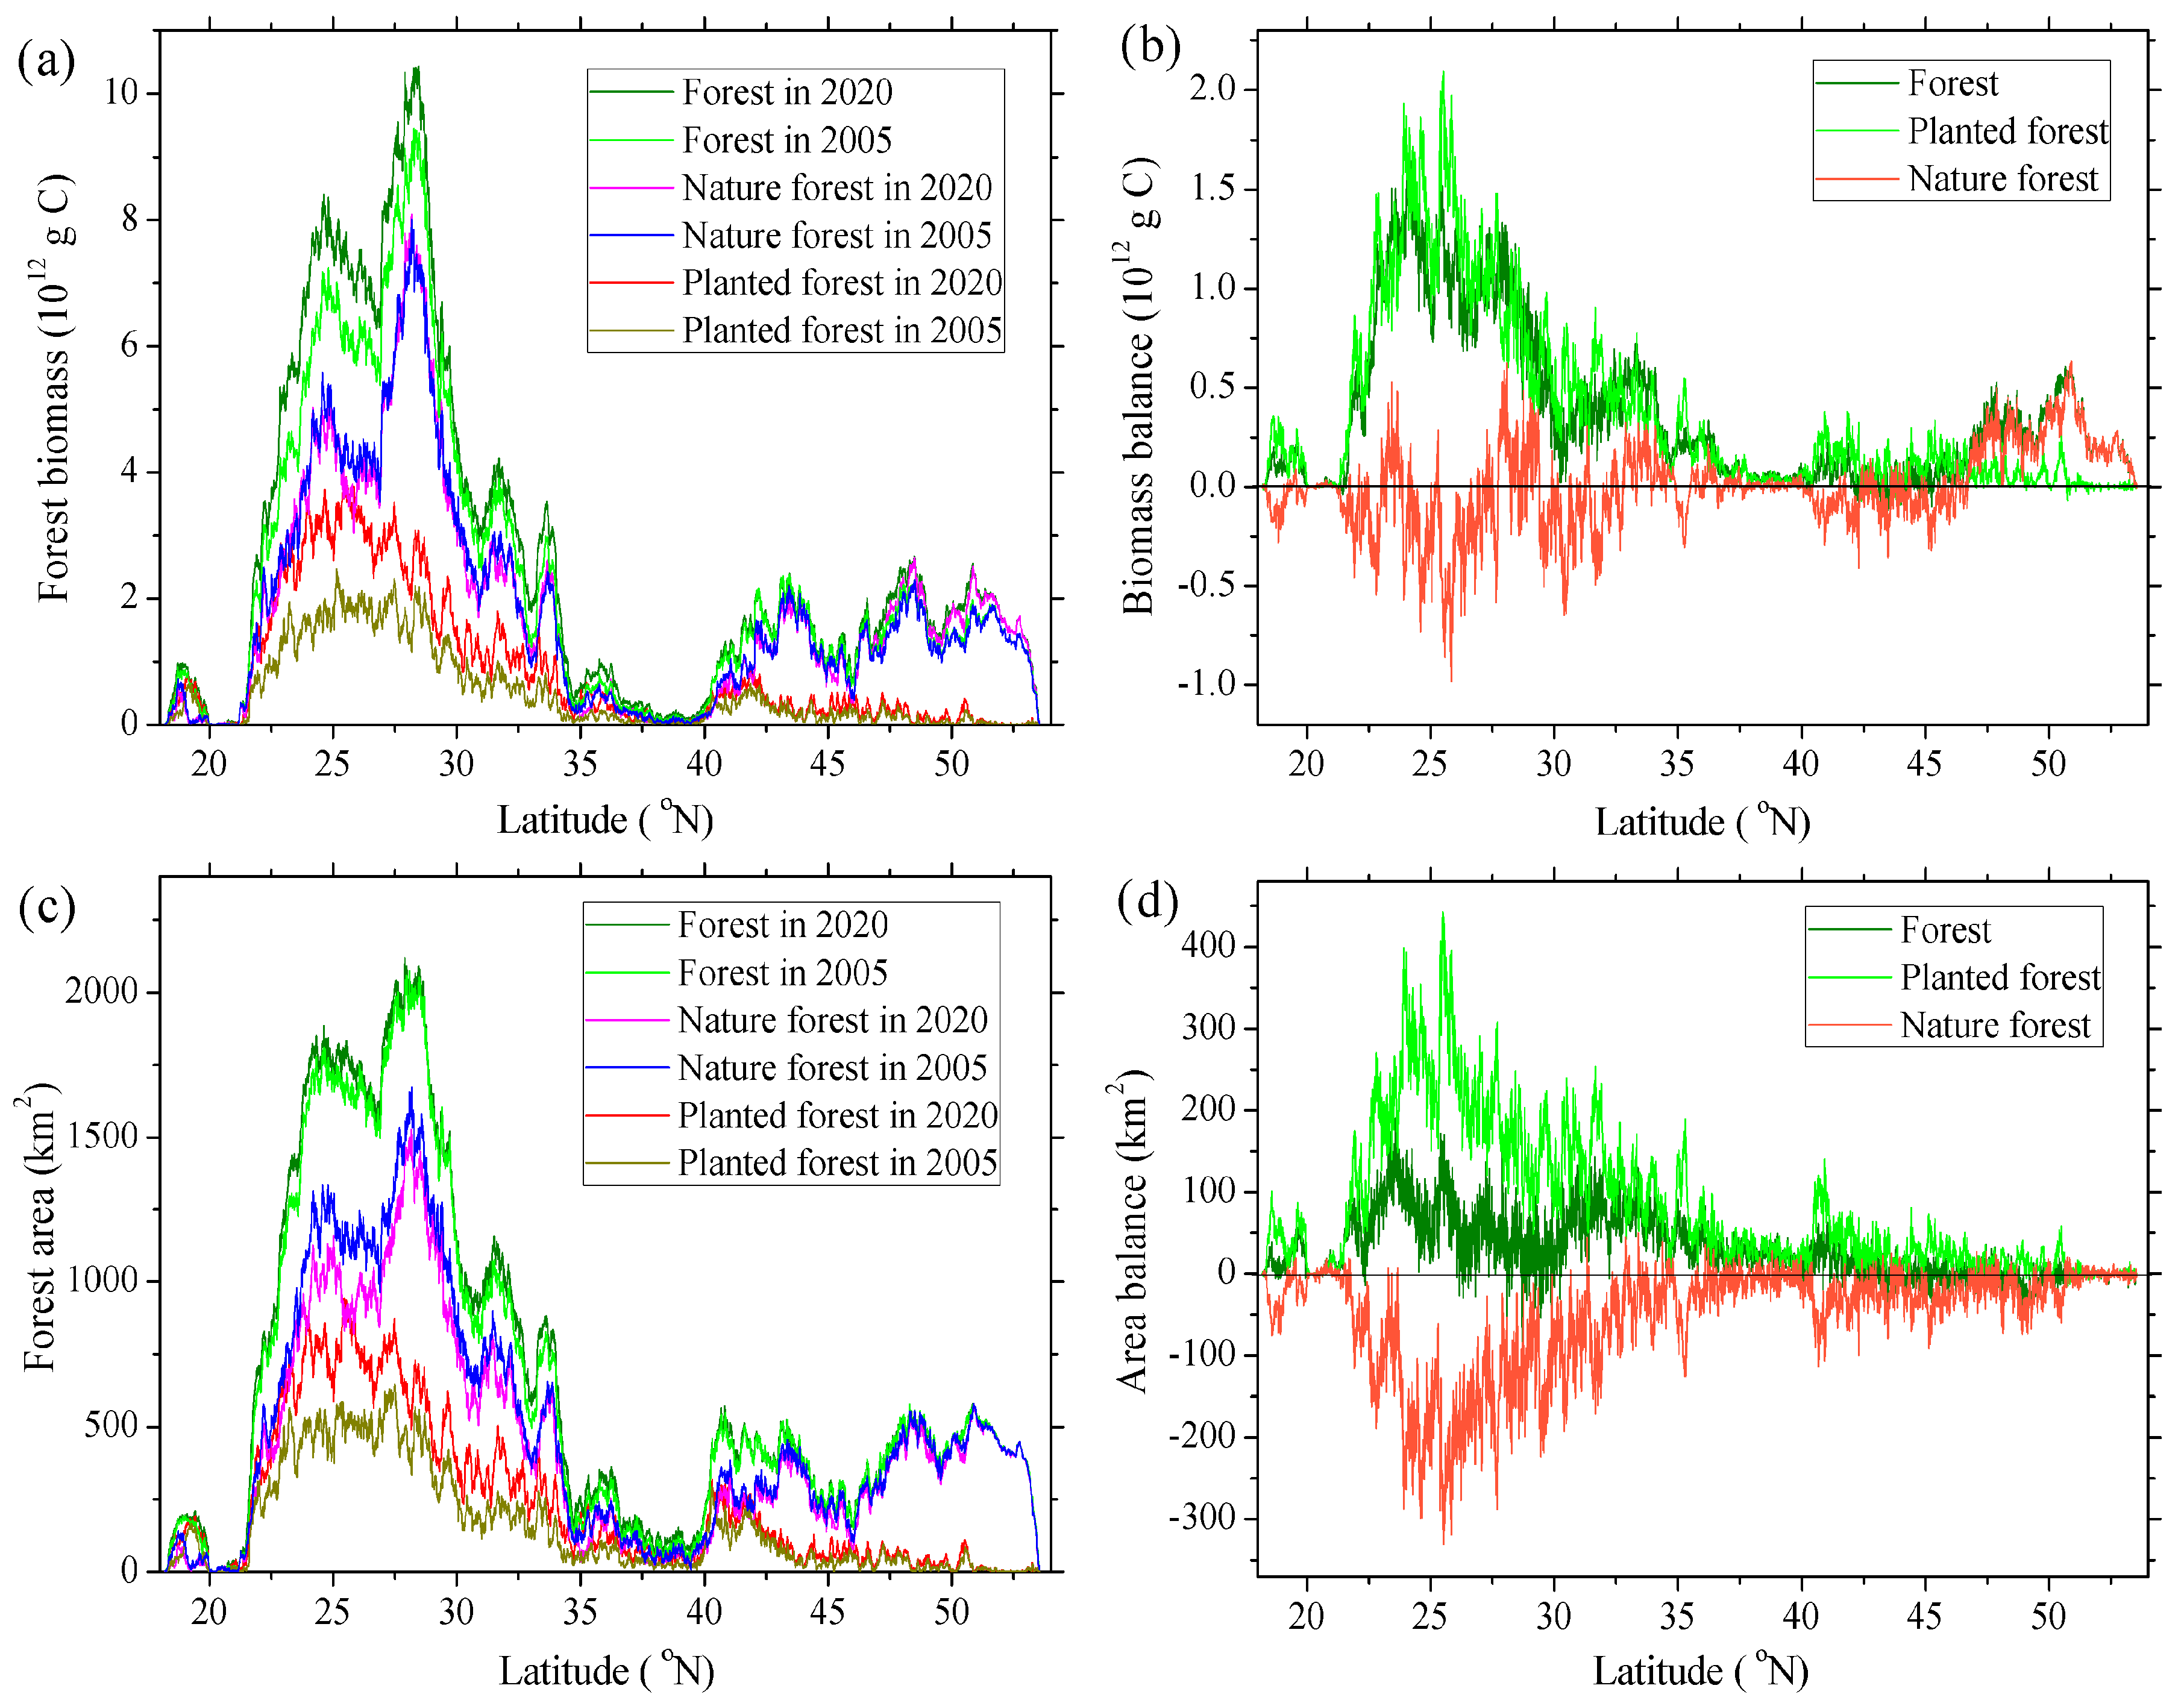
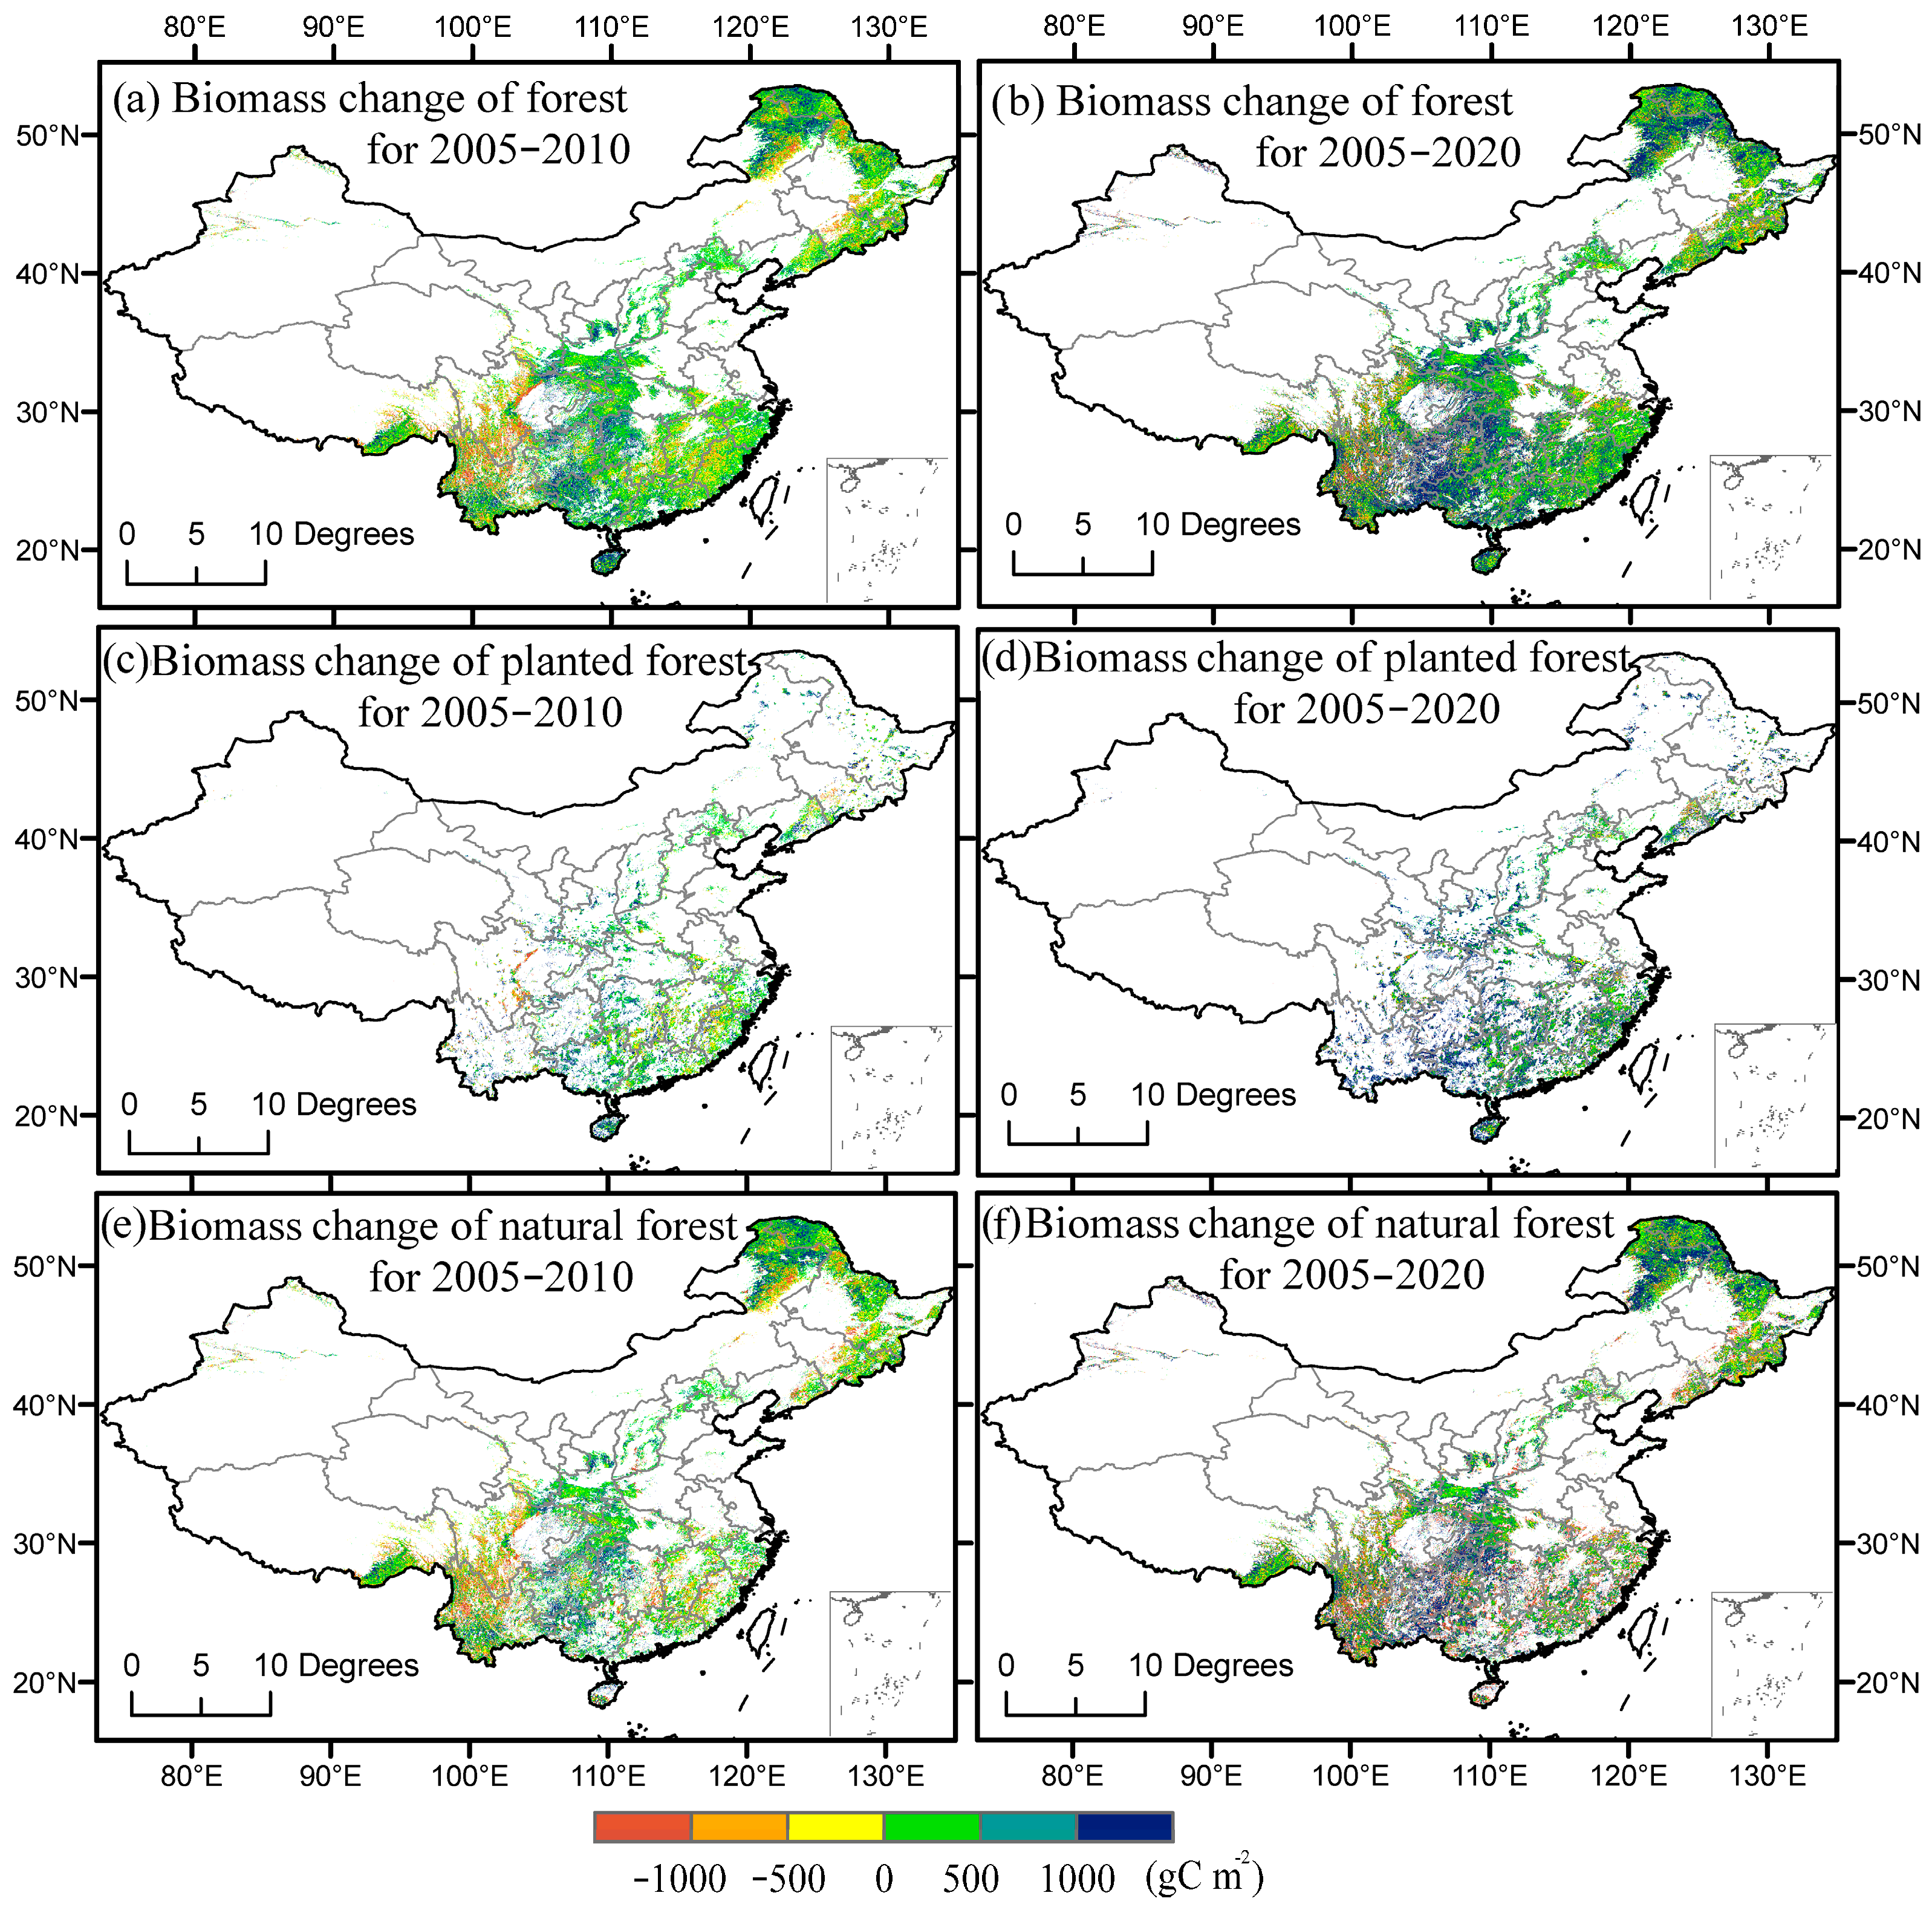
3.4. Latitudinal Changes in Biomass and Area for Forest, Natural Forest, and Planted Forest in 2005 and 2020

Planted and natural forests had a large difference in the latitudinal changes of forest biomass and area between 2005 and 2020. Forest biomass was often higher than 4 × 10¹² g C at low latitudes between 22° N and 30° N and lower than 3 × 10¹² g C at high latitudes between 42° N and 52° N in 2005 and 2020 (Figure 6a). Natural forests often had a higher biomass than planted forests at low latitudes and high latitudes in 2005 and 2020. The biomass balance between 2005 and 2020 (Figure 6b) indicates that at the low latitudes, it was the biomass increase in planted forest that led to the increase in total forest biomass between 2005 and 2020, and at high latitudes (i.e., 47 °N–52° N), natural forest dominated the biomass increase in total forest biomass.
Forest area often had a higher value above 1000 km2 at low latitudes between 22° N and 30° N and a lower value below 700 km2 at high latitudes, such as 42° N–52° N, in 2005 and 2020 (Figure 6c). Natural forests maintained a larger area than planted forests at both low and high latitudes in 2005 and 2020. The area balance between 2005 and 2020 (Figure 6d) indicates that at low latitudes, the increase in planted forest area exceeded the decrease in natural forest area, producing an increase in total forest area from 2005 to 2020, whereas at high latitudes (i.e., 47° N–52° N), natural and planted forests had an equivalent area change but in opposite directions, resulting in a small change in total forest area between 2005 and 2020.
Essentially, planted forests dominated the significant increase in both area and biomass of total forest at the low latitudes from 2005 to 2020, while natural forests led the increase in total forest biomass at the high latitudes.

3.5. Changes in Area and Biomass for Two Groups of Planted Forest from 2005 to 2020

The planted forests were divided into two groups: those located within or outside the 2005 boundary of planted forests. Area and biomass statistics were calculated for the two groups for 2005, 2010, 2015, and 2020. Figure 7 illustrates the distribution of planted forests in 2005, 2010, 2015, and 2020 in China, showing a significant expansion of planted forests from 2010 to 2020 beyond the boundary of planted forests in 2005. Furthermore, the expansion of planted forests in 2020, compared with the 2005 benchmark, occurred mainly in southern China (i.e., 22° N–35° N), as shown in Figure 7d.
Planted forests within the 2005 boundary decreased in area and biomass between 2005 and 2020 (Figure 8). The area decreased by −25.1% from 0.55 × 10⁶ km2 in 2005 to 0.41 × 10⁶ km2 in 2020, and the biomass decreased by −9.4% from 1.81 Pg C in 2005 to 1.64 Pg C in 2020. In contrast, newly planted forests outside the 2005 boundary increased in area and biomass; the area increased from 0.0 km2 in 2005 to 0.17 × 10⁶ km2 in 2010 and 0.43 × 10⁶ km2 in 2020, and the biomass increased from 0.0 Pg C in 2005 to 0.60 Pg C in 2010 and 1.47 Pg C in 2020. In summary, newly planted forests (i.e., young forests) outside the 2005 boundary drove the rapid increase in the area and biomass of planted forests from 2005 to 2020, while planted forests within the 2005 boundary (i.e., mid-to-old forests) contributed negatively to the area and biomass changes of the total planted forest since 2005.

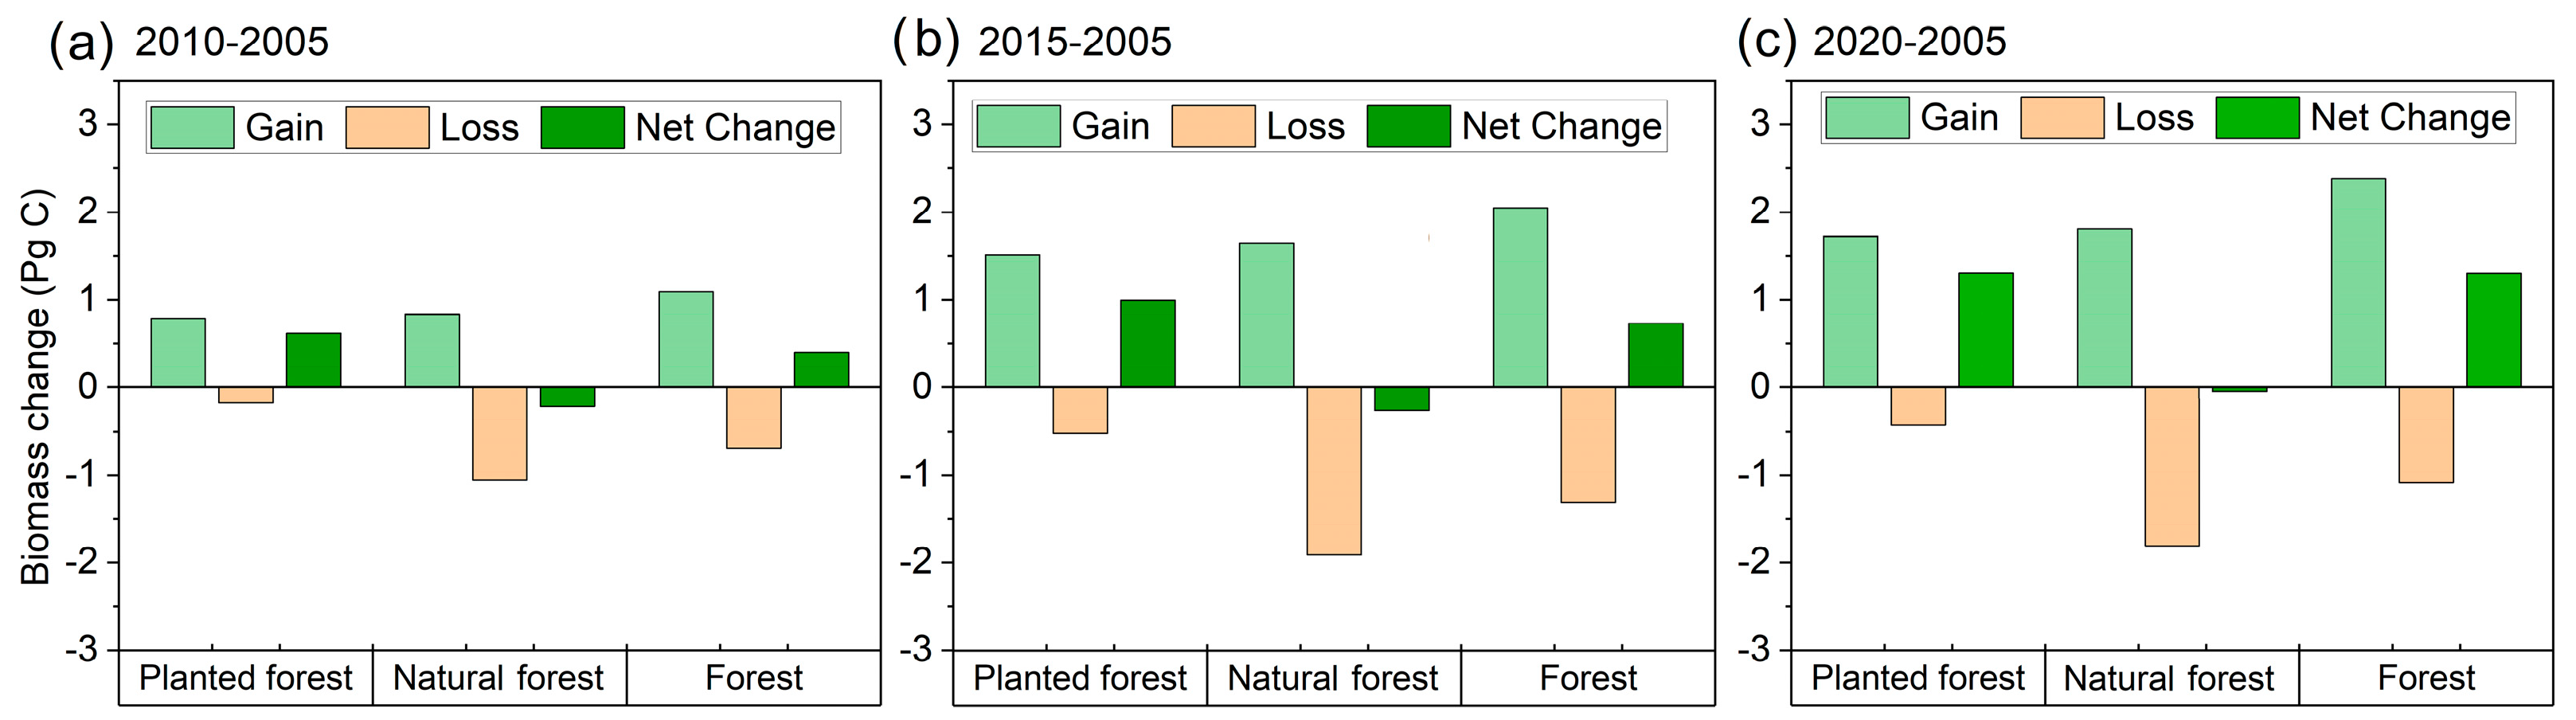
3.6. Changes in Biomass Gains and Losses in 2010, 2015, and 2020 Compared with Biomass in 2005

Biomass gains and losses were calculated at the pixel level by subtracting biomass in 2005 from biomass in 2010, 2015, and 2020 for planted forests, natural forests, and all forests, respectively. Biomass gain was the accumulated value of all positive anomalies, while biomass loss was the sum of all negative anomalies at the pixel level.
The planted forest often had a higher gain (e.g., 1.72 Pg C in 2020) and a smaller loss (e.g., −0.42 Pg C in 2020), resulting in a net increase in biomass (e.g., 1.30 Pg C in 2020), compared to the biomass in 2005 (Figure 9). The natural forest also had a higher gain (e.g., 1.80 Pg C in 2020) but a significant loss (e.g., −1.81 Pg C in 2020), resulting in a minor decrease in biomass (e.g., −0.01 Pg C in 2020). Hence, for statistics of all forests, the gain often had a higher value (e.g., 3.53 Pg C in 2020), which offset the significant loss (e.g., −2.23 Pg C in 2020), resulting in a net increase in biomass (e.g., 1.30 Pg C in 2020). Similar characteristics were observed for planted forests, natural forests, and all forests in 2010 (Figure 9a), 2015 (Figure 9b), and 2020 (Figure 9c), respectively.
The spatial distribution of biomass gains and losses was generated for all forests, planted forests, and natural forests in 2010 and 2020, compared with the 2005 benchmark. Figure 10a,b shows that biomass gains for forests occupied the largest forest area, up to 60.0% of the area in 2010 and 68.8% in 2020, while biomass losses occupied a small forest area in both 2010 and 2020. Similarly, Figure 10c,d shows that biomass gains for planted forests occupied the largest area of planted forests, i.e., 68.6% of the area in 2010 and 76.4% in 2020. In contrast, biomass gains for natural forests accounted for 54.8% of the area in 2010 and 57.7% in 2020 (Figure 10e,f).

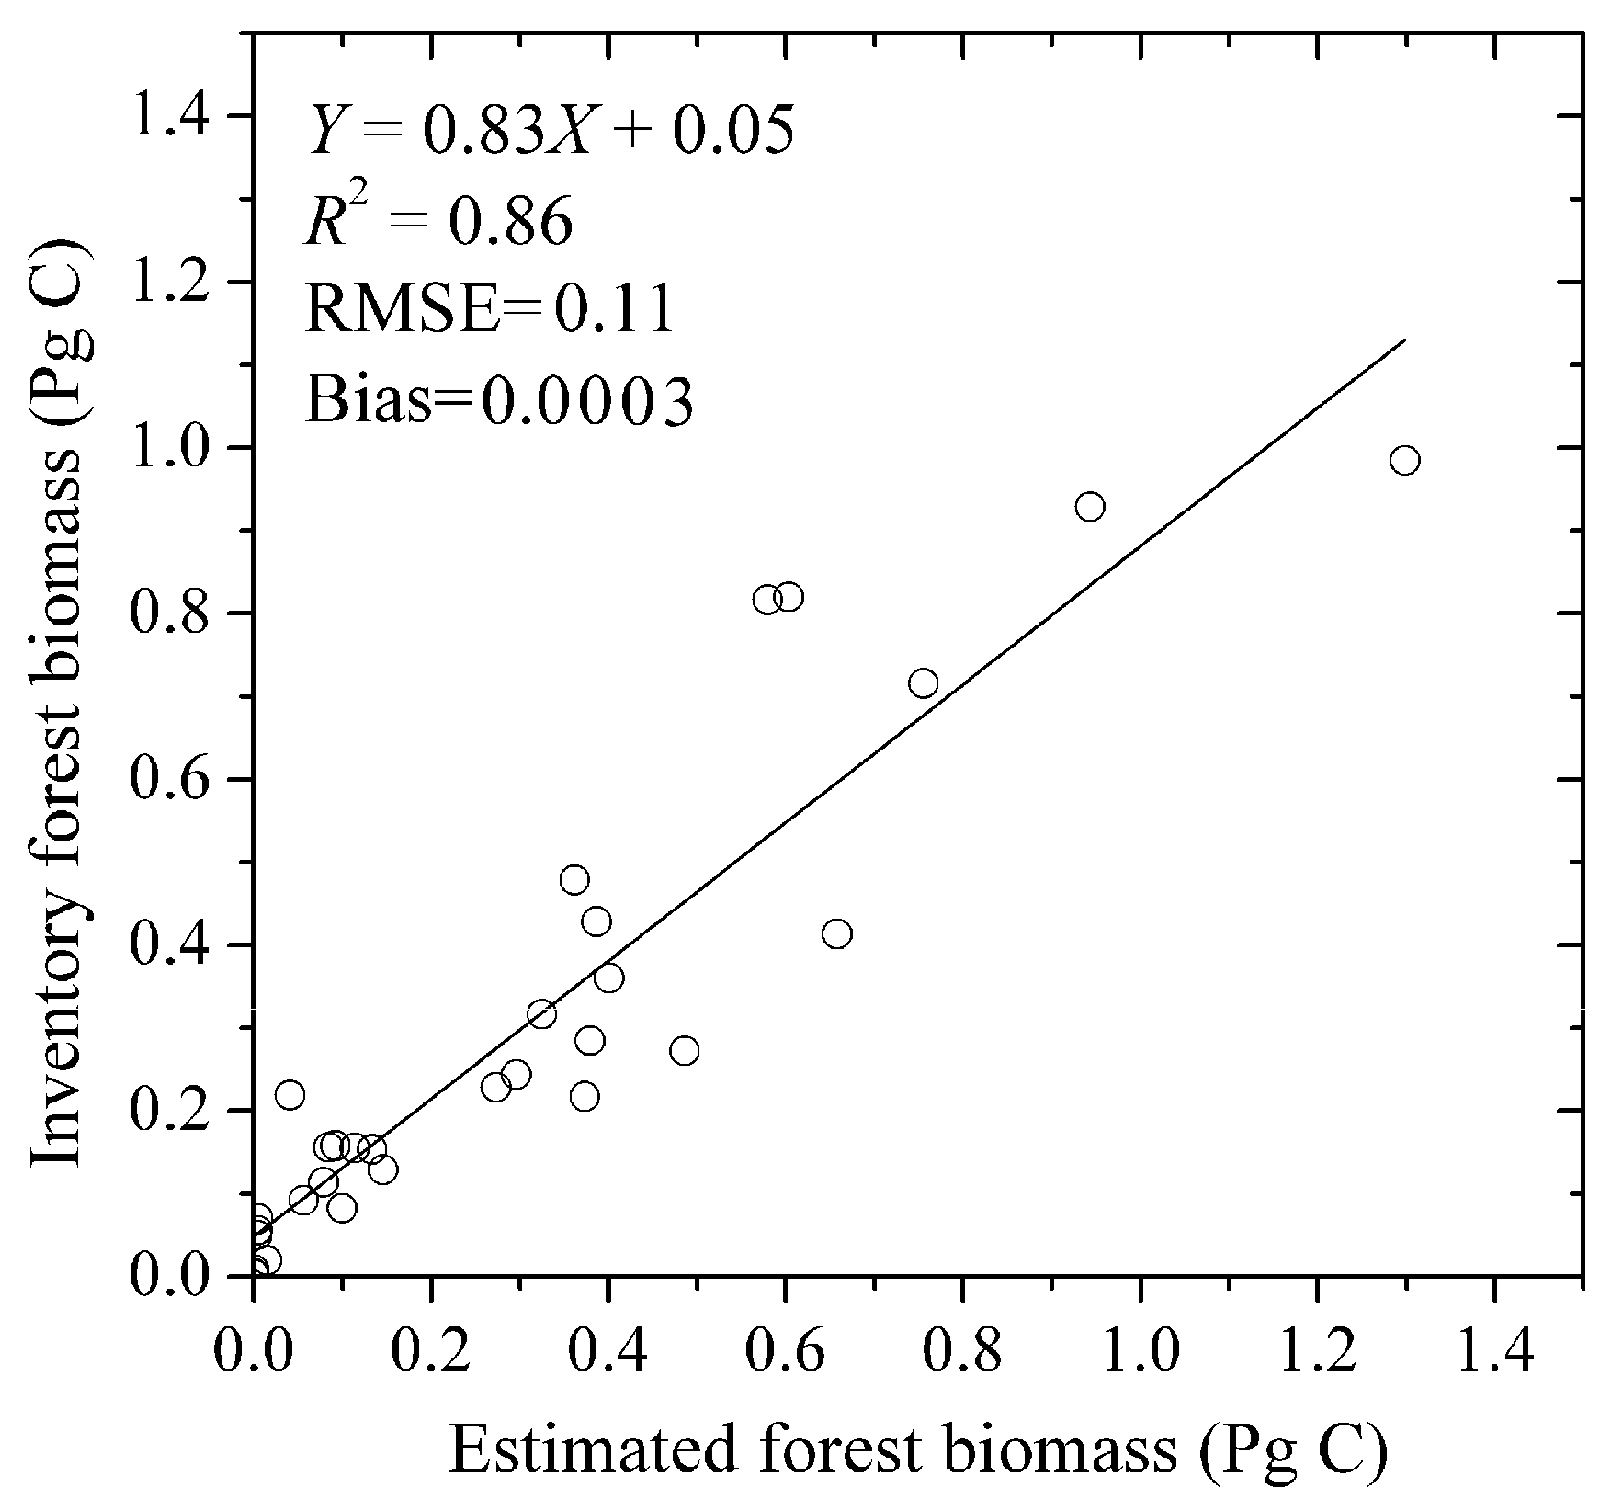
3.7. Evaluation of Estimated Forest Biomass in 2015 with Inventory-Based Forest Biomass

The evaluation shows that the estimated forest biomass in 2015 at the province level was closely related to the forest biomass obtained from the 9th inventory [28] (Figure 11). The error statistics showed an R2 of 0.86, a bias of 0.0003 Pg C, and an RMSE of 0.11 Pg C. The estimated forest biomass in this study was 8.99 Pg C in 2015, close to the 9th inventory-based forest biomass of 8.98 Pg C.

3.8. Evaluation of Estimated Forest Above-Ground Biomass in 2010 with Other Products

The evaluation indicates that the estimated forest above-ground biomass at a 1 km spatial resolution in 2010 was closely related to the above-ground biomass reported by Santoro et al. [29] in China (Figure 12). The error statistics yielded an R2 of 0.87, a bias of 0.69 Mg C ha−1, and an RMSE of 6.50 Mg C ha−1.

4. Discussion

A novel method is presented to quantify the individual contributions of planted forests and natural forests to total forest biomass changes. This method is based on remote sensing-derived annual forest biomass data and maps showing the locations of planted forests and natural forests at a spatial resolution of 1 km. This approach differs from previous studies that utilized a forest inventory-based method [10,30], a land ecosystem simulation method [15], or a carbon density method [17]. Further comparisons with previous methods and findings, as well as a discussion of the limitations of this study, are presented in the context of the study objective.

4.1. Comparison to Previous Methods

Our remote sensing-based method provides a more direct approach to monitoring biomass changes in planted and natural forests, contributing to overall biomass dynamics. It complements the land ecosystem model simulation method, which operates at a 0.5° grid scale and relies on an improved land-use and cover-change database [15]. The latter can be seen as an indirect method to capture biomass changes and carbon sinks. Similarly, the carbon density method estimates planted forest biomass at a 0.1° grid scale using tree species and tree age data from the seventh (2004–2008) National Forest Inventory in China and the 1:1,000,000 scale China vegetation type map [17].
The forest biomass data used in our study are mainly derived from multiple remote sensing sources and are subject to the impacts of natural disturbances such as fire, wind, disease, and insect pests. In contrast, the carbon density method and the land ecosystem model method do not explicitly account for these disturbance effects when estimating biomass dynamics. Therefore, the forest biomass data presented in our study are more likely to be representative of actual forest dynamics.

4.2. Comparison to Previous Results

Forest biomass in China increased significantly from 2005 to 2020, as biomass gains outpaced losses. This aligns well with previous inventory-based studies [10,30]. The research results indicate that planted forest biomass in China has increased significantly, leading to a substantial carbon sink, but with different amplitudes [15,17]. According to our study, the biomass of planted forests increased by 71.8% from 1.81 Pg C in 2005 to 3.11 Pg C in 2020, resulting in a carbon sink of 0.09 Pg C yr−1 during this period. Another method, the carbon density method, reported that the carbon storage of China’s planted forests increased from 0.98 Pg C in 2005 to 1.87 Pg C in 2020, with an average growth rate of 0.06 Pg C yr−1 [17]. In addition, land ecosystem model simulations showed that planted forest biomass increased at an average rate of 0.04 Pg C yr−1, accounting for 35% of the biomass carbon accumulation over the last four decades [15].
However, there have been discrepancies in the studies of interannual changes in natural forest biomass in China. Our results indicate that natural forests maintained stable biomass from 2005 to 2020, probably due to natural forest harvesting and the impact of natural disasters, which offset the growth of these forests. However, land ecosystem model simulations showed that natural forest biomass increased at an average rate of 0.07 Pg C yr−1, acting as a carbon sink and accounting for 65% of the biomass carbon accumulation in China from 1980 to 2019 [15]. This conclusion was based on the assumption that the ratio of harvested area for natural forests decreased significantly, resulting in a lower carbon loss of less than 0.01 Pg C per year for natural forests and a rather high carbon loss of more than 0.08 Pg C per year for planted forests in the 2010s [15]. Nonetheless, the 8th National Forest Inventory (2009–2013) reported comparable harvest volumes of 1.55 × 10⁹ m3 per year for planted forests and 1.79 × 10⁹ m3 per year for natural forests in China [31].
This study estimated that forest biomass in China was 8.99 Pg C in 2015, which was consistent with the 9th (2014–2018) inventory-based forest biomass of 8.98 Pg C [28]. A recent study reported a higher estimate of forest biomass (12.994 Pg C) in China in 2015, which was derived from a remote sensing-based mapping of forest plantations plus an existing biomass carbon density map with its original spatial resolution at 10 km [32]. There was a large difference in the estimated planted forest biomass in 2015 in China between the recent study (1.75 Pg C) [32] and our result (2.81 Pg C).
Moreover, different studies provided different estimates of how much biomass carbon was stored from the expansion and growth of planted forests. The carbon density method estimated that the area expansion of planted forests from land conversion contributed approximately 54% of the total increase in planted forest carbon storage compared to planted forest growth from 2005 to 2020 [17]. In contrast, our results show that the area expansion of newly planted forests contributed about 100% of the total increased carbon storage in planted forests compared with planted forest growth over the same period.

4.3. Limitations and Future Study

This study introduces a new method for distinguishing between the effects of natural and planted forests on total changes in forest biomass at a high spatial resolution of 1 km. The main uncertainties in the study arose from the forest biomass data [21] and the maps of natural and planted forests [16] that were utilized. These forest data were mainly derived from remote sensing data, which had been extensively validated by field samples and other forest products [17,21]. The maps of natural and planted forests achieved an overall classification accuracy of 78.93% to 82.18% for 2005–2020 [16].
The definition of forest in this study includes trees with a height exceeding 5 m and a canopy cover of more than 15%. This means that smaller trees (under 5 m) and sparse trees (canopy cover under 15%) resulting from reforestation and afforestation were not included in the maps of natural and planted forests, and consequently, were not considered in this study of forest biomass dynamics. As a result, the total forest biomass estimated in this study was lower than previous estimates [21,33]. For example, Tang et al. [33] reported a larger forest biomass stock of 10.48 Pg C based on an intensive field survey conducted during 2010–2015, whereas the forest biomass in this study had a lower stock of 8.99 Pg C in 2015.
The 1 km resolution maps of natural and planted forests used in this study were resampled from the 30 m resolution maps. The dominant forest type within each 1 km2 area was assigned to the corresponding 1 km resolution pixel [16]. The 1 km resolution map for 2005 was compared with the existing planted forest map digitized from the report of the 7th National Forest Resource Inventory (2004–2008). This comparison indicated that the 1 km resolution map for 2005 was spatially consistent with the digitized inventory map [16]. A comparison of China forest areas, aggregated at 1 km and 30 m resolutions, showed a strong correlation between the two datasets, with R2 = 0.995 for planted forests and R2 = 0.997 for natural forests over four years from 2005 to 2020. Although the forest areas at the 1 km resolution were slightly lower than those at the 30 m resolution, they exhibited a percent bias of –5.4% for planted forests and –6.8% for natural forests, respectively. In 2015, the total forest area aggregated at the 1 km resolution was 227.0 × 10⁴ km2, which closely aligned with the forest area of 220.4 × 10⁴ km2 reported in the 9th National Forest Inventory (2009–2013) [31]. However, the total forest area identified at the 30 m resolution was overestimated by 10.5%, suggesting a higher total of 243.6 × 10⁴ km2 in 2015.
Recent field experiments reveal that planted forests suffer higher drought risk than natural forests in China [34], but studies of natural and human disturbances on planted and natural forests at large spatial scales are still scarce, mainly due to the lack of time-continuous or regularly updated maps of planted forests [35]. In the future, with the advancement of forest biomass data to a fine spatial resolution of 30 m to match the 30 m forest type maps, this method can be used to monitor biomass variations of natural and planted forests and to evaluate the impact of natural and human disturbances on forest carbon sinks at a fine spatial scale. Using this method and the low-cost forest data provided by remote sensing, the large-scale implementation of forest-based natural climate solutions can be effectively managed and coordinated among forest-dependent communities, industry, governments, and indigenous people [36].

5. Conclusions

The independent biomass data for planted and natural forests at a spatial resolution of 1 km in China between 2005 and 2020 revealed complex dynamics with significant spatial variations. Our results indicate that China’s natural forests maintained a relatively stable biomass during this period, despite a decrease in the natural forest area due to factors such as logging and natural disasters. In northern China, the natural forests experienced an increase in biomass due to effective conservation measures. On the other hand, southern China saw a decline in natural forest area, but relatively stable biomass levels.
The remarkable overall increase in China’s forest biomass from 2005 to 2020 was primarily due to the increase in both the biomass and area of planted forests. Southern China, with its subtropical or warm temperate climate, experienced a rapid growth in both biomass and planted area over the same period. In the cold temperate climate of northern China, the area and biomass of planted forests increased slightly.
Our research also revealed that the planted forests existing in 2005 witnessed a decline in both area and biomass by 2020, possibly due to forest harvesting and natural disasters. Interestingly, newly planted forests (young forests) established after 2005 showed an increase in both area and biomass by 2020. This suggests that young forests planted between 2005 and 2020 were the primary contributors to the rapid increase in total forest biomass in China during this period, while forests planted before 2005 (mid-to-old-age forests) and natural forests had a minor impact on the overall increase.
In light of these findings, we recommend incorporating planted and natural forest mapping into forest biomass analysis to better quantify forest carbon stocks and their impact on the global carbon cycle.

Author Contributions

Conceptualization, H.Y. and H.H.S.; methodology, H.Y., J.M. and J.Z.; software, Y.C.; validation, Y.C.; formal analysis, H.Y., Y.C. and J.Z.; writing—original draft preparation, H.Y., J.M. and H.H.S.; writing—review and editing, H.Y., J.Z. and H.H.S.; funding acquisition, H.Y. and J.M. All authors have read and agreed to the published version of the manuscript.

Funding

This research was funded by the Guangxi Key Technologies R&D Program (Guike AB23026052), the Innovation and Development Special Project of China Meteorological Administration (CXFZ2024J052), and the National Natural Science Foundation of China (41571327). H. Shugart was supported by a chaired professor fund from the University of Virginia.

Data Availability Statement

All the relevant data originate from these publicly available sources. The annual forest above-ground and below-ground biomass data are available at https://download.pangaea.de/dataset/955074/files/DATA.zip (accessed on 28 February 2023). The natural and planted forest maps at a 1 km spatial resolution are available at https://www.3decology.org/2024/04/15/chinas-planted-forest-maps-from-1990-to-2020/ (accessed on 5 August 2024). The global forest above-ground biomass data for 2010 are available at https://doi.org/10.1594/PANGAEA.894711 (accessed on 7 May 2024).

Conflicts of Interest

The authors declare no conflicts of interest.

References

  1. Lan, X.; Tans, P.; Thoning, K.W. Trends in Globally-Averaged CO2 Determined from NOAA Global Monitoring Laboratory Measurements; Global Monitoring Laboratory: Boulder, CO, USA, 2024. [CrossRef]
  2. Friedlingstein, P.; O’Sullivan, M.; Jones, M.W.; Andrew, R.M.; Bakker, D.C.E.; Hauck, J.; Landschützer, P.; Le Quéré, C.; Luijkx, I.T.; Peters, G.P.; et al. Global Carbon Budget 2023. Earth Syst. Sci. Data 2023, 15, 5301–5369. [Google Scholar] [CrossRef]
  3. Tian, H.; Lu, C.; Ciais, P.; Michalak, A.M.; Canadell, J.G.; Saikawa, E.; Huntzinger, D.N.; Gurney, K.R.; Sitch, S.; Zhang, B.; et al. The terrestrial biosphere as a net source of greenhouse gases to the atmosphere. Nature 2016, 531, 225–228. [Google Scholar] [CrossRef] [PubMed]
  4. Monteiro, J.M. The year 2023 may afford us a peek at a warmer world. Commun. Earth Environ. 2024, 5, 280. [Google Scholar] [CrossRef]
  5. Peters, G.P.; Andrew, R.M.; Boden, T.; Canadell, J.G.; Ciais, P.; Le Quéré, C.; Marland, G.; Raupach, M.R.; Wilson, C. The challenge to keep global warming below 2 °C. Nat. Clim. Change 2013, 3, 4–6. [Google Scholar] [CrossRef]
  6. Pan, Y.; Birdsey, R.A.; Phillips, O.L.; Houghton, R.A.; Fang, J.; Kauppi, P.E.; Keith, H.; Kurz, W.A.; Ito, A.; Lewis, S.L.; et al. The enduring world forest carbon sink. Nature 2024, 631, 563–569. [Google Scholar] [CrossRef] [PubMed]
  7. Xu, H.; Yue, C.; Zhang, Y.; Liu, D.; Piao, S. Forestation at the right time with the right species can generate persistent carbon benefits in China. Proc. Natl. Acad. Sci. USA 2023, 120, e2304988120. [Google Scholar] [CrossRef]
  8. Piao, S.; Wang, X.; Park, T.; Chen, C.; Lian, X.; He, Y.; Bjerke, J.W.; Chen, A.; Ciais, P.; Tømmervik, H.; et al. Characteristics, drivers and feedbacks of global greening. Nat. Rev. Earth Environ. 2020, 1, 14–27. [Google Scholar] [CrossRef]
  9. Lu, F.; Hu, H.; Sun, W.; Zhu, J.; Liu, G.; Zhou, W.; Zhang, Q.; Shi, P.; Liu, X.; Wu, X.; et al. Effects of national ecological restoration projects on carbon sequestration in China from 2001 to 2010. Proc. Natl. Acad. Sci. USA 2018, 115, 4039–4044. [Google Scholar] [CrossRef]
  10. Zeng, W.; Chen, X.; Yang, X. Estimating changes of forest carbon storage in China for 70 years (1949–2018). Sci. Rep. 2023, 13, 16864. [Google Scholar] [CrossRef]
  11. Yu, Z.; Liu, S.; Li, H.; Liang, J.; Liu, W.; Piao, S.; Tian, H.; Zhou, G.; Lu, C.; You, W.; et al. Maximizing carbon sequestration potential in Chinese forests through optimal management. Nat. Commun. 2024, 15, 3154. [Google Scholar] [CrossRef]
  12. Tong, X.; Brandt, M.; Yue, Y.; Ciais, P.; Rudbeck Jepsen, M.; Penuelas, J.; Wigneron, J.-P.; Xiao, X.; Song, X.-P.; Horion, S.; et al. Forest management in southern China generates short term extensive carbon sequestration. Nat. Commun. 2020, 11, 129. [Google Scholar] [CrossRef] [PubMed]
  13. Busch, J.; Bukoski, J.J.; Cook-Patton, S.C.; Griscom, B.; Kaczan, D.; Potts, M.D.; Yi, Y.; Vincent, J.R. Cost-effectiveness of natural forest regeneration and plantations for climate mitigation. Nat. Clim. Change 2024, 14, 996–1002. [Google Scholar] [CrossRef]
  14. Fan, Z.; Sun, J.; Tagesson, T.; Wang, L.; Xu, S.; Tan, W.; Tian, F.; Ye, W.; Tan, Q.; Wang, S.; et al. Planted Forests Greened 7% Slower Than Natural Forests in Southern China Over the Past Forty Years. Geophys. Res. Lett. 2024, 51, e2024GL111209. [Google Scholar] [CrossRef]
  15. Yu, Z.; Ciais, P.; Piao, S.; Houghton, R.A.; Lu, C.; Tian, H.; Agathokleous, E.; Kattel, G.R.; Sitch, S.; Goll, D.; et al. Forest expansion dominates China’s land carbon sink since 1980. Nat. Commun. 2022, 13, 5374. [Google Scholar] [CrossRef]
  16. Cheng, K.; Yang, H.; Guan, H.; Ren, Y.; Chen, Y.; Chen, M.; Yang, Z.; Lin, D.; Liu, W.; Xu, J.; et al. Unveiling China’s natural and planted forest spatial–temporal dynamics from 1990 to 2020. ISPRS J. Photogramm. Remote Sens. 2024, 209, 37–50. [Google Scholar] [CrossRef]
  17. Cheng, K.; Yang, H.; Tao, S.; Su, Y.; Guan, H.; Ren, Y.; Hu, T.; Li, W.; Xu, G.; Chen, M.; et al. Carbon storage through China’s planted forest expansion. Nat. Commun. 2024, 15, 4106. [Google Scholar] [CrossRef] [PubMed]
  18. Sánchez-García, C.; Revelles, J.; Burjachs, F.; Euba, I.; Expósito, I.; Ibáñez, J.; Schulte, L.; de Pablo, J.F.-L. What burned the forest? Wildfires, climate change and human activity in the Mesolithic—Neolithic transition in SE Iberian Peninsula. Catena 2024, 234, 107542. [Google Scholar] [CrossRef]
  19. Saatchi, S.S.; Harris, N.L.; Brown, S.; Lefsky, M.; Mitchard, E.T.A.; Salas, W.; Zutta, B.R.; Buermann, W.; Lewis, S.L.; Hagen, S.; et al. Benchmark map of forest carbon stocks in tropical regions across three continents. Proc. Natl. Acad. Sci. USA 2011, 108, 9899–9904. [Google Scholar] [CrossRef]
  20. Nie, S.; Wang, C.; Zeng, H.; Xi, X.; Li, G. Above-ground biomass estimation using airborne discrete-return and full-waveform LiDAR data in a coniferous forest. Ecol. Indic. 2017, 78, 221–228. [Google Scholar] [CrossRef]
  21. Chen, Y.; Feng, X.; Fu, B.; Ma, H.; Zohner, C.M.; Crowther, T.W.; Huang, Y.; Wu, X.; Wei, F. Maps with 1 km resolution reveal increases in above- and belowground forest biomass carbon pools in China over the past 20 years. Earth Syst. Sci. Data 2023, 15, 897–910. [Google Scholar] [CrossRef]
  22. Stovall, A.E.L.; Shugart, H.H. Improved Biomass Calibration and Validation With Terrestrial LiDAR: Implications for Future LiDAR and SAR Missions. IEEE J. Sel. Top. Appl. Earth Obs. Remote Sens. 2018, 11, 3527–3537. [Google Scholar] [CrossRef]
  23. de Faria, L.D.; Matricardi, E.A.T.; Marimon, B.S.; Miguel, E.P.; Junior, B.H.M.; de Oliveira, E.A.; Prestes, N.C.C.d.S.; de Carvalho, O.L.F. Biomass Prediction Using Sentinel-2 Imagery and an Artificial Neural Network in the Amazon/Cerrado Transition Region. Forests 2024, 15, 1599. [Google Scholar] [CrossRef]
  24. Cheng, K.; Su, Y.; Guan, H.; Tao, S.; Ren, Y.; Hu, T.; Ma, K.; Tang, Y.; Guo, Q. Mapping China’s planted forests using high resolution imagery and massive amounts of crowdsourced samples. ISPRS J. Photogramm. Remote Sens. 2023, 196, 356–371. [Google Scholar] [CrossRef]
  25. Li, W.; MacBean, N.; Ciais, P.; Defourny, P.; Lamarche, C.; Bontemps, S.; Houghton, R.A.; Peng, S. Gross and net land cover changes in the main plant functional types derived from the annual ESA CCI land cover maps (1992–2015). Earth Syst. Sci. Data 2018, 10, 219–234. [Google Scholar] [CrossRef]
  26. Besnard, S.; Koirala, S.; Santoro, M.; Weber, U.; Nelson, J.; Gütter, J.; Herault, B.; Kassi, J.; N’Guessan, A.; Neigh, C.; et al. Mapping global forest age from forest inventories, biomass and climate data. Earth Syst. Sci. Data 2021, 13, 4881–4896. [Google Scholar] [CrossRef]
  27. Fick, S.E.; Hijmans, R.J. WorldClim 2: New 1-km spatial resolution climate surfaces for global land areas. Int. J. Climatol. 2017, 37, 4302–4315. [Google Scholar] [CrossRef]
  28. National Forestry and Grassland Administration. China Forest Resource Report (2014–2018); China forestry publishing house: Beijing, China, 2019. [Google Scholar]
  29. Santoro, M.; Cartus, O.; Carvalhais, N.; Rozendaal, D.M.A.; Avitabile, V.; Araza, A.; de Bruin, S.; Herold, M.; Quegan, S.; Rodríguez-Veiga, P.; et al. The global forest above-ground biomass pool for 2010 estimated from high-resolution satellite observations. Earth Syst. Sci. Data 2021, 13, 3927–3950. [Google Scholar] [CrossRef]
  30. Fang, J.; Yu, G.; Liu, L.; Hu, S.; Chapin, F.S. Climate change, human impacts, and carbon sequestration in China. Proc. Natl. Acad. Sci. USA 2018, 115, 4015–4020. [Google Scholar] [CrossRef]
  31. National Forestry and Grassland Administration. China Forest Resource Report (2009–2013); China forestry publishing house: Beijing, China, 2014. [Google Scholar]
  32. Xu, H.; He, B.; Guo, L.; Yan, X.; Zeng, Y.; Yuan, W.; Zhong, Z.; Tang, R.; Yang, Y.; Liu, H.; et al. Global Forest Plantations Mapping and Biomass Carbon Estimation. J. Geophys. Res. Biogeosci. 2024, 129, e2023JG007441. [Google Scholar] [CrossRef]
  33. Tang, X.; Zhao, X.; Bai, Y.; Tang, Z.; Wang, W.; Zhao, Y.; Wan, H.; Xie, Z.; Shi, X.; Wu, B.; et al. Carbon pools in China’s terrestrial ecosystems: New estimates based on an intensive field survey. Proc. Natl. Acad. Sci. USA 2018, 115, 4021–4026. [Google Scholar] [CrossRef]
  34. Ma, L.; Ma, J.; Yan, P.; Tian, F.; Peñuelas, J.; Rao, M.P.; Fu, Y.; Hu, Z. Planted Forests in China Have Higher Drought Risk Than Natural Forests. Glob. Change Biol. 2025, 31, e70055. [Google Scholar] [CrossRef] [PubMed]
  35. Abbasi, A.O.; Tang, X.; Harris, N.L.; Goldman, E.D.; Gamarra, J.G.P.; Herold, M.; Kim, H.S.; Luo, W.; Silva, C.A.; Tchebakova, N.M.; et al. Spatial database of planted forests in East Asia. Sci. Data 2023, 10, 480. [Google Scholar] [CrossRef] [PubMed]
  36. Shanley, C.S.; Graves, R.A.; Drever, C.R.; Schindel, M.; Robertson, J.C.; Case, M.J.; Biswas, T. Mapping forest-based natural climate solutions. Commun. Earth Environ. 2024, 5, 502. [Google Scholar] [CrossRef]
Figure 1. Workflow for the data processing, and the steps to separate biomass gains and losses of planted forest and natural forest.
Forests 16 00884 g001
Figure 2. Distribution of mean (a) planted forest biomass and (b) natural forest biomass averaged over 2005, 2010, 2015, and 2020.
Forests 16 00884 g002
Figure 3. Changes in (a) forest biomass, (b) above-ground biomass, and (c) below-ground biomass for planted forest and natural forest in 2005, 2010, 2015, and 2020, respectively.
Forests 16 00884 g003
Figure 4. Distribution of (a,b) forest biomass, (c,d) planted forest biomass, and (e,f) natural forest biomass in 2005 and 2020, respectively. Note that forest biomass includes planted forest biomass and natural forest biomass.
Forests 16 00884 g004
Figure 5. Changes in (a) forest area and (b) area and biomass proportion occupied by planted and natural forest, respectively, in 2005, 2010, 2015, and 2020.
Forests 16 00884 g005
Figure 6. Latitudinal changes in (a) biomass and (c) area of forest, natural forest, and planted forest in 2005 and 2020, and (b,d) their balance defined as biomass in 2020 minus biomass in 2005.
Forests 16 00884 g006
Figure 7. Distribution of planted forest in 2005, 2010, 2015, and 2020 in China, including forest groups (green color) within and (red color) outside the 2005 boundary of planted forest.
Forests 16 00884 g007
Figure 8. Changes in (a) area and (b) biomass of planted forest in 2005, 2010, 2015, and 2020, including forest groups in and out of the 2005 boundary of planted forest.
Forests 16 00884 g008
Figure 9. Biomass of planted forest, natural forest, and all forest in (a) 2010, (b) 2015, and (c) 2020 minus the corresponding biomass in 2005, respectively.
Forests 16 00884 g009
Figure 10. Distribution of biomass change for (a,b) forest, (c,d) planted forest, and (e,f) natural forest for (left column) 2005–2010 and (right column) 2005–2020, respectively.
Forests 16 00884 g010
Figure 11. Comparison of estimated forest biomass in 2015 with the 9th inventory-based forest biomass for 31 provinces in China.
Forests 16 00884 g011
Figure 12. Comparison of estimated forest above-ground biomass (AGB) in 2010 with AGBsantoro in China.
Forests 16 00884 g012
Table 1. Mean biomass for planted forest, natural forest, and forest for south (18°–35° N), north (35° N–54° N), and all of China, averaged over 2005, 2010, 2015, and 2020.
RegionPlanted Forest Biomass and PercentageNatural Forest Biomass and PercentageTotal Forest Biomass and Percentage
South2.19 Pg C (86.2%)4.44 Pg C (70.3%)6.63 Pg C (74.9%)
North0.35 Pg C (13.8%)1.88 Pg C (29.7%)2.23 Pg C (25.1%)
All2.54 Pg C (100%)6.32 Pg C (100%)8.86 Pg C (100%)
Table 2. Annual biomass for planted forest, natural forest, and all forests in 2005, 2010, 2015, and 2020.
YearPlanted Forest (Pg C)Natural Forest (Pg C)Total Biomass (Pg C)
20051.816.448.26
20102.436.238.65
20152.816.188.99
20203.116.449.56
Disclaimer/Publisher’s Note: The statements, opinions and data contained in all publications are solely those of the individual author(s) and contributor(s) and not of MDPI and/or the editor(s). MDPI and/or the editor(s) disclaim responsibility for any injury to people or property resulting from any ideas, methods, instructions or products referred to in the content.

