Abstract
Evaluating forest functional indicators is essential for effective forest management planning. In this study, we conducted a metagenome-based comparative analysis of the rhizosphere soils from a natural Quercus mongolica stand and an artificial Larix kaempferi stand on Mt. Gariwang, Pyeongchang, Republic of Korea. Both stands originally belonged to the same natural forest and represent the current dominant tree species. Bacterial communities were affected more by climate than by tree species. A bacterial co-occurrence network analysis showed more complex interactions in the Q. mongolica than in L. kaempferi. Conversely, fungal communities were affected more by tree species than by climate. Specifically, the Q. mongolica stand had a high ratio of saprotrophic fungi, whereas the L. kaempferi stand exhibited a higher ratio of fungi associated with nutrient decomposition and harbored a high proportion of fungi that form ectomycorrhizae with long-distance exploration types. These fungal traits serve as indicators of soil ecological changes in Q. mongolica and L. kaempferi stands. Our comparative analysis of the microbial communities of Q. mongolica and L. kaempferi, representative plantation species in the Republic of Korea, revealed seasonal and host species–specific bacterial and fungal associations, and fungal communities were less variable than bacterial communities and more accurately reflected host tree traits.
Keywords:
diversity; forests; Haliangium; keystone taxa; Larix kaempferi; microbiome; Quercus mongolica 1. Introduction
As of 2020, South Korea’s forests were dominated by trees aged 30–40 years (38.9%) and 40–50 years (32.9%). By 2030, trees aged 40 or older will cover 77.3% of the area, meaning most forests will reach the 50–70-year harvestable range. The harvesting process can induce various changes in the forest environment. Additionally, as forests undergo maturation, they may experience degradation and changes in their vegetation structure as a result of ecological succession and climate change. Moreover, increasing temperatures have the potential to cause declines in Korean conifer species [1,2,3]. Therefore, it is imperative to conduct research on forest establishment and management that takes into consideration carbon sequestration and alterations in biodiversity to achieve sustained increases in forest biomass and the maintenance of tree health [4].
Trees in forests continuously influence their surrounding environment through multiple mechanisms, such as secretions and the shedding of leaves. Forest soils can harbor over 1500 species of microbes. Among the soil microbial species, over 70% are rare taxa, and these are more strongly influenced by host tree species than by climate [5]. Plants form symbioses with soil microbes, leading to increased nutrient uptake and enhanced resilience to environmental stressors [6,7]. Additionally, leaf-associated microbes play a crucial role in the initial decomposition of fallen leaves, contributing to efficient nutrient cycling within forests [8]. Therefore, microbial communities exhibit distinct structures and functions based on the tree species involved.
Advancements in next-generation sequencing (NGS) technologies have enabled the comprehensive analysis of genetic sequences present in soil [9]. Metagenomic analyses utilize NGS to identify microbial species in soil based on specific DNA regions [10]. This method enables the identification of microbial species that cannot be cultured. In the field of forestry, microbiome research is actively being conducted, helping provide a comprehensive understanding of forest environments [11,12]. Recently, the application of network analysis to metagenomic data has enabled the prediction of interactions among microbes and their responses to the soil environment [13]. There is also a growing interest in utilizing these microbial features to predict and evaluate environmental changes in forests.
Korea’s summer climate features high temperatures and concentrated rainfall in August. The interactions between microbiomes and host plants also exhibit seasonal variation [14]. Additionally, these interactions vary with the maturity of the forest [15]. However, there is a notable lack of research on forest seasonal microbiome dynamics tailored to Korea’s climate, even though soil sampling timing can significantly influence results and their interpretation. When examining forest soil ecology through microbiome analysis, it is essential to understand the unique characteristics of the rhizosphere microbiome associated with specific tree species [16].
This study aimed to analyze changes in microbiome diversity based on soil sampling time and to compare the functions and characteristics of the microbiomes of coniferous and deciduous stands originating from nearly identical sites 40 years ago. Gangwon-do is of particular importance in national forest policy due to its extensive national forests and high timber volume, making it a critical area for this research. Therefore, the analysis focused on two dominant tree species in Gangwon province: the conifer (Larix kaempferi) and the deciduous (Quercus mongolica) species [17]. We propose two hypotheses: First, the microbiomes of each forest type will exhibit species-specific community compositions and functional potential traits. Second, the utility of bacterial and fungal analyses will vary depending on both species and sampling timing. By comparing the microbiomes associated with L. kaempferi and Q. mongolica stands, this study aims to evaluate the temporal and host species influences on rhizosphere microbial structure, function, and ecological network stability.
2. Materials and Methods
2.1. Sample Collection and Physicochemical Analysis
The sampling areas included a Q. mongolica stand and a L. kaempferi stand on Gariwangsan in Pyeongchang, Gangwon province, South Korea (37.28° N, 128.3° E) (Figure 1). The average temperature at Gariwang Mountain is 9.7 °C, with an annual rainfall of 1761.4 mm. The Q. mongolica stand was a natural broadleaf stand, whereas the L. kaempferi stand was established 50 years ago following the clear-cutting of a natural broadleaf stand. The two selected areas share identical elevations and aspects. Therefore, both stands have been subjected to the same climatic disturbances.
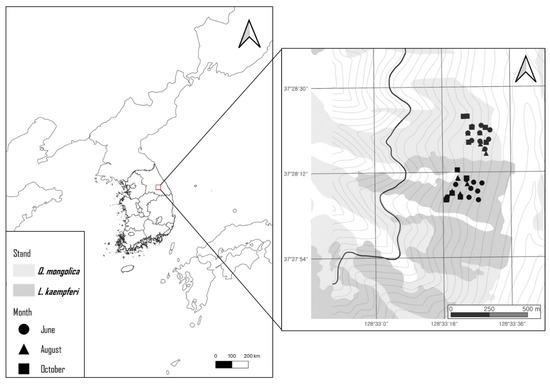
Figure 1.
Locations of the sampling points.
The distance between the L. kaempferi and Q. mongolica stands exceeded 200 m, and sampling points within stands were located at least 50 m from each other. In June, rhizosphere soil samples were collected from one dominant tree at each of nine sampling points. In August and October, soil samples were collected from two dominant trees at each of five sampling points, yielding a total of 58 samples. At each sampling point, the organic layer was removed, and rhizosphere soil was collected from a depth of 20 cm. The samples were transported to the laboratory under refrigeration, and a portion of each soil sample, intended for physicochemical analysis, was air-dried.
For soil pH measurement, the soil was diluted with distilled water at a 1:10 ratio, and the pH of the solution was measured using a pH meter (MP511, SECHANG, Seoul, Republic of Korea). Soil moisture (SM) was determined by calculating the weight difference before and after drying at 105 °C. Total carbon (TC), organic matter (OM), exchangeable potassium (K), exchangeable calcium (Ca), total phosphorus (TP), and total nitrogen (TN) measurements were performed by the Korea Agriculture Technology Promotion Agency (Iksan, Republic of Korea) [18].
2.2. DNA Extraction and Sequencing
DNA extraction was conducted using the DNeasy PowerSoil Pro Kit (Qiagen, Hilden, Germany), and DNA quality was assessed using a NanoDrop™ Lite spectrophotometer (Thermo Fisher Scientific, Waltham, MA, USA). Sequencing was performed at the Kyungpook National University (KNU) NGS center in Daegu, Republic of Korea. Bacterial 16S V4 and fungal ITS2 amplicon sequencing were performed using the MiSeq system (Illumina, San Diego, CA, USA) [19,20]. Sequencing was performed using the Miseq Reagent Kit v2 (Illumina, San Diego, CA, USA) and TruSeq Index adapters [21,22]. PCR amplification, library preparation, and sequencing were conducted following Illumina’s 16S Metagenomic Sequencing Library Preparation protocol [23]. Primers pairs included 515F (5′-GTGCCAGCMGCCGCGGTAA-3′) and 806R (5′-GGACTACHVGGGTWTCTAAT-3′) for the bacterial V4 region and ITS3 (5′-GCATCGATGAAGAACGCAGC-3′) and ITS4 (5′-TCCTCCGCTTATTGATATGC-3′) for the fungal ITS2 region.
2.3. Diversity Analysis
Raw reads were processed using QIIME2 (Quantitative Insights into Microbial Ecology, Version 2) [24], with low-quality reads filtered out using DADA2 (Divisive Amplicon Denoising Algorithm 2) [25]. We aligned the filtered data using reference databases: SILVA version 138 for the bacterial V4 region and UNITE version 8.3 for the fungal ITS2 region [26,27,28]. For bacteria, phylogenetic trees were constructed using SEPP (SATé-enabled phylogenetic placement), while fungal phylogenetic trees were generated using MAFFT version 7 in conjunction with the FastTree algorithm [29,30]. Alpha diversity metrics, including the Shannon (incorporating richness and evenness), Chao1 (a measure of richness), and Simpson (emphasizing dominance) indices, were employed to assess alpha diversity [31,32]. Beta diversity was assessed using the Bray–Curtis dissimilarity index, and differences between stands were statistically assessed using Permutational analysis of variance (PERMANOVA) [33,34]. Furthermore, beta diversity was visualized and its correlation with soil environmental factors was examined using a distance-based redundancy analysis (dbRDA) [35]. Statistical comparisons of soil environments between the two stands were performed using the Wilcoxon rank sum test, with resulting p-values adjusted for multiple testing using the Benjamini–Hochberg false discovery rate procedure.
2.4. Functional Potential Prediction
Functional potential predictions were performed to investigate the functional potential differences between the microbiomes associated with the L. kaempferi and Q. mongolica stands. Bacterial functional potential predictions were conducted using PICRUSt2 and FAPROTAX [36,37]. The PICRUSt2 analysis employed EPA-ng to map each sequence onto a reference tree, with functional potential predictions based on the Kyoto Encyclopedia of Genes and Genomes (KEGG) orthology database [38]. The FAPROTAX analysis was conducted using the microeco package (v 1.14.0) in R (v 4.2.1) [39]. Fungal functional potential predictions were performed using FungalTraits and FUNGuild [40,41]. Data visualization and statistical analyses were conducted using STAMP (v 2.1.3), after taxa abundances were normalized as relative frequencies within each sampling point [42]. KEGG predicts gene family abundances, and FAPROTAX predicts bacterial ecological functions. FUNGuild evaluates fungi based on trophic modes, while FungalTraits predicts fungal physiological and trait characteristics.
2.5. Microbial Network Analysis
Network analyses were conducted to examine interactions among taxa identified through metagenomic analysis. These analyses were based on phylogenetic molecular ecological networks (pMENs) and were executed using the molecular ecological network analysis (MENA) pipeline, which employs random matrix theory [13,43]. In the taxa table used for the analysis, each taxa’s abundance at a given sampling point was normalized as its relative frequency after rarefaction, and only taxa present in at least 15 out of 29 samples were included. Similarity matrices were constructed using the Pearson correlation coefficient, and modularity was calculated using greedy modularity optimization [44,45]. Correlation analyses between soil environmental variables and each taxon were conducted using the Mantel test [46]. To identify modules correlated with environmental variables and evaluate inter-module similarity, a module–eigengene analysis was performed. Modules with fewer than five nodes were not used for this analysis. Nodes were classified into four topological roles based on their Zi (within-module connectivity) and Pi (among-module connectivity) values: (1) peripherals (Zi < 2.5, Pi < 0.62), (2) module hubs (Zi > 2.5, Pi < 0.62), (3) connectors (Zi < 2.5, Pi > 0.62), and (4) network hubs (Zi > 2.5, Pi > 0.62) [47].
3. Results
3.1. Soil Physicochemical Properties
In June and August, the Q. mongolica stand exhibited lower soil pH and K⁺ values and higher TP than the L. kaempferi stand (Table 1), but these differences disappeared by October. Total nitrogen increased in August at both stands, and in the L. kaempferi stand, TN decreased again in October. In both stands, TP decreased in August and October, while K⁺ increased in August. Soil moisture, OM, and TC showed little variation across the sampling times.

Table 1.
Soil physicochemical properties.
3.2. Alpha Diversity
The Shannon index captures species richness and evenness; Chao1 estimates total richness, including rare taxa; and the Simpson index emphasizes the dominance of abundant species. Together, these complementary metrics provide a comprehensive view of community structure and stability.
The alpha diversity analysis revealed significant increases in all diversity indices of the bacterial community during August, coinciding with higher temperatures, followed by a decline in October as temperatures decreased (Figure 2a and Figure S1a). In June, a significant difference in alpha diversity (Chao1, Shannon) was observed between the L. kaempferi and Q. mongolica forests, although no significant differences in diversity were detected between the two forest types when not accounting for the sampling month (Figure S2a).
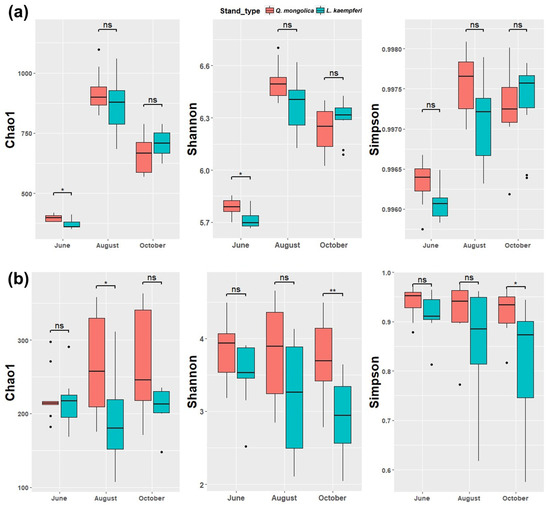
Figure 2.
Boxplot showing the Chao1, Shannon, and Simpson alpha diversity indices during each sampling period (x-axis) in the Q. mongolica and L. kaempferi stands. Panel (a) depicts the alpha diversity indices for the bacterial communities, and panel (b) depicts the alpha diversity indices for the fungal communities. Significant differences are indicated by asterisks, with * indicating p < 0.05 and ** indicating p < 0.01, and “ns” indicates “nonsignificant” (p > 0.05). The line within the box represents the median, and the top and bottom of the boxes correspond to the 75th and 25th percentiles, respectively. Whiskers extend to the minimum values, and points indicate outliers.
For fungal communities, the Chao1 index in August was significantly higher in the Q. mongolica stand than in the L. kaempferi stand. In October, the Simpson and Shannon indices indicated significantly higher diversity in the Q. mongolica stand (Figure 2b). When looking at all seasons together, all alpha diversity indices were significantly higher in the Q. mongolica stand than in the L. kaempferi stand (Figure S2b). Unlike bacterial communities, fungal community alpha diversity did not exhibit significant seasonal variation (Figure S1b).
3.3. Beta Diversity
The analysis of bacterial beta diversity revealed significant differences in microbial community structures between June (early summer) and August (midsummer). In October (autumn), the community structure was between those observed in June and August in the dbRDA plot (Figure 3c). PERMANOVA analyses consistently yielded p-values of 0.001 when comparing seasons, indicating significant seasonal variation in the bacterial community. This demonstrates a cyclical pattern in bacterial community dynamics corresponding to seasonal changes (Figure 3c). When examining the difference between tree species across the entire study period, the p-value was 0.398, indicating no significant differences between the bacterial communities associated with L. kaempferi and Q. mongolica (Figure 3a). However, during August, which experienced the highest temperatures, a significant difference between the two tree species was observed, with a p-value of 0.011, indicating significant differences (Figure 3c).
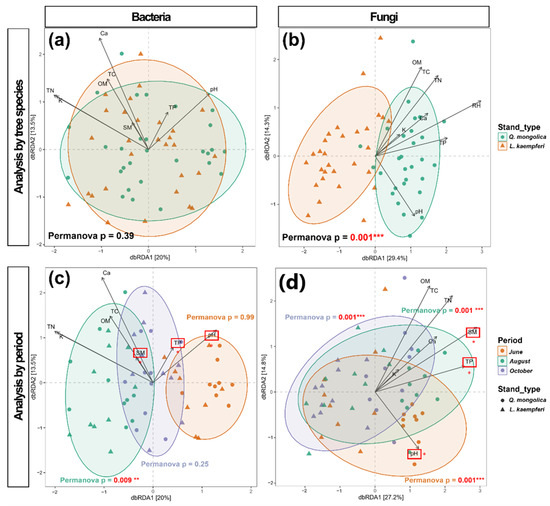
Figure 3.
Distance-based redundancy analysis (dbRDA) plots of the sample points for bacteria (a,c) and fungi (b,d). The PERMANOVA p-values assess the significance of differences between the Q. mongolica and L. kaempferi stands across all seasons (a,b) and within each season (c,d). Significant differences are indicated by asterisks, with * indicating p < 0.05, ** indicating p < 0.01, and *** indicating p < 0.001. The vectors represent the influences of physicochemical variables, with their directions and lengths indicating the directions of the relationships and the strengths of the effects, respectively. Significant differences in physicochemical variables between the Q. mongolica and L. kaempferi stands are indicated with red squares and asterisks.
The analysis of fungal beta diversity indicated that fungal community structure remained relatively stable throughout the study period (Figure 3d). In contrast to bacteria, fungal communities exhibited clear differences between tree species, with PERMANOVA results consistently indicating significant differences at all sampling times (p = 0.001; Figure 3b,d).
Wilcoxon rank sum tests revealed that soil pH, SM, and TP were significantly higher in the Q. mongolica stand, with p-values of 0.036, 0.031, and 0.032, respectively (Figure 3c,d). However, no soil physicochemical characteristics were found to be correlated with the season.
3.4. Functional Potential Prediction
Based on PICRUSt2, bacterial functional potential prediction at the KEGG level 2 identified 41 functions. Among these, functions related to the digestive system, enzyme families, and signal transduction were significantly higher in the Q. mongolica stand (Figure 4a and Figure S4). At KEGG level 3, 20 functions were significantly higher in the Q. mongolica stand, whereas 9 were significantly higher in the L. kaempferi stand (Figure S3). FAPROTAX bacterial functional potential predictions revealed that nitrate reduction, nitrogen fixation, and iron respiration were significantly elevated in the Q. mongolica stand, whereas dark hydrogen oxidation was more prominent in the L. kaempferi stand (Figure 4b and Figure S4).
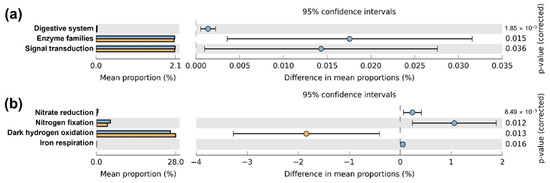
Figure 4.
Relative abundance plots of the predicted functional potentials identified using PICRUSt 2 (a) and FAPROTAX (b). The results from PICRUSt2 are categorized by KEGG pathways (level 2). Light blue bars/circles represent the Q. mongolica stand, and orange bars/circles represent the L. kaempferi stand. The p-values at the far right are based on Welsh’s t-tests.
The FUNGuild fungal functional potential prediction analysis identified 26 distinct functions. In the L. kaempferi stand, functions such as “Symbiotroph” and “Ectomycorrhizal” were more prevalent than in the Q. mongolica stand. Conversely, the Q. mongolica stand exhibited significantly higher levels of “Orchid Mycorrhizal” “Root Associated Biotroph” and “Plant Saprotroph” functions (Figure 5a and Figure S5). Analysis using FungalTraits revealed that the L. kaempferi stand had a significantly higher proportion of medium-distance fringe types, with a prevalence of endophytes and soil saprotrophic fungi. Conversely, the Q. mongolica stand showed a significantly higher proportion of contact and short-distance delicate types, with an abundance of fungi related to saprotroph (Figure 5b and Figure S5). Additionally, fungi associated with nutrient uptake, such as dark septate root endophytes and arbuscular mycorrhiza, were more prevalent in the Q. mongolica stand than the L. kaempferi stand.
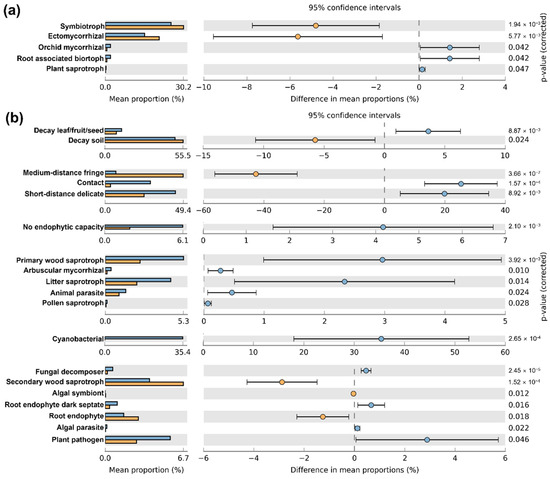
Figure 5.
Relative abundance plot of the predicted functional potentials identified using FUNGuild (a) and FungalTraits (b). Light blue bars/circles represent the Q. mongolica stand, and orange bars/circles represent the L. kaempferi stand. The p-values at the far right are based on Welsh’s t-tests.
The correlation analysis between functional potentials differing among tree species and soil physicochemical properties revealed distinct patterns. Bacterial functional potentials that were elevated in the L. kaempferi stands were negatively correlated with pH. In contrast, those elevated in the Q. mongolica stands exhibited a positive correlation with pH as well as with various soil nutrients (Figure 6a). For fungal communities, those in the L. kaempferi stands showed minimal relation to soil physicochemical properties, with symbiotrophs displaying negative correlations with soil nutrients. Conversely, saprotrophs in the Q. mongolica stands exhibited positive correlations with soil nutrients (Figure 6b).
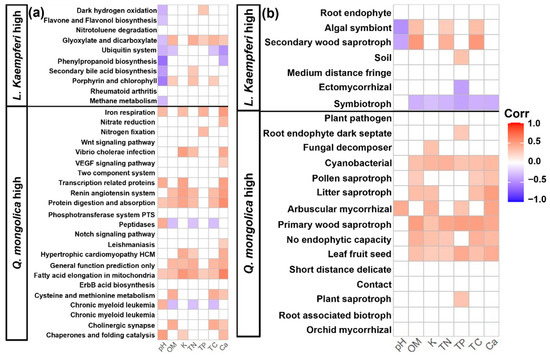
Figure 6.
Heatmap of soil physicochemical traits and the predicted bacterial (a) and fungal (b) functional potentials that were significant between the Q. mongolica and L. kaempferi stands. Color value of each cell was determined using Pearson correlation analyses, with cells representing nonsignificant correlations, as determined using t-tests, left blank. Functions with higher abundance in the L. kaempferi stand are displayed above the thick line, and those with higher abundances in the Q. mongolica stand are shown below it.
3.5. Network Analysis
The construction of bacterial (Figure 7) and fungal (Figure S6) networks in both Q. mongolica and L. kaempferi stands revealed notable differences in soil microbial interactions between the two stands. The connectivity, with R2 values ranging from 0.83 to 0.93, indicated a strong fit to a power-law distribution and confirmed their scale-free nature. The bacterial networks in the Q. mongolica and L. kaempferi stands consisted of 177 and 197 nodes, with 525 and 352 links, were organized into 14 (modularity = 0.43) and 17 (modularity = 0.61) modules, respectively. The fungal networks in the Q. mongolica and L. kaempferi stands comprised 142 and 127 nodes, with 254 and 202 links, organized into 12 (modularity = 0.76) and 11 (modularity = 0.72) modules, respectively. Bacterial and fungal networks shared 96 and 66 nodes, respectively.
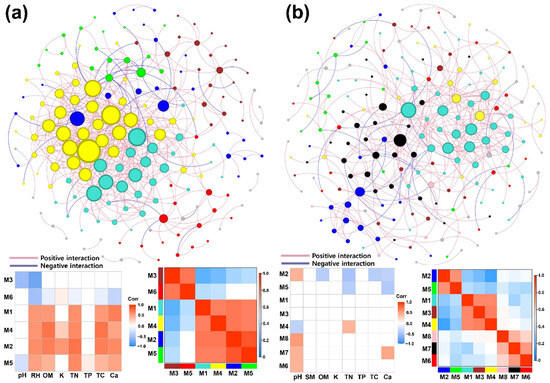
Figure 7.
Network analyses of bacterial communities in the Q. mongolica (a) and L. kaempferi (b) stands based on random matrix theory. The networks show the interactions between taxa, with nodes of the same color representing taxa belonging to the same module and larger nodes indicating taxa with a higher degree. In each panel, the graph on the right is a module–module heatmap, and the graph on the left is a module–soil physicochemical trait heatmap. In the module–soil physicochemical trait heatmaps, blank cells indicate nonsignificant correlations, as determined via t-tests.
Visualization of the bacterial network in the Q. mongolica stand revealed a high concentration of links within the top two modules, accompanied by a high number of interactions per node (Figure 7a). Conversely, the bacterial network in the L. kaempferi stand showed a more dispersed distribution of links throughout the network, with fewer interactions per node (Figure 7b). Statistical analysis further demonstrated that the Q. mongolica stand had significantly higher degrees and clustering coefficients, while its betweenness was significantly lower (Figure 8a). In comparison, no significant differences were observed between the Q. mongolica and L. kaempferi stands in fungal network analysis (Figure 8b and Figure S6b).
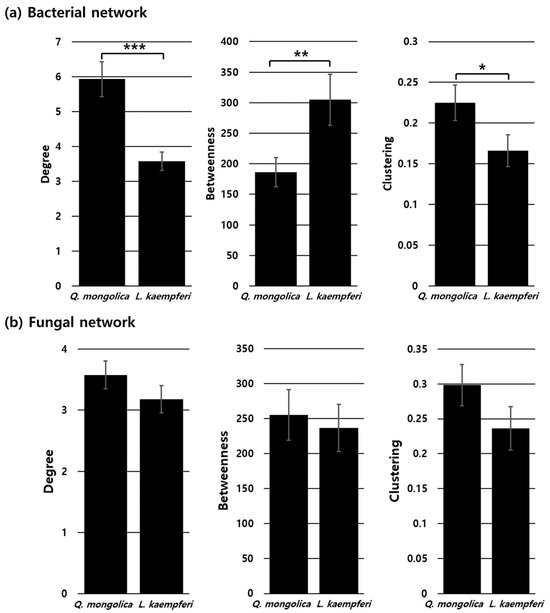
Figure 8.
Bar plots of the degree, betweenness, and clustering centrality metrics from the network analyses of the bacterial (a) and fungal (b) communities in the Q. mongolica and L. kaempferi stands. The length of each bar represents the mean for each group, and the error bars represent the standard error. Significant differences are denoted by asterisks: * represents p < 0.05, ** represents p < 0.01, and *** represents p < 0.001.
The module-eigengene analysis of major modules, those comprising more than five nodes, revealed distinct groupings within the microbial networks. The bacterial network in the Q. mongolica stand was categorized into two groups, whereas that in the L. kaempferi stand was divided into three (Figure 7). The fungal network in the Q. mongolica stand was divided into three major groups, whereas that in the L. kaempferi stand was categorized into four. However, the overall correlation between modules in the fungal network was lower than that seen in the bacterial network (Figure S6).
In an analysis of correlations between bacterial modules and environmental traits in the Q. mongolica stand, 66.7% of the correlations were significant, and the modules could be divided into two distinct groups based on their environmental responses. This indicates a high sensitivity of these modules to soil environmental conditions (Figure 7a). In contrast, bacterial modules in the L. kaempferi stand exhibited a notably weaker association with soil environment, with only 17.2% of the correlations being significant (Figure 7b). For fungal modules, 28.1% and 10.9% of the correlations between modules and environmental traits were significant in the Q. mongolica and L. kaempferi stands, respectively (Figure S6).
Topological roles of each taxon were determined using Zi–Pi values. In the bacterial network of the Q. mongolica stand, Haliganium sp. was classified as a network hub. Additionally, this network contained four module hubs and eight connectors. In contrast, the bacterial network of the L. kaempferi stand included five module hubs and seven connectors. For the fungal networks, the Q. mongolica stand had one module hub and two connectors, whereas the L. kaempferi stand had three module hubs and two connectors (Figure S7).
4. Discussion
4.1. Difference in Community Composition
Our metagenomic analysis revealed significant variations in bacterial communities based on sampling time. The fact that a significant difference in bacterial beta diversity between the two tree species was observed only in August can be attributed to three main factors. First, bacterial communities exhibit sensitivity to temperature changes, which affect metabolic rates and cell division. Previous studies indicate that prolonged periods of elevated soil temperature significantly enhance interactions between microbes within a community [45]. In our study area, average temperatures were 16.2 °C in June, 19.7 °C in August, and 8.8 °C in October. The Republic of Korea experiences distinct seasons and more pronounced temperature fluctuations in high-altitude areas than in low-altitude areas [48]. Second, Korea experiences concentrated rainfall during the summer months (July–August). The differences between the stands in physicochemical properties disappeared after October, likely due to the leaching and stabilization of nutrients by concentrated rainfall [49]. These properties are expected to diverge again in other seasons [50]. Third, trees experience their most vigorous growth during summer, when both sunlight and rainfall are abundant. During this period, substances secreted from the tree into the rhizosphere appear to strongly influence the associated bacterial communities [51,52]. Overall, bacterial communities are significantly influenced by seasonal variation than fungal communities. Therefore, to accurately assess forest environmental changes through bacterial communities, it is crucial to carefully consider the timing of sampling.
Fungal communities demonstrated less variation across sampling periods, indicating greater resilience to climatic conditions, and exhibited distinct differences between tree species consistently across all sampling times. This suggests that fungal communities are significantly influenced by tree species. Previous studies support this observation, indicating that while bacterial communities exhibit annual variations and are heavily influenced by environmental factors, fungal communities are more significantly influenced by vegetation (host species) than by climate conditions [53,54]. Thus, analyzing fungal communities may offer a more effective approach for evaluating changes in forest soil environments, suggesting that fungal community characteristics are effective indicators for forest health monitoring and ecosystem evaluation.
4.2. Difference in Functional Responses
Most bacterial functional potentials that were elevated in the L. kaempferi stand exhibited significant negative correlations with soil pH. This indicates that the soil environment in the L. kaempferi stand, which exhibited a lower soil pH, promoted bacterial communities rich in species possessing these traits. In contrast, the functional potential analysis of fungal communities demonstrated that symbiotrophic fungi, which establish symbiotic relationships with trees, increased as soil nutrient levels decreased. This suggests that, under nutrient-poor conditions, trees secrete substances into the rhizosphere to promote the development of fungal communities that enhance nutrient absorption [55].
The exploration types of ectomycorrhiza did not correlate with soil properties, indicating that traits inherent to the tree species predominantly influence these aspects of the fungal community. In the Q. mongolica stand, ectomycorrhizal fungi forming contact and short-distance delicate exploration-type ectomycorrhizae, characterized by relatively short and hydrophilic hyphae, were significantly more prevalent [56]. These fungi are well-adapted for rapid nutrient absorption in nutrient-rich environments. In contrast, the L. kaempferi stand exhibited a higher prevalence of medium-distance fringe-type ectomycorrhizal fungi, which have longer and more hydrophobic hyphae [56]. Although these fungi have lower nutrient absorption efficiency, their morphology minimizes nutrient loss during long-distance transport, thereby ensuring effective delivery to the host. Additionally, the L. kaempferi stand exhibited a higher abundance of endophytes, indicating that these symbiotic fungal associations are distinctive features of this stand. Such characteristics could be utilized for assessing the ecological status of L. kaempferi stands.
In the bacterial communities, elevated functional potentials included those related to the digestive system and enzyme families, which are crucial for the decomposition of organic matter, such as leaf litter [57,58,59], as well as signal transduction, which is associated with bacterial interactions, including quorum sensing within bacterial communities [58]. All three functional potentials were found to be more prevalent in the Q. mongolica stand. Additionally, the fungal community in the Q. mongolica stand displayed a higher abundance of leaf and seed saprotrophic fungi, and fungal decomposers. Notably, the Q. mongolica stand had a higher prevalence of arbuscular mycorrhizal fungi and a lower prevalence of ectomycorrhizal fungi when compared to the L. kaempferi stand. Ectomycorrhizal fungi can directly utilize nutrients from soil organic matter and organic nitrogen, whereas arbuscular mycorrhizal fungi depend on nutrients that have been fully decomposed by other microorganisms [55,59]. Therefore, in the Q. mongolica stand, where decomposition and nutrient cycling are highly active, forming arbuscular mycorrhizae may provide a significant advantage, allowing rapid nutrient absorption in the vigorous nutrient-cycling environment [60]. The distinctive microbial functional potential seen in this stand showed a positive correlation with soil nutrients, indicating that the microbial communities in the Q. mongolica stand enhance soil fertility, thereby supporting growth. Dark hydrogen-oxidizing bacteria were more abundant in the L. kaempferi stand. When H2 is produced during nitrogen fixation, these bacteria recycle this H2 via hydrogen oxidation, thereby supporting the N-fixation process [61].
4.3. Differences in Network Structure
The bacterial network in the Q. mongolica stand exhibited significantly higher degrees and clustering compared to that in the L. kaempferi stand, reflecting more complex interactions within the network. Such complex networks can enhance soil biological fertility and offer greater stability against environmental fluctuations [62,63,64,65,66]. The significantly lower betweenness centrality in the Q. mongolica stand’s bacterial network suggests that the top two modules play a particularly important role in the network’s functionality [67,68]. Additionally, the modules in the Q. mongolica stand exhibited strong correlations with environmental factors that categorized them into two major groups. This observation suggests that soil bacteria in the Q. mongolica stand are more responsive to seasonal changes and forest maturation than fungal communities. For example, under typical conditions, Modules 1, 2, 4, and 5 are activated to facilitate organic matter decomposition and nutrient uptake; however, when soil disturbances occur, the dominance and interactions of Modules 3 and 6 may increase. The fungal networks did not differ between the two stands, which may be because fungi have more genes than bacteria and can perform more functions independently. Therefore, the importance of interactions appears to be lower for fungi compared to bacteria [69].
The analysis of the topological roles of individual taxa revealed that the number of keystone taxa, defined using their Zi or Pi values, was comparable between the Q. mongolica and L. kaempferi stands, though they shared no taxa. This indicates that each tree species supports distinct keystone taxa adapted to its specific growth conditions and environmental factors. Keystone taxa play crucial roles in microbial communities [70], and alterations or losses of these taxa can significantly impact overall network structure and host plant growth [71]. In the bacterial network of the Q. mongolica stand, Haliangium sp. was identified as the sole network hub, exerting significant influence both within its own module and in interactions with other modules. This genus is commonly found in various types of forests, including Q. mongolica forests [72,73]. Previous studies indicate that Haliangium sp. decompose organic matter, enhance nitrogen absorption, and improves the host plants’ resistance to environmental stress [74]. Additionally, when inoculated into soils as part of a beneficial microbe ensemble, Haliangium sp. is expected to react in concert with the community, influencing the host in a coordinated manner [75]. Together, this suggests that Haliangium sp. is essential for nutrient cycling and interactions in Q. mongolica forest soils.
5. Conclusions
This study investigated the characteristics of microbial communities in coniferous and deciduous stands and demonstrated their potential utility in future forest environmental assessments. In Quercus mongolica stands, microbial interactions are highly active, enriching functions for rapid organic matter decomposition and uptake. In contrast, Larix kaempferi stands possess functions that facilitate nutrient uptake over a larger area rather than rapid absorption. As our results demonstrate, assessing fungal functional profiles alongside network complexity and stability can be used to evaluate soil environmental status in forest ecosystems. Additionally, fungi can be ecologically categorized into clear functional groups (e.g., mycorrhizal, saprotrophic, and pathogenic), and they exhibit higher host specificity than bacteria [76]. Therefore, long-term monitoring of fungal functional shifts and network structural changes under various disturbance regimes is needed.
Supplementary Materials
The following supporting information can be downloaded at https://www.mdpi.com/article/10.3390/f16060883/s1, Figure S1. Boxplots of bacterial and fungal alpha diversity indices, including the Chao1, Shannon, and Simpson indices, from the Quercus mongolica and Larix kaempferi stands. Statistical analysis results assessing differences in alpha diversity across different sampling periods are shown. Significant differences are indicated by asterisks, with * indicating p < 0.05, *** indicating p < 0.001, and **** indicating p < 0.0001, and “ns” indicates “non-significant” (p > 0.05). Figure S2. Boxplots of bacterial (a) and fungal (b) alpha diversity indices, including the Chao1, Shannon, and Simpson indices, in the Q. mongolica and L. kaempferi stands, representing the aggregate diversity across all sampling periods. Figure S3. Relative abundance plot of the predicted functional potentials identified using PICRUSt 2 (KEGG level 3). Light blue bars/circles represent the Q. mongolica stand, and orange bars/circles represent the L. kaempferi stand. The p-values at the far right are based on Welsh’s t-test. Figure S4. The relative abundances of the 14 predicted functional potentials with the highest significance identified in the bacterial communities using FAPROTAX (a) and PICRUSt2 (b). The relative abundances are separated by season. Within each functional trait, the letters indicate significant differences (p < 0.05) based on one-way ANOVAs followed by Duncan’s multiple range tests: boxes not associated with the same letter are significantly different. Figure S5. The relative abundances of the 7 predicted functional potentials with the highest significance identified in the bacterial communities stand using FUNGuild (a) and FungalTraits (b). The relative abundances are separated by season. Within each functional trait, the letters indicate significant differences (p < 0.05) based on one-way ANOVAs followed by Duncan’s multiple range tests: boxes not associated with the same letter are significantly different. Figure S6. Results of network analyses based on the random matrix theory for the fungal communities in the Q. mongolica (a) and L. kaempferi (b) stands. Figure S7. Zi–Pi plots illustrating the distribution of nodes within the bacterial (a and c) and fungal (b and d) community networks in the Q. mongolica (a and b) and L. kaempferi (c and d) stands based on their topological roles within the network (graph quadrants). The threshold values of Zi and Pi for categorizing nodes are 2.5 and 0.62, respectively.
Author Contributions
Conceptualization, S.H.L. (Seok Hui Lee), Y.D.P. and J.W.K.; methodology, S.H.L. (Seok Hui Lee) and J.W.K.; software, S.H.L.(Seok Hui Lee); validation, Y.D.P. and J.W.K.; formal analysis, S.H.L. (Seok Hui Lee); investigation, S.H.L. (Seok Hui Lee), J.Y.P., S.H.J., D.S.K. and S.H.L. (Su Ho Lee); resources, S.H.L. (Seok Hui Lee), S.H.L. (Su Ho Lee), Y.D.P. and J.W.K.; data curation, S.H.L. (Seok Hui Lee), J.Y.P., S.H.J. and D.S.K.; Writing—original draft preparation, S.H.L. (Seok Hui Lee); Writing—review and editing, S.H.L. (Seok Hui Lee), Y.D.P. and J.W.K.; visualization, S.H.L. (Seok Hui Lee); supervision, Y.D.P. and J.W.K.; project administration, J.W.K.; funding acquisition, J.W.K. All authors have read and agreed to the published version of the manuscript.
Funding
This study was carried out with the support of the “R&D Program for Forest Science Technology (Project No. RS-2024-00404388 and FTIS-2022461E10-2424-0201)” provided by the Korea Forest Service (Korea Forestry Promotion Institute).
Data Availability Statement
All data related to this manuscript are incorporated in this manuscript only.
Conflicts of Interest
The authors declare no conflicts of interest.
References
- Mather, A. The Forest Transition. Area 1992, 24, 367–379. Available online: https://www.jstor.org/stable/20003181 (accessed on 12 April 2025).
- Lee, S.-J.; Shin, D.-B.; Byeon, J.-G.; Oh, S.-H. Climate Change Vulnerability Assessment and ecological characteristics study of Abies nephrolepis in South Korea. Forests 2023, 14, 855. [Google Scholar] [CrossRef]
- Lee, S.-J.; Shin, D.-B.; Lee, A.-R.; Oh, S.-H. Characteristics of Dieback of Pinus densiflora and Risk Assessment in the Wangpicheon Ecosystem and Landscape Conservation Area in Uljin, South Korea. Forests 2023, 14, 903. [Google Scholar] [CrossRef]
- Mori, A.S.; Lertzman, K.P.; Gustafsson, L. Biodiversity and ecosystem services in forest ecosystems: A research agenda for applied forest ecology. J. Appl. Ecol. 2017, 54, 12–27. [Google Scholar] [CrossRef]
- Xiong, C.; He, J.Z.; Singh, B.K.; Zhu, Y.G.; Wang, J.T.; Li, P.P.; Zhang, Q.B.; Han, L.L.; Shen, J.P.; Ge, A.H. Rare taxa maintain the stability of crop mycobiomes and ecosystem functions. Environ. Microbiol. 2021, 23, 1907–1924. [Google Scholar] [CrossRef]
- Bhattacharyya, P.N.; Jha, D.K. Plant growth-promoting rhizobacteria (PGPR): Emergence in agriculture. World J. Microbiol. Biotechnol. 2012, 28, 1327–1350. [Google Scholar] [CrossRef]
- Lee, S.H.; Jeon, S.H.; Park, J.Y.; Kim, D.S.; Kim, J.A.; Jeong, H.Y.; Kang, J.W. Isolation and evaluation of the antagonistic activity of Cnidium officinale rhizosphere bacteria against phytopathogenic fungi (Fusarium solani). Microorganisms 2023, 11, 1555. [Google Scholar] [CrossRef]
- Baldrian, P. Forest microbiome: Diversity, complexity and dynamics. FEMS Microbiol. Rev. 2017, 41, 109–130. [Google Scholar] [CrossRef]
- Behjati, S.; Tarpey, P.S. What is next generation sequencing? Arch. Dis. Child.-Educ. Pract. 2013, 98, 236–238. [Google Scholar] [CrossRef]
- Simon, C.; Daniel, R. Metagenomic analyses: Past and future trends. Appl. Environ. Microbiol. 2011, 77, 1153–1161. [Google Scholar] [CrossRef]
- Kanokratana, P.; Uengwetwanit, T.; Rattanachomsri, U.; Bunterngsook, B.; Nimchua, T.; Tangphatsornruang, S.; Plengvidhya, V.; Champreda, V.; Eurwilaichitr, L. Insights into the phylogeny and metabolic potential of a primary tropical peat swamp forest microbial community by metagenomic analysis. Microb. Ecol. 2011, 61, 518–528. [Google Scholar] [CrossRef] [PubMed]
- Castañeda, L.E.; Barbosa, O. Metagenomic analysis exploring taxonomic and functional diversity of soil microbial communities in Chilean vineyards and surrounding native forests. PeerJ 2017, 5, e3098. [Google Scholar] [CrossRef] [PubMed]
- Deng, Y.; Jiang, Y.-H.; Yang, Y.; He, Z.; Luo, F.; Zhou, J. Molecular ecological network analyses. BMC Bioinform. 2012, 13, 113. [Google Scholar] [CrossRef] [PubMed]
- Wang, H.-H.; Chu, H.-L.; Dou, Q.; Feng, H.; Tang, M.; Zhang, S.-X.; Wang, C.-Y. Seasonal changes in Pinus tabuliformis root-associated fungal microbiota drive N and P cycling in terrestrial ecosystem. Front. Microbiol. 2021, 11, 526898. [Google Scholar] [CrossRef]
- Terhonen, E.; Blumenstein, K.; Kovalchuk, A.; Asiegbu, F.O. Forest tree microbiomes and associated fungal endophytes: Functional roles and impact on forest health. Forests 2019, 10, 42. [Google Scholar] [CrossRef]
- Singh, A.; Kumar, M.; Verma, S.; Choudhary, P.; Chakdar, H. Plant microbiome: Trends and prospects for sustainable agriculture. In Plant Microbe Symbiosis; Springer: Cham, Switzerland, 2020; pp. 129–151. [Google Scholar] [CrossRef]
- Lee, W.; Choi, J.; Lee, W.; Lee, Y.; Kim, S.; Jung, D. Comparison of growth characteristics for Korea red pine, Korea white pine, Japanese larch in Gang Won province. In Proceedings of the 2009 Meeting of the Korean Forest Society, Jeju Island, Republic of Korea, 30 November 2009; pp. 410–413. [Google Scholar]
- Kim, S.S.; Kim, R.Y.; Kim, M.S.; Kim, Y.H.; Song, G.C.; Yoon, H.B.; Lee, Y.J.; Jeon, Y.T.; Jo, H.S. Soil Chemical Analysis Method; NAAS (National Institute of Agricultural Sciences): Wanju, Republic of Korea, 2010. [Google Scholar] [CrossRef]
- Liu, D.; Chater, C.C.C.; Yu, F.; Perez-Moreno, J. Tuber pseudohimalayense ascomata-compartments strongly select their associated bacterial microbiome from nearby pine forest soils independently of their maturation stage. Pedobiologia 2021, 87–88, 150743. [Google Scholar] [CrossRef]
- Naumova, N.B.; Belanov, I.P.; Alikina, T.Y.; Kabilov, M.R. Undisturbed soil pedon under birch forest: Characterization of microbiome in genetic horizons. Soil Syst. 2021, 5, 14. [Google Scholar] [CrossRef]
- Odendaal, M.-L.; Groot, J.A.; Hasrat, R.; Chu, M.L.J.; Franz, E.; Bogaert, D.; Bosch, T.; de Steenhuijsen Piters, W.A. Higher off-target amplicon detection rate in MiSeq v3 compared to v2 reagent kits in the context of 16S-rRNA-sequencing. Sci. Rep. 2022, 12, 16489. [Google Scholar] [CrossRef]
- Glenn, T.C.; Nilsen, R.A.; Kieran, T.J.; Sanders, J.G.; Bayona-Vásquez, N.J.; Finger, J.W.; Pierson, T.W.; Bentley, K.E.; Hoffberg, S.L.; Louha, S. Adapterama I: Universal stubs and primers for 384 unique dual-indexed or 147,456 combinatorially-indexed Illumina libraries (iTru & iNext). PeerJ 2019, 7, e7755. [Google Scholar] [CrossRef]
- Amplicon, P.C.R.; Clean-Up, P.C.R.; Index, P.C.R. 16s Metagenomic Sequencing Library Preparation; Illumina: San Diego, CA, USA, 2013; p. 21. [Google Scholar]
- Bolyen, E.; Rideout, J.R.; Dillon, M.R.; Bokulich, N.A.; Abnet, C.C.; Al-Ghalith, G.A.; Alexander, H.; Alm, E.J.; Arumugam, M.; Asnicar, F. Reproducible, interactive, scalable and extensible microbiome data science using QIIME 2. Nat. Biotechnol. 2019, 37, 852–857. [Google Scholar] [CrossRef]
- Callahan, B.J.; McMurdie, P.J.; Rosen, M.J.; Han, A.W.; Johnson, A.J.A.; Holmes, S.P. DADA2: High-resolution sample inference from Illumina amplicon data. Nat. Methods 2016, 13, 581–583. [Google Scholar] [CrossRef] [PubMed]
- Robeson, M.S.; O’Rourke, D.R.; Kaehler, B.D.; Ziemski, M.; Dillon, M.R.; Foster, J.T.; Bokulich, N.A. RESCRIPt: Reproducible sequence taxonomy reference database management. PLoS Comput. Biol. 2021, 17, e1009581. [Google Scholar] [CrossRef]
- Bokulich, N.A.; Kaehler, B.D.; Rideout, J.R.; Dillon, M.; Bolyen, E.; Knight, R.; Huttley, G.A.; Gregory Caporaso, J. Optimizing taxonomic classification of marker-gene amplicon sequences with QIIME 2’s q2-feature-classifier plugin. Microbiome 2018, 6, 90. [Google Scholar] [CrossRef]
- Abarenkov, K.; Zirk, A.; Piirmann, T.; Pöhönen, R.; Ivanov, F.; Nilsson, R.H.; Kõljalg, U. UNITE QIIME Release for Fungi; UNITE Community: Saline, MI, USA, 2020. [Google Scholar] [CrossRef]
- Mirarab, S.; Nguyen, N.; Warnow, T. SEPP: SATé-enabled phylogenetic placement. In Biocomputing 2012; World Scientific: Singapore, 2012; pp. 247–258. [Google Scholar] [CrossRef]
- Katoh, K.; Standley, D.M. MAFFT multiple sequence alignment software version 7: Improvements in performance and usability. Mol. Biol. Evol. 2013, 30, 772–780. [Google Scholar] [CrossRef]
- Shannon, C.E. A mathematical theory of communication. Bell Syst. Tech. J. 1948, 27, 379–423. [Google Scholar] [CrossRef]
- Morris, E.K.; Caruso, T.; Buscot, F.; Fischer, M.; Hancock, C.; Maier, T.S.; Meiners, T.; Müller, C.; Obermaier, E.; Prati, D. Choosing and using diversity indices: Insights for ecological applications from the German Biodiversity Exploratories. Ecol. Evol. 2014, 4, 3514–3524. [Google Scholar] [CrossRef]
- Sorenson, T. A method of establishing groups of equal amplitude in plant sociology based on similarity of species content and its application to analyses of the vegetation on Danish commons. Biol. Skrifter. 1948, 5, 1. [Google Scholar]
- French, A.; Macedo, M.; Poulsen, J.; Waterson, T.; Yu, A.; Multivariate Analysis of Variance (MANOVA). San Francisco State University 2008. Available online: https://www.academia.edu/7751963/Multivariate_Analysis_of_Variance_MANOVA (accessed on 12 April 2025).
- Legendre, P.; Anderson, M.J. Distance-based redundancy analysis: Testing multispecies responses in multifactorial ecological experiments. Ecol. Monogr. 1999, 69, 1–24. [Google Scholar] [CrossRef]
- Douglas, G.M.; Maffei, V.J.; Zaneveld, J.R.; Yurgel, S.N.; Brown, J.R.; Taylor, C.M.; Huttenhower, C.; Langille, M.G. PICRUSt2 for prediction of metagenome functions. Nat. Biotechnol. 2020, 38, 685–688. [Google Scholar] [CrossRef]
- Louca, S.; Parfrey, L.W.; Doebeli, M. Decoupling function and taxonomy in the global ocean microbiome. Science 2016, 353, 1272–1277. [Google Scholar] [CrossRef]
- Kanehisa, M.; Goto, S. KEGG: Kyoto encyclopedia of genes and genomes. Nucleic Acids Res. 2000, 28, 27–30. [Google Scholar] [CrossRef] [PubMed]
- Liu, C.; Cui, Y.; Li, X.; Yao, M. microeco: An R package for data mining in microbial community ecology. FEMS Microbiol. Ecol. 2021, 97, fiaa255. [Google Scholar] [CrossRef]
- Põlme, S.; Abarenkov, K.; Henrik Nilsson, R.; Lindahl, B.D.; Clemmensen, K.E.; Kauserud, H.; Nguyen, N.; Kjøller, R.; Bates, S.T.; Baldrian, P. FungalTraits: A user-friendly traits database of fungi and fungus-like stramenopiles. Fungal Divers. 2020, 105, 1–16. [Google Scholar] [CrossRef]
- Nguyen, N.H.; Song, Z.; Bates, S.T.; Branco, S.; Tedersoo, L.; Menke, J.; Schilling, J.S.; Kennedy, P.G. FUNGuild: An open annotation tool for parsing fungal community datasets by ecological guild. Fungal Ecol. 2016, 20, 241–248. [Google Scholar] [CrossRef]
- Parks, D.H.; Tyson, G.W.; Hugenholtz, P.; Beiko, R.G. STAMP: Statistical analysis of taxonomic and functional profiles. Bioinformatics 2014, 30, 3123–3124. [Google Scholar] [CrossRef]
- Edelman, A.; Rao, N.R. Random matrix theory. Acta Numer. 2005, 14, 233–297. [Google Scholar] [CrossRef]
- Newman, M.E. Fast algorithm for detecting community structure in networks. Phys. Rev. E—Stat. Nonlinear Soft Matter Phys. 2004, 69, 066133. [Google Scholar] [CrossRef]
- Yuan, M.M.; Guo, X.; Wu, L.; Zhang, Y.; Xiao, N.; Ning, D.; Shi, Z.; Zhou, X.; Wu, L.; Yang, Y. Climate warming enhances microbial network complexity and stability. Nat. Clim. Change 2021, 11, 343–348. [Google Scholar] [CrossRef]
- Diniz-Filho, J.A.F.; Soares, T.N.; Lima, J.S.; Dobrovolski, R.; Landeiro, V.L.; Telles, M.P.d.C.; Rangel, T.F.; Bini, L.M. Mantel test in population genetics. Genet. Mol. Biol. 2013, 36, 475–485. [Google Scholar] [CrossRef]
- Guimera, R.; Amaral, L.A.N. Cartography of complex networks: Modules and universal roles. J. Stat. Mech. Theory Exp. 2005, 2005, P02001. [Google Scholar] [CrossRef]
- Jiao, S.; Yang, Y.; Xu, Y.; Zhang, J.; Lu, Y. Balance between community assembly processes mediates species coexistence in agricultural soil microbiomes across eastern China. ISME J. 2020, 14, 202–216. [Google Scholar] [CrossRef] [PubMed]
- Park, J.H.; Duan, L.; Kim, B.; Mitchell, M.J.; Shibata, H. Potential effects of climate change and variability on watershed biogeochemical processes and water quality in Northeast Asia. Environ. Int. 2010, 36, 212–225. [Google Scholar] [CrossRef] [PubMed]
- Sohng, J.; Han, A.R.; Jeong, M.A.; Park, Y.; Park, B.B.; Park, P.S. Seasonal pattern of decomposition and N, P, and C dynamics in leaf litter in a Mongolian oak forest and a Korean pine plantation. Forests 2014, 5, 2561–2580. [Google Scholar] [CrossRef]
- Nakayama, M.; Tateno, R. Solar radiation strongly influences the quantity of forest tree root exudates. Trees 2018, 32, 871–879. [Google Scholar] [CrossRef]
- Jakoby, G.; Rog, I.; Megidish, S.; Klein, T. Enhanced root exudation of mature broadleaf and conifer trees in a Mediterranean forest during the dry season. Tree Physiol. 2020, 40, 1595–1605. [Google Scholar] [CrossRef]
- Sun, S.; Li, S.; Avera, B.N.; Strahm, B.D.; Badgley, B.D. Soil bacterial and fungal communities show distinct recovery patterns during forest ecosystem restoration. Appl. Environ. Microbiol. 2017, 83, e00966-17. [Google Scholar] [CrossRef]
- Urbanová, M.; Šnajdr, J.; Baldrian, P. Composition of fungal and bacterial communities in forest litter and soil is largely determined by dominant trees. Soil Biol. Biochem. 2015, 84, 53–64. [Google Scholar] [CrossRef]
- Li, W.-Q.; Huang, Y.-X.; Chen, F.-S.; Liu, Y.-Q.; Lin, X.-F.; Zong, Y.-Y.; Wu, G.-Y.; Yu, Z.-R.; Fang, X.-M. Mixing with broad-leaved trees shapes the rhizosphere soil fungal communities of coniferous tree species in subtropical forests. For. Ecol. Manag. 2021, 480, 118664. [Google Scholar] [CrossRef]
- Hobbie, E.A.; Agerer, R. Nitrogen isotopes in ectomycorrhizal sporocarps correspond to belowground exploration types. Plant Soil 2010, 327, 71–83. [Google Scholar] [CrossRef]
- López-Mondéjar, R.; Zühlke, D.; Becher, D.; Riedel, K.; Baldrian, P. Cellulose and hemicellulose decomposition by forest soil bacteria proceeds by the action of structurally variable enzymatic systems. Sci. Rep. 2016, 6, 25279. [Google Scholar] [CrossRef]
- Waters, C.M.; Bassler, B.L. Quorum sensing: Cell-to-cell communication in bacteria. Annu. Rev. Cell Dev. Biol. 2005, 21, 319–346. [Google Scholar] [CrossRef] [PubMed]
- Dong, Y.; Wang, Z.; Sun, H.; Yang, W.; Xu, H. The response patterns of arbuscular mycorrhizal and ectomycorrhizal symbionts under elevated CO2: A meta-analysis. Front. Microbiol. 2018, 9, 1248. [Google Scholar] [CrossRef] [PubMed]
- Nuccio, E.E.; Hodge, A.; Pett-Ridge, J.; Herman, D.J.; Weber, P.K.; Firestone, M.K. An arbuscular mycorrhizal fungus significantly modifies the soil bacterial community and nitrogen cycling during litter decomposition. Environ. Microbiol. 2013, 15, 1870–1881. [Google Scholar] [CrossRef] [PubMed]
- Fan, X.; Zhang, X.; Zhao, G.; Zhang, X.; Dong, L.; Chen, Y. Aerobic hydrogen-oxidizing bacteria in soil: From cells to ecosystems. Rev. Environ. Sci. Bio/Technol. 2022, 21, 877–904. [Google Scholar] [CrossRef]
- Ling, N.; Zhu, C.; Xue, C.; Chen, H.; Duan, Y.; Peng, C.; Guo, S.; Shen, Q. Insight into how organic amendments can shape the soil microbiome in long-term field experiments as revealed by network analysis. Soil Biol. Biochem. 2016, 99, 137–149. [Google Scholar] [CrossRef]
- Chen, Z.-J.; Liu, Y.-Q.; Li, Y.-Y.; Lin, L.-A.; Zheng, B.-H.; Ji, M.-F.; Li, B.L.; Han, X.-M. The seasonal patterns, ecological function and assembly processes of bacterioplankton communities in the Danjiangkou Reservoir, China. Front. Microbiol. 2022, 13, 884765. [Google Scholar] [CrossRef]
- Siles, J.A.; Margesin, R. Seasonal soil microbial responses are limited to changes in functionality at two Alpine forest sites differing in altitude and vegetation. Sci. Rep. 2017, 7, 2204. [Google Scholar] [CrossRef]
- Landi, P.; Minoarivelo, H.O.; Brännström, Å.; Hui, C.; Dieckmann, U. Complexity and stability of ecological networks: A review of the theory. Popul. Ecol. 2018, 60, 319–345. [Google Scholar] [CrossRef]
- Zhang, C.; Lei, S.; Wu, H.; Liao, L.; Wang, X.; Zhang, L.; Liu, G.; Wang, G.; Fang, L.; Song, Z. Simplified microbial network reduced microbial structure stability and soil functionality in alpine grassland along a natural aridity gradient. Soil Biol. Biochem. 2024, 191, 109366. [Google Scholar] [CrossRef]
- Hu, A.; Nie, Y.; Yu, G.; Han, C.; He, J.; He, N.; Liu, S.; Deng, J.; Shen, W.; Zhang, G. Diurnal temperature variation and plants drive latitudinal patterns in seasonal dynamics of soil microbial community. Front. Microbiol. 2019, 10, 674. [Google Scholar] [CrossRef]
- Yang, H.; Li, J.; Xiao, Y.; Gu, Y.; Liu, H.; Liang, Y.; Liu, X.; Hu, J.; Meng, D.; Yin, H. An integrated insight into the relationship between soil microbial community and tobacco bacterial wilt disease. Front. Microbiol. 2017, 8, 2179. [Google Scholar] [CrossRef] [PubMed]
- Tiessen, A.; Pérez-Rodríguez, P.; Delaye-Arredondo, L.J. Mathematical modeling and comparison of protein size distribution in different plant, animal, fungal and microbial species reveals a negative correlation between protein size and protein number, thus providing insight into the evolution of proteomes. BMC Res. Notes 2012, 5, 85. [Google Scholar] [CrossRef] [PubMed]
- Cheng, Y.; Zhou, L.; Liang, T.; Man, J.; Wang, Y.; Li, Y.; Chen, H.; Zhang, T. Deciphering rhizosphere microbiome assembly of Castanea henryi in plantation and natural forest. Microorganisms 2022, 10, 42. [Google Scholar] [CrossRef] [PubMed]
- Van Der Heijden, M.G.; Hartmann, M. Networking in the plant microbiome. PLoS Biol. 2016, 14, e1002378. [Google Scholar] [CrossRef]
- Wang, Y.; Wang, R.; Lu, B.; Guerin-Laguette, A.; He, X.; Yu, F. Mycorrhization of Quercus mongolica seedlings by Tuber melanosporum alters root carbon exudation and rhizosphere bacterial communities. Plant Soil 2021, 467, 391–403. [Google Scholar] [CrossRef]
- Deng, J.; Yin, Y.; Zhu, W.; Zhou, Y. Variations in soil bacterial community diversity and structures among different revegetation types in the Baishilazi Nature Reserve. Front. Microbiol. 2018, 9, 2874. [Google Scholar] [CrossRef]
- Lin, W.; Liu, L.; Liang, J.; Tang, X.; Shi, J.; Zhang, L.; Wu, P.; Lan, S.; Wang, S.; Zhou, Y. Changes of endophytic microbial community in Rhododendron simsii roots under heat stress and its correlation with leaf physiological indicators. Front. Microbiol. 2022, 13, 1006686. [Google Scholar] [CrossRef]
- Muratova, A.; Golubev, S.; Romanova, V.; Sungurtseva, I.; Nurzhanova, A. Effect of heavy-metal-resistant PGPR inoculants on growth, rhizosphere microbiome and remediation potential of miscanthus× giganteus in Zinc-contaminated Soil. Microorganisms 2023, 11, 1516. [Google Scholar] [CrossRef]
- Chen, Y.; Xi, J.; Xiao, M.; Wang, S.; Chen, W.; Liu, F.; Shao, Y.; Yuan, Z. Soil fungal communities show more specificity than bacteria for plant species composition in a temperate forest in China. BMC Microbiol. 2022, 22, 208. [Google Scholar] [CrossRef]
Disclaimer/Publisher’s Note: The statements, opinions and data contained in all publications are solely those of the individual author(s) and contributor(s) and not of MDPI and/or the editor(s). MDPI and/or the editor(s) disclaim responsibility for any injury to people or property resulting from any ideas, methods, instructions or products referred to in the content. |
© 2025 by the authors. Licensee MDPI, Basel, Switzerland. This article is an open access article distributed under the terms and conditions of the Creative Commons Attribution (CC BY) license (https://creativecommons.org/licenses/by/4.0/).