1. Introduction
Cutting wood with a high-performance CO
2 laser has a wide range of applications in the woodworking industry. Compared to sawing and milling, it is characterized by high precision, efficiency, and the ability to create cuts of different shapes. One of the advantages is that it is a contactless process, meaning there is no tool wear and no waste in the form of sawdust. The high precision and cut quality, along with the small heat-affected zone, position this method of material separation among promising technologies [
1].
The factors influencing the quality of the cut when using a CO
2 laser can be divided into several groups. The first group includes laser parameters such as power
P, cutting speed
v, beam diameter d, cutting angle, and energy density
. The quality of the cut is also related to the physical properties of the wood used, the anatomical direction of the cut, the number of annual rings, and the moisture content. From the first group, the most significant factors are
P,
v, and
E [
2,
3], while from the second group, the type of wood, cutting direction, and moisture content have the greatest impact [
4,
5,
6,
7,
8,
9,
10].
When using a CO
2 laser, two characteristic zones are formed in the material: the cutting kerf and the heat-affected zone [
11,
12]. Based on the values of the cutting kerf width on the upper surface WKU and the lower surface WKL, parameter
directly characterizes the quality of the cut. The optimal cutting conditions are those that result in a WKR value as close to 1 as possible [
13].
The type of wood used naturally has a significant impact on the cutting results; thus, many authors investigate the influence of the material type on the cutting kerf widths.
The authors of article [
14] focused on the influence of laser parameters on the cutting of bamboo wood. Other researchers in study [
15] applied CO
2 laser technology to cutting MDF, while others used this technology in the production of wood flooring [
16]. Another group of authors studied the influence of cutting speed, focal point position, and gas pressure on the characteristics of glued joints in beech wood [
17].
While analyzing the influence of laser parameters on the cutting result is important from a qualitative perspective, the decisive factor for practical laser cutting is the cut quality. Therefore, many researchers focus on optimizing the cutting process with respect to cutting quality. For spruce lumber, cutting optimization was studied by the authors of article [
10]. For composites of wood materials with polymers, the authors of article [
18] focused on this topic, and for engraving plywood and pine wood, the study is presented in article [
19].
Further research on the surface properties of wood after cutting was conducted by the authors of articles [
17,
20,
21].
Research into the influence of laser parameters on cutting results and subsequent tests is important, but this research only covers the range of powers and speeds obtained through measurements, which naturally does not include all possible cutting conditions for the given wood type—primarily for economic reasons. If the goal is to optimize the technology for a given type of wood across the entire range, there are two possible approaches.
The first approach is to cover the entire range of P and v parameters through measurements and experimentally determine which values of this parameter pair lead to an optimal cut. Naturally, for wood materials with a high degree of inhomogeneity and anisotropy, this approach results in a huge number of measurements, which of course increases costs.
The second approach is to use measurement data to predict how the cutting parameters will behave for new, unmeasured values of laser parameters. This can be done using standard mathematical regression models either linear or nonlinear, or—as is commonly used nowadays—by applying artificial neural networks (ANNs), which have few significant advantages over mathematical regression.
Those are that it is not needed to know exact mathematical formulas between output and inputs. Second is that the process is fully automatic and thus time effective. But most significant is that ANNs offer increased prediction accuracy versus mathematical regression models.
Just like with experimentally obtained data, artificial neural networks can be used for the same purposes, with the added benefit that they extend the range of use beyond the experimental values. The use of ANNs in the field of wood machining can be divided mainly into three areas: optimization of the cutting process, prediction of output properties based on the technological parameters of the process, and prediction of the final surface properties of the wood after processing. Of course, the use of ANNs is much broader and they are applied in various areas of materials engineering.
With this approach, various properties of the cut material are predicted. Cutting kerf widths and the widths of heat-affected zone in spruce wood, versus
P,
v, and AR were predicted in articles [
22,
23]. Energy consumption during wood processing [
24,
25], and noise emission during wood machining were predicted [
26]. They are also used as tools for in situ monitoring defect formation in industrial flooring materials, or as tools to minimize dust formation during wood processing [
27,
28]. However, such studies are relatively limited, as prediction is most useful when applied to the final product’s properties—such as predicting the physical and mechanical properties of wood based on density [
29] or predicting the mechanical properties of wood [
30].
A much more applicable use of ANNs is in the optimization of wood material processing using various technological methods. This approach is frequently used in CNC wood machining but also finds use in laser cutting and wood drilling, with the goal of minimizing time and costs while maintaining high cut quality [
31]. The process of wood machining using CNC technology was, for example, optimized for beech, chestnut, pine, and spruce wood depending on moisture content and anatomical grain direction in article [
32]. For walnut and ash wood, the authors in article [
33] optimized CNC machining parameters such as cutting speed, tool diameter, and spindle speed to achieve optimal cutting, reduce energy consumption, and save time. They were also used to optimize CO
2 laser cutting of spruce wood [
22], the drilling process for plywood materials [
34], milling of thermally treated and untreated wood [
35], and even in less common wood-processing technologies such as electrical discharge machining, where authors optimized the material removal rate [
36].
Once the wood processing technology is optimized, the process of final product development typically follows—more specifically, testing the surface properties of the material or physical properties of final product.
For example, the authors in article [
37] modeled the surface roughness of beech and spruce wood using ANN. In another study [
38], surface roughness for CNC machining of black poplar was predicted. Others modeled the surface roughness of glued pine panels processed by CNC machining [
39]. After gluing, of course, the bond strength is verified. ANN has also been used in this area, as in article [
40], where the authors modeled the strength of glued joints in larch wood impregnated with Immersol-Aqua and bonded using Klebit-303 adhesive.
As mentioned earlier, there are only a few studies dealing with the prediction of parameters of cut vs. laser parameters mainly for lower values of P regardless of cutting direction. As the cutting kerf is a direct result that provides information about the quality of a cut, full-scale optimization of these parameters versus laser parameters is crucial. It is important also because the quality of a cut directly affects the surface roughness of the wood and thus also the applicability of the sample after glueing. In short, the applicability of samples after CO2 cutting depends significantly on parameters of the cutting kerf.
The aim of this article is application of ANN prediction methods for full-scale optimization of cutting kerf widths WKU and WKL versus (P, v) for different wood species, and cutting directions. Prediction of cutting kerf widths is performed for P values up to 500 W, v values up to 50 mm·s−1 in parallel and perpendicular directions. The main difference with former published articles is in the scale of the wooden materials (only spruce wood was used in previous studies) and in studying the effects of the cutting direction on the quality of the cut. Based on the predicted values, we then determined the optimal values of the above-mentioned laser parameters P, v, and E for each wood type and each cutting direction. To optimize the cutting process, we also performed sensitivity analysis—examining how cutting direction, P, and v affect the kerf parameters, and how this influence changes with variations in energy density E. Such a study has not yet been conducted by other researchers in this field and contributes to the comprehensiveness of the chosen approach.
2. Materials and Methods
Experimental measurements were conducted on radial lumber samples of spruce, beech, and oak with dimensions
T ×
R ×
L (6 × 70 × 500) mm and average densities corresponding to an equilibrium moisture content of
w = 12%, as shown in
Table 1. This moisture content is used in a majority of articles about laser cutting of wood [
2,
10,
16,
19,
21,
22,
23,
27,
28,
32,
36,
37,
39]. Before cutting, the surface of the samples was sanded using P 120 grit sandpaper.
The samples were cut using a CO
2 laser beam with a wavelength of 10.6 µm, both along and across the grain, as illustrated in
Figure 1. Focal positions for all samples were on the upper surface. Four laser power settings were used, 40%, 60%, 80%, and 100% power, corresponding to power values of
P = (54, 81, 108, and 135) W and four cutting speeds
v = (5, 10, 15, 20) mm·s
−1 were applied, with a constant beam diameter of d = 0.15 mm. For each parameter combination, four parallel cuts of 50 mm in length were made in both anatomical directions.
We used a CO2 laser with a nominal P value equal to 135 W to cut through samples in every measurement. The proper value of P depends on the thickness you want to cut. If you can use a low-power laser to cut to the desired thickness, then it is not necessary to use a high-power laser. A higher value of P also increases costs.
The cutting kerf parameters were measured using the VHX-H5M software (
https://www.keyence.com.cn/products/microscope/digital-microscope/vhx-7000/models/vhx-h5m/, accessed on 28 April 2025), which is part of the Keyence VHX-7000 digital microscope (Keyence Corporation, Osaka, Japan). For each combination of cutting parameters, 30 measurements of kerf width and the heat-affected zone on the upper and lower sides of the samples were taken. The values of the WKR parameter were then calculated according to the defined relationship. All other laser parameters were the same for all measurements.
ANNs in this study are used to predict WKU and WKL values for unmeasured values of P and v, independently for cutting direction for each type of wood material separately. The ANN is then used for the optimization of the CO2 laser cutting process, depending on the cutting direction and the type of wood used.
To predict these properties, the first step is to train the neural networks using experimental data, ensuring a minimal sum of squares from the measured WKU and WKL values and to achieve a high value of correlation coefficient r.
The routine for applying artificial neural networks in Statistica 12.0 software is as follows: the regression mode for ANN is applied to the input data, and then the five best networks are evaluated based on prediction accuracy. The best network is then selected, which typically shows the lowest value of mean absolute percentage error MAPE (%) and the highest correlation coefficient r between the measured and predicted data.
3. Results
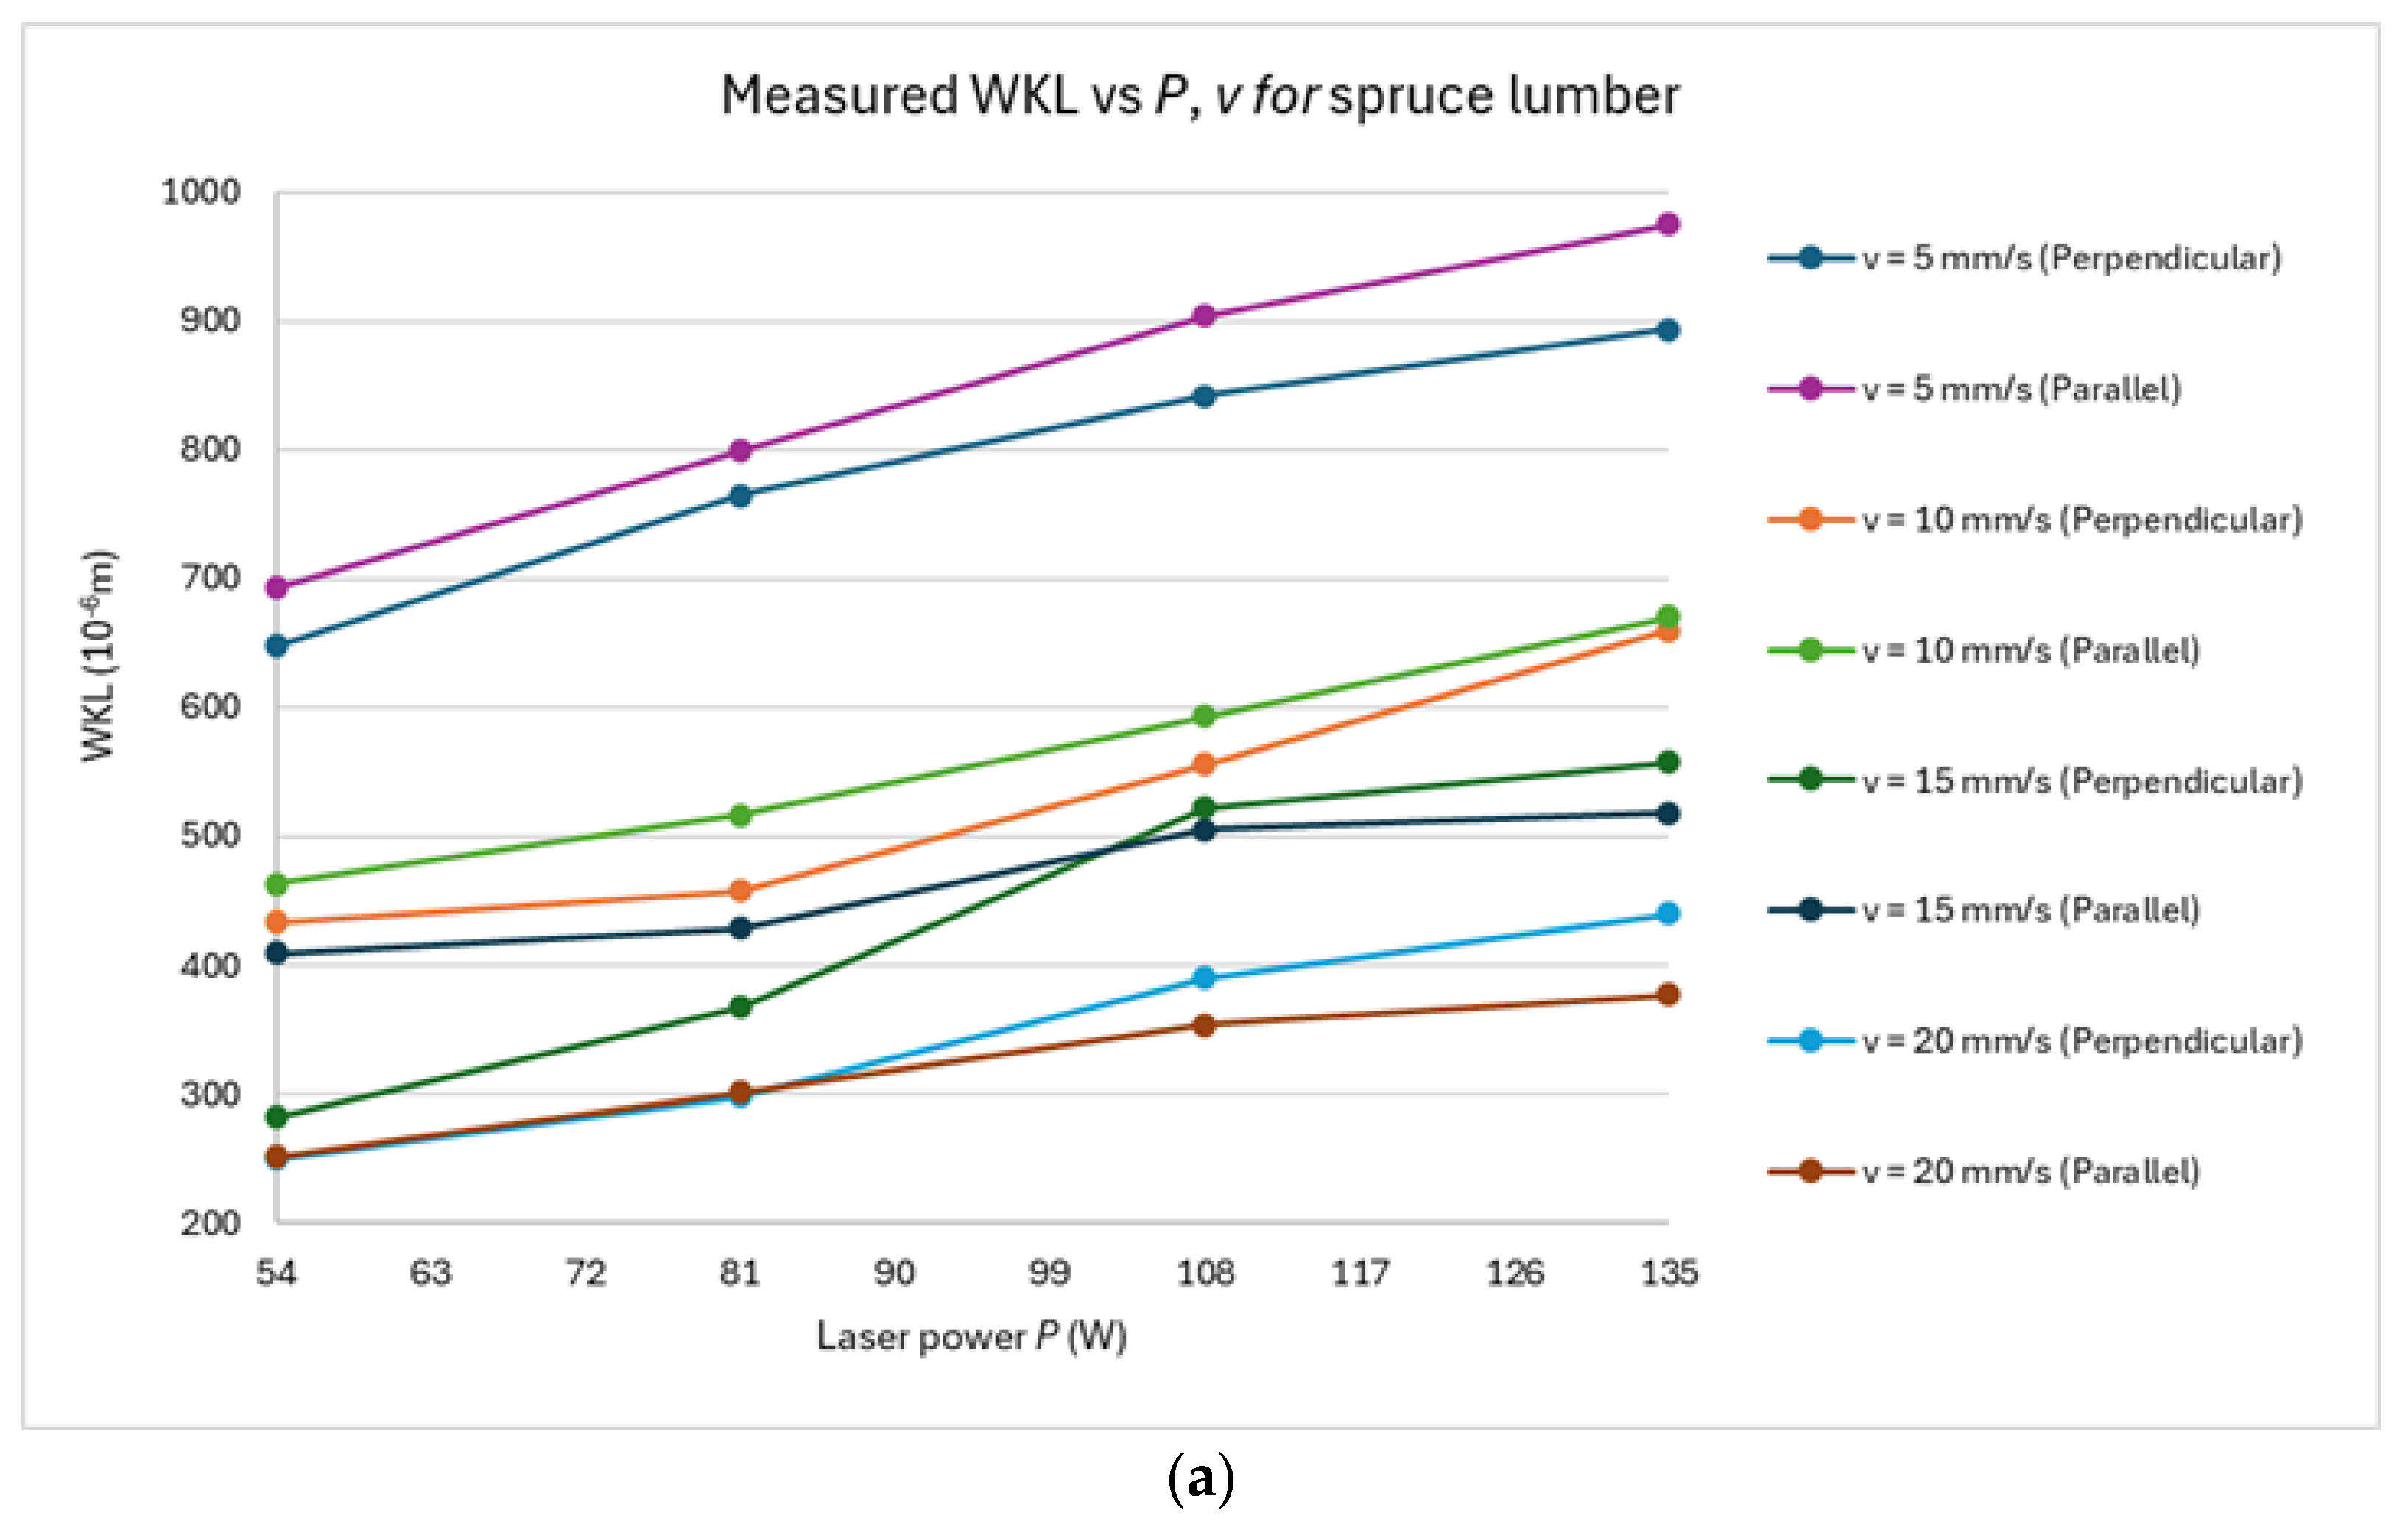
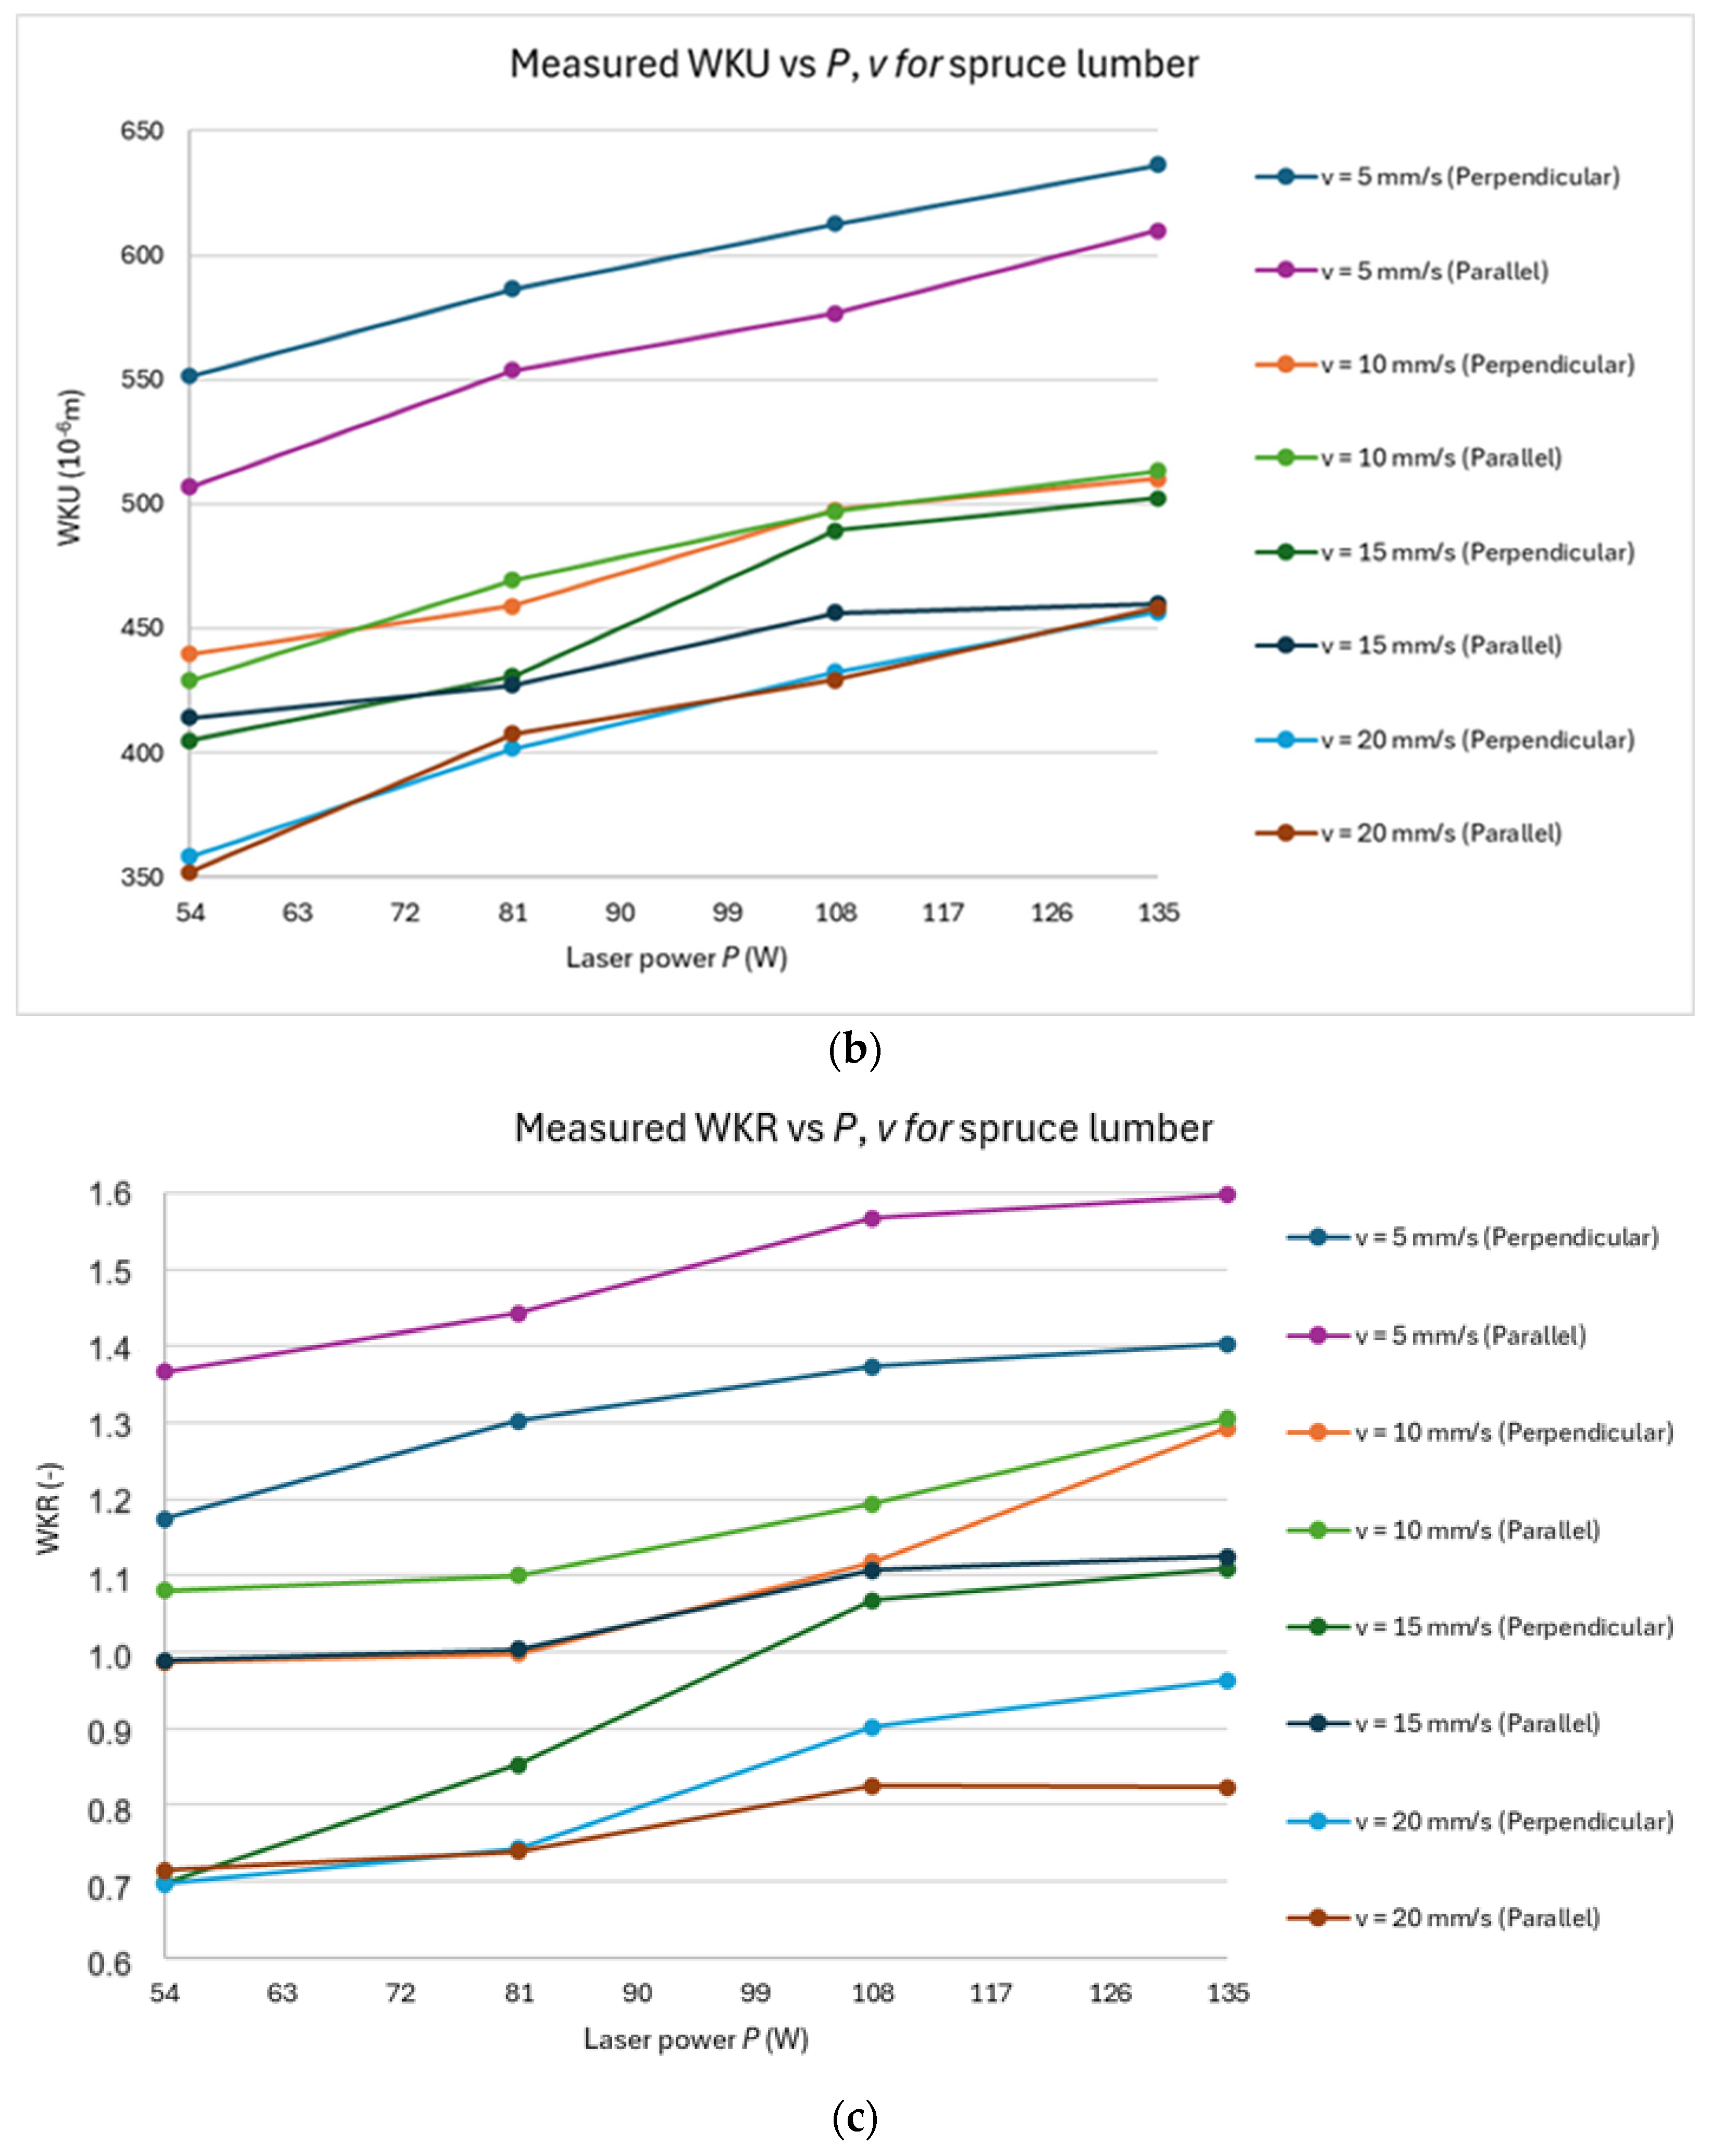
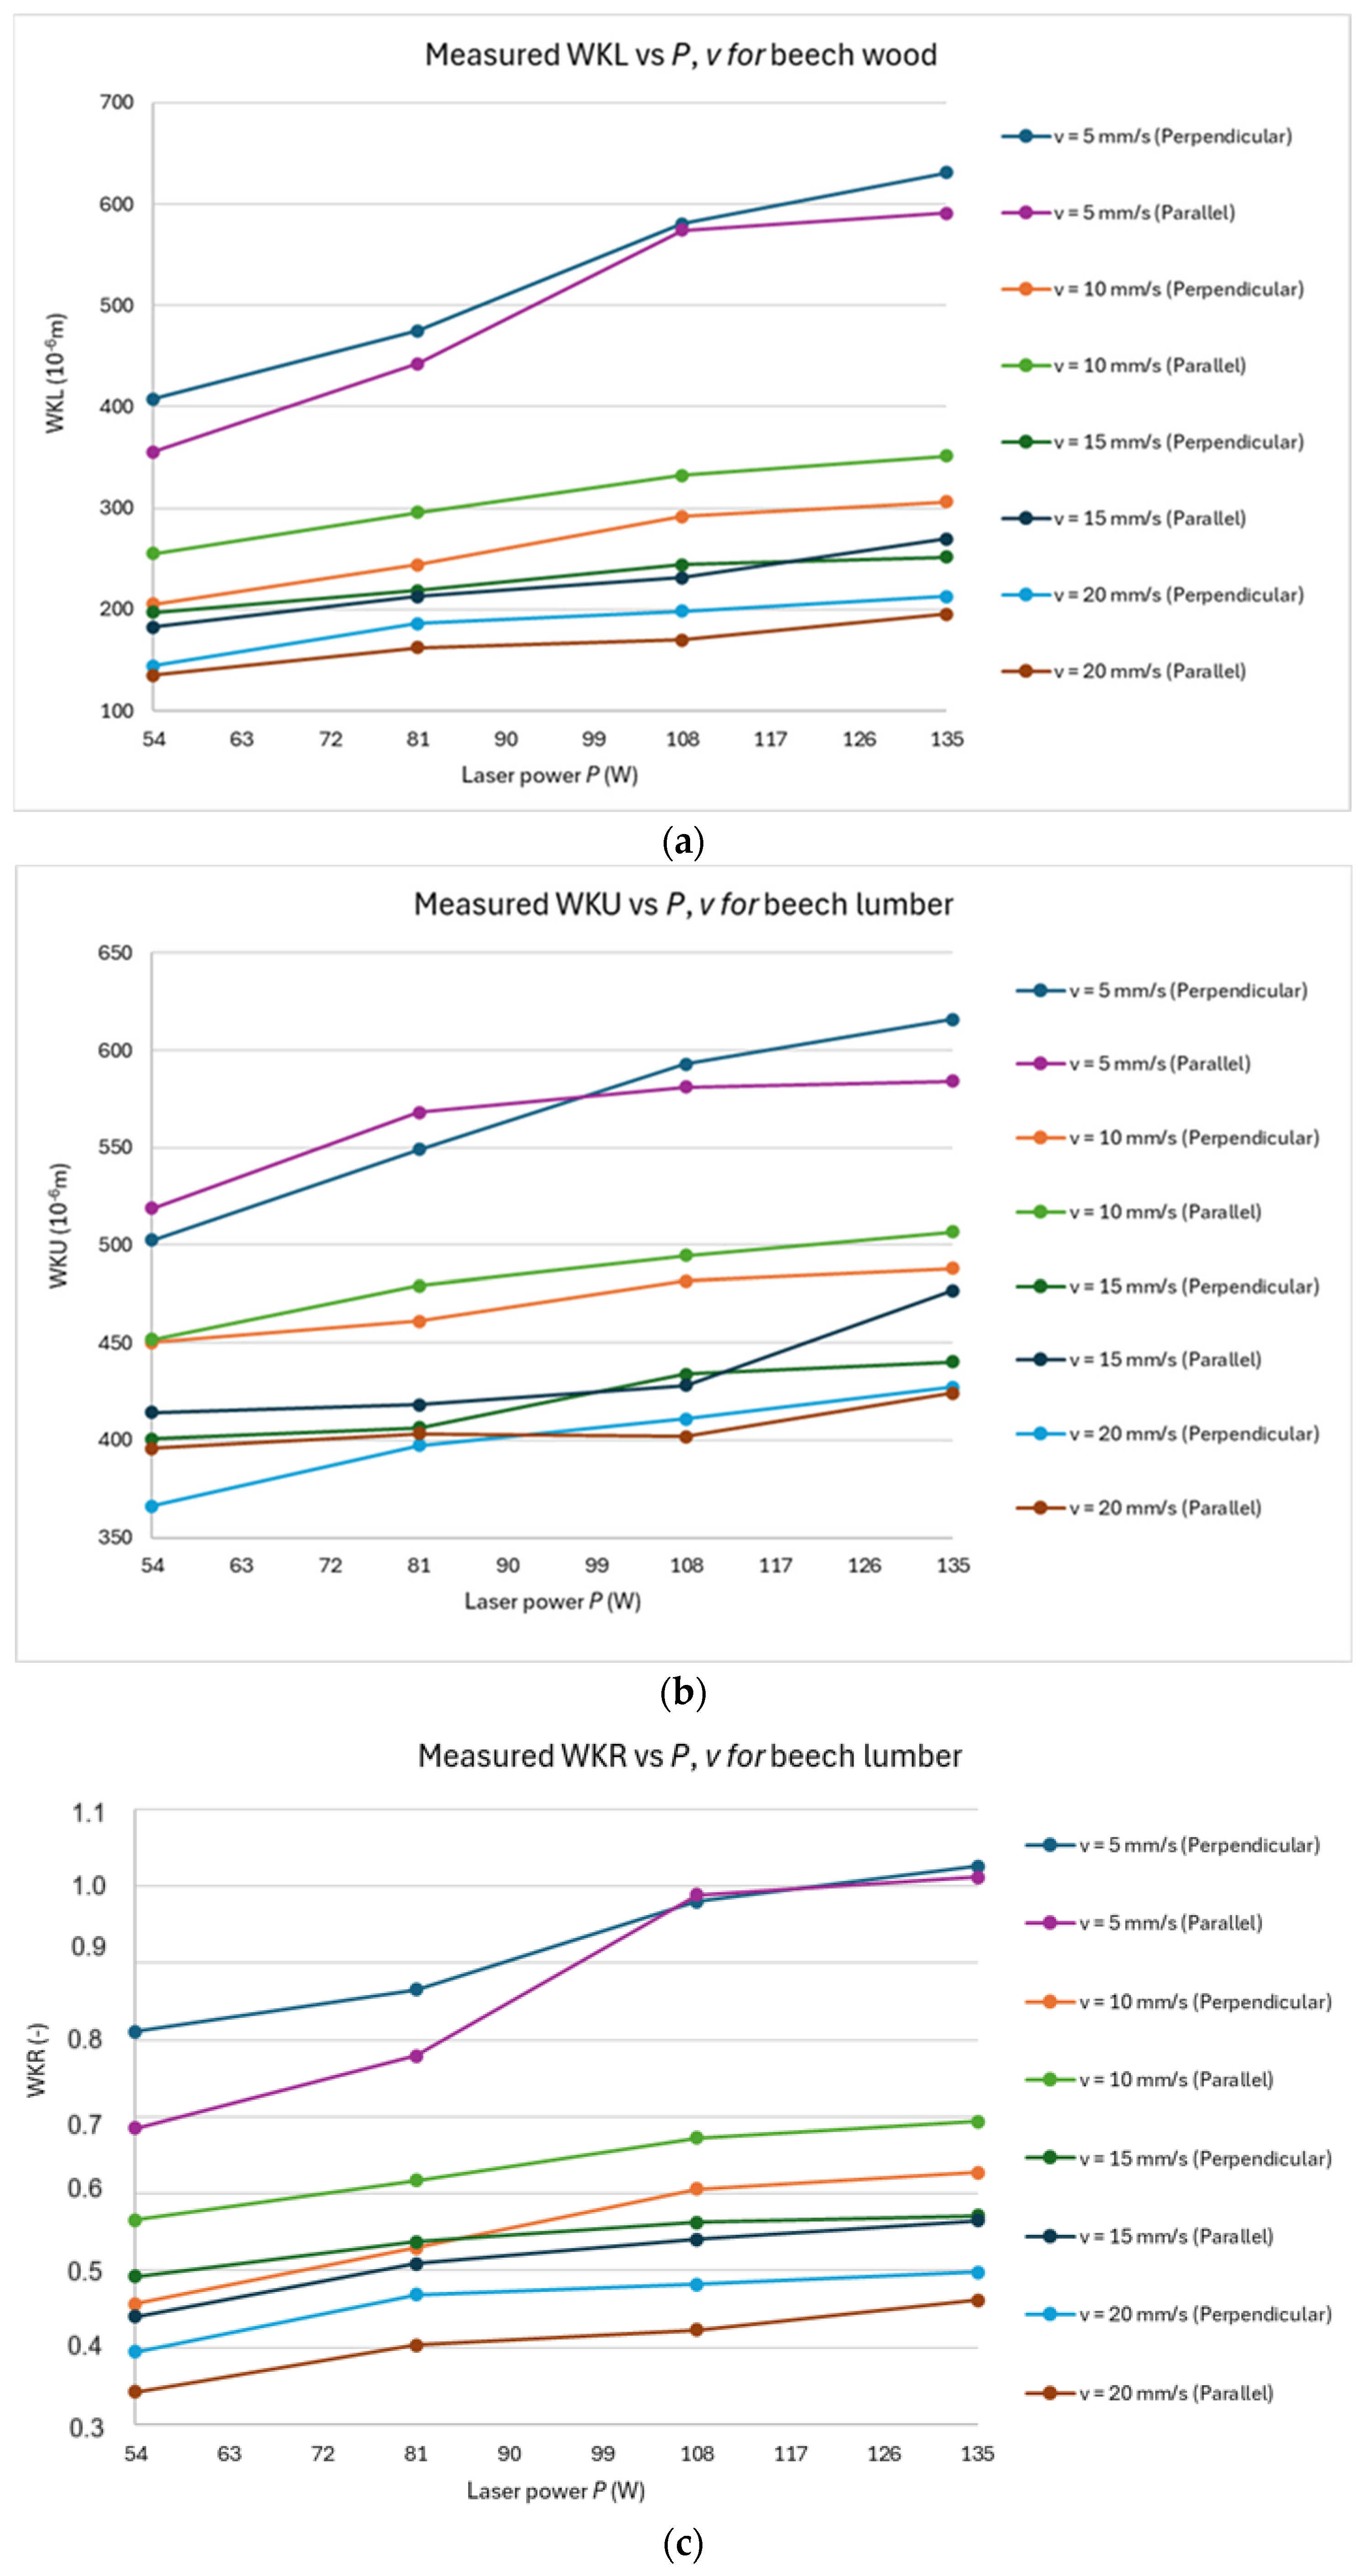
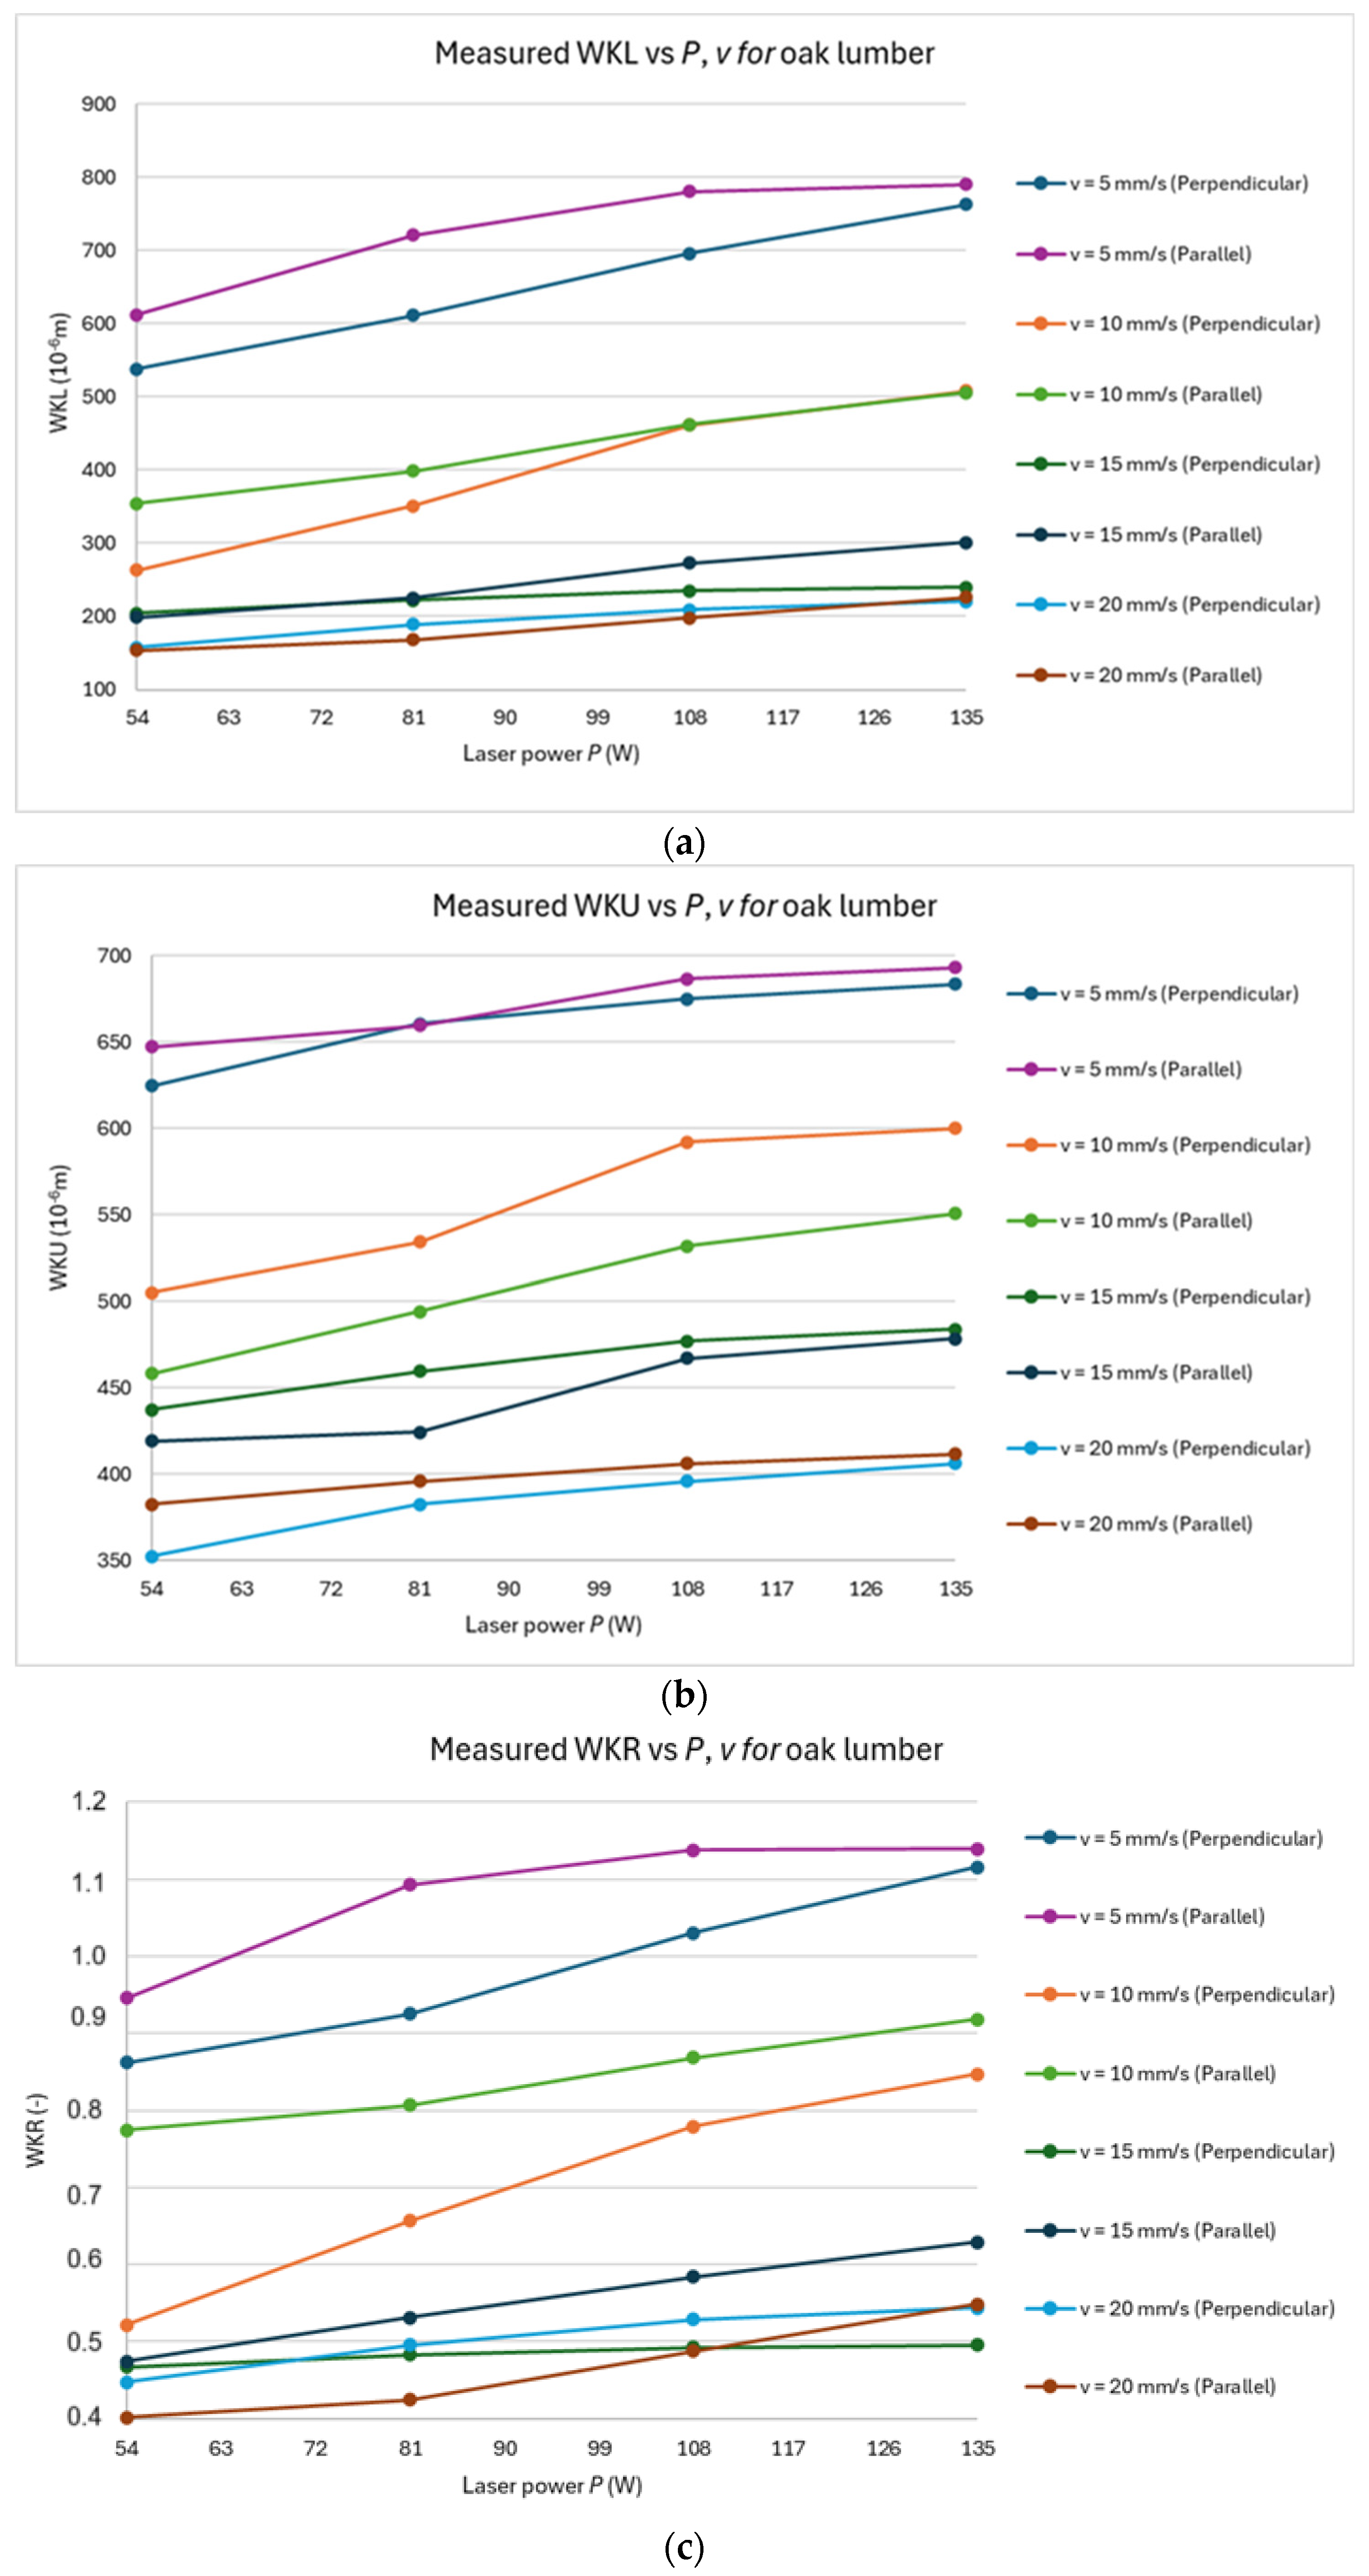
3.1. Measured Data
Figure 2a–c show the response graphs for WKL, WKU, and WKR of spruce lumber as a function of
P and
v for experimental values. Similarly
Figure 3a–c and
Figure 4a–c present the results for beech and oak lumber also for experimental values of
P,
v.
Figure 2,
Figure 3 and
Figure 4 show the changing cutting parameters as a function of
P and
v for all materials, but independently of the cutting direction. From these figures, parts labeled (a) and (b) were measured, and (c) for WKR was calculated.
The figures show that WKL, in contrast to WKU, as a function of P and v, does not contain breakpoints; thus, the effect of P and v is monotonic within the measured values.
For WKU, except for oak lumber, it is observed that the curve bends even within the range of the measured values, indicating a change in the influence of P and v on this property.
Further interesting facts arise from the dependencies for WKR. It is seen that the average value of WKR for spruce is at the level of 1.1 (thus above the optimal value), and for beech and oak, it is 0.68 and 0.8, respectively (thus below the optimal value). This means that for spruce, an optimal cut is achieved at lower values of E, whereas for beech and oak, higher values of E are required. This implies that wood with lower density (spruce) is optimally cut with a smaller value of E, while wood with higher density is better cut with a higher value of E. This fact stems from the increased thermal conductivity of denser wood. Higher thermal conductivity leads to a faster dissipation of heat from the cutting zone, thus requiring more energy to achieve the desired cutting kerf width.
3.2. Neural Network Training on Measured Data
A very useful piece of information for determining the predicted values for unmeasured P and v values is the sensitivity coefficient for the inputs, i.e., the degree of influence of P, v, and cutting direction on the output property for each type of wood separately.
The statistical parameters of the best networks for each type of wood are summarized in
Table 2,
Table 3 and
Table 4. The tables also show the labels of the best networks. All the best neural networks used error backpropagation algorithms as a training method with BFGS Quasi-Newton training algorithms. Data were divided into training, validation, and testing groups with the ratio 70:15:15. The convergence criterion was the sum of squares.
From
Table 2,
Table 3 and
Table 4, the correlation coefficient
r ranges from 0.931 to 0.995. The mean deviation between the measured and predicted values for the independent parameters WKL and WKU is between 2 and 4% for WKL and between 1 and 2% for WKU. Such error values for the ANN model are at the lower boundary of ANN usage in the woodworking industry, as described in works [
28,
37,
38]. Based on this, it can be concluded that the evaluated best networks are valid and capable of predicting the cutting kerf parameters even for unmeasured values of
P and
v.
With relatively lower values of the correlation coefficient r, it should be noted that this is between 94% and 99% for the independent variables WKL and WKU, which also means that the ANN models used can be considered very accurate. In general, it can be said that the measurement errors and network errors are still very low compared to the usual variations in material properties of wood. This is especially the case when referring to properties that are directly dependent on the input values.
For different batches of the same material, fluctuations in densities can be higher or equal or even lower, as shown in
Table 1. But the effect of density fluctuations together with the effect of materials’ inhomogeneity and anisotropy can describe only remaining percents from r
2 value to 1. This is for WKU at most 11.5% for beech and oak. For WKL, it is at most 3.5%. Both effects are much less than the effect of
P,
v, and cutting direction. Here, it must be mentioned that anisotropy and inhomogeneity errors induced by material are in general for wood materials significantly higher than for polymers, metals, or composites.
The sensitivity coefficient values are a result of the training process itself. These values can be considered valid only if the selected best networks are considered valid, which is the case here.
Table 5 shows the relative influences of
P,
v, and cutting direction on the cutting kerf widths for all wood species.
From
Table 5, the cutting direction has a significant impact only for oak wood. At low values of
v and
P, the cutting speed has a greater effect on the final cutting properties. This aligns with the fact that while laser power loses its effect on the cutting kerf width at higher values, increasing cutting speed decreases the kerf width in a nonlinear manner. This has been observed by many authors [
1,
4,
9,
18,
19,
22,
23].
3.3. ANN Prediction
Based on the training of neural networks on experimental data, we predicted the effects of P, v, and cutting direction on the values of the WKL and WKU and then computed values of WKR for unmeasured values of laser parameters P, v. The same statistical parameters apply to these predictions as for the training of the network.
The following sections will present predictions of WKL, WKU, and WKR, the results of statistical tests for characterizing cutting direction effects on WKU, WKL, and WKR (in the form of F-test and
t-test results and box whisker plots), and the optimized values of the monitored parameters. As energy density
E is a crucial parameter of cut quality, we present the values in
Table 6.
The experimental
E values are highlighted in red, while the values obtained from the prediction models are in black. Values of
v are listed vertically in the first column and values of
P horizontally in the first row, both in bold font. Values of
E are at the cross-section of the row and the column. All predicted results of WKU, WKL, and WKR are valid in the interval of
E values in
Table 6 and thus from 7 to 667 MJ·m
−2 for a continuous CO
2 laser.
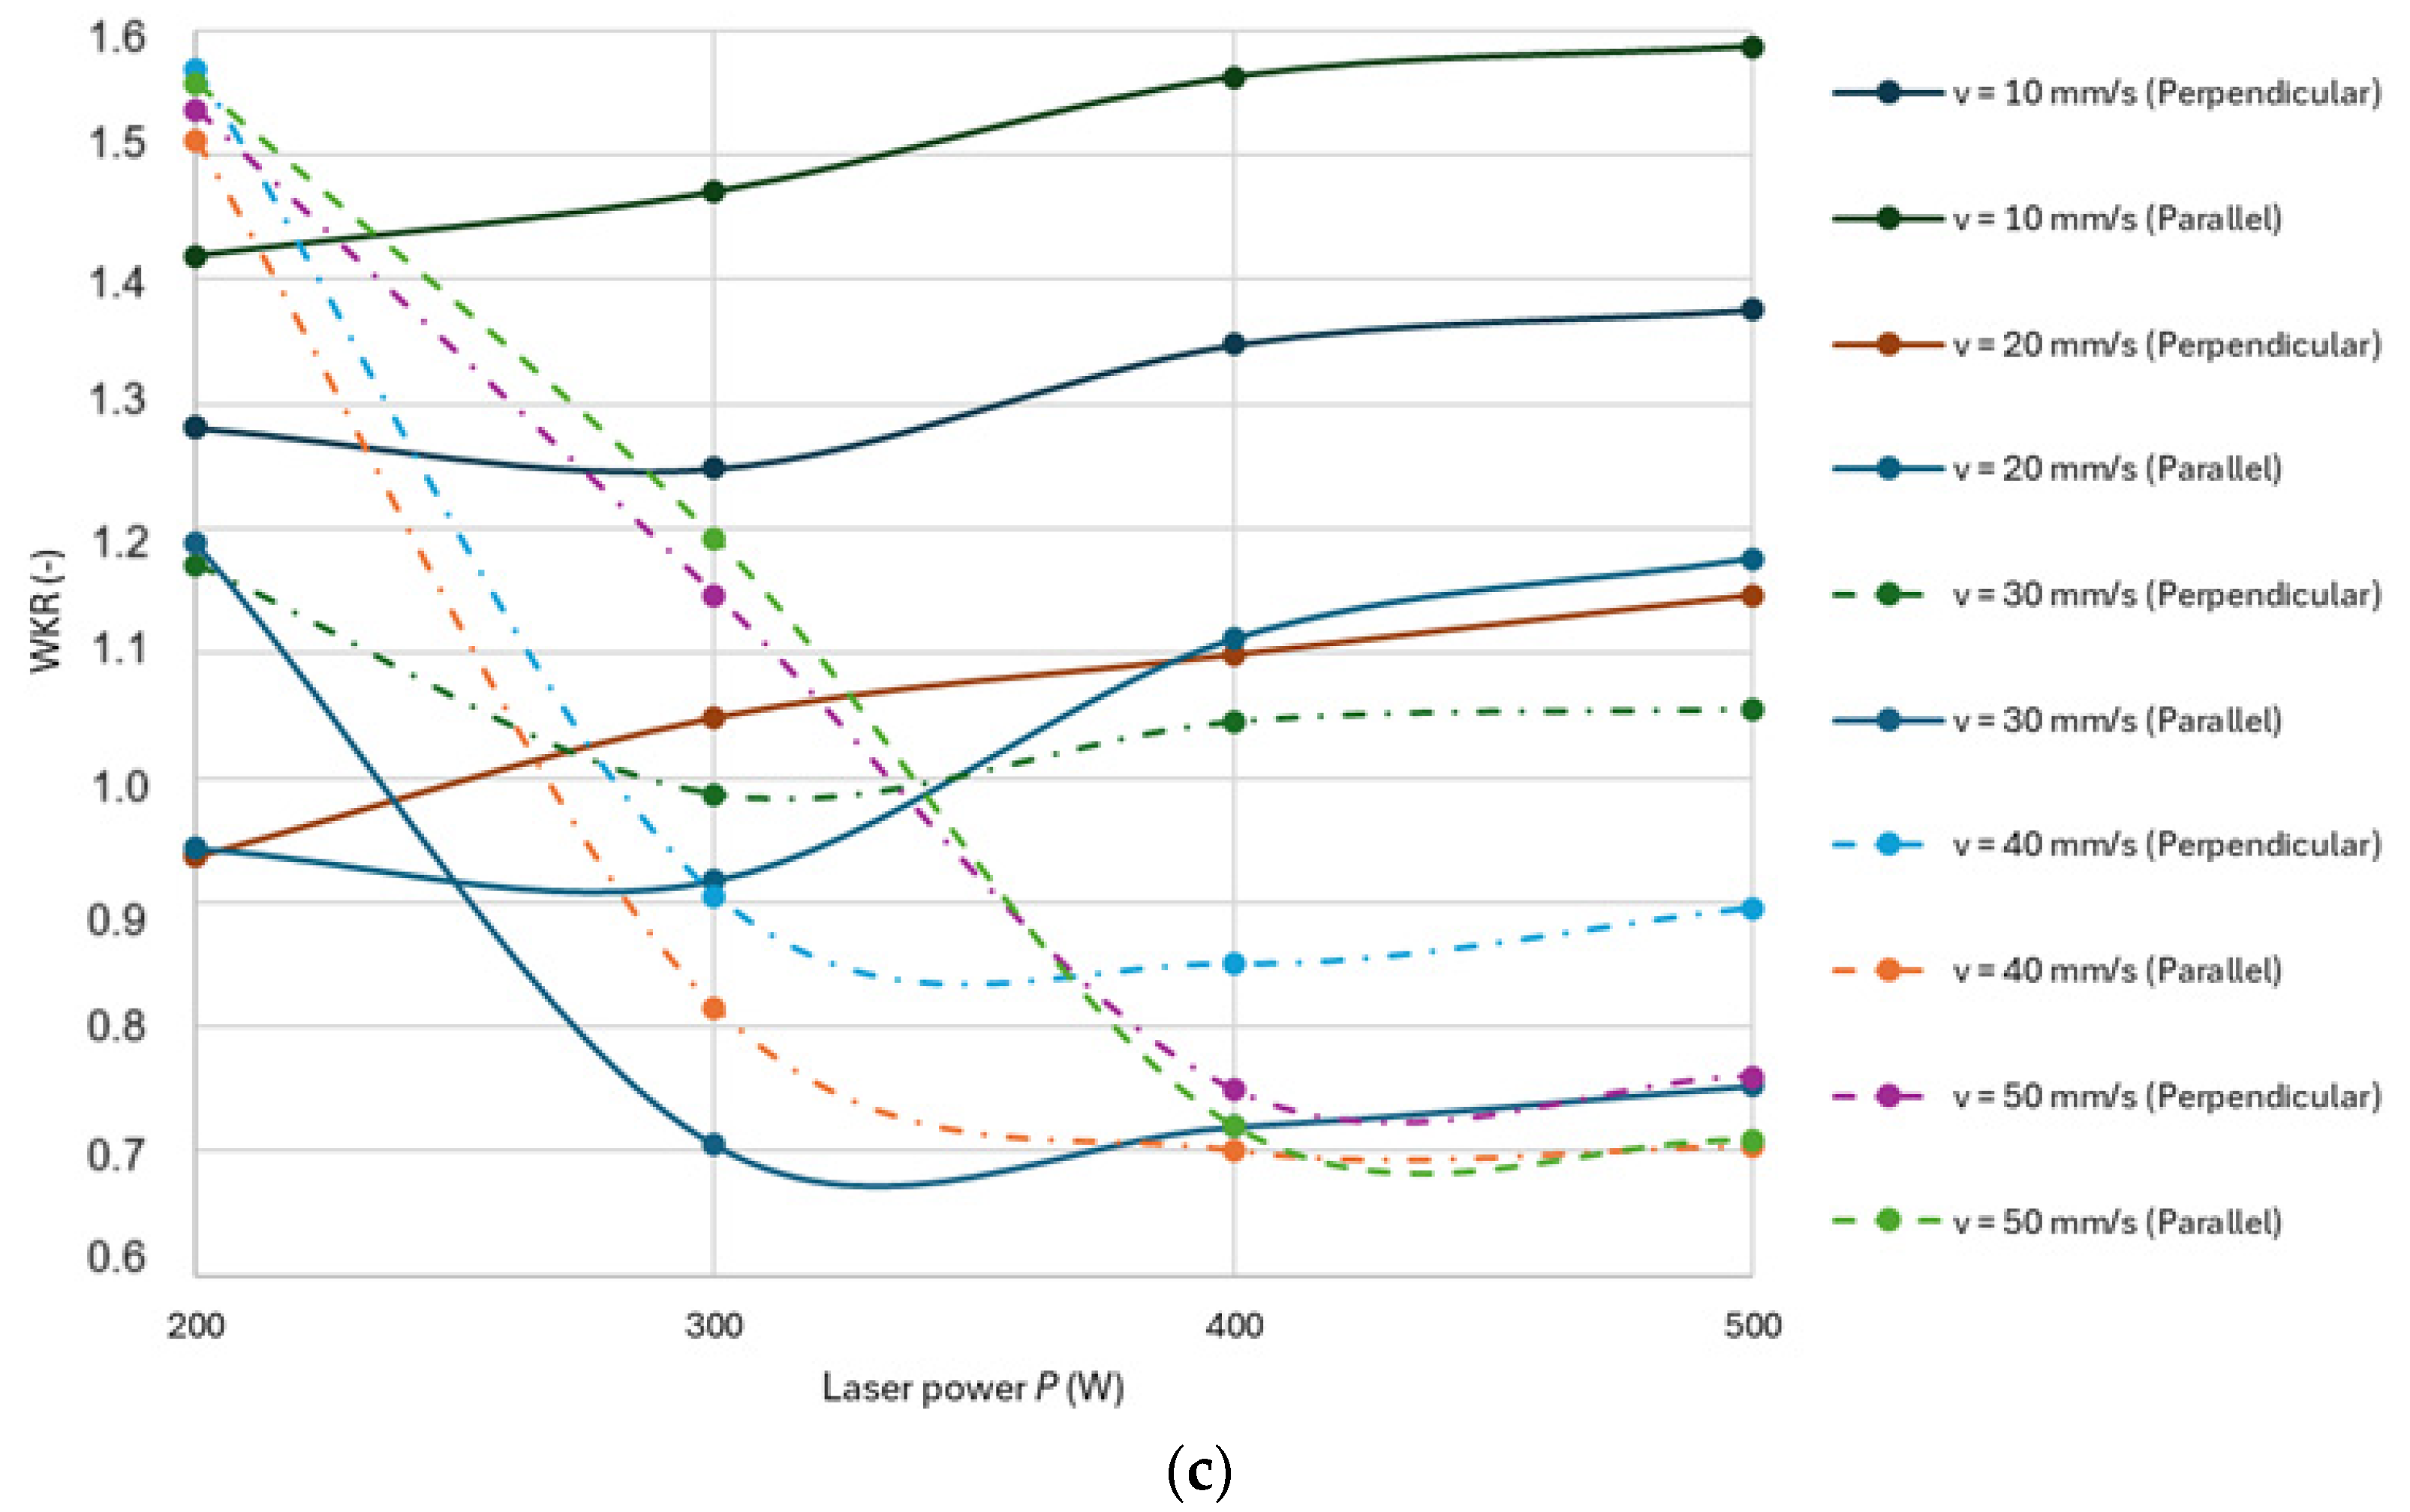
3.4. ANN Predictions for Spruce
The following section presents the prediction results for spruce wood. In
Figure 5a–c, the dependencies of WKL, WKU, and WKR versus
P,
v, and cutting direction are shown.
From
Figure 5a–c, the following can be concluded:
The WKU, WKL values decrease non-linearly with
v, which has been observed by many other authors [
7,
10,
12,
14,
15,
19,
22,
23].
Values of WKU and WKL increase exponentially with power and stabilize with the
P value at the 400 W level, which is also a typical trend [
3,
10,
14,
19,
22,
23].
WKR also stabilizes for higher laser power levels due to the definition.
The optimal WKR value is found at the middle point between the values of P and v.
For v = 10 mm·s−1, the WKR ratio reaches a value significantly higher than 1, which is not optimal.
On the other hand, as v is higher than 30 mm·s−1, the WKR value decreases significantly below 1, which is also not optimal.
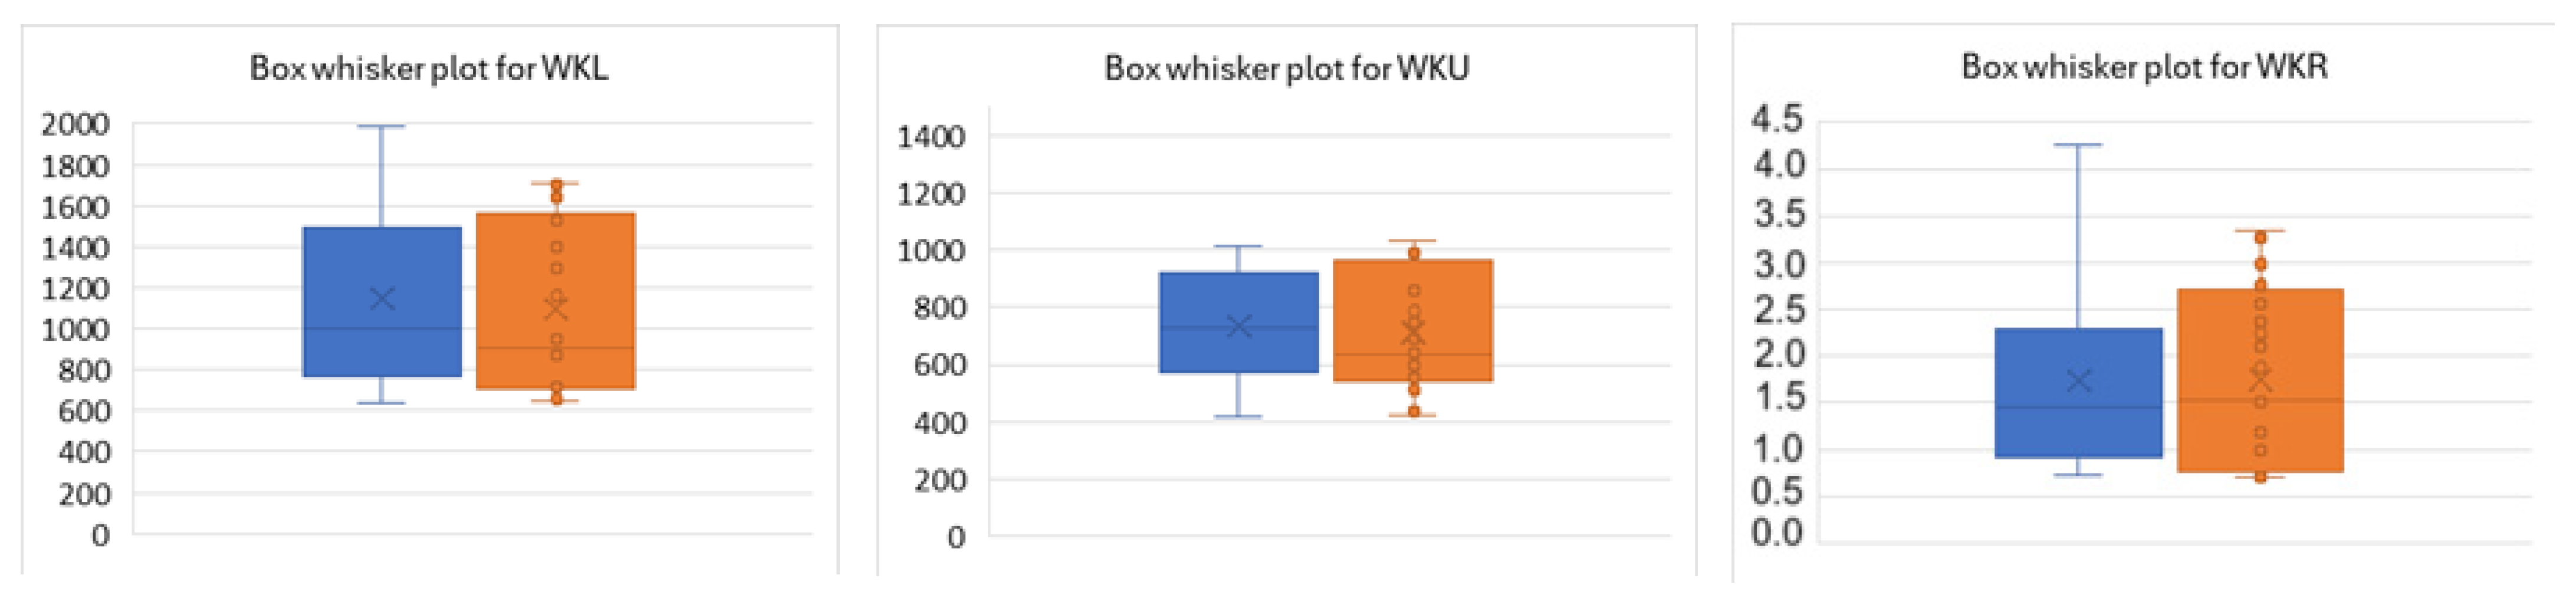
Regarding the research conducted in two mutually perpendicular anatomical directions, attention is also paid to the effect of cutting direction on the wood at various P and v values.
The results of the analysis are shown in the form of box whisker plots for WKL, WKU, and WKR in
Figure 6. Subsequently, in
Table 7, the probability values of variance and mean equalities for WKL, WKU, and WKR are given for laser powers ranging from 200 to 500 W and cutting speeds from 10 to 50 mm·s
−1. The blue boxes correspond to the cutting direction across the fibres, and the orange boxes correspond to the cutting direction along the fibres.
From
Figure 6, the differences in cutting kerf parameters for various cutting directions are not statistically significant. Additionally, it is observed that the cutting kerf width on the top surface is smaller than on the bottom surface, which is related to the faster heat dissipation into the thermally affected area when heat is applied to the upper part of the sample. The effect of cutting direction is not significant, as the thermal conductivity of spruce wood is significantly lower than that of beech and oak wood, due to its lower density.
From
Table 7, for spruce wood, the cutting direction does not play a significant role, as the probability of equality for means and variances is significantly above 50%, which is much higher than the test error. The test error for a 95% confidence interval is 5%.
3.5. ANN Prediction for Beech
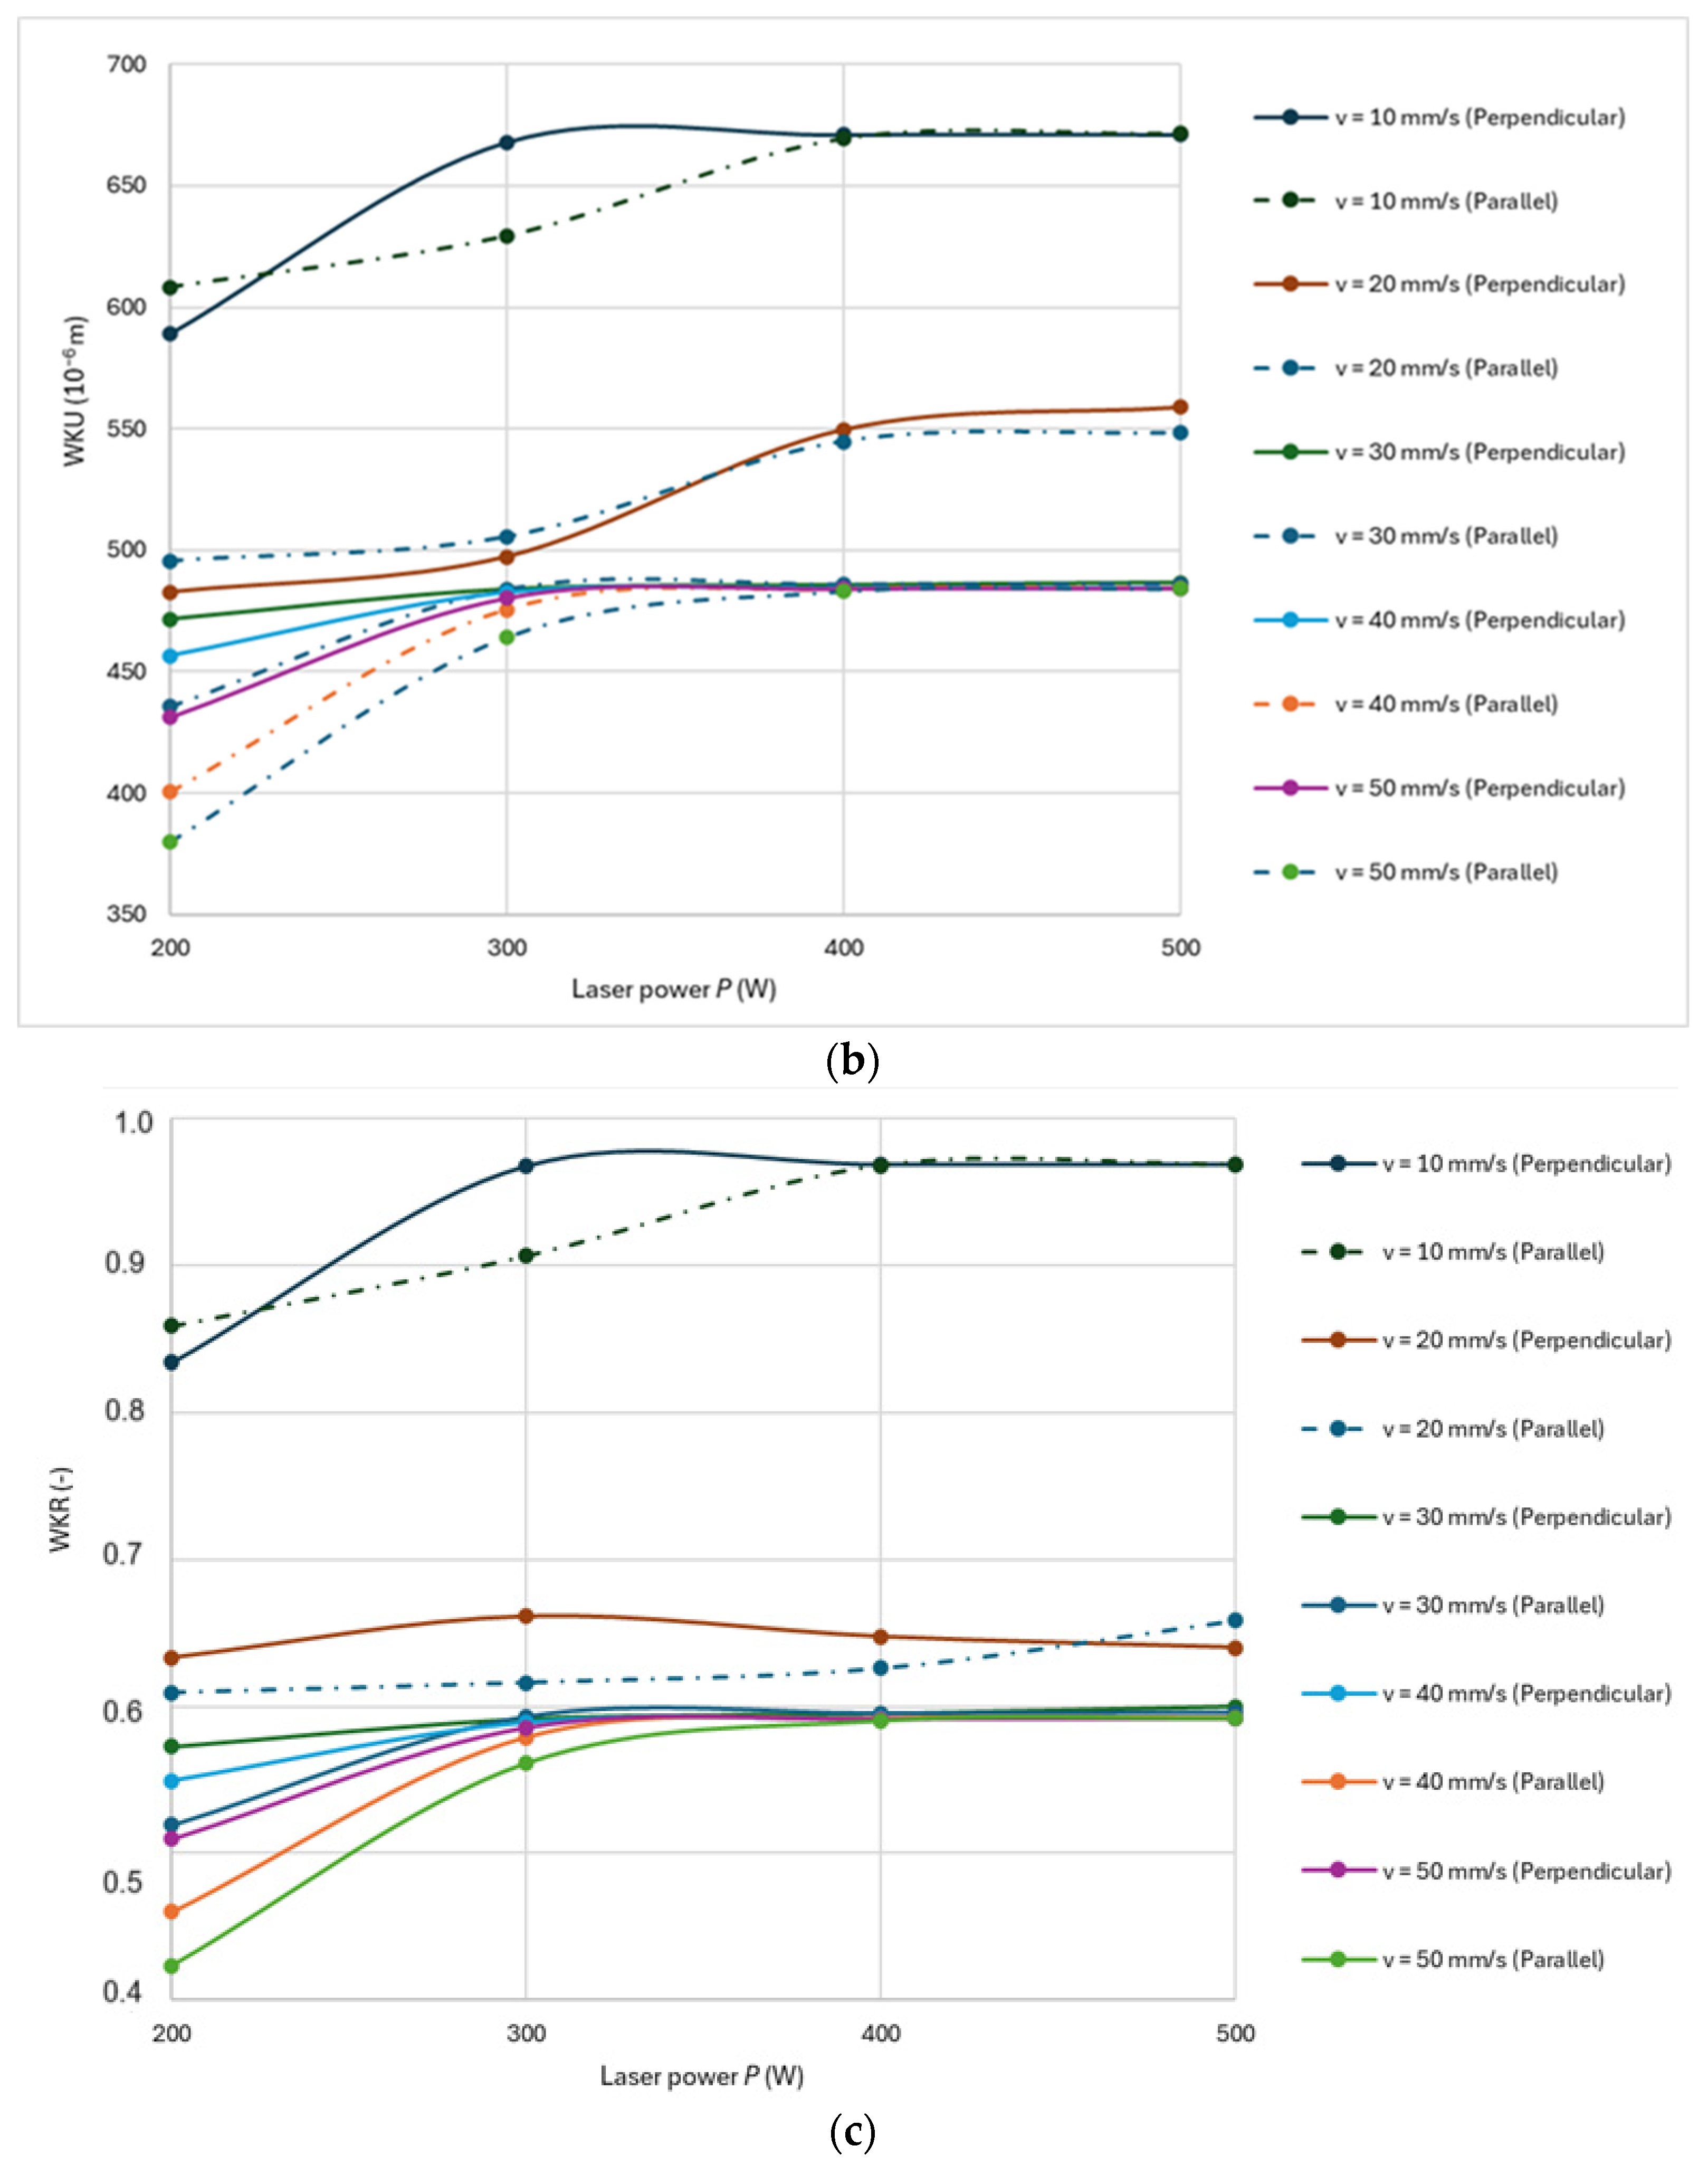
In the following section, the prediction results for beech wood are presented.
Figure 7a–c show the dependencies of WKL, WKU, and WKR versus
P,
v, and cutting direction.
From
Figure 7a–c, the following conclusions can be drawn:
WKU, WKL, and WKR decrease non-linearly with the value of
v, as observed by other authors [
7,
10,
12,
14,
15,
19,
22,
23].
Values of WKU and WKL increase exponentially with power and stabilize with the
P value at the 400 W level, which is also a typical trend [
3,
10,
14,
19,
22,
23].
WKR also stabilizes for higher laser power levels due to the definition.
The optimal WKR value is found only at minimal values of v.
For values of v higher than 10 mm·s−1, the WKR values rapidly decrease, which means that only minimal values of v lead to good quality of cut.
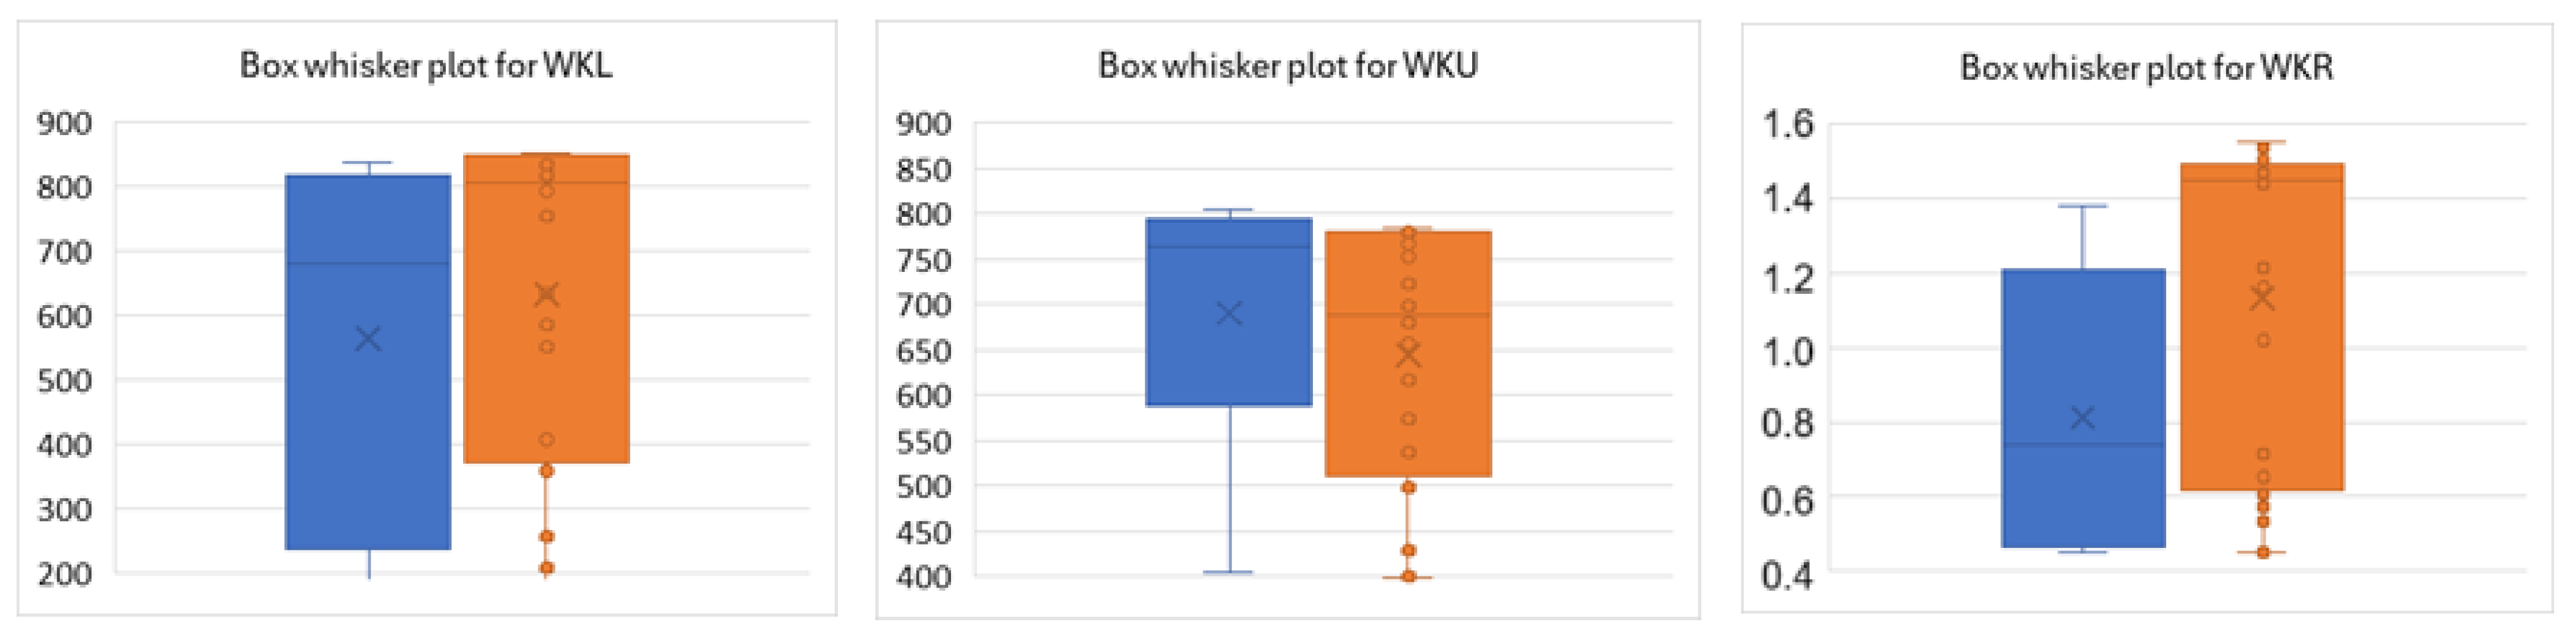
Similarly, as for spruce wood, the effect of cutting direction on kerf parameters WKU, WKL, and WKR is studied via box whisker plots and
t-test statistics in
Table 8.
Figure 8 shows the box whisker plots for WKL, WKU, and WKR, followed by the probability values of variance and mean equalities for laser powers ranging from 200 to 500 W and cutting speeds from 10 to 50 mm·s
−1. The blue boxes correspond to cutting along the grain, and the orange ones correspond to cutting across the grain.
From
Figure 8, it can be seen that the differences in the cutting parameters for the different cutting directions are not statistically significant. The influence of cutting direction is not significant, even though the thermal conductivity of beech wood is significantly higher than that of spruce wood.
From
Table 8, for beech wood, the probability of variance equality for different cutting directions is higher than for spruce wood. This is since the structure of beech wood is much more homogeneous than that of spruce, meaning that the variance in properties is lower.
3.6. ANN Prediction for Oak
The following section presents the prediction results for oak wood.
Figure 9a–c show the dependencies of WKL, WKU, and WKR versus
P,
v, and cutting direction.
From
Figure 9a–c, the following can be concluded:
WKL and WKU values decrease non-linearly with
v, like what was observed in beech and spruce wood. This trend was also observed by other authors [
7,
10,
12,
14,
15,
19,
22,
23].
WKL and WKU values stabilize for P values higher than 400 W, but only for v below 30 mm·s−1.
Values of WKU and WKL increase exponentially with power and stabilize with a
P value at a 400 W level, which is also a typical trend [
3,
10,
14,
19,
22,
23].
WKR also stabilizes for higher laser power levels due to the definition.
The optimal WKR value across the grain direction is found only for v values below 20 mm·s−1 and only for P between 400 and 500 W.
For cutting along the grain, the optimal WKR value is found also for a v value of 30 mm·s−1.
Similarly, as for spruce and beech wood, the effect of cutting direction on kerf parameters WKU, WKL, and WKR is studied via box whisker plots and
t-test statistics in
Table 9.
The influence of cutting direction on WKU, WKL, and WKR across the entire range of possible powers and cutting speeds is shown in the box plots in
Figure 10. Blue boxes represent cutting across the grain, and orange boxes represent cutting along the grain.
From
Figure 10, with a change in the cutting direction, the variance and average value of the WKU and WKL changes, especially for the WKU. As a result, the WKR ratio of kerf widths also changes.
For cutting across the grain, the width of the lower kerf is smaller, while the width of the upper kerf is larger, leading to a significant decrease in the average value of WKR.
On the other hand, in the case of cutting along the grain, the width of the kerf on the lower surface increases, while the width of the kerf on the upper surface decreases. This leads to an increase in the value of WKR.
All these results indicate that for oak wood, the cutting direction has the greatest effect on the cutting kerf widths. This is also confirmed by the sensitivity coefficients from the experimental data presented in
Table 5. According to this table, since the influence of
v on the kerf width decreases in comparison with spruce and beech, the energy density
E has a smaller impact on the values of WKL and WKU.
From
Table 9, for oak wood, the cutting direction has the most significant effect on the kerf widths compared to the other wood species studied, and in the case of their ratio, it is even statistically significant.
3.7. Comparison of Kerf Widths Depending on the Material
To gain an overview of the influence of cutting direction and wood species on the kerf width,
Table 10 presents the variance values for kerf width. These values are obtained from the ANN predictions and measurement results and represent the minimum, average, and maximum WKU, WKL, and WKR across the entire range of
P and
v values.
The minimum values of WKU and WKL occur at low P values and high v values. Conversely, the maximum values of WKU and WKL occur at high P values and low v values. The mean value represents the average of all values within the range of 200–500 W for P and 10–50 mm·s−1 for v.
From
Table 10 for spruce wood, the following can be seen:
The cutting direction has a minimal impact on the values of WKL, WKU, and WKR for spruce wood. This is because spruce wood, with relatively low density, offers higher resistance to heat conduction into heat-affected zones which results in an increase in cutting kerf widths (the values of WKL are 2 to 4 times higher than those for beech and oak). This is consistent with
Table 5, where the effect of the cutting direction on WKL and WKU is significantly smaller in spruce compared to beech and oak.
For spruce, it is evident that the WKL value is higher than WKU. This is because, in the upper surface, after the application of radiation, there is greater heat dissipation into the thermally affected area, leading to a reduction in the kerf width regardless of the cutting direction. This is also reflected in the minimal deviations of WKR for both cutting directions, caused by the measurement error. This trend was also observed in refs. [
10,
22,
23].
Furthermore, for spruce, the optimal value of WKR is reached approximately in the middle of the range, at average values of
P and
v, which has also been observed in previous studies [
10,
22,
23].
From
Table 10 for beech wood, the following can be seen:
The cutting direction has a slight effect on WKL and WKU, especially at higher v values, where it reaches 27% and 12%, respectively, which is about twice the measurement error.
The cutting direction also has a mild effect on WKR at maximal v value, where it reaches 17%, which is at the level of the measurement error (roughly equal to the sum of errors for the WKU and WKL, which is about 18%).
For beech wood, again, especially at medium and high values of v, WKU is higher than WKL, suggesting that the supplied energy does not preferentially dissipate into the thermally affected area, but rather contributes to an increase in the WKU value.
This effect is minimized for low values of v, where the optimal cut is obtained.
From
Table 10 for oak wood, the following can be seen:
The cutting direction has a mild effect on the WKU and WKL, especially for medium values of v, where it reaches 14% for WKL, which is comparable to the measurement error, and 7% for the WKU, which is also at the measurement error level.
The effect of the cutting direction is visible mainly for medium and higher WKR values (i.e., at minimum to medium v values), where the optimal WKR value is also reached.
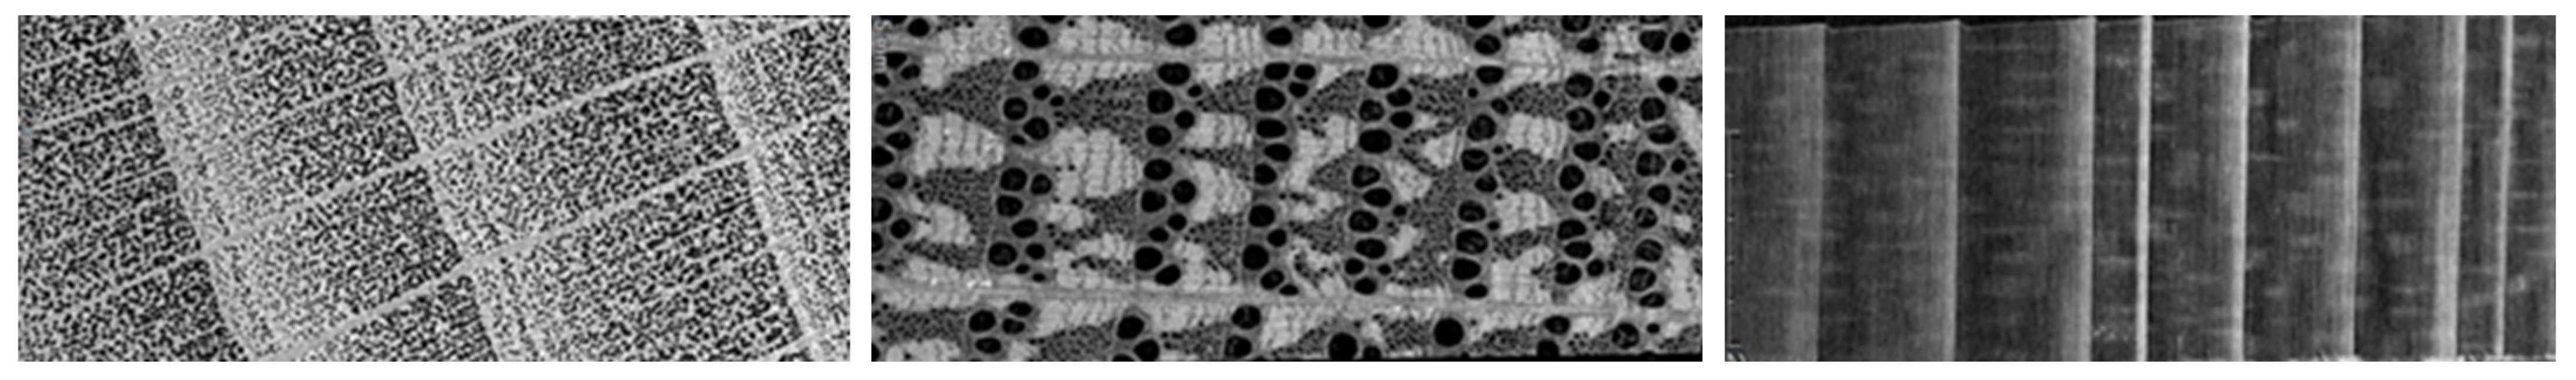
Differences in the WKU and WKL values for oak wood are highly significant, especially at high values of
v, where they reach a ratio of approximately 2.5 times. This is considerably higher than in spruce and beech, where the ratios are about 2 times for beech and 1.5 times lower on the upper surface compared to the lower surface for spruce. This is due to the different structure of the material being cut, as shown in
Figure 11.
The effects of cutting direction on cutting kerf widths can be explained by anisotropic heat transfer. In the parallel direction at lower or middle values of
v, the continuous CO
2 laser generates heat which transfers to heat affected zones which results in lowering of cutting kerf widths. In the perpendicular direction, the laser ray goes through big pores in the microstructure of oak; thus, heat transfer is mainly in the direction of the kerf width which increases the cutting kerf width [
41].
3.8. Optimal Values of Power P, Cutting Speed v, and Energy Density E
From the predicted values of WKL, WKU, and the subsequently calculated values of WKR, the optimal values of
P and
v were determined, and the corresponding optimal values of
E were calculated for each material and each direction separately. The results are presented as interval values because the optimal conditions can be met at more than one setting of the input parameters.
Table 11 shows the optimal values of
P,
v, and
E for spruce wood, for both cutting directions—along the grain and across the grain. Similarly, for beech and oak wood, the optimal values are presented in
Table 12 and
Table 13.
Spruce wood has optimal cutting parameters for medium values of v in the range of 20 to 30 mm·s−1. For beech and oak wood, the ideal values of v are low, between 10 and 20 mm·s−1, because higher v values reduce the WKU and WKL.
The optimal P value for spruce wood is lower than for beech and oak wood, which primarily relates to the density of the material.
For spruce and beech wood, it can be said that the optimal values of P, v are the same regardless of the cutting direction. This is consistent with the fact that the influence of cutting direction on the kerf width parameters is very low and statistically insignificant for these types of wood.
For oak wood, it can be observed that when cutting along the grain, higher E values are required compared to cutting across the grain.
The optimal E for beech and oak wood are higher than for spruce wood, which correlates with the higher density of these woods, and therefore a higher energy input is required to maintain the same cutting parameters.
The average optimal energy density E for spruce wood cutting along the grain is 83 MJ·m−2, and across the grain, it is 72 MJ·m−2. For oak wood, the optimal E along the grain is 167 MJ·m−2, and across the grain, it is 183 MJ·m−2. For beech wood, the optimal E values are 300 MJ·m−2 along the grain and 267 MJ·m−2 across the grain. From this, it can qualitatively be stated that the higher the density of wood, the greater the amount of energy required to achieve an optimal cut.
From these average values of optimal E, it can be stated that cutting direction does not have a significant effect on this parameter, which means that density is the most significant parameter affecting the E value.
4. Discussion
In this part, we will discuss the presented results along with similar research published in [
1,
10,
22].
Publication [
1] compared CO
2 laser cutting of wood and wood polymeric composites versus other standard cutting techniques. They studied mainly the effect of cutting speed on the quality of cut surface for wooden composites.
In publications [
10,
22], the authors studied the effect of
P,
v, and number of cut annual rings (ARs) on the widths of cutting kerfs WKU and WKL and their ratio WKR and the widths of the heat-affected zones WHAZU and WHAZL.
Publication [
10] studied the effect of all three input parameters on the above-mentioned output parameters for measured results for maximal value
P equal to 150 W with spot diameter equal to 0.3 mm and maximal value of v equal to 9 mm·s
−1. Research was performed on spruce wood of thickness 8 mm. Optimal values of
P,
v were equal to 150 W and 3 mm·s
−1 according to condition WKR = 1 which corresponds to optimal values of
E equal to 167 MJ·m
−2 but only for values of WKR = 0.85, which still is 15% below the optimum. According to the optimization conditions for WKU and WKL to be minimal, both were fulfilled for values of
P and
v equal to 100 W and 9 mm·s
−1 which correspond to an
E value of 37 MJ·m
−2. However, all research was performed only for
E values between 37 and 167 MJ·m
−2, which was also an interval of optimal
E values. Here, it must be mentioned that all used regression models obtain values of correlations between WKR measured and modelled at a maximal level of 0.79. Both the correlation coefficient value (0.79) and the closest WKR value to 1 (0.85) show that prediction models still can be improved further.
Publication [
22] studied the effects of
P and AR on the above-mentioned output parameters for measured results of
P up to 150 W and predicted results for
P up to 500 W. Research was performed on spruce wood of thickness 8 mm and predictions were made for a value of
v equal to 12 mm·s
−1. Optimal values of
P were equal to 200 W at 12 mm·s
−1 according to the condition WKR = 1 which corresponds to an optimal value of
E equal to 83 MJ·m
−2 by obtaining the best value of WKR = 0.95. However, all research was performed only for
E values between 56 and 139 MJ·m
−2. Here, it must be mentioned that the best neural network model MLP 3-3-5 obtains a value of correlation between WKR measured and modelled at a maximal level of 0.97. Both the correlation coefficient value (0.97 vs. 0.79) and the closest WKR value to 1 (0.95 vs. 0.85) show that the ANN model significantly improved the accuracy of predictions. However, the presented results are valid only for a value of
v = 12 mm·s
−1. Another important conclusion which results from ANN modelling was the fact that the AR value improves values of WKU, WKL, and WKR only for
P = 200 W; thus, at higher values of
P (also of
E) heat transfer does not have a significant effect on creation of the cutting kerf width.
In former articles, the effect of cutting direction on cutting kerf parameters was not examined for spruce wood. Optimal values of P are between 200 W and 300 W at optimal values of v between 20 and 30 mm·s−1 according to the condition WKR = 1, which correspond to optimal value of E equal to 78 MJ·m−2 by obtaining the best value of WKR = 1.01. All research was performed for E values between 7 and 556 MJ·m−2. Here, it must be mentioned that the best neural network model MLP 4-8-3 obtains values of correlation between the WKR measured and modelled at the maximal level of 0.99.
However, the beam diameter d was changed from 0.3 mm to 0.15 mm, the optimal value of E for ANN models was very similar, about 80 MJ·m−2, regardless of cutting direction for spruce wood. The coefficient of correlation of ANN models increased significantly versus regression models from 0.79 to 0.99 in the presented paper. The optimal value of WKR which should be closest to 1 also increased from the maximal value 0.85 for the maximal P value 150 W, up to 0.99 for predicted values up to 500 W. All these results show that ANN models are valid for values of E up to 667 MJ·m−2.


 ,
, 


