Review

A Review of Applying Drones and Remote Sensing Technology in Mangrove Ecology

1
School of Environmental Science and Engineering, Guangzhou University, Guangzhou 510006, China
2
Guangdong Basic Research Center of Excellence for Ecological Security and Green Development, Southern Marine Science and Engineering Guangdong Laboratory (Guangzhou), Guangzhou 511458, China
3
Research Centre of Ecology & Environment for Coastal Area and Deep Sea, Southern Marine Science and Engineering Guangdong Laboratory (Guangzhou), Guangzhou 511458, China
4
Guangdong Basic Research Center of Excellence for Ecological Security and Green Development, School of Ecology, Environment and Resources, Guangdong University of Technology, Guangzhou 510006, China
5
Ocean College, Zhejiang University, 1 Zheda Road, Zhoushan 316021, China
6
Department of Marine Biotechnology, Kunsan National University, Kunsan 54150, Republic of Korea
*
Author to whom correspondence should be addressed.
Forests 2025, 16(6), 870; https://doi.org/10.3390/f16060870
Submission received: 22 April 2025 / Revised: 11 May 2025 / Accepted: 20 May 2025 / Published: 22 May 2025

Abstract

:
: Mangrove forests are one of the ecosystems with the richest biodiversity and the highest functional value of ecosystem services in the world. For mangrove research, it is particularly important to facilitate mangrove mapping, plant species classification, biomass, and carbon sink estimation using remote sensing technologies. Recently, more and more studies have combined unmanned aerial vehicles and remote sensing technology to estimate plant traits and the biomass of mangrove forests. Various multispectral and hyperspectral data are used to establish various vegetation indices for plant classification, and data models for biomass estimation and carbon sink calculation. This study systematically reviews the use of remote sensing and unmanned aerial vehicles in mangrove studies during the past three decades based on 2424 peer-reviewed papers. By synthesizing these studies, we identify the pros and cons of different indices and models developed from remote sensing technologies by sorting out past cases. Specifically, we review the use of remote sensing technologies in mapping the past and present area, plant species composition, and biomass of mangrove forests and examine the threats to the degradation of mangrove forests. Our findings reveal that there is increasing integration of machine learning and remote sensing to facilitate mangrove mapping and species identification. Moreover, multiple sources of remote sensing data tend to be combined to improve species classification accuracy and enhance the precision of mangrove biomass estimates when integrated with field-based data.

1. Introduction

Mangroves are ecosystems located along tropical and subtropical coastlines, renowned for their exceptionally high value in providing ecosystem services [1]. These services include carbon sequestration and long-term burial, providing nursery habitats for various benthic organisms and nearshore fisheries, stabilizing coastlines, supporting ecological restoration, and promoting sustainable eco-tourism [2,3]. Mangroves are the first natural barrier against extreme weather events such as cyclones, tsunamis, and extreme tidal surges [4]. Moreover, mangroves possess immense potential for carbon sequestration, storage, and export, offering invaluable contributions to mitigating the impacts of climate change [5,6]. In recent decades, global climate change and human activities in coastal regions have driven the conversion of mangroves into various other land use types, such as agricultural land, aquaculture ponds, and urban development [7].
Mangrove biomass is a crucial indicator for assessing mangrove productivity, ecosystem functions, and sustainable development. Although field-based measurements provide accurate estimates on mangrove biomass, they often require substantial investments of labor and logistic support, and cannot provide timely estimates. Consequently, an increasing number of studies have been estimating mangrove biomass by using satellite remote sensing technology [8]. It offers broad coverage, quick access, and low costs for precise measurement [9,10], mapping [11,12], and monitoring of mangrove biomass [13]. Combining remote sensing with machine learning (ML) models enables efficient and accurate estimation of mangrove biomass and carbon sequestration over different spatio-temporal scales [14]. In earlier studies, satellite remote sensing typically relies on passive sensing technologies, which are often affected by weather conditions, cloud cover, tidal conditions, and satellite orbital constraints. These constraints make it challenging to obtain high-quality satellite imagery [15]. However, the acquisition and utilization of mangrove-related imagery and spectral information have reached unprecedented precision and efficiency [16,17] with the integration of active remote sensing, Light Detection and Ranging (LiDAR) technology, multispectral and hyperspectral imaging, as well as the synergistic use of satellites and LiDAR.
Globally, extensive research has been performed on mangrove biomass and carbon sequestration, with a noticeable increasing trend in recent years. As our understanding of mangroves deepens, an increasing number of blue carbon studies have emerged. The term blue carbon was coined in 2009 and has since gained recognition and importance [18]. Given the widespread global distribution of mangroves and the varying conditions across countries, research projects and methodologies also exhibit significant diversity.
Remote sensing tools can integrate field survey data more effectively to establish allometric equations for accurately estimating the aboveground carbon storage of mangroves. Multispectral and hyperspectral remote sensing imagery, synthetic aperture radar (SAR), and LiDAR can successfully map the distribution and species composition of mangrove ecosystems. These technologies offer advantages such as cost-effectiveness and controllable accuracy, and they are able to cover larger areas more efficiently compared to traditional field surveys [19,20]. Remote sensing and unmanned aerial vehicles (UAVs) have significant potential in monitoring changes in mangrove extent [21,22], assessing various plant characteristics [23,24] (e.g., tree height and leaf area index), and predicting the degradation of mangrove forests [25]. However, these advanced technologies also have inherent limitations. The spectral similarity among different mangrove species makes species identification challenging, and the high density of vegetation overlap further exacerbates this difficulty [26].
Low-resolution optical remote sensing (e.g., Landsat 1–3, SPOT 1–3) data have been initially used for studying mangroves. These satellite remote sensing data cover large areas and are relatively easy to acquire. However, the spatial resolution of these satellites is generally not very high, and data are often limited by the satellite’s fixed orbit and operational cycle. Mangroves typically grow in intertidal regions, making it challenging to obtain satellite imagery at low tide conditions. In contrast, drones have emerged as a promising alternative for mapping mangroves due to their flexibility, portability, and high data quality [27,28]. The high spatial resolution offered by drone imagery bridges the gap between large-scale satellite monitoring and on-the-ground field surveys, providing a crucial link for advancing species classification and mapping mangrove extent [29,30,31].
For example, Zhu et al. [32] combined Landsat-8 imagery with Multiple Altimeter Beam Experimental Lidar (MABEL) data to generate a tree height map with a spatial resolution of 30 m. Wang et al. [33] estimated the total height and above-ground biomass (AGB) of mangroves in Hainan Island by integrating field plot data, UAV-LiDAR data, and Sentinel-2 imagery. At present, most research relies on satellite imagery as the primary data source, with drone data serving as a supplementary tool. However, both types of data can be combined to supplement each other, improving the accuracy of estimating mangrove biomass, species classification, and carbon stock predictions.
Prior to 2010, low-resolution satellite remote sensing data were used without the involvement of ML algorithms or supervised classification methods. At that time, remote sensing often relied on manual interpretation, which was prone to significant errors and subjective biases from interpreters. However, advancements in technology over recent decades have transformed this approach. The integration of UAV technology with ML algorithms and supervised classification methods has enabled more accurate classification of mangrove species and improved mangrove mapping. Despite these advancements, a review of the literature reveals that few studies have systematically summarized the application of UAV data and ML algorithms in mangrove ecosystem research. In particular, there is a notable gap in studies focusing on two key areas: the accuracy of mangrove species classification using different ML algorithms and the assessment of mangrove degradation.
To address this research gap, this review summarizes past studies related to estimating mangrove biomass, plant traits, and species composition, as well as mangrove mapping based on satellite and drone remote sensing. The objectives of this study include the following: (1) Reviewing the advancements in predicting mangrove biomass and carbon dynamics using remote sensing and drone LiDAR technologies and summarizing their pros and cons. (2) Summarizing the performance of mainstream ML algorithms in mangrove species classification and comparing their respective strengths and limitations. (3) Investigating the causes of mangrove degradation through remote sensing technologies. This review underscores the critical role of satellite and drone remote sensing in global mangrove studies and establishes the importance of remote sensing technologies in studying mangroves. Meanwhile, this study summarizes the current limitations of remote sensing technologies and discusses the potential for integrating drone technology with remote sensing, highlighting how their combined use could enhance the accuracy of estimating mangrove biomass and mapping mangroves.

2. Materials and Methods

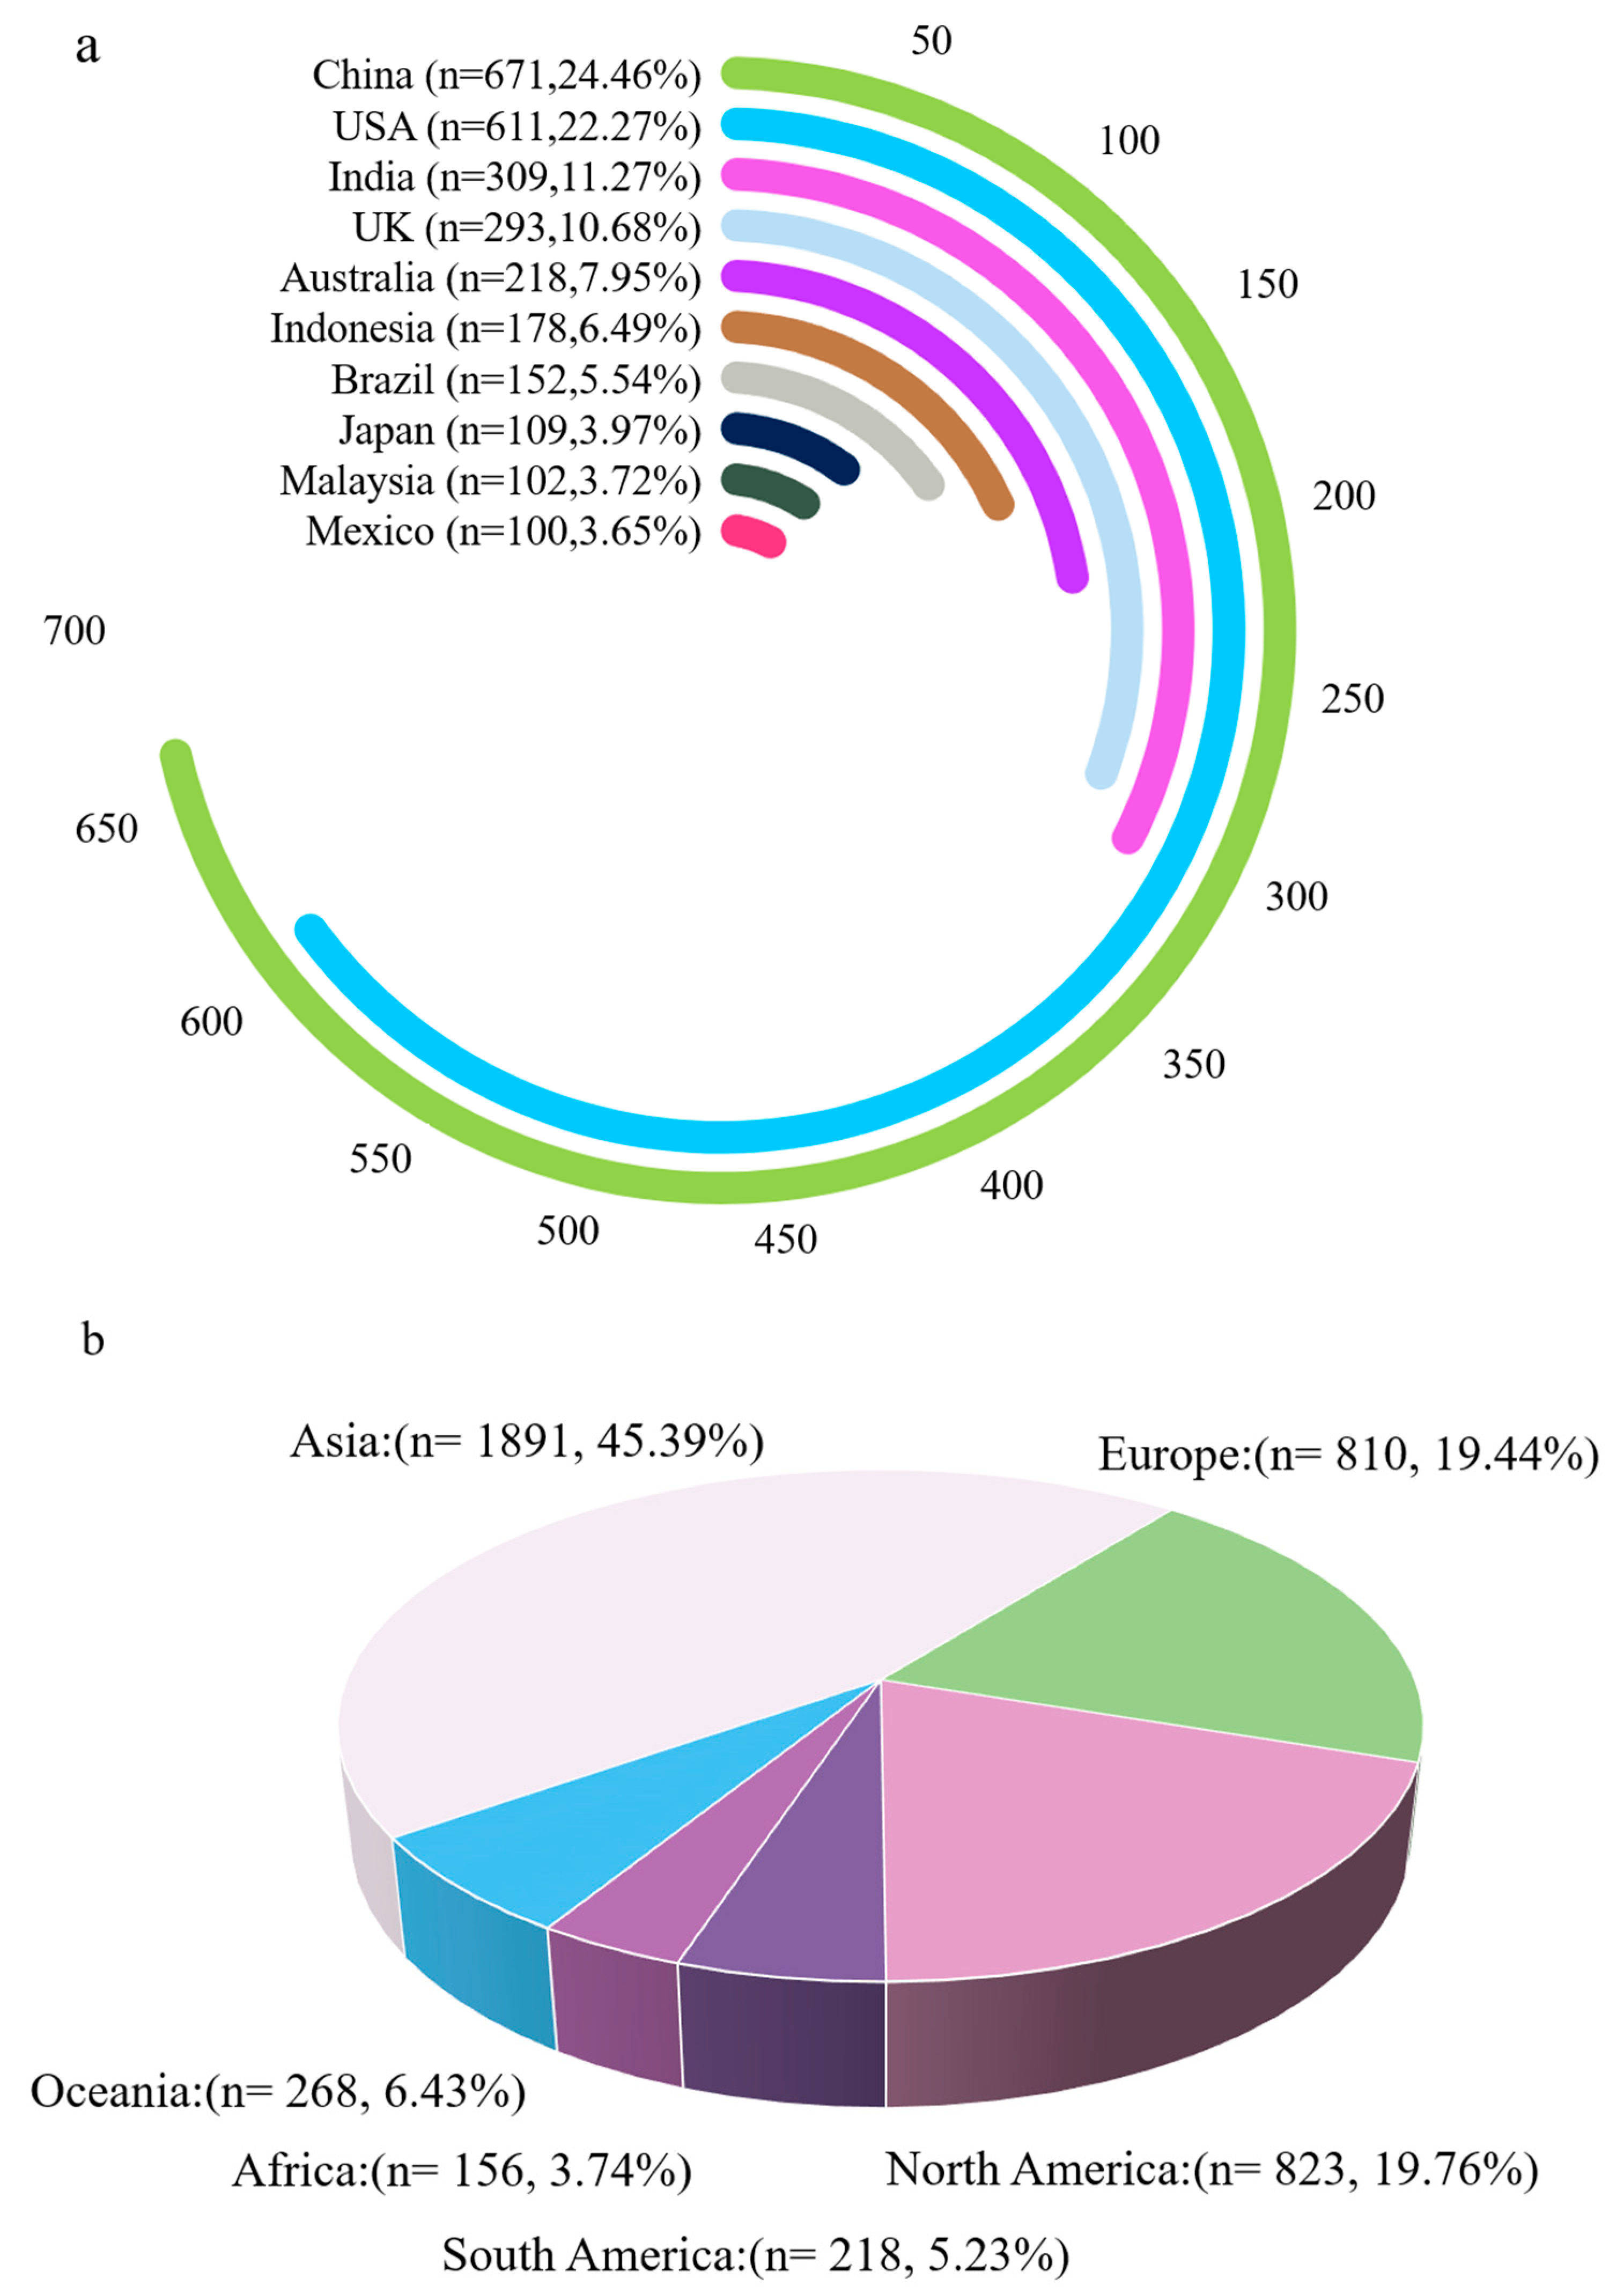
2.1. Data Collection

The analytical data for this study were collected from the online database ‘Web of Science’ (WOS). The specific search terms include the article retrieval period (from 1 January 1990 to 1 October 2024), article topics, and article language. Detailed information is provided in Table 1.

2.2. Data Analysis

A total of 2424 articles were retrieved, including 2060 journal articles (84.983%), 68 review papers (2.805%), and 358 conference papers (14.769%). From 1990 to 2024, there has been a continuous increase in the number of papers in the area of mangrove remote sensing. Figure 1 indicates that the number of publications from 2010 to 2024 is 2124 (87.62%), whereas it was only 300 (12.38%) from 1990 to 2009. This stark contrast highlights that papers published after 2010 dominate studies on remote sensing of mangroves. As a result, this review primarily focuses on recent publications to elaborate on the applications of remote sensing in mangrove research. In terms of both publication quantity and citation frequency, papers on mangroves based on UAV and satellite remote sensing are currently increasing. These data indirectly confirm the feasibility and vast potential of remote sensing technologies in mangrove research.
In terms of the authors’ nationalities, China plays a disproportionately important role in studying mangroves using remote sensing technologies. Scholars from China (647 articles from mainland China, 4 from Hong Kong, and 30 from Taiwan) ranked first during 1990–2024, followed by scholars from the United States and India (Figure 2). Although the area of mangroves in China is approximately 30,000 hectares, accounting for only 0.2% of the global mangrove area [34], this does not dampen the enthusiasm of Chinese researchers.
The growing number of studies on remote sensing of mangroves is closely linked to China’s carbon peak and carbon neutrality goals. This is because mangrove ecosystems have become a research hotspot, primarily due to their carbon sequestration capacity, which is an order of magnitude greater than that of terrestrial forests. Notably, Asia has emerged as the primary region for mangrove ecosystem research. This is attributed to two key factors: on one hand, Southeast Asian countries have extensive mangrove coverage, and, on the other hand, they host the highest diversity of mangrove species globally, making the region the center of global mangrove distribution [34]. These unique characteristics have attracted researchers from around the world to Asia, particularly Southeast Asian countries, to study mangrove ecosystems.

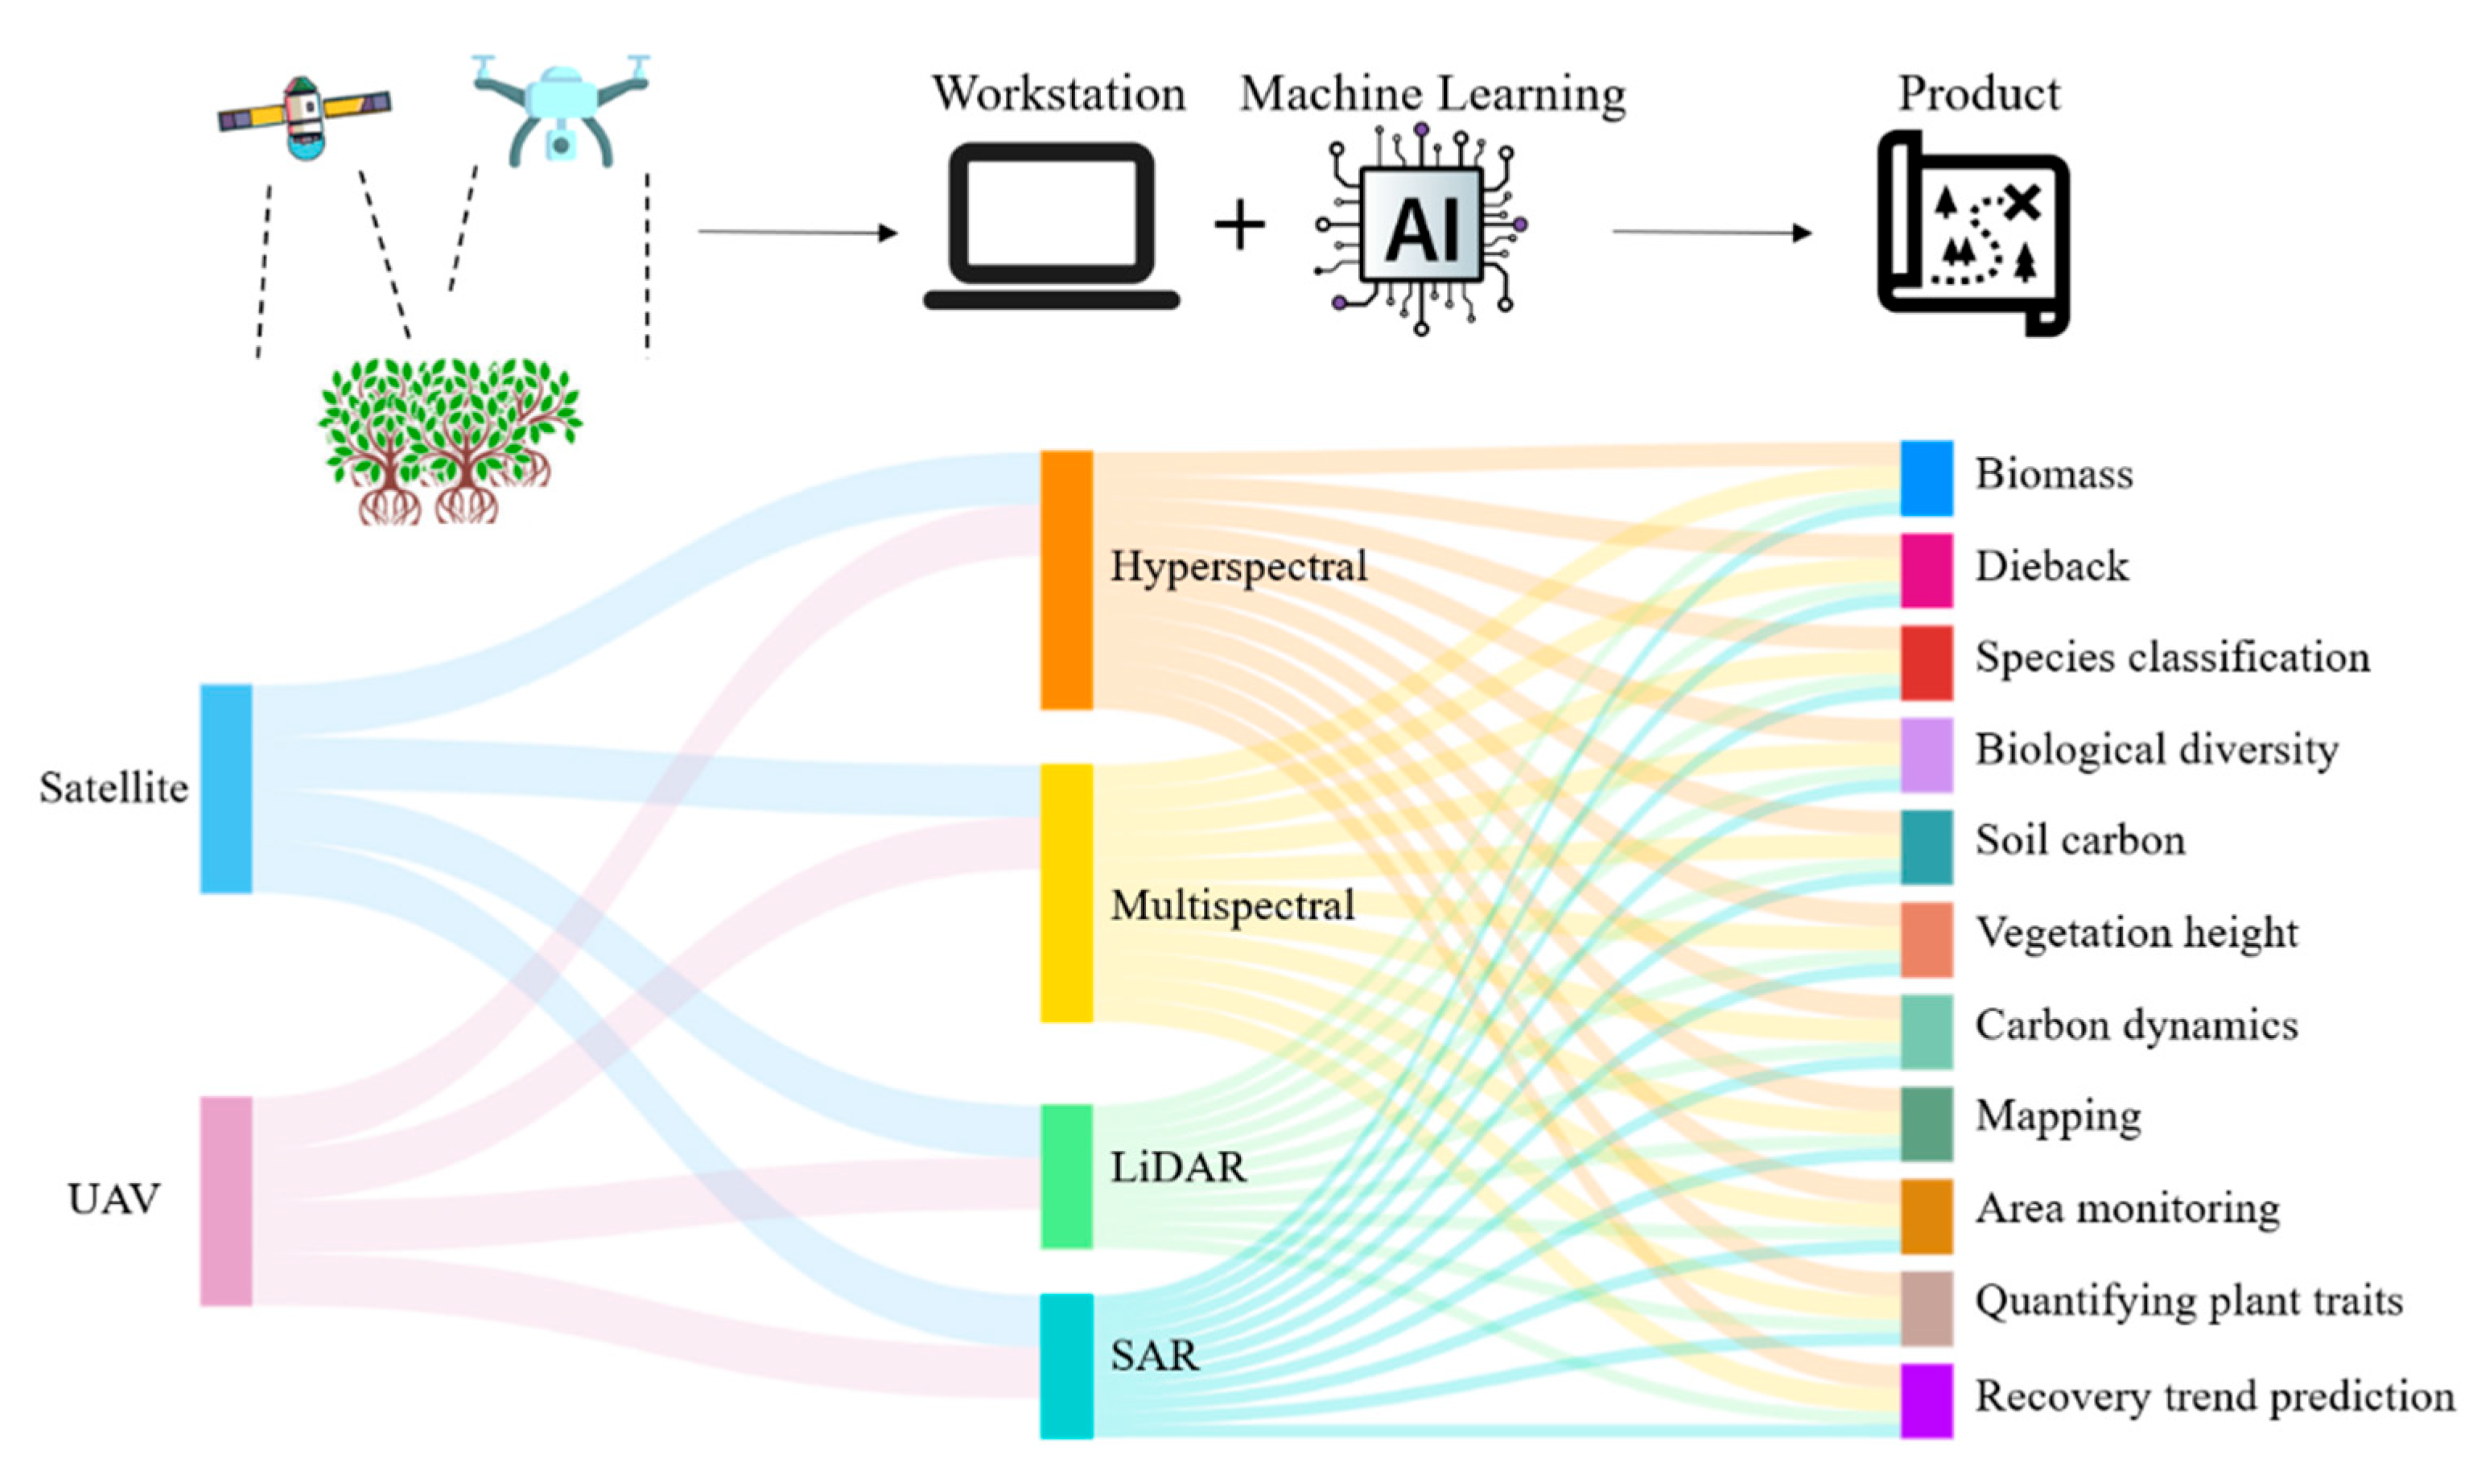
2.3. Technical Approach

A review of the papers indicates that mangrove ecosystem research generally follows a similar technical approach (Figure 3). This approach typically integrates satellite remote sensing data, UAV data, and field survey data, followed by visualization of these data through specialized software. Increasingly, researchers are combining traditional software with ML methods. This is because ML techniques are more effective in overcoming the subjectivity of visual interpretation, thus improving the accuracy of the output products. Although ML offers significant advantages in handling large-scale datasets, the models and parameters developed are typically applicable only to specific study areas. This results in a lack of portability for these models and parameters, meaning that for each new research area, the models must be re-established, and parameters must be set according to the specific conditions of that area.

3. Predicting Mangrove Biomass and Carbon Dynamics

Recently, the capacity of mangroves to store large amounts of carbon has gained significant attention [5,35,36,37]. Donato et al. [35] estimated that soil carbon stocks account for 49%–98% of the total carbon stored in mangroves. Therefore, accurately estimating the spatial distribution of mangrove soil carbon stocks is a critical step in assessing the impacts of climate change and human activities on mangrove carbon storage, and evaluating the climate mitigation potential of these ecosystems [38].
Jardine et al. [39] developed a predictive model based on soil carbon stocks compiled from the meta-analysis of Chmura et al. [40], Kristensen et al. [41], and Donato et al. [35]. These three studies collectively include data from over 900 samples collected from 28 countries/regions, which accounts for 64.4% of the global mangrove area. Jardine et al. [39] used both parameter-based predictive models and ML algorithms. They identified annual precipitation as the most significant predictor for soil carbon stocks, followed by distance from the equator and geographic region. Based on their model predictions, Jardine et al. [39] generated a high-resolution spatially explicit global dataset of mangrove soil carbon concentrations. This dataset contributes to ongoing mangrove conservation efforts and provides important scientific input for future conservation initiatives.
Numerous studies related to mangrove biomass and carbon stock estimation have been undertaken, typically through field surveys [42,43,44]. However, field survey methods are only applicable to specific locations or local-scale studies. At the global scale, mangrove biomass and carbon sequestration are typically estimated from upscaling methods, wherein the average mangrove biomass density obtained from field surveys is multiplied by the total mangrove area [45]. As a platform for storing, managing, analyzing, and visualizing geospatial data, Geographic Information Systems (GISs) play a critical role in estimating mangrove biomass and carbon stocks. By integrating geospatial data obtained from remote sensing, the Global Positioning System (GPS), and field surveys, GIS enables spatial analysis essential for quantifying carbon storage in mangrove ecosystems [46,47]. Advances in geospatial technologies have enabled the increasing availability of georeferenced datasets with fine spatial resolution, suitable for large spatial scales. When integrated with field survey data, these geospatial datasets provide robust support for the estimation of mangrove biomass and carbon storage.
Giri et al. [48] produced the first global mangrove map using remote sensing data by combining automated and manual classification techniques applied to over 1000 Landsat scenes acquired between 1997 and 2000. Although this effort resulted in a global map, the product did not provide highly accurate information and represented only a single temporal snapshot, failing to capture the critical spatiotemporal dynamics of mangrove ecosystems. Hutchison et al. [49] proposed a climate-based model to estimate global mangrove biomass based on temperature and precipitation data for mangrove regions. In addition to climate-based models, allometric models can be employed to estimate mangrove biomass and carbon sequestration by using canopy height as a key allometric variable [42,50]. This approach is particularly useful because canopy height can be obtained from satellite sensors, significantly reducing data acquisition challenges. For instance, Fatoyinbo et al. [46] applied an allometric model to estimate mangrove biomass in Africa based on canopy height, which was extracted through an overlay analysis of GIS-based Shuttle Radar Topography Mission (SRTM) data and mangrove extent data classified from Landsat imagery.
Even though remote sensing technology has brought great convenience to research, field surveys still remain the most fundamental and accurate method for obtaining AGB measurements of mangroves at local scales [51,52,53,54,55]. However, when applied to larger scales, this approach is both time-consuming and costly [56,57]. Additionally, due to the muddy terrain and unique structural characteristics of mangroves, field surveys in these regions are much more challenging than in other terrestrial ecosystems.
In Table 2, we compared the advantages and disadvantages of traditional field surveys with those of UAVs and remote sensing. While field surveys are indispensable for mangrove research, remote sensing offers a cost-effective means of acquiring large-scale optical data. When properly processed, these data can supplement field survey measurements and improve estimates of mangrove biomass and carbon sequestration. However, certain inherent limitations remain. For instance, Saenger et al. [42] highlighted the problems of the upscaling approach, which estimates AGB from field sample averages and then extrapolates to larger areas by multiplying the total mangrove coverage. This method can introduce significant discrepancies between the estimated and actual biomass. Despite these problems, remote sensing is useful due to the advantages it offers in generating large-scale biomass maps with lower economic and labor costs. Another challenge lies in the use of allometric models, which are essentially regression-based empirical formulas and inherently contain a degree of error. When these models are applied to large spatial scales, the cumulative effect of such errors can significantly impact the accuracy of estimating biomass and carbon sequestration. Although these uncertainties are inevitable, advancements in remote sensing and the integration of high-precision UAV imagery are expected to enhance the accuracy of assessing mangrove biomass and carbon stocks.
In summary, the use of satellite remote sensing and UAVs has significantly advanced research on mangrove carbon sequestration. Satellite imagery allows for systematic, periodic monitoring of vast mangrove regions, making it particularly suitable for regional or global carbon stock assessments. UAVs, on the other hand, can capture centimeter-level imagery and LiDAR data, which greatly improves the accuracy of estimating canopy height, structure, and biomass. However, these indirect methods of data acquisition also present considerable limitations. For instance, there is an inherent subjectivity in data interpretation, particularly in species classification and biomass modeling. Moreover, current remote sensing techniques struggle to extract information on low-stature mangrove species or understory vegetation, which affects the overall accuracy of carbon stock estimation.

4. Mangrove Mapping and Species Identification

There are various methods for mangrove mapping and classification. Early techniques that required field-based classification were challenging, inefficient, and time-consuming due to the dense canopies of mangrove forests and the muddy conditions [58]. This direct field-based approach can also be disruptive to mangrove trees. In contrast, remote sensing technology allows for the collection of ground spectral information without direct contact [59]. Additionally, it can be integrated with ML algorithms, overcoming the limitations of traditional methods such as visual interpretation, pixel-based classification, and object-based classification. These methods are often subjective, inefficient, or fail to capture spatial information effectively [60,61]. ML algorithms have become a powerful tool in research [62,63] with their ability to handle complex data and extract non-linear relationships.

4.1. Support Vector Machine (SVM)

The SVM is a machine learning technique grounded in the Vapnik–Chervonenkis Dimension theory and the principle of structural risk minimization [64]. Its primary goal is to identify the optimal hyperplane that maximizes the separation margin between two classes in a high-dimensional feature space, making it widely applicable in the classification of remote sensing imagery [65,66,67]. In linearly separable cases, the classifier operates by determining a hyperplane that distinctly divides the data points of one class from those of another. Crucially, this decision boundary relies on a limited subset of training samples, referred to as support vectors. For non-linearly separable data, the SVM utilizes a kernel function to map input vectors from a lower-dimensional space into a higher-dimensional one, where linear separation becomes feasible [68]. This transformation allows SVMs to effectively handle complex classification tasks by formulating a discriminant function in high-dimensional space. Consequently, their performance remains robust regardless of the dimensionality of the data, thereby circumventing the curse of dimensionality [69]. From Table 3, it is evident that the SVM classification model generally achieves an overall accuracy of over 70%, indicating that the SVM method is relatively reliable for classifying mangrove species. Moreover, in many experiments, the overall accuracy exceeds 90%, demonstrating very high classification performance. A review of the literature reveals that classification accuracy is strongly correlated with the mangrove species in the experimental area and the type of satellite data used. For single data types, the classification accuracy of hyperspectral imagery generally exceeds that of multispectral imagery, due to the higher spectral resolution of hyperspectral data. Multiple experiments have also demonstrated that combining multi-source satellite imagery can, to some extent, improve classification accuracy. For example, Zhen et al. [70] used the SVM method to classify mangrove species in their study area using Radarsat-2 and Landsat-8 as data sources. The results showed that when using Radarsat-2 imagery alone, the overall accuracy was only 53.4% with a Kappa coefficient of 0.46. When using Landsat-8 imagery alone, the overall accuracy increased to 83.5% with a Kappa coefficient of 0.80. However, when the two datasets were combined, the overall accuracy reached 95%, and the Kappa coefficient increased to 0.95.
The advantages of SVM [75] include the following: (1) better classification performance when dealing with high-dimensional and complex data, (2) high generalization capacity, and (3) high flexibility in choosing different kernel functions to fit different data structures. On the other hand, disadvantages of SVM include the following: (1) high computational complexity and long training time, (2) more sensitive to the choice of parameters and kernel functions, and (3) not applicable to large-scale datasets.

4.2. Random Forest (RF)

The RF regression algorithm is a nonparametric statistical estimation technique designed to capture intricate non-linear associations between dependent and independent variables [76]. Its foundational concept lies in the construction of an ensemble of decision trees [77], where the final output is obtained by averaging the predictions generated by each individual tree within the forest [78].
RF is the most widely used ML algorithm in mangrove remote sensing research due to its mature technology and high classification accuracy. As seen in Table 4, studies using RF typically achieve overall classification accuracies above 80%, with some even reaching 95% or 98%. These results highlight that RF has significant potential for species classification, achieving exceptionally high classification precision in certain specific study areas. For instance, Shen et al. [79] performed mangrove species classification using data from Sentinel-2, Sentinel-1, and ALOS-2. Sentinel-2 provided optical remote sensing data, while Sentinel-1 and ALOS-2 were radar remote sensing satellites. The overall classification accuracies achieved by these three different data sources were 92.67%, 39.67%, and 30.33%, respectively. This comparison clearly demonstrates that SAR data, when used alone, often cannot yield ideal classification results for mangrove species. This lies in the fundamental difference between optical remote sensing and SAR. Unlike optical remote sensing, which captures surface reflectance and thus provides only spectral information, SAR derives elevation data by analyzing phase differences, enabling the extraction of vertical structural information in addition to horizontal spatial data. However, SAR data alone typically cannot yield optimal performance in species classification since SAR provides structural rather than spectral information and species classification relies heavily on the spectral reflectance characteristics of vegetation.
The advantages of RF [86] include the following: (1) its ability to handle overfitting and improve accuracy, (2) flexibility in both classification and regression problems, (3) the capacity to handle both categorical and continuous values, and (4) the capability to manage large datasets with higher dimensions. On the other hand, the disadvantages of RF include (1) sensitivity to small changes in the data, (2) complex computations, and (3) poor adaptation to high-dimensional sparse data.

4.3. Extreme Gradient Boosting (XGBoost)

XGBoost, introduced by Chen and Guestrin in [87], is an enhanced Gradient Tree Boosting method that offers several improvements over the conventional Gradient Boosting Machine (GBM). The algorithm incorporates two major innovations: (1) regularization techniques that help mitigate overfitting, and (2) a tree pruning mechanism that predefines the Maximum Tree Depth (MTD) and performs backward pruning instead of based on loss criteria. These enhancements contribute to improved computational efficiency and support parallel processing, facilitated by a block-structured design that enables faster model training [88]. Although XGBoost is a relatively recent development and has yet to be extensively explored in remote sensing image classification tasks integrating both spectral and spatial features, its application in mangrove studies is emerging. As indicated in Table 5, this algorithm achieves overall classification accuracies exceeding 90% for mangrove species, outperforming both RF and SVM models. This highlights the strong potential of XGBoost in advancing mangrove species classification research. The advantages of XGBoost [86] include the following: (1) its ability to support parallel processing and (2) its applicability in both regression and classification problems. On the other hand, the disadvantages of XGBoost include the following: (1) it is less interpretable and more difficult to visualize and tune compared to AdaBoost and RF and (2) it cannot handle categorical values by itself.

4.4. Other ML Methods

In addition to machine learning algorithms such as SVM, RF, and XGBoost, many other algorithmic models have also been applied in remote sensing-based mangrove research (Table 6). While these algorithms are not yet as widely adopted as the more established methods, they demonstrate unique strengths and potential in addressing specific challenges within mangrove studies. This untapped potential highlights the need for further exploration and development by researchers to fully leverage their capabilities in this field.
In the past twenty years, a range of decision tree-based Boosting algorithms has emerged, significantly advancing the field of data analysis. Techniques such as Adaptive Boosting (AdaBoost), GBM, XGBoost, and Light Gradient Boosting Machine (LightGBM) are representative methods within the Boosting family of ML algorithms. Particularly noteworthy are XGBoost and LightGBM, which represent next-generation machine learning models that have seen rapidly growing adoption in remote sensing applications in recent years [91,92,93].
Table 6. Summary of species classification results by other ML methods.
Study AreaStudy TimeDataML AlgorithmsSpeciesOAKappaReference
Fucheng Town, Guangdong Province, China2023GF-1 (hyperspectral 8 m), GF-3 (SAR), Sentinel-2 (multispectral), Landsat-9Extremely Randomized Trees (ERT)SA, KO, AM90.13%0.84[80]
Yingluo Bay, China2024UAV Hyperspectral dataAdaBoostBG, RS, AM, AC, EA, HT, SA82.96%0.79[81]
Yingluo Bay, China2024UAV Hyperspectral dataLightGBM97.15%0.97[81]
Yingluo Bay, China2024UAV Multispectral dataAdaBoost60.05%0.56[81]
Yingluo Bay, China2024UAV Multispectral dataLightGBM80.96%0.78[81]
Qi’ao Island, Guangdong, China2015Worldview-2 (multispectral, 1.5 m)Back Propagation Artificial Neural Network (BP ANN)KO, SA87.68%0.82[94]
Gaoqiao Mangrove Reserve, China2023Sentinel-2 (multispectral), Sentinel-1 (SAR), ALOS-2 (SAR)LightGBMNA92.33%
37%
33.67%
0.912
0.272
0.208
[79]
OA: overall accuracy; SA: Sonneratia apetala; KO: Kandelia obovata; AM: Avicennia marina; AC: Aegiceras corniculatum; AM: Avicennia marina; RS: Rhizophora stylosa; BG: Bruguiera gymnorhiza; EA: Excoecaria agallocha; HT: Hibiscus tiliaceus.
Currently, in remote sensing-based mangrove research using satellites and UAVs, there is no specific method that can be definitively identified as the best for mangrove species classification. This is because many factors can influence classification accuracy, and variations in locations, species composition, and data types. The algorithms used also make it difficult to establish a direct comparison of classification accuracy across studies. SVM and RF were once the most widely used algorithms for mangrove species classification [80,95]. However, both RF and SVM have limited processing capabilities when applied to hyperspectral images or training samples with high noise levels. In contrast, XGBoost not only offers high accuracy and efficient computation but also has the advantage of handling imbalanced datasets, providing superior performance compared to RF [87].
Overall, classifications based on the combination of optical and radar data achieve higher accuracy compared to models trained on single datasets. When using the same ML algorithm, the classification accuracy is directly related to the data type, with hyperspectral data generally outperforming multispectral data, which, in turn, surpasses SAR data. Although radar remote sensing can provide more accurate spatial information with its strong penetration capabilities and useful polarization information, the classification accuracy is often suboptimal when using SAR data alone.
Although SAR data are not the first choice for species classification, they still play a vital role in specific contexts. SAR can easily penetrate cloud cover, enabling all-weather, day-and-night observations. It is highly sensitive to water body changes, making it effective for monitoring mangrove boundary dynamics during tidal fluctuations. While SAR does not provide spectral information, it can capture structural differences between mangroves and low-lying vegetation such as salt marshes, aiding in their differentiation. The integration of optical remote sensing with SAR has been shown to significantly improve classification accuracy; for instance, the accuracy increased from 83.5% to 95% when SAR data were incorporated [70]. Thus, SAR complements optical remote sensing by addressing its limitations in structural characterization and cloud interference.
The utilization of various remote sensing data has significantly expanded the scope of mangrove research while reducing the difficulty of data acquisition. Remote sensing methods have largely replaced traditional field sampling, minimizing human interference with mangrove ecosystems and greatly facilitating mangrove research.

4.5. Accuracy Assessment of ML Algorithms

After applying various ML algorithms in mangrove-related research, an accuracy assessment is required to evaluate the accuracy and reliability of the results. A confusion matrix is a visual tool commonly used for image classification accuracy assessment, as it compares the consistency between the actual ground truth and the model’s classification results to determine the relevant coefficients. This method is particularly valuable in remote sensing-based mangrove research, where data from satellites and UAVs are analyzed. The confusion matrix generally includes four key accuracy metrics, i.e., producer accuracy, user accuracy, overall accuracy, and the Kappa coefficient. These metrics provide a comprehensive evaluation of model performance. Some studies suggest that when both producer accuracy and user accuracy are greater than 85%, the identification of a species can be considered reliable [76]. Conversely, Wang et al. [80] mentioned that the producer accuracy and user accuracy for three mangrove species were both below 75%, indicating lower reliability in species identification.
As shown in Table 7, optical remote sensing combined with ML algorithms (RF, SVM) can achieve high classification accuracy, typically ranging from 80% to 95%. In contrast, classification accuracy using SAR data is generally lower. However, integrating different sensors (optical sensors, UAV-LiDAR, SAR) can significantly enhance classification accuracy. RF is generally the optimal choice, particularly when supported by high-resolution data (Sentinel-2, UAV-LiDAR), where classification accuracy can exceed 90%. Other emerging ML algorithms, such as XGBoost and LightGBM, demonstrate classification accuracy comparable to RF. Nevertheless, as these algorithms are still in the developmental stage, their widespread adoption remains limited compared to the well-established RF algorithm, and available comparative data are relatively scarce. Looking ahead, the development of emerging ML algorithms and their integration with high-resolution UAV and satellite remote sensing data will undoubtedly be a key research focus and direction in the future.
By comparing the overall accuracy and Kappa coefficient of different data combinations or models, one can assess the classification accuracy of mangrove species for specific experiments using various models or data combinations. For instance, Wang et al. [82] compared the accuracy of UAV-LiDAR and Sentinel-2 data when used separately and in combination. When combined, the overall accuracy reached 85.6% and 91.61% in two different research sites, respectively. In contrast, the overall accuracy for Sentinel-2 data alone was 80% and 80.42%, while for UAV-LiDAR data alone, the overall accuracy was 77.6% and 75.52%. Their experiment showed that the combination of both datasets provided higher accuracy. However, due to the different experimental locations, the overall accuracy for the same data combination varied, likely because of differences in mangrove species at both sites. These findings demonstrate that the combined use of both datasets leads to an improvement in classification accuracy compared to using either dataset individually.
Yang et al. [81] conducted an experiment using the same data and four ML algorithms to evaluate their performance in mangrove species classification. Their findings revealed that in both multispectral and hyperspectral data sources, a consistent ranking of algorithm performance was obtained: LightGBM (OA = 80.96%/97.15%) > RF (OA = 80.5%/95.73%) > XGBoost (OA = 80.37%/94.26%) > AdaBoost (OA = 63.05%/82.96%). These results highlighted that hyperspectral data generally provide more effective spectral information for mangrove species classification than multispectral data within the same study area, significantly improving classification accuracy. However, it is important to note that this trend may vary for specific species, depending on their unique spectral characteristics.
Overall, the combination of hyperspectral data with LightGBM or XGBoost is among the most effective approaches currently used for mangrove species classification. While RF remains a robust and reliable option, particularly suitable for studies with moderate sample sizes or relatively balanced class distributions, future advancements could focus on integrating multiple algorithms (such as through ensemble learning) and incorporating field sampling to enhance model generalizability. A major challenge is that current ML models often perform well within specific study areas or datasets but struggle to generalize across different regions. Additionally, classification accuracy is often limited when relying on a single data source. To address these limitations, combining multispectral, hyperspectral, SAR, and LiDAR data can offer richer biophysical information, improving the discrimination of spectrally similar mangrove species. Furthermore, incorporating ecological priors—such as species distribution patterns, environmental preferences, and zonation dynamics—into the ML pipeline can improve interpretability and ecological validity, fostering more robust and meaningful classifications.

5. Mangrove Degradation

With the increasing recognition of the ecological functions of mangrove ecosystems across various sectors of society [96], particularly following the 2004 Indian Ocean tsunami, a global surge in the protection and restoration of mangroves was initiated. These efforts have resulted in a significant reduction in the rate of global mangrove loss, with the rate of decrease in global mangrove extent slowing from 1% to 2% per year to 0.16%–0.39% [97,98,99]. This marks a critical turning point in global mangrove conservation efforts.
Mangroves provide a wide range of valuable ecosystem goods and services, playing a particularly crucial role for residents of Small Island Developing States (SIDS), who heavily depend on these ecosystems for their livelihoods and well-being. For these communities, mangroves serve as a vital source of energy, construction materials for housing, and medical resources [100]. However, in SIDS, mangrove expansion is often constrained by limited land availability, coastal development, and insufficient sediment supply [101], which exacerbates their vulnerability to environmental changes. Beyond SIDS, mangrove ecosystems globally are facing mounting environmental challenges. These challenges are compounded by rising sea levels, ocean acidification, and the increasing frequency of extreme marine events—such as El Niño, La Niña, and nuclear wastewater discharge [102]. Given these threats, large-scale monitoring of mangrove degradation and mortality has become increasingly critical.
Wang et al. [34] found that in recent years, the global extent of mangroves has significantly decreased, with land reclamation and aquaculture ponds being the primary drivers. In addition to these drivers, urbanization, pollution, and extreme climate events have also contributed to the widespread decline and even mortality of mangrove ecosystems. Thomas et al. [103] further highlighted that between 1996 and 2010, no regions within the global mangrove range remained completely intact, with human disturbances or mangrove clearance observed at each site. The most common causes of human-induced changes were the conversion of mangroves into aquaculture ponds or agricultural land, which account for 11.2% of all mangrove losses, particularly in Southeast Asia. Deforestation was another significant cause, almost exclusively occurring in Southeast Asia. These regions experienced the majority of losses and degradation, largely due to the widespread prevalence of aquaculture activities.
Rossi et al. [104] reported large-scale mangrove dieback in Abaco Island, as observed by local fishermen. They constructed a time series of live mangrove vegetation coverage and maximum annual Normalized Difference Vegetation Index (NDVI) from 1989 to 2013 to determine the onset of mangrove dieback. Their results suggested that herbivory might have facilitated the spread of the disease responsible for the dieback at the studied site. Carruthers et al. [105] found that extreme sea-level rise led to mangrove dieback in the Maldives. The average rise in sea level caused prolonged exposure of mangroves to seawater, resulting in a significant influx of saltwater, which likely increased pore water salinity [106]. As salinity exceeded the tolerance threshold of the mangroves, sediment accumulation decreased while soil inundation increased, and salinity stress further intensified. Carruthers et al. [105] suggested that this mechanism created a positive feedback loop, which could have contributed to the observed mangrove tree mortality.
From Table 8, it is evident that while there has been considerable research on mangrove dieback within specific regions, many studies did not attribute mangrove dieback to a single cause. Instead, it is likely that multiple factors are contributing to mangrove dieback. The primary causes most frequently mentioned in these studies include local herbivory [104], hurricane landfalls [107], storms and gusts [108], iron toxicity [109], sea-level rise [110], drought [111], and herbicides [112]. Therefore, the underlying mechanisms of mangrove dieback remain complex and multifaceted, requiring further investigation. Many scholars have systematically investigated mangrove dieback events and introduced new survey methods that differ from traditional field surveys. These include the use of NDVI monitoring, the creation of mangrove boundary maps from remote sensing images for comparing dieback areas, and the integration of ML algorithms with multi-factor analyses. Undoubtedly, remote sensing technology has facilitated large-scale mapping and increasingly detailed identification of conservation issues. Moreover, powerful datasets are continuously being developed and regularly updated, enabling practitioners to monitor conservation efforts more effectively [113].
Overall, mangrove degradation is rarely attributable to a single cause; it is typically the result of multiple interacting ecological factors. Recent technological advances, however, have transformed monitoring capabilities: the application of UAV and satellite remote sensing has significantly simplified the tracking of mangrove degradation while enabling large-scale continuous observation. Crucially, when integrated with field-based ecological surveys and local ecological knowledge of mangrove species, these technologies allow for more precise identification of degradation drivers. Moving forward, research on mangrove degradation should prioritize remote sensing as a core tool, systematically complemented by on-the-ground ecological investigations, to establish a robust scientific foundation for sustainable mangrove conservation and management.

6. Gaps and Uncertainties

The use of UAVs and satellite remote sensing has significantly simplified mangrove ecosystem research, thereby greatly advancing studies in this field. These technologies have demonstrated positive contributions in various aspects, including species classification, species identification, degradation monitoring, and biomass assessment. However, several research gaps and challenges persist. For instance, species classification models and the parameter settings of ML algorithms often rely on researchers’ subjective judgment, as there is no universally accepted standard in the field. This lack of standardization makes it difficult to transfer models developed in one study to another. Additionally, the diversity of datasets influences research variability, and higher-precision remote sensing data generally leads to more accurate classifications. For example, hyperspectral data typically yield higher classification accuracy than multispectral data when using the same algorithm.
Despite facilitating progress in mangrove research, UAV and remote sensing data also have limitations. This is primarily because these methods rely on non-contact data acquisition and spectral information, which poses challenges in capturing certain ecological features. For example, field investigations of mangrove ecosystems reveal that many low-growing mangrove species exist, yet their biological information is often poorly represented in remote sensing data. Although UAVs help overcome the low spatial resolution of satellite imagery, they still have limited effectiveness in collecting biological data on understory vegetation within mangrove forests.
A review of existing studies reveals that research on aboveground biomass in mangrove ecosystems largely relies on allometric growth equations. The typical workflow involves species classification, followed by the use of LiDAR technology to generate three-dimensional models of mangroves and obtain tree height and other structural parameters. These data, combined with field measurements, enable large-scale biomass estimations. However, research on belowground biomass using UAVs and satellite remote sensing is still in its early stages. A significant challenge lies in extracting soil-related data from spectral information, which remains technically complex. Moving forward, to ensure that UAV and satellite remote sensing technologies continue to play an irreplaceable role in mangrove ecology, it is essential to develop more effective ML algorithms, acquire higher-resolution optical remote sensing data, integrate multi-source data, and extract additional information (such as soil data) from optical remote sensing data. These challenges represent critical and unavoidable issues in this research field.
In studies on mangrove degradation, remote sensing technologies offer a convenient means for large-scale monitoring. However, the causes of degradation are often multifaceted, involving local ecological conditions, global climate change, sea-level rise, and other interacting factors. As a result, this complexity makes it difficult to pinpoint the exact causes of degradation solely through remote sensing analysis.
This study synthesizes findings from previously published academic papers. However, the reliance on a single database may introduce certain limitations. Furthermore, in summarizing ML algorithms for mangrove species classification, this study focuses primarily on mainstream algorithms, while less commonly used ML methods are not extensively covered, which represents another limitation. To address these gaps, future research should incorporate multiple databases to enhance the comprehensiveness of the study and strive to include a broader range of ML algorithms.

7. Conclusions

This study reviews various remote sensing techniques used in studying mangroves, with a particular focus on satellite and UAV-based remote sensing technologies. The use of ML algorithms for mangrove species classification, including but not limited to SVM, RF, and XGBoost has been explored, with emphasis on the accuracy of classification results and the effectiveness of different data sources. The results indicate that combining multiple types of remote sensing data (e.g., multispectral, hyperspectral, and SAR data) with ML algorithms can significantly improve classification accuracy. Unlike optical remote sensing, which captures spectral reflectance critical for species differentiation, SAR primarily provides structural information rather than spectral signatures. While SAR data provide better 3D information compared to optical imagery, its classification accuracy is generally lower when used alone. These data can also be used to monitor mangrove dieback. However, mangrove dieback is often due to multiple factors, making it a complex phenomenon to study and address.
In the future, mangrove species classification is expected to adopt model fusion strategies that integrate multiple algorithms, while incorporating prior knowledge into the ML modeling process to enhance both interpretability and ecological relevance. Currently, mangrove classification is often limited by the dimensional constraints of single-source data. The integration of diverse remote sensing datasets, including multispectral, hyperspectral, SAR, and LiDAR, can provide more comprehensive geophysical features, thereby improving classification accuracy, particularly for species with similar spectral signatures. Further, in light of mangrove degradation studies, combining remote sensing with field-based ecological assessments and knowledge of local species’ ecological traits not only refines species mapping but also allows for more accurate identification of degradation drivers.
The accurate identification of mangrove species and delineation of their distribution range is crucial for estimating mangrove carbon stocks. Precise species classification and the determination of mangrove boundaries enable effective monitoring of changes in mangrove areas. The application of satellite and UAV-based remote sensing has significantly advanced research in mangrove ecology, enhancing our understanding of mangrove ecosystems at both the regional and global scales. As complicated classification algorithms are increasingly developed and applied, future classification of mangrove species is expected to be improved. Future studies can more effectively map mangrove species distribution and identify dominant species in specific regions by selecting appropriate ML models and data types and combining them with field sampling data. This approach will not only aid in mangrove conservation and restoration but also inform effective ecological management strategies.

Author Contributions

W.X., X.O., X.X., Y.H., Y.Z., Z.X., B.-O.K. and Z.Y. contributed to the conception and design of the study. W.X. and X.O. analyzed the data and wrote the initial version of the manuscript. X.O. critically revised the manuscript. All authors have read and agreed to the published version of the manuscript.

Funding

This study is supported by the National Natural Science Foundation of China (Grant Nos. 52239005, 52271280), Nansha Key Scientific and Technological Project, Guangdong Province (No. 2023ZD012), ANSO collaborative research (ANSO-CR-KP-2022-11), the Program for Guangdong Introducing Innovative and Entrepreneurial Teams (2019ZT08L213), Guangdong Provincial Key Laboratory Project (2019B121203011), and PI project of Southern Marine Science and Engineering Guangdong Laboratory (Guangzhou) (GML2022009).

Data Availability Statement

Data are available upon request to Xiaoguang Ouyang.

Conflicts of Interest

There are no conflicts of interest in this study.

Abbreviations

The following abbreviations are used in this manuscript:
LiDARLight Detection and Ranging
UAVUnmanned Aerial Vehicle
SARSynthetic Aperture Radar
MABELMultiple Altimeter Beam Experimental Lidar
AGBAbove-ground Biomass
WOSWeb of Science
GISGeographic Information System
SRTMShuttle Radar Topography Mission
SVMSupport Vector Machine
RFRandom Forest
XGBoostExtreme Gradient Boosting
AdaBoostAdaptive Boosting
GBMGradient Boosting Machine
GPSGlobal Positioning System
MLMachine Learning
LightGBMLight Gradient Boosting Machine
SIDSSmall Island Developing States
NDVINormalized Difference Vegetation Index

References

  1. Cao, J.; Liu, K.; Liu, L.; Zhu, Y.; Li, J.; He, Z. Identifying mangrove species using field close-range snapshot hyperspectral imaging and machine-learning techniques. Remote Sens. 2018, 10, 2047. [Google Scholar] [CrossRef]
  2. Ho, D.T.; Lamers, P.; Nawaz, S.; Sugiyama, M.; Fiorini, A.C.O.; Yu, Z.; Holmes, H.; Gadikota, G.; Breyer, C.; Macintosh, A.; et al. Navigating the obstacles of carbon-negative technologies. One Earth 2024, 7, 1471–1476. [Google Scholar] [CrossRef]
  3. Mukherjee, N.; Sutherland, W.J.; Dicks, L.; Huge, J.; Koedam, N.; Dahdouh-Guebas, F. Ecosystem service valuations of mangrove ecosystems to inform decision making and future valuation exercises. PLoS ONE 2014, 9, e107706. [Google Scholar] [CrossRef]
  4. Alongi, D.M. Mangrove forests: Resilience, protection from tsunamis, and responses to global climate change. Estuar. Coast. Shelf Sci. 2008, 76, 1–13. [Google Scholar] [CrossRef]
  5. Ouyang, X.; Maher, D.T.; Santos, I.R. Climate change decreases groundwater carbon discharges in global tidal wetlands. One Earth 2024, 7, 1442–1455. [Google Scholar] [CrossRef]
  6. Ouyang, X.; Lee, S.Y. Improved estimates on global carbon stock and carbon pools in tidal wetlands. Nat. Commun. 2020, 11, 317. [Google Scholar] [CrossRef]
  7. Hati, J.P.; Samanta, S.; Chaube, N.R.; Misra, A.; Giri, S.; Pramanick, N.; Gupta, K.; Majumdar, S.D.; Chanda, A.; Mukhopadhyay, A.; et al. Mangrove classification using airborne hyperspectral AVIRIS-NG and comparing with other spaceborne hyperspectral and multispectral data. Egypt. J. Remote Sens. Space Sci. 2021, 24, 273–281. [Google Scholar]
  8. Wang, L.; Jia, M.; Yin, D.; Tian, J. A review of remote sensing for mangrove forests: 1956–2018. Remote Sens. Environ. 2019, 231, 111223. [Google Scholar] [CrossRef]
  9. Hirata, Y.; Tabuchi, R.; Patanaponpaiboon, P.; Poungparn, S.; Yoneda, R.; Fujioka, Y. Estimation of aboveground biomass in mangrove forests using high-resolution satellite data. J. For. Res. 2014, 19, 34–41. [Google Scholar] [CrossRef]
  10. Huang, Z.; Tian, Y.; Zhang, Q.; Huang, Y.; Liu, R.; Huang, H.; Zhou, G.; Wang, J.; Tao, J.; Yang, Y.; et al. Estimating mangrove above-ground biomass at Maowei Sea, Beibu Gulf of China using machine learning algorithm with Sentinel-1 and Sentinel-2 data. Geocarto Int. 2022, 37, 15778–15805. [Google Scholar] [CrossRef]
  11. Hu, L.; Xu, N.; Liang, J.; Li, Z.; Chen, L.; Zhao, F. Advancing the mapping of mangrove forests at national-scale using Sentinel-1 and Sentinel-2 time-series data with Google Earth Engine: A case study in China. Remote Sens. 2020, 12, 3120. [Google Scholar] [CrossRef]
  12. Li, W.; Gong, P. Continuous monitoring of coastline dynamics in western Florida with a 30-year time series of Landsat imagery. Remote Sens. Environ. 2016, 179, 196–209. [Google Scholar] [CrossRef]
  13. Li, S.; Zhu, Z.; Deng, W.; Zhu, Q.; Xu, Z.; Peng, B.; Guo, F.; Zhang, Y.; Yang, Z. Estimation of aboveground biomass of different vegetation types in mangrove forests based on UAV remote sensing. Sustain. Horiz. 2024, 11, 100100. [Google Scholar] [CrossRef]
  14. Roy, A.D.; Arachchige, P.S.P.; Watt, M.S.; Kale, A.; Davies, M.; Heng, J.E.; Daneil, R.; Galgamuwa, G.P.; Moussa, L.G.; Timsina, K.; et al. Remote sensing-based mangrove blue carbon assessment in the Asia-Pacific: A systematic review. Sci. Total Environ. 2024, 938, 173270. [Google Scholar]
  15. Tian, Y.; Jia, M.; Wang, Z.; Mao, D.; Du, B.; Wang, C. Monitoring invasion process of Spartina alterniflora by seasonal Sentinel-2 imagery and an object-based random forest classification. Remote Sens. 2020, 12, 1383. [Google Scholar] [CrossRef]
  16. Salum, R.B.; Souza-Filho, P.W.M.; Simard, M.; Silva, C.A.; Fernandes, M.E.; Cougo, M.F.; Rogers, K. Improving mangrove above-ground biomass estimates using LiDAR. Estuar. Coast. Shelf Sci. 2020, 236, 106585. [Google Scholar] [CrossRef]
  17. Tran, T.V.; Reef, R.; Zhu, X. A review of spectral indices for mangrove remote sensing. Remote Sens. 2022, 14, 4868. [Google Scholar] [CrossRef]
  18. Nellemann, C.; Corcoran, E.; Duarte, C.M.; Valdés, L.; De Young, C.; Fonseca, L.; Grimsditch, G. Blue Carbon. A Rapid Response Assessment. United Nations Environment Programme, GRID-Arendal. 2009. Available online: https://www.grida.no/publications/145 (accessed on 1 June 2014).
  19. Hossain, M.S.; Bujang, J.S.; Zakaria, M.H.; Hashim, M. The application of remote sensing to seagrass ecosystems: An overview and future research prospects. Int. J. Remote Sens. 2015, 36, 61–114. [Google Scholar] [CrossRef]
  20. Rondon, M.; Ewane, E.B.; Abdullah, M.M.; Watt, M.S.; Blanton, A.; Abulibdeh, A.; Burt, J.A.; Rogers, K.; Ali, T.; Reef, R.; et al. Remote sensing-based assessment of mangrove ecosystems in the Gulf Cooperation Council countries: A systematic review. Front. Mar. Sci. 2023, 10, 1241928. [Google Scholar] [CrossRef]
  21. He, Y.; Zhang, T.; You, S.; Luo, Z.; Zhang, X.; Zhang, R. Remote Sensing Monitoring of Mangrove Variation in Jiulong River Estuary of Fujian from 1978 to 2018. In Proceedings of the IGARSS 2020—2020 IEEE International Geoscience and Remote Sensing Symposium, Waikoloa, HI, USA, 26 September–2 October 2020; pp. 6654–6657. [Google Scholar]
  22. Jamaluddin, I.; Chen, Y.N.; Ridha, S.M.; Mahyatar, P.; Ayudyanti, A.G. Two Decades Mangroves Loss Monitoring Using Random Forest and Landsat Data in East Luwu, Indonesia (2000–2020). Geomatics 2022, 2, 282–296. [Google Scholar] [CrossRef]
  23. Fu, B.; Jiang, L.; Yao, H.; Wei, Y.; Jia, M.; Sun, W.; Deng, T. Retrieval performance of mangrove tree heights using multiple machine learning regression models and UAV-LiDAR point clouds. Int. J. Digit. Earth 2024, 17, 2392851. [Google Scholar] [CrossRef]
  24. Li, Q.; Wong, F.K.K.; Fung, T.; Brown, L.A.; Dash, J. Assessment of active LiDAR data and passive optical imagery for double-layered mangrove leaf area index estimation: A case study in Mai Po, Hong Kong. Remote Sens. 2023, 15, 2551. [Google Scholar] [CrossRef]
  25. Halder, B.; Pereira, P. Climate change impacts assessment on Bangladesh Mangrove Forest using high-resolution datasets and Google Earth Engine. J. Coast. Conserv. 2024, 28, 24. [Google Scholar] [CrossRef]
  26. Yin, D.; Wang, L. Individual mangrove tree measurement using UAV-based LiDAR data: Possibilities and challenges. Remote Sens. Environ. 2019, 223, 34–49. [Google Scholar] [CrossRef]
  27. Li, Z.; Zan, Q.; Yang, Q.; Zhu, D.; Chen, Y.; Yu, S. Remote estimation of mangrove aboveground carbon stock at the species level using a low-cost unmanned aerial vehicle system. Remote Sens. 2019, 11, 1018. [Google Scholar] [CrossRef]
  28. Zimudzi, E.; Sanders, I.; Rollings, N.; Omlin, C.W. Remote sensing of mangroves using unmanned aerial vehicles: Current state and future directions. J. Spat. Sci. 2021, 66, 195–212. [Google Scholar] [CrossRef]
  29. Chen, R.; Zhang, R.; Zhao, C.; Wang, Z.; Jia, M. High-resolution mapping of mangrove species height in Fujian Zhangjiangkou National Mangrove Nature Reserve combined GF-2, GF-3, and UAV-LiDAR. Remote Sens. 2023, 15, 5645. [Google Scholar] [CrossRef]
  30. Pham, T.D.; Yokoya, N.; Bui, D.T.; Yoshino, K.; Friess, D.A. Remote sensing approaches for monitoring mangrove species, structure, and biomass: Opportunities and challenges. Remote Sens. 2019, 11, 230. [Google Scholar] [CrossRef]
  31. Deng, L.; Chen, B.; Yan, M.; Fu, B.; Yang, Z.; Zhang, B.; Zhang, L. Estimation of Species-Scale Canopy Chlorophyll Content in Mangroves from UAV and GF-6 Data. Forests 2023, 14, 1417. [Google Scholar] [CrossRef]
  32. Zhu, X.; Wang, C.; Nie, S.; Pan, F.; Xi, X.; Hu, Z. Mapping forest height using photon-counting LiDAR data and Landsat 8 OLI data: A case study in Virginia and North Carolina, USA. Ecol. Indic. 2020, 114, 106287. [Google Scholar] [CrossRef]
  33. Wang, D.; Wan, B.; Qiu, P.; Zuo, Z.; Wang, R.; Wu, X. Mapping height and aboveground biomass of mangrove forests on Hainan Island using UAV-LiDAR sampling. Remote Sens. 2019, 11, 2156. [Google Scholar] [CrossRef]
  34. Wang, W.; Shi, J.B.; Chen, L.Z. Research of Conservation and Restoration Strategy of Mangrove Wetlands in China; China Environmental Science Press: Beijing, China, 2021. [Google Scholar]
  35. Donato, D.C.; Kauffman, J.B.; Murdiyarso, D.; Kurnianto, S.; Stidham, M.; Kanninen, M. Mangroves among the most carbon-rich forests in the tropics. Nat. Geosci. 2011, 4, 293–297. [Google Scholar] [CrossRef]
  36. Pendleton, L.; Donato, D.C.; Murray, B.C.; Crooks, S.; Jenkins, W.A.; Sifleet, S.; Craft, C.; Fourqurean, J.W.; Kauffman, J.B.; Marbà, N.; et al. Estimating global “blue carbon” emissions from conversion and degradation of vegetated coastal ecosystems. PLoS ONE 2012, 7, e43542. [Google Scholar] [CrossRef] [PubMed]
  37. Siikamäki, J.; Sanchirico, J.N.; Jardine, S.L. Global economic potential for reducing carbon dioxide emissions from mangrove loss. Proc. Natl. Acad. Sci. USA 2012, 109, 14369–14374. [Google Scholar] [CrossRef] [PubMed]
  38. Howard, J.; Sutton-Grier, A.; Herr, D.; Kleypas, J.; Landis, E.; Mcleod, E.; Pidgeon, E.; Simpson, S. Clarifying the role of coastal and marine systems in climate mitigation. Front. Ecol. Environ. 2017, 15, 42–50. [Google Scholar] [CrossRef]
  39. Jardine, S.L.; Siikamäki, J.V. A global predictive model of carbon in mangrove soils. Environ. Res. Lett. 2014, 9, 104013. [Google Scholar] [CrossRef]
  40. Chmura, G.L.; Anisfeld, S.C.; Cahoon, D.R.; Lynch, J.C. Global carbon sequestration in tidal, saline wetland soils. Global Biogeochem. Cycles 2003, 17, 1111. [Google Scholar] [CrossRef]
  41. Kristensen, E.; Bouillon, S.; Dittmar, T.; Marchand, C. Organic carbon dynamics in mangrove ecosystems: A review. Aquat. Bot. 2008, 89, 201–219. [Google Scholar] [CrossRef]
  42. Saenger, P.; Snedaker, S.C. Pantropical trends in mangrove above-ground biomass and annual litterfall. Oecologia 1993, 96, 293–299. [Google Scholar] [CrossRef]
  43. Stringer, C.E.; Trettin, C.C.; Zarnoch, S.J.; Tang, W. Carbon stocks of mangroves within the Zambezi River Delta, Mozambique. For. Ecol. Manag. 2015, 354, 139–148. [Google Scholar] [CrossRef]
  44. Kauffman, J.B.; Donato, D.C. Protocols for the Measurement, Monitoring and Reporting of Structure, Biomass and Carbon Stocks in Mangrove Forests; Cifor: Bogor, Indonesia, 2012; Volume 86. [Google Scholar]
  45. Tang, W.; Zheng, M.; Zhao, X.; Shi, J.; Yang, J.; Trettin, C.C. Big geospatial data analytics for global mangrove biomass and carbon estimation. Sustainability 2018, 10, 472. [Google Scholar] [CrossRef]
  46. Fatoyinbo, T.E.; Simard, M. Height and biomass of mangroves in Africa from ICESat/GLAS and SRTM. Int. J. Remote Sens. 2013, 34, 668–681. [Google Scholar] [CrossRef]
  47. Tang, W.; Feng, W.; Jia, M.; Shi, J.; Zuo, H.; Trettin, C.C. The assessment of mangrove biomass and carbon in West Africa: A spatially explicit analytical framework. Wetlands Ecol. Manag. 2016, 24, 153–171. [Google Scholar] [CrossRef]
  48. Giri, C.; Ochieng, E.; Tieszen, L.L.; Zhu, Z.; Singh, A.; Loveland, T.; Masek, J.; Duke, N. Status and distribution of mangrove forests of the world using earth observation satellite data. Global Ecol. Biogeogr. 2011, 20, 154–159. [Google Scholar] [CrossRef]
  49. Hutchison, J.; Manica, A.; Swetnam, R.; Balmford, A.; Spalding, M. Predicting global patterns in mangrove forest biomass. Conserv. Lett. 2014, 7, 233–240. [Google Scholar] [CrossRef]
  50. Manyika, J. Big Data: The Next Frontier for Innovation, Competition, and Productivity; McKinsey Global Institute: New York, NY, USA, 2011. [Google Scholar]
  51. Tamai, S.; Nakasuga, T.; Tabuchi, R.; Ogino, K. Standing biomass of mangrove forests in southern Thailand. J. Jpn. For. Soc. 1986, 68, 384–388. [Google Scholar]
  52. Slim, F.J.; Gwada, P.M.; Kodjo, M.; Hemminga, M.A. Biomass and litterfall of Ceriops tagal and Rhizophora mucronata in the mangrove forest of Gazi Bay, Kenya. Mar. Freshwater Res. 1996, 47, 999–1007. [Google Scholar] [CrossRef]
  53. Ross, M.S.; Ruiz, P.L.; Telesnicki, G.J.; Meeder, J.F. Estimating above-ground biomass and production in mangrove communities of Biscayne National Park, Florida (USA). Wetlands Ecol. Manag. 2001, 9, 27–37. [Google Scholar] [CrossRef]
  54. Soares, M.L.G.; Schaeffer-Novelli, Y. Above-ground biomass of mangrove species. I. Analysis of models. Estuar. Coast. Shelf Sci. 2005, 65, 1–18. [Google Scholar] [CrossRef]
  55. Komiyama, A.; Ong, J.E.; Poungparn, S. Allometry, biomass, and productivity of mangrove forests: A review. Aquat. Bot. 2008, 89, 128–137. [Google Scholar] [CrossRef]
  56. Mitra, A.; Sengupta, K.; Banerjee, K. Standing biomass and carbon storage of above-ground structures in dominant mangrove trees in the Sundarbans. For. Ecol. Manag. 2011, 261, 1325–1335. [Google Scholar] [CrossRef]
  57. Comley, B.W.T.; McGuinness, K.A. Above-and below-ground biomass, and allometry, of four common northern Australian mangroves. Aust. J. Bot. 2005, 53, 431–436. [Google Scholar] [CrossRef]
  58. Tian, Y.; Huang, H.; Zhou, G.; Zhang, Q.; Tao, J.; Zhang, Y.; Lin, J. Aboveground mangrove biomass estimation in Beibu Gulf using machine learning and UAV remote sensing. Sci. Total Environ. 2021, 781, 146816. [Google Scholar] [CrossRef]
  59. Rogan, J.; Chen, D. Remote sensing technology for mapping and monitoring land-cover and land-use change. Prog. Plann. 2004, 61, 301–325. [Google Scholar] [CrossRef]
  60. Heenkenda, M.K.; Joyce, K.E.; Maier, S.W.; Bartolo, R. Mangrove species identification: Comparing WorldView-2 with aerial photographs. Remote Sens. 2014, 6, 6064–6088. [Google Scholar] [CrossRef]
  61. Kamal, M.; Phinn, S. Hyperspectral data for mangrove species mapping: A comparison of pixel-based and object-based approach. Remote Sens. 2011, 3, 2222–2242. [Google Scholar] [CrossRef]
  62. Pu, R.; Landry, S. A comparative analysis of high spatial resolution IKONOS and WorldView-2 imagery for mapping urban tree species. Remote Sens. Environ. 2012, 124, 516–533. [Google Scholar] [CrossRef]
  63. Wang, D.; Wan, B.; Qiu, P.; Su, Y.; Guo, Q.; Wu, X. Artificial mangrove species mapping using pléiades-1: An evaluation of pixel-based and object-based classifications with selected machine learning algorithms. Remote Sens. 2018, 10, 294. [Google Scholar] [CrossRef]
  64. Andrew, A.M. An introduction to support vector machines and other kernel-based learning methods. Kybernetes 2001, 30, 103–115. [Google Scholar] [CrossRef]
  65. Yao, Y.J.; Zhang, Z.X.; Qin, Q.M.; Qiu, Y.F. Study on wetland information extraction of remote sensing images based on support vector machine. J. Appl. Res. Comput. 2008, 25, 989–991. [Google Scholar]
  66. Wang, Z.; Sun, J.; Yu, Z.; Bu, Y. Review of remote sensing image classification based on support vector machine. Comput. Sci. 2016, 43, 8–15. [Google Scholar]
  67. Zhang, C.; Zang, S.Y.; Jin, Z.; Zhang, Y.H. Remote sensing classification for Zhalong Wetlands based on support vector machine. Wetland Sci. 2011, 9, 263–269. [Google Scholar]
  68. Buser, B. A training algorithm for optimal margin classifier. In Proceedings of the 5th Annual ACM Workshop on Computational Learning Theory, Pittsburgh, PA, USA, 27–29 July 1992; pp. 144–152. [Google Scholar]
  69. Ding, H.Y.; Bian, Z.F. Theory of support vector machine and its applications in remote sensing image processing. Comput. Eng. Des. 2008, 5, 62–65. [Google Scholar]
  70. Zhen, J.; Liao, J.; Shen, G. Mapping mangrove forests of Dongzhaigang nature reserve in China using Landsat 8 and Radarsat-2 polarimetric SAR data. Sensors 2018, 18, 4012. [Google Scholar] [CrossRef]
  71. Fu, C.; Song, X.; Xie, Y.; Wang, C.; Luo, J.; Fang, Y.; Cao, B.; Qiu, Z. Research on the spatiotemporal evolution of mangrove forests in the Hainan Island from 1991 to 2021 based on SVM and Res-UNet algorithms. Remote Sens. 2022, 14, 5554. [Google Scholar] [CrossRef]
  72. Vidhya, R.; Vijayasekaran, D.; Ahamed Farook, M.; Jai, S.; Rohini, M.; Sinduja, A. Improved classification of mangroves health status using hyperspectral remote sensing data. Int. Arch. Photogramm. Remote Sens. Spat. Inf. Sci. 2014, 40, 667–670. [Google Scholar] [CrossRef]
  73. Li, Q.; Wong, F.K.K.; Fung, T. Mapping multi-layered mangroves from multispectral, hyperspectral, and LiDAR data. Remote Sens. Environ. 2021, 258, 112403. [Google Scholar] [CrossRef]
  74. Saputra, R.; Gaol, J.L.; Agus, S.B. Study of mangrove coverage change based on object (OBIA) using satellite imagery in Dompak Island Province of Kepulauan Riau. IOP Conf. Ser. Earth Environ. Sci. 2021, 713, 012001. [Google Scholar]
  75. Foody, G.M.; Mathur, A. A relative evaluation of multiclass image classification by support vector machines. IEEE Trans. Geosci. Remote Sens. 2004, 42, 1335–1343. [Google Scholar] [CrossRef]
  76. Belgiu, M.; Drăguţ, L. Random forest in remote sensing: A review of applications and future directions. ISPRS J. Photogramm. Remote Sens. 2016, 114, 24–31. [Google Scholar] [CrossRef]
  77. Zhao, C.; Qin, C.Z.; Wang, Z.; Mao, D.; Wang, Y.; Jia, M. Decision surface optimization in mapping exotic mangrove species (Sonneratia apetala) across latitudinal coastal areas of China. ISPRS J. Photogramm. Remote Sens. 2022, 193, 269–283. [Google Scholar] [CrossRef]
  78. Breiman, L. Random forests. Mach. Learn. 2001, 45, 5–32. [Google Scholar] [CrossRef]
  79. Shen, Z.; Miao, J.; Wang, J.; Zhao, D.; Tang, A.; Zhen, J. Evaluating Feature Selection Methods and Machine Learning Algorithms for Mapping Mangrove Forests Using Optical and Synthetic Aperture Radar Data. Remote Sens. 2023, 15, 5621. [Google Scholar] [CrossRef]
  80. Wang, X.; Tan, L.; Fan, J. Performance evaluation of mangrove species classification based on multi-source Remote Sensing data using extremely randomized trees in Fucheng Town, Leizhou city, Guangdong Province. Remote Sens. 2023, 15, 1386. [Google Scholar] [CrossRef]
  81. Yang, Y.; Meng, Z.; Zu, J.; Cai, W.; Wang, J.; Su, H.; Yang, J. Fine-scale mangrove species classification based on UAV multispectral and hyperspectral remote sensing using machine learning. Remote Sens. 2024, 16, 3093. [Google Scholar] [CrossRef]
  82. Wang, D.; Wan, B.; Qiu, P.; Tan, X.; Zhang, Q. Mapping mangrove species using combined UAV-LiDAR and Sentinel-2 data: Feature selection and point density effects. Adv. Space Res. 2022, 69, 1494–1512. [Google Scholar] [CrossRef]
  83. Nagarajan, P.; Rajendran, L.; Pillai, N.D.; Lakshmanan, G. Comparison of machine learning algorithms for mangrove species identification in Malad creek, Mumbai using WorldView-2 and Google Earth images. J. Coast. Conserv. 2022, 26, 44. [Google Scholar] [CrossRef]
  84. Chan-Bagot, K.; Herndon, K.E.; Puzzi Nicolau, A.; Martín-Arias, V.; Evans, C.; Parache, H.; Mosely, K.; Narine, Z.; Zutta, B. Integrating SAR, optical, and machine learning for enhanced coastal mangrove monitoring in Guyana. Remote Sens. 2024, 16, 542. [Google Scholar] [CrossRef]
  85. Miraki, M.; Sohrabi, H.; Immitzer, M. Tree Species Mapping in Mangrove Ecosystems Using UAV-RGB Imagery and Object-Based Image Classification. J. Indian Soc. Remote Sens. 2023, 51, 2095–2103. [Google Scholar] [CrossRef]
  86. Jafarzadeh, H.; Mahdianpari, M.; Gill, E.; Mohammadimanesh, F.; Homayouni, S. Bagging and boosting ensemble classifiers for classification of multispectral, hyperspectral and PolSAR data: A comparative evaluation. Remote Sens. 2021, 13, 4405. [Google Scholar] [CrossRef]
  87. Chen, T.; Guestrin, C. Xgboost: A scalable tree boosting system. In Proceedings of the 22nd ACM Sigkdd International Conference on Knowledge Discovery and Data Mining, San Francisco, CA, USA, 13–17 August 2016; pp. 785–794. [Google Scholar]
  88. Zhong, L.; Hu, L.; Zhou, H. Deep learning based multi-temporal crop classification. Remote Sens. Environ. 2019, 221, 430–443. [Google Scholar] [CrossRef]
  89. Ou, J.; Tian, Y.; Zhang, Q.; Xie, X.; Zhang, Y.; Tao, J.; Lin, J. Coupling UAV Hyperspectral and LiDAR Data for Mangrove Classification Using XGBoost in China’s Pinglu Canal Estuary. Forests 2023, 14, 1838. [Google Scholar] [CrossRef]
  90. Zhen, J.; Mao, D.; Shen, Z.; Zhao, D.; Xu, Y.; Wang, J.; Jia, M.; Wang, Z.; Ren, C. Performance of XGBoost Ensemble Learning Algorithm for Mangrove Species Classification with Multisource Spaceborne Remote Sensing Data. J. Remote Sens. 2024, 4, 0146. [Google Scholar] [CrossRef]
  91. Georganos, S.; Grippa, T.; Vanhuysse, S.; Lennert, M.; Shimoni, M.; Kalogirou, S.; Wolff, E. Less is more: Optimizing classification performance through feature selection in a very-high-resolution remote sensing object-based urban application. GISci. Remote Sens. 2018, 55, 221–242. [Google Scholar] [CrossRef]
  92. Ustuner, M.; Balik Sanli, F. Polarimetric target decompositions and light gradient boosting machine for crop classification: A comparative evaluation. ISPRS Int. J. Geo-Inf. 2019, 8, 97. [Google Scholar] [CrossRef]
  93. Abdi, A.M. Land cover and land use classification performance of machine learning algorithms in a boreal landscape using Sentinel-2 data. GISci. Remote Sens. 2020, 57, 1–20. [Google Scholar] [CrossRef]
  94. Zhu, Y.; Liu, K.; Liu, L.; Wang, S.; Liu, H. Retrieval of mangrove aboveground biomass at the individual species level with worldview-2 images. Remote Sens. 2015, 7, 12192–12214. [Google Scholar] [CrossRef]
  95. Rahmandhana, A.D.; Kamal, M.; Wicaksono, P. Spectral reflectance-based mangrove species mapping from worldview-2 imagery of Karimunjawa and Kemujan Island, Central Java Province, Indonesia. Remote Sens. 2022, 14, 183. [Google Scholar] [CrossRef]
  96. Costanza, R.; De Groot, R.; Sutton, P.; Van der Ploeg, S.; Anderson, S.J.; Kubiszewski, I.; Farber, S.; Turner, R.K. Changes in the global value of ecosystem services. Global Environ. Change 2014, 26, 152–158. [Google Scholar] [CrossRef]
  97. Hamilton, S.E.; Casey, D. Creation of a high spatio-temporal resolution global database of continuous mangrove forest cover for the 21st century (CGMFC-21). Global Ecol. Biogeogr. 2016, 25, 729–738. [Google Scholar] [CrossRef]
  98. Lewis, R.R. Mangrove restoration-Costs and benefits of successful ecological restoration. In Proceedings of the Mangrove Valuation Workshop, George, Malaysia, 4–8 April 2001; Volume 4. [Google Scholar]
  99. Richards, D.R.; Friess, D.A. Rates and drivers of mangrove deforestation in Southeast Asia, 2000–2012. Proc. Natl. Acad. Sci. USA 2016, 113, 344–349. [Google Scholar] [CrossRef]
  100. Ruslan, N.F.N.; Goh, H.C.; Hattam, C.; Edwards-Jones, A.; Moh, H.H. Mangrove ecosystem services: Contribution to the well-being of the coastal communities in Klang Islands. Mar. Policy 2022, 144, 105222. [Google Scholar] [CrossRef]
  101. Lovelock, C.E.; Cahoon, D.R.; Friess, D.A.; Guntenspergen, G.R.; Krauss, K.W.; Reef, R.; Rogers, K.; Saunders, M.L.; Sidik, F.; Swales, A.; et al. The vulnerability of Indo-Pacific mangrove forests to sea-level rise. Nature 2015, 526, 559–563. [Google Scholar] [CrossRef]
  102. Harris, R.M.; Beaumont, L.J.; Vance, T.R.; Tozer, C.R.; Remenyi, T.A.; Perkins-Kirkpatrick, S.E.; Mitchell, P.J.; Nicotra, A.B.; McGregor, S.; Andrew, N.R.; et al. Biological responses to the press and pulse of climate trends and extreme events. Nat. Clim. Change 2018, 8, 579–587. [Google Scholar] [CrossRef]
  103. Thomas, N.; Lucas, R.; Bunting, P.; Hardy, A.; Rosenqvist, A.; Simard, M. Distribution and drivers of global mangrove forest change, 1996–2010. PLoS ONE 2017, 12, e0179302. [Google Scholar] [CrossRef]
  104. Rossi, R.E.; Archer, S.K.; Giri, C.; Layman, C.A. The role of multiple stressors in a dwarf red mangrove (Rhizophora mangle) dieback. Estuar. Coast. Shelf Sci. 2020, 237, 106660. [Google Scholar] [CrossRef]
  105. Carruthers, L.; Ersek, V.; Maher, D.; Sanders, C.; Tait, D.; Soares, J.; Floyd, M.; Hashim, A.S.; Helber, S.; Garnett, M.; et al. Sea-level rise and extreme Indian Ocean Dipole explain mangrove dieback in the Maldives. Sci. Rep. 2024, 14, 27012. [Google Scholar] [CrossRef] [PubMed]
  106. Dittmann, S.; Mosley, L.; Stangoulis, J.; Nguyen, V.L.; Beaumont, K.; Dang, T.; Guan, H.; Gutierrez-Jurado, K.; Lam-Gordillo, O.; McGrath, A. Effects of extreme salinity stress on a temperate mangrove ecosystem. Front. For. Global Change 2022, 5, 859283. [Google Scholar] [CrossRef]
  107. Lagomasino, D.; Fatoyinbo, T.; Castañeda-Moya, E.; Cook, B.D.; Montesano, P.M.; Neigh, C.S.; Corp, L.A.; Ott, L.E.; Chavez, S.; Morton, D.C. Storm surge and ponding explain mangrove dieback in southwest Florida following Hurricane Irma. Nat. Commun. 2021, 12, 4003. [Google Scholar] [CrossRef]
  108. Servino, R.N.; de Oliveira Gomes, L.E.; Bernardino, A.F. Extreme weather impacts on tropical mangrove forests in the Eastern Brazil Marine Ecoregion. Sci. Total Environ. 2018, 628, 233–240. [Google Scholar] [CrossRef]
  109. Sippo, J.Z.; Santos, I.R.; Sanders, C.J.; Gadd, P.; Hua, Q.; Lovelock, C.E.; Santini, N.S.; Johnston, S.G.; Harada, Y.; Reithmeir, G.; et al. Reconstructing extreme climatic and geochemical conditions during the largest natural mangrove dieback on record. Biogeosciences 2020, 17, 4707–4726. [Google Scholar] [CrossRef]
  110. Lovelock, C.E.; Feller, I.C.; Reef, R.; Hickey, S.; Ball, M.C. Mangrove dieback during fluctuating sea levels. Sci. Rep. 2017, 7, 1680. [Google Scholar] [CrossRef]
  111. Duke, N.C.; Kovacs, J.M.; Griffiths, A.D.; Preece, L.; Hill, D.J.; Van Oosterzee, P.; Mackenzie, J.; Morning, H.S.; Burrows, D. Large-scale dieback of mangroves in Australia’s Gulf of Carpentaria: A severe ecosystem response, coincidental with an unusually extreme weather event. Mar. Freshwater Res. 2017, 68, 1816–1829. [Google Scholar] [CrossRef]
  112. Duke, N.C.; Bell, A.M.; Pederson, D.K.; Roelfsema, C.M.; Nash, S.B. Herbicides implicated as the cause of severe mangrove dieback in the Mackay region, NE Australia: Consequences for marine plant habitats of the GBR World Heritage Area. Mar. Pollut. Bull. 2005, 51, 308–324. [Google Scholar] [CrossRef]
  113. Bryan-Brown, D.N.; Connolly, R.M.; Richards, D.R.; Adame, F.; Friess, D.A.; Brown, C.J. Global trends in mangrove forest fragmentation. Sci. Rep. 2020, 10, 7117. [Google Scholar] [CrossRef] [PubMed]
  114. Asbridge, E.F.; Bartolo, R.; Finlayson, C.M.; Lucas, R.M.; Rogers, K.; Woodroffe, C.D. Assessing the distribution and drivers of mangrove dieback in Kakadu National Park, northern Australia. Estuar. Coast. Shelf Sci. 2019, 228, 106353. [Google Scholar] [CrossRef]
  115. Ghosh, S.; Proisy, C.; Muthusankar, G.; Hassenrück, C.; Helfer, V.; Mathevet, R.; Andrieu, J.; Balachandran, N.; Narendran, R. Multiscale Diagnosis of Mangrove Status in Data-Poor Context Using Very High Spatial Resolution Satellite Images: A Case Study in Pichavaram Mangrove Forest, Tamil Nadu, India. Remote Sens. 2022, 14, 2317. [Google Scholar] [CrossRef]
Figure 1. Publications and citations related to mangrove remote sensing from 1990 to 2024. The blue bars demote publication counts and the yellow line denotes citations.
Forests 16 00870 g001
Figure 2. Cumulative numbers of publications based on UAV and satellite remote sensing across the top 10 countries (a), the publication numbers by continent (b).
Forests 16 00870 g002
Figure 3. Technical approach for mangrove ecosystem research based on satellite and UAV remote sensing.
Forests 16 00870 g003
Table 1. Detailed search information.
CriteriaTopicPublication DateLanguage
Search terms“Mangrove AND UAV” OR “Mangrove AND Unmanned Aerial Vehicle” OR “Mangrove AND remote sensing” OR “Mangrove AND multispectral” OR “Mangrove AND hyperspectral” OR “Mangrove AND Landsat” OR “Mangrove AND Gaofen” OR “Mangrove AND GF” OR “Mangrove AND sentinel” OR “Mangrove AND LiDAR”January 1990 to October 2024English
WoS primarily covers fields such as natural sciences, engineering, and medicine and includes a large number of English-language journals. As a result, it is a suitable database for this study. However, WoS also has certain limitations. Specifically, it contains relatively few non-English publications, particularly those in Russian and French, which may lead to the omission of important regional research findings. Additionally, WoS relies on searches based on titles, abstracts, and keywords, rather than the full text of articles, which may limit the precision of retrieval results. To mitigate these limitations, this study employs topic-based search queries, ensuring that the selected search terms are as broad as possible to maximize the number of relevant articles retrieved.
Table 2. Comparison among traditional field investigation, UAV, and remote sensing.
Traditional Field InvestigationUAV-LiDAR and RS
Able to measure diameter at breast height, tree height, and biomass of individual treeLimited by resolution, difficult to obtain detailed information on individual plants
DestructiveNon-destructive
Small-scale, limited by logistics and time, only covers local sitesLarge scale, suitable for regional or global monitoring
Affected by tides, weather, and terrain; some areas are difficult to accessAffected by cloud cover and atmospheric interference, especially in tropical and coastal regions
High cost, due to labor, transportation, and equipment expensesLow cost (some satellite data are free), but high-resolution data may be paid
Suitable for small-scale, high-precision studies such as species identification and soil analysisSuitable for large-scale, long-term monitoring such as mangrove range changes and ecosystem health assessment
Table 3. Summary of species classification results by SVM.
Study AreaStudy TimeDataSpeciesOAKappaReference
Sundarbans Biosphere Reserve, India (40%) and Bangladesh (60%)2021Landsat 8 OLI
(multispectral 30 m),
Hyperion
(hyperspectral 30 m),
Sentinel-2 data
(multispectral)
AA, AM, AO, AR, BC, BG, CD, CE, EA, PP, SA76.42%
81.98%
79.81%
0.71
0.78
0.75
[7]
Dongzhaigang, China2018Radarsat-2 (SAR), Landsat-8 (multispectral 30 m)NA53.4%
83.5%
95%
(combined data)
0.46
0.80
0.95
[70]
Hainan Island, China2022Landsat-5 TM (30 m), Landsat-8 OLI (multispectral 30 m)NA94.2%
(2021)
0.82[71]
Thuraikkadu Reserve Forest area, India2014Hyperion (hyperspectral 30 m), Earth Observing -1 (hyperspectral 30 m)NA73.74%0.62[72]
Mai Po Nature Reserve, HK, China2021Worldview 3
(hyperspectral 30 m), LiDAR data
AC, AI, AM, KO, AI, SA84%0.81[73]
Indonesia2021SPOT 4 (multispectral 20 m), Sentinel 2B (multispectral)NA89%0.86[74]
OA: overall accuracy; NA: not available. AA: Avicennia alba; AM: Avicennia marina; AO: Avicennia officinalis; AR: Avicennia rotundifolia; BC: Bruguiera cylindrica; BG: Bruguiera gymnorhiza; CD: Ceriops decandra; CE: Casuarina equisetifolia; EA: Excoecaria agallocha; PP: Phoenix paludosa; SA: Sonneratia apetala; AC: Aegiceras corniculatum; AI: Acanthus ilicifolius; KO: Kandelia obovata; KOAI: Kandelia obovata and Acanthus ilicifolius.
Table 4. Summary of species classification results by RF.
Study AreaStudy TimeDataSpeciesOAKappaReference
Zhangjiangkou National Mangrove Nature Reserve, China2023GF-2 PMS image
(hyperspectral 8 m), GF-3 polarimetric SAR and UAV-LiDAR
KO, AC, AM, SA91.43%0.89[29]
Fucheng Town, Guangdong Province, China2023GF-1 (hyperspectral 8 m), GF-3(SAR), Sentinel-2 (multispectral), Landsat-9SA, KO, AM88.47%0.81[80]
Yingluo Bay, Guangxi, China2024UAV multispectral, hyperspectral image BG, RS, AM, AC, EA, HT, SA80.5%
95.73%
0.77
0.95
[81]
Dongzhaigang National Nature Reserve and Qinglangang Nature Reserve, Hainan Island, China2022Sentinel-2
(multispectral) and UAV-LiDAR
RS, CT, AM, BS, LR, EA, SS85.6%
91.61%
0.79
0.86
[82]
Gaoqiao Mangrove Reserve, China2023Sentinel-2 (multispectral), Sentinel-1 (SAR), ALOS-2 (SAR)NA92.67%
39.67%
30.33%
0.915
0.302
0.194
[79]
Malad Creek, India2022WorldView-2
(multispectral, 1.5 m)
AM88.64%0.86[83]
Guyana2024Landsat-8 OIL
(multispectral 30 m), Sentinel-2 MSI (multispectral) and Sentinel-1 SAR
NA95%NA[84]
Sirik, southern Iran2023UAVRM, AM98%0.97[85]
OA: overall accuracy; KO: Kandelia obovata; AC: Aegiceras corniculatum; AM: Avicennia marina; SA: Sonneratia apetala; RS: Rhizophora stylosa; BG: Bruguiera gymnorhiza; EA: Excoecaria agallocha; HT: Hibiscus tiliaceus; CT: Ceriops tagal; BS: Bruguiera sexangula; LR: Lumnitzera racemosa; SS: Sonneratia spp.; RM: Rhizophora mucronata.
Table 5. Summary of species classification results by XGBoost.
Study AreaStudy TimeDataSpeciesOAKappaReference
Guangxi, southwestern China2023UAV hyperspectral data and UAV-LiDAR dataSA, AI, CM, AC, KO96.78%0.9596[89]
The core zones of the ZMNNR, China2024WV-2 image
(multispectral, 1.5 m) and OHS data (hyperspectral, 10 m) and ALOS-2 data (SAR)
AM, KO, SA, RS, BG, AC94.02%NA[90]
Gaoqiao Mangrove Reserve, China2023Sentinel-2 (multispectral), Sentinel-1 (SAR), ALOS-2 (SAR)NA92.33%
36.67%
33.67%
0.912
0.268
0.235
[79]
Yingluo Bay, China2024UAV hyperspectral dataBG, RS, AM, AC, EA, HT, SA94.26%0.93[81]
Yingluo Bay, China2024UAV multispectral data80.37%0.77[81]
OA: overall accuracy; SA: Sonneratia apetala; AI: Acanthus ilicifolius; AC: Aegiceras corniculatum; KO: Kandelia obovata; CM: Cyperus malaccensis (non-mangrove species); AM: Avicennia marina; SA: Sonneratia apetala; RS: Rhizophora stylosa; BG: Bruguiera gymnorhiza; EA: Excoecaria agallocha; HT: Hibiscus tiliaceus.
Table 7. Comparison of classification accuracy among different ML algorithms.
Study AreaStudy TimeDataML AlgorithmsSpeciesOAKappaReference
Sundarbans Biosphere Reserve, India (40%), and Bangladesh (60%)2021Landsat 8 OLI
(multispectral 30 m),
Sentinel-2 data
(multispectral)
SVMAA, AM, AO, AR, BC, BG, CD, CE, EA, PP, SA76.42%
79.81%
0.71
0.78
0.75
[7]
Dongzhaigang, China2018Radarsat-2 (SAR), Landsat-8 (multispectral 30 m)SVMNA53.4%
83.5%
95%
(combined data)
0.46
0.80
0.95
[70]
Dongzhaigang Nature Reserve and Qinglangang Nature Reserve, China2022Sentinel-2 data
(multispectral), UAV-LiDAR data
RFRS, CT, AM, BS, LR, EA, SS85.6%
91.61%
0.79
0.86
[82]
Gaoqiao Mangrove Reserve, China2023Sentinel-2 (multispectral), Sentinel-1 (SAR), ALOS-2 (SAR)RFNA92.67%
39.67%
30.33%
0.915
0.302
0.194
[79]
XGBoost92.33%
36.67%
33.67%
0.912
0.268
0.235
LightGBM92.33%
37%
33.67%
0.912
0.272
0.208
OA: overall accuracy; AA: Avicennia alba; AM: Avicennia marina; AO: Avicennia officinalis; AR: Avicennia rotundifolia; BC: Bruguiera cylindrica; BG: Bruguiera gymnorhiza; CD: Ceriops decandra; CE: Casuarina equisetifolia; EA: Excoecaria agallocha; PP: Phoenix paludosa; SA: Sonneratia apetala; RS: Rhizophora stylosa; BS: Bruguiera sexangula; LR: Lumnitzera racemosa; SS: Sonneratia spp, CT: Ceriops tagal.
Table 8. Summary of mangrove dieback.
Study AreaStudy TimeDataCauses of DiebackReference
Abaco Island2020Landsat 5 and 7 annual NDVI compositesHerbivory and disease[104]
Across the world2020Landsat
derived dataset
Human activities (e.g., deforestation, aquaculture)[113]
Maldives2024Landsat 8 OLI dataset and Oblique aerial drone imageSea-level rise[105]
Kakadu
National Park, northern Australia
2019Airborne remote sensing data and color aerial photography photosThe El Niño–Southern Oscillation (ENSO)[114]
Pichavaram, India2022VHSR satellite images and meteorological observation dataLikely due to hypersaline environment[115]
Disclaimer/Publisher’s Note: The statements, opinions and data contained in all publications are solely those of the individual author(s) and contributor(s) and not of MDPI and/or the editor(s). MDPI and/or the editor(s) disclaim responsibility for any injury to people or property resulting from any ideas, methods, instructions or products referred to in the content.

