Abstract
The life-cycle economics and greenhouse-gas (GHG) emissions of forest biomass harvesting and utilization for value-added bioproducts were comprehensively evaluated via the development of an integrated modeling framework. Taking the eastern U.S. as the case region, the model innovatively integrated field studies, a Bayesian-based statistical learning model, techno-economic analysis, and life-cycle assessment. In specific, by investigating and summarizing the typical forest biomass harvesting systems across the region, the forest biomass harvesting costs were spatially grouped and mapped for four classified subregions across the eastern US. Overall, with 95% confidence the forest biomass harvesting cost is between USD 21.99 and USD 44.33/dry Mg, while the GHG emissions are between 14.79 and 98.80 kg CO2 eq./dry Mg. Furthermore, for the forest biomass utilization for four alternative value-added bioproducts, the minimum selling price (MSP) is USD 177.82/Mg for pellet fuel, USD 110.24/MWh for biopower, USD 1059.4/Mg for biochar, and USD 4.98/gallon for aviation fuel. The life-cycle GHG emissions are 149.80 kg CO2 eq./Mg pellet fuel, 52.22 kg CO2 eq./MWh biopower, 792.12 kg CO2 eq./Mg biochar, and 2.13 kg CO2 eq./gallon aviation fuel, respectively. Considering the uncertainties, 95% confidence intervals of MSPs range from USD 164.77 to USD 190.97/Mg for pellet fuel with an 81.85% probability to be profitable, from USD 100.20 to USD 120.21/MWh for biopower with a 49.38% probability to be profitable, from USD 1000.91 to USD 1109.25/Mg for biochar with a 79.51% probability to be profitable, from USD 4.86 to USD 5.54/gallon for aviation fuel with an 0.03% probability to be profitable. Moreover, the MSPs of pellet fuel and biochar are much less affected by the market changes than those of biopower and aviation fuel. However, the production of biopower and aviation fuel has lower carbon intensities than that of pellet fuel and biochar.
1. Introduction
With the rapid development of the global economy in the past decades, human well-being has been significantly improved. However, this development is driven by the development paradigm of excessive consumption of natural resources. It is leading to severe consequences such as accelerated global warming, which hurts human well-being in turn. In this context, sustainable development is expected to be the new development paradigm to boost economic growth without harming the environment [1]. Therefore, the United Nations specifically defined 17 Sustainable Development Goals (SDGs) as the blueprint of a sustainable future, which are intended to be achieved by 2030 [2].
The bio-based industry could be an option to mitigate climate warming, supply clean energy, and mitigate poverty, hence facilitating the realization of corresponding SDGs [3]. In addition, energy security is identified as one of the major threats to sustainability [4]. The supply of conventional fossil fuels heavily relies on the international trading network whose fragility has been exposed during the COVID-19 pandemic and other geopolitical situations. With the localized feedstock supply chains, the bioenergy industry development could help increase the resilience and security of the national energy supply [5].
Forest biomass is an important and advantageous feedstock source of bioenergy over other biomass sources such as corn and energy crops. As a second-generation biomass source, its utilization does not have a concern of threatening the food supply as the use of corn does. Also, the forest resources which the biomass is extracted from are widely available across the world. However, the currently available resources of energy crops are very limited, and their future development is still quite influenced by the renewable energy policies. This is especially true in the heavily forested regions, where the timber industry is usually well-developed with a long history. Forest biomass harvesting can leverage the well-developed logging systems, and its utilization is expected to add additional revenue to the conventional timber harvesting business [6].
The eastern United States is exactly such a heavily forested region with abundant forest resources and a long-established timber industry. Forest biomass utilization for bioenergy and bioproducts has been outlined by policy-makers as a potentially emerging industry to boost the regional economy [7]. Pellet fuel, biopower, biofuel, and biochar are the major alternative bioproducts from forest biomass thus far, especially the pellet fuel for the southeastern states of the U.S. However, compared with its availability, forest biomass utilization still requires considerable development to be enhanced.
One of the major barriers to forest biomass utilization is harvesting and logistics, which determine the delivery of quality biomass feedstocks [8,9,10]. Though forest biomass harvesting could leverage the timber logging machinery and systems, there are still differences between both [11]. There have been a few studies that investigate the configurations and costs of forest biomass harvesting and logistics systems across the nation and even the world [12,13]. In the US, Townsend et al. [14] investigated the systems and costs of forest biomass harvesting in the southern Rocky Mountains in the US. Harrill et al. [15] investigated the cost and production of integrated harvesting of sawlog and wood chips in northern California. In addition, the technological advances in the biomass supply chains are paid the attention [16]. On-site chipping is considered as a promising operation to improve the efficiency of forest biomass logistics; Vance et al. [17] specifically investigated the chipping operations using a time-motion study and machine rate method in the central Appalachian region. However, the studies are still very limited overall. And the existing studies just focused on certain harvesting systems, a certain process, or a certain region [15,18]. That makes it difficult to compare and summarize the status of forest biomass harvesting on the large scale due to the inconsistence of methodologies, biomass sources, and reporting years. The eastern US especially has great potential to develop forest biomass for value-added bioproducts, while the current understanding of forest biomass harvesting is still insufficient. The existing few studies just focus on the economic cost assessment, without considering the GHG emissions associated with the harvesting and logistics. GHG emissions are getting more and more critical, given the carbon-neutral expectation of the bioproducts. Therefore, it will be useful to reveal the economics and GHG emissions of forest biomass harvesting at the eastern US region level based on consistent field studies.
With a good understanding of forest biomass harvesting and logistics, the other major barrier to the industrial development of bioproducts is the feasibility of the production of alternative value-added bioproducts. Thus far, techno-economic analysis (TEA) has been conducted for various bioproducts in the past decades [19]. However, most of the TEA analyses just simplify the biomass feedstock supply with a delivered cost assumption, without deeply considering the biomass harvesting and logistics. As our previous studies indicate, the biomass feedstock delivery cost is a major component of the bioenergy production cost [20]. In other words, the economic feasibility of the production of bioproducts is very sensitive to the feedstock delivery price. Thus, this assumption undermines the solidness of the economic feasibility outcomes to some degree. Moreover, most of the existing studies separately assess the economic feasibility and environmental impacts (particularly GHG emissions) of bioproducts’ production. However, given that GHG emissions are increasingly interconnected with the economy, it is getting more and more useful to consider the economics and GHG emissions of value-added bioproducts in an integrated manner.
Therefore, the overall objective of this study is to integrally assess the economics and GHG emissions of forest biomass utilization for alternative value-added bioproducts with in-depth consideration of forest biomass harvesting and logistics in the eastern US. The specific objectives are to: (1) summarize and compare the representative forest biomass harvesting systems based on our consistent field studies; (2) spatially and statistically analyze the cost and GHG emission of the forest biomass harvesting; and (3) assess the life-cycle economics and GHG emissions of alternative value-added bioproducts. The results will provide a comprehensive picture of integrated life-cycle economics and GHG emissions of forest biomass utilization for value-added bioproducts’ in the eastern US.
2. Study Area, Methods, and Data
In this study, a comprehensive analytics framework covers the forest biomass cutting, extraction, chipping, transportation, and conversion for value-added bioproducts. The forest biomass harvesting was first deeply analyzed based on our field studies across the region, while the transportation was determined by leveraging the previously developed forest biomass logistics optimization model specifically for the region. Second, the outcomes from these harvesting and logistics studies were used to feed the TEA and life-cycle assessment (LCA) models. To enhance the conventional deterministic models, stochastic analyses were conducted to reveal the economics and GHG emissions given the uncertainties. Third, a metric of carbon intensity was defined to integrate the GHG emissions and economic values to provide a comprehensive view of forest biomass utilization for value-added bioproducts. The integrated framework is illustrated in Figure 1, while the details are described in the following sections.
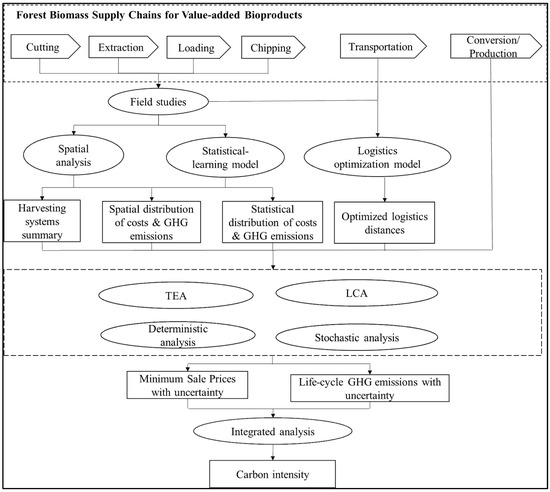
Figure 1.
Schematic diagram of analytics framework in this study. Note: Rectangles represent methods employed in this study, while ellipses denote corresponding outputs.
2.1. Study Region
As we mentioned, the study region is the eastern US, which covers 22 states from Maine down to Florida (Figure 2). This region has abundant forest resources with 60.29% of the average forest coverage rate, which is much higher than the national average (36.21%) [5]. Moreover, the region has a long-established and well-developed timber logging industry. Along with these timber logging activities to produce the conventional wood products such as furniture, the entire region annually produces around 11.91 million dry tons of logging residue, as indicated by the baseline scenario of the 2016 Billion-ton report. In addition to these logging residues, the provision of whole-tree biomass from the low-quality trees is of great potential as well, around 27.98 million dry tons per year at a USD 60/dry ton level [21].
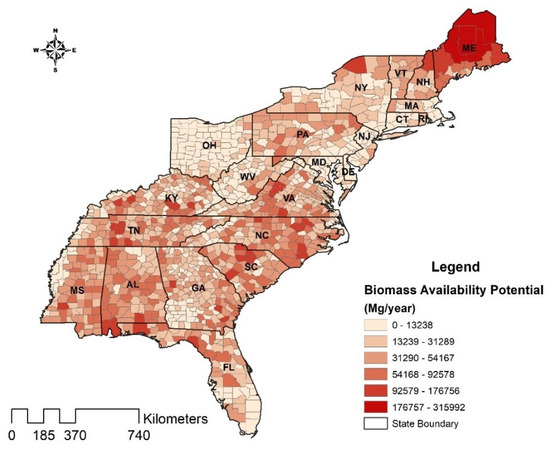
Figure 2.
Study region: eastern United States, with forest biomass availability potential.
Thus far, the eastern US is becoming a more and more important region for producing value-added bioproducts. Wood pellet fuel and biopower are the main bioenergy products thus far, while aviation fuel and biochar are also being investigated in the region. With most clustered pellet plants, the southeastern region is the major source of national pellet fuel production [22]. Among the forest biomass, mill residue is the main feedstock for bioenergy production and has been almost fully utilized, due to its characteristics of being clean and centralized. However, logging residue and whole-tree biomass are still underutilized [3]. Thus, we only focused on logging residue and whole-tree biomass of this region, considering their utilization-promoting potential in the future. A systematic assessment of the life-cycle economics and GHG emissions of forest biomass utilization for value-added products helps to promote the regional bio-based industries, hence facilitating the regional bioeconomy development in the context of Net-Zero by 2050.
2.2. Forest Biomass Harvesting Systems in the Eastern US
With the efforts of the entire team, consisting of four sub-teams from the University of Maine, West Virginia University, Virginia Polytechnic Institute and State University, and Auburn University, in recent years, the harvesting sites with representative forest biomass harvesting systems, especially the integrated harvesting systems across the study region, have been individually visited. The corresponding costs and productivities have been generated and published by each sub-team to reveal the harvesting systems in certain subregions, while the details could be referred to Chasuk [23], Garren et al. [24], Louis and Kizha [25], and Vance [26]. Therefore, it appears essential and meaningful to systematically summarize and consistently compare all these published subregion outcomes to provide an overview of the forest biomass harvesting systems across the eastern US.
In this study, we summarized and compared all these representative harvesting systems in terms of subregion, terrain type, stand type with main species, biomass harvesting type, and harvesting machines configuration and description. This will provide a very comprehensive picture of the forest biomass harvesting systems in the eastern US. It will also lay a foundation for further analysis of the costs and GHG emissions of forest biomass harvesting and logistics.
2.3. Costs, GHG Emissions, and Their Distribution of Forest Biomass Harvesting and Logistics Across the Eastern US
The forest biomass harvesting cost for each representative harvesting system was directly retrieved from the above-mentioned publications. These reported harvesting costs were consistently calculated following a shared calculation protocol based on the machine rate method [11]. Furthermore, to be more comparable and up-to-date, all the reported costs were converted as 2021 USD with the US inflation rates. GHG emissions for each harvesting system were calculated based on their reported fuel consumption rates, using the TRACI 2.1 LCA method.
2.3.1. Spatial Distribution
Considering the spatial distribution of terrain conditions, forest types, and the representativeness of the forest biomass harvesting systems, the entire eastern US was classified into several subregions from the perspective of forest biomass harvesting, referring to the regional classification of timber harvesting systems in the US [11]. Then, leveraging the representativeness of the investigated systems, the costs of forest biomass harvesting (including costs of cutting, extraction, loading, and chipping) were statistically summarized by each subregion. As a result, the costs of forest biomass harvesting were spatially reported and mapped in the format of average cost with standard deviation (if applicable) by classified subregion and typical harvesting type (integrated harvesting vs. biomass-only harvesting). Similarly, the GHG emissions for these systems were statistically summarized by each classified subregion and typical harvesting type.
2.3.2. Statistical Distribution
In addition to the above spatial distribution, statistical analytics was further con-ducted to quantitatively infer the statistical distribution of the costs and GHG emissions of the forest biomass harvesting in the eastern US. Specifically, the data on harvesting costs and GHG emissions were fitted with normal distributions, respectively, with quantile–quantile (Q-Q) plot verification. Then, the statistics of mean and confidence interval (95%) were derived to quantitatively reveal the costs and GHG emissions of forest biomass harvesting in the eastern US.
Furthermore, the field studies we conducted and summarized here served as benchmarks. In addition to these, there have been a few other field investigation studies of forest biomass harvesting in the eastern US. For example, Hanzelka et al. [27] also conducted a similar case study about whole-tree biomass operation in the coastal plain of Virginia. And there must be more in the near future, given the increasing demand for fiber resources for the rapid development of the bioeconomy. Incorporating these “other” data with the benchmarks could further enhance the understanding of the costs and GHG emissions of forest biomass harvesting in the eastern US. Thus, for further enhancing the statistical inference described in the previous paragraph, a Bayesian-based statistical learning model was used to incorporate the data from other existing studies, which can be used for the data incorporation of future studies [28]. For this Bayesian-based statistical learning model, we first used Q-Q plot to examine whether the data fit the normal distribution, since the normal distribution is most commonly used. Then, the examined normal distribution was fitted to the data from our field studies, which was used as the prior distribution of costs and GHG emissions. Then, the corresponding data from other studies were used as the other observed data to enhance the prior distribution, providing a more robust posterior distribution. The generic expression of the Bayesian-based statistical learning model could be mathematically formulated as below [29]:
where f(θ) is the prior distribution, xn is the new data observations, L(θ) is the likelihood function, and θ is a given parameter of the prior distribution.
According to the literature search on Google Scholar, thus far only two other field studies of forest biomass harvesting in the eastern US were found with available data on machine rates, fuel consumption rates, and productivities [27,30]. Therefore, as we described, the Bayesian-based statistical learning model was used to incorporate these data of costs and GHG emissions calculated from the reported fuel consumption rates, to enhance our benchmark results.
2.4. Economic Costs and GHG Emissions of Forest Biomass Utilization for Alternative Value-Added Bioproducts with the Consideration of Uncertainties
Forest biomass can be a feedstock for various bioproducts. Considering the technology readiness, application potentials, and data availability, four alternative value-added bioproducts, including pellet fuel, biopower, biochar, and aviation fuel, were selected to analyze their economics and GHG emissions, respectively. Specifically, pellet fuel is the dominant bioenergy product in the eastern US, and small-scale plants with less than 100,000 Mg production capacity are very typical [3]. Biopower is another common bioenergy product in the region, although the number of biopower plants is not as high as that of pellet fuel plants. It plays an important role in decarbonizing electricity generation, hence further decarbonizing the entire electricity-driven economy [31]. At this moment, biopower is still a small portion of the national electricity generation, accounting for 1.3% [5]. Biochar is a bioproduct with great potential for soil improvement and carbon sequestration and is being widely investigated in the region [32,33]. Aviation fuel from biomass is an emerging value-added bioproduct and is expected to have great potential to decarbonize the airplane industry [34]. However, the technology readiness level is still lower compared to the conversion routes for the other three bioproducts. Therefore, the commercialization of bio-based aviation fuel is still under development. The Fischer–Tropsch (FT) process is the most promising conversion route for biomass to aviation fuel, and multiple process modeling studies have been conducted to provide the material flow and energy consumption data [35,36]. For details about the Fischer–Tropsch (FT) process, refer to the study by Klerk et al. [37].
There have been benchmark studies of TEA and LCA of woody biomass conversion for these value-added bioproducts, which are published in USDOE reports, our previous studies, and the literature [32,35,36,38,39,40,41,42,43]. Thus, in this study, these benchmark studies were leveraged to develop generic TEA and LCA models to assess the life-cycle economics and GHG emissions of forest biomass utilization for alternative value-added bioproducts, taking our deeply investigated costs and GHG emissions of forest biomass harvesting and logistics into the consideration.
Specifically, the TEA parameter configurations for pellet plants and biopower plants were based on the DOE NREL reports and our previous case studies [38,39,40,41]. For biochar production, a small-scale system was explored, and has demonstrated its potential to be commercialized, particularly for forest residue utilization [32,42]. Thus, it was used in this study as a representative system to produce biochar products from forest biomass. Regarding the aviation fuel production from forest biomass, the parameter configuration was based on DOE reports and the literature [35,36,43]. To ensure accuracy and consistency, all the key parameters during the configuration have been cross-verified by multiple sources. Only the consistent data published in peer-reviewed journals/reports were considered. These data were finally examined by multiple experts from Universities, USDOE national labs, and industries associated with WVU Center for Sustainable Biomaterials and Bioenergy (WVU Center for Sustainable Biomaterials & Bioenergy. https://bioenergy.wvu.edu (accessed on 1 May 2024)). However, it should be noted that these parameters are for generic models with representative scales, to provide general insights to the decision-makers about the economics and GHG emissions of forest biomass utilization for these alternative value-added bioproducts. They should be refined by technical engineering study of the project when developing a real production project.
In addition, a 5% annual price escalation rate was set for wood pellets, based on the average increase rate in the past years according to USEIA data. Regarding the biochar and aviation fuel, there is no mature market to determine the rate. Thus, we used the rate of wood pellet fuel, 5% as the reference value, considering that all of them are bioproducts and there is a good expectation of bio-based products in the context of Net-Zero by 2050. A 1.8% of annual price escalation rate was set for electricity based on the average increase rate of electricity in the past years. The cost escalation rate was set at 1.73%, which is the average inflation rate for the past 10 years (2011–2020). The tax rate was set as 35%, following the federal tax regulation on energy projects [39]. The specific parameters configuration was listed in Table 1.

Table 1.
Parameter configuration for generic models of forest biomass utilization for alternative value-added bioproducts.
2.4.1. Deterministic Analysis
First, the deterministic TEA and LCA models of forest biomass utilization for value-added bioproducts were conducted, respectively. In conventional TEA studies, Net Present Value (NPV) and Internal Rate of Return (IRR) are two commonly used indicators to assess economic feasibility. However, most of the bioproducts do not have mature markets with stable selling prices. To overcome this limitation, we used the metric of the minimum selling price (MSP, at plant–gate for year 1) here. With the MSPs of the bioproducts, the net production cost would be equivalent to the net product revenue, which can be formulated as:
where is the total revenue at year n, is the discount rate, is the total cost at year n, and is the lifetime of the plant/facility. With introducing the metric of MSP, this model was further specified as below:
where is the quantity of annual production of the bioproduct, is the selling price escalation rate, is the capital cost, is the operating cost at year n, is the feedstock cost at year n, and is the other cost at year n. Consequentially, with mathematical conversion techniques the metric of MSP was derived as:
In the model, the feedstock cost, , was calculated as the sum of the stumpage cost (if applicable), harvesting cost, and transportation cost. The harvesting cost was directly from our above analysis. The transportation cost was calculated as the product of the unit transportation cost and transportation distance. The unit cost was obtained along with our field investigations, while the transportation distances to the plants/facilities with various annual demands of biomass feedstock were determined by our previously developed forest biomass logistics optimization model specifically for the eastern US region considering the biomass availability, road conditions, biomass-processing facility siting suitability, etc. [5]. As the forest biomass is from the small-diameter trees or logging residues, the stumpage cost does not always occur on a case-by-case basis. If applicable, the stumpage cost of small-diameter trees was set as USD 10/dry Mg, which is consistent with that in the 2016 Billion-ton report [21]. In addition, the other costs may include the income tax for corporations. Given these variations, three scenarios were set in the TEA deterministic analysis. The baseline scenario was set as forest biomass utilization for bioproduction, without tax and stumpage cost. Compared with the baseline, scenario 1 considered the tax, while scenario 2 considered stumpage cost. The MSPs were derived by bioproduct and scenario. Furthermore, the effects of the changes of forest biomass feedstock delivered cost (changing −10%–10%), discount rate (6%–12%), and added tax rate (0%–40%) on baseline MSPs were evaluated via the sensitivity analysis, respectively.
Regarding the LCA, the scope of “cradle-to-gate” life-cycle GHG emissions of forest biomass utilization for bioproducts included the process of felling, extraction, preprocessing, transportation, and conversion. The functional unit was defined as the one-unit bioproduct produced in-plant, including 1 Mg pellet production, 1 MWh electricity generation, 1 Mg biochar production, and 1 gallon aviation fuel production, respectively. Incorporating the GHG emissions of forest biomass transportation and in-plant conversion with the above GHG emissions of the harvesting process, the overall GHG emissions were derived by bioproduct. Specifically, GHG emissions of forest biomass transportation were calculated using TRACI 2.1 with the SimaPro 9.3 platform, based on the investigated fuel consumption rate. GHG emissions of in-plant conversion were obtained from our previous studies and the literature [36,41,42].
2.4.2. Stochastic Analysis
The deterministic model provides benchmark results for the economics and GHG emissions of forest biomass utilization for value-added bioproducts. However, its consideration on the associated uncertainties is insufficient. To overcome this limitation of the deterministic analysis, the Monte Carlo-based stochastic model was used to incorporate the uncertainties into the TEA and LCA analysis. Based on the above deterministic models, the stochastic models were implemented via Monte Carlo simulation with the given uncertainty distributions of the involved parameters (Table 2). Specifically, the probability distributions of the harvesting cost and harvesting GHG emissions are set as normal distributions, which are derived from the results of the above field studies with the Q-Q plot examination. The probability distribution of the discount rate was set as a uniform distribution, which is because of the equal probability for any rate within the range (6%–10%). While the probability distribution for any other parameters was set as a triangular distribution, because for these parameters we can only identify a probable range and most likely value. Furthermore, the statistics of uncertainty distributions of costs and GHG emissions of forest biomass harvesting were based on our above analysis, while the statistics of other key parameters and their uncertainty referred to our previous studies, the literature, and experts’ opinions [41]. These uncertainties were mathematically expressed in the format of statistical distributions (Table 2).
Table 2.
Uncertainty information of key parameters for stochastic TEA and LCA models.
As a result, the 95% confidence intervals of the MSPs and GHG emissions for the bioproducts were derived to provide further information. Moreover, the profitable probability for forest biomass utilization for each bioproduct was derived as well, based on the comparison of the MSP and the corresponding assumed selling price (at plant–gate). The acceptable selling prices were set as USD 190/Mg pellet fuel, USD 110/MWh biopower, USD 1100/Mg biochar, and USD 4/gallon aviation fuel, based on the consultation of the experts and market trends [41,42,44,45].
2.4.3. Integrated Analysis of LCA and TEA
Based on the above deterministic results of TEA and LCA, an integrated analysis was implemented via the defined metric of carbon intensity to provide a more comprehensive picture of the forest biomass utilization for value-added bioproducts. Specifically, the carbon intensity (CI) was defined as GHG emissions per monetary value of industry output. It was mathematically formulated as:
Here, the MSP from TEA analysis was used as the industry output of the production of per unit bioproduct.
2.5. Analytics Tools
All the calculations of the cost analysis and techno-economic assessment were conducted using Visual Basic for Applications via a Microsoft Excel-based spreadsheet [46]. The life-cycle assessment was implemented in the SimaPro 9.1 platform [47]. In addition, the Monte Carlo simulations for both TEA and LCA uncertainty analysis were conducted using Oracle Crystal Ball [48]. The number of trials of the Monte Carlo simulation was set at 5000.
3. Results
3.1. Summary and Comparison of the Forest Biomass Harvesting Systems in the Eastern US
Eleven representative sites of forest biomass harvesting were visited by the entire team, as listed in Table 3. Specifically, they cover all the geographic subregions of the eastern US, including the southeastern states, Mid-Atlantic states, and northeastern states of the US. In terms of terrain type, they cover all the typical types, including coastal plain-, mountain-, hilly-, and undulating mountain-subregions. In terms of forest stand and species, they cover pine plantations, pine mixed with hardwood, and hardwood types with typical species in each subregion. They also include solely forest-biomass harvesting, though focusing more on integrated biomass harvesting. Moreover, all the selected harvesting systems were determined with the experts’ best judgment to highlight the representations.
Table 3.
Summary of typical forest biomass harvesting systems in the eastern US.
Overall, in terms of forest biomass harvesting, one-pass integrated harvesting is the dominant system across the entire eastern US, while two-pass harvesting just occurs in the southeastern US. One-pass harvesting cuts small-diameter trees (SDT) for biomass and larger-diameter trees (LDT) for the primary products (sawtimber/pulpwood) together, while two-pass harvesting usually cuts SDT before cutting LDT. This dominant role of one-pass harvesting could be attributed to the fact that it is more cost-efficient than the two-pass system [23]. In all one-pass systems, the SDT and LDT are separated in different bunches during the felling process. Then, in the mountain areas, they are skidded and loaded with shared machines, while in the coastal areas they are usually skidded and loaded separately with specific machines. This is partially due to the terrain conditions; namely, mountain areas with steep slopes prefer as few machines as possible working together in the sites, while the plain areas allow more machines to work together. In addition to the cutting and extraction, the chipping at the landing is a commonly used way to increase the bulk density of forest biomass for further transportation. In the two-pass harvesting that occurs in the southeast of the US, the operators let the feller-buncher arrive earlier to cut SDT. This could also benefit the second-pass sawtimber harvesting, as larger working spaces could be released via the first-pass biomass harvesting. Of note, either an entirely different system or the same system with the first-pass SDT harvesting could be used for the second-pass LDT harvesting. In addition, the shared loading machine in the mountain regions is expected to feed the chipper with treetops and branches from the processing LDT for sawtimber [24].
In terms of the machinery, feller-buncher(s) and grapple skidder(s) are the common-used combinations to cut and extract forest biomass across the eastern US. Specifically, the rubber-tired feller-buncher is used in the coastal plains of the southeastern and Mid-Atlantic US, while the tracked feller-buncher is used in the mountain areas of the Mid-Atlantic and northeast US. The chipper is the machine used in common to cut the forest biomass into small chips. The standalone loader is commonly used to feed the chipper, while a chipper with a self-contained loader can be employed as well. The details about the representative forest biomass harvesting systems are listed in Table 3.
3.2. Spatial and Statistical Distribution of the Costs and GHG Emissions of the Forest Biomass Harvesting
Based on our field studies, the terrain conditions and forest types are major factors affecting forest biomass harvesting. In terms of the terrain characteristics, the eastern US mainly consists of Appalachian Mountain areas and coastal plain areas (Figure 3a). In terms of the forest types, it mainly consists of hardwood (oak, maple, birch, beech) forests in the northeastern region and pine and other softwood forests in the southeastern region (Figure 3b).
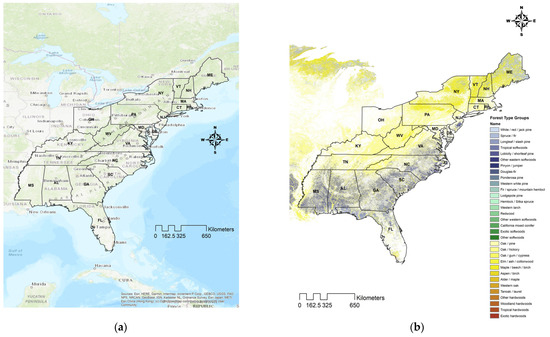
Figure 3.
(a) Terrain conditions; (b) forest types across eastern US. Data sources: https://www.arcgis.com/home/item.html?id=30e5fe3149c34df1ba922e6f5bbf808f (accessed on 1 April 2022); https://www.arcgis.com/home/item.html?id=fe77a8a503ca4b9ba1ee2ef3c8ff7b19 (accessed on 1 April 2022).
Furthermore, we also referred to the spatial distribution of the timber harvesting systems across the eastern US [11]. Considering the representativeness of the investigated forest biomass harvesting systems summarized above, the entire eastern US was classified into four subregions for the cost estimation of forest biomass harvesting: the northeastern US mountain region with hardwood-dominated forests, the Mid-Atlantic US mountain region with hardwood-dominated forests, the Mid-Atlantic US coastal plain region with pine-dominated forests, and the southeastern US coastal plain region pine-dominated forests.
The forest biomass harvesting costs for each classified region are statistically summarized and illustrated in Figure 4. In the southeastern US coastal plain region, the biomass-only harvesting cost is USD 28.08/dry Mg, while the integrated forest biomass harvesting cost is USD 33.37 ± 0.16/dry Mg. In the Mid-Atlantic US coastal plain region, the integrated forest biomass harvesting cost is USD 39.32 ± 8.82/dry Mg. In the Mid-Atlantic US mountain region, the biomass-only harvesting cost is USD 33.32 ± 0.01/dry Mg, while the integrated forest biomass harvesting cost is USD 45.57 ± 18.16/dry Mg. In the northeastern US mountain region, the integrated forest biomass harvesting cost is USD 20.61/dry Mg, the chipping-only biomass cost is USD8.27/dry Mg, while the forest biomass from thinning activities could be as high as USD 128.08/dry Mg.
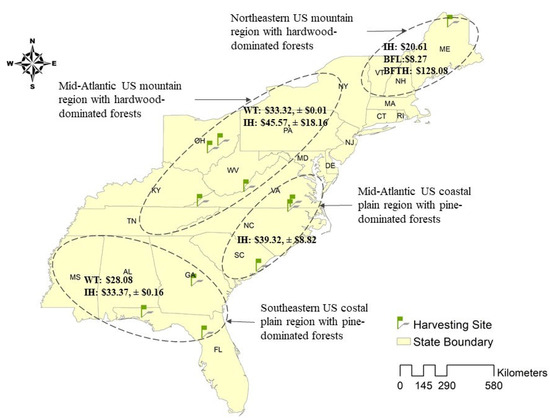
Figure 4.
Spatial distribution of harvesting costs of forest biomass. Note: (1) IH—integrated harvesting; WT—biomass only harvesting; BFL—chipping-only biomass cost; BFTH—biomass from thinning activities. (2) Costs were reported in format: mean ± standard deviation (if applicable). (3) References: Chasuk [23]; Garren et al. [24]; Vance [26]; Louis and Kizha [25].
The normal quantile–quantile (Q-Q) plot indicated that the data of forest biomass harvesting costs in the eastern US statistically fitted the normal distribution well. The statistical inference revealed that the forest biomass harvesting cost follows the normal distribution well:
where FBHC stands for the forest biomass harvesting cost (USD) per dry Mg and N stands for normal distribution. Therefore, we can conclude that with 95% confidence the forest biomass harvesting cost in the eastern US would be between USD 25.52 and USD 45.75/dry Mg.
As this derived normal distribution is a conjugate prior, a closed-form expression was given for the posterior via the Bayesian-based statistical learning model. Therefore, incorporating the other two data into these benchmark results of this study, the distribution of forest biomass harvesting costs in the eastern US would be updated and statistically follow:
where UFBHC stands for the updated cost of forest biomass harvesting (USD) per dry Mg and N stands for normal distribution. Therefore, we can conclude with 95% confidence that the forest biomass harvesting cost in the eastern US would be between USD 21.99 and USD 44.33/dry Mg, after being updated by the other consistent studies.
Similarly, the normal quantile-quantile (Q-Q) plot indicated that the data of GHG emissions of forest biomass harvesting in the eastern US statistically fits the normal distribution well (Figure 5). The statistical inference revealed the forest biomass harvesting cost follows the below normal distribution well:
where FBHE stands for the forest biomass harvesting emission (kg CO2 eq.)/dry Mg and N stands for normal distribution. Therefore, we can conclude with 95% confidence that GHG emissions of forest biomass harvesting in the eastern US would be between 43.59 and 115.09 kg CO2 eq./dry Mg. Furthermore, as this derived normal distribution is a conjugate prior, a closed-form expression was given for the posterior via the Bayesian-based statistical learning model. Therefore, incorporating the other two data into these benchmark results of this study the distribution of GHG emissions of forest biomass harvesting in the eastern US statistically follow:
where UFBHE stands for the updated GHG emission of forest biomass harvesting (kg CO2 eq.)/dry Mg and N stands for normal distribution. Therefore, we can conclude with 95% confidence that GHG emissions of forest biomass harvesting in the eastern US would be between 14.79 and 98.80 kg CO2 eq./dry Mg, after being updated by the other two consistent studies.
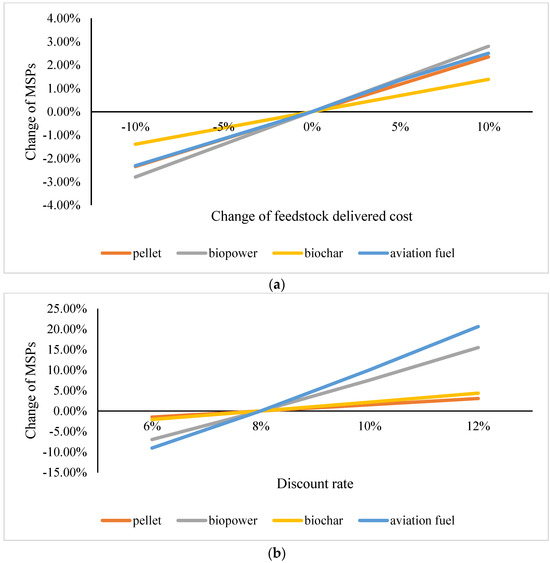
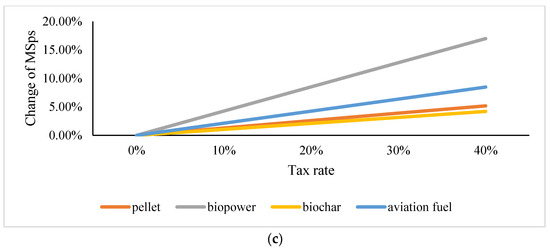
Figure 5.
Sensitivity of MSPs to change of: (a) forest biomass feedstock delivered cost; (b) discount rate; (c) tax rate.
3.3. Economics and GHG Emissions of Forest Biomass Utilization for Alternative Value-Added Bioproducts
3.3.1. Deterministic Analysis Results
With the deterministic model, without considering the tax and stumpage cost, the MSP is USD 177.82/Mg pellet fuel, USD 110.24/MWh biopower, USD 1059.4/Mg biochar, and USD 4.98/gallon of aviation fuel. Here, the big difference of aviation fuel and other bioproducts in terms of the number is because of different units employed. However, by adding the income tax for incorporations, the RSPs would increase by 4.54% for pellet fuel, 14.86% for biopower, 3.68% for biochar, and 9.04% for aviation fuel, respectively. Compared with the baseline, if the stumpage cost is added, the MSPs would increase by 5.94% for pellet fuel, 6.94% for biopower, 3.62% for biochar, and 11.85% for aviation fuel, respectively.
The effects of the changes of feedstock delivered cost and discount rate on the MSPs were investigated (Figure 5). The results indicated that the MSPs would increase when the feedstock delivered cost increased. Specifically, the MSPs would increase by 0.23% for pellet fuel, by 0.28% for biopower, by 0.14% for biochar, and by 0.24% for aviation fuel, with an increase of 1% in feedstock delivered cost. The MSPs would increase as well when the discount rate increases. Specifically, the MSPs would increase by 0.76% for pellet fuel, by 3.74% for biopower, by 1.07% for biochar, and by 4.95% for aviation fuel, with an increase of 1% in the discount rate. Moreover, the effect of the tax rate on MSPs was also analyzed. Adding tax to the production would significantly increase the MSPs. Specifically, the MSPs would increase by 0.13% for pellet fuel, by 0.42% for biopower, by 0.10% for biochar, and by 0.21% for aviation fuel, with an additional 1% of the tax rate.
The LCA results indicated that the life-cycle GHG emissions are 149.80 kg CO2 eq./Mg pellet fuel, 52.22 kg CO2 eq./MWh biopower, 792.12 kg CO2 eq./Mg biochar, and 2.13 kg CO2 eq./gallon aviation fuel. Specifically, the process of preprocessing and the conversion at-plant contributes most to the overall GHG emission, 53.03% and 69.43% of pellet fuel and biochar, respectively. While for the biopower and aviation fuel, the process of biomass harvesting and preprocessing at landing contributes the most, 71.08% and 74.71, respectively (Figure 6). The biomass feedstock transportation contributes the least for all four bioproducts, while it accounts for more in aviation fuel than in other products. That is attributed to the longer transportation distance needed for aviation fuel production, given its larger demand for feedstock.
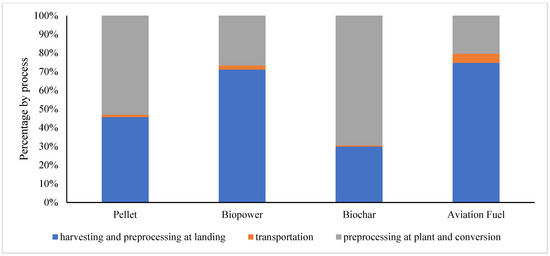
Figure 6.
Percentage of each process to overall life-cycle GHG emissions of bioproducts.
3.3.2. Stochastic Analysis Results
The stochastic analysis indicated that with the given uncertainties, the 95% confidence intervals of MSP range from USD 164.77 to USD 190.97/Mg for pellet fuel, from USD 100.20 to USD 120.21/MWh for biopower, from USD 1000.91 to USD 1109.25/Mg for biochar, from USD 4.86 to USD 5.54/gallon for aviation fuel (Figure 7). Compared with the assumed market selling prices, the profitable probability is 81.85% for pellet fuel, 49.38% for biopower, 79.51% for biochar, and 0.03% for aviation fuel. In reality, the price of pellet fuels fluctuates more (mostly goes up in recent years), while the prices of the other three bioproducts are relatively steady. Thus, we further considered the profitability probability when the price of pellet fuels goes up. It would go up to 90.05% when the acceptable selling price of pellet fuels goes up to USD 200/Mg.
Figure 7.
Uncertainty of MSPs for: (a) pellet fuel, (b) biopower, (c) biochar, (d) aviation fuel.
Regarding the uncertainties of life-cycle GHG emissions, the Monte Carlo simulation results indicated that with the given uncertainties, the 95% confidence intervals of the GHG emissions range from 100.14 to 199.82 kg CO2 eq./Mg for pellet fuel, from 24.25 to 80.10 kg CO2 eq./MWh for biopower, from 617.06 to 968.03 kg CO2 eq./Mg for biochar, and from 0.94 to 3.33 kg CO2 eq./Gallon for aviation fuel (Figure 8).
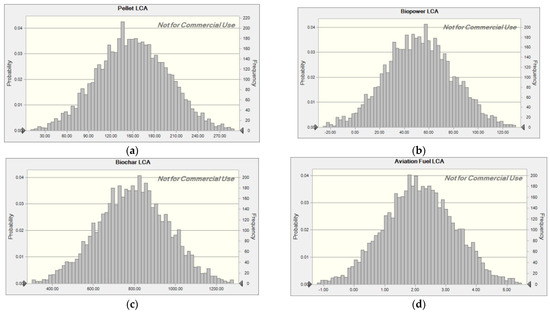
Figure 8.
Uncertainty of life-cycle GHG emissions for: (a) pellet fuel, (b) biopower, (c) biochar, (d) aviation fuel.
3.3.3. Integrated Analysis Results
The integrated analysis indicated that the carbon intensity is 0.84, 0.47, 0.75, and 0.41 for pellet fuel, biopower, biochar, and aviation fuel, respectively. This means that the production of biopower and aviation fuel has lower carbon intensities than that of pellet fuel and biochar. And the carbon intensity (CI) values of bioenergy pathways—ranging from 0.41 for aviation fuel to 0.84 for pellet fuel—highlight critical sectoral dynamics in decarbonization efforts.
4. Discussion
In the context of bioeconomy and SDGs, the key marginal contribution of this study is that an integrated modeling framework was developed, consisting of field studies, a Bayesian-based statistical learning model, techno-economic analysis, and life-cycle assessment. This modeling framework could take the whole chain of forest biomass cutting, extraction, chipping, transportation, and conversion for value-added bioproducts into consideration and comprehensively assess the forest biomass utilization for value-added bioproducts from the perspectives of both economics and GHG emissions. The output of the integrated model could inform the decision-making process in the development of bio-based industries. The eastern US was used as the case region to examine this integrated model, and the results showed the model had a very good performance. Therefore, in addition to the case region, the eastern US, any other forest regions with different environmental conditions could employ this integrated modeling framework to explore the life-cycle economics and GHG emissions of forest biomass utilization for value-added bioproducts.
As a key result combining the economic analysis and GHG emission, the carbon intensity (CI) values of value-adding pathways—ranging from 0.41 for aviation fuel to 0.84 for pellet fuel—highlight critical sectoral dynamics in decarbonization efforts. In electricity markets, biopower’s low CI (0.47) positions it as a competitive alternative to fossil fuels, particularly in regions with renewable portfolio standards or carbon pricing mechanisms that incentivize low-carbon generation. Similarly, aviation fuel’s low CI (0.41) underscores its potential to address one of the hardest-to-abate sectors, aligning with global SAF (sustainable aviation fuel) mandates like CORSIA and the EU’s ReFuelEU. Conversely, higher CI values for pellet fuel and biochar (0.84 and 0.75) may emphasize the need for sector-specific policies, such as sustainable forestry certifications or enhanced carbon accounting.
Overall, the results could be used by both policy-makers and the private sector. First, since the reduction of the carbon intensity means reducing GHG emissions while keeping the economic growth, bio-based industries with low CIs could be good solutions in the context of climate change. Thus, the results on bio-industries in this study could be used by the policy-makers in regional energy planning for achieving carbon reduction targets. The quantitative evidence was provided for the policy-makers to substitute the fossil-fuel-based industries with the bio-based ones in the local industry portfolios, leading to the decoupling of GHG emission and economic growth. Second, at this moment the higher profitability probability of wood pellet fuel and biochar indicates that both could be good choice for the private sector to start their bio-based business in the short run. However, the lower CIs of the biopower and aviation fuel mean that both of them would be more promising considering the “getting-greener” trend in the long run, especially regulated by the Nationally Determined Contributions set by the Paris Agreement.
4.1. Forest Biomass Harvesting System
The representative forest biomass harvesting systems across the eastern US were summarized in this study, especially focusing on the integrated biomass harvesting system. The harvesting systems and configured machinery of forest biomass are very similar to those of timber harvesting. Actually, this gives biomass harvesting a big advantage. Leveraging the well-developed timber harvesting systems and machinery in the eastern US, the forest biomass is more ready to be harvested and utilized than other biomass sources, such as energy crops. Most of the harvesting systems for energy crops are still in trials and need further evaluation for commercial-scale utilization [49,50]. This is reflected in our previous study where the harvesting cost of forest residue is lower than that of energy crops in the northeastern US [51].
In addition to the cutting and extraction processes that are similar between biomass and timber harvesting, chipping is an additional core component in biomass supply chains [52]. However, lower utilization rates of the chippers were observed in almost all sites, compared with those of other machines. This is consistent with the previous studies [53]. The lower utilization rate leads to a higher unit cost of chipping. Thus, employing small-size mobile chippers is a popular strategy for biomass harvesting operators to avoid this issue [54]. In addition, centralized chipping is also a potential option to increase the utilization rate of the chippers via leveraging the scale of the economy, as what we observed in northern West Virginia where a centralized chipping operation was employed. However, this is a tradeoff issue between at-landing chipping and centralized chipping, as the centralized chipping usually comes along with the higher transportation cost of loose material, an additional requirement of chipping sites, and even storage cost of wood chips in the chipping sites. This centralized chipping operation is not included here since it is still not a typical operation in the region, and it will be reported in detail in a standalone manuscript.
During the field studies, we noticed that most of the integrated harvesting just chipped the SDT for forest biomass, while the treetops and branches from the primary products, such as sawtimber/pulpwood processing, were not chipped for biomass utilization in all integrated systems. This could be attributed to the low profit margin of biomass harvesting and the relatively low quality of treetops and branches. As the amount of treetops and branches is much lower than the whole-tree biomass, the unit cost of utilizing treetops and branches would be much higher. Given the thin profit margin, utilizing the treetops and branches is not economically appealing [6]. Moreover, the treetops and branches are usually with contaminations (such as soil and small stones) from the skidding, so utilizing them requires more caution and could potentially increase the maintenance of chippers [55]. This is consistent with the reported intention of a contractor in coastal regions to add a tub grinder to comminute the materials that are not suitable to be chipped [24]. The low-quality forest residue could be ground as hog fuel for direct burning [56].
4.2. Costs and GHG Emissions of Forest Biomass Harvesting
Both the spatial and statistical distributions of the costs and GHG emissions of forest biomass harvesting were provided in this study, which could be used as a benchmark for future harvesting cost and GHG emission studies in the eastern US. Unlike an assumed feedstock harvesting cost and GHG emission in most of previous studies, this study provided a statistically solid data source for feedstock cost and GHG emission of forest biomass utilization for bio-based industries.
A 95% confidence interval of forest biomass harvesting cost in the eastern US, USD 25.52–45.75/dry Mg, was derived based on our field investigations. The other two similar studies in the eastern US reported forest biomass harvesting costs, USD 26.58/dry Mg and USD 37.28/dry Mg, which perfectly fell into this confidence interval [27,29]. This supports the rationality of our results. In addition, the GHG emissions and their statistical distribution are also provided in this study. The 95% confidence interval of GHG emission based on our field investigations is 43.59–115.09 kg CO2 eq./dry Mg. Of note, the harvesting costs/emissions reported in this study are the sum of those of felling, extraction, loading, and chipping functions. The potential costs and emissions resulting from Best Management Practice (BMP) were not considered here. If BMP is included, the harvesting cost would increase while the environmental burdens would decrease.
The reported GHG emission of forest biomass harvesting for pulpwood in the State of Michigan (14.4–51.6 kg CO2 eq./dry Mg) partially overlapped with this interval, but is slightly lower [57]. That looks reasonable because pulpwood harvesting is more productive than biomass harvesting in felling and extraction processes, because of the larger diameters of pulpwood. Moreover, this confidence interval covers one of the results from the other two similar studies (73.54 kg CO2 eq./dry Mg) in the eastern US, while the other result (17.50 kg CO2 eq./dry Mg) is out of this range. In this case, the proposed Bayesian-based statistical learning model demonstrated the good capacity to incorporate the other studies with our studies to provide more robust results. The 95% confidence intervals of cost and GHG emission of forest biomass harvesting in the eastern US are (USD 21.99–44.33)/dry Mg and (14.79–98.80 kg CO2 eq.)/dry Mg, respectively. This learning capacity is very meaningful in the context of the big data era. The studies on forest biomass utilization for bioenergy are expected to be more and more. This proposed Bayesian-based model demonstrated the feasibility of integrating the results of comparable studies to deliver more robust results. Especially for the field studies, their results are usually reported one by one. This fragmentedness makes it hard to reveal a comprehensive big picture beyond just a one-site view.
Spatially, the coastal plain region of the southeastern and Mid-Atlantic US showed lower biomass harvesting costs. This is consistent with our observations that the terrain conditions in both regions are friendly for harvesting machines, which could lead to higher productivity. However, the mountain regions of the Mid-Atlantic and the northeastern US are usually with wide valleys and steep slopes, which limits productivity. In addition, the biomass cost of biomass-only harvesting is generally lower than that of integrated harvesting. This could be attributed to the higher machine utilization rates in the biomass-only harvesting than in the integrated harvesting, where the machines have to move around the large-diameter trees. In addition, a lower biomass cost from integrated harvesting is reported in the northeastern US. This could be attributed to the following two reasons: First, as reported, all non-merchantable trees along with the small-diameter trees are chipped in pulpwood standards due to the shrunk bioenergy market in the northeastern US [25,58]. We used this wood chip cost to proximate the forest biomass cost in the region. As the larger-diameter trees for pulpwood are counted here for wood chips, it could lower the overall felling and skidding costs. Second, in the northeastern mountain region, the overall diameters of trees are larger than those in the coastal plain region [24]. This could lead to the felling and extraction cost of biomass trees being lower due to higher productivity than those in coastal plain regions.
Moreover, the forest biomass cost, including only chipping cost, is also reported in the northeastern US region. This would occur in the case that forest biomass is required to move to the landing for site preparation or legislation compliance, no matter whether it would be used [25]. Though this cost is relatively lower than the regular biomass cost including felling and extraction cost, the quantity of this kind of biomass is supposed to be limited and cannot be commercially utilized at large scale. This cost could be used in the analysis when this kind of biomass is used in small-scale facilities, such as the small-scale biochar production system in the paper. In addition, the reported biomass harvesting cost from thinning activities was much higher than that of forest biomass from other sources. This would make this biomass utilization definitely unprofitable from an economic view. This is consistent with Campbell and Anderson’s study, which states that without considering the environmental value, it is very challenging to be profitable using this biomass as feedstock for bioenergy production [59].
Lastly, the forest biomass harvesting sites were visited and investigated as more representative as possible to reflect the overall status of regional harvesting. As this site determination process was subjective with our best judgment, bias may exist. And as these investigations were conducted during the COVID-19 pandemic, the number of visited sites could be further extended. In this case, the proposed Bayesian-based statistical learning model could help overcome this limitation by integrating the other and future studies. In addition, the number of sites visited in the northeastern region is less than that in other regions. In that region, the biomass utilization market is much smaller and there are recent closures of plants [58]. This limited the identification of the forest biomass integrated harvesting sites.
4.3. Economics and GHG Emissions of Forest Biomass Utilization for Alternative Value-Added Products
The deterministic and stochastic analyses of TEA and LCA comprehensively and quantitatively revealed the economics and GHG emissions of forest biomass utilization for the alternative value-added bioproducts in the eastern US. They could play as useful references for decision-makers to develop the bio-industries for bioeconomy in the region. Using the metric of MSP demonstrated advantages over the other conventional metrics, such as NPV and IRR, in the bioproducts field. Because most of the bioproducts’ markets are still underdeveloped at this moment, it is challenging to have a market selling price to calculate the profit. Especially for aviation fuel, the production of forest biomass-based aviation fuel is very rare in reality. Because of this, the price escalation rates of biochar and aviation fuel were set referring to the rate of wood pellet fuels. This point needs reassessment in the near future when the market for biochar and aviation fuel is well-developed.
The MSPs for pellet fuel and biopower are slightly lower than those in the previous study using multi-biomass feedstock [20]. That could be attributed to the higher feedstock delivered cost of other biomass including hybrid willow, switchgrass, and Miscanthus than forest biomass [51]. While MSP for biochar is a bit higher than another study (~USD 800/Mg) using the same production system [32]. The major reason is much lower feedstock cost is assumed (USD 14/Mg) in that study. This lower cost could be realized when we use the forest biomass that just needs to pay the chipping cost, as we discussed above. However, with this cost the quantity of forest biomass availability would be highly limited. This is consistent with the current situation of biochar production, using a small-scale production system with low-cost feedstock [60]. This makes biochar production very flexible, especially at this moment when the biochar market is still under developed. However, we should be aware of the associated lower conversion rate (~20%) of the small-scale system than that (40%–60%) of the large-scale system [61]. That implies that biochar production needs to be upgraded to a larger scale, considering the prospect of biochar application. Regarding the aviation fuel from forest biomass, the MSP is within the reported cost range (USD 4–6/gallon) of biomass-based jet fuel [43]. Moreover, the sensitivity analysis indicated, in terms of the bioproducts, the MSPs of pellet fuel and biochar are much less affected than those of biopower and aviation fuel, with the changes in feedstock delivered cost, discount rate, and tax rate. That could partially explain the current investment status that much more pellet fuel plants were established than other bioproduct plants.
The GHG emissions of pellet fuel, biochar, and aviation fuel production are close to those in other studies [35,41,42]. GHG emissions of biopower are within the reported range (33.6–64.2 kg CO2 eq./MWh) of GHG emissions of forest biomass utilization for electricity generation across the nation [62]. For the production of aviation fuel and biopower, the process of in-plant conversion accounted for a smaller portion than the harvesting and logistics for GHG emissions. This is consistent with the other studies [36]. The major reason is that GHG emissions from biomass during the conversion process are regarded as biogenic carbon. In the LCA framework, biogenic carbon is thought of as having no global warming potential impact, which is numerically set as zero [63]. Overall, the LCA results clearly quantified the GHG emissions for four kinds of bioproducts. In the context of climate change, products with fewer GHG emissions would be more in line with the future political and market trends, hence creating opportunities for bio-based industries. However, the GHG results cannot be directly compared across the four bioproducts, because of the different mass units. We proposed the metric of carbon intensity to integrate the GHG emission results with the economic results, which revealed a different insight. Though the wood pellet and biochar production are more economically appealing, their carbon intensities are higher than the production of biopower and aviation fuel from forest biomass. This implies that, as high value-adding products from forest biomass biopower and aviation fuel need to be further developed to develop the low-carbon economy, though they are not as economically appealing as wood pellet fuel and biochar at this moment. In other words, the wood pellet fuel and biochar are the dominant value-added bioproducts from forest biomass at this moment, while the biopower and aviation fuel are very promising considering the future political and market trends to be “greener”.
Furthermore, the stochastic analysis quantitatively revealed the uncertainty of MSPs and GHG emissions of forest biomass utilization for these alternative value-added bioproducts. Producing pellet fuel from forest biomass is with high probability (>80%) to be profitable. And the biochar production could be profitable with high probability (79.51%) when the price could be kept at USD 1100/Mg. The biopower production is not so confident to be profitable (~50%). It is consistent with the previous study that states a USD 60–160/Mg carbon tax/credit could be necessary for biopower generation to achieve profitability [64]. The aviation fuel production from forest biomass is still far from being profitable, if the MSP stays at USD 4.98/gallon. This implies that policy instruments, such as subsidies and carbon credits, should be adopted to promote the development of sustainable aviation fuel. The Fischer–Tropsch (FT) catalyst process was used here for the conversion of aviation fuel due to its high technology readiness level. The economic performances of forest biomass for aviation fuel via the paths of hydroprocessed esters and fatty acids (HEFA), alcohol-to-jet (ATJ), and hydroprocessing of fermented sugars (HFS) might be different and need a further study.
5. Conclusions
Overall, an integrated modeling framework consisting of field studies, a Bayesian-based statistical learning model, techno-economic analysis, and life-cycle assessment was developed in this study to reveal a comprehensive insight into forest biomass utilization for alternative value-added bioproducts. Taking the eastern US as the case region, the integrated model was examined with good performance. Moreover, the production of forest biomass for pellet fuel and biochar is more economically favored at this moment, while the production of forest biomass for biopower and aviation fuel is very promising given the future political and market trends to be “greener”. All of these value-added bioproducts can play positive roles in the decarbonization paths of the corresponding sectors.
Specifically, by investigating and summarizing the typical forest biomass harvesting systems across the region, the forest biomass harvesting costs were spatially grouped and mapped for four defined subregions including the northeastern US mountain region with hardwood-dominated forests, the Mid-Atlantic US mountain region with hardwood-dominated forests, the Mid-Atlantic US coastal plain region with pine-dominated forests, and the southeastern US coastal plain region pine-dominated forests. Overall, in the eastern US, with 95% confidence, the forest biomass harvesting cost is between USD 21.99 and USD 44.33/dry Mg, while GHG emissions are between 14.79 and 98.80 kg CO2 eq./dry Mg. With these forest biomass utilization for four alternative value-added bioproducts, the economics and GHG emissions were evaluated. The results indicated that the MSP is USD 177.82/Mg for pellet fuel, USD 110.24/MWh for biopower, USD 1059.4/Mg for biochar, and USD 4.98/gallon for aviation fuel. The life-cycle GHG emissions are 149.80 kg CO2 eq./Mg pellet fuel, 52.22 kg CO2 eq./MWh biopower, 792.12 kg CO2 eq./Mg biochar, and 2.13 kg CO2 eq./gallon aviation fuel, respectively. Considering the uncertainties, the 95% confidence intervals of MSP range from USD 164.77 to USD 190.97/Mg for pellet fuel with an 81.85% probability to be profitable, from USD 100.20 to USD 120.21/MWh for biopower with a 49.38% probability to be profitable, from USD 1000.91 to USD 1109.25/Mg for biochar with a 79.51% probability to be profitable, and from USD 4.86 to USD 5.54/Gallon for aviation fuel with an 0.03% probability to be profitable. Moreover, the MSPs of pellet fuel and biochar are much less affected by the market changes than those of biopower and aviation fuel. However, the production of biopower and aviation fuel has lower carbon intensities than that of pellet fuel and biochar.
Author Contributions
Conceptualization, J.W. and X.Z.; methodology, X.Z.; formal analysis, X.Z.; writing—original draft preparation, X.Z.; writing—review and editing, J.W., X.Z., J.V. and J.L.; project administration, J.W., J.V. and J.L.; funding acquisition, J.W., X.Z. and J.L. All authors have read and agreed to the published version of the manuscript.
Funding
This research work is co-supported by the National Key R&D Program of China (2023YFD2202105), the USDA NIFA Competitive Grants: 2019-67020-29287 and 2020-68012-31881, China Postdoctoral Science Foundation (2023M730151), and Beijing Postdoctoral Research Foundation (2023-zz-157).
Data Availability Statement
The raw data supporting the conclusions of this article will be made available by the authors on request.
Acknowledgments
We appreciate all the supports from the entire research team, consisting of members from University of Maine, West Virginia University, Virginia Polytechnic Institute and State University, and Auburn University, for their data sharing and technical support. And we acknowledge the support from IUFRO Task Force ‘Interaction and Synergy of Carbon ‘3S’ (Sink, Storage and Substitution) in Forest Value Chains’.
Conflicts of Interest
The authors declare no conflicts of interest.
References
- Elliott, J. An Introduction to Sustainable Development; Routledge: London, UK, 2012; ISBN 978-02-0384-417-5. [Google Scholar]
- United Nations. The 17 Goals. Available online: https://sdgs.un.org/goals (accessed on 1 January 2025).
- Zhang, X.; Wang, J.; Strager, M.P. Industrial Development and Economic Impacts of Forest Biomass for Bioenergy: A Data-Driven Holistic Analysis Framework. Resour. Conserv. Recycl. 2022, 182, 106296. [Google Scholar] [CrossRef]
- Nel, W.P.; Cooper, C.J. Implications of fossil fuel constraints on economic growth and global warming. Energy Policy 2009, 37, 166–180. [Google Scholar] [CrossRef]
- Zhang, X. Optimization and Analytics of Decarbonized Forest and Biomass Supply Chains. Ph.D. Thesis, West Virginia University, Morgantown, WV, USA, 2022; p. 11434. Available online: https://researchrepository.wvu.edu/etd/11434 (accessed on 1 January 2025).
- Barrett, S.M.; Bolding, M.C.; Aust, W.M.; Munsell, J.F. Characteristics of logging businesses that harvest biomass for energy production. For. Prod. J. 2014, 64, 265–272. [Google Scholar] [CrossRef]
- Kittler, B.A.; Beauvais, C.M. The Potential for Sustainable Wood-Based Bioenergy in Maryland: Developing Safeguards for Woody Biomass Harvests and Evaluating Wood-Based Bioenergy Markets. Available online: https://dnr.maryland.gov/forests/Documents/publications/MDBiomassGuidelines.pdf (accessed on 1 January 2025).
- Hartley, D.S.; Burli, P.H. Biomass Supply, Logistics, and Factors that Affect Logistics; Springer: Amsterdam, The Netherlands, 2024; pp. 25–49. ISBN 978-94-007-6308-1. [Google Scholar]
- Hess, J.R.; Tumuluru, J.S. Biomass Supply Chain Logistics: Challenges and Technological Advancements; Springer: Amsterdam, The Netherlands, 2024; pp. 3–24. ISBN 978-94-007-6308-1. [Google Scholar]
- Evans, A.M.; Perschel, R.T.; Kittler, B.A. Overview of forest biomass harvesting guidelines. J. Sustain. For. 2013, 32, 89–107. [Google Scholar] [CrossRef]
- Wang, J. Forest and Biomass Harvest and Logistics; Springer: New York, NY, USA, 2022; ISBN 978-3-031-12946-9. [Google Scholar]
- Ghaffariyan, M.R.; Brown, M.; Acuna, M.; Sessions, J.; Gallagher, T.; Kühmaier, M.; Spinelli, R.; Visser, R.; Devlin, G.; Eliasson, L.; et al. An international review of the most productive and cost effective forest biomass recovery technologies and supply chains. Renew. Sustain. Energy Rev. 2017, 74, 145–158. [Google Scholar] [CrossRef]
- Titus, B.D.; Brown, K.; Helmisaari, H.-S.; Vanguelova, E.; Stupak, I.; Evans, A.; Clarke, N.; Guidi, C.; Bruckman, V.J.; Varnagiryte-Kabasinskiene, I.; et al. Sustainable forest biomass: A review of current residue harvesting guidelines. Energy Sustain. Soc. 2021, 11, 10. [Google Scholar] [CrossRef]
- Townsend, L.; Dodson, E.; Anderson, N.; Worley-Hood, G.; Goodburn, J. Harvesting forest biomass in the US southern Rocky Mountains: Cost and production rates of five ground-based forest operations. Int. J. For. Eng. 2019, 30, 163–172. [Google Scholar] [CrossRef]
- Harrill, H.; Han, H.-S. Productivity and cost of integrated harvesting of wood chips and sawlogs in stand conversion operations. Int. J. For. Res. 2012, 1, 893079. [Google Scholar] [CrossRef]
- Bastos, T.; Teixeira, L.C.; Nunes, L.J.R. Forest 4.0: Technologies and digitalization to create the residual biomass supply chain of the future. J. Clean. Prod. 2024, 467, 143041. [Google Scholar] [CrossRef]
- Vance, J.; Wang, J.; Zhang, X.; Grushecky, S.; Spinelli, R. Chipping operations and chip quality from mixed hardwood forests for bioenergy. Int. J. For. Eng. 2023, 34, 317–329. [Google Scholar] [CrossRef]
- Kizha, A.R.; Han, H.-S. Processing and sorting forest residues: Cost, productivity and managerial impacts. Biomass Bioenergy 2016, 93, 97–106. [Google Scholar] [CrossRef]
- BETO. BETO Biofuels TEA Database. Available online: https://bioenergykdf.net/content/beto-biofuels-tea-database (accessed on 7 May 2025).
- Liu, W.; Wang, J.; Richard, T.L.; Hartley, D.S.; Spatari, S.; Volk, T.A. Economic and life cycle assessments of biomass utilization for bioenergy products. Biofuels Bioprod 2017, 11, 633–647. [Google Scholar] [CrossRef]
- Langholtz, M.H.; Stokes, B.J.; Eaton, L.M. Billion-Ton Report: Advancing Domestic Resources for a Thriving Bioeconomy; Oak Ridge National Laboratory, DOE: Oakridge, TN, USA, 2016; pp. 1–411. [Google Scholar]
- Hoefnagels, R.; Junginger, M.; Faaij, A. The economic potential of wood pellet production from alternative, low-value wood sources in the southeast of the US. Biomass Bioenergy 2014, 71, 443–454. [Google Scholar] [CrossRef]
- Chasuk, L. Woody Biomass Production in the Southeastern United States. Master’s Thesis, Auburn University, Auburn, AL, USA, 2022. [Google Scholar]
- Garren, A.M.; Bolding, M.C.; Barrett, S.M.; Aust, W.M.; Coates, T.A. Evaluating the productivity and costs of five energywood harvesting operations in the lower Mid-Atlantic region of the US. Int. J. For. Eng. 2022, 33, 170–180. [Google Scholar]
- Louis, L.T.; Kizha, A.R. Wood biomass recovery cost under different harvesting methods and market conditions. Int. J. For. Eng. 2021, 32, 164–173. [Google Scholar] [CrossRef]
- Vance, J.E. Production and Economic Analyses of Woody Biomass Utilization for Energy. Master’s Thesis, West Virginia University, Morgantown, WV, USA, 2018. [Google Scholar]
- Hanzelka, N.C.; Bolding, M.C.; Sullivan, J.; Barrett, S.M. Productivity and costs of utilizing small-diameter stems in a biomass-only harvest. Int. J. For. Eng. 2016, 27, 43–52. [Google Scholar] [CrossRef]
- Box, G.E.; Tiao, G.C. Bayesian Inference in Statistical Analysis; John Wiley & Sons: New York, NY, USA, 2011; ISBN 978-11-1803-319-7. [Google Scholar]
- Wasserman, L. Bayesian Inference; Springer: Amsterdam, The Netherlands, 2004; pp. 175–192. ISBN 978-0-387-21736-9. [Google Scholar]
- Conrad, J.L., IV; Bolding, M.C.; Aust, W.M.; Smith, R.L.; Horcher, A. Harvesting productivity and costs when utilizing energywood from pine plantations of the southern Coastal Plain USA. Biomass Bioenergy 2013, 52, 85–95. [Google Scholar] [CrossRef]
- Hoegh-Guldberg, O.; Jacob, D.; Bindi, M.; Brown, S.; Camilloni, I.; Diedhiou, A.; Djalante, R.; Ebi, K.; Engelbrecht, F.; Guiot, J.; et al. Impacts of 1.5 C Global Warming on Natural and Human Systems; Glob. Warm. 15 C IPCC Spec. Rep. IPCC Secretariat: Geneva, Switzerland, 2018; Volume 137, pp. 175–311. [Google Scholar]
- Sahoo, K.; Bilek, E.; Bergman, R.; Mani, S. Techno-economic analysis of producing solid biofuels and biochar from forest residues using portable systems. Appl. Energy 2019, 235, 578–590. [Google Scholar] [CrossRef]
- EUR 24099 EN; Verheijen, F.; Jeffery, S.; Bastos, A.C.; Van der Velde, M.; Diafas, I. Biochar Application to Soils—A Critical Scientific Review of Effects on Soil Properties. Office for the Official Publications of the European Communities: Luxembourg, 2010; Volume 24099, p. 162ISBN 9789279142932.
- Staples, M.D.; Malina, R.; Suresh, P.; Hileman, J.I.; Barrett, S.R. Aviation CO2 emissions reductions from the use of alternative jet fuels. Energy Policy 2018, 114, 342–354. [Google Scholar] [CrossRef]
- Agusdinata, D.B.; Zhao, F.; Ileleji, K.; DeLaurentis, D. Life cycle assessment of potential biojet fuel production in the United States. Environ. Sci. Technol. 2011, 45, 9133–9143. [Google Scholar] [CrossRef]
- Michag, M.F.R.; Michailos, S.; Akram, M.; Cardozo, E.; Hughes, K.J.; Ingham, D.; Pourkashanian, M. Bioenergy with carbon capture and storage (BECCS) potential in jet fuel production from forestry residues: A combined Techno-Economic and Life Cycle Assessment approach. Energy Convers. Manag. 2022, 255, 115346. [Google Scholar]
- de Klerk, A.; Chauhan, G.; Halmenschlager, C.; Link, F.; Sánchez, N.M.; Gartley, B.; El-Sayed, H.E.M.; Sehdev, R.; Lehoux, R. Sustainable aviation fuel: Pathways to fully formulated synthetic jet fuel via Fischer–Tropsch synthesis. Energy Sci. Eng. 2024, 12, 394–409. [Google Scholar] [CrossRef]
- Hunsberger, R.; Mosey, G. Pre-Feasibility Analysis of Pellet Manufacturing on the Former Loring Air Force Base Site. In A Study Prepared in Partnership with the Environmental Protection Agency for the RE-Powering America’s Land Initiative: Siting Renewable Energy on Potentially Contaminated Land and Mine Sites; National Renewable Energy Lab. (NREL): Golden, CO, USA, 2014. [Google Scholar]
- Moriarty, K. Feasibility Study of Biopower in East Helena, Montana. In A Study Prepared in Partnership with the Environmental Protection Agency for the RE-Powering America’s Land Initiative: Siting Renewable Energy on Potentially Contaminated Land and Mine Sites; National Renewable Energy Lab. (NREL): Golden, CO, USA, 2013. [Google Scholar]
- Scarlata, C.; Mosey, G. Feasibility Study of Economics and Performance of Biopower at the Chanute Air Force Base in Rantoul, Illinois. In A Study Prepared in Partnership with the Environmental Protection Agency for the RE-Powering America’s Land Initiative: Siting Renewable Energy on Potentially Contaminated Land and Mine Sites; National Renewable Energy Lab. (NREL): Golden, CO, USA, 2013. [Google Scholar]
- Wang, Y.; Wang, J.; Zhang, X.; Grushecky, S. Environmental and Economic Assessments and Uncertainties of Multiple Lignocellulosic Biomass Utilization for Bioenergy Products: Case Studies. Energies 2020, 13, 6277. [Google Scholar] [CrossRef]
- Sahoo, K.; Upadhyay, A.; Runge, T.; Bergman, R.; Puettmann, M.; Bilek, E. Life-cycle assessment and techno-economic analysis of biochar produced from forest residues using portable systems. Int. J. Life Cycle Assess. 2021, 26, 189–213. [Google Scholar] [CrossRef]
- Milbrandt, A.; Kinchin, C.; McCormick, R. Feasibility of Producing and Using Biomass-Based Diesel and Jet Fuel in the United States; National Renewable Energy Lab. (NREL): Golden, CO, USA, 2013. [Google Scholar]
- U.S. Energy Information Administration. Biofuels and Biomass. Available online: https://www.eia.gov/biofuels/biomass/ (accessed on 1 January 2025).
- The Pricer. How Much Does Jet Fuel Cost? Available online: https://www.thepricer.org/how-much-does-jet-fuel-cost/ (accessed on 1 January 2025).
- Microsoft Corporation. Microsoft 365. Available online: https://www.microsoft.com/en-us/microsoft-365 (accessed on 1 January 2025).
- PRé Sustainability. SimaPro. SimaProLCA Softw. Inf. Change-Mak. Available online: https://simapro.com/ (accessed on 1 January 2025).
- Oracle. Oracle Crystal Ball. Available online: https://www.oracle.com/applications/crystalball/ (accessed on 1 January 2025).
- Eisenbies, M.H.; Volk, T.A.; Espinoza, J.; Gantz, C.; Himes, A.; Posselius, J.; Shuren, R.; Stanton, B.; Summers, B. Biomass, spacing and planting design influence cut-and-chip harvesting in hybrid poplar. Biomass Bioenergy 2017, 106, 182–190. [Google Scholar] [CrossRef]
- Eisenbies, M.H.; Volk, T.A.; Posselius, J.; Foster, C.; Shi, S.; Karapetyan, S. Evaluation of a single-pass, cut and chip harvest system on commercial-scale, short-rotation shrub willow biomass crops. Bioenergy Res. 2014, 7, 1506–1518. [Google Scholar] [CrossRef]
- Wang, Y.; Wang, J.; Schuler, J.; Hartley, D.; Volk, T.; Eisenbies, M. Optimization of harvest and logistics for multiple lignocellulosic biomass feedstocks in the northeastern United States. Energy 2020, 197, 117260. [Google Scholar] [CrossRef]
- Zhang, X.; Wang, J.; Vance, J.; Wang, Y.; Wu, J.; Hartley, D. Data Analytics for Enhancement of Forest and Biomass Supply Chain Management. Curr. For. Rep. 2020, 6, 129–142. [Google Scholar] [CrossRef]
- Aman, A.L.; Baker, S.A.; Greene, W.D. Productivity and product quality measures for chippers and grinders on operational southern US timber harvests. Int. J. For. Eng. 2011, 22, 7–14. [Google Scholar] [CrossRef]
- Westbrook, M.D., Jr.; Dale Greene, W.; Izlar, R.L. Utilizing forest biomass by adding a small chipper to a tree-length southern pine harvesting operation. South. J. Appl. For. 2007, 31, 165–169. [Google Scholar] [CrossRef]
- Spinelli, R.; Cavallo, E.; Facello, A.; Magagnotti, N.; Nati, C.; Paletto, G. Performance and energy efficiency of alternative comminution principles: Chipping versus grinding. Scand. J. For. Res. 2012, 27, 393–400. [Google Scholar] [CrossRef]
- Sahoo, K.; Bilek, E.; Bergman, R.; Kizha, A.R.; Mani, S. Economic analysis of forest residues supply chain options to produce enhanced-quality feedstocks. Biofuels Bioprod. Biorefining 2019, 13, 514–534. [Google Scholar] [CrossRef]
- Zhang, F.; Johnson, D.M.; Wang, J.; Yu, C. Cost, energy use and GHG emissions for forest biomass harvesting operations. Energy 2016, 114, 1053–1062. [Google Scholar] [CrossRef]
- Koirala, A.; Kizha, A.R. Perceiving major problems in forest products transportation by trucks and trailers: A cross-sectional survey. Eur. J. For. Eng. 2017, 3, 23–34. [Google Scholar]
- Campbell, R.M.; Anderson, N.M. Comprehensive comparative economic evaluation of woody biomass energy from silvicultural fuel treatments. J. Environ. Manag. 2019, 250, 109422. [Google Scholar] [CrossRef]
- Jirka, S.; Tomlinson, T. State of the Biochar Industry. Available online: https://biochar-international.org/wp-content/uploads/2018/11/ibi_state_of_the_industry_2014_final.pdf (accessed on 1 January 2025).
- Shabangu, S.; Woolf, D.; Fisher, E.M.; Angenent, L.T.; Lehmann, J. Techno-economic assessment of biomass slow pyrolysis into different biochar and methanol concepts. Fuel 2014, 117, 742–748. [Google Scholar] [CrossRef]
- Xu, H.; Latta, G.; Lee, U.; Lewandrowski, J.; Wang, M. Regionalized Life Cycle Greenhouse Gas Emissions of Forest Biomass Use for Electricity Generation in the United States. Environ. Sci. Technol. 2021, 55, 14806–14816. [Google Scholar] [CrossRef] [PubMed]
- Wiloso, E.I.; Heijungs, R.; Huppes, G.; Fang, K. Effect of biogenic carbon inventory on the life cycle assessment of bioenergy: Challenges to the neutrality assumption. J. Clean. Prod. 2016, 125, 78–85. [Google Scholar] [CrossRef]
- Hepburn, C.; Adlen, E.; Beddington, J.; Carter, E.A.; Fuss, S.; Mac Dowell, N.; Minx, J.C.; Smith, P.; Williams, C.K. The technological and economic prospects for CO2 utilization and removal. Nature 2019, 575, 87–97. [Google Scholar] [CrossRef]
Disclaimer/Publisher’s Note: The statements, opinions and data contained in all publications are solely those of the individual author(s) and contributor(s) and not of MDPI and/or the editor(s). MDPI and/or the editor(s) disclaim responsibility for any injury to people or property resulting from any ideas, methods, instructions or products referred to in the content. |
© 2025 by the authors. Licensee MDPI, Basel, Switzerland. This article is an open access article distributed under the terms and conditions of the Creative Commons Attribution (CC BY) license (https://creativecommons.org/licenses/by/4.0/).