Review

Global Meta-Analysis of Mangrove Primary Production: Implications for Carbon Cycling in Mangrove and Other Coastal Ecosystems

Tropical Coastal & Mangrove Consultants, Pakenham, VIC 3810, Australia
Forests 2025, 16(5), 747; https://doi.org/10.3390/f16050747 (registering DOI)
Submission received: 22 March 2025 / Revised: 21 April 2025 / Accepted: 22 April 2025 / Published: 27 April 2025

Abstract

:
Mangrove forests are among the most productive vascular plants on Earth. The gross (GPP) and aboveground forest net primary production (ANPP) correlate positively with precipitation. ANPP also correlates inversely with porewater salinity. The main drivers of the forest primary production are the porewater salinity, rainfall, tidal inundation frequency, light intensity, humidity, species age and composition, temperature, nutrient availability, disturbance history, and geomorphological setting. Wood production correlates positively with temperature and rainfall, with rates comparable to tropical humid forests. Litterfall accounts for 55% of the NPP which is greater than previous estimates. The fine root production is highest in deltas and estuaries and lowest in carbonate and open-ocean settings. The GPP and NPP exhibit large methodological and regional differences, but mangroves are several times more productive than other coastal blue carbon habitats, excluding macroalgal beds. Mangroves contribute 4 to 28% of coastal blue carbon fluxes. The mean and median canopy respiration equate to 1.7 and 2.7 g C m−2 d−1, respectively, which is higher than previous estimates. Mangrove ecosystem carbon fluxes are currently in balance. However, the global mangrove GPP has increased from 2001 to 2020 and is forecast to continue increasing to at least 2100 due to the strong fertilization effect of rising atmospheric CO2 concentrations.

1. Introduction

Primary production is a fundamental ecological process, representing the first step in the capture, storage, and transfer of matter and energy. Photoautotrophs, such as mangroves and various types of algae, produce the food needed for metabolism, growth, and reproduction by incorporating carbon dioxide into organic matter using energy from sunlight. These primary producers require nutrients such as nitrogen (N) and phosphorus (P) to construct biomolecules, such as nucleic acids and proteins [1]. Nutrient uptake and cycling occur in tandem with primary production and the ratio with which they are used influences other ecological processes, including biogeochemical cycles. In forests, the canopy photosynthesizes and produces fixed carbon, leading to the formation and accumulation of tree foliage, branches, wood, and roots. Many factors are important in regulating primary production, especially light, temperature, salinity, nutrients, water availability, and sediment characteristics, such as grain size and percentages of sand, silt, and clay.
Recently, a light-use efficiency model revealed that the annual mean gross primary production (GPP) of tropical vegetation ranges from 7.1 to 7.6 g C m−2 d−1, with an apparent increasing trend from 2001 to 2020 [2]. Inland vegetation was affected mostly by precipitation, whereas coastal wetlands were mainly influenced by temperature; land cover changes that reduced the forest area significantly influenced the rates of GPP, illustrating that global environmental change is the dominant driver affecting tropical GPP. Net primary production (NPP), in contrast, has exhibited a significant decline in drought-affected areas of southern Africa, central Asia, India, South America, and Australia; tropical Asia suffers little from drought, but nearly all global vegetation has been negatively affected by climate change [3].
Mangrove forests are often described as the most productive ecosystems on Earth [4]. And while this statement is true in many coastal settings [5], not all mangroves are highly productive, especially in environments where high salinity and temperature, low rainfall, and anoxia prevail. Until recently, most estimates of mangrove primary production have been empirical measurements of litterfall rates, as it is relatively easy to collect litter beneath the canopy using litter traps. Both gross and net primary production are very method-dependent, with significantly different rates among methods [6,7]. For example, it is well known that litterfall accounts for only a fraction of the total mangrove net primary production [4,8], as litter is composed of leaves, twigs, and reproductive parts that fall from the canopy, but does not account for wood or root production. Other photoautotrophs contribute significantly to the total forest primary production. Chlorophytes, diatoms, phytoflagellates, and cyanobacteria living on the sediment surface and as epiphytes on leaves, decomposing wood, bark, and on living roots, as well as macroalgae living on the aboveground roots of most mangrove species, are important additional sources of fixed carbon.
Wood and roots constitute a large proportion of the total forest net primary production. The estimation of wood (or stem) production typically involves repeated measurements of the stem diameter and the application of allometric equations to estimate increases in biomass over time. Increments are summed for all trees within a stand surviving an appropriate time interval (1–3 y) to estimate wood production. The production of belowground roots is of considerable significance to sediment formation and the gain of surface elevation, making significant contributions to carbon processes due to the high proportion of biomass allocated belowground relative to the aboveground biomass. Knowledge of root production is limited by difficulties associated with measuring the root growth, mortality, and longevity of complex root structures [4,9]. As with aboveground biomass, belowground root biomass varies greatly among mangrove forests even when similar sampling techniques and sampling depths are used. While some of these variations may be due to methodological limitations, other factors undoubtedly play a role, including the forest age, species composition, forest history, and local climate variations, which could influence biomass allocation patterns contributing to observed differences.
Mangrove production is often limited by micro- and macronutrients, especially N and P, for which the best evidence exists. Mangrove vegetation has a requirement for minerals to synthesize cell contents to manufacture structural and reproductive tissue. Whether or not a particular stand of mangroves is nutrient-limited is problematic, as a variety of responses to fertilization have often been discerned, suggesting that other drivers play a role in mangrove–nutrient relationships. Mangroves must be efficient to survive in a harsh environment, and this notion is reflected in the generally high rates of nutrient-use efficiency compared with tropical plantation trees, evergreen, and deciduous species, forbs, and graminoids [1,4,8]. There is some evidence for species differences in mangroves in their N- and P-use efficiency; several reasons may explain these differences, including differences in nutrient allocation, the proportion of energy and nutrients vested in chemical defences, leaf life spans, and sediment physical chemistry and biogeochemistry.
A meta-analysis was performed to critically examine the growing global database on the rates and patterns of mangrove forest gross and net primary production. For ecosystem-level estimates, a revised and more accurate calculation of the canopy respiration was derived. A revised perspective is necessary because technological advances and new methods have permitted more accurate measurements of CO2 and other atmospheric gas fluxes and concentrations than possible previously. The role of benthic algal production was likewise assessed, including various forms of micro- and macroalgae, in the total forest production. The revised rates of the mangrove GPP, NPP, and respiration constitute important components not only of ecosystem production, but also for their revised contribution to coastal blue carbon fluxes in the tropical global ocean.

2. Materials and Methods

2.1. Literature Search and Screening

Two systematic literature searches (Figure S1, Supplementary Materials) were conducted by following the PRISMA protocol [10]. The searches were conducted without restricting publication date or type of publication, using the ISI Web of Science Core Collection, Google Scholar, China National Knowledge Infrastructure, Elsevier Scopus and Science Direct platforms, and the Sustainable Wetlands Adaptation and Mitigation Program (SWAMP) databases. The following keywords and phrases were searched: ‘mangrove’, ‘mangrove swamp’, ‘mangrove forest’, ‘mangrove wetland’, ‘mangal’, ’primary production’, forest production’, ‘production’, ‘respiration’, ‘canopy respiration’, ‘ecosystem respiration’, ‘ gross primary production’, ‘net primary production’, ’tree’, ‘litterfall’, ‘wood production’, ‘stem production’, ‘root production’, algae’, microalgae’, ‘microphytobenthos’, ‘macroalgae’, ‘cyanobacteria’, ‘field-based radiation based model’, ‘growth curve’ ‘growth increment’, ‘aboveground’, ‘belowground’, ‘global distribution’, ‘remote sensing’, ‘modelling’, ‘light attenuation’, ‘eddy covariance’, ‘ECV’, ‘MODIS’, ‘NIRv’, and ‘gas exchange’. Pre-1980 references or data in peer-reviewed publications were also taken into consideration.
In total, 3871 articles were identified, of which 3668 were discarded after not meeting at least one of the following criteria: (1) contains sufficient detail to judge whether methodology and level of replication were appropriate and based on published studies; (2) quantitative data were only from either empirical field or modelled studies with mangrove species clearly stated; (3) a clear description of prior land use or forest modification, if any; and (4) data of at least one environmental factor are also presented. After 101 additional articles were excluded for several reasons (e.g., inability to download or unsuccessful data acquisition from graphed data), 203 articles (see References) were finally accepted for meta-analysis.

2.2. Data Analysis

Data were extracted from these articles, and for those containing graphed data, values were determined from figures using the Get Data Graph Digitizer 2.26 software (Informer Technologies, Inc., Los Angeles, CA, USA). Rates of production in original dry weight were converted to carbon using a 48% conversion factor [8].
Non-parametric statistics were used in all analyses as all untransformed and transformed data violated assumptions of normality and homoscedasticity. One-way analysis of variance on ranks was used to test significant differences between mangrove data. Partial correlation analysis was used to separately test significant correlations between both GPP and NPP with environmental variables. The partial correlation coefficient, ΡXY,Z, measures the degree of association between two variables (x,y) while controlling for the effect of a third intercorrelated variable (z). This helps to isolate the direct relationship between the two variables of interest by removing the influence of the confounding variable. Spearman rank correlations were calculated and subsequently used in the equation
Ρ x y , z = r x y r x z r y z ( 1 r x z 2 )   ( 1 r y z 2 )
where rxy = correlation between variables x and y, rxz = correlation between variables x and z, and ryz = correlation between variables y and z.

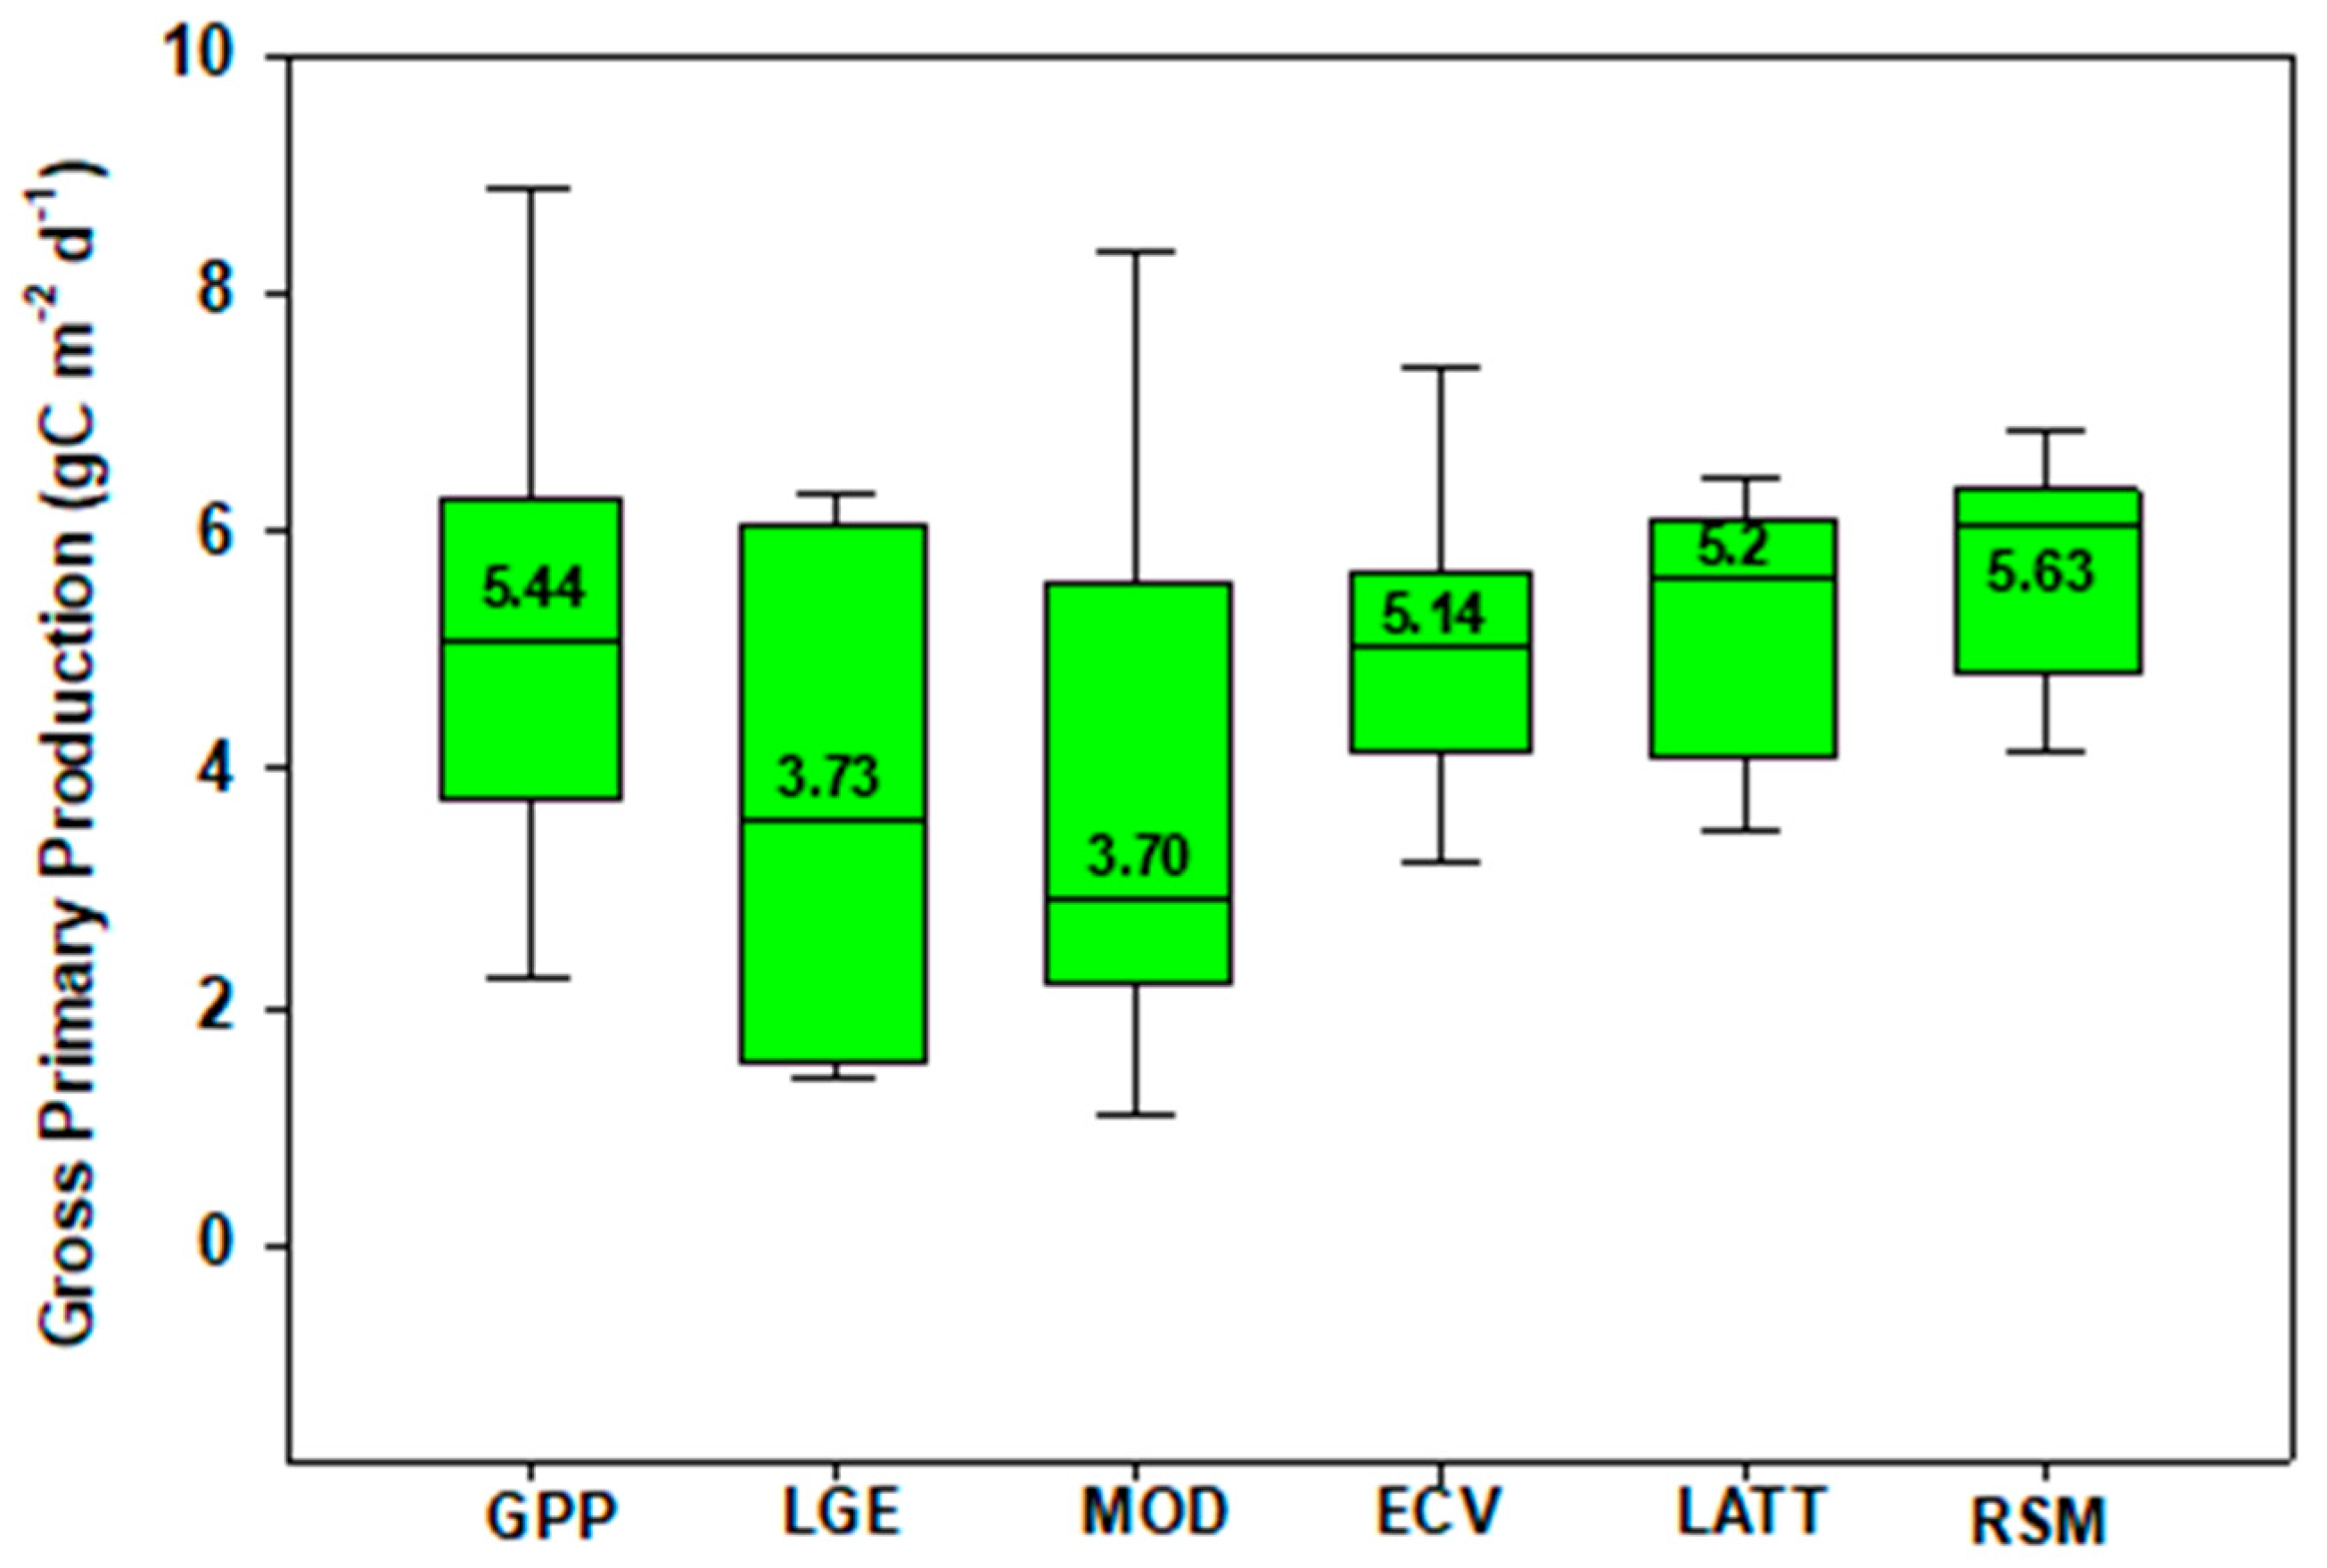
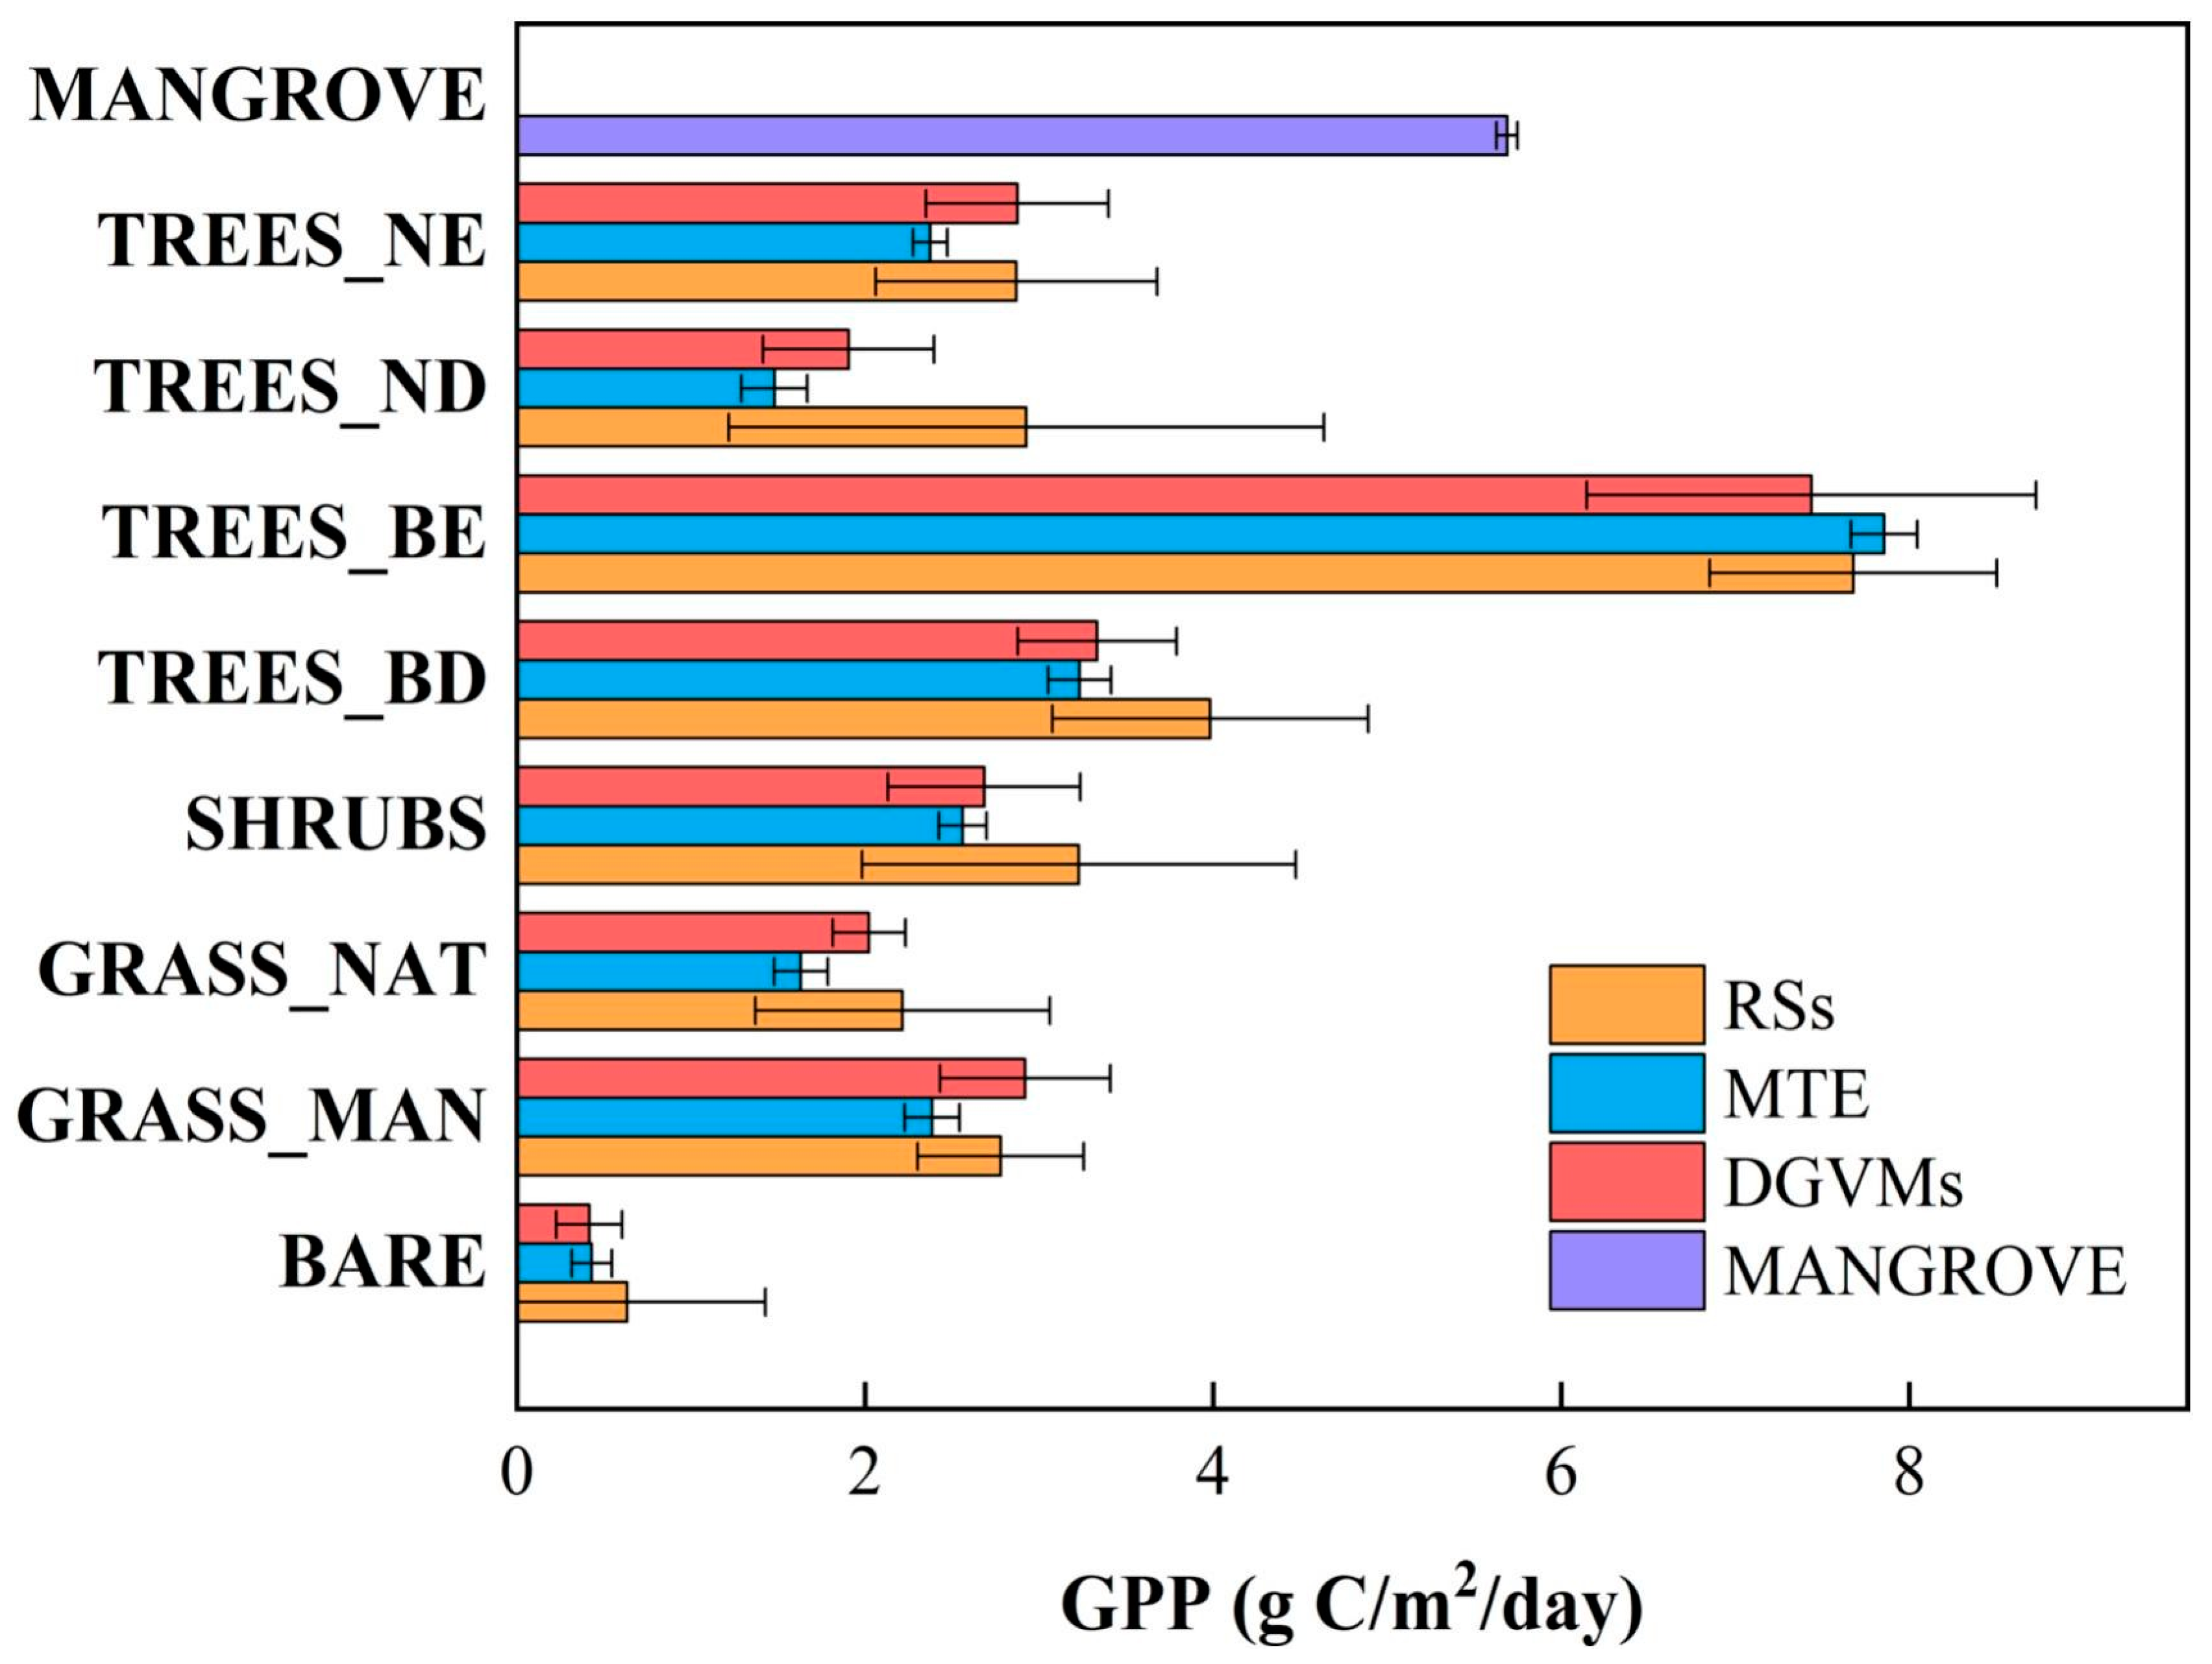
3. Gross Primary Production

There has been a dramatic increase in the number of observations of mangrove gross primary production due to advances in remote sensing technology and modelling techniques and the use of eddy covariance methods. Four methods have been used most frequently: (1) eddy covariance, (2) light attenuation, (3) combined litterfall and gas exchange, and (4) MODIS (Moderate Resolution Imaging Spectroradiometer), which is a satellite-based sensor used for earth and climate measurements. No significant differences were found among the five methods (one-way ANOVA on ranks, H = 6.65, df = 3, p = 0.08), so all data were subsequently combined. The mangrove GPP averaged 5.4 g C m−2 d−1 (2.9± 1 SD) with a median of 5.1 g C m−2 d−1, a range of 0.3–17.3 g C m−2 d−1, and 25% and 75% confidence intervals of 3.7 and 6.3 g C m−2 d−1, respectively (Figure 1).
The partial correlation analysis indicated that the mangrove gross primary production was only positively correlated with rainfall (ΡGPPRainTemp = 0.404, p < 0.001), after controlling for the positive relationship between rainfall and temperature (ΡRainTemp = 0.326, p < 0.001). The correlation underscores a decline in GPP away from the wet tropics and a reliance on freshwater for regulating GPP. Other drivers of the mangrove GPP likely include variables in combination, such as the porewater salinity, light intensity, species composition, sediment temperature, pH, redox potential, nutrient availability, frequency of tidal inundation, disturbance, and geomorphological setting. For example, in arid zone mangroves in the Gulf of California, Mexico, the GPP was limited by the lack of rainfall during the pre-monsoon and high tides, as an air temperature and vapor pressure deficit strongly drove GPP during the monsoon season [46].
The global mangrove GPP and its drivers were explored using global mangrove eddy covariance data and an applied Gaussian Process Regression (GPR) for the 1996–2020 period (Figure 2).
The globally averaged mangrove GPP was estimated at 6.0 g C m−2 d−1, which is slightly greater than my calculated estimate and comparable to that of evergreen broad-leaf forests, exceeding the GPP of most other plant types [47,48]. Production hotspots near the equator (Indonesia, Papua New Guinea, Solomon Islands, north shore of the Gulf of Guinea, and parts of the Caribbean Sea) exceeded 8 g C m−2 d−1, but the analysis revealed a decline in the global mangrove GPP during 1996–2020 of ~0.9 Tg C y−1, coinciding with a strengthening seasonal cycle and increasing variability [47]. A temporal pattern was discovered displaying a bimodal seasonal cycle with peak rates in February and November and a lower GPP in May, coinciding with the opposing seasonal cycles between the northern (April–May) and southern (November–February) hemispheres.
The most important variable in estimating the GPP was the fraction of absorbed photosynthetically active radiation (fAPAR), with the salinity, sea surface temperatures, vapor pressure difference, air temperature, and precipitation as secondary factors. North and south of the equator, the modelling indicates that the GPP declines to intermediate rates (3.3–6.6 g C m−2 d−1) in subtropical regions along the east coast of the Americas, Africa, and Australia. A relatively lower GPP (≤2.7 g C m−2 d−1) is seen along the northern Pacific coast of North America and Western Australia as well as the Middle East. The mangrove GPP tends to be higher on eastern coasts than on western coasts of the continents; there is no longitudinal gradient. The mangrove GPP in the northern hemisphere is 31% higher than in terrestrial ecosystems and 63% higher in the southern hemisphere. The tendency for a higher GPP on eastern coasts was attributed to lower salinity variations and the higher atmospheric moisture brought in by upwelling and oceanographic processes that may favour plant growth. The optimal temperature was about 26 °C, which is somewhat higher than the cross-ecosystem optimal temperature of 20.3 °C [49]. However, it did fall within the optimal air temperature range suggested for tropical ecosystems [50]. The models indicate that the optimal salinity range is 20–34 for mangroves [47].
Mangrove GPP is relatively high compared to the rates estimated in most terrestrial ecosystems (Figure 3).The globally averaged GPP for mangroves (6.0 g C m−2 d−1) is greater on average than model estimates for shrublands (2.6–3.2 g C m−2 d−1), natural grasslands (1.6–2.2 g C m−2 d−1), and croplands (2.4–2.9 g C m−2 d−1). A higher GPP was estimated only for broad-leaved evergreen trees (7.4–7.9 g C m−2 d−1), with some variation among model estimates. The mangrove GPP exceeded the terrestrial production at nearly all latitudes, except near the equator where GPP rates are comparable. The decrease in GPP with latitude is more significant than that of mangroves, mostly due to the natural decrease in the proportion of broad-leaved evergreen forests.
A process-based, biogeochemical model (Mango-GPP) was recently developed to improve GPP simulations of mangrove ecosystems, integrating mangrove physiological processes with light-use efficiency [51]. The model results were compared to empirical observations with an eddy covariance, with the modelled versus observed total annual GPP resulting in an r2 of 0.96. The observed annual mangrove GPP ranged from 4.0 to 7.4 g C m−2 d−1 with an average of 5.8 g C m−2 d−1. The modelled annual GPP ranged from 4.2 to 7.2 g C m−2 d−1 with an average of 5.7 g C m−2 d−1 for three mangrove forests located in the Mai Po Nature Reserve (Hong Kong), the Zhangjiang Estuary Mangrove National Nature Reserve (Zhanjiang, China), and the Nansha Coastal Wetland Park (Guangzhou, China). At the Zhangjiang forest, which is dominated by Kandelia obovata, Aegiceras corniculatum, and A. marina, the model generally captured the daily and seasonal fluctuations in the mangrove GPP over the 2018–2020 period (Figure 4).
To improve our understanding of how mangrove forests respond to climate and environmental change, long-term trends and interannual variability in the GPP for mangroves and adjacent terrestrial evergreen broad-leaf forests were quantified (Figure 5). This was accomplished by utilizing the near-infrared reflectance of vegetation (NIRv), a remotely sensed proxy for GPP, and retrieving Moderate Resolution Imaging Spectroradiometer (MODIS) surface reflectance data. Furthermore, the contribution of various environmental factors (air temperature, precipitation, vapor pressure deficit, wind speed, sea surface height, and atmospheric CO2 concentration) to the GPP were quantified [52].
Globally, both mangroves and evergreen broad-leaf forests (EBFs) displayed an overall increasing trend, with the global average NIRv increasing by 0.21% and 0.11% y−1 for mangroves and EBFs, respectively (Figure 5). The percentage of greening mangroves is much larger (38%) than that of greening evergreen broad-leaf forests (27%), with the rate of greening mangroves intensifying with higher latitudes [53]. Furthermore, the interannual variability of mangrove GPP is greatly magnified compared to EBFs, underscoring the greater sensitivity of mangroves to potential drought stress. The interannual fluctuation of the sea-surface height is the main driver responsible for one-third of the mangrove GPP variability. The heightened responsiveness of mangroves to rainfall and CO2 fertilization superimposed on a strong tidal influence give rise to an amplified interannual GPP variation and an increase in the greenness of mangrove forests. While the study did not include low-lying, frequently inundated mangrove forests, the observation remains valid that mangrove carbon fixation may be enhanced by increasingly warmer temperatures, suggesting a divergence with EBFs due to climate change.

4. Aboveground Net Primary Production

At least eight methods have been used to measure the mangrove aboveground net primary production (ANPP): (1) biomass increment + litterfall; (2) CO2 gas measurements + litterfall; (3) field-based, radiation-based models; (4) gas exchange; (5) growth curve/growth increment; (6) light attenuation; (7) light interception; and (8) litterfall only. Using all data and methods, the mean ANPP averaged 3.7 (4.6 ± 1 SD) g C m−2 d−1 with a median of 2.4 g C m−2 d−1 and a range of 0.0- 35.0 g C m−2 d−1. However, there were significant differences between methods (one-way ANOVA on ranks, H = 162.35, df = 8, p < 0.001), with the light attenuation and light interception methods yielding greater rates of ANPP than most of the other methods (Table 1).
The rates of ANPP were highly variable among methods as well as globally (Table 1). These methods have been partially or fully adapted from methods used to measure the terrestrial forest ANPP and thus have the same pitfalls and advantages in estimating mangrove ANPP. Traditionally, ANPP is measured indirectly by measuring and summing (1) the biomass of the incremental growth of tree stems and (2) litterfall. Both the field-based, radiation-based and the growth curve/growth increment models incorporate the Farquhar model of C3 photosynthesis and several empirical models of stomatal response fitted to eddy covariance data, which are measures of gas exchange from the forest floor to above the canopy. Whole-ecosystem methods include the use of remote sensing and chlorophyll fluorescence techniques which are increasingly used in forest ecology. Litterfall is by far the most common method used because it is inexpensive and easy to measure, but measures only leaf production.
Assuming that the biomass increment/litterfall method is the most reliable measurement of mangrove ANPP, the mean values (Table 1) indicate that litterfall accounts for only 55% (2.2/3.9 × 100) of the total ANPP. The litterfall (Table 1) was greater (2.2 g C m−2 y−1 = 8.0 Mg C ha−1 y−1) than previous estimates of 4.7 Mg C ha−1 y−1 [123], 5.2 Mg C ha−1 y−1 [4], and 4.7 Mg C ha−1 y−1 [124]. Other studies have estimated lower percentages (33–38%) of the mangrove ANPP [4,125]. The light attenuation and light interception methods are based on several untested assumptions that translate into overestimates of ANPP. And indeed, both methods provided mean values significantly greater than most of the other techniques. Gas exchange measurements are precise and rapid but are subject to the problem of extrapolation errors from a small area to an entire stand; relying solely on gas exchange measurements overestimates the ANPP as it does not account for most tree respiration [8]. Thus, arguably the most accurate method to measure the mangrove ANPP is to combine increments of stem increase with litterfall as it accounts for all, or most, aboveground tree parts. Based on these data, the ANPP averaged 14.3 Mg C ha−1 y−1, which is greater than the earlier estimates of 4.1, 5.8, and 8.7 Mg C ha−1 y−1 calculated by Bouillion et al. [123], Twilley et al. [4], and Adame et al. [124], respectively.
An analysis of tropical forest NPP using the biomass increment/litterfall, radiation-based, and biogeochemical model-based methods shows that the three methods produced similar NPP estimates for undisturbed tropical forests [68]. However, the different methods produced very different patterns of NPP in space and time, which suggested a limited understanding of tropical forest NPP, especially in response to environmental change.
Using all the data (see data repository), the rates of aboveground net primary production correlated positively with rainfall (ΡANPPRainSal = 0.404, p < 0.001) after controlling for the positive relationship between rainfall and salinity (ΡRainSal = 0.326, p < 0.001). Conversely, ANPP correlated negatively with porewater salinity (ΡRainSal = −0.383, p < 0.001) after controlling for the relationship between rainfall and salinity. Other drivers may affect the mangrove ANPP as they affect GPP, including the forest age, light intensity, species composition, sediment pH and redox potential, nutrient availability, frequency of tidal inundation, disturbance, and geomorphological setting.
Several studies have attempted to deduce large-scale and even global patterns in mangrove ANPP, including litterfall [52,126,127,128,129,130]. In the neotropics, the mangrove litterfall rates are highest in riverine systems, especially in deltaic coastlines, and lowest in carbonate settings [126]. Unlike at the global level, the interaction between the minimum precipitation and minimum temperature in neotropical mangroves explained most of the variability (40%). Thus, low litterfall rates were predicted for areas with low rainfall, frosts, or no river input, whereas high litterfall rates were associated with higher temperatures and rainfall regimes, an increased tidal exchange, and a high riverine discharge, such as near the major tropical river deltas (e.g., the Amazon, Orinoco). A close positive relationship was observed [127,128,129,130] between the litterfall production and forest age as well as with the basal area, stem density, and canopy height in mangrove plantations, which suggests that the mangrove ANPP increases faster with larger stand sizes. A comparison of the annual litterfall in mangroves and other forests [131] found that mangroves had the highest rates of litterfall (2.9 g C m−2 d−1) and were also greater than found here (Table 1) but with identical bimodal seasonal patterns, with the first peak mainly in spring and the second peak in autumn or early winter; tropical evergreen broad-leaved and rainforests had average litterfall rates of 1.9 g C m−2 d−1. Drought and temperature were limiting factors for the mangrove litterfall as both affect porewater salinity and transpiration rates.
In the American Pacific region, which encompasses the coastline from the Gulf of California to northern Peru, the highest litterfall rates were recorded in the Tropical Eastern Pacific Province (central Mexico to northern Peru) compared with the warm Temperate Northeast Pacific Province (mostly Baja and the Gulf of California) and in estuaries compared with lagoons [129]. Species differences were found with the higher litterfall in Rhizophora spp. forests than in stands of A. germinans. Nearly 34% of the variability of the litterfall production was explained by the maximum temperature and rainfall of the wettest and driest months, underscoring the fact that mangrove ANPP varies with coastal the geomorphology, tidal setting, and climatic conditions. Larger-scale patterns align with gradients in the climatic variables, such as rainfall and temperature [4,123].
A further analysis of mangrove litterfall patterns [128] observed two NPP peaks a year, one in May and again in September with lower rates in July and December, but the overall monthly ANPP was constant throughout the year. However, seasonality was least discernible in the western Coral Triangle, Sahul Shelf, tropical Northwestern Atlantic, Sunda Shelf, and Gulf of Guinea. Seasonality was most variable on the southwest Australian Shelf, warm temperate Northwest Atlantic, warm temperate Northwest Pacific, the west Central Australian Shelf and the warm temperate Northeast Pacific of the subtropics. Spatially, the highest total annual province ANPP was in the western Coral Triangle with nearly a fifth of the total global ANPP, followed by the Sahul Shelf and the Sunda Shelf; these three provinces represent 41% of the world’s historical mangrove ANPP as litterfall. Four of the top five most productive provinces occur in Southeast Asia and the Indo-Pacific [131,132].

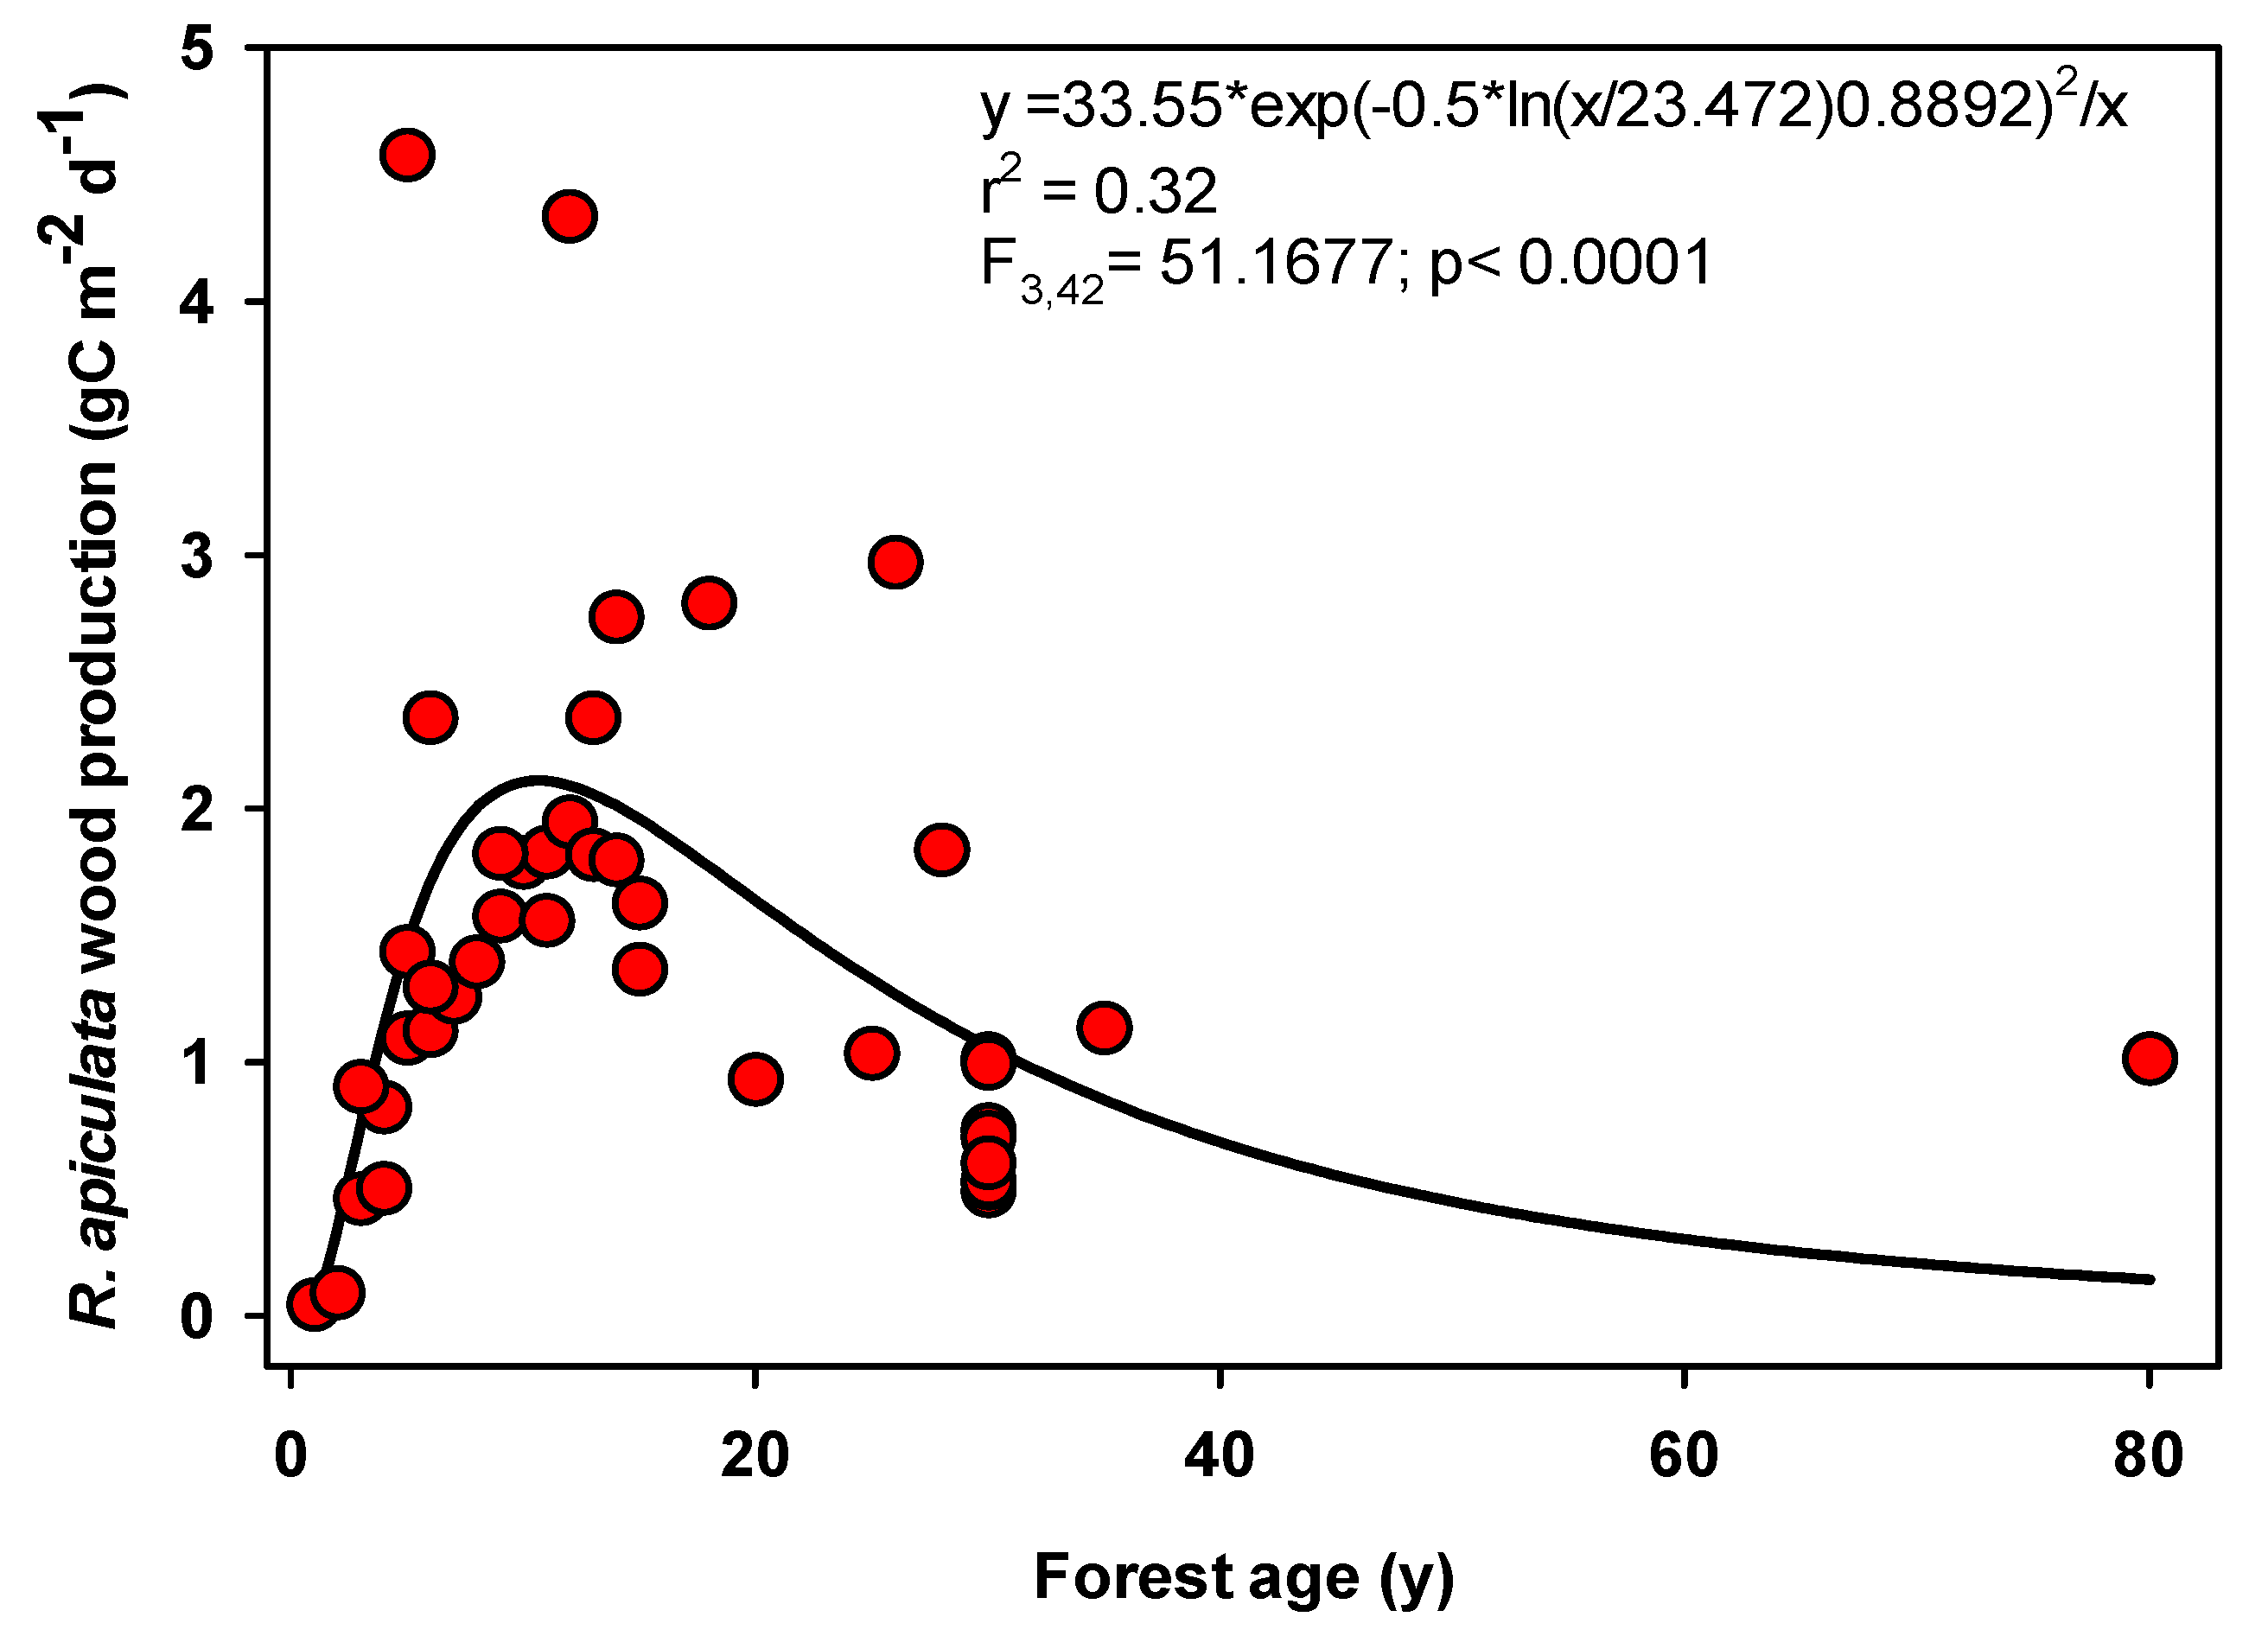
4.1. Wood Production

Wood production is most often measured as changes in the diameter-at-breast height (dbh) to calculate changes in stem biomass over time. Tree biomass is measured using allometric equations from measurements of the tree height and dbh. Increases in mangrove wood biomass are then converted to CORG units by multiplying the DW biomass by 0.48, which is the average CORG content of mangrove wood [8]. Based on 125 observations, the rates of wood production averaged 1.2 (1.0 ± 1 SD) g C m−2 d−1 (=4.5 Mg C ha−1 y−1), with a median of 1.0 g C m−2 d−1 and a range of 0.0–6.6 g C m−2 d−1 [4,54,55,56,57,58,59,60,61,62,63,65,66,67,71,72,73,81,92,106,123,124,125,128,132,133,134,135,136,137,138,139,140,141,142,143,144,145,146,147,148,149,150,151,152,153,154]. Globally, wood production correlated positively with temperature (Spearman’s r = 0.347, p < 0.001) and rainfall (r = 0.255, p < 0.001), as production is globally influenced by regional climates and hydroperiods [132]. The mean rate of wood production calculated here is close to earlier estimates of 4.8 Mg C ha−1 y−1 [123], 2.8 Mg C ha−1 y−1 [4], and 4.0 Mg C ha−1 y−1 [124,133]. A range of woody biomass accumulation of 0.0–6.7 g C m−2 d−1 was previously calculated [133] which is identical to my calculations. However, the ratio of wood/litter production is estimated here at 0.6 which is less than the earlier calculated ratios of 1.0 [123], 1.0 [4], and 0.9 [124]. This discrepancy may be attributed to the fact that the extrapolations here are based on measurements of biomass increments over time which do not consider processes, such as natural gap formation and regeneration, that contribute to biomass turnover. The wood production in other tropical moist forests is within the same range, averaging from 2.7 to 11.3 Mg C ha−1 y−1 [134].
Globally, incremental increases in the mangrove tree dbh average 0.31 cm y−1 and range from 0.0 to 1.8 cm y−1 [133]. However, locally and regionally, stem growth can be influenced by precipitation during the dry season, whereas species composition influences the biomass incremental growth within areas of lower rainfall [124]. Thus, different drivers may operate at different spatial scales. Wood production at the global scale did not correlate with forest age, but at individual locations, there is frequently a pattern of increasing wood production with plantation age. For example, there is a curvilinear relationship of Rhizophora apiculata plantations in Thailand, with a linear increase in tree growth from <1 to 10–12 y (Figure 6) with a clear decline until 80 y. In other undisturbed mangrove forests, the tree growth reaches a maximum growth rate after 35 y [130,155]. Mangrove wood growth–age patterns closely mimic those of other tropical trees [156].
Wood production rates at the local scale are also influenced by geomorphological settings, with a greater wood production in riverine and interior forests than in fringing stands [158]. Other drivers likely to impact stem growth are edaphic factors, such as the sediment organic carbon content, nutrient concentrations and availability, disturbance history, and climate. Differences in global patterns of wood production were found between plantation and non-plantation mangroves [133]. In non-plantation mangroves, climatic conditions are the most important factors influencing the global pattern of the tree dbh growth rate, with edaphic and biological characteristics also playing a role under specific climatic conditions, such as seasonal variations in precipitation. Forest age can also strongly influence tree mortality and necromass production in relation to the mortality rates induced by an increased competition in younger stands. The global pattern of non-plantation mangrove wood production was mainly determined by the mean dbh growth rate of individual trees, whereas in plantations, species selection and planting density were the most important factors influencing wood production [133].
One aspect of the mangrove ANPP that is often overlooked is the production of dead wood. A systematic review of dead wood stocks and production in mangrove forests estimated that the mean (±1 SD) stocks of dead wood averaged 8.1 ± 12.1 Mg C ha−1 and 14.4 ± 17.6 Mg C ha−1 of downed trees [153]. The mean production was 3.0 Mg C ha−1 y−1, ranging from 1.5 to 5.5 Mg C ha−1 y−1. There are few data sources with large gaps in regard to geography, species, and forest type. The analysis indicated that higher stocks of dead wood might be found in undisturbed forests.

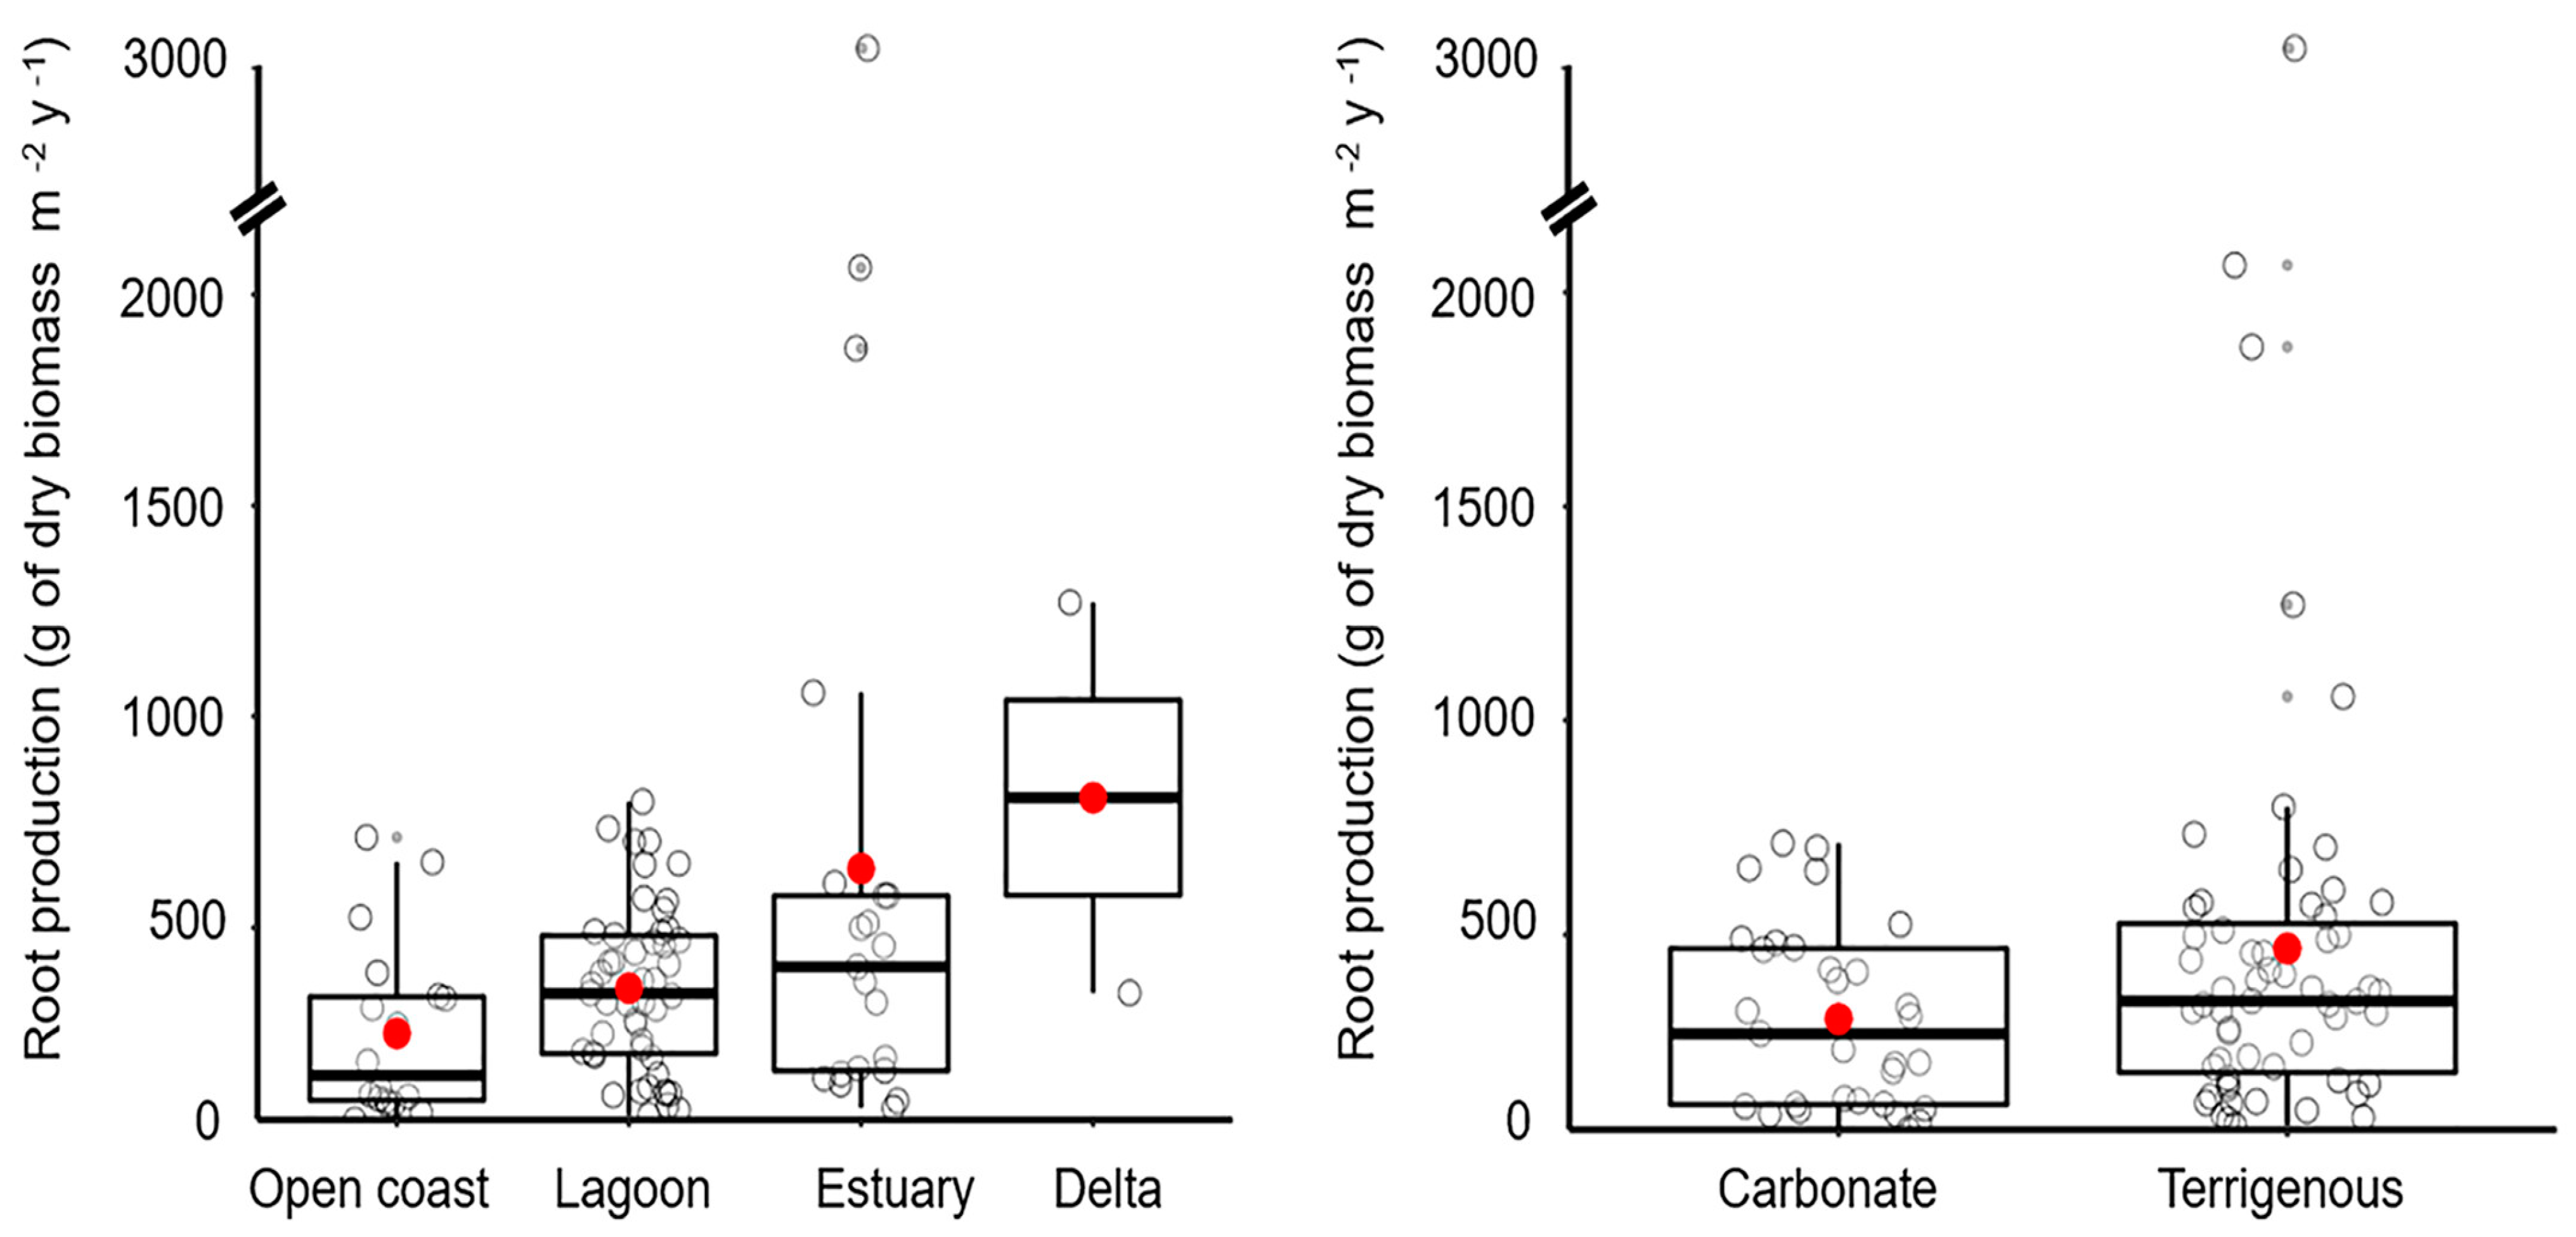
4.2. Root Production

Compared to the measurements of litter and wood production, there are currently only 90 measurements from 24 journal articles of fine (<20 mm) root production in mangrove forests [159]. This is mainly due to the difficulty of accurately extracting fine roots from silt–clay sediment particles and the fact that these methods are laborious and time-consuming. There are thus considerable uncertainties in the root/shoot ratios assumed from allometric equations that are inappropriate for some regions. Existing allometric equations are not viable because, unlike aboveground biomass, there are no time- and cost-effective methods for measuring the belowground biomass over large spatial scales [133]. Methods using mini-rhizotrons are promising, greatly improving accuracy, but the data are still scant.
The mean fine root production averaged 1.0 (1.0 ± 1 SD) g C m−2 d−1 (=3.0 Mg C ha−1 y−1) with a median of 0.8 g C m−2 d−1 and a range of 0.1–4.0 g C m−2 d−1 over a sediment depth profile of 0–75 cm. These rates are highly likely to be underestimated as (1) many studies exclude sampling below 45 cm, (2) only two different methods of measurement (ingrowth core and sequential coring) were used, and (3) no studies have measured the production of larger (>20 mm) diameter roots. The most productive bioregion is the central Indo-Pacific followed by the tropical Atlantic. Ceriops forests have a significantly greater root production than Avicennia or Rhizophora forests, as studies of fine root production on Iriomote Island, Japan, and Ranong, Thailand provide supporting evidence of species differences in root growth. On Iriomote Island, the root production was 1.5 times greater for R. stylosa than for B. gymnorhiza [160], and in Thai forests the production was significantly greater in R. apiculata than in A. alba stands, partly due to the accumulation of peat [161].
The root production varies with the intertidal position, as discovered on Pohnpei Island, Micronesia, where the fine root production in a landward B. gymnorhiza stand averaged 6.6 Mg C ha−1 y−1 but 27 Mg C ha−1y−1 in a seaward B. gymnorhiza forest, although the root production of Rhizophora spp. was greater than that of all other species regardless of the intertidal height [162].
There are clear patterns in root production across geomorphological settings, with the highest rates in deltas and estuaries and lowest rates in terrestrial and carbonate settings (Figure 7). Unfortunately, very few measurements come from very productive mangrove regions, such as in Southeast Asia, South America, Papua New Guinea, and Africa.
A range of factors influence root growth, although root production has been best explained with a linear equation, including the geomorphological settings combined with the maximum air temperature in the warmest month and the minimum rainfall in the driest month [159]. Root production is likely to decrease when the ANPP decreases after reaching the thermal photosynthetic optimum between 25 and 32 °C [8]. The tree density and basal area are not significantly linked to root production, as found in individual studies. Nutrients, salinity, and the bulk density exert local control over root production, with a significant positive relationship between the sediment total N and root production, but not with the total phosphorus. The local response of root production to an increase in nutrient availability is probably regulated by other factors, such as forest age, tidal inundation frequency, anoxia, pH, and salinity, although there was no global effect of porewater salinity on root production [163]. In mature reforested mangroves in Vietnam, fine root production decreased with the stand age in the top 32 cm, while in younger stands the production declined with sediment depth. There was no clear vertical pattern of root production in the older stands, although a major fraction occurred deeper than 30 cm [163].
In tropical terrestrial forests the fine root production averages 0.8 ± 0.6 g C m−2 d−1 with a range of 0.3 to 1.1 g C m−2 d−1, being greater than the rates in boreal and temperate forests [164,165]. The latitude, mean annual temperature, and annual rainfall explain about 60% of the variation. Production rates were highly dependent on the species composition, sampling depth, and methodology. At the global scale, fine root production increases in terrestrial forests along natural N and P gradients [166], underscoring the importance of nutrient availability and limitation. The range of the mangrove root production is in the middle to high range of the rates measured in tropical terrestrial forests (96–389 g C m−2 y−1) using a similar methodology [165,167], suggesting that the mangrove estimates are conservative considering that mangroves allocate disproportionately more CORG to roots than their terrestrial counterparts [4].

5. Total Tree Net Primary Production

Several studies (Table 2) have calculated the total tree net primary production (aboveground + belowground) with contrasting results, mainly due to the increasing information over time, especially changes in the accuracy of the global area of mangroves and the rapid rise in estimates of belowground production. Total mangrove NPP (Mg C ha−1 y−1) estimates have ranged from 11 to 21 Mg C ha−1 y−1 with the most recent calculations suggesting a value at the lower end of the range. Likewise, global mangrove NPP estimates range from 143 to 383 Tg C y −1 with current calculations of a global mean of 183 Tg C y−1 (Table 2).
Global NPP estimates for seagrass meadows, salt marshes, coral reefs, mangrove forests, and the entire tropical coastal ocean average 294, 27 78, 183, and 4254 Tg C y−1 for a total global NPP of the low-latitude regions of 4836 Tg C y−1 [5,171]. Mangroves are thus by area about 1.5, 2.4, 8, and 2 times more productive than seagrasses, salt marshes, coral reefs, and tropical coastal ocean ecosystems, respectively. Mangroves account for nearly 4% of the total global NPP although they represent only 1.9% of the total coastal ocean area, illustrating their disproportionate role in coastal carbon dynamics [123,125]. When these estimates were calculated, however, the importance of macroalgal beds in blue carbon dynamics was still not fully acknowledged.

6. Long-Term Trends in Mangrove Primary Production

The models of mangrove GPP trends indicate a global increase in the NIRv (near-infrared reflectance of vegetation), a proxy measure of GPP, from 2001 to 2020 [52]. Both mangrove and nearby terrestrial evergreen broad-leaf forests recently experienced significant production increases, although mangroves exhibited a stronger increasing trend and greater interannual variability in GPP than their terrestrial counterparts on most co-occurring coasts. The increases in mangrove production were attributed to the strong fertilization effect of increasing atmospheric CO2 where the high levels of interannual variability were attributed to a greater sensitivity of mangrove vegetation to variations in the rainfall and sea level. These results suggest that the mangrove GPP will likely continue to increase with global warming, although it may suffer from deficits in water availability and forest losses from rising sea levels.
The modelling of mangrove NPP trends indicates a minimal change (1.4%) from 1980 to 2094 [128]. However, dramatic increases may occur in the subtropics, such as in the regions of southwest Australia, and the warm temperate Northeast and Northwest Pacific, whereas significant decreases in NPP may occur and are still forecast in the Java Transitional Province and the western Coral Triangle.
Changes in the mangrove NPP are not expected to be regionally uniform. For instance, the modelling of mangrove GPP and the leaf area index in Pichavaram, India, indicates production increases in the future during the wet season and decreases during the dry period [44]. Compared to its current average, the mangrove GPP is forecast to drop in India by 4 to 20% from 2050 to 2060 and from 5 to 28% from 2090 to 2100, which is attributed to the projected rises in air temperature and sea-level rises.

7. Algal Primary Production

7.1. Microalgae and Cyanobacterial Mats

A highly diverse mixture of chlorophytes, diatoms, phytoflagellates, cyanobacteria, and other microphotoautotrophs (e.g., microplankton) living on the surfaces of sediments, as epiphytes on leaves, other litter, decomposing wood, and on living stems and aboveground roots are additional sources of fixed carbon in mangrove forests; they all are of considerable trophic importance in mangrove food webs. It was once thought that under closed canopies with unfavourably low light conditions, the benthic algal biomass and production was low [172]. However, more recent studies at more locations and using more sensitive measurements have found that microalgal and cyanobacterial communities are well adapted to low light intensities and are thus more abundant and productive than previously believed [173,174].
Few studies have measured microphytobenthic (MPB) production, so the sample size is small (n = 35). The mean production averaged 1.5 ± 2.5 (±1 SD) g C m−2 d−1 with a range of 0.0–10.5 g C m−2 d−1 and a median of 0.6 g C m−2 d−1 [54,172,173,174,175,176,177,178,179,180,181,182,183,184,185,186,187,188,189,190,191]. The production did not correlate with the temperature, photon flux density, or salinity [54,172,173,174,175,176,177,178,179,180,181,182,183,184,185,186,187,188,189,190,191]. These data include five data points of cyanobacterial mat production, which averaged 2.9 ± (4.3 1 SD) g C m−2 d−1 with a range of 0.4–10.5 and a median of 1.2 [175,176,177,178]. Considering the small sample sizes of both the microalgal and cyanobacterial NPP, further effort is imperative to more clearly gauge their production in relation to the forest type and age, sediment type, light intensity under the canopy, porewater salinity and pH, temperature, changes in sea level, precipitation, and tidal elevation. More urgent still, the areal extent and variability of these photoautotrophs within mangrove forests are required to accurately estimate their ecosystem-scale contribution to the mangrove forest NPP.
In two recent studies, the benthic microalgal biomass in mangrove forests was almost double those measured in adjacent bare tidal flats, although the production in mangroves was greatly reduced. This finding was explained as a possible accumulation of algal biomass due to a slower tidal flow within the forest and an increased biomass per cell due to the expansion of its chloroplast to receive more light with photo- and physiological acclimation [173]. These results are supported by measurements in two contrasting estuarine and oceanic mangrove forests in Hong Kong, in which the microalgal abundance and diversity were equal if not higher in mangroves than on tidal flats [174]. The study found that the porewater salinity, irradiance level, and surface sediment temperature and pH explained 24% of the variation. Moreover, pennate diatoms dominated the mangroves as they do in many other mangroves [189], and cyanobacteria were common at the estuarine forest; the mangrove microphytobenthos exhibited photosynthetic performances characteristic of low light acclimation. However, the role of herbivores in grazing down biomass was not assessed but may be significant.
The energetics of photosynthetic microphytobenthic communities play an important role in the production and exchange of CO2 between the mangrove sediment and the atmosphere [185]. Under light conditions, photosynthesis by MPB results in a higher CO2 uptake and higher CO2 respiration in the dark. Further, these effects can be seasonally variable in the subtropics as CO2 fluxes are more negative in winter light and more positive in the dark, indicating that MPB respiration and photosynthesis change the total sediment CO2 flux patterns [189]. In summer, the sediments show positive and equivalent fluxes between light and dark, suggesting an insignificant MPB contribution to CO2 fluxes. MPB communities are therefore both a temporal and spatial CO2 sink and source in mangrove forests depending on drivers such as the temperature and light levels. In some subtropical mangroves factors including the surface sediment chlorophyll, sediment water content, percentage of silt–clay content, and light intensity can explain close to one half of the CO2 flux variability [188]. In mangroves of the Gulf of Nicoya, Costa Rica, the MPB production was positively correlated with sea-level changes and rainfall and inversely correlated with the mean irradiance at noon [191]. Also, MPB production is often very low in arid, high salinity environments [190].
Cyanobacteria not only form extensive mats but grow as epiphytes on tree bark, downed wood, prop roots, and pneumatophores and are capable of high rates of nitrogen fixation [8]. Various genera, such as Anabaena, Lyngbya, Rivularia, Calothrix, Microcoleus, and Nodularia, are well-known diazotrophs found in mangrove sediments and as epiphytes. They are especially abundant in salt pans landward of mangroves and in carbonate deposits of mangroves growing among coral cays, with mats ranging from thin biofilms to well-developed thick carpets of different colours. Most of these mats are dominated by filamentous cyanobacteria, such as Oscillatoria spp., Microcoleus spp. and Spirulina spp. [177]. Cyanobacterial mats grow most extensively in scrub or dwarf forests where sufficient light penetrates to the sediment surface, such as in Twin Cays, Belize, where the mat GPP averaged 0.9 g C m−2 d−1 [175]. As these mats cover half of the land area at Twin Cays, being ubiquitous in dwarf stands along pond edges and on the bottom of shallow ponds, the total gross fixed carbon equated to 5.3 × 10⁷ g C y−1, indicating that they are an important labile CORG source for the Twin Cays ecosystem.

7.2. Macroalgae

Mangrove macroalgae are dominated by the rhodophytes, Bostrychia, Stictosiphonia, Hypnea, and Caloglossa, the chlorophyte, Chaetomorpha, and the phaeophyte, Dictyota [192]. In some forests, species of Bostrychia grow as turf algae on trees along with other associated red macroalgae, such as Caloglossa and Catenella, forming an intertidal plant association termed ‘Bostrychietum’ [193,194,195]. In the Americas, 55% of red macroalgae colonizes pneumatophores, prop roots, downed wood, and trunks and 19% may be entangled with or epiphytic on other macrophytes, while 28% and 20% grow in hard surfaces and on mangrove sediments, respectively [196]. Mangrove macroalgae are highly tolerant to temperature and salinity variations, but sensitive to desiccation.
The sample size of the macroalgal NPP in mangroves is considerably greater (n = 102) than for microphytobenthos, averaging 17.4 ± 14.2 (1 SD) g C m−2 d−1 with a range of 0.0–51.5 g C m−2 d−1 and a median of 17.4 g C m−2 d−1 [8,178,181,192,193,194,195,196,197,198,199,200,201,202,203,204,205,206], assuming weight-specific and oxygen data conversions to g C m−2 d−1 and a wet weight (WW)/dry weight (DW) conversion factor of 15 [196], a photosynthetic quotient (PQ) of 1.2, and a g DW: m2 conversion factor of 27.5 [197]. The macroalgal production correlated positively with temperature (Spearman’s r = 0.63; p < 0.001) but inversely with photon flux density (Spearman’s r = 0.73: p < 0.001). The macroalgal NPP is thus nearly 4.5 times greater than the mangrove ANPP on a unit area basis, suggesting that they play a highly significant role in the carbon flow in mangrove ecosystems, but only if they carpet a sufficiently large area of forest.
Most photosynthesis measurements have been performed in the Caribbean, including in Florida waters where the work of Dawes and his colleagues established that the mangrove macroalgae were both abundant and productive [197,199,203]. The peak rates of red macroalgal photosynthesis measured in Floridan mangroves with Bostrychia binderi showed an unusual tolerance to desiccation and equally high rates of photosynthesis both in air and while submerged [199]. The photosynthetic quotients for B. binderi and Gracilaria verrucosa were 1.2 with diel fluctuations in photosynthesis and pronounced mid-morning peaks [197]. In the Belize Barrier Reef–mangrove ecosystem, the production of the frondose algae, Dictyota divaricata and Acanthophora spicifera, was high in the mangroves with higher N and P concentrations than in the same species at a barrier reef site. This finding suggests that macroalgae in fringing mangroves may not be as severely nutrient-limited as they are in adjacent reef habitats [201]. Submerged macroalgae were similarly productive, and this was attributed to greater nutrient availability near the mangroves and to reduced levels of herbivory [200].
Macroalgae are conspicuous in Latin American and South African mangroves. The red algae, Bostrychia radicans and Caloglossa leprieurii, are common on A. marina pneumatophores with peak photosynthetic rates measured between 25% and 58% desiccation and with increases in the photosynthetic and respiratory rates with increasing temperatures, peaking at 32–37 °C, low light intensities, and a wide range of salinity [202]. However, some species, such as B. binderi, do not show a sensitivity to high-light conditions while other species show a wide tolerance to a range of light intensities [196]. Both the Caloglossa and Bostrychia species acclimate to harsh environmental conditions by synthesizing and accumulating high concentrations of the osmotic osmolytes D-mannitol, D-mannitol, and D-dulcitol which are involved in osmotic acclimation [192,203]. For Bostrychia calliptera and C. leprieurii living as epiphytes on the prop roots of R. mangle on the Pacific coast of Colombia, photoinhibition occurred at irradiances as low as 200 μmol photons m−2 s−1, with an adaptation to shaded habitats with light compensation points in the air and water for both species below 17 μmol photons m−2 s−1 [204]. A subsequent study observed that both the B. calliptera and B. montagnei in Brazilian mangroves decreased their photosynthetic performance under increasing photon flux densities, with the latter species being more sensitive to light than the former [193], possibly explaining its preferential occurrence in more shaded conditions than B. calliptera.
The high rates of macroalgal NPP reflect rapid rates of relative growth, which averaged a 2.1 ± 2.1 (±1 SD)% WW increase per day; the growth rates ranged from 0.1 to 11% WW d−1 with a median of 1.1% WW d−1 [193,194,195,203,205]. All rates were measured under a wide range of laboratory conditions. For example, B. calliptera increased its mean growth from 170 to 638 μmol photons m−2 s−1 with a growth inhibition under 1155 μmol photons m−2 s−1. B. montagnei showed optimum growth under 267 μmol photons m−2 s−1 with a growth inhibition from 443 to 1155 μmol photons m−2 s−1 [193]. For Bostrychia simpliciuscula, the specific growth rates declined from a maximum of 7.2% WW d−1 at a salinity of 5. With increasing salinity up to normal seawater, the specific growth rate decreased slightly down from its peak to 5.1%WW d−1, although this decline was insignificant due to the high variability. However, a further salinity increase resulted in strong growth with a relative growth rate of 1.5% WW d−1 at a salinity of 50 and only 0.3% WW d−1 at a salinity of 70 [203]. Unsurprisingly, a photosynthetic–irradiance (PI) curve resulted in a light compensation point (IC) in the light-limited region of 1.8 μmol photons m−2 s−1 and a low initial saturation of photosynthesis (IK) of 36.4 μmol photons m−2 s−1.

8. A Revised Mangrove Carbon Budget

The revised mangrove carbon mass balance (Table 3) differs from my original model [8,125] in several ways. First, there is a small net surplus instead of a small deficit due to greater inputs because of the revised increases in the GPP of both microalgae and macroalgae and a large increase in subterranean groundwater discharge [127], mostly due to more empirical groundwater estimates from terrestrial sources. The microalgal and macroalgal GPP and NPP are overestimates to an unknown degree as the areal extent of both algal sources in mangroves is poorly constrained and likely to be highly variable among mangrove habitats.
The outputs have also increased due to the revised increase in the respiration of the canopy, microalgae, and macroalgae; there was a slight increase in the sediment respiration with the additional data [124].
The current mass balance model suggests that the mangrove production and sediment DIC production are the largest (and equal) ecosystem C inputs. The sediment DIC production is included as an input because it reflects the mineralization of organic matter derived from about a 60% contribution from allochthonous sources, such as phytoplankton, benthic macroalgae, seagrass detritus, marine, riverine, and coastal OM, whereas the bulk of the remaining mineralized organic matter is likely derived from the microbial necromass as well as from deep, ancient sediment deposits [207]. Regardless, the carbon inputs and outputs of mangrove ecosystems are in overall balance, considering the relative error of the many measurements used to derive these fluxes. These estimates are likely to change, altering the metabolic balance because of climate change, especially warmer temperatures, sea-level rises, and increasing greenhouse gas concentrations.
Table 3. Carbon mass balance in mangrove forests (Mg C ha−1 y−1) based on globally averaged data from [207] for original values and this paper for current estimates. Groundwater update is from [188].
ComponentInputsComponentOutputs
OriginalCurrentOriginalCurrent
Mangrove GPP20.019.7RCANOPY8.014.8
Macroalgal GPP6.28.6RMACROALGAE2.94.0
Microalgal GPP4.45.5RMICROALGAE2.32.9
Sediment DIC production19.819.8RTIDAL WATER3.33.3
Groundwater from terrestrial sources2.612.8RSEDIMENT6.76.7
DICEXPORT24.824.8
DOCEXPORT3.83.8
POCEXPORT1.91.9
Burial1.61.6
CH4 AIR/SEA EXPORT0.060.06
Total Net Flux53.066.4 55.463.9
Net Balance−2.42.5

9. Ecosystem Contributions to Coastal Blue Carbon Fluxes

Within the global tropical coastal ocean, mangrove ecosystems contribute disproportionately to the blue carbon flow in relation to their small area (6% of all low-latitude habitats). Except for the global NPP, mangroves contribute between 4% and 28% to the total blue carbon flow (Table 4). The low contribution to the NPP is masked by the overwhelming global NPP flux of subtidal and intertidal macroalgae beds and floating macroalgae. Tropical and subtropical seagrasses also contribute disproportionately to the low-latitude blue carbon flow due to their high rates of GPP and RE (Table 4), whereas tropical salt marshes and tidal flats are small sources of blue carbon due mostly to their small area.
Macroalgae and tidal flats have the highest PGPP/RE ratios, although all ecosystems are net autotrophic. Coral reefs are within the same order of magnitude as mangrove forests regarding their contribution to the global NEP (Table 4), but their inclusion as a blue carbon ecosystem is still debated [208].
Table 4. Contribution of mangroves to blue carbon fluxes compared with other coastal ecosystems in global low-latitude coastal oceans. Global areas of seagrass [209], macroalgae [210], mangroves [211], tidal flats [212], salt marshes [213], and coral reefs [214]. Percentage contributions of mangroves are based on total fluxes for each ecosystem. Macroalgae data are from [215,216]. All other data are from [207,214,215,216]. Abbreviations and units: RE = (g C m−2 y−1) = ecosystem respiration (respiration of canopy, sediment, tidal water, microalgae, and macroalgae); GPP (g C m−2 y−1) = gross primary production; and NEP (g C m−2 y−1) = net ecosystem production (=PGPP − RE). Units: area (1010 m2), global RE, global GPP, and global NEP (Tg C y−1).
EcosystemAreaREGlobal RE GPPGlobal GPPMean PGPP/RENEPGlobal NEP
Mangroves14.5149821719712861.347369
Salt marshes0.819210234161.5426
Seagrasses18.1236750428536081.2486103
Macroalgae158.7368583129420543.59261469
Tidal flats7.545696122.1516
Coral reefs34.89125469985991.18649
Totals234.45383186674463575-20641702
Mangrove contribution6%28%12%11%8%-23%4%

10. Conclusions

A recently expanded database of production rates in mangrove forests strengthens the notion that mangrove forests per unit area are among the most productive ecosystems in the world. The revised mean rates of the mangrove, microalgal, and macroalgal GPP are 5.4, 1.5, and 17.4 g C m−2 d−1, respectively. The mangrove ANPP averages 3.9 g C m−2 d−1 as estimated by summing the biomass increments + litterfall, although both the GPP and ANPP rates vary greatly between methods and biogeographical regions. Only broad-leaved evergreen forests have greater rates of GPP. The mangrove GPP correlates positively with annual rainfall and temperature, and the ANPP correlates positively with rainfall and inversely with porewater salinity. Litterfall equates to only 55% of the NPP. The wood production averages 1.2 g C m−2 d−1, best fitting a non-linear peak regression with peak production rates between 5 and 12 y. The mean fine root production averages 1.0 g C m−2 d−1, being highest in deltas and estuaries and lowest in open-coast and carbonate settings. The total mangrove NPP ranges from 11.0 to 21.1 Mg ha−1 y−1 with the global mangrove NPP ranging from 143.0 to 383.4 Tg C y−1. The mangrove GPP is forecast to increase to 2100 due to rising CO2 levels which have a fertilizing effect.
A revised mangrove carbon mass balance shows that the mangrove primary production and sediment DIC production are the largest and roughly equal ecosystem inputs. Canopy respiration and dissolved carbon exports are the largest ecosystem losses. Overall, the model is in balance but may become unbalanced with the increasing impacts of climate change.
Globally, mangroves contribute 8% to 28% of the total blue carbon flow among low-latitude coastal ecosystems, which is disproportionate to their small area (6%). Macroalgae and tidal flats had the greatest ratio of PGPP/RE, although all blue carbon ecosystems are currently net autotrophic.

Supplementary Materials

The following supporting information can be downloaded at https://www.mdpi.com/article/10.3390/f16050747/s1. Figure S1. Diagram of PRISMA protocol used in the meta-analysis.

Funding

This research received no external funding.

Data Availability Statement

All data used in this study can be found in the data repositories of the referenced publications listed below. The raw data supporting the conclusions of this article will be made available by the author on request.

Conflicts of Interest

The author declares no conflicts of interest.

References

  1. Reef, R.; Feller, I.C.; Lovelock, C.E. Nutrition of mangroves. Tree Physiol. 2010, 30, 1148–1160. [Google Scholar] [CrossRef] [PubMed]
  2. Chen, Y.; Zhang, S.; Guo, J.; Shen, Y. Spatiotemporal evolution and impact mechanisms of gross primary productivity in the tropics. Forests 2024, 15, 913. [Google Scholar] [CrossRef]
  3. Cao, D.; Zhang, J.; Han, J.; Zhang, T.; Yang, S.; Wang, J.; Prodhan, F.A.; Yao, F. Projected increases in global terrestrial net primary productivity loss caused by drought under climate change. Earth’s Future 2022, 10, e2022EF002681. [Google Scholar] [CrossRef]
  4. Twilley, R.R.; Castañeda-Moya, E.; Rivera-Monroy, V.H.; Rovai, A. Productivity and carbon dynamics in mangrove wetlands. In Mangrove Ecosystems: A Global Biogeographic Perspective; Rivera-Monroy, V.H., Lee, S.Y., Kristensen, E., Twilley, R.R., Eds.; Springer: Cham, Switzerland, 2017; pp. 113–162. [Google Scholar] [CrossRef]
  5. Alongi, D.M. Carbon balance in salt marsh and mangrove ecosystems: A global synthesis. J. Mar. Sci. Eng. 2022, 8, 767. [Google Scholar] [CrossRef]
  6. Rivera-Monroy, V.H.; Castañeda, E.; Barr, J.G.; Engel, V.; Fuentes, J.D.; Troxler, T.G.; Twilley, R.R.; Bouillon, S.; Smith, T.J., III; O’Halloran, T.L. Current methods to evaluate net primary production and carbon budgets in mangrove forests. In Methods in Biogeochemistry of Wetlands, Vol. 10; Delaune, R.D., Reddy, K.R., Richardson, C.J., Megonigal, J.P., Eds.; Wiley: Boston, MA, USA, 2013; pp. 253–288. [Google Scholar] [CrossRef]
  7. Gu, X.; Zhao, H.; Peng, C.; Guo, X.; Lin, Q.; Yang, Q.; Chen, L. The mangrove blue carbon sink potential: Evidence from three net primary production methods. For. Ecol. Manag. 2022, 504, 119848. [Google Scholar] [CrossRef]
  8. Alongi, D.M. The Energetics of Mangrove Forests; Springer: Dordrecht, The Netherlands, 2009. [Google Scholar] [CrossRef]
  9. Twilley, R.R.; Day, J.W., Jr. Mangrove wetlands. In Estuarine Ecology, 2nd ed.; Day, J.W., Jr., Kemp, W.M., Yanez-Arancibia, A., Crump, B.C., Eds.; Wiley: Boston, MA, USA, 2012; pp. 165–202. [Google Scholar]
  10. Page, M.J.; Moher, D.; Bossuyt, P.M.; Boutron, I.; Hoffmann, T.C.; Mulrow, C.D.; Shamseer, L.; Tetzlaff, J.M.; Akl, E.A.; Brennan, S.E.; et al. PRISMA 2020 explanation and elaboration: Updated guidance and exemplars for reporting systematic reviews. BMJ 2021, 372, n160. [Google Scholar] [CrossRef]
  11. Lugo, A.E.; Snedaker, S.C. The ecology of mangroves. Annu. Rev. Ecol. Syst. 1974, 5, 39–64. [Google Scholar] [CrossRef]
  12. Suwa, R.; Khan, M.N.I.; Hagihara, A. Canopy photosynthesis, canopy respiration and surplus production in a subtropical mangrove Kandelia candel forest, Okinawa Island, Japan. Mar. Ecol. Prog. Ser. 2006, 320, 131–139. [Google Scholar] [CrossRef]
  13. Jayakody, J.M.A.L.; Amarasinghe, M.D.; Pahalawattaarachchiand, V.P.; De Silva, K.H.W.L. Vegetation structure and potential gross primary productivity of mangroves at Kadolkele in Meegamuwa (Negombo) estuary, Sri Lanka. Sri Lanka J. Aquat. Sci. 2008, 13, 95–108. [Google Scholar] [CrossRef]
  14. As-syakur, A.R.; Osawa, T.; Adnyana, I.W.S. Estimation of gross primary production using satellite data and GIS in urban area, Denpasar. Int. J. Remote Sens. Earth Sci. 2010, 7, 84–95. [Google Scholar] [CrossRef]
  15. Barr, J.G.; Engel, V.; Fuentes, J.D.; Fuller, D.O.; Kwon, H. Modelling light use efficiency in a subtropical mangrove forest equipped with CO2 eddy covariance. Biogeosciences 2013, 10, 2145–2158. [Google Scholar] [CrossRef]
  16. Chanda, A.; Akhand, A.; Manna, S.; Dutta, S.; Hazra, S.; Das, I.; Dadhwal, V.K. Characterizing spatial and seasonal variability of carbon dioxide and water vapour fluxes above a tropical mixed mangrove forest canopy, India. J. Earth Syst. Sci. 2013, 122, 503–513. [Google Scholar] [CrossRef]
  17. Chen, H.; Lu, W.; Yan, G.; Yang, S.; Lin, G. Typhoons exert significant but differential impacts on net ecosystem exchange of subtropical mangrove forests in China. Biogeosciences 2014, 11, 5323–5333. [Google Scholar] [CrossRef]
  18. Li, Q.; Lu, W.; Chen, H.; Luo, Y.; Lin, G. Differential responses of net ecosystem exchange of carbon dioxide to light and temperature between spring and neap tides in subtropical mangrove forests. Sci. World J. 2014, 2014, 943697. [Google Scholar] [CrossRef]
  19. Leopold, A.; Marchand, C.; Renchon, A.; Deborde, J.; Quiniou, T.; Allenbach, M. Net ecosystem carbon dioxide exchange in the ‘Coeur de Voh’ mangrove, New Caledonia: Effects of water stress on mangrove productivity in a semiarid climate. Agric. For. Meteorol. 2016, 223, 217–232. [Google Scholar] [CrossRef]
  20. Rodda, S.R.; Thumaty, K.C.; Jha, C.S.; Dadhwal, V.K. Seasonal variations of carbon dioxide, water vapor and energy fluxes in tropical Indian mangroves. Forests 2022, 7, 35. [Google Scholar] [CrossRef]
  21. Cui, X.; Liang, J.; Lu, W.; Chen, H.; Liu, F.; Lin, G.; Xu, F.; Luo, Y.; Lin, G. Stronger ecosystem carbon sequestration potential of mangrove wetlands with respect to terrestrial forests in subtropical China. Agric. For. Meteorol. 2018, 249, 71–80. [Google Scholar] [CrossRef]
  22. Shrestha, S.; Miranda, I.; Kumar, A.; Pardo, M.L.E.; Dahal, S.; Rashid, T.; Remillard, C.; Mishra, D.R. Identifying and forecasting potential biophysical risk areas within a tropical mangrove ecosystem using multi-sensor data. Int. J. Appl. Earth Obser. Geoinform. 2019, 74, 281–294. [Google Scholar] [CrossRef]
  23. Kripa, M.K. Modelling the gross primary productivity (GPP) of an Indian mangrove vegetation. Environ. Ecol. 2019, 37, 221–228. [Google Scholar]
  24. Liu, J.; Lai, D.Y.F. Subtropical mangrove wetland is a stronger carbon dioxide sink in the dry than wet seasons. Agric. For. Meteorol. 2019, 278, 107644. [Google Scholar] [CrossRef]
  25. Gnanamoorthy, P.; Selvam, V.; Burman, P.K.D.; Chakraborty, S.; Karipot, A.; Nagarajan, R.; Ramasubramanian, R.; Song, Q.; Zhang, Y.; Grace, J. Seasonal variations of net ecosystem (CO2) exchange in the Indian tropical mangrove forest of Pichavaram. Estuar. Coast. Shelf Sci. 2020, 243, 106828. [Google Scholar] [CrossRef]
  26. Rasquinha, D.N.; Mishra, D.R. Tropical cyclones shape mangrove productivity gradients in the Indian subcontinent. Sci. Rep. 2021, 11, 17355. [Google Scholar] [CrossRef]
  27. Alvarado-Berrientos, M.S.; López-Adame, H.; Lazcano-Hernández, H.E.; Arellano-Verdejo, J.; Hernández-Arana, H.A. Ecosystem-atmosphere exchange of CO2, water, energy in a basin mangrove of the northeastern coast of the Yucatan Peninsula. J. Geophys. Res. Biogeosci. 2021, 126, e2020JG005811. [Google Scholar] [CrossRef]
  28. Kanniah, K.D.; Kang, C.S.; Sharma, S.; Amir, A.A. Remote sensing to study mangrove fragmentation and its impacts on leaf area index and gross primary productivity in the south of Peninsular Malaysia. Remote Sens. 2021, 13, 1427. [Google Scholar] [CrossRef]
  29. Lele, N.; Kripa, M.K.; Panda, M.; Das, S.K.; Nivas, A.H.; Divakaran, N.; Naik-Gaonkar, S.; Sawant, A.; Pattnaik, A.K.; Samal, R.N.; et al. Seasonal variation in photosynthetic rates and satellite-based GPP estimation over mangrove forest. Environ. Monit. Assess. 2021, 193, 61. [Google Scholar] [CrossRef]
  30. Lu, Y.; Zhu, X. Response of mangrove carbon fluxes to drought stress detected by photochemical reflectance index. Remote Sens. 2021, 13, 4053. [Google Scholar] [CrossRef]
  31. Zhu, X.; Hou, Y.; Zhang, Y.; Lu, X.; Liu, Z.; Weng, Q. Potential sun-induced chlorophyll fluorescence for indicating mangrove canopy photosynthesis. J. Geophys. Res Biogeosci. 2021, 126, e2020JG006159. [Google Scholar] [CrossRef]
  32. Rodda, S.R.; Thumaty, K.C.; Faraoda, R.; Jha, C.S.; Dadhwal, V.K. Unique characteristics of carbon dioxide exchange in Sundarbans mangrove forests and their relationship with environmental factors. Estuar. Coast. Shelf Sci. 2022, 267, 107764. [Google Scholar] [CrossRef]
  33. Romadhoni, L.S.R.; As-Syakur, A.R.; Hidayah, Z.; Wiyanto, D.B.; Safitri, R.; Utama, R.Y.S.; Wijana, I.M.S.; Anugrah, A.P.; Antara, I.M.O.G. Annual characteristics of gross primary productivity (GPP) in mangrove forest during 2016–2022 as revealed by Sentinel-s remote sensing imagery. IOP Conf. Ser. Earth Environ. Sci. 2022, 1016, 012051. [Google Scholar] [CrossRef]
  34. Burman, P.K.D.; Chakraborty, S.; El-Madany, T.S.; Ramasubramanian, R.; Gogoi, N.; Gnanamoorthy, P.; Murkute, C.; Nagarajan, R.; Karipot, A. A comparative study of ecohydrologies of a tropical mangrove and a broadleaf deciduous forest using eddy covariance measurement. Meteorol. Atmos. Phys. 2022, 134, 4. [Google Scholar] [CrossRef]
  35. Zhao, X.; Chunlin Wang, C.; Li, T.; Zhang, C.; Fan, X.; Zhang, Q.; Zhang, Q.; Chen, X.; Zou, X.; Shen, C.; et al. Net carbon dioxide and methane emissions from restored mangrove wetland: New insights based on a case study in estuary of the Pearl River, China. Sci. Total Environ. 2022, 811, 151619. [Google Scholar] [CrossRef]
  36. Zheng, Y.; Takeuchi, W. Estimating mangrove forest gross primary production by quantifying environmental stressors in the coastal area. Sci. Rep. 2022, 12, 2238. [Google Scholar] [CrossRef]
  37. Harahap, M.; Basyuni, M.; Sulistyono, N.; Sasmito, S.D.; Latifah, S.; Delvian Amelia, R.; Bimantara, Y.; Harahap, S.S.H.; Larekeng, S.H.; Sumarga, E.; et al. Carbon stock and carbon dioxide fluxes in various land covers in Karang Gading and Langkat Timur Laut Wildlife Reserve, North Sumatra, Indonesia. Sustainability 2023, 15, 15196. [Google Scholar] [CrossRef]
  38. Kumar, T.; Das, P.K. Estimation of gross primary productivity of Indian Sundarbans mangrove forests using field measurements and Landsat 8 Operational Land Imager data. Trop. Ecol. 2023, 64, 167–179. [Google Scholar] [CrossRef]
  39. Wang, C.; Zhao, X.; Chen, X.; Xiao, C.; Fan, X.; Shen, C.; Sun, M.; Shen, Z.; Zhang, Q. Variations in carbon dioxide and methane exchange in response to multiple biophysical factors from a mangrove wetland park in Southeastern China. Atmos 2024, 14, 805. [Google Scholar] [CrossRef]
  40. Wu, L.; Guo, E.; An, Y.; Xiong, Q.; Shi, X.; Zhang, X.; Sun, Z. Evaluating the losses and recovery of GPP in the subtropical mangrove forest directly attacked by tropical cyclone: Case study of Hainan Island. Forests 2023, 15, 2094. [Google Scholar] [CrossRef]
  41. Vargas-Terminel, M.L.; Rodríguez, J.C.; Yépez, E.A.; Robles-Zazueta, C.A.; Watts, C.; Garatuza-Payán, J.; Vargas, R.; Sanchez-Mejia, Z.M. Ecosystem-atmosphere carbon dioxide exchange from semiarid mangroves in the Gulf of California. J. Arid. Environ. 2024, 208, 104872. [Google Scholar] [CrossRef]
  42. Zhao, D.; Zhang, Y.; Wang, J.; Zhen, J.; Shen, Z.; Xiang, K.; Xiang, H.; Wang, Y.; Wu, G. Spatiotemporal dynamics and geo-environmental factors influencing mangrove gross primary productivity during 2000-2020 in Gaoqiao Mangrove Reserve, China. For. Ecosyst. 2023, 10, 100137. [Google Scholar] [CrossRef]
  43. Gou, R.; Buchmann, N.; Chi, J.; Luo, Y.; Mo, L.; Shekhar, A.; Feigenwinter, I.; Hörtnagl, L.; Lu, W.; Cui, X.; et al. Temporal variations of carbon and water fluxes in a subtropical mangrove forest: Insights from a decade-long eddy covariance measurement. Agric. For. Meteorol. 2022, 343, 109764. [Google Scholar] [CrossRef]
  44. Burman, P.K.D.; Das Das, P. A data-driven approach to assess the impact of climate change on a tropical mangrove in India. J. Geophys. Res Biogeosci. 2024, 129, e2023JG007911. [Google Scholar] [CrossRef]
  45. Manne, M.; Rajitha, K.; Chakraborty, S.; Gnanamoorthy, P. A path analysis approach to model the gross primary productivity of mangroves using climate data and optimal indices. Model. Earth Syst. Environ. 2024, 10, 509–522. [Google Scholar] [CrossRef]
  46. Munoz-Albiter, M.E.; Velazquez-Rodriguez, A.S.; Sanchez-Mejia, Z.M. Seasonal gross primary production in response to environmental factors from arid mangroves in the Gulf of California. Remote Sens. Appl. Soc. Environ. 2024, 33, 101096. [Google Scholar] [CrossRef]
  47. Sun, Z.; An, Y.; Kong, J.; Zhao, J.; Cui, W.; Nie, T.; Zhang, T.; Liu, W.; Wu, L. Exploring the spatiotemporal patterns of global mangrove gross primary production and quantifying the factors affecting its estimation, 1996–2020. Sci. Total Environ. 2024, 908, 168262. [Google Scholar] [CrossRef]
  48. Wang, J.; Yu, G.; Han, L.; Yao, Y.; Sun, M.; Yan, Z. Ecosystem carbon exchange across China’s coastal wetlands: Spatial patterns, mechanisms, and magnitudes. Agric. For. Meteorol. 2024, 345, 109859. [Google Scholar] [CrossRef]
  49. Yuan, W.; Liu, S.; Zhou, G.; Zhou, G.; Tieszen, L.L.; Baldocchi, D.; Bernhofer, C.; Gholz, H.; Goldstein, A.H.; Goulden, M.L.; et al. Deriving a light use efficiency model from eddy covariance flux data for predicting daily gross primary production across biomes. Agric. For. Meteorol. 2007, 143, 189–207. [Google Scholar] [CrossRef]
  50. Huang, M.; Piao, S.; Ciais, P.; Peñuelas, J.; Wang, X.; Keenan, T.F.; Peng, S.; Berry, J.A.; Wang, K.; Mao, J.; et al. Air temperature optima of vegetation productivity across global biomes. Nat. Ecol. Evol. 2019, 3, 772–779. [Google Scholar] [CrossRef] [PubMed]
  51. Tang, Y.; Li, T.; Yang, X.Q.; Chao, Q.; Wang, C.; Lai, D.Y.; Liu, J.; Zhu, X.; Zhao, X.; Fan, X.; et al. Mango-GPP: A process-based model for simulating gross primary productivity of mangrove ecosystems. J. Adv. Model. Earth Syst. 2023, 15, e2023MS003714. [Google Scholar] [CrossRef]
  52. Zhang, Z.; Luo, X.; Friess, D.A.; Wang, S.; Li, Y. Stronger increases but greater variability in global mangrove productivity compared to that of adjacent terrestrial forests. Nat. Ecol. Evol. 2024, 8, 239–250. [Google Scholar] [CrossRef]
  53. Chen, Y.; Kirwan, M.L. Rapid greening in mangroves. Nat. Ecol. Evol. 2024, 8, 186–187. [Google Scholar] [CrossRef]
  54. Golley, F.; Odum, H.T.; Wilson, R.F. The structure and metabolism of a Puerto Rican red mangrove forest in May. Ecology 1962, 43, 9–19. [Google Scholar] [CrossRef]
  55. Christensen, B. Biomass and primary production of Rhizophora apiculata Bl. in a mangrove forest in southern Thailand. Aquat. Bot. 1978, 4, 43–52. [Google Scholar] [CrossRef]
  56. Sukardjo, S.; Yamada, I. Biomass and productivity of a Rhizophora mucronata Lamarck plantation in Tritih, central Java, Indonesia. For. Ecol. Manag. 1992, 49, 195–209. [Google Scholar] [CrossRef]
  57. Amarasinghe, M.D.; Balasubramanium, S. Net primary productivity of two mangrove forest stands on the northwestern coast of Sri Lanka. Hydrobiologia 1992, 247, 37–47. [Google Scholar] [CrossRef]
  58. Ong, J.E. Mangroves—A carbon source and sink. Chemosphere 1993, 27, 1097–1107. [Google Scholar] [CrossRef]
  59. Ong, J.E.; Gong, W.K.; Clough, B.F. Structure and productivity of a 20-year-old stand of Rhizophora apiculata Bl. mangrove forest. J. Biogeogr. 1995, 22, 417–424. [Google Scholar] [CrossRef]
  60. Hossain, M.; Othman, S.; Bujang, J.S.; Kusnan, M. Net primary productivity of Bruguiera parviflora (Wright & Arn.) dominated mangrove forest at Kuala Selangor, Malaysia. For. Ecol. Manag. 2008, 255, 179–182. [Google Scholar] [CrossRef]
  61. Khan Md, N.I.; Suwa, R.; Hagihara, A. Biomass and aboveground net primary production in a subtropical mangrove stand of Kandelia obovata (S.,L.) Yong at Manko Wetland, Japan. Wetl. Ecol. Manag. 2009, 17, 585–599. [Google Scholar] [CrossRef]
  62. Poungparn, S.; Poungparn, S.; Komiyama, A.; Patanaponpaipoon, P.; Jintana, V.; Sangtiean, T.; Tanapermpool, P.; Piriyatota, S.; Maknual, C.; Kato, S. Site-independent allometric relationships for estimating above-ground weights of mangroves. Tropics 2002, 12, 147–158. [Google Scholar] [CrossRef]
  63. Kamruzzaman, M.D.; Kamara, M.; Sharma, S.; Hagihara, A. Stand structure, phenology and litterfall dynamics of a subtropical mangrove Bruguiera gymnorrhiza. J. For. Res. 2016, 27, 513–523. [Google Scholar] [CrossRef]
  64. Peng, C.J.; Qian, J.W.; Guo, X.D.; Zhao, H.W.; Hu, N.X.; Yang, Q.; Chen, C.P.; Chen, L.Z. Vegetation carbon stocks and net primary productivity of the mangrove forests in Shenzhen, China. J. Appl. Ecol. 2016, 27, 2059–2065. [Google Scholar] [CrossRef]
  65. Kamruzzaman, M.D.; Ahmed, S.; Osawa, A. Biomass and net primary productivity of mangrove communities along the oligohaline zone of the Sundarbans, Bangladesh. For. Ecosyst. 2017, 4, 16. [Google Scholar] [CrossRef]
  66. Kamruzzaman, M.D.; Mouctar, K.; Sharma, S.; Osawa, A. Comparison of biomass and net primary productivity among three species in a subtropical mangrove forest at Manko Wetland, Okinawa, Japan. Reg. Stud. Mar. Sci. 2019, 25, 100475. [Google Scholar] [CrossRef]
  67. Njana, M.A.; Zahabu, E.; Malimbwi, R.E. Carbon stocks and productivity of mangrove forests in Tanzania. South For. 2018, 80, 217–232. [Google Scholar] [CrossRef]
  68. Cleveland, C.C.; Taylor, P.; Chadwick, K.D.; Dahlin, K.; Doughty, C.E.; Malhi, Y.; Smith, W.K.; Sullivan, B.W.; Wieder, W.R.; Townsend, A.R. A comparison of plot-based satellite and Earth system model estimates of tropical forest net primary production. Glob. Biogeochem. Cycles 2015, 29, 626–644. [Google Scholar] [CrossRef]
  69. Okimoto, Y.; Nose, A.; Ikeda, K.; Agarie, S.; Oshima, K.; Tateda, Y.; Ishii, T.; Nhan, D.D. An estimation of CO2 fixation capacity in mangrove forest using two methods of CO2 exchange and growth curve analysis. Wetl. Ecol. Manag. 2008, 16, 155–171. [Google Scholar] [CrossRef]
  70. Okimoto, Y.; Nose, A.; Oshima, K.; Tateda, Y.; Ishii, T. A case study for an estimation of carbon fixation capacity in the mangrove plantation of Rhizophora apiculata trees in Trat, Thailand. For. Ecol. Manag. 2013, 310, 1016–1026. [Google Scholar] [CrossRef]
  71. Analuddin, K.; La Ode, K.; La Ode, M.Y.H.; Andi, S.; Idin, S.; La, S.; Rahim, S.; La Ode, A.F.; Kazuo, N. Aboveground biomass, productivity and carbon sequestration in Rhizophora stylosa forest of southeast Sulawesi, Indonesia. Biodiversitas 2020, 21, 1316–1325. [Google Scholar] [CrossRef]
  72. Aksornkoae, S. Structure, Regeneration and Productivity of Mangroves in Thailand. Ph.D. Thesis, Michigan State University, East Lansing, MI, USA, 1975. [Google Scholar]
  73. Robertson, A.I.; Daniel, P.A.; Dixon, P. Mangrove forest structure and productivity in the Fly River estuary, Papua New Guinea. Mar. Biol. 1991, 111, 147–155. [Google Scholar] [CrossRef]
  74. Cox, E.F.; Allen, J. Stand Structure and Productivity of the Rhizophora mangle in Hawaii; USDA Forest Service/UNL Faculty Publications; USDA: Washington, DC, USA, 1999; Volume 43, pp. 1–64. [Google Scholar]
  75. Alongi, D.M.; Dixon, P. Mangrove primary production and above and below-ground biomass in Sawi Bay, southern Thailand. Phuket Mar. Biol. Cent. Spec. Publ. 2000, 22, 31–38. [Google Scholar]
  76. Alongi, D.M.; Sasekumar, A.; Chong, V.C.; Pfitzner, J.; Trott, L.A.; Tirendi, F.; Dixon, P.; Brunskill, G.J. Sediment accumulation and organic material flux in a managed mangrove ecosystem: Estimates of land-ocean-atmosphere exchange in Peninsular Malaysia. Mar. Geol. 2004, 208, 383–402. [Google Scholar] [CrossRef]
  77. Kairo, J.G.; Lang’at, J.K.; Dahdouh-Guebas, F.; Bosire, J.; Karachi, M. Structural development and productivity of replanted mangrove plantations in Kenya. For. Ecol. Manag. 2008, 255, 2670–2677. [Google Scholar] [CrossRef]
  78. Selvam, P.P.; Geevarghese, G.A.; Ramachandran, P.; Ramachandran, R. Spatial assessment of net canopy photosynthetic rates and species diversity in Pichavaram mangrove forest, Tamil Nadu. Indian J. Ecol. 2018, 45, 717–723. [Google Scholar]
  79. Sahu, S.K.; Kathiresan, K. The age and species composition of mangrove forest directly influence the net primary productivity and carbon sequestration potential. Biocatal. Agric. Biotechnol. 2019, 20, 101235. [Google Scholar] [CrossRef]
  80. Sasekumar, A.; Loi, J.J. Litter production in three mangrove forest zones in the Malay Peninsula. Aquat. Bot. 1983, 17, 283–290. [Google Scholar] [CrossRef]
  81. Alam, R.; Mahmood, H.; Biswas, T.; Rahman, M. Physiologically adaptive plasticity in nutrient resorption efficiency of Avicennia officinalis L. under fluctuating saline environments in the Sundarbans of Bangladesh. Hydrobiologia 2019, 828, 41–56. [Google Scholar] [CrossRef]
  82. Saenger, P.; Snedaker, S.C. Pantropical trends in mangrove above-ground biomass and annual litterfall. Oecologia 1993, 96, 293–299. [Google Scholar] [CrossRef]
  83. May, J.D. Spatial variation in litter production by the mangrove Avicennia marina var. australasica in Rangaunu harbour, New Zealand. N. Z. J. Mar. Freshw. Res. 1999, 33, 162–173. [Google Scholar] [CrossRef]
  84. Utrera-Lopez, M.; Moreno-Casasola, P. Mangrove litter dynamics in La Mancha Lagoon, Veracruz, Mexico. Wetl. Ecol. Mang. 2008, 16, 11–22. [Google Scholar] [CrossRef]
  85. Bernini, E.; Rezende, C.E. Litterfall in a mangrove in Southeast Brazil. Pan-American J. Aquat. Sci. 2010, 5, 508–519. [Google Scholar]
  86. Sanchez-Andres, R.; Sánchez-Carrillo, S.; Alatorre, L.C.; Cirujano, S.; Álvarez-Cobelas, M. Litterfall dynamics and nutrient decomposition of arid mangrove in the Gulf of California: Their role in sustaining ecosystem heterotrophy. Estuar. Coast. Shelf Sci. 2010, 89, 191–199. [Google Scholar] [CrossRef]
  87. Agraz Hernández, C.M.; García Zaragoza, C.; Iriarte-Vivar, S.; Flores-Verdugo, F.J.; Moreno Casasola, P. Forest structure, productivity and species phenology of mangrove in the La Mancha lagoon in the Atlantic coast of Mexico. Wetl. Ecol. Manag. 2011, 19, 273–293. [Google Scholar] [CrossRef]
  88. Metcalfe, K.N.; Franklin, D.C.; McGuinness, K.A. Mangrove litter fall: Extrapolation from traps to a large tropical macrotidal harbour. Estuar. Coast. Shelf Sci. 2011, 95, 245–252. [Google Scholar] [CrossRef]
  89. Coronado-Molina, C.; Alvarez-Guillen, H.; Day, J.W.; Reyes, E.; Perez, B.C.; Vera-Herrera, F.; Twilley, R. Litterfall dynamics in carbonate and deltaic mangrove ecosystems in the Gulf of Mexico. Wetl. Ecol. Manag. 2012, 20, 1230136. [Google Scholar] [CrossRef]
  90. Farooqui, Z.A.F.A.R.; Shafique, S.; Khan, K.L.; Ali, A.; Iqbal, P.; Siddiqui, P.J. Assessment of litter production in semi-arid mangrove forests near active Indus River mouth (Hajambro Creek) and Karachi Backwaters, Pakistan. Pakistan J. Bot. 2012, 44, 1763–1768. [Google Scholar]
  91. Lopen-Medellin, X.; Ezcurra, E. The productivity of mangrove in northwestern Mexico: A meta-analysis of current data. J. Coast. Conserv. 2012, 16, 399–403. [Google Scholar] [CrossRef]
  92. Poungparn, S.; Komiyama, A.; Sangteian, T.; Maknual, C.; Patanaponpaiboon, P.; Suchewaboripont, V. High primary productivity under submerged soil raises the net ecosystem productivity of a secondary mangrove forest in eastern Thailand. J. Trop. Ecol. 2012, 28, 303–306. [Google Scholar] [CrossRef]
  93. Sharma, S.; Hoque, A.R.; Analuddin, K.; Hagihara, A. Litterfall dynamics in an overcrowded mangrove Kandelia obovata (S.L.) Young stand over five years. Estuar. Coast. Shelf Sci. 2012, 98, 31–41. [Google Scholar] [CrossRef]
  94. Adame, M.F.; Zaldívar-Jimenez, A.; Teutli, C.; Caamal, J.P.; Andueza, M.T.; López-Adame, H.; Cano, R.; Hernández-Arana, H.A.; Torres-Lara, R.; Herrera-Silveira, J.A. Drivers of mangrove litterfall within a karstic region affected by frequent hurricanes. Biotropica 2013, 45, 147–154. [Google Scholar] [CrossRef]
  95. Sakardjo, S.; Alongi, D.M.; Kusmana, C. Rapid litter production and accumulation in Bornean mangrove forests. Ecosphere 2013, 4, 79. [Google Scholar] [CrossRef]
  96. Ye, Y.; Chen, Y.P.; Chen, G.C. Litter production and litter elemental composition in two rehabilitated Kandelia obovata mangrove forests in Jiulongjiang estuary, China. Mar. Environ. Res. 2013, 83, 63–72. [Google Scholar] [CrossRef]
  97. Liu, L.; Li, F.; Yang, Q.; Tam, N.F.; Liao, W.; Zan, Q. Long-term differences in annual litter production between alien (Sonneratia apetala) and native (Kandelia obovata) mangrove species in Futian, Shenzhen, China. Mar. Pollut. Bull. 2014, 85, 747–753. [Google Scholar] [CrossRef] [PubMed]
  98. Ntyam, S.C.O.; Armah, A.K.; Ajonina, G.N.; George, W.; Adomako, J.K.; Elvis, N.; Obiang, B.O. Importance of mangrove litter production in the protection of Atlantic coastal forest of Cameroon and Ghana. In The Land/Ocean Interactions in the Coastal Zone of West and Central Africa; Diop, S., Barusseau, J.-P., Descamps, C., Eds.; Springer: Cham, Switzerland, 2014; pp. 123–137. [Google Scholar] [CrossRef]
  99. Wang’ondu, V.W.; Bosire, J.O.; Kairo, J.G.; Kinyamario, J.I.; Mwaura, F.B.; Dahdouh-Guebas, F.; Koedam, N. Litterfall dynamics of restored mangroves (Rhiophora mucronata Lamk. and Sonneratia alba) in Kenya. Restor. Ecol. 2014, 22, 824–831. [Google Scholar] [CrossRef]
  100. Hoque, M.M.; Mustafa Kamal, A.H.; Idris, M.H.; Haruna Ahmed, O.; Rafiqul Hoque, A.T.M.; Masum Billah, M. Litterfall production in a tropical mangrove of Sarawak, Malaysia. Zool. Ecol. 2015, 25, 157–165. [Google Scholar] [CrossRef]
  101. Kamruzzaman, M.D.; Paul, S.K.; Ahmed, S.; Azad, M.S.; Osawa, A. Phenology and litterfall production of Bruguiera sexangula (Lour.) Pour. In the Sundarbans mangrove forests, Bangladesh. For. Sci. Technol. 2019, 15, 165–172. [Google Scholar] [CrossRef]
  102. Rani, V.; Sreelekshmi, S.; Preethy, C.M.; Bijoy Nandan, S. Phenology and litterfall dynamics structuring ecosystem productivity in a tropical mangrove stand on southwest coast of India. Reg. Stud. Mar. Sci. 2016, 8, 400–407. [Google Scholar] [CrossRef]
  103. Mulya, M.B.; Arlen, H.J. Production of litter and detritus related to the density of mangrove. IOP Conf. Ser. Earth Environ. Sci. 2018, 130, 012033. [Google Scholar] [CrossRef]
  104. Torres, J.R.; Barba, E.; Choix, F.J. Mangrove productivity and phenology in relation to hydroperiod and physical chemistry properties of water and sediment in Biosphere Reserve, Centla Wetland, Mexico. Trop. Conserv. Sci. 2018, 11, 1–14. [Google Scholar] [CrossRef]
  105. Dewiyanti, I.; Nurfadillah, N.; Setiawati, T.; Yanti, F.; Ebrahimi, S.A. Litter production and decomposition of mangrove in the northern coast of Aceh Besar district, Aceh province. IOP Conf. Ser. Mat. Sci. Eng. 2019, 567, 012025. [Google Scholar] [CrossRef]
  106. Ohtsuka, T.; Tomotsune, M.; Suchewaboripont, V.; Iimura, Y.; Kida, M.; Yoshitake, S.; Kondo, M.; Kinjo, K. Stand dynamics and aboveground net primary productivity of a mature subtropical mangrove forest on Ishigaki Island, southwestern Japan. Reg. Stud. Mar. Sci. 2019, 27, 100516. [Google Scholar] [CrossRef]
  107. Ochoa-Gómez, J.G.; Lluch-Cota, S.E.; Rivera-Monroy, V.H.; Lluch-Cota, D.B.; Troyo-Diéguez, E.; Oechel, W.; Serviere-Zaragoza, E. Mangrove wetland productivity and carbon stocks in an arid zone of the Gulf of California (La Paz Bay, Mexico). For. Ecol. Manag. 2019, 442, 135–147. [Google Scholar] [CrossRef]
  108. Azad, M.d.S.; Kamruzzaman, M.; Paul, S.K.; Kanzaki, M. Litterfall release, vegetative, and reproductive phenology investigation of Heritiera fomes Buch-Ham in the Sundarbans mangrove forests, Bangladesh: Relationship with environmental variables. For. Sci. Technol. 2020, 16, 105–115. [Google Scholar] [CrossRef]
  109. Robertson, A.I.; Dixon, P.; Zagorskis, I. Phenology and litter production in the mangrove genus Xylocarpus along rainfall and temperature gradients in tropical Australia. Mar. Freshw. Res. 2020, 72, 551–562. [Google Scholar] [CrossRef]
  110. Robertson, A.I.; Dixon, P.; Daniel, P.A.; Zagorskis, I. Primary production in forests of the mangrove palm Nypa fruticans. Aquat. Bot. 2020, 16, 103288. [Google Scholar] [CrossRef]
  111. Dangan-Galon, F.; Dolorosa, R.G.; Seguerra, R.O. Mangrove leaf litter production in the Iwahig River estuary ecosystem of Princess Princesa Bay, Palawan, The Philippines. Palawan Sci. 2021, 13, 1–12. [Google Scholar] [CrossRef]
  112. Dewiyani, I.; El Rahimi, S.A.; Damora, A.; Ulfah, M. Mangrove litter production in correlation to environmental properties of water in Pusong Cium, Seruway, Aceh Tamiang. IOP Conf. Ser. Earth Environ. Sci. 2021, 674, 012030. [Google Scholar] [CrossRef]
  113. de Oliveira Gomes, I.E.; Vescovi, L.C.; Bernardino, A.F. The collapse of mangrove litterfall production following a climate-related forest loss in Brazil. Mar. Pollut. Bull. 2021, 453, 110910. [Google Scholar] [CrossRef]
  114. Torres, J.R.; Sánchez-Mejía, Z.M.; Arreola-Lizárraga, J.A.; Galindo-Félix, J.I.; Mascareño-Grijalva, J.J.; Rodríguez-Pérez, G. Environmental factors controlling structure, litter productivity, and phenology of mangroves in arid region of the Gulf of California. Acta Oecol. 2022, 117, 103861. [Google Scholar] [CrossRef]
  115. Abohasassan, R.A. Litterfall production and nutrient dynamics in mangrove systems on the Red Sea coast of Saudi Arabia. JKAU Meterol. Environ. Arid. Land Agric. Sci. 2023, 32, 15–35. [Google Scholar] [CrossRef]
  116. Cintron-Molero, G.; Coelho, C., Jr.; Paiva, L.M.; Schaeffer-Novelli, Y. Latitudinal variations in Brazilian mangroves’ annual litterfall as evidence of maximum power and geo-ecological manifestation. In Brazilian Mangroves and Salt Marshes; Schaeffer-Novelli, Y., Abuchahla, G.M.d.O., Cintron-Molero, G., Eds.; Springer: Cham, Switzerland, 2023; pp. 99–111. [Google Scholar] [CrossRef]
  117. Dali, G.L.A. Litter production in two mangrove forests along the coast of Ghana. Heliyon 2023, 9, e17004. [Google Scholar] [CrossRef]
  118. Purnobasuki, H.; Amaliyah, S.; Kobayashi, K. Production and decomposition of mangrove species Rhizophora apiculata Blume in Surabaya east coast, Indonesia. Borneo J. Resour. Sci. Technol. 2023, 13, 53–66. [Google Scholar] [CrossRef]
  119. Rumondang, A.L.; Kusmana, C.E.C.E.P.; Wilarso, S. Mangrove litterfall productivity in the all-high tides area of Angke Kapuk protected mangrove forest, Jakarta. Seybold Rep. 2023, 18, 1742–1754. [Google Scholar] [CrossRef]
  120. Nyamsi-Moussian, L.; Gordon, A.N.; Essome-Koum, G.L.; Kotte-Mapoko, E.F.; Boubakary Konango-Same, A.; Ngo-Massou, V.M.; Shangguan, Z.; Wang, M.Y. Assessment of standing biomass and litterfall production in reforested mangrove stands within Doula-Edea National Park (Cameroon). J. Mar. Biol. Environ. Sci. 2024, 5, 117–129. [Google Scholar]
  121. Shij, K.; Suresh, S.; Jilesh, V.; Nayar, T.S. Leaf litter production and decomposition in a riverine mangrove forest in India. Wetl. Ecol. Manag. 2024, 32, 59–77. [Google Scholar] [CrossRef]
  122. Kresnasari, D.; Zainuri, M.; Muskanafola, M.R.; Pribadi, R.; Wiarta, R. Litter productivity dynamics in Segara Anakan mangrove forest, Cilacap, Indonesia. Indonesia J. Mar. Sci. 2025, 30, 152–162. [Google Scholar] [CrossRef]
  123. Bouillon, S.; Borges, A.V.; Castaneda, E.; Diele, K.; Dittmar, T.; Duke, N.C.; Kristensen, E.; Lee, S.Y.; Marchand, C.; Middelburg, J.; et al. Mangrove production and carbon sinks: A revision of global budget estimates. Glob. Biogeochem. Cycle 2008, 22, GB2013. [Google Scholar] [CrossRef]
  124. Adame, M.F.; Cormier, N.; Taillardat, P.; Iram, N.; Rovai, A.; Sloey, T.M.; Yando, E.S.; Blanco-Libreros, J.F.; Arnaud, M.; Jennerjahn, T.; et al. Deconstructing the mangrove carbon cycle: Gains, transformation, and losses. Ecosphere 2024, 15, e4806. [Google Scholar] [CrossRef]
  125. Alongi, D.M. Carbon cycling and storage in mangrove forests. Annu. Rev. Mar. Sci. 2014, 6, 195–219. [Google Scholar] [CrossRef]
  126. Ribeiro, R.D.A.; Rovai, A.S.; Twilley, R.R.; Castañeda-Moya, E. Spatial variability of mangrove primary productivity in the neotropics. Ecosphere 2019, 10, e02841. [Google Scholar] [CrossRef]
  127. Ouyang, X.; Guo, F. Patterns of mangrove productivity and support for marine fauna. In Handbook of Halophytes; Grigore, M.-N., Ed.; Springer: Cham, Switzerland, 2021; pp. 1783–1802. [Google Scholar] [CrossRef]
  128. Chatting, M.; Al-Maslamani, I.; Walton, M.; Skov, M.W.; Kennedy, H.; Husrevoglu, S.; Le Vay, L. Past, present and future global mangrove primary productivity. Sci. Total Environ. 2024, 957, 177446. [Google Scholar] [CrossRef]
  129. Velázquez-Pérez, C.; Romero-Berny, E.I.; Miceli-Méndez, C.L.; Moreno-Casasola, P.; López, S. Geoforms and biogeography defining mangrove primary productivity: A meta-analysis for the American Pacific. Forests 2024, 15, 1215. [Google Scholar] [CrossRef]
  130. Walcker, R.; Gandois, L.; Proisy, C.; Corenblit, D.; Mougin, E.; Laplanche, C.; Ray, R.; Fromard, F. Control of “blue carbon” storage by mangrove aging: Evidence from a 66-year chronosequence in French Guiana. Glob. Change Biol. 2018, 11, 93. [Google Scholar] [CrossRef]
  131. Zhang, H.; Yuan, W.; Dong, W.; Liu, S. Seasonal patterns of litterfall in forest ecosystems worldwide. Ecol. Complex. 2014, 20, 240–247. [Google Scholar] [CrossRef]
  132. Rovai, A.S.; Twilley, R.R.; Castañeda-Moya, E.; Midway, S.R.; Friess, D.A.; Trettin, C.C.; Bukoski, J.J.; Stovall, A.E.; Pagliosa, P.R.; Fonseca, A.L.; et al. Macroecological patterns of forest structure and allometric scaling in mangrove forests. Glob. Ecol. Biogeogr. 2021, 30, 1000–1013. [Google Scholar] [CrossRef]
  133. Xiong, Y.; Cakir, R.; Phan, S.M.; Ola, A.; Krauss, K.W.; Lovelock, C.E. Global patterns of tree stem growth and stand aboveground wood production in mangrove forests. For. Ecol. Manag. 2019, 444, 382–392. [Google Scholar] [CrossRef]
  134. Banin, L.; Lewis, S.L.; Lopez-Gonzalez, G.; Baker, T.R.; Quesada, C.A.; Chao, K.J.; Burslem, D.F.; Nilus, R.; Abu Salim, K.; Keeling, H.C.; et al. Tropical forest wood production: A cross-continental comparison. J. Ecol. 2014, 102, 1025–1037. [Google Scholar] [CrossRef]
  135. Day, J.W., Jr.; Conner, W.H.; Ley-Lou, F.; Day, R.H.; Navarro, A.M. The productivity and composition of mangrove forests, Laguna de Terminos, Mexico. Aquat. Bot. 1987, 27, 267–284. [Google Scholar] [CrossRef]
  136. Imbert, D.; Rollet, B. Phytomasse aeinne et production primaire dans la mangrove du Grande Cul-de-Sac Marin (Guateloupe, Antilles, Francaise). Bull. Ecol. 1989, 20, 27–39. [Google Scholar]
  137. Lee, S.Y. Primary productivity and particulate organic matter flow in an estuarine mangrove-wetland in Hong Kong. Mar. Biol. 1990, 106, 453–463. [Google Scholar] [CrossRef]
  138. Day, J.W., Jr.; Coronado-Molina, C.; Vera-Herrera, F.R.; Twilley, R.; Rivera-Monroy, V.H.; Alvarez-Guillen, H.; Day, R.; Conner, W. A 7-year record of above-ground net primary production in a southeastern Mexican mangrove forest. Aquat. Bot. 1996, 55, 39–60. [Google Scholar] [CrossRef]
  139. Li, M.S. Nutrient dynamics of a Futian mangrove forest in Shenzhen, south China. Estuar. Coast. Shelf Sci. 1997, 45, 463–472. [Google Scholar] [CrossRef]
  140. Ross, M.S.; Ruiz, P.L.; Telesnicki, G.J.; Meeder, J.F. Estimating above-ground biomass and production in mangrove communities of Biscayne National Park, Florida (U.S.A.). Wetl. Ecol. Manag. 2001, 9, 27–37. [Google Scholar] [CrossRef]
  141. Sherman, R.E.; Fahey, T.J.; Martinez, P. Spatial patterns of biomass and aboveground net primary productivity in a mangrove ecosystem in the Dominican Republic. Ecosyst 2003, 6, 384–398. [Google Scholar] [CrossRef]
  142. Ong, J.E.; Gong, W.K.; Wong, C.H. Allometry and partitioning of the mangrove, Rhizophora apiculata. For. Ecol. Manag. 2004, 188, 395–408. [Google Scholar] [CrossRef]
  143. Ewe, S.M.; Gaiser, E.E.; Childers, D.L.; Iwaniec, D.; Rivera-Monroy, V.H.; Twilley, R.R. Spatial and temporal patterns of aboveground net primary productivity (ANPP) along two freshwater-estuarine transects in the Florida Coastal Everglades. Hydrobiologia 2006, 569, 459–474. [Google Scholar] [CrossRef]
  144. Alongi, D.M. Patterns of mangrove wood and litter production within a beach ridge-fringing reef embayment, Northern Great Barrier Reef coast. Estuar. Coast. 2011, 34, 32–44. [Google Scholar] [CrossRef]
  145. Castañeda-Moya, E.; Twilley, R.R.; Rivera-Monroy, V.H. Allocation of biomass and net primary productivity of mangrove forests along environment gradients in the Florida Coastal Everglades, USA. For. Ecol. Manag. 2013, 307, 226–241. [Google Scholar] [CrossRef]
  146. Enoki, T.; Yasuda, K.; Kusumoto, B. Aboveground net primary production and stand dynamics of mangroves along a river on Iriomote Island, southwestern Japan. Tropics 2014, 23, 91–98. [Google Scholar] [CrossRef]
  147. Njana, M.A.; Bollandsås, O.M.; Eid, T.; Zahabu, E.; Malimbwi, R.E. Above- and belowground tree biomass models for three mangrove species in Tanzania: A nonlinear mixed effects modelling approach. Ann. For. Sci. 2016, 73, 353–369. [Google Scholar] [CrossRef]
  148. Kamruzzaman, M.; Osawa, A.; Deshar, R.; Sharma, S.; Mouctar, K. Species composition, biomass, and net primary productivity of mangrove forest in Okukubi River, Okinawa Island, Japan. Reg. Stud. Mar. Sci. 2017, 12, 19–27. [Google Scholar] [CrossRef]
  149. Hassan, M.K. Management practices and aboveground biomass production patterns of Rhizophora apiculata plantation: Study from a mangrove area in Samut Songkram Province, Thailand. BioResources 2018, 13, 7826–7850. [Google Scholar] [CrossRef]
  150. Phan, S.M.; Nguyen, H.T.T.; Nguyen, T.K.; Lovelock, C. Modelling above ground biomass accumulation of mangrove plantations in Vietnam. For. Ecol. Manag. 2019, 432, 376–386. [Google Scholar] [CrossRef]
  151. Rivera-Monroy, V.H.; Danielson, T.M.; Castañeda-Moya, E.; Marx, B.D.; Travieso, R.; Zhao, X.; Gaiser, E.E.; Farfan, L.M. Long-term demography and stem productivity of Everglades mangrove forests (Florida, USA): Resistance to hurricane disturbance. For. Ecol. Manag. 2019, 440, 79–91. [Google Scholar] [CrossRef]
  152. Cuc, N.T.K.; Hien, H.T. Stand structure and above ground biomass of Kandelia obovata Sheue, H.Y. Liu & J. Yong mangrove plantations in Northern Viet Nam. For. Ecol. Manag. 2021, 483, 118720. [Google Scholar] [CrossRef]
  153. Mugi, L.M.; Kiss, D.; Kairo, J.G.; Huxham, M.R. Stocks and productivity of dead wood in mangrove forests: A systematic literature review. Front. For. Glob. Change 2022, 5, 767337. [Google Scholar] [CrossRef]
  154. Robertson, A.I.; Zagorskis, I.; Logan, M. Environmental predictors of forest structure, tree growth and wood production for Xylocarpus granatum in mixed-species mangrove forests. Mar. Freshw. Res. 2024, 75, MF23246. [Google Scholar] [CrossRef]
  155. Sillanpää, M.; Vantellingen, J.; Friess, D.A. Vegetation regeneration in a sustainably harvested mangrove forest in West Papua, Indonesia. For. Ecol. Manag. 2017, 390, 137–146. [Google Scholar] [CrossRef]
  156. Pregitzer, K.S.; Euskirchen, E.S. Carbon cycling and storage in world forests: Biome patterns related to forest age. Glob. Change Biol. 2004, 10, 2052–2077. [Google Scholar] [CrossRef]
  157. Poungparn, S.; Komiyama, A.; Umnouysin, S.; Rodtassana, C.; Sangtiean, T.; Maknual, C.; Pravinvongvuthi, T.; Suchewaboripont, V.; Kato, S. Ten-year estimation of net primary productivity in a mangrove forest under a tropical monsoon climate in eastern Thailand: Significance of the temperature environment in the dry season. Forests 2020, 11, 987. [Google Scholar] [CrossRef]
  158. Krauss, K.W.; Keeland, B.D.; Allen, J.A.; Ewel, K.C.; Johnson, D.J. Effects of season, rainfall, and hydrogeomorphic setting on mangrove tree growth in Micronesia. Biotropica 2007, 39, 161–170. [Google Scholar] [CrossRef]
  159. Arnaud, M.; Krause, S.; Norby, R.J.; Dang, T.H.; Acil, N.; Kettridge, N.; Gauci, V.; Ullah, S. Global mangrove root production, its controls and roles in the blue carbon budget of mangroves. Glob. Change Biol. 2023, 29, 3256–3270. [Google Scholar] [CrossRef]
  160. Fujimoto, K.; Ono, K.; Watanabe, S.; Taniguchi, S.; Inoue, T.; Kanayama, K.; Ogawa, T. Estimation of probable annual fine root production and missing dead roots associated with the ingrowth core methods: Attempt with major mangrove species on Iriomote Island, southwestern Japan. Mangrove Sci. 2021, 12, 11–14. [Google Scholar]
  161. Noguchi, K.; Poungparn, S.; Umnouysin, S.; Patanaponpaiboon, P.; Duangnamol, D.; Yoneda, R.; Utsugi, H.; Sato, T.; Tabuchi, R. Biomass and production rates of fine roots in two mangrove stands in southern Thailand. JARQ 2020, 54, 349–360. [Google Scholar] [CrossRef]
  162. Ono, K.; Fujimoto, K.; Hirata, Y.; Tabuchi, R.; Taniguchi, S.; Furukawa, K.; Watanabe, S.; Suwa, R.; Lihpai, S. Estimation of total fine root production using continuous inflow methods in tropical mangrove forest on Pohnpei Island, Micronesia: Fine root necromass accumulation is a substantial contributor to blue carbon stocks. Ecol. Res. 2022, 37, 33–52. [Google Scholar] [CrossRef]
  163. Arnaud, M.; Morris, P.J.; Baird, A.J.; Dang, H.; Nguyen, T.T. Fine root production in a chronosequence of mature reforested mangroves. New Phytol. 2021, 232, 1591–1602. [Google Scholar] [CrossRef] [PubMed]
  164. Finér, L.; Ohashi, M.; Noguchi, K.; Hirano, Y. Fine root production and turnover in forest ecosystem in relation to stand and environmental characteristics. For. Ecol. Manag. 2011, 262, 2008–2023. [Google Scholar] [CrossRef]
  165. Huaraca, H.W.; Riutta, T.; Girardin, C.A.; Hancco Pacha, F.; Puma Vilca, B.L.; Moore, S.; Rifai, S.W.; del Aguila-Pasquel, J.; Araujo Murakami, A.; Freitag, R.; et al. Fine root dynamics across pantropical rainforest ecosystems. Glob. Change Biol. 2021, 27, 3657–3680. [Google Scholar] [CrossRef]
  166. Yuan, Z.Y.; Chen, H.Y.H. A global analysis of fine root production as affected by soil nitrogen and phosphorus. Proc. Royal. Soc. B 2012, 279, 3796–3802. [Google Scholar] [CrossRef]
  167. Malhi, Y.; Doughty, C.E.; Galbraith, D. The allocation of ecosystem net primary productivity in tropical forests. Phil. Trans. Roy Soc. B Biol. Sci. 2011, 366, 3225–3245. [Google Scholar] [CrossRef]
  168. Twilley, R.R.; Chen, R.H.; Hargis, T. Carbon sinks in mangroves and their implications to carbon budget of tropical carbon ecosystems. Water Air Soil Pollut. 1992, 64, 265–288. [Google Scholar] [CrossRef]
  169. Lugo, A.E.; Brown, S.; Brinson, M.M. Forested wetlands in freshwater and saltwater environments. Limnol. Oceanogr. 1988, 33, 894–909. [Google Scholar] [CrossRef]
  170. Alongi, D.M. Impacts of climate change on blue carbon stocks and fluxes in mangrove forests. Forests 2022, 13, 149. [Google Scholar] [CrossRef]
  171. Alongi, D.M.; Mukhopadhyay, S.K. Contributions of mangroves to coastal carbon cycling in low latitude seas. Agric. For. Meteorol. 2015, 213, 266–272. [Google Scholar] [CrossRef]
  172. Alongi, D.M. Zonation and seasonality of benthic primary production and community respiration in tropical mangrove forests. Oecologia 1994, 98, 320–327. [Google Scholar] [CrossRef]
  173. Kwon, B.-O.; Kim, H.; Noh, J.; Lee, S.Y.; Nam, J.; Khim, J.S. Spatiotemporal variability in microphytobenthic across bare intertidal flat, saltmarsh, and mangrove forest of Asia and Australia. Mar. Pollut. Bull. 2020, 151, 110707. [Google Scholar] [CrossRef] [PubMed]
  174. Loo, Y.P.; Ouyang, X.; Lai, D.Y.; Lee, S.Y. The microphytobenthos are abundant and mediate key carbon fluxes in tropical mangroves. Estuar. Coast. 2024, 47, 963–980. [Google Scholar] [CrossRef]
  175. Joye, S.B.; Lee, R.Y. Benthic microbial mats: Important sources of fixed nitrogen and carbon to the Twin Cays, Belize ecosystem. Atoll Res. Bull. 2004, 528, 1–24. [Google Scholar] [CrossRef]
  176. Lovelock, C.E.; Grinham, A.; Adame, M.F.; Penrose, H.M. Elemental composition and productivity of cyanobacterial mats in an arid zone estuary in northwestern Australia. Wetl. Ecol. Manag. 2010, 18, 37–47. [Google Scholar] [CrossRef]
  177. Lyimo, T.J. The microalgae and cyanobacteria of Chwaka Bay. In People, Nature and Research in Chwaka Bay, Tanzania; WIOMSA: Zanzibar, Tanzanian, 2012; pp. 125–141. [Google Scholar]
  178. Lovelock, C.E.; Simpson, L.T.; Duckett, L.J.; Feller, I.C. Carbon budgets for Caribbean mangrove forests of varying structure and with phosphorus enrichment. Forests 2015, 6, 3528–3546. [Google Scholar] [CrossRef]
  179. Steinke, T.D.; Naidoo, Y. Biomass of algae epiphytic on pneumatophores of the mangrove, Avicennia marina, in the St. Lucia estuary. S. Afr. J. Bot. 1990, 56, 226–232. [Google Scholar] [CrossRef]
  180. Schories, D.; Mehlig, U. CO2 gas exchange of benthic microalgae during exposure to air: A technique for the rapid assessment of primary production. Wetl. Ecol. Manag. 2000, 8, 273–280. [Google Scholar] [CrossRef]
  181. Koch, M.S.; Madden, C.J. Patterns of primary production and nutrient availability in a Bahamas lagoon with fringing mangrove. Mar. Ecol. Prog. Ser. 2001, 219, 109–119. [Google Scholar] [CrossRef]
  182. Rajesh, K.M.; Gowda, G.; Mendon, M.R.; Gupta, T.R.C. Primary production of benthic microalgae in the tropical semi-enclosed brackish water pond, southwest coast of India. Asian Fish Sci. 2001, 14, 357–366. [Google Scholar]
  183. Borje, A. Microphytobenthic Productivity in Mangrove Areas of Different Replanting Regimes, Gazi Bay, Kenya. Master’s Thesis, Stockholm University, Stockholm, Sweden, 2004; pp. 1–22. [Google Scholar]
  184. Kristensen, E.; Flindt, M.R.; Ulomi, S.; Borges, A.V.; Abril, G.; Bouillon, S. Emission of CO2 and CH4 to the atmosphere by sediments and open waters in two Tanzanian mangrove forests. Mar. Ecol. Prog. Ser. 2008, 370, 53–67. [Google Scholar] [CrossRef]
  185. Leopold, A.; Marchand, C.; Deborde, J.; Chaduteau, C.; Allenbach, M. Influence of mangrove zonation on CO2 fluxes at the sediment-air interface (New Caledonia). Geoderma 2013, 202–203, 62–70. [Google Scholar] [CrossRef]
  186. Castellantos-Galindo, G.A.; Cantera, J.; Valencia, N.; Giraldo, S.; Peña, E.; Kluger, L.C.; Wolff, M. Modelling trophic flows in the wettest mangroves in the world: The case of Bahia Malaga in the Colombian Pacific coast. Hydrobiologia 2017, 803, 13–27. [Google Scholar] [CrossRef]
  187. Bento, L.; Masuda, L.S.M.; Peixoto, R.B.; Enrich-Prast, A. Regulation in the metabolism and community structure of a tropical salt flat after rainfall. J. Coast. Res. 2017, 33, 304–308. [Google Scholar] [CrossRef]
  188. Ouyang, X.; Lee, S.Y.; Connolly, R.M. Structural equation modelling reveals factors regulating surface sediment organic carbon content and CO2 efflux in a subtropical mangrove. Sci. Total Environ. 2017, 578, 513–522. [Google Scholar] [CrossRef]
  189. Chen, S.; Chmura, G.L.; Wang, Y.; Yu, D.; Ou, D.; Chen, B.; Ye, Y.; Chen, G. Benthic microalgae offset the sediment carbon dioxide emission in subtropical mangrove in cold seasons. Limnol. Oceanogr. 2019, 64, 1297–1308. [Google Scholar] [CrossRef]
  190. Breavington, J.; Steckbauer, A.; Fu, C.; Ennasri, M.; Duarte, C.M. Dynamics of CO2 and CH4 fluxes in Red Sea mangrove soils. Biogeosciences 2025, 22, 117–134. [Google Scholar] [CrossRef]
  191. Corzo, A.; Haro, S.; Gómez-Ramírez, E.; González, C.J.; Papaspyrou, S.; Garcia-Robledo, E. Intertidal microphytobenthic primary production and net metabolism of a tropical estuary. Mar. Environ. Res. 2024, 202, 106741. [Google Scholar] [CrossRef]
  192. Karsten, U.; West, J.A. Ecophysiological studies on six species of the mangrove red algal genus Calogrossa. Funct. Plant. Biol. 1993, 20, 729–739. [Google Scholar] [CrossRef]
  193. Borburema, H.D.; Graiff, A.; Marinho-Soriano, E.; Karsten, U. Photosynthetic performance, growth, pigment content, and photoprotective compounds of the mangrove macroalgae Bostrychia calliptera and Bostrychia montagnei (Rhodophyta) under light stress. Front. Mar. Sci. 2022, 9, 989454. [Google Scholar] [CrossRef]
  194. Borburema, H.D.; Yokoya, N.S.; de Souza, J.M.C.; Nauer, F.; Barbosa-Silva, M.S.; Marinho-Soriano, E. Ocean warming and increased salinity threaten Bostrychia (Rhodophyta) species from genetically divergent populations. Mar. Environ. Res. 2022, 178, 105662. [Google Scholar] [CrossRef]
  195. Borburema, H.D.; Yokoya, N.S.; Soares, L.P.; de Souza, J.M.C.; Nauer, F.; Fujii, M.T.; Pasqualetti, C.B.; de Miranda, G.E.C.; Marinho-Soriano, E. Mangrove macroalgae increase their growth under ocean acidification: A study with Bostrychia (Rhodophyla) haplotypes from different biogeographic provinces. J. Exp. Mar. Biol. Ecol. 2022, 552, 151740. [Google Scholar] [CrossRef]
  196. Cordeiro-Marino, M.; Braga, M.R.A.; Eston, V.R.; Fujii, M.T.; Yokoya, N.S. Mangrove macroalgal communities of Latin America: The state of art and perspectives. In Coastal Plant Communities of Latin. America; Seeliger, U., Ed.; Elsevier: San Diego, CA, USA, 1992; pp. 51–64. [Google Scholar] [CrossRef]
  197. Hoffman, W.E.; Dawes, C.J. Photosynthetic rates and primary production by two Florida benthic red algal species from a salt marsh and a mangrove community. Bull. Mar. Sci. 1980, 30, 358–364. [Google Scholar]
  198. Burkholder, P.R.; Almodovar, L.R. Studies on mangrove algal communities in Puerto Rico. Florida Sci. 1973, 36, 50–66. [Google Scholar]
  199. Dawes, C.J.; Moon, R.E.; Davis, M.A. The photosynthetic and respiratory rates and tolerances of benthic algae from a mangrove and salt marsh estuary: A comparative study. Estuar. Coast. Mar. Sci. 1978, 6, 175–185. [Google Scholar] [CrossRef]
  200. Littler, M.M.; Taylor, P.R.; Littler, D.S.; Sims, R.H.; Norris, J.N. The distribution, abundance and primary productivity of submerged macrophytes in a Belize Barrier Reef mangrove system. Atoll Res. Bull. 1985, 280, 1–20. [Google Scholar] [CrossRef]
  201. Lapointe, B.E.; Littler, M.M.; Littler, D.S. A comparison of nutrient-limited productivity in macroalgae from a Caribbean Barrier Reef and from a mangrove ecosystem. Aquat. Bot. 1987, 28, 243–255. [Google Scholar] [CrossRef]
  202. Mann, F.D.; Steinke, T.D. Photosynthetic and respiratory responses of the mangrove-associated red algae, Bostrychia radicans and Caloglossa leprieurii. S. Afr. J. Bot. 1988, 54, 203–207. [Google Scholar] [CrossRef]
  203. Dawes, C.J. Mangrove structure, litter and macroalgal productivity in a northernmost forest of Florida. Mangr. Salt Marsh 1999, 3, 259–267. [Google Scholar] [CrossRef]
  204. Pena, E.J.; Zingmark, R.; Nietch, C. Comparative photosynthesis of two species of intertidal epiphytic macroalgae on mangrove roots during submersion and emersion. J. Phycol. 2002, 35, 1206–1214. [Google Scholar] [CrossRef]
  205. Karsten, U.; Koch, S.; West, J.A.; Kirst, G.O. The intertidal red alga Bostrychia simpliciuscula Harvey ex J. Agardh from a mangrove swamp in Singapore: Acclimation to light and salinity. Aquat. Bot. 1994, 48, 313–323. [Google Scholar] [CrossRef]
  206. Borburema, H.D.D.S.; Lima, R.P.D.; Miranda, G.E.C.D. Effects of ocean warming, eutrophication and salinity variations on the growth of habitat-forming macroalgae in estuarine environments. Acta Bot. Bras. 2020, 34, 662–672. [Google Scholar] [CrossRef]
  207. Alongi, D.M. Lateral export and sources of subsurface dissolved carbon and alkalinity in mangroves: Revising the blue carbon budget. J. Mar. Sci. Eng. 2022, 10, 1916. [Google Scholar] [CrossRef]
  208. James, K.; Macreadie, P.I.; Burdett, H.L.; Davies, I.; Kamenos, N.A. It’s time to broaden what we consider a ‘blue carbon ecosystem’. Glob. Change Biol. 2024, 30, e17261. [Google Scholar] [CrossRef]
  209. McKenzie, L.J.; Nordlund, L.M.; Jones, B.L.; Cullen-Unsworth, L.C.; Roelfsema, C.; Unsworth, R.K.F. The global distribution of seagrass meadows. Environ. Res. Lett. 2020, 15, 074041. [Google Scholar] [CrossRef]
  210. Duarte, C.M.; Gattuso, J.-P.; Hancke, K.; Gundersen, H.; Filbee-Dexter, K.; Pedersen, M.F.; Middelburg, J.J.; Burrows, M.T.; Krumhansi, K.A.; Wernberg, T.; et al. Global estimates of the extent and production of macroalgal forests. Glob. Ecol. Biogeogr. 2022, 31, 1422–1439. [Google Scholar] [CrossRef]
  211. Jia, M.; Wang, Z.; Mao, D.; Ren, C.; Song, K.; Zhao, C.; Wang, C.; Xiao, X.; Wang, Y. Mapping global distribution of mangrove forests at 10-m resolution. Sci. Bull. 2023, 68, 1306–1316. [Google Scholar] [CrossRef]
  212. Murray, N.J.; Phinn, S.R.; DeWitt, M.; Ferrari, R.; Johnston, R.; Lyons, M.B.; Clinton, N.; Thau, D.; Fuller, R.A. The global distribution and trajectory of tidal flats. Nature 2019, 565, 222–225. [Google Scholar] [CrossRef]
  213. Worthington, T.A.; Spalding, M.; Landis, E.; Maxwell, T.L.; Navarro, A.; Smart, L.S.; Murray, N.J. The distribution of global tidal marshes from Earth observation data. Glob. Ecol. Biogeogr. 2024, 33, e13852. [Google Scholar] [CrossRef]
  214. Lyons, M.B.; Murray, N.J.; Kennedy, E.V.; Kovacs, E.M.; Castro-Sanguino, C.; Phinn, S.R.; Acevedo, R.B.; Alvarez, A.O.; Say, C.; Tudman, P.; et al. New global area estimates for coral reefs from high-resolution mapping. Cell Rep. Sustain. 2024, 1, 100015. [Google Scholar] [CrossRef]
  215. Pessarrodona, A.; Franco-Santos, R.M.; Wright, L.S.; Vanderlift, M.A.; Howard, J.; Pidgeon, E.; Wernberg, T.; Filbee-Dexter, K. Carbon sequestration and climate change mitigation using macroalgae: A state of knowledge review. Biol. Rev. 2023, 98, 1945–1971. [Google Scholar] [CrossRef] [PubMed]
  216. Otani, S.; Endo, T. CO2 flux in tidal flats and salt marshes. In Blue Carbon in Shallow Coastal Ecosystems; Kuwae, T., Hori, M., Eds.; Springer: Singapore, 2019; pp. 223–250. [Google Scholar]
Figure 1. Rates of mangrove gross primary production (g C m−2 d−1) based on combined data (GPP) using 5 methods: litterfall + gas exchange (LGE), MODIS (MOD), eddy covariance (ECV), light attenuation (LATT), and remote sensing/modelling (RSM). Horizontal line in each box: median; lower and upper hinges: 25th and 75th percentiles; error bars: 95% confidence intervals. Values above median line are means. Original data from references: [8,11,12,13,14,15,16,17,18,19,20,21,22,23,24,25,26,27,28,29,30,31,32,33,34,35,36,37,38,39,40,41,42,43,44,45,46,47,48].
Forests 16 00747 g001
Figure 2. Spatial distribution of mangrove ecosystem GPP (g C m−2 y−1): (a) global distribution of GPP estimates averaged by 0.5° × 0.5°; (bg) closeup of GPP in (b) Everglades National Park, (c) Gurupi-Piria Marine Extractive Reserve, (d) Edumanom National Forest, (e) Sundarbans National Park, (f) Terusan, and (g) Deception Bay, respectively; (h) latitudinal distribution of mangrove GPP and terrestrial GPP estimated by DGVMs (dynamic global vegetation models), RS (remote sensing), and MTE (model tree ensemble product); and (i) longitudinal distribution of mangrove GPP (g C m−2 d−1). Reproduced from [47] with permission of Elsevier B.V.
Forests 16 00747 g002
Figure 3. Comparison of annually averaged mangrove GPP with empirically-derived GPP data (MANGROVE) estimated in other plant functional types based on remote sensing (RS), model tree ensemble (MTE), and dynamic global vegetational (DGVM) models. BARE: bare soil; GRASS_MAN: managed grasses; GRASS_NAT: natural grasses; SHRUBS: shrubs; TREES_BD: broad-leaved deciduous trees; TREES_BE: broad-leaved evergreen trees; TREES_ND: needle-leaved deciduous trees; and TREES_NE: needle-leaved evergreen trees. Reproduced from [47] with permission from Elsevier B.V.
Forests 16 00747 g003
Figure 4. Modelled and observed (a) daily (g C m−2 d−1) and (b) seasonal patterns of mangrove GPP at Zhangjiang mangrove forest, 2018–2020. Seasonal patterns (b) are monthly average GPP. Empirical measurements from eddy covariance are in red and model estimates are in blue. Reproduced from [51] under Creative Commons Attribution License 4.0.
Forests 16 00747 g004
Figure 5. Changes in near-infrared reflectance of vegetation (NIRv) during 2001–2020 for mangroves and evergreen broad-leaf forests at the global scale. Geographic distribution trends (a) in annual mean NIRv at the 0.5° × 0.5° grid-cell scale. Inset maps (a) illustrate regional trends in the NIRv. The pie plots indicate the area-weighted proportion of grid cells with increasing production, decreasing production, or nonsignificant (non-sig’) production trends. The insert plots in (b) illustrate the probability density curves of the interannual variability (IAV) with the average by the dashed blue lines and the numbers in blue indicating the global average IAV value. The right-hand panels depict the latitudinal pattern of trends and IAV averaged per 1° latitude band. Reproduced from [52] with permission from Springer Nature.
Forests 16 00747 g005
Figure 6. Relationship between forest age and wood production of Rhizophora apiculata in 5 locations in Thailand. Non-linear peak regression equation and statistics are in upper righthand corner. Locations and references: Chantaburi [72], Phuket Island [55], Samut Songkram [149], Sawi Bay [75], and Trat [157].
Forests 16 00747 g006
Figure 7. Mangrove root production (g DW m−2 y−1) across geomorphological (left panel) and sedimentary (right panel) settings. Red filled dots are sample mean. Bold horizontal lines are sample medians. Lower and upper hinges correspond to first and third quartiles of sample. Upper and lower whiskers extend from hinges to largest and smallest values. Open circles indicate individual measurements. Reproduced from [159] under Creative Commons Attribution License 4.0.
Forests 16 00747 g007
Table 1. Mean and median rates of mangrove ANPP (g C m−2 d−1) based on different methods. Different letters as superscripts in methods indicate significant differences (p < 0.001) using Dunn’s test in pair-wise comparisons test post-ANOVA. DW data were converted to CORG assuming 48% C content [8]. References: Biomass increment + litterfall: [7,8,54,55,56,57,58,59,60,61,62,63,64,65,66,67,68,69,70,71]. CO2 measurements + litterfall: [11]. Field-based, radiation-based biogeochemical model: [68]. Gas exchange: [8,59,69]. Growth curve analysis: [69,70]. Growth increment: [72]. Light attenuation/light interception: [7,8,43,73,74,75,76,77,78,79]. Litterfall: [7,53,55,56,58,60,61,65,66,67,71,80,81,82,83,84,85,86,87,88,89,90,91,92,93,94,95,96,97,98,99,100,101,102,103,104,105,106,107,108,109,110,111,112,113,114,115,116,117,118,119,120,121,122].
MethodSizeMean±1 SDMaxMinMedian
Biomass increment + litterfall b,c703.92.611.80.03.2
CO2 exchange + litterfall d41.42.14.40.00.7
Field-based, radiation-based model c,d33.10.33.63.03.0
Gas exchange a,b,c88.95.416.62.36.7
Growth curve/growth increment b,c143.62.89.30.72.4
Light attenuation a3612.89.230.71.99.0
Light interception a,b1810.08.735.03.76.9
Litterfall d3382.21.48.10.01.9
Table 2. Estimates of mean mangrove tree net primary production (Mg C ha−1 y−1) and of global total mangrove NPP (Tg C y−1) using different estimates of global mangrove area (km2). NA = not available. * = area correction factor (×1.98) applied.
Litter ProductionWood ProductionRoot ProductionTotal Mangrove NPPGlobal Mangrove AreaGlobal Mangrove NPPReference
9.012.1NA21.1181,900383.4[168]
12.8NANA16.3160,000260.5[169]
4.24.25.213.6160,000218.0[123]
4.34.210.819.3160,000308.7[8]
10.09.02.021.0170,000356.9[9]
4.34.24.713.1138,000210.0[125]
4.44.95.915.2160,000 *228.0[170]
4.53.63.011.0137,600143.0[159]
4.04.73.011.7147,359182.7[124]
Disclaimer/Publisher’s Note: The statements, opinions and data contained in all publications are solely those of the individual author(s) and contributor(s) and not of MDPI and/or the editor(s). MDPI and/or the editor(s) disclaim responsibility for any injury to people or property resulting from any ideas, methods, instructions or products referred to in the content.

