Article

Contribution of Different Forest Strata on Energy and Carbon Fluxes over an Araucaria Forest in Southern Brazil

by
Marcelo Bortoluzzi Diaz
1,
Pablo Eli Soares de Oliveira
2,
Vanessa de Arruda Souza
3,
Claudio Alberto Teichrieb
1,
Hans Rogério Zimermann
1,
Gustavo Pujol Veeck
1,
Alecsander Mergen
1,
Maria Eduarda Oliveira Pinheiro
1,
Michel Baptistella Stefanello
1,
Osvaldo L. L. de Moraes
1,
Gabriel de Oliveira
4,5,
Celso Augusto Guimarães Santos
4,6,* and
Débora Regina Roberti
1,*
1
Department of Physic, Federal University of Santa Maria (UFSM), Santa Maria 97105-900, RS, Brazil
2
Department of Atmospheric and Climate Sciences, Federal University of Rio Grande do Norte (UFRN), Natal 90650-001, RN, Brazil
3
Department of Environmental Sciences, Federal Rural of Rio de Janeiro (UFRRJ), Seropédica 23890-000, RJ, Brazil
4
Stokes School of Marine and Environmental Sciences, University of South Alabama, Mobile, AL 36688, USA
5
Dauphin Island Sea Lab, Dauphin Island, AL 36528, USA
6
Department of Civil and Environmental Engineering, Federal University of Paraíba, João Pessoa 58051-900, PB, Brazil
*
Authors to whom correspondence should be addressed.
Forests 2025, 16(6), 1008; https://doi.org/10.3390/f16061008
Submission received: 19 April 2025 / Revised: 29 May 2025 / Accepted: 7 June 2025 / Published: 16 June 2025
(This article belongs to the Section Forest Ecology and Management)

Abstract

:
Forest–atmosphere interactions through mass and energy fluxes significantly influence climate processes. However, due to anthropogenic actions, native Araucaria forests in southern Brazil, part of the Atlantic Forest biome, have been drastically reduced. This study quantifies CO2 and energy flux contributions from each forest stratum to improve understanding of surface–atmosphere interactions. Eddy covariance data from November 2009 to April 2012 were used to assess fluxes in an Araucaria forest in Paraná, Brazil, across the ecosystem, understory, and overstory strata. On average, the ecosystem acts as a carbon sink of −298.96 g C m−2 yr−1, with absorption doubling in spring–summer compared to autumn–winter. The understory primarily acts as a source, while the overstory functions as a CO2 sink, driving carbon absorption. The overstory contributes 63% of the gross primary production (GPP) and 75% of the latent heat flux, while the understory accounts for 94% of the ecosystem respiration (RE). The energy fluxes exhibited marked seasonality, with higher latent and sensible heat fluxes in summer, with sensible heat predominantly originating from the overstory. Annual ecosystem evapotranspiration reaches 1010 mm yr−1: 60% of annual precipitation. Water-use efficiency is 2.85 g C kgH2O−1, with higher values in autumn–winter and in the understory. The influence of meteorological variables on the fluxes was analyzed across different scales and forest strata, showing that solar radiation is the main driver of daily fluxes, while air temperature and vapor pressure deficit are more relevant at monthly scales. This study highlights the overstory’s dominant role in carbon absorption and energy fluxes, reinforcing the need to preserve these ecosystems for their crucial contributions to climate regulation and water-use efficiency.

1. Introduction

The Amazon rainforest, located in the tropical zone, plays a fundamental role in the world’s climate due to its vast dimensions and diversity and is predominantly located within Brazilian territory [1,2]. Since the 1980s, numerous studies have been conducted in this region to describe the exchange processes between different Amazonian forest ecosystems and the atmosphere [3,4,5]. However, given Brazil’s continental dimensions, there are other ecosystems that remain under-investigated, such as the Atlantic rainforest. This rainforest originally covered around 150 million ha, extending through tropical and subtropical regions from 5° S to 30° S [6]. Currently, only about 16% of the Atlantic rainforest’s natural vegetation remains, largely in small fragments of around 100 hectares each [6,7]. The highly heterogeneous environmental conditions of these forests have promoted great biodiversity and high levels of endemism. One example is the Mixed Ombrophilous Forests, among the most threatened forest formations in Brazil, with only 12.6% of its original extent still intact [6,8,9,10]. These forests are primarily found at elevations above 500 m and between latitudes 20° S and 29° S, currently covering an area of 25 million hectares. The dominant species is the Brazilian pine, or Paraná pine (Araucaria angustifolia, referred to here as the Araucaria forest). The deforestation of these areas is a subject of ongoing discussion within Brazilian legislative frameworks, as current laws regulate its commercial use through management and planting but do not prohibit clear-cutting [11]. Adult Araucaria trees are easily distinguished by their umbel-shaped canopies and straight, woody stems, which are free of branches up to two-thirds of their height and can reach up to 30 m [12]. Therefore, the overall forest–atmosphere interactions in the Araucaria forest can be significantly influenced by the partitioning of energy and carbon fluxes between the overstory and understory, underscoring the importance of these vertical structures in maintaining ecosystem stability and functionality.
The overstory contribution to the fluxes is often more significant, especially in relation to CO2 and evapotranspiration [13,14]. The contribution of understory fluxes is highly dependent on canopy structure, which limits the available energy for flux processes at this level [15,16,17,18,19,20]. Misson et al. [13] observed that understory respiration varied between 32% and 79% of the total respiration in different types of forests, including evergreen and deciduous, across various climate types, such as temperate, boreal, arid, and semiarid. Baldocchi and Vogel [21] found that the canopy contribution to ecosystem evapotranspiration was around 95% for a temperate deciduous forest. However, Powell et al. [22] found values of 50%–40% in summer, 30%–15% in winter, and 45% on an annual average for a pine flatwood forest. Wang et al. [23] and Baldocchi et al. [24] showed that the greater the canopy cover, the more substantial the contribution of the upper stratum to the total evapotranspiration of the ecosystem. Understanding the partitioning of these vertical fluxes is crucial for various scientific domains, such as biogeochemistry, plant physiology, and ecohydrology, as well as for advancing climate models [13,25]. In this regard, grasping the factors that control the flux partitioning between the overstory and understory across different climates and forest types remains a challenge.
Despite the increasing availability of flux data from tropical and subtropical forests, the dynamics of energy and carbon exchange in pronounced dual-canopy strata, such as those in Araucaria forests, remain poorly understood. This structural configuration suggests significant stratification in energy absorption, evapotranspiration, and carbon assimilation. Furthermore, seasonal variations in solar radiation and temperature in southern Brazil may differentially influence the overstory and understory, resulting in distinct seasonal flux patterns. We hypothesize that, due to the dominance and height of Araucaria trees, the overstory exhibits stronger seasonal variability in carbon and energy fluxes, primarily driven by solar radiation, whereas the understory displays dampened seasonality yet still plays a substantial role, particularly in carbon exchange.
In this paper, we are interested in quantifying these contributions. To that end, we analyze a time series of eddy covariance data to understand the patterns of energy and carbon fluxes at the ecosystem, overstory, and understory levels in an Araucaria forest in southern Brazil. Fluxes were collected at 11 m (within the forest, i.e., understory) and at 32 m (above the Araucaria canopy, i.e., ecosystem). More specifically, we aim to (1) quantify annual carbon, water exchange, and water-use efficiency of the Araucaria forest; (2) evaluate the seasonality of the fluxes; and (3) determine which drivers control the fluxes.

2. Materials and Methods

2.1. Experimental Area Description

The experimental site is located in a Mixed Ombrophilous Forest (MOF), covering 32 hectares in São João do Triunfo, State of Paraná, southern Brazil, within the Atlantic rainforest biome. The site is classified as a disturbed primary forest and represents a remnant of a much larger forest that once covered 182,000 km2 [26]. The predominant species is Araucaria trees (Araucaria angustifolia), accounting for 42% to 48% of the sampled species at the site, with canopy heights ranging from 10 to 25 m [27]. The lower stratum of the forest includes a mixture of shrubs and herbaceous plants, typically reaching heights between 0.5 and 2 m, along with small trees such as yerba mate (Ilex paraguariensis), cinnamon (Lauraceae), and members of the Myrtaceae family, which generally range in height from 2 to 8 m [28]. Additionally, the site features fens, epiphytes, mosses, and lichens that cover the ground and tree trunks. The predominant soil type at the site is Dystrophic Red-Yellow Podzolic.
The climate classification of the experimental site is categorized as Cfa according to the Köppen classification system [29], which is defined as temperate humid with a hot summer. The mean annual air temperature is 17.4 °C, with the coldest month being July at 12.9 °C and the hottest month January at 21.2 °C. Precipitation is well distributed throughout the year, totaling 1667.7 mm yr−1, without a well-defined dry season. The minimum monthly precipitation occurs in August with 86.2 mm month−1 and the maximum in October with 186.1 mm month−1, according to the Climatic Normals for 1991–2020 from the Brazilian National Meteorological Service (INMET), available at https://portal.inmet.gov.br/normais (accessed on 22 April 2024).
The leaf area index (LAI) at the experimental site was obtained from the MOD15A2 product of the MODIS (Moderate Resolution Imaging Spectroradiometer). The composite images of the MOD15A2 product offer a temporal resolution of eight days and a spatial resolution of 1 km, maintained within the range of 0.4 to 0.7 nm of the electromagnetic spectrum [30].

2.2. Atmospheric Data Measurements

A 32 m tall flux tower was installed at geographic coordinates 25°41′21.1″ S and 50°09′47.1″ W at 780 m above sea level, with a minimum fetch of 250 m from any direction. Meteorological and eddy covariance data were collected between 1 November 2009 and 10 April 2012 at various heights. At 11 m and 32 m, air temperature and wind components were measured using a CSAT3 3-D Sonic Anemometer (Campbell Scientific Inc., Logan, UT, USA), and H2O/CO2 concentrations were measured using an open-path infrared gas analyzer (LI-7500; LI-COR Inc., Lincoln, NE, USA), both at a frequency of 10 Hz. At 29 m, air temperature (Tair) and relative humidity (RH) were measured using a temperature and relative humidity probe (HMP45C Campbell Scientific Inc., Logan, UT, USA), and global radiation (Rg) was measured using the pyranometer (LI-200, LI-COR Inc., Lincoln, NE, USA), both at one-minute intervals. More details about data collection can be found in Oliveira et al. [31].
Precipitation (Prec) data and gaps in the meteorological measurements (Rg, Tair, and RH) due to lack of energy or sensor maintenance were filled using data collected at a nearby station (OMM83836) of the Brazilian National Meteorological Service (INMET), located approximately 50 km from the experimental site in Irati (latitude: −25.50°; longitude: −50.64°). Remaining gaps in the dataset were filled using the ERA5 reanalysis [32]. Climatic Normals for precipitation and air temperature were obtained from the same INMET station from 1991 to 2020 dataset.

2.3. Data Processing

Sensible (H) and latent heat (LE) fluxes as well as carbon dioxide (CO2) fluxes were obtained using the eddy covariance (EC) technique. This procedure is based on the covariance between vertical wind speed and a scalar obtained from the experimental data at high frequency [33]. The high-frequency EC measurements were processed using the EddyPro Advanced Software, version 7.0.6 (LI-COR Inc., Lincoln, NE, USA), resulting in half-hour fluxes. Flux estimation involved several steps: raw data filtration using the methodology described by Vickers and Mahrt [34]; turbulent fluctuation calculation on a per-block mean basis, with double rotation [35] and density effect correction [36]; high-frequency spectral correction based on the mathematical formulations to model the attenuations due to instrumental configuration [37]; and both high- and low-filter spectral corrections following the methods of Moncrieff et al. [38] and Moncrieff et al. [39], respectively.
The net ecosystem carbon exchange (NEE) was obtained as the sum of the CO2 flux and the storage term (S). S was calculated as follows:
S = 0 h d C d t d z
where d C d t represents the variation in the CO2 concentration (C) over a half-hour interval between the surface and the observation height ( h ).
Half-hour fluxes were quality controlled to remove spurious values [40]. NEE, LE, and H values above 50 μmol CO2 m−2 s−1, 700 W m−2, and 400 W m−2 and below −50 μmol CO2 m−2 s−1, −100 W m−2, and −100 W m−2, respectively, were removed. Subsequently, a filter was applied to eliminate the remaining spikes. This filter compares the fluxes every half hour ( f i ) with the mean ( f m ) and standard deviation ( f s d ), using data from the same time as f i in a 14-day moving window, according to the adapted equations [41]:
f m + 1.7 f s d < f i < f m ( 1.7 f s d )
The filter usually used in low-turbulence situations (i.e., the u filter, where u represents the friction velocity) was not applied to our data, as recommended by Oliveira et al. [31]. These authors demonstrated, using the same dataset, that when turbulence is weak, CO2 and other scalars accumulate inside the canopy due to a decoupling between the levels. When a more intense period of turbulence occurs, recoupling happens. Under these conditions, the CO2 fluxes filtered with u correction can overestimate ecosystem respiration rates. This tendency increases as the turbulent fluxes become more intermittent.
The measurement system failed during the period from 7 February 2011 to 24 August 2011. Therefore, these data were discarded from the analysis; i.e., no gap-filling procedures were performed since it is a large window to be filled. After applying quality controls to the flux data, the total amount of failures was 44.8%, 43.8%, and 51.1% for H, LE, and NEE, respectively, at the 11 m height measurements and 39.5%, 45.9%, and 49.2% for H, LE, and NEE, respectively, at the 32 m height measurements, primarily due to lack of energy or sensor maintenance. This rate of failures is in accordance with the literature [42]. Gap filling was performed using a marginal distribution sampling (MDS) method following the procedure suggested by Reichstein et al. [43], using the REddyProc package (version 1.2.2) (Max Planck Institute for Biogeochemistry at MPI-BGC, Jena, Germany) available in RStudio (version RStudio-2024.04.0-735) [44].

2.4. Flux Partitioning in Forest Strata

In this study, fluxes were analyzed at levels limited to the heights at which the EC system sensors were installed, as follows:
-
Ecosystem: the LE, H, and NEE fluxes were obtained by the EC system at height of 32 m;
-
Understory: the LE, H, and NEE fluxes were obtained by the EC system at height of 11 m;
-
Overstory: the LE, H, and NEE fluxes were calculated by subtracting the understory fluxes from the ecosystem fluxes, respectively.
In the overstory, 90% of the biomass volume covers almost all canopies of the largest trees [27]. The remaining biomass (10%) is located below 11 m in height (understory) and is composed of smaller vegetation and the soil surface.
Evapotranspiration (ET), in mm day−1, was estimated using daily LE (in W m−2) multiplied by the conversion factor of 0.0353. ET represents the sum of two distinct processes: evaporation (E) and transpiration (T). Overstory ET represents the transpiration process of the canopy and evaporation of intercepted precipitation and dew. In the understory, however, ET is formed by a combination of surface evaporation and lower biomass transpiration.
To partition the NEE between ecosystem respiration (RE), which represents the respiration from vegetation and soil (i.e., autotrophic and heterotrophic respiration), and gross primary production (GPP), we used the methodology described by Reichstein et al. [43] using the REddyProc package (version 1.2.2) [44], based on the nighttime approach [45]. We obtained the RE from the nonlinear relationship proposed by Lloyd and Taylor [46], parameterized during the nighttime period with the air temperature (Tair), as follows:
R E = r b   e x p E 0 1 T r e f T 0 1 T a i r T 0
where r b is the respiration value at the reference temperature ( T r e f ), E 0 is the activation energy, T 0 is −46.02 °C as obtained by Lloyd and Taylor [46], and T r e f is 10 °C. Equation (3) was extrapolated to the daytime period based on the r b and E 0 parameters collected during the night period. Then, GPP was calculated as the residual between NEE and RE during the daytime. This procedure was conducted with the NEE flux calculated by the EC system at both 11 m and 32 m heights. We analyzed each level as follows:
-
Ecosystem: the RE and GPP from partition of NEE obtained by the EC system at a 32 m height;
-
Understory: the RE and GPP from partition of NEE by the EC system at an 11 m height;
-
Overstory: the RE and GPP were obtained by subtracting the ecosystem’s RE and GPP from the understory’s RE and GPP, respectively.
In this study, the fluxes estimated for the overstory represent processes occurring in the canopy, while the fluxes estimated for the understory represent processes occurring in the vegetation and soil below the canopy.

2.5. Statistical Analyses

The relation between LE, GPP, and RE and meteorological (Tair, Rg, and VPD) and biophysical variables (EVI and LAI) were evaluated for ecosystem and understory. All statistical analyses were conducted using the fitlm function, a linear regression modeling tool, in MATLAB (Mathworks Inc., Natick, MA, USA), version R2024b. The relationship between the atmospheric variables and the fluxes were considered significant if the p-value was less than 0.05.
For the annual analysis, we used the full time series available (November 2009 to April 2012) to calculate average annual fluxes, representing an average year based on the mean values across this period, hereafter termed annual. For seasonal analysis, we defined two periods: spring–summer (SS), from October to March and autumn–winter (AW), from April to September, both obtained using the annual dataset. This approach allowed us to characterize both seasonal variability and overall annual patterns despite the absence of a single continuous calendar year.

3. Results

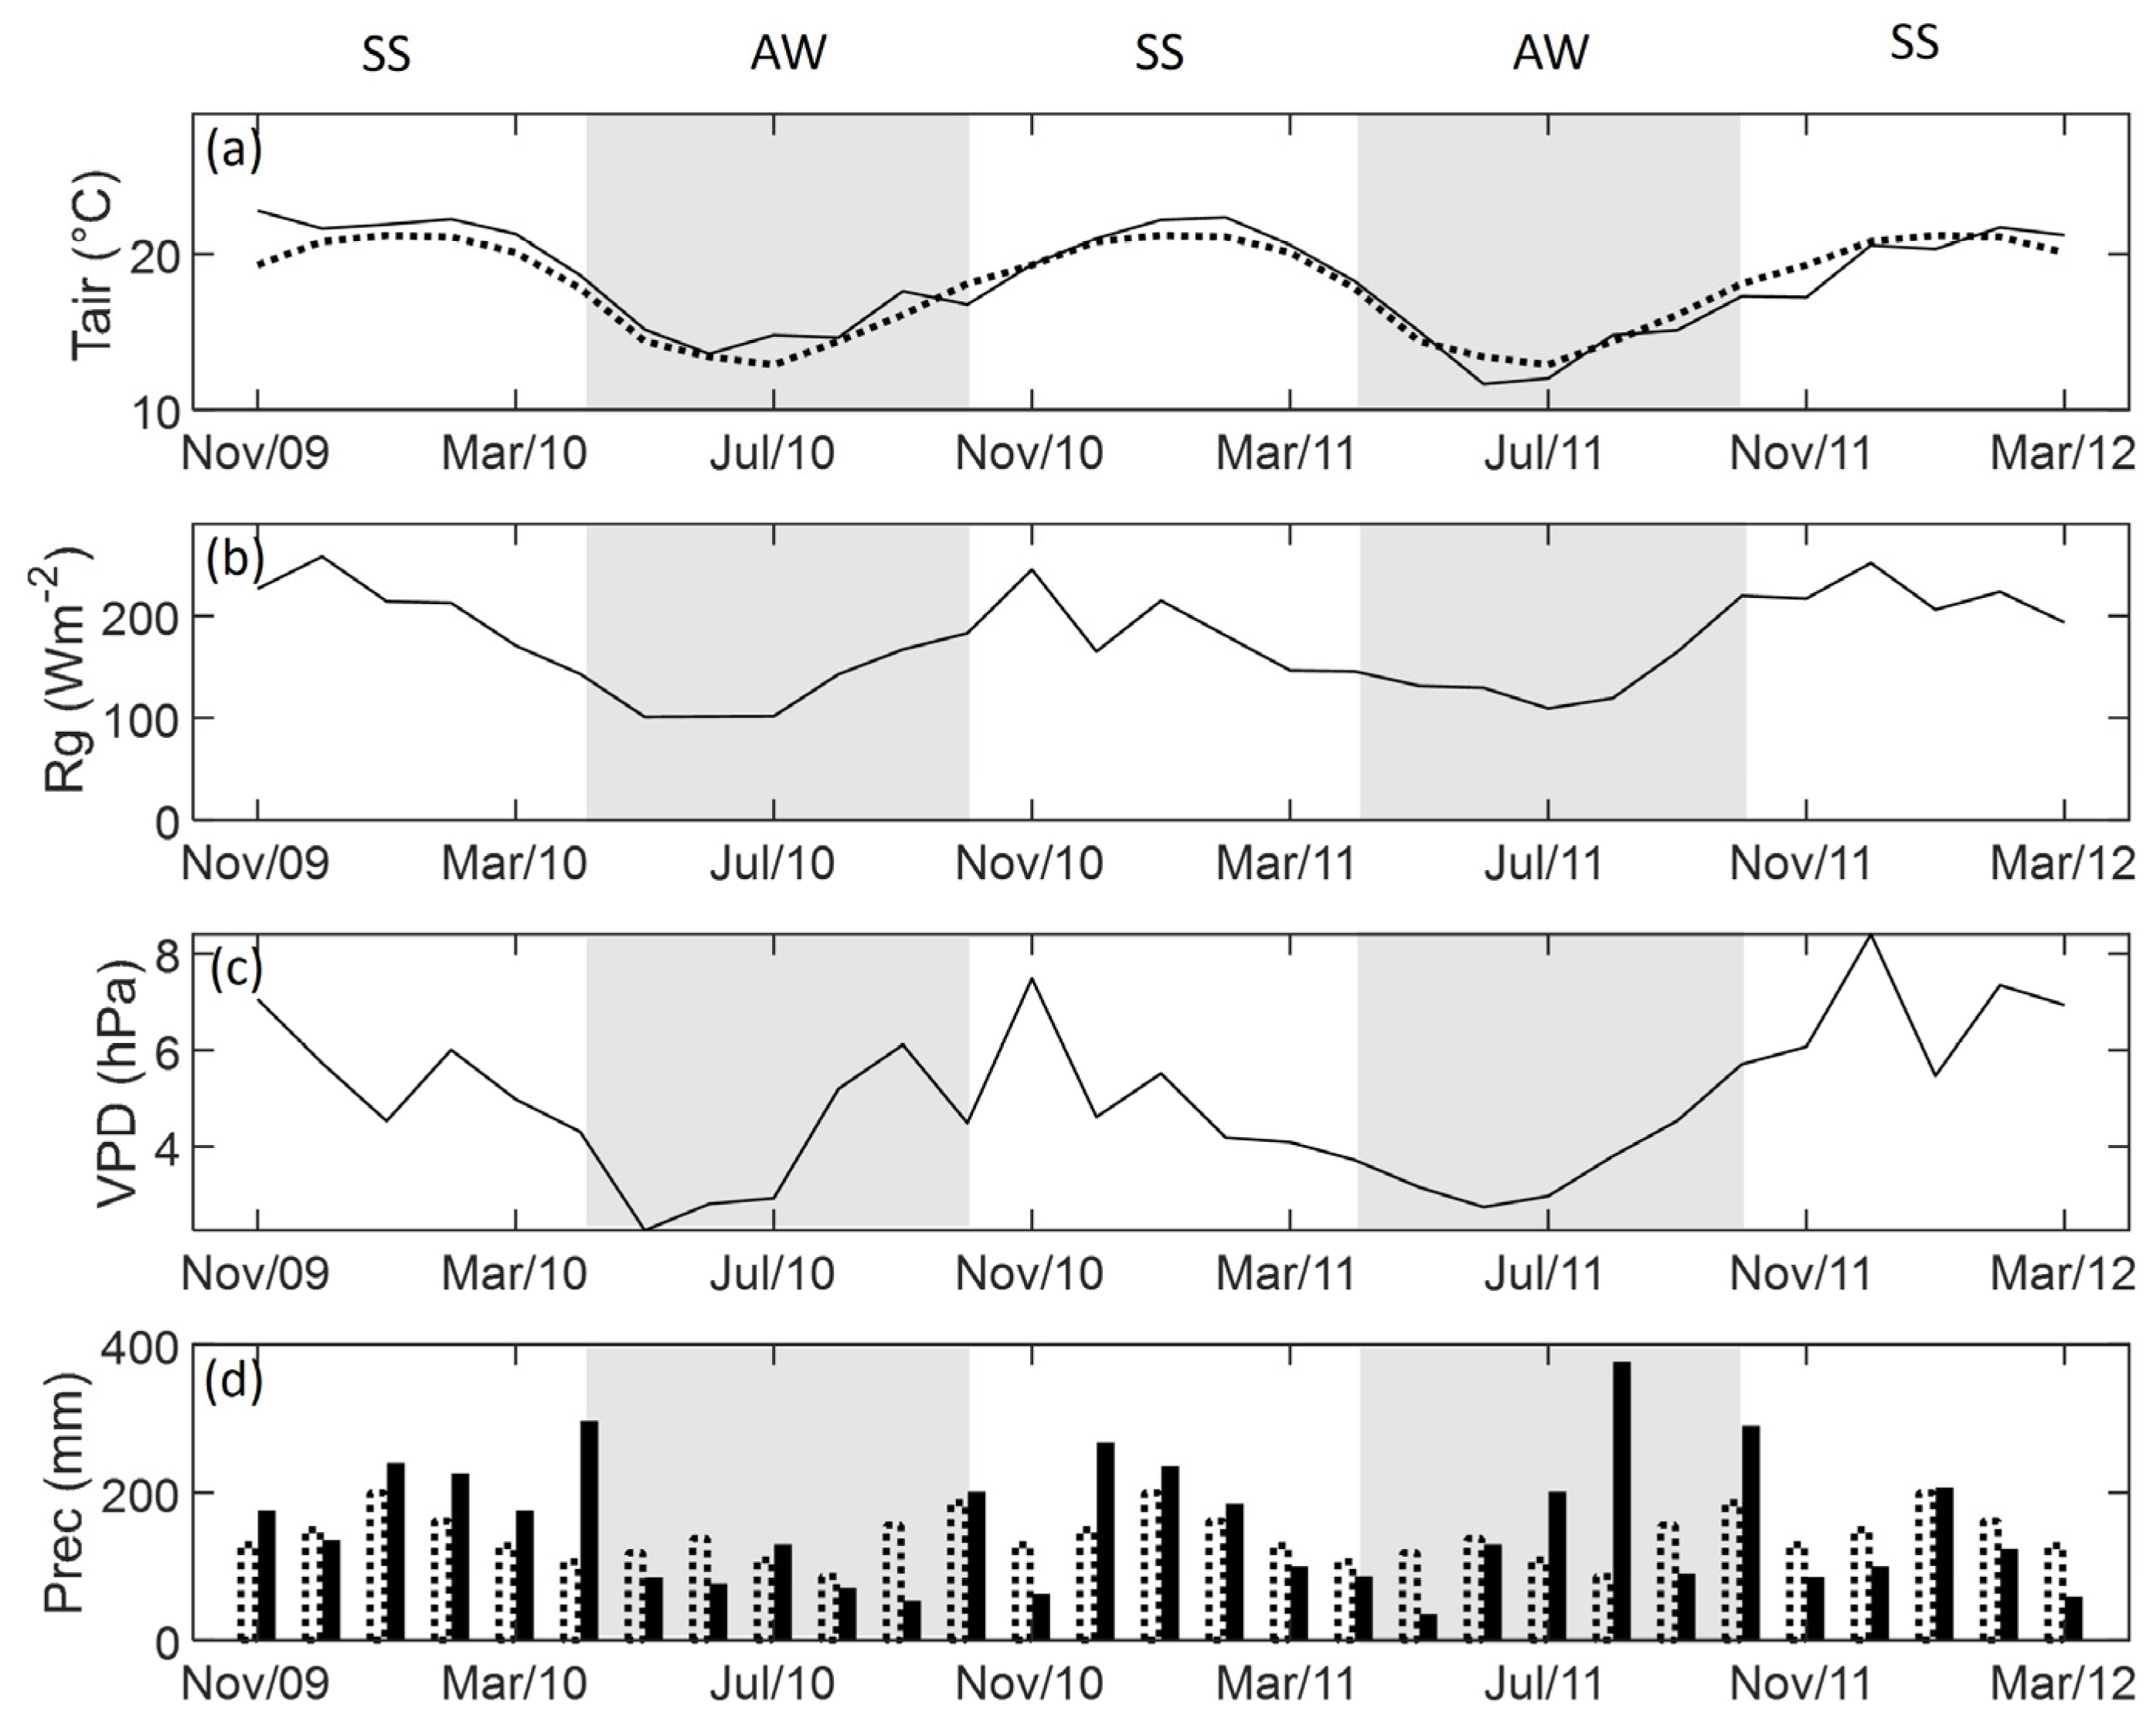
3.1. Weather Conditions
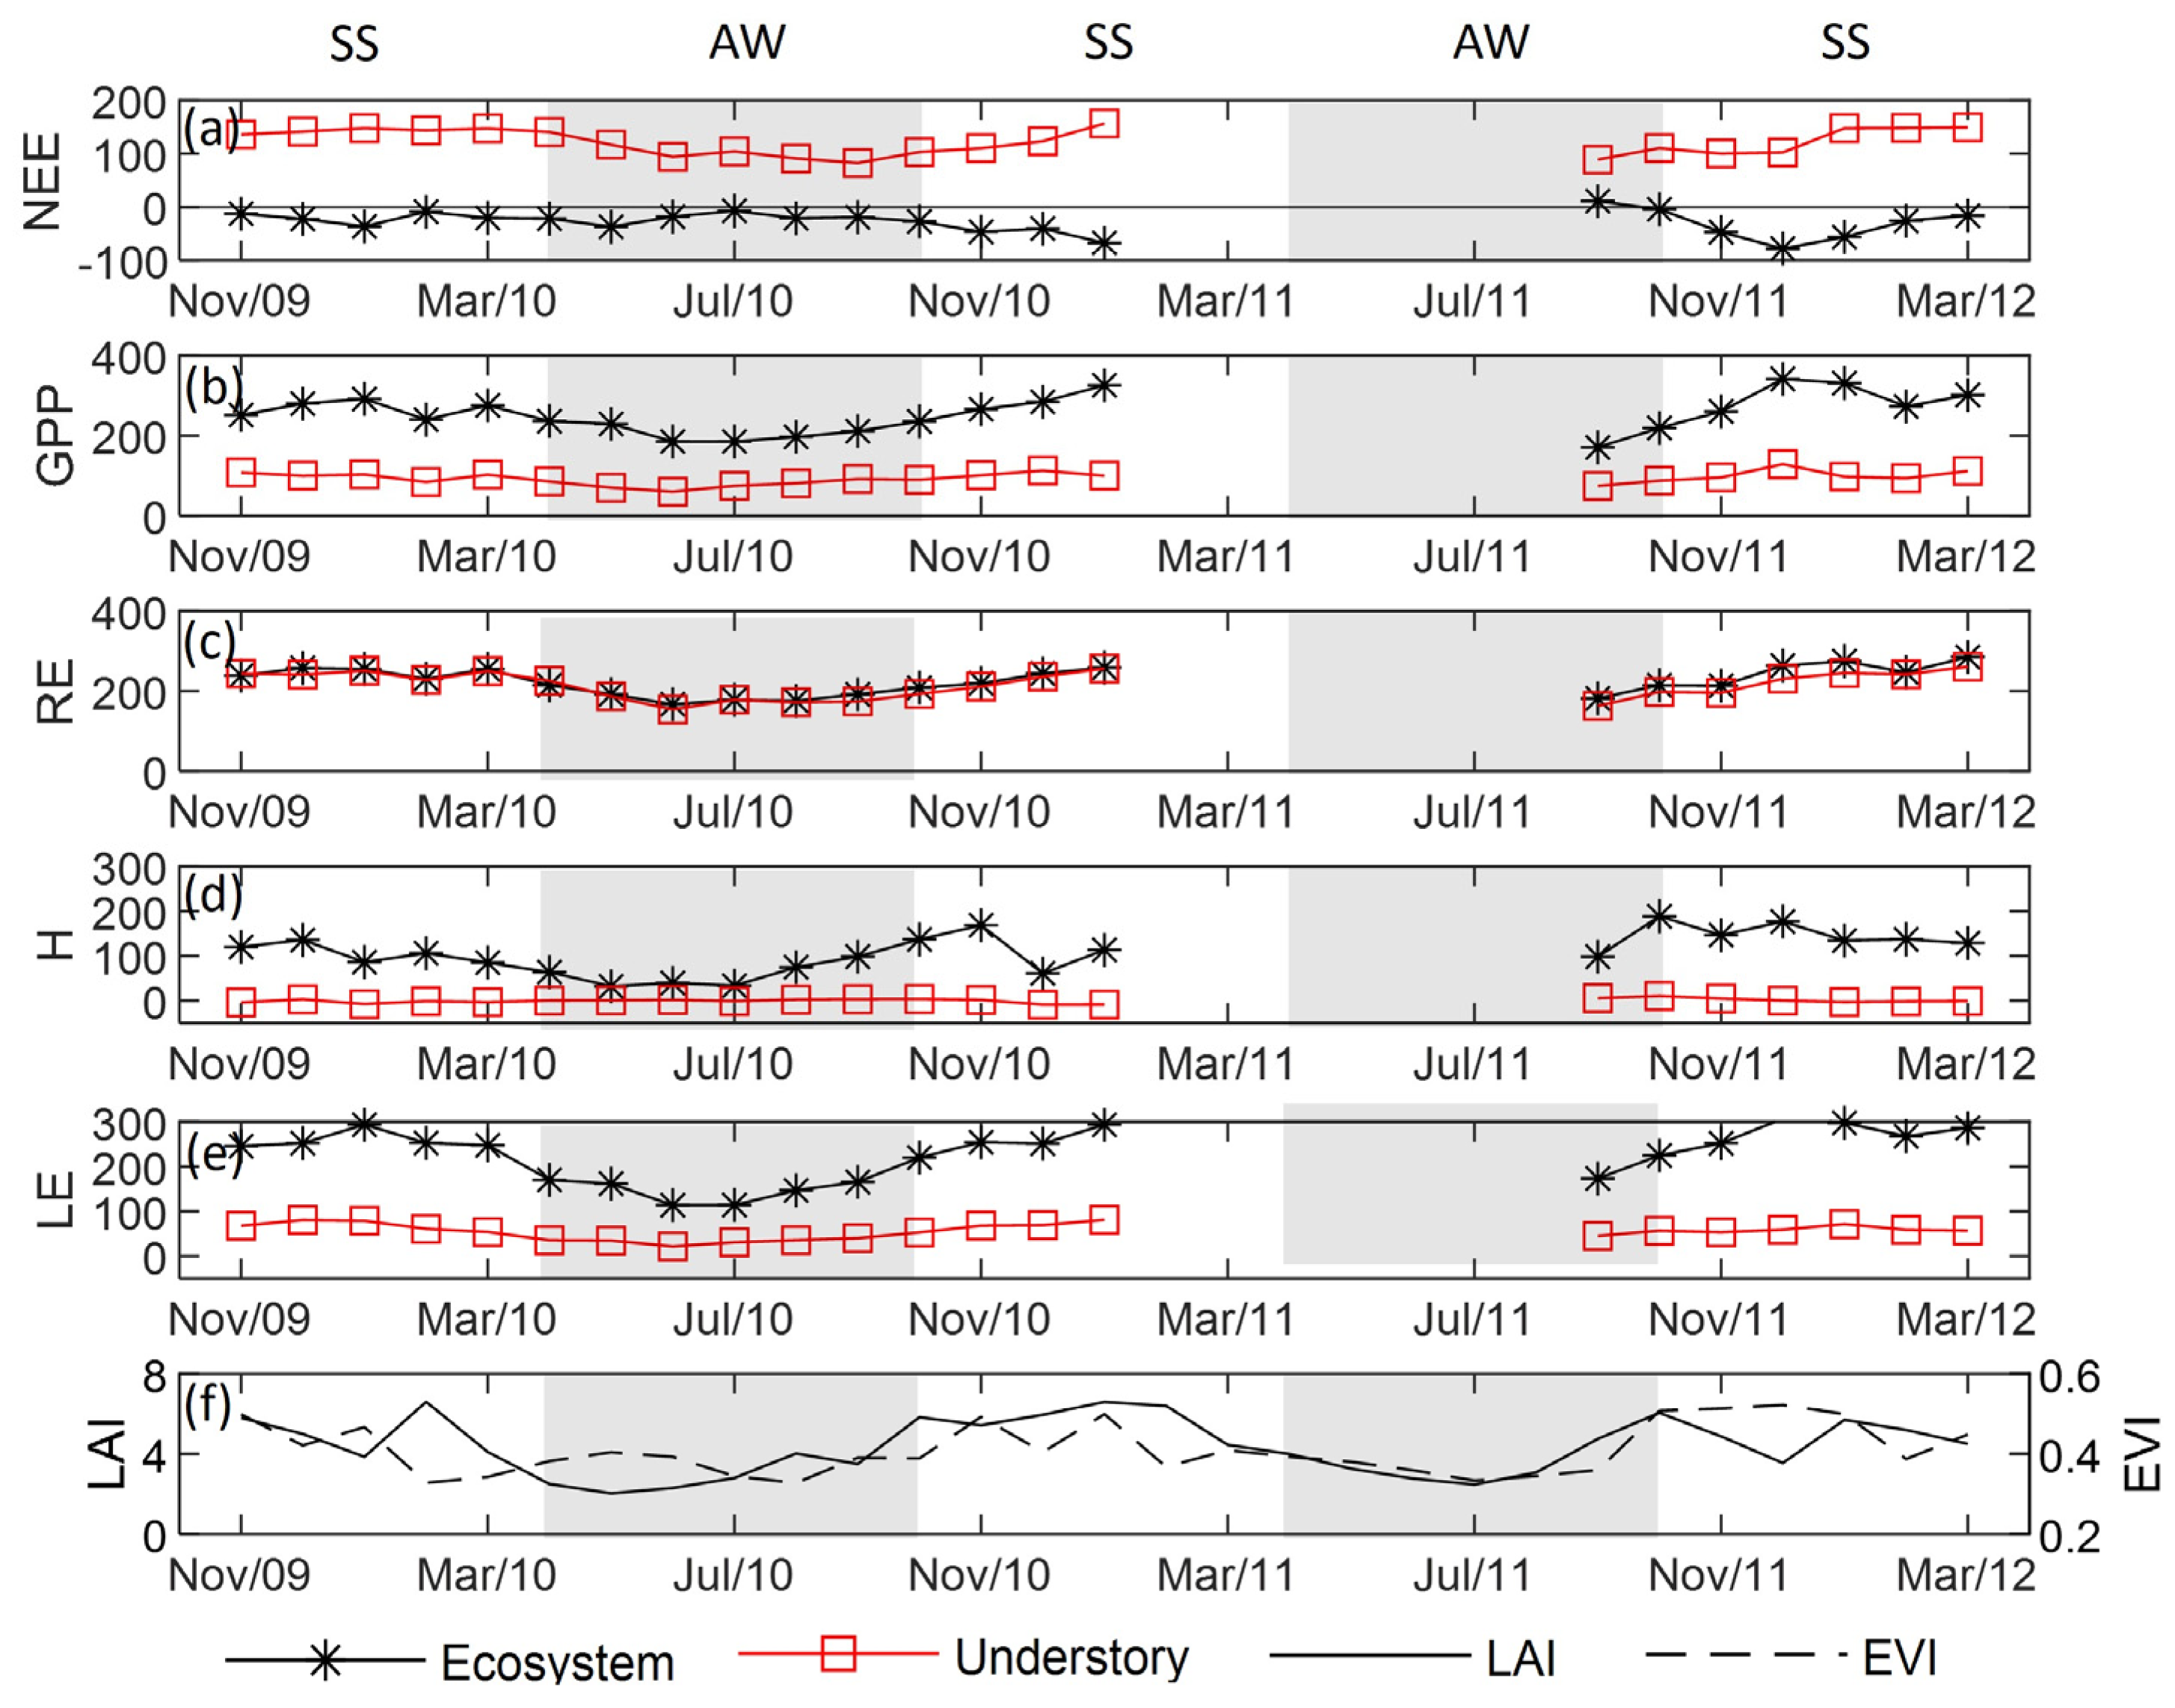
Air temperature (Tair) and global radiation (Rg) displayed typical seasonality for a subtropical climate, as did the VPD (Figure 1). During the study period, the mean Tair in SS was approximately 5 °C higher than in AW, while Rg and VPD were about 75% and 60% higher in SS compared to AW, respectively (see Supplementary Material, Table S1). Air temperature remained slightly above the climatic average until May 2011 and then fell slightly below it. Precipitation patterns were relatively consistent throughout the study period, with annual accumulations of 1864 mm yr−1 and 1833 mm yr−1 in 2010 and 2011, respectively, which were about 10% higher than the climatic normal of 1667.7 mm yr−1. The lowest monthly precipitation occurred in May 2011 with less than 33 mm, whereas the highest was recorded in August 2011, reaching 375 mm. The increased precipitation during SS in 2010 and 2011 led to lower VPD values, whereas the SS of 2012 showed an opposite trend (Figure 1). The leaf area index (LAI) peaked between January and February, reaching approximately 6 m2 m−2, before decreasing to values below 3 m2 m−2 by May. LAI remained low until August, when it started increasing again (Figure 2f).

3.2. CO2 Fluxes

The monthly integrated values of NEE, GPP, and RE are shown in Figure 2, while the seasonal and annual integrated values are presented in Table S1 (Supplementary Material). A positive sign of NEE indicates net CO2 emissions to the atmosphere, while a negative sign denotes CO2 assimilation or uptake by the ecosystem. Generally, the magnitude of NEE, RE, and GPP are larger in SS than in AW. This behavior is more evident in monthly values than in daily values, as shown in Figure 2 and Figure S1 (Supplementary Material), respectively. The ecosystem-level NEE was a carbon sink in all periods and approximately two times greater in SS than in AW. However, the understory NEE acted as a source, with its value in SS nearly 25% greater than in AW. NEE was controlled by GPP in the overstory and by RE in the understory. Annually, GPP in the overstory was 73% higher than in the understory, accounting for 63% of the ecosystem’s total GPP. The Understory RE accounted for 94% of the ecosystem’s total RE. At the ecosystem level, the RE/GPP ratio was higher in AW (0.92) than in SS (0.88), indicating that the Araucaria forest ecosystem emitted less by RE than was absorbed by GPP in SS compared to AW. This pattern led to a greater CO2 absorption in SS than in AW. Generally, the RE/GPP ratio was higher in the understory (RE/GPP ≥ 2.0) than in the overstory (RE/GPP < 0.1) for all analyzed periods.
The annual net ecosystem productivity (NEP = −NEE) was 298.96 g C m−2 yr−1, indicating that the Araucaria site acted as a CO2 sink, considering the annual integration over the ecosystem. During this period, the GPP of the ecosystem was approximately 8% greater than the RE, with GPP at 2898.78 g C m−2 and RE at 2599.83 g C m−2 yr−1. Zeri et al. [47], studying the Amazonian forests in Brazil, found that the annual NEP accumulation was 450 ± 388 g C m−2 yr−1, with GPP of 3413 ± 333 g C m−2 yr−1 and RE of 2963 ± 235 g C m−2 yr−1. Therefore, the Araucaria forest, in our study, absorbed CO2 from the atmosphere at rates similar to those of the Amazonian forest in terms of NEE absorption and partitioning.

3.3. Energy Fluxes

The overstory accounts for the majority of H in the ecosystem (Figure 2d). On average, H exhibited almost 50% of the variation between AW and SS, with greater values in SS (see Supplementary Material, Table S1). The understory presented values close to zero. LE demonstrates pronounced seasonality, with higher values in SS than in AW for the ecosystem (76%), overstory (72%), and understory (87%) (Figure 2e, Table S1). Smaller differences were observed in an evergreen tropical forest in Amazonia, where the dry season presented 40% of the wet season’s values [48]. Consequently, winter and summer had a more significant influence on the LE seasonality in the Araucaria forest compared to the dry and wet periods in the Amazonian forest. In the overstory, LE was approximately three times the values found in the understory. Thus, the overstory makes a higher contribution to the evapotranspiration processes, representing about 75% of the ecosystem’s LE.
Figure 3 represents the evaporative fraction that illustrates the turbulent energy process used for LE. In the ecosystem (n = 32, the position of the measurements), LE constituted, on average, 70% of the total energy (H + LE in n = 32). A slight increase was observed in SS and a decrease in AW. When calculating the evaporative fraction, considering only the energy intercepted by the overstory (n = 32–11), this ratio increased to 55%, indicating a higher utilization of energy in the canopy, predominantly through the transpiration process. It is noteworthy that transpiration in the overstory can account for more than half of the available energy in the system, playing a crucial role in the region’s water and energy balance. Similar findings were observed in different biomes in Brazil: Giambelluca et al. [49], studying the Cerrado biome, noted a high dependence of the evaporative fraction on the LAI, with average values of 60% in Cerrado Dense (LAI = 3.45 m2 m−2) and 49% in Field Cerrado (LAI = 2.01 m2 m−2); Rocha et al. [50] reported a value of 86% for a tropical forest in Amazonia, while Fisher et al. [51] found an average value of 72% across several tropical forest ecosystems.
LE, expressed in terms of ET, corresponded to approximately 60% of the total annual precipitation that occurred in this ecosystem (ET = 1010 mm yr−1; Prec = 1674 mm yr−1). In other forest systems in Brazil, Rocha et al. [50] and Von Randow et al. [52] found values around 60% for the Amazon region, and Cabral et al. [53] found values ranging from 82 to 96% for the relationship between ET and Prec in a eucalyptus plantation.

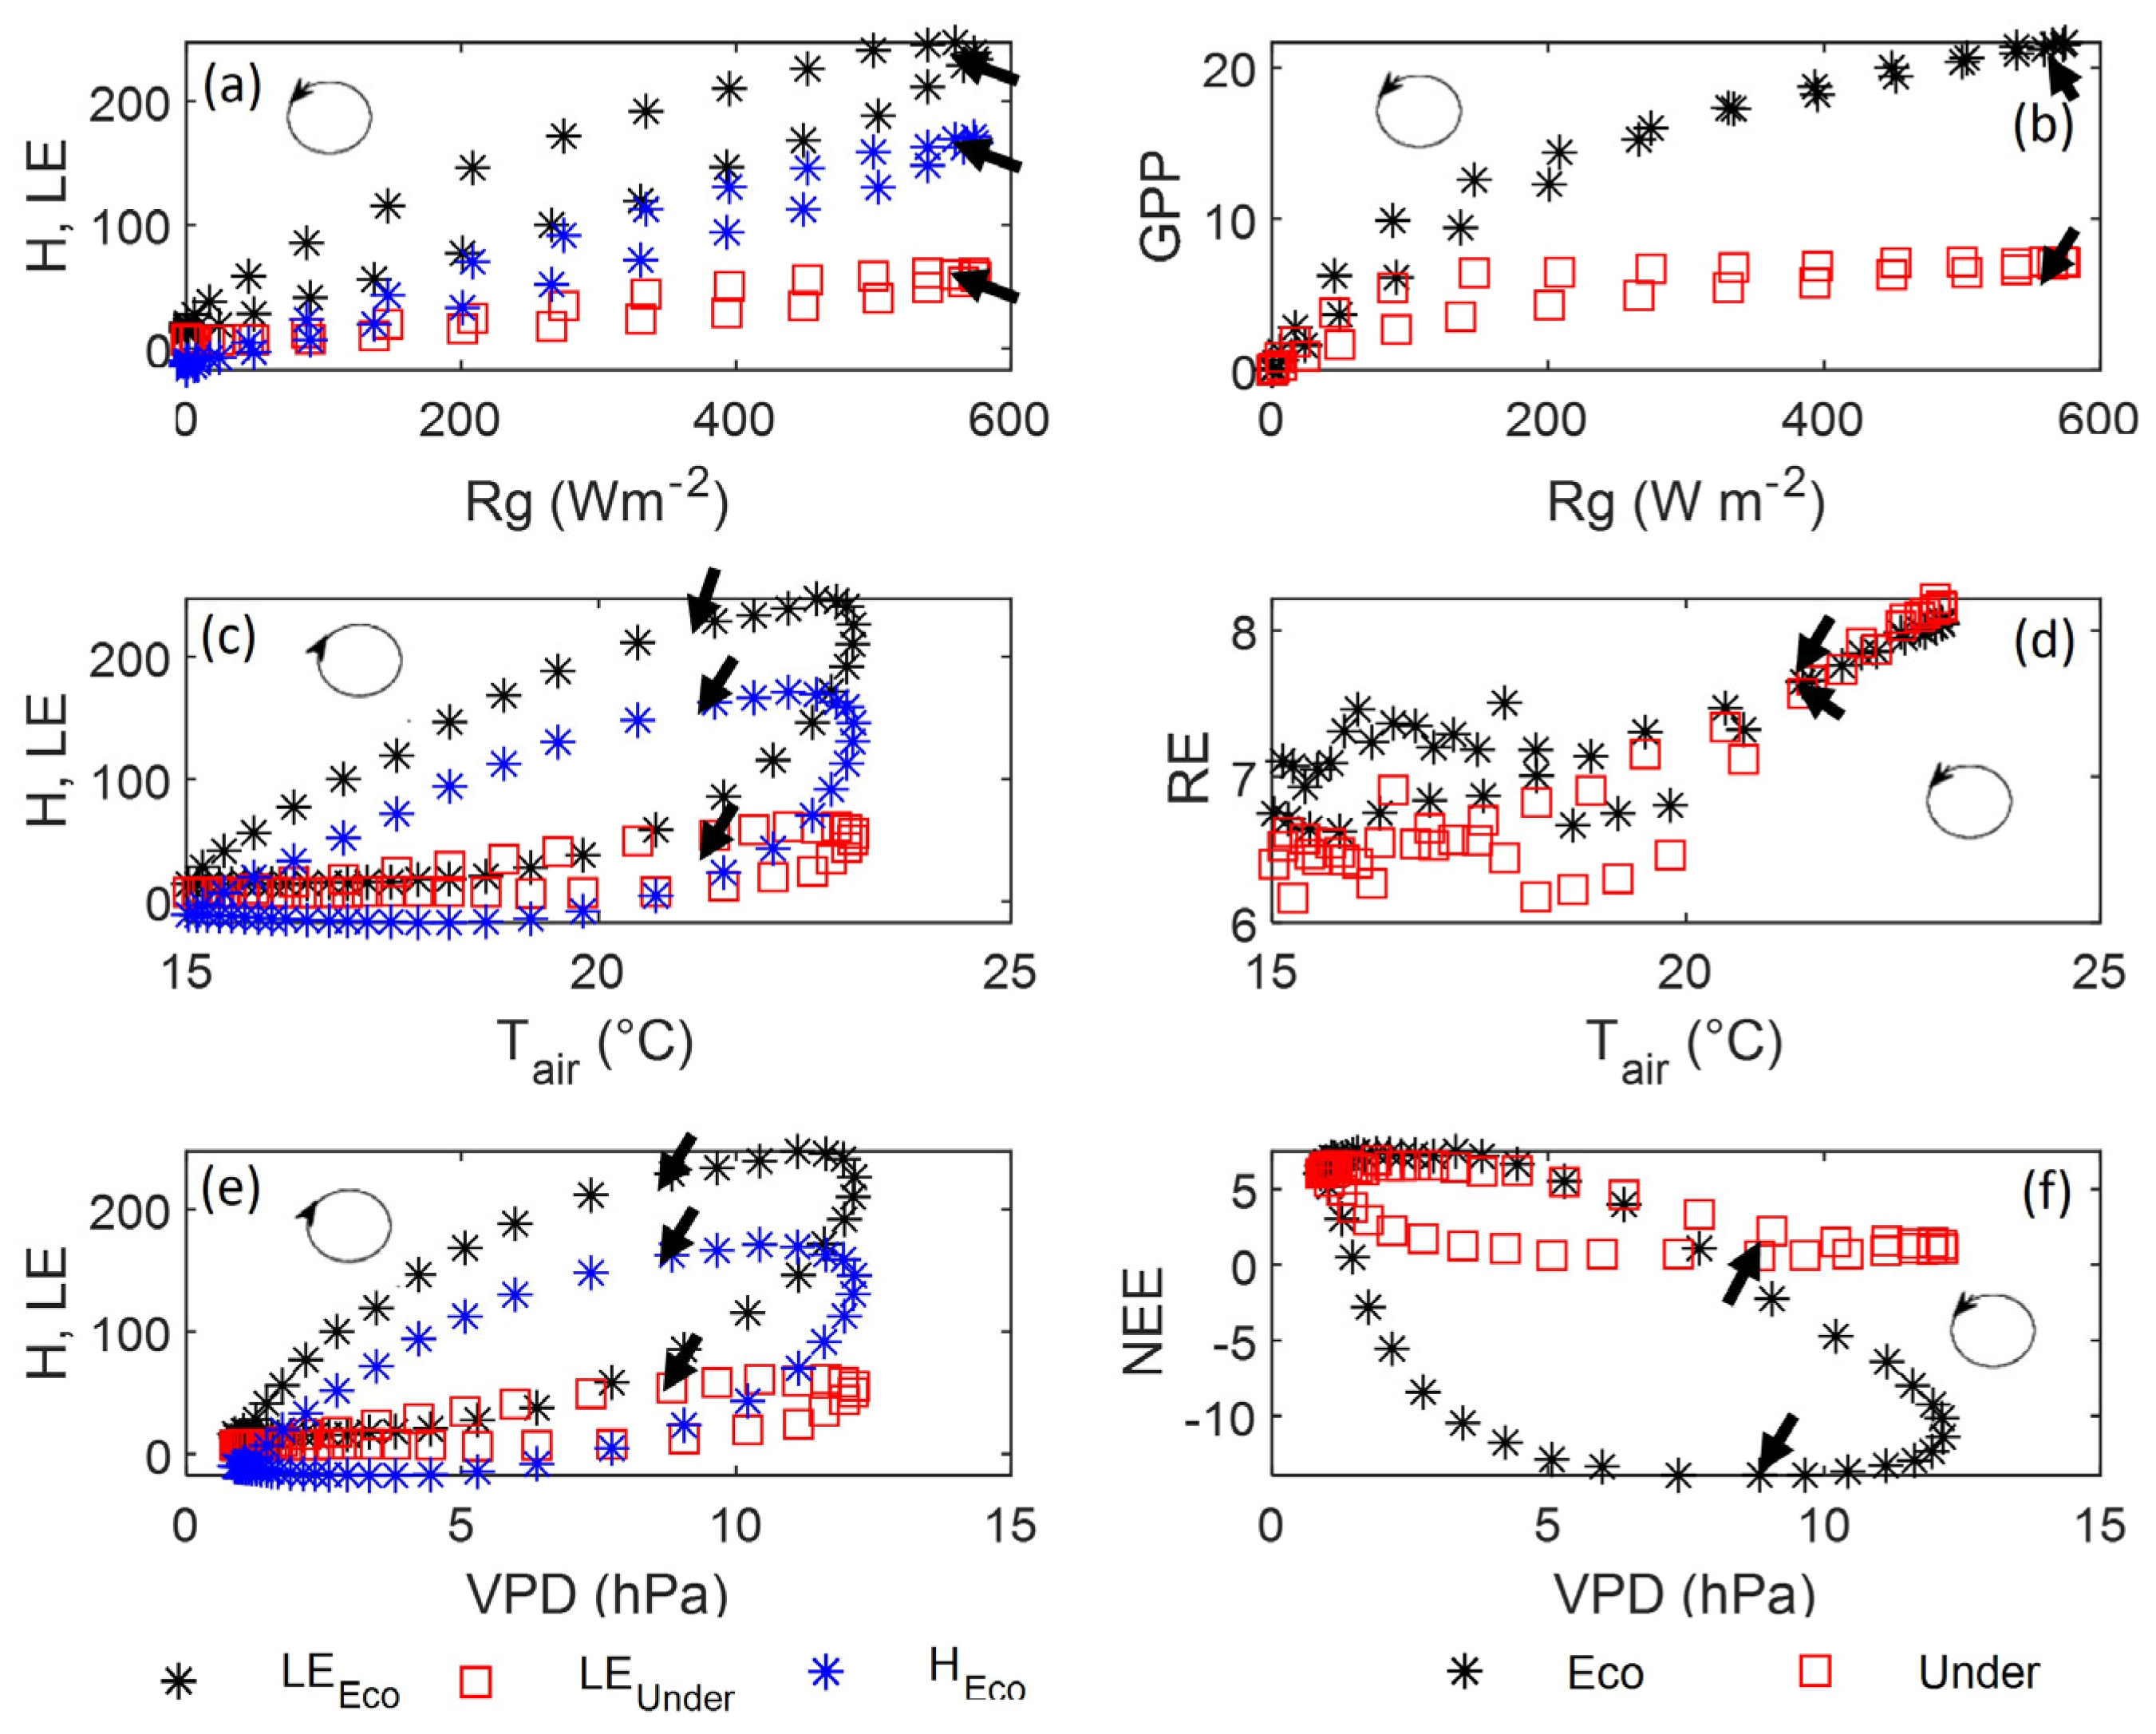
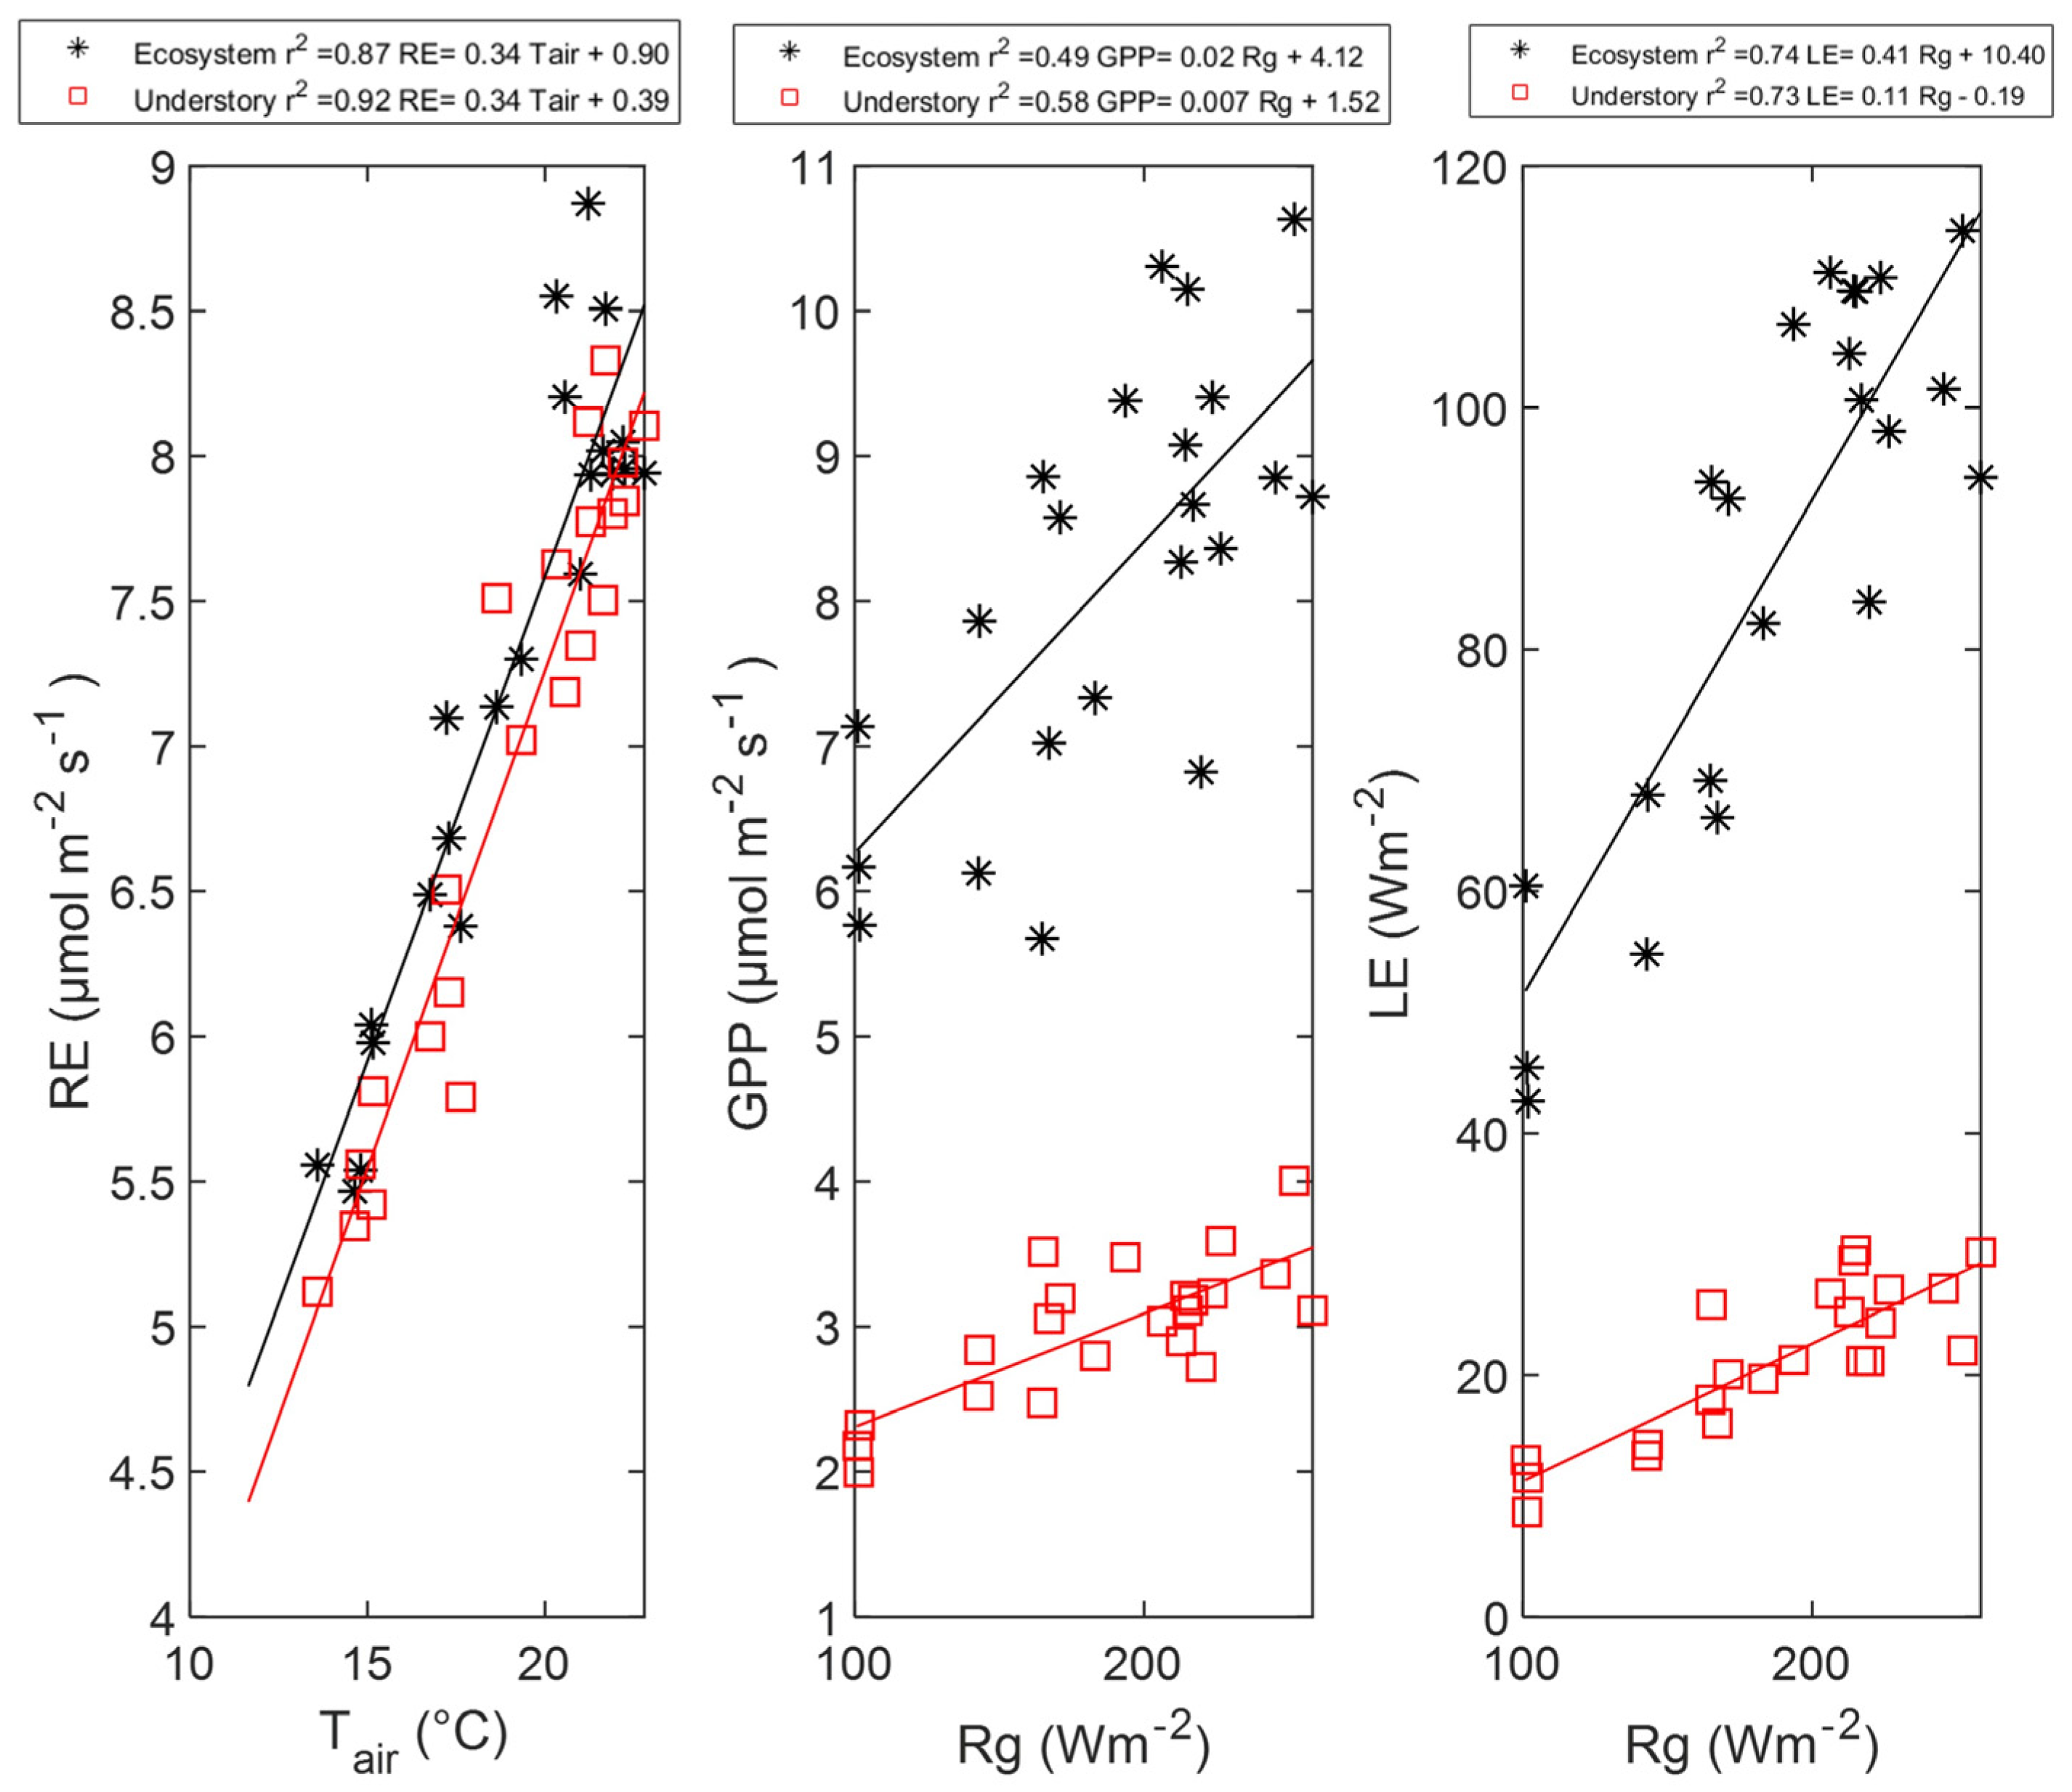
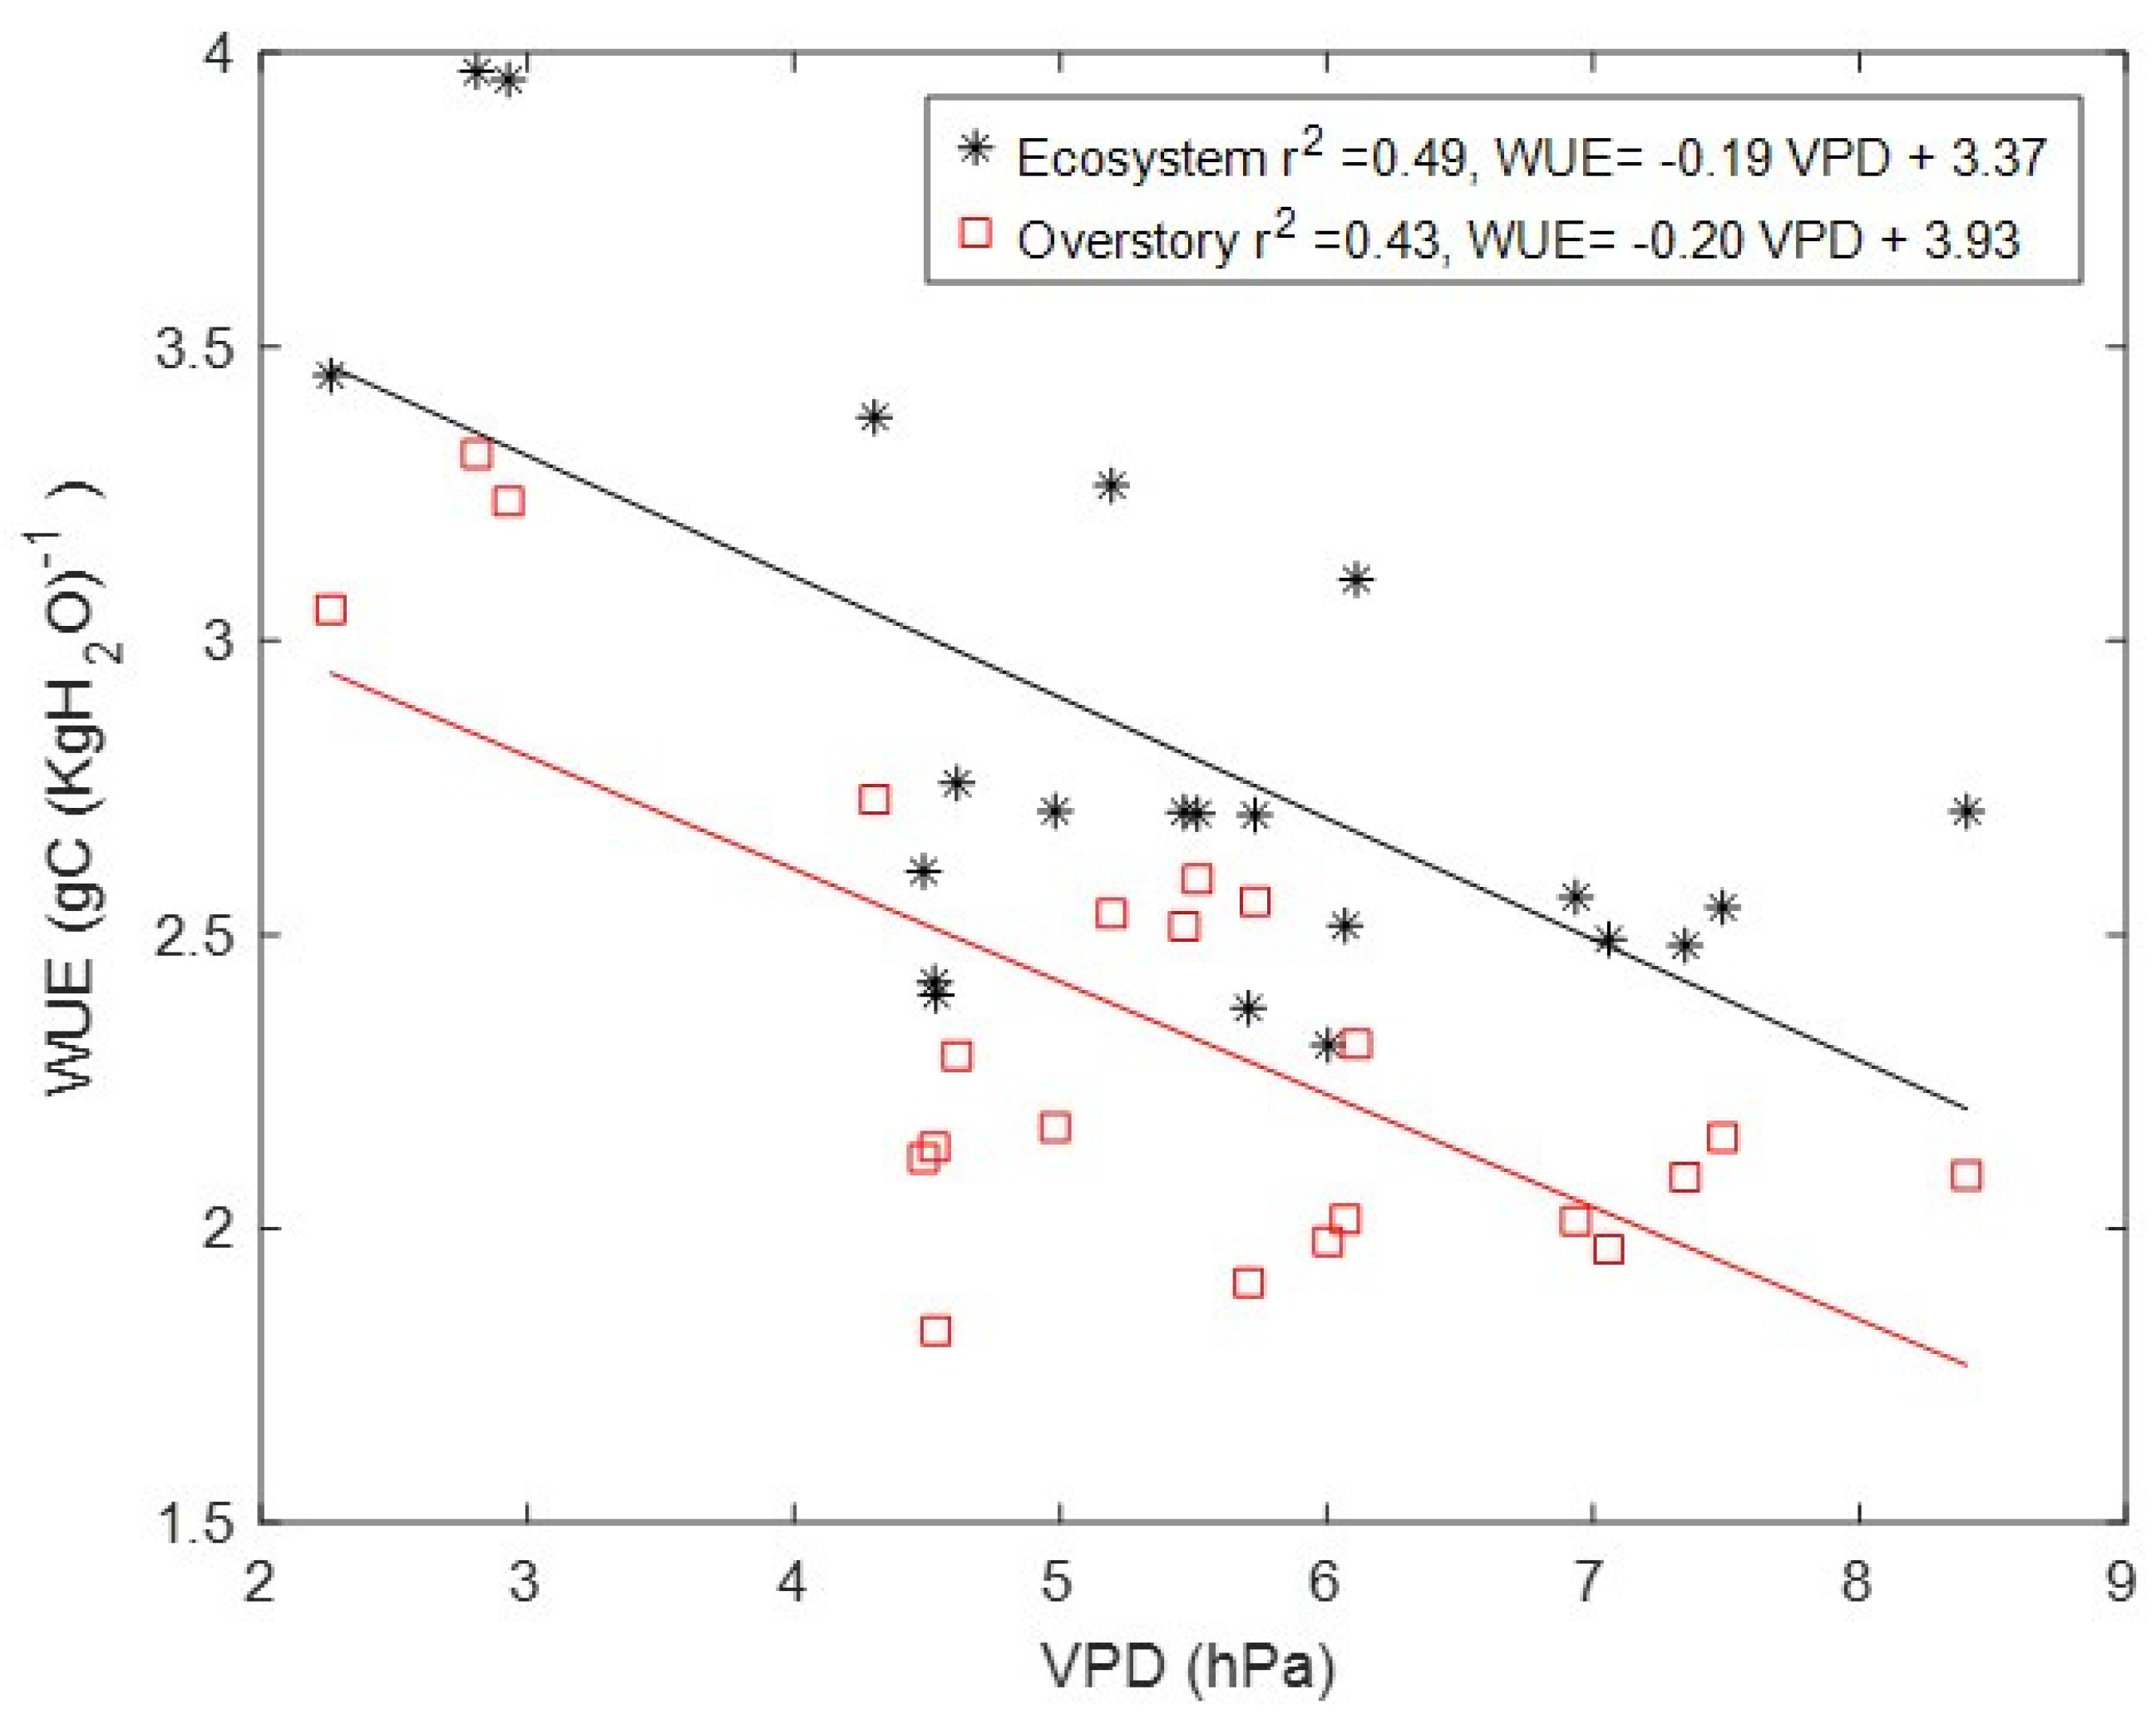
3.4. Drivers of Carbon and Energy Fluxes

The relationship between the fluxes and meteorological variables across different forest strata for average daily cycles is depicted in Figure 4. A strong dependence of the H, LE, and GPP fluxes on Rg can be observed. The energy fluxes in each stratum display a weak hysteretic character with Rg, although this is not observed in GPP. Due to the minimal contribution of the lower stratum to H, it was excluded from this analysis.
The relationships between energy fluxes and atmospheric variables such as Tair and VPD across different strata are depicted in Figure 4c,e, respectively. In these relationships, hysteresis curves are observed. In all cases, the direction of the loops is clockwise, reflecting the distinct characteristics between the fluxes and atmospheric conditions throughout the day, which result in a lag between their cycles. Considering the relationship between energy fluxes and atmospheric variables as linear, the angular coefficient in the morning period is lower than in the afternoon period. A similar response occurs around noon; at this point, while the fluxes have already reached their maximum values and are beginning to decrease, the atmospheric variables (Tair and VPD) have not yet peaked.
Many studies have shown that the energy and mass fluxes over different types of forests are highly dependent on their LAI and incident solar radiation, making the overstory stratum more representative [14,21,23,24,25]. Generally, the lower amount of incident solar radiation reaching the forest’s interior suppresses some processes in the understory stratum, like GPP [13]. This is evident in Figure 4b, where the overstory GPP displays greater amplitude in daytime values than understory GPP. In both strata, GPP shows a hyperbolic response to solar radiation, as suggested by results obtained in previous studies [45,54,55,56]. However, after reaching its maximum value, the understory GPP remains constant, even with variations in global radiation. This relationship can be explained by the intermittent character of turbulence within the canopy, as described by Oliveira et al. [31]. This intermittency makes it challenging to accurately describe the daily cycle in this stratum, even in average terms, due storage decoupling between strata. Since CO2 fluxes are more sensitive to this condition than energy fluxes, this pattern is not observed in energy fluxes [31].
Although the RE in both strata is directly related to air temperature, the response in the understory is more noticeable than in the overstory, suggesting that soil respiration plays a fundamental role in controlling RE within the forest (Figure 4d). Thus, soil temperature may be the most suitable parameter for studying the temperature–response respiration curve for the Understory. Lasslop et al. [57] suggested conducting a local analysis to determine whether air or soil temperature better characterizes the nocturnal period, as indicated by Equation (3). In this work, soil temperature was not measured.
The relationship between NEE and VPD (Figure 4f) displays a counterclockwise hysteresis curve in both layers, which is more pronounced in the overstory. In the understory, NEE is positive throughout the day, indicating it is a CO2 source, with higher values occurring when VPD is lower. Conversely, the overstory acts as a CO2 source at night and a sink during the day when VPD values are higher.
Rg has the greatest influence on energy flux on a daily cycle scale. Air temperature and VPD also show a time lag with Rg. Therefore, solar radiation is the determining variable in the structure of hysteresis in the relationships among these variables. The hysteresis pattern between the fluxes and weather conditions described above has been similarly documented by several authors [56,58,59].
On a monthly average, the r2 between GPP, RE, and LE with meteorological variables (Tair, Rg, and VPD) and biophysical parameters (LAI and EVI) varies across strata. For the ecosystem level, Tair shows a strong correlation with RE (r2 = 0.87) and GPP (r2 = 0.67), while Rg has an r2 of 0.74 with both LE and GPP. VPD exhibits a lower r2, with 0.53 for LE and 0.38 for GPP. In the understory, Tair is highly correlated with RE (r2 = 0.92) and LE (r2 = 0.72), and VPD shows a notable correlation with GPP (r2 = 0.68). Biophysical parameters like EVI and LAI have lower r2 values, generally below 0.5, indicating a weaker relationship with the fluxes (see Supplementary Material Table S2).
The relationship between the monthly RE and Tair for the understory showed a similar slope to that in the overstory (Figure 5). For GPP and LE versus Rg, a greater slope is presented for the ecosystem.

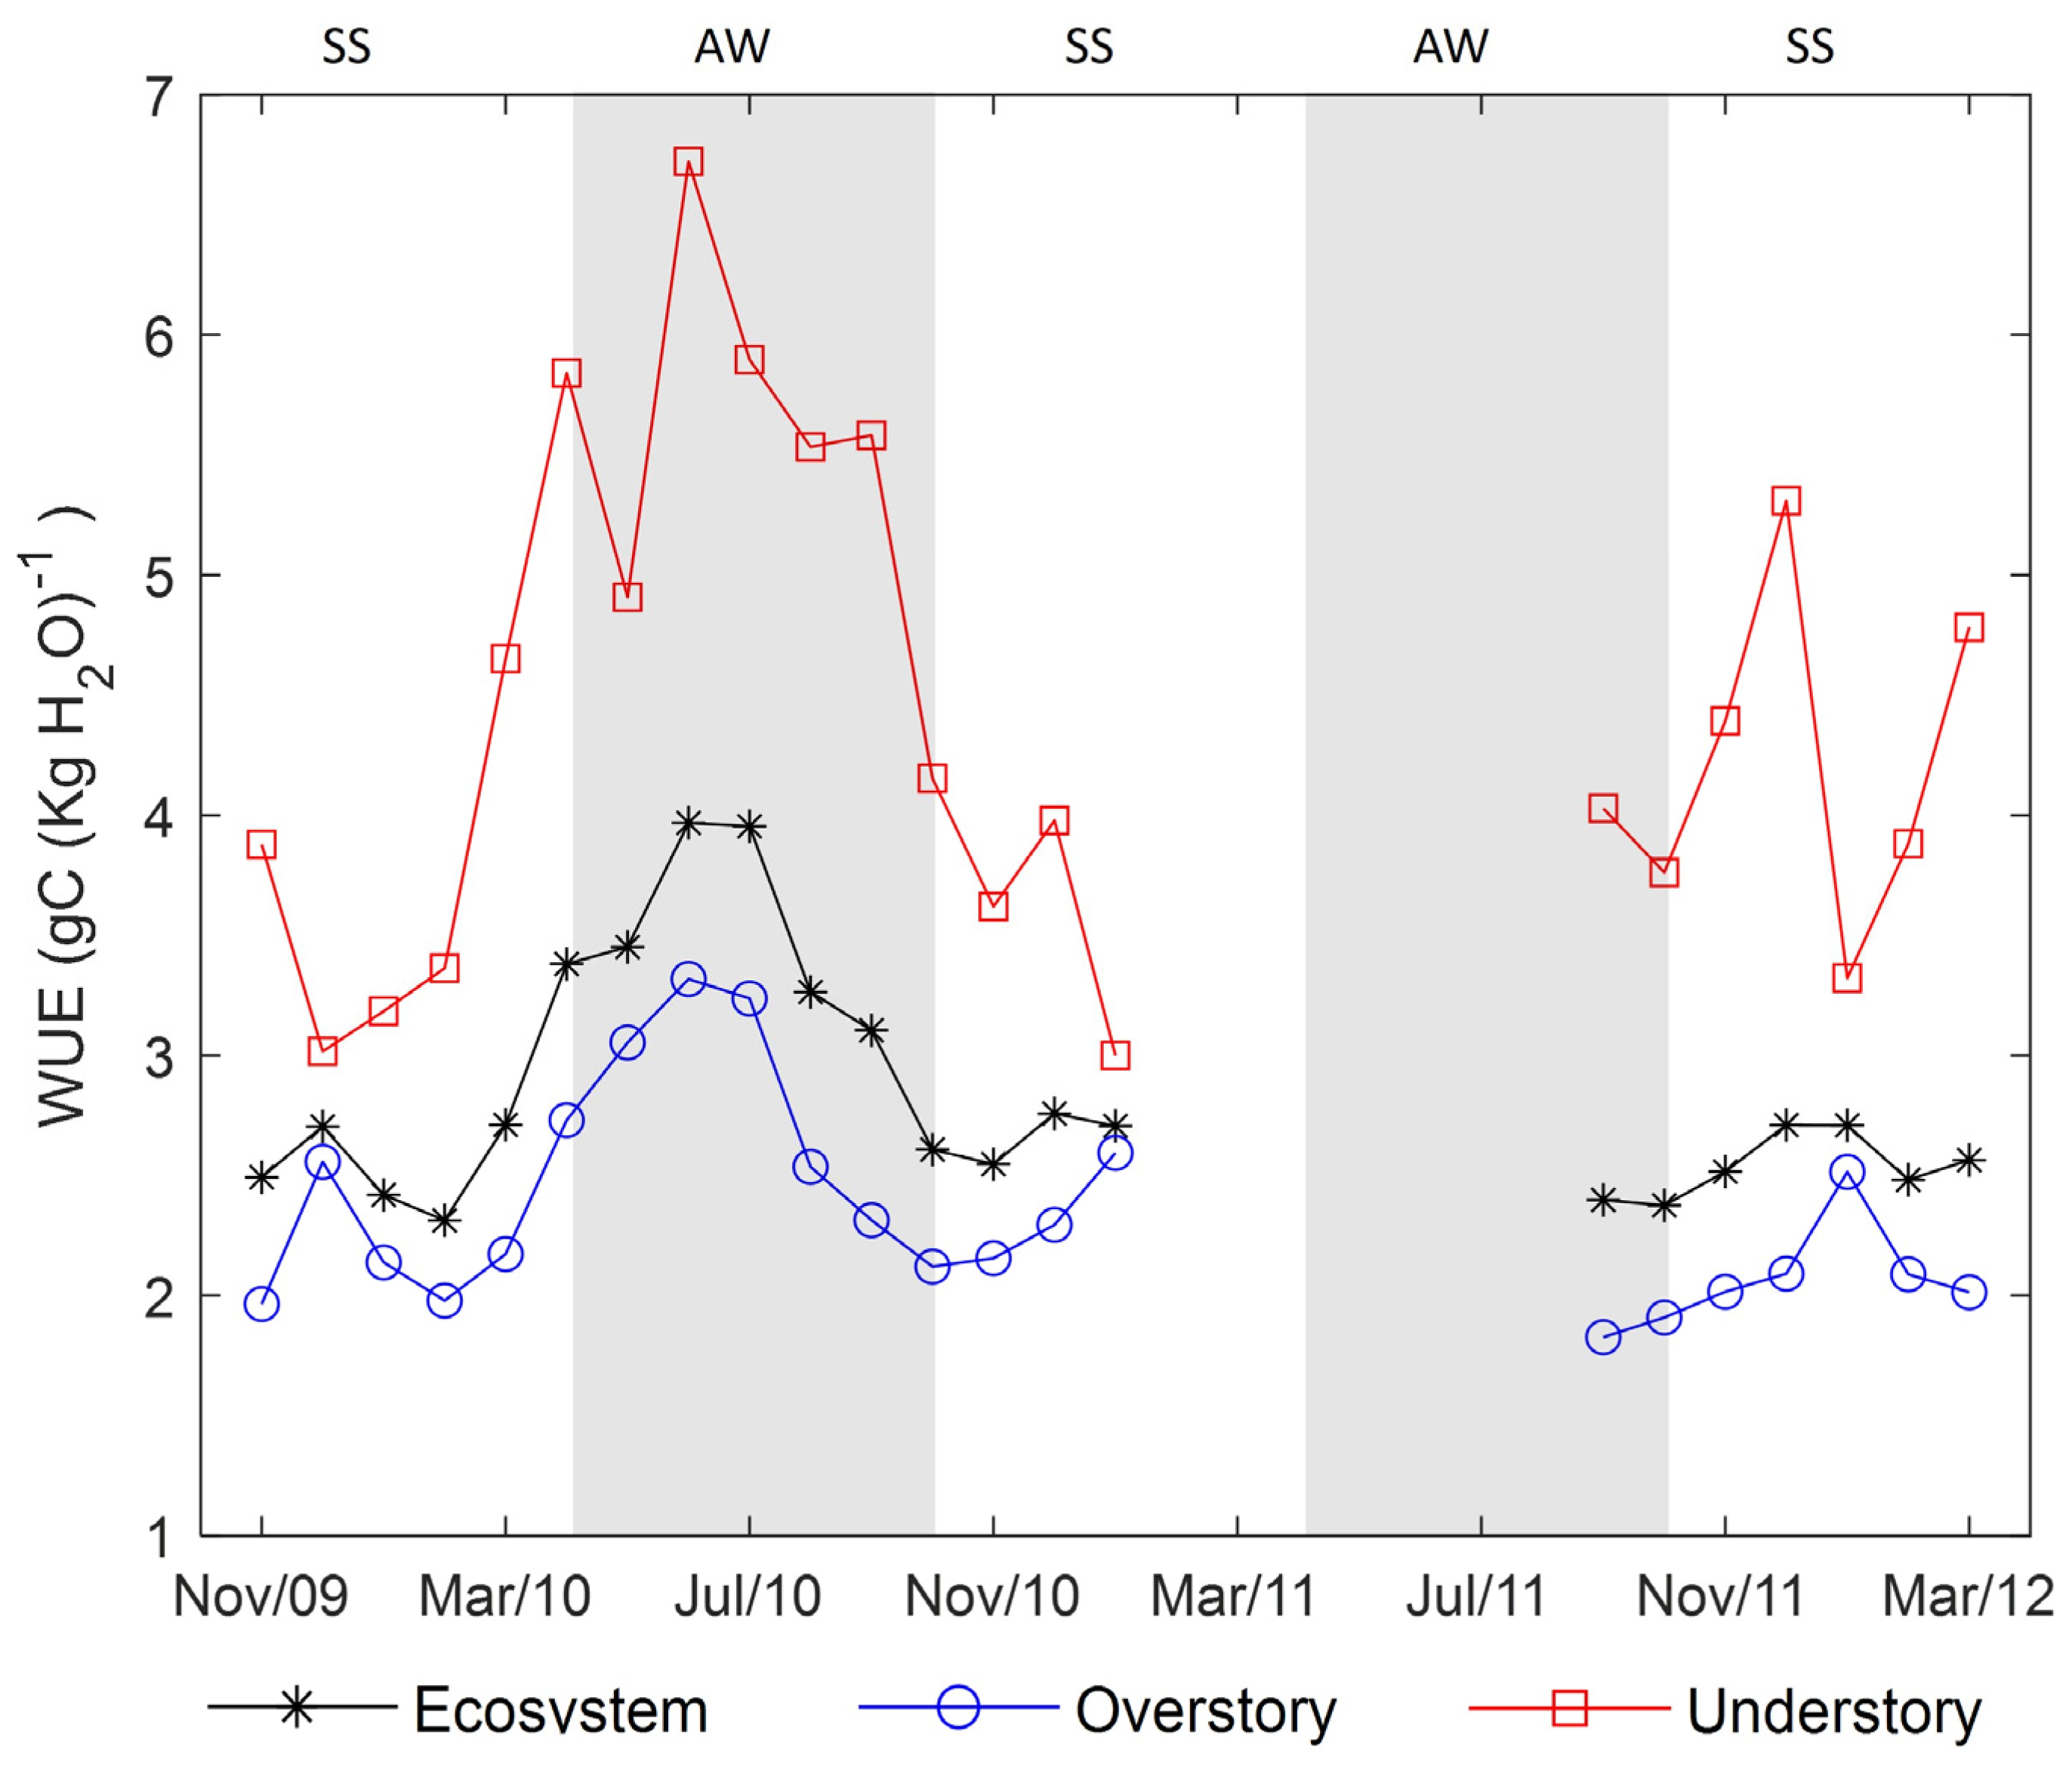
3.5. Water-Use Efficiency (WUE)

It is possible to estimate how much water is lost to each assimilated carbon molecule by relating CO2 and H2O fluxes through the water-use efficiency (WUE = GPP/ET) [60] (Figure 6). The annual value of WUE was 2.85 g C kgH2O−1. Higher values of WUE were found in the understory. Generally, AW presents greater values than SS across all levels (Supplementary Material Table S1, Figure 6). These results are likely due to the lower VPD in the AW period, as illustrated by the relationship between WUE and VPD (Figure 7).
Figure 7 illustrates the relationship between WUE and VPD. There is a noticeable reduction in WUE as VPD increases in the overstory and the ecosystem, with the overstory being more sensitive to this condition, i.e., exhibiting a steeper slope. This behavior of reducing WUE with increasing VPD was also observed in studies such as that of Sulman et al. [25] and Mahrt and Vickers [61] across different forest ecosystems. This pattern explains the seasonal variability of WUE values, which is greater in AW.

4. Discussion

The underrepresentation of Southern Hemisphere ecosystems in global flux databases limits the accuracy of Earth system models and hampers a full understanding of biosphere–atmosphere interactions [62,63]. This study contributes unique flux data from the Araucaria forest, a structurally complex and endangered subtropical forest, improving the global representation of this biome in flux synthesis studies. Our findings demonstrate the feasibility and value of partitioning fluxes between forest strata in such ecosystems despite methodological challenges. The application of eddy covariance at both the overstory and understory levels required rigorous quality control due to lower wind speeds and more stable atmospheric conditions below the canopy, which can reduce turbulence and compromise data quality [64,65]. Still, with appropriate corrections and validation, the measurements captured meaningful patterns in vertical flux contributions. We also acknowledge the smaller footprint and higher heterogeneity of the understory fluxes, which are influenced by local vegetation structure and soil characteristics. These factors introduce variability that must be carefully considered when interpreting the energy and carbon dynamics of multi-layered forests such as this one. By quantifying the relative contributions and seasonality of each stratum, this work offers critical insights for improving ecosystem modeling and informing conservation strategies in the Atlantic Forest biome.
Despite the methodological constraints, it was clearly demonstrated that the forest exhibits distinct seasonality in its energy and CO2 fluxes, which is typical of subtropical climates, with higher values observed during the spring–summer (SS) than in autumn–winter (AW). The overstory, comprising nearly 90% of the ecosystem’s biomass, showed the most seasonal variations. This dominance is reflected in its contribution of 63% to the GPP and 75% to the LE of the entire ecosystem. The parallelism in GPP and LE contributions is anticipated, as the process of CO2 uptake via stomatal photosynthesis inherently involves water release through transpiration [66]. However, the disproportionately higher LE relative to GPP suggests that significant energy consumption in the overstory is channeled into evaporation of intercepted precipitation rather than directly into biomass production. While similar processes are expected to occur in the understory, which accounts for 25% of the Ecosystem’s LE, a lack of detailed data limits our ability to fully characterize these contributions at the lower strata.
In the Araucaria forest site, the highest GPP values were observed in the overstory, where the majority of available energy for photosynthesis is intercepted by the tall trees that dominate the canopy. This significant capture of solar radiation by the canopy explains why the overstory is primarily responsible for the bulk of biomass productivity at this site. Previous studies by Alton et al. [67] and Kuglitsch et al. [68] have highlighted that in forest ecosystems where water stress is not a limiting factor, GPP is predominantly influenced by the leaf area index (LAI) and global radiation. At our site, however, despite the lack of marked seasonal variations, GPP is primarily driven by air temperature, as indicated in both the overstory and understory (see Supplementary Material Table S2). This suggests a unique adaptation of the forest’s photosynthetic processes to the local climate, underlining the importance of air temperature in modulating biological activity across different strata.
In the Araucaria forest analyzed in this study, the distribution of respiration between the overstory and understory is notably disproportionate, illuminating unique aspects of forest ecosystem dynamics. The Understory is responsible for a striking 94% of the ecosystem’s total respiration; this is in stark contrast to the overstory, which accounts for only 6%. This disparity is not merely a reflection of biomass presence but indicates complex metabolic processes that drive the forest’s carbon cycling. In the understory, the ratio of RE to GPP consistently exceeds 1 (RE/GPP = 2.34 in AW and 2.30 in SS), suggesting substantial contributions from non-photosynthetic respiration. This includes autotrophic respiration from understory vegetation and tree roots, alongside heterotrophic respiration from soil microorganisms that decompose organic matter [69]. The findings underscore the role of soil and microbial activity, which, as suggested by Martínez-García et al. [70], demonstrate that the balance of autotrophic and heterotrophic respiration can vary widely, primarily influenced by the dynamics of autotrophic elements within the ecosystem. These insights into the respiration patterns provide a deeper understanding of the ecological processes that regulate carbon fluxes in this Araucaria forest site, highlighting the critical role of the understory in the forest’s overall carbon economy.
Based on the analysis of the annual pattern derived from the available time series at the study site, we demonstrate that the Araucaria forest can acts as a significant carbon sink (with a net carbon sequestration of 298.96 g C m−2 yr−1) while also accounting for approximately 60% of the annual precipitation through ET. These results highlight the forest’s critical role in regional carbon and water cycles, underscoring the importance of protecting such ecosystems against deforestation. The carbon storage and sequestration capabilities of the Araucaria forest are comparable to those reported for the Amazon forest, emphasizing its global ecological significance [47,71,72]. The observed climatic conditions during the study period were reflective of the regional climatic averages, suggesting that the findings likely depict normal ecosystem behaviors. Nevertheless, the potential impacts of climatic anomalies, such as drier or wetter years, on these atmospheric exchange processes are crucial areas for further investigation. Understanding these dynamics is essential for enhancing predictive models of ecosystem responses to changing climatic conditions and for developing informed conservation strategies that ensure the sustainability of these vital ecological functions.
Our results also indicates notable efficiency of the Araucaria forest in the use of water for carbon assimilation, absorbing, on average, 2.85 g C kgH2O−1 annually. However, we again stress that this result represents a particular period and should be interpreted as characteristic of the site under typical conditions and not as representative of longer-term trends or variability. Even so, this rate of water-use efficiency surpasses that observed in similar latitudinal needle leaf forests in the northern hemisphere, where average values are typically around 2.75 g C kgH2O−1 [73]. Furthermore, mixed forests exhibit WUE ranging from 2 and 2.75 g C kgH2O−1, while the Amazon forest in Brazil shows values between 2.5 and 3.5 g C kgH2O−1 [47]. These comparisons highlight the Araucaria forest’s superior capability in carbon–water balance, which is critical for its ecological sustainability and resilience. However, this delicate balance is threatened by ongoing changes in land use and land cover in the MOF region, where forested areas are increasingly being converted to agricultural lands. Such transitions typically result in lower WUEs, often below 2 g C kg H2O−1 in agricultural systems [74,75]. This reduction in WUE can significantly alter the regional water and carbon cycles, exacerbating climate change impacts and reducing biodiversity. Thus, preserving the Araucaria forest and its efficient water use is essential not only for maintaining regional ecological balance but also for ensuring global environmental stability.

5. Conclusions

This study utilized a time series of eddy covariance data to elucidate the dynamics of energy and carbon fluxes at the ecosystem, overstory and understory levels within an Araucaria forest site in southern Brazil. Our analysis revealed that the Araucaria forest can act as a significant carbon sink, where the specific site absorbed, on average, 298.96 g C m−2 yr−1, with greater CO2 absorption occurring during the SS seasons compared to AW. The overstory is identified as the primary contributor to this process, accounting for 63% of the total ecosystem’s GPP, while the understory, despite being a smaller component, is responsible for 94% of ecosystem’s total respiration.
The study also highlights that the majority of energy fluxes, including H and LE, are driven by the overstory. The overstory contributed to 75% of the total LE of the ecosystem, emphasizing its role in regulating the microclimate and water dynamics within this forest system. Although the study spans a relatively short period, the Araucaria forest exhibits high water-use efficiency for carbon assimilation, displaying variability patterns similar to those observed in other subtropical forests. However, it is important to acknowledge that our interpretations are limited to this specific dataset and that the long-term functioning of the ecosystem should be further investigated through extended observations and/or modeling. In particular, we emphasize the importance of conserving Araucaria forests in the face of ongoing land use and land cover changes. Given the current challenges posed by deforestation in Brazil, the preservation of these ecosystems is crucial for climate change mitigation and the maintenance of biodiversity.

Supplementary Materials

The following supporting information can be downloaded at: https://www.mdpi.com/article/10.3390/f16061008/s1, Figure S1: Daily integrated values of (a) NEE, (b) GPP, and (c) RE in g C m−2 d−1; (d) LE and (e) H in MJ m−2 d−1 for the understory and ecosystem; and (f) LAI (m2 m−2) and EVI. The non-shaded and shaded areas represent the spring–summer (SS) and autumn–winter (AW) periods, respectively. Table S1: Seasonality of atmospheric variables and fluxes. Daily mean for Tair (°C) and VPD (hPa). Accumulated in the period for Rg (MJ m−2 Season−1 for AW and SS and MJ m−2 yr−1 for Annual); Prec (mm Season−1 for AW and SS and mm yr−1 for Annual); NEE, RE, and GPP (g C m−2 Season−1 for AW and SS and g C m−2 yr−1 for Annual); H and LE (MJ m−2 Season−1 for AW and SS and MJ m−2 yr−1 for Annual); and WUE (GPP/ET) (g C (kg H2O)−1. Table S2: Coefficient of determination (r2) between the fluxes and meteorological variables for monthly averages.

Author Contributions

M.B.D., conceptualization, data curation, formal analysis, investigation, methodology, software, validation, and writing—original draft; P.E.S.d.O., data curation, investigation, methodology, software, and writing—review and editing; V.d.A.S., formal analysis, methodology, writing—original draft, and writing—review and editing; C.A.T., data curation and investigation; H.R.Z., data curation and investigation; G.P.V., data curation and software; A.M., data curation and software; M.E.O.P., visualization and writing—review and editing; M.B.S., visualization and writing—review and editing; O.L.L.d.M., funding acquisition, project administration, and resources; G.d.O., visualization and writing—review and editing; C.A.G.S., visualization and writing—review and editing; D.R.R., formal analysis, funding acquisition, investigation, project administration, resources, supervision, writing—original draft, and writing—review and editing. All authors have read and agreed to the published version of the manuscript.

Funding

The authors acknowledge the National Council for Scientific and Technological Development (CNPq—Brazil), the Coordination for the Improvement of Higher Education Personnel (CAPES—Brazil, funding code 001), Foundation for Research of Rio Grande do Sul State (FAPERGS), and Financier of Studies and Projects (FINEP—Brazil) for their financial support.

Data Availability Statement

Data will be made available on reasonable request.

Acknowledgments

The authors acknowledge the staff of the Micrometeorology Laboratory of the Federal University of Santa Maria for the technical support provided, particularly relative to the flux towers and the eddy covariance instrumentation.

Conflicts of Interest

The authors declare no conflicts of interest. No potential conflicts of interest are reported by the authors.

References

  1. Nobre, C.A.; Sampaio, G.; Borma, L.S.; Castilla-rubio, J.C.; Silva, J.S.; Cardoso, M. Land-use and climate change risks in the Amazon and the need of a novel sustainable development paradigm. Proc. Natl. Acad. Sci. USA 2016, 113, 10759–10768. [Google Scholar] [CrossRef] [PubMed]
  2. Haghtalab, N.; Moore, N.; Heerspink, B.P.; Hyndman, D.W. Evaluating spatial patterns in precipitation trends across the Amazon basin driven by land cover and global scale forcings. Theor. Appl. Climatol. 2020, 140, 411–427. [Google Scholar] [CrossRef]
  3. Fleischmann, A.S.; Laipelt, L.; Papa, F.; Paiva, R.C.D.d.; de Andrade, B.C.; Collischonn, W.; Biudes, M.S.; Kayser, R.; Prigent, C.; Cosio, E.; et al. Patterns and drivers of evapotranspiration in South American wetlands. Nat. Commun. 2023, 14, 6656. [Google Scholar] [CrossRef]
  4. Baker, J.C.A.; Spracklen, D.V. Climate Benefits of Intact Amazon Forests and the Biophysical Consequences of Disturbance. Front. For. Glob. Change 2019, 2, 47. [Google Scholar] [CrossRef]
  5. Leite-Filho, A.T.; Costa, M.H.; Fu, R. The southern Amazon rainy season: The role of deforestation and its interactions with large-scale mechanisms. Int. J. Climatol. 2020, 40, 2328–2341. [Google Scholar] [CrossRef]
  6. Ribeiro, M.C.; Metzger, J.P.; Martensen, A.C.; Ponzoni, F.J.; Hirota, M.M. The Brazilian Atlantic Forest: How much is left, and how is the remaining forest distributed? Implications for conservation. Biol. Conserv. 2009, 142, 1141–1153. [Google Scholar] [CrossRef]
  7. Ranta, P.; Blom, T.O.M.; Niemelä, J.; Joensuu, E.; Siitonen, M. The fragmented Atlantic rain forest of Brazil: Size, shape and distribution of forest fragments. Biodivers. Conserv. 1998, 7, 385–403. [Google Scholar] [CrossRef]
  8. Reis, M.S.d.; Ladio, A.; Peroni, N. Landscapes with Araucaria in South America: Evidence for a cultural dimension. Ecol. Soc. 2014, 19, art43. [Google Scholar] [CrossRef]
  9. Nodari, E.S. Historia de la devastación del Bosque de Araucaria en el sur del Brasil. Áreas. Rev. Int. Ciencias Soc. 2016, 35, 75–85. [Google Scholar]
  10. Marchioro, C.A.; Santos, K.L.; Siminski, A. Present and future of the critically endangered Araucaria angustifolia due to climate change and habitat loss. For. Int. J. For. Res. 2020, 93, 401–410. [Google Scholar] [CrossRef]
  11. Eisfeld, R.L.; Arce, J.E.; Sanquetta, C.R.; Braz, E.M. É economicamente viável o plantio de araucária? Uma análise entre a espécie e seu principal substituto, o pinus. Sci. For. 2020, 48, e3408. [Google Scholar] [CrossRef]
  12. Souza, A.F. A review of the structure and dynamics of araucaria mixed forests in southern Brazil and northern Argentina. N. Z. J. Bot. 2020, 59, 2–54. [Google Scholar] [CrossRef]
  13. Misson, L.; Baldocchi, D.D.; Black, T.A.; Blanken, P.D.; Brunet, Y.; Curiel Yuste, J.; Dorsey, J.R.; Falk, M.; Granier, A.; Irvine, M.R.; et al. Partitioning forest carbon fluxes with overstory and understory eddy-covariance measurements: A synthesis based on FLUXNET data. Agric. For. Meteorol. 2007, 144, 14–31. [Google Scholar] [CrossRef]
  14. Scott, R.; Watts, C.; Payan, J.G.; Edwards, E.; Goodrich, D.C.; Williams, D.; Shuttleworth, W.J. The understory and overstory partitioning of energy and water fluxes in an open canopy, semiarid woodland. Agric. For. Meteorol. 2003, 114, 127–139. [Google Scholar] [CrossRef]
  15. Xue, B.-L.; Kumagai, T.; Iida, S.; Nakai, T.; Matsumoto, K.; Komatsu, H.; Otsuki, K.; Ohta, T. Influences of canopy structure and physiological traits on flux partitioning between understory and overstory in an eastern Siberian boreal larch forest. Ecol. Modell. 2011, 222, 1479–1490. [Google Scholar] [CrossRef]
  16. Thiffault, N.; Fenton, N.; Munson, A.; Hébert, F.; Fournier, R.; Valeria, O.; Bradley, R.; Bergeron, Y.; Grondin, P.; Paré, D.; et al. Managing Understory Vegetation for Maintaining Productivity in Black Spruce Forests: A Synthesis within a Multi-Scale Research Model. Forests 2013, 4, 613–631. [Google Scholar] [CrossRef]
  17. Ikawa, H.; Nakai, T.; Busey, R.C.; Kim, Y.; Kobayashi, H.; Nagai, S.; Ueyama, M.; Saito, K.; Nagano, H.; Suzuki, R.; et al. Understory CO2, sensible heat, and latent heat fluxes in a black spruce forest in interior Alaska. Agric. For. Meteorol. 2015, 214–215, 80–90. [Google Scholar] [CrossRef]
  18. Zellweger, F.; De Frenne, P.; Lenoir, J.; Vangansbeke, P.; Verheyen, K.; Bernhardt-Römermann, M.; Baeten, L.; Hédl, R.; Berki, I.; Brunet, J.; et al. Forest microclimate dynamics drive plant responses to warming. Science 2020, 368, 772–775. [Google Scholar] [CrossRef]
  19. Cai, Y.; Tanioka, Y.; Kitawaga, T.; Ida, H.; Hirota, M. Gross primary production of dwarf bamboo, Sasa senanensis, in a mature beech forest with a substantial gap-mosaic structure. J. Plant Res. 2021, 134, 209–221. [Google Scholar] [CrossRef]
  20. Cai, Y.; Koido, R.; Umino, T.; Sakamoto, H.; Hasebe, Y.; Sarmah, R.; Yoneda, M.; Ida, H.; Hirota, M. Gross Primary Production of Dwarf Bamboo, Sasa senanensis, in Cool-Temperate Secondary Forests with Different Canopy Structures. Forests 2022, 13, 564. [Google Scholar] [CrossRef]
  21. Baldocchi, D.D.; Vogel, C.A. Energy and CO2 flux densities above and below a temperate broad-leaved forest and a boreal pine forest. Tree Physiol. 1996, 16, 5–16. [Google Scholar] [CrossRef] [PubMed]
  22. Powell, T.L.; Starr, G.; Clark, K.L.; Martin, T.A.; Gholz, H.L. Ecosystem and understory water and energy exchange for a mature, naturally regenerated pine flatwoods forest in north Florida. Can. J. For. Res. 2005, 35, 1568–1580. [Google Scholar] [CrossRef]
  23. Wang, L.; Caylor, K.K.; Villegas, J.C.; Barron-Gafford, G.A.; Breshears, D.D.; Huxman, T.E. Partitioning evapotranspiration across gradients of woody plant cover: Assessment of a stable isotope technique. Geophys. Res. Lett. 2010, 37, L09401. [Google Scholar] [CrossRef]
  24. Baldocchi, D.D.; Ryu, Y. A Synthesis of Forest Evaporation Fluxes—From Days to Years—As Measured with Eddy Covariance. In Forest Hydrology and Biogeochemistry; Springer: Dordrecht, The Netherlands, 2011; pp. 101–116. [Google Scholar]
  25. Sulman, B.N.; Roman, D.T.; Scanlon, T.M.; Wang, L.; Novick, K.A. Comparing methods for partitioning a decade of carbon dioxide and water vapor fluxes in a temperate forest. Agric. For. Meteorol. 2016, 226–227, 229–245. [Google Scholar] [CrossRef]
  26. Zandavalli, R.B.; Dillenburg, L.R.; de Souza, P.V.D. Growth responses of Araucaria angustifolia (Araucariaceae) to inoculation with the mycorrhizal fungus Glomus clarum. Appl. Soil Ecol. 2004, 25, 245–255. [Google Scholar] [CrossRef]
  27. Schaaf, L.B. Florística, Estrutura e Dinâmica no Período 1979–2000 de uma Floresta Ombrófila Mista Localizada no Sul do Paraná. Master’s Thesis, Universidade Federal do Paraná, Curitiba, Brazil, 2001. [Google Scholar]
  28. Bittencourt, S.; Corte, A.P.D.; Sanqueta, C.R. Estrutura da comunidade de Pteridophyta em uma floresta ombrófila mista do Paraná, Brasil. Silva Lusit. 2004, 12, 243–254. [Google Scholar]
  29. Peel, M.C.; Finlayson, B.L.; McMahon, T.A. Updated world map of the Köppen-Geiger climate classification. Hydrol. Earth Syst. Sci. 2007, 11, 1633–1644. [Google Scholar] [CrossRef]
  30. Knyazikhin, Y.; Glassy, J.; Privette, J.L.; Tian, Y.; Lotsch, A.; Zhang, Y.; Wang, Y.; Morisette, J.T.; Votava, P.; Myneni, R.B.; et al. MODIS Leaf Area Index (LAI) and Fraction of Photosynthetically Active Radiation Absorbed by Vegetation (FPAR) Product (MOD15) Algorithm Theoretical Basis Document. 1999. Available online: https://modis.gsfc.nasa.gov/data/atbd/atbd_mod15.pdf (accessed on 28 November 2023).
  31. Oliveira, P.E.S.; Acevedo, O.C.; Moraes, O.L.L.; Zimermann, H.R.; Teichrieb, C. Nocturnal Intermittent Coupling Between the Interior of a Pine Forest and the Air Above It. Bound.-Layer Meteorol. 2013, 146, 45–64. [Google Scholar] [CrossRef]
  32. Hersbach, H.; Bell, B.; Berrisford, P.; Hirahara, S.; Horányi, A.; Muñoz-Sabater, J.; Nicolas, J.; Peubey, C.; Radu, R.; Schepers, D.; et al. The ERA5 global reanalysis. Q. J. R. Meteorol. Soc. 2020, 146, 1999–2049. [Google Scholar] [CrossRef]
  33. Baldocchi, D.D.; Hincks, B.B.; Meyers, T.P. Measuring Biosphere-Atmosphere Exchanges of Biologically Related Gases with Micrometeorological Methods. Ecology 1988, 69, 1331–1340. [Google Scholar] [CrossRef]
  34. Vickers, D.; Mahrt, L. Quality control and flux sampling problems for tower and aircraft data. J. Atmos. Ocean. Technol. 1997, 14, 512–526. [Google Scholar] [CrossRef]
  35. Wilczak, J.M.; Oncley, S.P.; Stage, S.A. Sonic anemometer tilt correction algorithms. Bound.-Layer Meteorol. 2001, 99, 127–150. [Google Scholar] [CrossRef]
  36. Webb, E.K.; Pearman, G.I.; Leuning, R. Correction of flux measurements for density effects due to heat and water vapour transfer. Q. J. R. Meteorol. Soc. 1980, 106, 85–100. [Google Scholar] [CrossRef]
  37. Gash, J.H.C.; Culf, A.D. Applying a linear detrend to eddy correlation data in realtime. Bound.-Layer Meteorol. 1996, 79, 301–306. [Google Scholar] [CrossRef]
  38. Moncrieff, J.; Clement, R.; Finnigan, J.; Meyers, T. Averaging, Detrending, and Filtering of Eddy Covariance Time Series. In Handbook of Micrometeorology; Kluwer Academic Publishers: Dordrecht, The Netherlands, 2004; pp. 7–31. [Google Scholar]
  39. Moncrieff, J.B.; Massheder, J.M.; de Bruin, H.; Elbers, J.; Friborg, T.; Heusinkveld, B.; Kabat, P.; Scott, S.; Soegaard, H.; Verhoef, A. A system to measure surface fluxes of momentum, sensible heat, water vapour and carbon dioxide. J. Hydrol. 1997, 188–189, 589–611. [Google Scholar] [CrossRef]
  40. Foken, T.; Leuning, R.; Oncley, S.R.; Mauder, M.; Aubinet, M. Corrections and Data Quality Control. In Eddy Covariance; Springer: Dordrecht, The Netherlands, 2012; pp. 85–131. [Google Scholar]
  41. Béziat, P.; Ceschia, E.; Dedieu, G. Carbon balance of a three crop succession over two cropland sites in South West France. Agric. For. Meteorol. 2009, 149, 1628–1645. [Google Scholar] [CrossRef]
  42. Papale, D.; Reichstein, M.; Aubinet, M.; Canfora, E.; Bernhofer, C.; Kutsch, W.; Longdoz, B.; Rambal, S.; Valentini, R.; Vesala, T.; et al. Towards a standardized processing of Net Ecosystem Exchange measured with eddy covariance technique: Algorithms and uncertainty estimation. Biogeosciences 2006, 3, 571–583. [Google Scholar] [CrossRef]
  43. Reichstein, M.; Falge, E.; Baldocchi, D.; Papale, D.; Aubinet, M.; Berbigier, P.; Bernhofer, C.; Buchmann, N.; Gilmanov, T.; Granier, A.A.; et al. On the separation of net ecosystem exchange into assimilation and ecosystem respiration: Review and improved algorithm. Glob. Change Biol. 2005, 11, 1424–1439. [Google Scholar] [CrossRef]
  44. Wutzler, T.; Lucas-Moffat, A.; Migliavacca, M.; Knauer, J.; Sickel, K.; Šigut, L.; Menzer, O.; Reichstein, M. Basic and extensible post-processing of eddy covariance flux data with REddyProc. Biogeosciences 2018, 15, 5015–5030. [Google Scholar] [CrossRef]
  45. Lasslop, G.; Reichstein, M.; Papale, D.; Richardson, A.D.; Arneth, A.; Barr, A.; Stoy, P.; Wohlfahrt, G. Separation of net ecosystem exchange into assimilation and respiration using a light response curve approach: Critical issues and global evaluation. Glob. Change Biol. 2010, 16, 187–208. [Google Scholar] [CrossRef]
  46. Lloyd, J.; Taylor, J.A. On the Temperature Dependence of Soil Respiration. Funct. Ecol. 1994, 8, 315–323. [Google Scholar] [CrossRef]
  47. Zeri, M.; Sá, L.D.A.; Manzi, A.O.; Araújo, A.C.; Aguiar, R.G.; von Randow, C.; Sampaio, G.; Cardoso, F.L.; Nobre, C.A. Variability of Carbon and Water Fluxes Following Climate Extremes over a Tropical Forest in Southwestern Amazonia. PLoS ONE 2014, 9, e88130. [Google Scholar] [CrossRef] [PubMed]
  48. Rocha, H.R.d.; Manzi, A.O.; Cabral, O.M.; Miller, S.D.; Goulden, M.L.; Saleska, S.R.; R.-Coupe, N.; Wofsy, S.C.; Borma, L.S.; Artaxo, P.; et al. Patterns of water and heat flux across a biome gradient from tropical forest to savanna in Brazil. J. Geophys. Res. 2009, 114, G00B12. [Google Scholar]
  49. Giambelluca, T.W.; Scholz, F.G.; Bucci, S.J.; Meinzer, F.C.; Goldstein, G.; Hoffmann, W.A.; Franco, A.C.; Buchert, M.P. Evapotranspiration and energy balance of Brazilian savannas with contrasting tree density. Agric. For. Meteorol. 2009, 149, 1365–1376. [Google Scholar] [CrossRef]
  50. Rocha, H.R.d.; Goulden, M.L.; Miller, S.D.; Menton, M.C.; Pinto, L.D.V.O.; de Freitas, H.C.; Figueira, A.M.E.S. Seasonality of Water and Heat Fluxes over a Tropical Forest in Eastern Amazonia. Ecol. Appl. 2004, 14, 22–32. [Google Scholar] [CrossRef]
  51. Fisher, J.B.; Malhi, Y.; Bonal, D.; Da Rocha, H.R.; De Araújo, A.C.; Gamo, M.; Goulden, M.L.; Rano, T.H.; Huete, A.R.; Kondo, H.; et al. The land-atmosphere water flux in the tropics. Glob. Change Biol. 2009, 15, 2694–2714. [Google Scholar] [CrossRef]
  52. von Randow, C.; Manzi, A.O.; Kruijt, B.; de Oliveira, P.J.; Zanchi, F.B.; Silva, R.L.; Hodnett, M.G.; Gash, J.H.C.; Elbers, J.A.; Waterloo, M.J.; et al. Comparative measurements and seasonal variations in energy and carbon exchange over forest and pasture in South West Amazonia. Theor. Appl. Climatol. 2004, 78, 5–26. [Google Scholar] [CrossRef]
  53. Cabral, O.M.R.; Gash, J.H.C.; Rocha, H.R.; Marsden, C.; Ligo, M.A.V.; Freitas, H.C.; Tatsch, J.D.; Gomes, E. Fluxes of CO2 above a plantation of Eucalyptus in southeast Brazil. Agric. For. Meteorol. 2011, 151, 49–59. [Google Scholar] [CrossRef]
  54. Falge, E.; Baldocchi, D.; Olson, R.; Anthoni, P.; Aubinet, M.; Bernhofer, C.; Burba, G.; Ceulemans, R.; Clement, R.; Dolman, H.; et al. Gap filling strategies for defensible annual sums of net ecosystem exchange. Agric. For. Meteorol. 2001, 107, 43–69. [Google Scholar] [CrossRef]
  55. Aubinet, M.; Feigenwinter, C.; Heinesch, B.; Laffineur, Q.; Papale, D.; Reichstein, M.; Rinne, J.; Gorsel, E. Van Nighttime Flux Correction. In Eddy Covariance; Springer: Dordrecht, The Netherlands, 2012; pp. 133–157. [Google Scholar]
  56. Pita, G.; Gielen, B.; Zona, D.; Rodrigues, A.; Rambal, S.; Janssens, I.A.; Ceulemans, R. Carbon and water vapor fluxes over four forests in two contrasting climatic zones. Agric. For. Meteorol. 2013, 180, 211–224. [Google Scholar] [CrossRef]
  57. Lasslop, G.; Migliavacca, M.; Bohrer, G.; Reichstein, M.; Bahn, M.; Ibrom, A.; Jacobs, C.; Kolari, P.; Papale, D.; Vesala, T.; et al. On the choice of the driving temperature for eddy-covariance carbon dioxide flux partitioning. Biogeosciences 2012, 9, 5243–5259. [Google Scholar] [CrossRef]
  58. Zhang, Q.; Manzoni, S.; Katul, G.; Porporato, A.; Yang, D. The hysteretic evapotranspiration-Vapor pressure deficit relation. J. Geophys. Res. Biogeosci. 2014, 119, 125–140. [Google Scholar] [CrossRef]
  59. Mallick, K.; Trebs, I.; Boegh, E.; Giustarini, L.; Schlerf, M.; Drewry, D.T.; Hoffmann, L.; von Randow, C.; Kruijt, B.; Araújo, A.; et al. Canopy-scale biophysical controls of transpiration and evaporation in the Amazon Basin. Hydrol. Earth Syst. Sci. 2016, 20, 4237–4264. [Google Scholar] [CrossRef]
  60. Beer, C.; Reichstein, M.; Tomelleri, E.; Ciais, P.; Jung, M.; Carvalhais, N.; Rödenbeck, C.; Arain, M.A.; Baldocchi, D.; Bonan, G.B.; et al. Terrestrial gross carbon dioxide uptake: Global distribution and covariation with climate. Science 2010, 329, 834–838. [Google Scholar] [CrossRef]
  61. Mahrt, L.; Vickers, D. Relationship of area-averaged carbon dioxide and water vapour fluxes to atmospheric variables. Agric. For. Meteorol. 2002, 112, 195–202. [Google Scholar] [CrossRef]
  62. Chu, H.; Baldocchi, D.D.; John, R.; Wolf, S.; Reichstein, M. Fluxes all of the time? A primer on the temporal representativeness of FLUXNET. J. Geophys. Res. Biogeosci. 2017, 122, 289–307. [Google Scholar] [CrossRef]
  63. Villarreal, S.; Vargas, R. Representativeness of FLUXNET Sites Across Latin America. J. Geophys. Res. Biogeosci. 2021, 126, e2020JG006090. [Google Scholar] [CrossRef]
  64. Baldocchi, D.D.; Law, B.E.; Anthoni, P.M. On measuring and modeling energy fluxes above the floor of a homogeneous and heterogeneous conifer forest. Agric. For. Meteorol. 2000, 102, 187–206. [Google Scholar] [CrossRef]
  65. Lamaud, E.; Ogée, J.; Brunet, Y.; Berbigier, P. Validation of eddy flux measurements above the understorey of a pine forest. Agric. For. Meteorol. 2001, 106, 187–203. [Google Scholar] [CrossRef]
  66. Lloyd, J.; Grace, J.; Miranda, A.C.; Meir, P.; Wong, S.C.; Miranda, H.S.; Wright, I.R.; Gash, J.H.C.; McIntyre, J. A simple calibrated model of Amazon rainforest productivity based on leaf biochemical properties. Plant. Cell Environ. 1995, 18, 1129–1145. [Google Scholar] [CrossRef]
  67. ALTON, P.B.; NORTH, P.R.; LOS, S.O. The impact of diffuse sunlight on canopy light-use efficiency, gross photosynthetic product and net ecosystem exchange in three forest biomes. Glob. Change Biol. 2007, 13, 776–787. [Google Scholar] [CrossRef]
  68. Kuglitsch, F.G.; Reichstein, M.; Beer, C.; Carrara, A.; Ceulemans, R.; Granier, A.; Janssens, I.A.; Koestner, B.; Lindroth, A.; Loustau, D.; et al. Characterisation of ecosystem water-use efficiency of european forests from eddy covariance measurements. Biogeosci. Discuss. 2008, 5, 4481–4519. [Google Scholar]
  69. Chapin, F.S.; Woodwell, G.M.; Randerson, J.T.; Rastetter, E.B.; Lovett, G.M.; Baldocchi, D.D.; Clark, D.A.; Harmon, M.E.; Schimel, D.S.; Valentini, R.; et al. Reconciling Carbon-cycle Concepts, Terminology, and Methods. Ecosystems 2006, 9, 1041–1050. [Google Scholar] [CrossRef]
  70. Martínez-García, E.; Nilsson, M.B.; Laudon, H.; Lundmark, T.; Fransson, J.E.S.; Wallerman, J.; Peichl, M. Overstory dynamics regulate the spatial variability in forest-floor CO2 fluxes across a managed boreal forest landscape. Agric. For. Meteorol. 2022, 318, 108916. [Google Scholar] [CrossRef]
  71. Phillips, O.L.; Brienen, R.J.W. Carbon uptake by mature Amazon forests has mitigated Amazon nations’ carbon emissions. Carbon Balance Manag. 2017, 12, 1. [Google Scholar] [CrossRef]
  72. Hubau, W.; Lewis, S.L.; Phillips, O.L.; Affum-Baffoe, K.; Beeckman, H.; Cuní-Sanchez, A.; Daniels, A.K.; Ewango, C.E.N.; Fauset, S.; Mukinzi, J.M.; et al. Asynchronous carbon sink saturation in African and Amazonian tropical forests. Nature 2020, 579, 80–87. [Google Scholar] [CrossRef]
  73. Tang, X.; Li, H.; Desai, A.R.; Nagy, Z.; Luo, J.; Kolb, T.E.; Olioso, A.; Xu, X.; Yao, L.; Kutsch, W.; et al. How is water-use efficiency of terrestrial ecosystems distributed and changing on Earth? Sci. Rep. 2014, 4, 7483. [Google Scholar] [CrossRef]
  74. de Oliveira, G.; Brunsell, N.A.; Moraes, E.C.; Yosio, E.; Bertani, G.; Santos, T.V.; Aragao, L.E.O.C.; Oliveira, G.D.; Brunsell, N.A.; Moraes, E.C.; et al. Evaluation of MODIS-based estimates of water-use efficiency in Amazonia. Int. J. Remote Sens. 2017, 38, 5291–5309. [Google Scholar] [CrossRef]
  75. Katerji, N.; Mastrorilli, M.; Rana, G. Water use efficiency of crops cultivated in the Mediterranean region: Review and analysis. Eur. J. Agron. 2008, 28, 493–507. [Google Scholar] [CrossRef]
Figure 1. Monthly average of (a) air temperature (Tair), (b) solar radiation (Rg), (c) pressure vapor deficit (VPD), and (d) monthly accumulated precipitation (Prec). The dashed line in (a) and dashed bars in (d) represents the Climatic Normal for the region. The non-shaded and shaded areas represent the spring–summer (SS) and autumn–winter (AW) periods, respectively.
Forests 16 01008 g001
Figure 2. Monthly integrated values of (a) NEE, (b) GPP, and (c) RE in g C m−2 month−1; (d) LE and (e) H in (MJ m−2 month−1) for the understory and ecosystem; and (f) LAI (m2 m−2) and EVI. The non-shaded and shaded areas represent the spring–summer (SS) and autumn–winter (AW) periods, respectively.
Forests 16 01008 g002
Figure 3. Monthly average evaporative fraction for overstory and ecosystem, where sub-index “n” refers to the level of observation of the flux (n = 32, n = 32–11, n = 11). The non-shaded and shaded areas represent the spring–summer (SS) and autumn–winter (AW) periods, respectively.
Forests 16 01008 g003
Figure 4. Daily scale relationships between fluxes and atmospheric conditions: H and LE versus (a) Rg; (c) Tair; (e) VPD; (b) GPP versus Rg; (d) RE versus Tair; (f) NEE versus VPD. LE for the ecosystem (LEEco) and understory (LEUnder), H for the ecosystem (HEco) in W m−2, and CO2 components (GPP, RE, and NEE in µmol CO2 m−2 s−1) for each stratum. The arrows indicate local noon. The circle with the arrow represents the direction hysteresis.
Forests 16 01008 g004
Figure 5. Relationship between the fluxes and meteorological variables for the understory and overstory, presented in monthly averages.
Forests 16 01008 g005
Figure 6. Monthly Water-Use Efficiency (WUE). The non-shaded and shaded areas represent the spring–summer (SS) and autumn–winter (AW) periods, respectively.
Forests 16 01008 g006
Figure 7. Relationship between water-use efficiency (WUE) and vapor pressure deficit (VPD) in monthly averages with p-value < 0.01. For the understory, p-value > 0.1 and r2 = 0.08 are not presented.
Forests 16 01008 g007
Disclaimer/Publisher’s Note: The statements, opinions and data contained in all publications are solely those of the individual author(s) and contributor(s) and not of MDPI and/or the editor(s). MDPI and/or the editor(s) disclaim responsibility for any injury to people or property resulting from any ideas, methods, instructions or products referred to in the content.

