Article

Vegetation Restoration Significantly Increased Soil Organic Nitrogen Mineralization and Nitrification Rates in Karst Regions of China

1
Key Laboratory of Karst Dynamics, MNR & GZAR, Institute of Karst Geology, Chinese Academy of Geological Sciences (CAGS), International Research Center on Karst Under the Auspices of UNESCO, Guilin 541004, China
2
Pingguo Guangxi, Karst Ecosystem, National Observation and Research Station, Pingguo 531406, China
3
School of Breeding and Multiplication, Sanya Institute of Breeding and Multiplication, Hainan University, Sanya 572025, China
4
Hydrogeology and Engineering Geology Survey Institute of Guangxi, Liuzhou 545006, China
*
Author to whom correspondence should be addressed.
Forests 2025, 16(6), 1006; https://doi.org/10.3390/f16061006
Submission received: 29 April 2025 / Revised: 5 June 2025 / Accepted: 13 June 2025 / Published: 15 June 2025
(This article belongs to the Section Forest Soil)

Abstract

Understanding the processes of organic nitrogen (N) mineralization to ammonium (NH4+) and NH4+ oxidation to nitrate (NO3), which, together, supply soil inorganic N (the sum of NH4+ and NO3), is of great significance for guiding the restoration of degraded ecosystems. This study used space-for-time substitution to investigate the dynamic changes in the rates of organic N mineralization (MNorg) and nitrification (ONH4) in soil at different vegetation restoration stages. Soil samples were collected from grassland (3–5 years), shrub-grassland (7–8 years), early-stage shrubland (15–20 years), late-stage shrubland (30–35 years), early-stage woodland (45–50 years), and late-stage woodland (70–80 years) in the subtropical karst region of China during the dry (December) and rainy (July) seasons. The MNorg and ONH4 were determined using the 15N labeling technique. The soil microbial community was determined using the phospholipid fatty acid method. Soil organic carbon (SOC), total nitrogen (TN), NH4+, NO3, and inorganic N contents, as well as the soil moisture content (SMC) were also measured. Our results showed that SOC and TN contents, and the SMC, as well as microbial community abundances increased markedly from grassland to the late-stage shrubland. Especially in the late-stage shrubland, the abundance of the total microbial community, bacteria, fungi, actinomycetes, and AMF in soil was significantly higher than other restoration stages. These results indicate that vegetation restoration significantly increased soil nutrient content and microbial community abundance. From grassland to the late-stage shrubland, the soil NH4+, NO3, and inorganic N contents increased significantly, and the NH4+:NO3 ratios changed from greater than 1 to less than 1, indicating that vegetation restoration significantly influenced soil inorganic N content and composition. As restoration progressed, the MNorg and ONH4 increased significantly, from 0.04 to 3.01 mg N kg−1 d−1 and 0.35 to 2.48 mg N kg−1 d−1 in the dry season, and from 3.26 to 7.20 mg N kg−1 d−1 and 1.47 to 10.7 mg N kg−1 d−1 in the rainy season. At the same vegetation restoration stage, the MNorg and ONH4 in the rainy season were markedly higher than those in the dry season. These results indicate that vegetation restoration and seasonal variations could significantly influence MNorg and ONH4. Correlation analysis showed that the increase in MNorg during vegetation restoration was mainly attributed to the increase in SOC and TN contents, as well as the total microbial community, bacterial, fungal, actinomycetes, and AMF abundances, and that the increase in ONH4 was mainly attributed to the increase in MNorg and the decrease in the F: B ratio. Moreover, the MNorg and ONH4 showed a strong positive correlation with inorganic N content. This study clarifies that vegetation restoration in karst regions could significantly increase MNorg and ONH4 through enhancing soil carbon and N contents, as well as microbial community abundances, thereby increasing the available soil N supply, which could provide a theoretical basis for soil fertility regulation in future rocky desertification management.

1. Introduction

Karst landforms cover approximately 2.20 × 10⁷ km2 and are widespread throughout the world [1]. China is a country with a large distribution of karst landforms, primarily concentrated in the southwest regions. Due to unique geological conditions and prolonged human disturbance, rock desertification is particularly prominent in karst regions [2,3,4]. Vegetation restoration can effectively mitigate rocky desertification. Natural restoration and afforestation are the two primary measures for vegetation restoration in rocky desertification regions, which can significantly affect the structure and function of karst ecosystems [5,6]. However, the phenomenon of slow plant growth has always existed during rock desertification control [1,7]. Therefore, clarifying the factors that limit vegetation restoration is the foundation for guiding the ecological management of karst rocky desertification regions.
The availability of soil nutrients is one of the primary factors restricting vegetation growth [8,9]. As an essential element for plant growth, nitrogen (N) significantly impacts ecosystem structure, function, and productivity [1,10,11]. Plants primarily utilize nitrate (NO3) and ammonium (NH4+) in soil, aside from small-molecule organic N [1]. Therefore, two important processes of soil inorganic N production have attracted extensive interest and research, i.e., the mineralization of soil organic N into NH4+, and the nitrification of NH4+ into NO3 [12,13,14]. Soil microorganisms are the primary drivers of N transformation processes [15], and their community structure and composition significantly influence soil inorganic N supply capacity [16], a process that is usually regulated by soil physicochemical properties. For example, high levels of SOC and TN can promote fungal and bacterial growth [17,18], influencing soil organic N mineralization and nitrification processes [19]. The abundance of ammonia-oxidizing bacteria, which significantly influence soil nitrification rates, is likely determined by moisture content [20]. In recent years, the effect of vegetation restoration on soil organic N mineralization and nitrification processes has been extensively studied, but most of these studies have focused on non-karst regions [21,22,23]. There are few studies on soil organic N mineralization and nitrification rates during natural restoration following rock desertification in karst regions.
In karst regions, limestone soils are typically characterized by high calcium and pH levels [24]. Soil calcium can bind with soil organic matter to promote its accumulation [1,25], and a higher pH increases the activity of nitrifying microorganisms [26]. These factors may lead to a change in patterns of soil organic N mineralization and nitrification rates during vegetation restoration in karst regions, both of which are different from those in non-karst regions. Karst soils are usually clay-heavy and have low organic matter content in the initial stages of plant restoration [1]. These conditions hinder soil microbial growth, which may inhibit soil organic N mineralization and nitrification processes. With vegetation restoration, the amount of plant litter and roots, as well as the secretion content, increases [27,28]. At the same time, higher calcium and magnesium content can complex with humic acid to form calcium humate and magnesium humate [1,25], both of which are conducive to increasing the soil organic matter content and thus promoting the rate of soil organic N mineralization. In addition, soil microbial abundance and activity are increased under good soil quality and environments [1], which may promote the soil organic N mineralization processes. Combined with a high soil pH in karst areas, this facilitates the growth of nitrifying bacteria [26], promotes the conversion of NH4+ to NO3, and increases the rate of soil nitrification. Furthermore, research has shown that the processes of soil organic N mineralization and nitrification are controlled by the soil temperature and moisture content and show an obvious seasonal dependence [29,30,31]. Compared to the dry season, the rate of soil organic N mineralization and nitrification is higher in the rainy season [32]. Karst regions have significant seasonal variations, with dry season temperatures usually much lower than rainy season temperatures [33,34]. These variations may also have an impact on soil organic N mineralization and nitrification processes. Therefore, we hypothesize that soil organic N mineralization and nitrification rates would increase significantly with vegetation restoration in karst regions and that soil organic N mineralization and nitrification rates are higher in the rainy season than in the dry season.
To elucidate complex ecological processes in a shorter period, the method of space-for-time substitution is currently widely used to study vegetation restoration and soil dynamics [35,36]. To verify this hypothesis, we also used space-for-time substitution to study the changes in soil organic N mineralization and nitrification rates at different restoration stages (grassland, shrub-grassland, early-stage shrubland, late-stage shrubland, early-stage woodland, and late-stage woodland) in the rocky desertification region. Soil samples were collected during the rainy and dry seasons at various stages of restoration. Soil organic N mineralization and nitrification rates were determined by the 15N labeling technique, and soil microbial community abundances and SOC, TN, NH4+, NO3, and inorganic N (the sum of NH4+ and NO3) contents, as well as the soil moisture content, were analyzed. The aim was to reveal the changing patterns and influencing factors of soil organic N mineralization and nitrification processes during vegetation restoration in karst regions.

2. Materials and Methods

2.1. Site Description

The study site is located in Guilin City, Guangxi Zhuang Autonomous Region (110°31′–110°54′ E, 25°12′–25°21′ N) (Figure 1). The area has a mid-subtropical monsoon climate and a lot of rainfall. The annual average rainfall is approximately 1884 mm, with distinct dry and rainy seasons. The rainy season is from April to August, which accounts for approximately 70% of the total annual rainfall amount [37], and the dry season is from September to March of the following year. The annual average temperature is roughly 19.0 °C, and the altitude is 259–381 m. The area has a typical peak-cluster depression landform, and the soil type has been classified as Calcareous Alfisol by the IUSS Working Group WRB.
In the 1950s, people cut down large areas of natural vegetation to plant crops, leading to serious rocky desertification. Areas experiencing the most intense rock desertification have been gradually abandoned by people. After decades of natural restoration, different stages of vegetation restoration have emerged. Based on the field survey results, six restoration stages were selected as research objects (Table 1), including grassland (G, 3–5 years), shrub-grassland (SG, 7–10 years), early-stage shrubland (SE, 15–20 years), late-stage shrubland (SL, 30–35 years), early-stage woodland (WE, 45–50 years), and late-stage woodland (WL, 70–80 years) [38]. Four representative sample plots were set up in each restoration stage for the vegetation survey, with a spacing of more than 300 m. The sample plot sizes were 10 m × 10 m for grassland and shrub-grassland, 20 m × 20 m for shrubland, and 20 m × 30 m for woodland. The results of the vegetation survey showed the following. The dominant species in the grassland was mainly Miscanthus floridulus. In the shrub-grassland, the dominant species included Bauhinia championii, Alchornea trewioides, Miscanthus floridulus, and Selaginella moellendorffii. The dominant species in the early-stage shrubland primarily included Spiraea kwangsiensis, Bauhinia championii, Selaginella moellendorffii, and Carex brunnea. In the late-stage shrubland, the dominant species were Loropetalum chinense, Bauhinia championii, Carex capilliformis, and Paederia foetida. The dominant species in the early-stage woodland mainly included Platycarya strobilacea, Mallotus philippinensis, Bauhinia championii, Loropetalum chinense, Carex capilliformis, and Paederia foetida. The main dominant species in the late-stage woodland included Cyclobalanopsis glauca, Mallotus philippinensis, Bauhinia championii, Murraya paniculata, Trachelospermum jasminoides, and Carex sendaica.

2.2. Soil Samples Collection

Soil samples were collected in December 2020 (dry season) and July 2021 (rainy season). Five 1 m × 1 m small squares were chosen randomly from each sample plot, and the litter layer was removed. A 0–15 cm layer of surface soil was gathered with a soil sampler [39]. The soil samples from each sample plot were evenly mixed into one soil sample, yielding a total of twenty-four soil samples. Following the removal of stones, plant roots, and litter, soil samples were passed through a 2 mm screen and divided into three portions. One portion was dried naturally indoors to determine the physical and chemical properties. The second portion was used to measure the soil organic N mineralization and nitrification rates and was stored in a refrigerator at 4 °C. The third portion was used to determine soil microbial communities and was stored in a refrigerator at −80 °C.

2.3. Soil Nitrogen Transformation Rates

The fresh soil equivalent to 30 g of the dry soil weight was weighed into a 250 mL Erlenmeyer flask under laboratory conditions, with 12 repeat flasks for each soil sample. These were pre-cultured in a constant temperature incubator for 24 h, with an incubation temperature of 10 °C during the dry season and 28 °C during the rainy season. After pre-incubation, each soil sample was separated into 2 groups, each containing 6 flasks. One group received 1 mL of (15NH4)2SO4 solution with a 15N abundance of 10%, while the other group received 1 mL of K15NO3 solution with a 15N abundance of 10%. The content of the added NH4+ and NO3 reached 30 mg N kg−1. Then, the soil moisture content was adjusted according to the actual situation. The soil moisture content did not need to be adjusted in the dry season but was adjusted to 60% of the soil water holding capacity in the rainy season. After sealing the Erlenmeyer flasks with plastic film, a syringe needle was used to create 4–5 tiny holes for gas exchange. The samples were placed in the incubator and maintained at the set temperature. Samples were collected at 0.5 h and 24 h after adding the labeled solution with 150 mL of 2 mol L−1 KCl solution for extraction. The extract was stored in a refrigerator at 4 °C, and the contents of NH4+ and NO3 and the 15N abundance were determined within a week.
Soil organic N mineralization and nitrification rates were calculated according to Formulae (1) and (2), respectively [40].
M Norg = NH 4 + t 1   NH 4 + t 2 t 2 t 1 × log APE t 1 APE t 2 log [ NH 4 + ] t 1 [ NH 4 + ] t 2
MNorg (mg N kg−1 d−1) in the equation represents the mineralization of organic N to NH4+ rate, where t1 is 0.5 h, t2 is 24 h, [NH4+]t1 and [NH4+]t2 are the NH4+ contents at 0.5 h and 24 h. APEt1 and APEt2 are the 15N atom percent excess at 0.5 h and 24 h.
O NH 4 = [ NO 3 ] t 1 [ NO 3 ] t 2 t 2 t 1 × log APE t 1 APE t 2 log [ NO 3 ] t 1 [ NO 3 ] t 2
In the formula, ONH4 (mg N kg−1 d−1) represents the nitrification (oxidation of NH4+ to NO3) rate, where t1 is 0.5 h, t2 is 24 h, [NO3]t1 and [NO3]t2 are the NO3 contents at 0.5 h and 24 h. APEt1 and APEt2 are the 15N atom percent excess at 0.5 h and 24 h.

2.4. Soil Physicochemical Properties

After pretreatment with 1 M HCl and passing through a 100-mesh sieve, the soil organic carbon (SOC) and total nitrogen (TN) contents were determined by a Sercon Integra 2 Elemental Analyzer (Sercon Ltd., Crewe, UK) [1]. The soil moisture content (SMC) was calculated using the aluminum box weighing method [19]. The content of soil NH4+ and NO3 was determined using a Skalar Plus San flow analyzer (Skalar, Breda, The Netherlands) [1]. The 15N of NH4+ and NO3 in the extract was separated by MgO and the Devarda alloy [41]. First, MgO was added to a portion of the extract to distill out NH4+. Then, the Devarda alloy was added to the sample and distilled again to separate NO3. A mixed indicator of boric acid was used to absorb the distillate, and then 0.02 M H2SO4 solutions were used to convert the distillate to (NH4)2SO4. The solution was dried in an oven at 80 °C. The abundance of 15N was measured using a Sercon Integra 2 Elemental Analyzer (Sercon Ltd., Crewe, UK) [1].

2.5. Soil Microbial Community

The soil PLFA was determined using the method of Bossio and Scow [42]. Eight grams of freeze-dried soil were treated with a chloroform–methanol–phosphate buffer (1:2:0.8 v/v/v) to extract phospholipids. Then, solid-phase extraction chromatography was used to separate the lipids. Finally, the phospholipids were hydrolyzed with weakly alkaline methanol and measured by gas chromatography (7890B, Agilent Technologies, Santa Clara, CA, USA). A 19:00 internal standard was used to calculate the abundance of PLFAs. The unit of all PLFAs is nmol g−1.
Different soil microbial groups were represented by specific fatty acids [1,43,44]. PLFA 16:1ω5c characterizes arbuscular mycorrhizal fungi (AMF). PLFAs 16:1ω5c, 18:1ω9c, 18:2ω6c, and 18:2ω9c characterize fungi. PLFAs a13:0, i13:0, i16:0, a17:0, i17:0, and i18:0 characterize Gram-positive bacteria (G+). PLFAs 14:1ω5c, 16:0 2OH, 16:1ω9c, 16:1ω7c, cy17:0ω7c, 18:1ω5c, 19:0cy, 20:1ω9c, and 22:1ω9c characterize Gram-negative bacteria (G). PLFAs 14:0, 15:0, 16:0, 17:0, 18:0, and the sum of G+ and G characterize bacteria. PLFAs 16:0 10Me, 17:0 10Me, and 18:0 10Me characterize actinomycetes. PLFAs i14:0, a14:0, a15:0, and i15:0 characterize aerobic bacteria. PLFAs 15:0 DMA, 16:1ω9c DMA, 18:1ω7c DMA, and 18:1ω9c DMA characterize anaerobic bacteria. PLFAs 20:2ω6c, 20:3ω6c, and 20:4ω6c characterize protozoa. The sum of the fungal, bacterial, actinomycetes, aerobic bacterial, anaerobic bacterial, and protozoan PLFAs was the total microbial community. Additionally, two groups of microbial ratios of Gram-positive to Gram-negative bacteria (G+:G ratio) and fungi to bacteria (F:B ratio) were calculated.

2.6. Data Statistics and Analysis

Before the statistical analysis, the normality of the data was verified using the Shapiro–Wilk test (p > 0.05). In SPSS 24.0 (IBM, Chicago, IL, USA), a one-way analysis of variance (ANOVA) and Tukey’s test were used to compare the differences in soil N transformation rates, soil physicochemical properties, and soil microbial communities during vegetation restoration. The difference was significant if p < 0.05. Two-way ANOVA was used to analyze the influence of vegetation restoration and seasonal variations on MNorg and ONH4. Pearson’s correlation was used to analyze the correlation between MNorg and ONH4 with soil physicochemical properties and microbial communities (Origin 2021, OriginLab Corp., Northampton, MA, USA). Random forest analysis (R 4.2.0, R Foundation for Statistical Computing, Vienna, Austria) was used to analyze the main influencing factors of MNorg and ONH4.

3. Results

3.1. Soil Physical and Chemical Properties

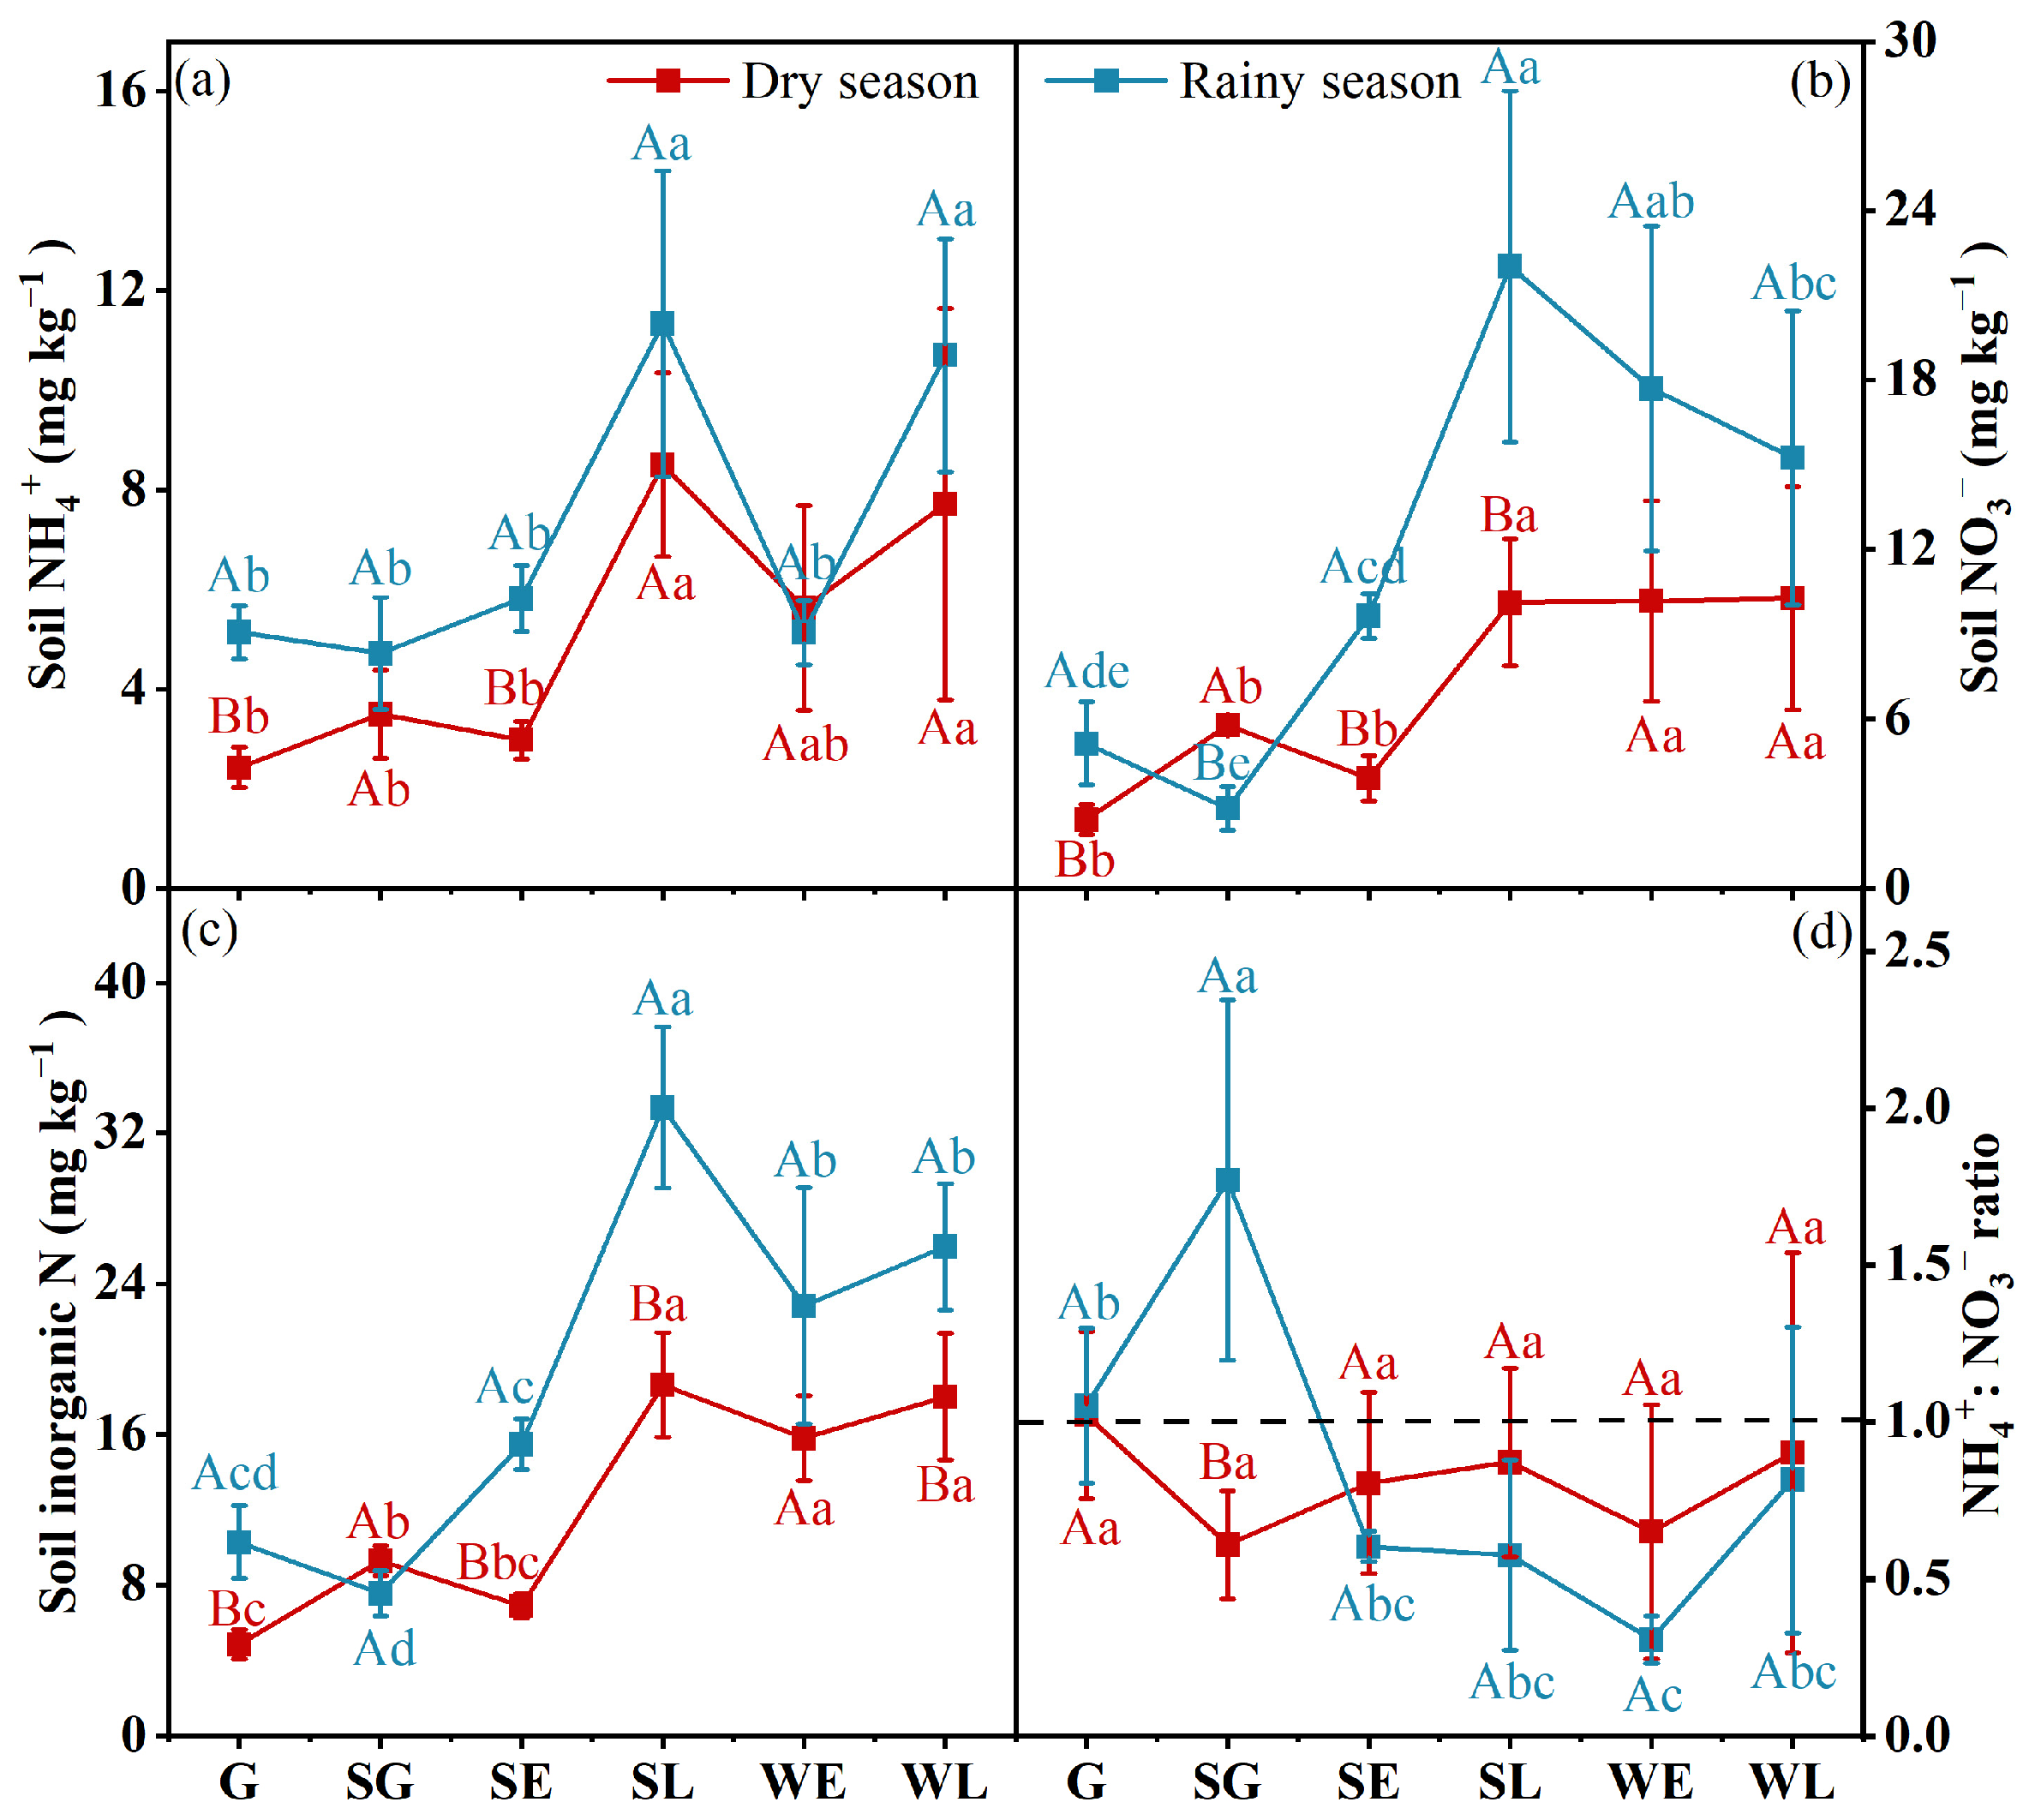
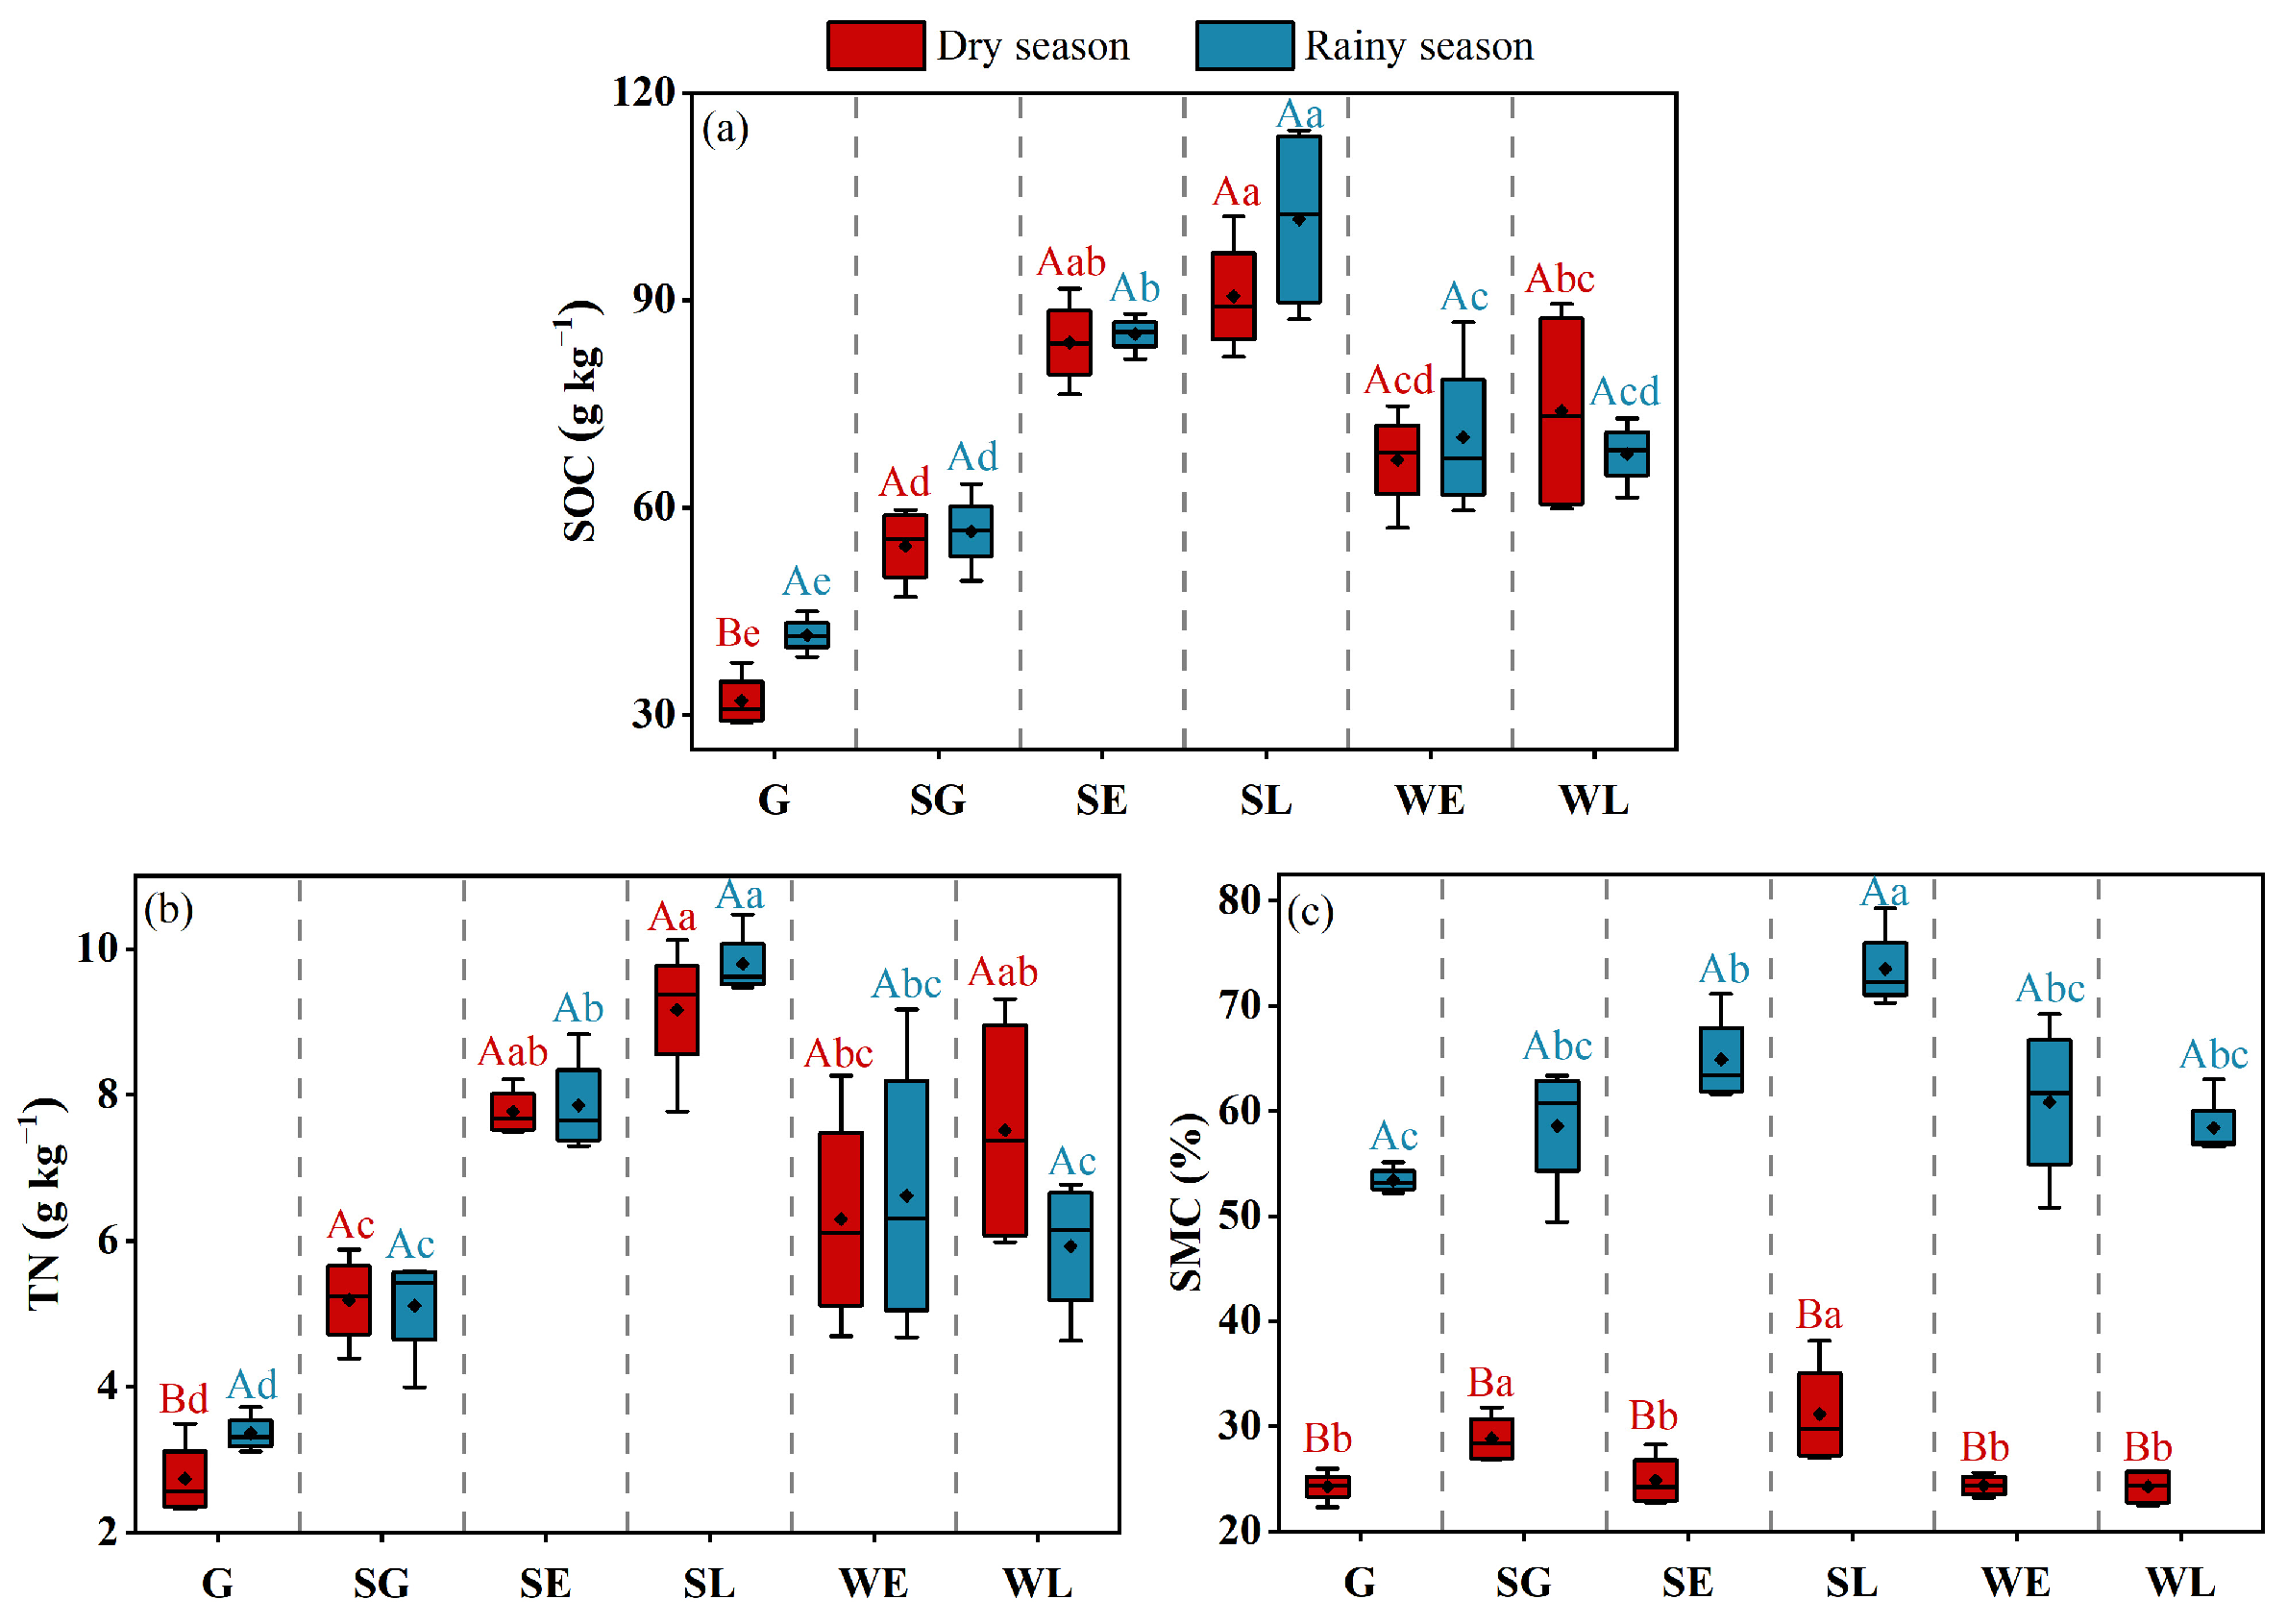
During vegetation restoration, the soil NH4+ content ranged from 2.43 to 11.3 mg kg−1 (Figure 2a), while the soil NO3 content ranged from 2.45 to 22.0 mg kg−1 (Figure 2b), and the soil inorganic N content ranged from 4.88 to 33.4 mg kg−1 (Figure 2c). With vegetation restoration, soil NH4+, NO3, and inorganic N contents increased significantly, showing that late-stage shrubland and late-stage woodland soils were markedly higher than the grassland, shrub-grassland, and early-stage shrubland soils. In the grassland and early-stage shrubland, the soil NH4+ content was significantly lower in the dry season than that in the rainy season. Soil NO3 and inorganic N contents were also significantly lower in the dry season than those in the rainy season, in the grassland, as well as early- and late-stage shrubland. Except for the grassland and shrub-grassland, the soil NH4+:NO3 ratio was less than 1 in other restoration stages, and there was no significant difference between the dry and rainy seasons (Figure 2d). From grassland to late-stage shrubland, the SOC and TN contents increased significantly (Figure 3a,b). The SOC and TN contents in the woodland stages were significantly lower than those in the late-stage shrubland and significantly higher than those in the grassland. Except for the grassland, seasonal variations had no significant impact on the SOC and TN contents. In the dry season, the SMC in the shrub-grassland and late-stage shrubland was significantly higher than that in the other restoration stages (Figure 3c). In the rainy season, the SMC increased significantly from the grassland to the late-stage shrubland, and the SMC was significantly lower in the stages of woodland than that in the late-stage shrubland. The SMC in the rainy season was markedly higher than that in the dry season at the same restoration stage.

3.2. Soil Microbial Community Composition

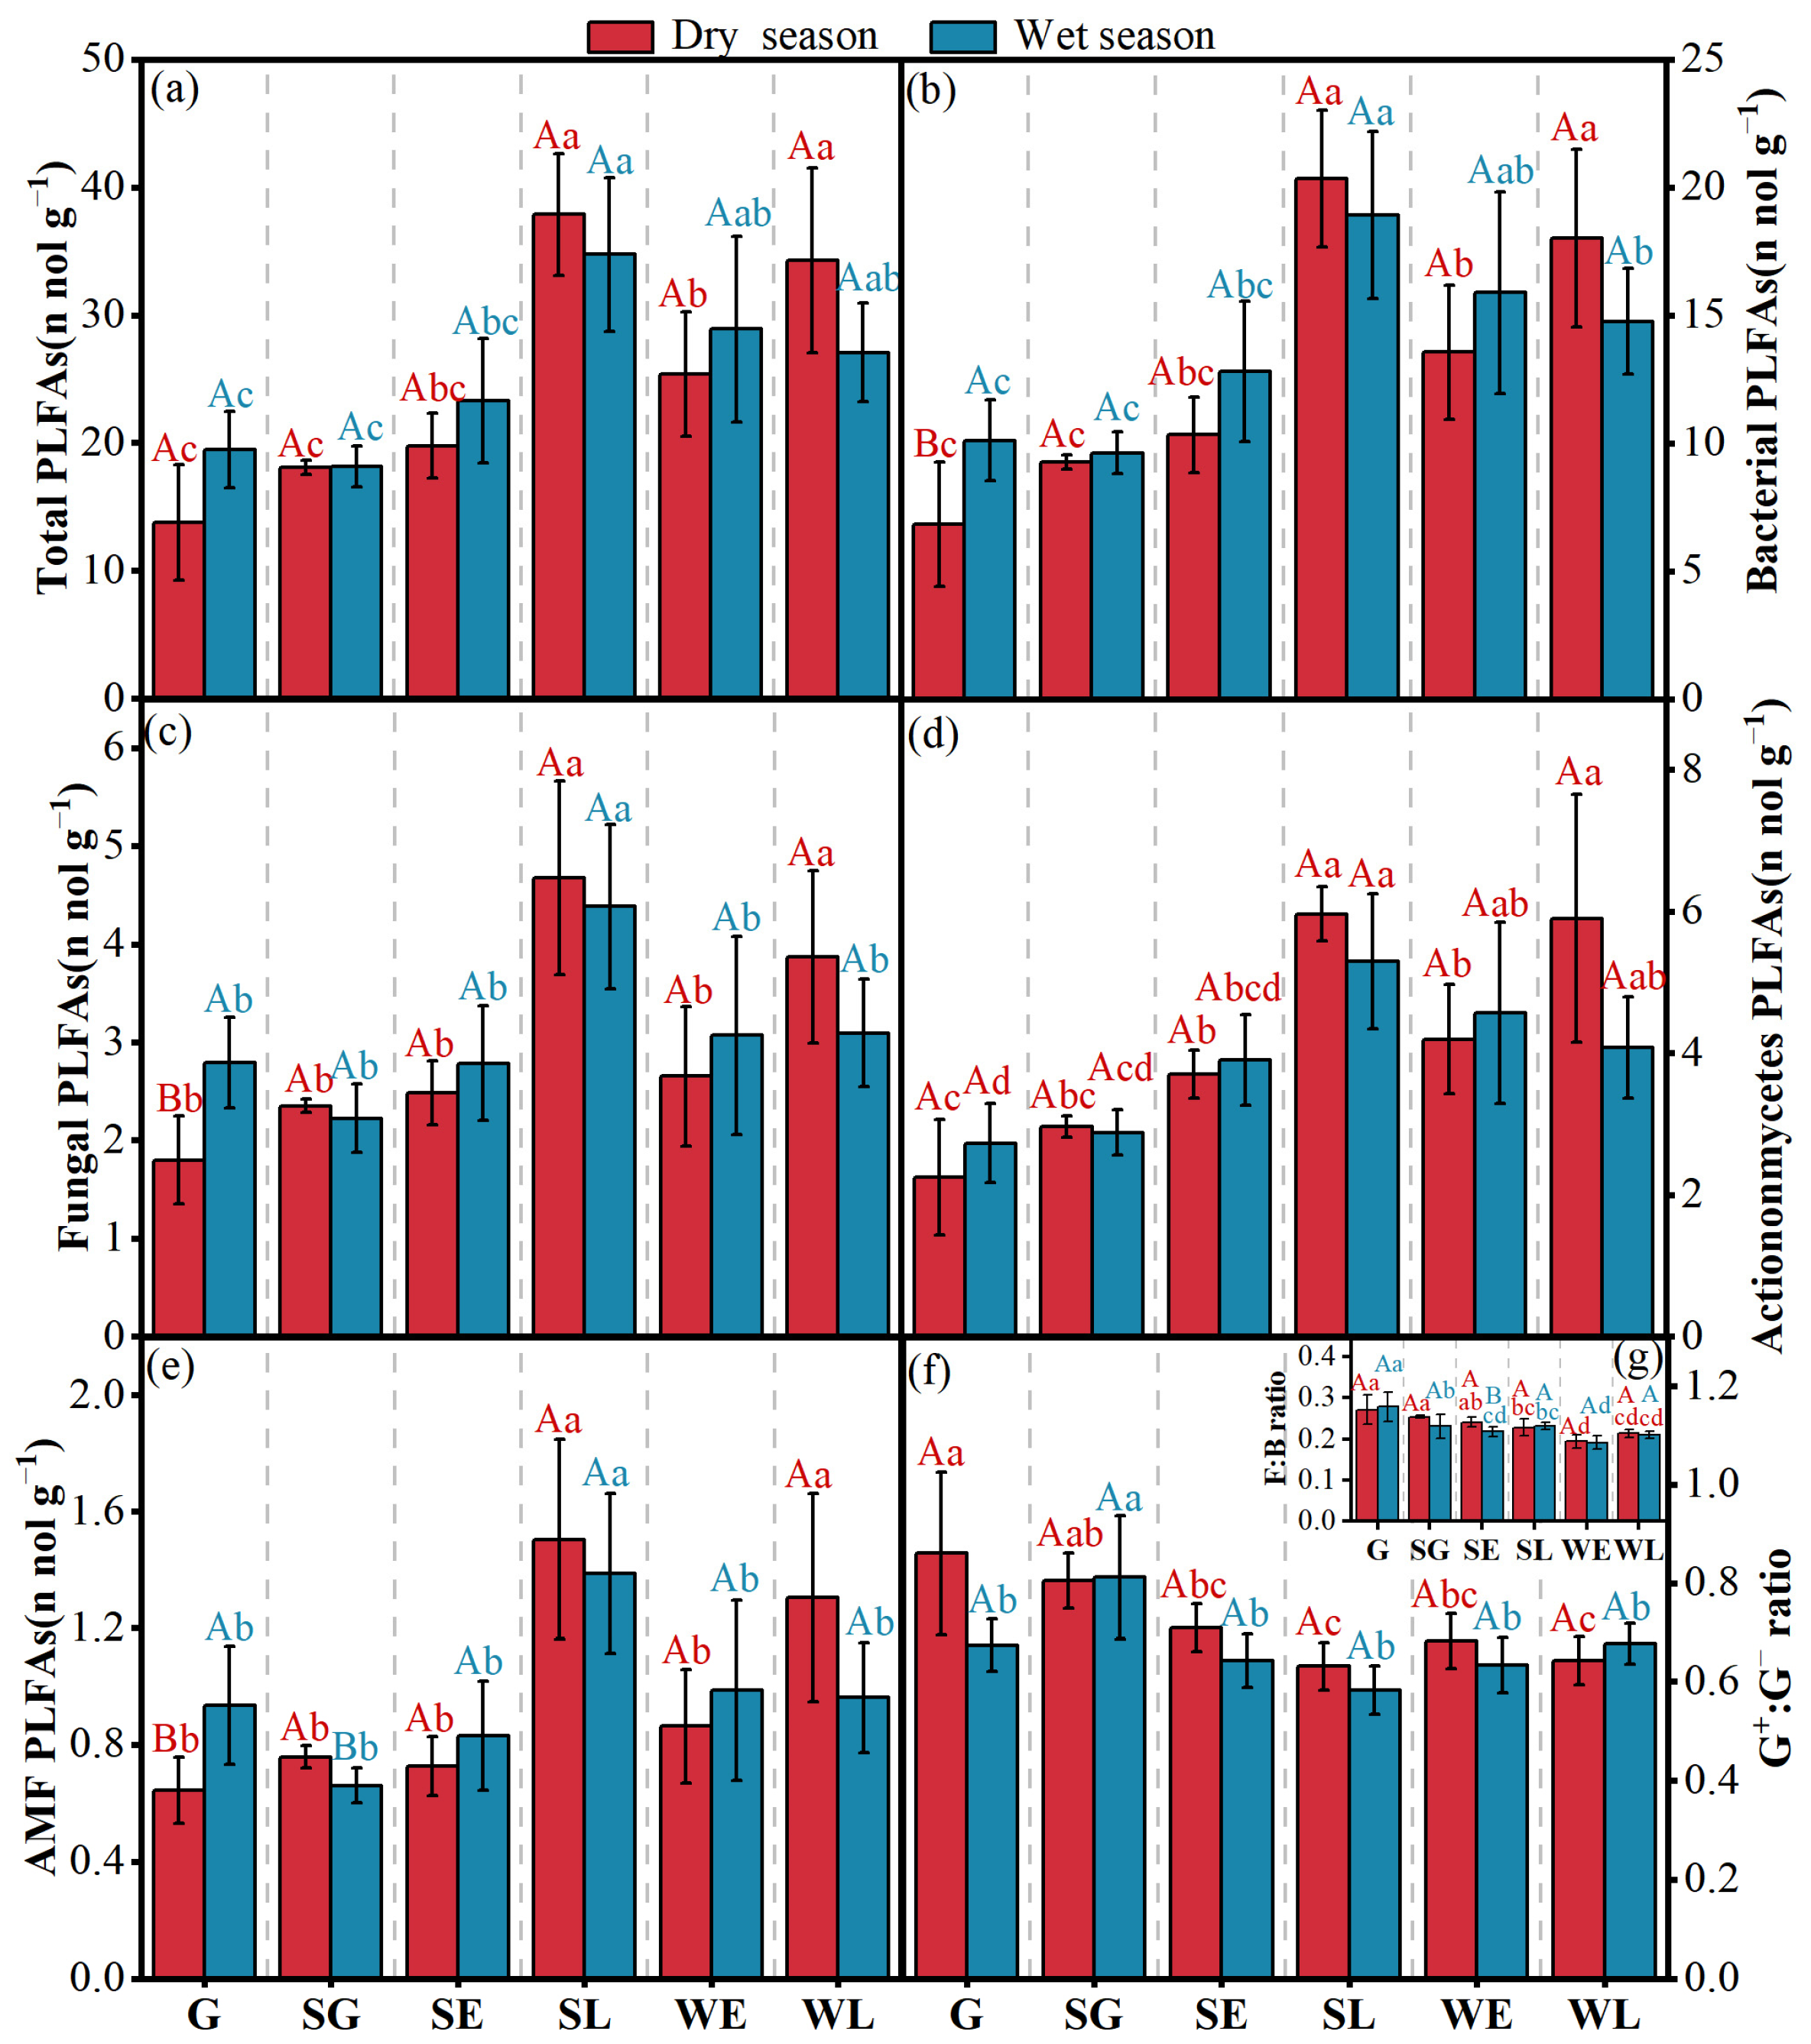
Vegetation restoration significantly influenced soil microbial communities (Figure 4). The soil total microbial community abundance ranged from 13.8 to 37.9 nmol g−1 (Figure 4a), and the soil bacterial abundance ranged from 6.84 to 20.3 nmol g−1 (Figure 4b) during vegetation restoration. Bacteria contributed more than 50% to the total microbial community abundance, indicating that bacteria dominated the microbial community. In the late-stage shrubland, the abundance of the total microbial community, bacteria, fungi, actinomycetes, and AMF in the soil was significantly higher than in the grassland, shrub-grassland, and early-stage shrubland (Figure 4a–e). In the dry season, the soil total microbial community, bacteria, fungi, actinomycetes, and AMF abundances in the late-stage shrubland and woodland were significantly higher than those in the early stage of woodland. In the rainy season, the soil bacterial abundance was significantly lower in the late-stage woodland than in the late-stage shrubland, and the soil fungal and AMF abundances were significantly lower in the early- and late-stage woodland than those in the late-stage shrubland. With vegetation restoration, the soil G+:G and F:B ratios showed a decreasing trend (Figure 4f,g). Except for the grassland, there was no significant difference in the abundance of the soil microorganisms between the dry season and rainy season at the same restoration stage. In the grassland, the soil bacterial, fungal, and AMF abundances were significantly lower in the dry season than in the rainy season.

3.3. Soil Organic Nitrogen Mineralization and Nitrification Rates

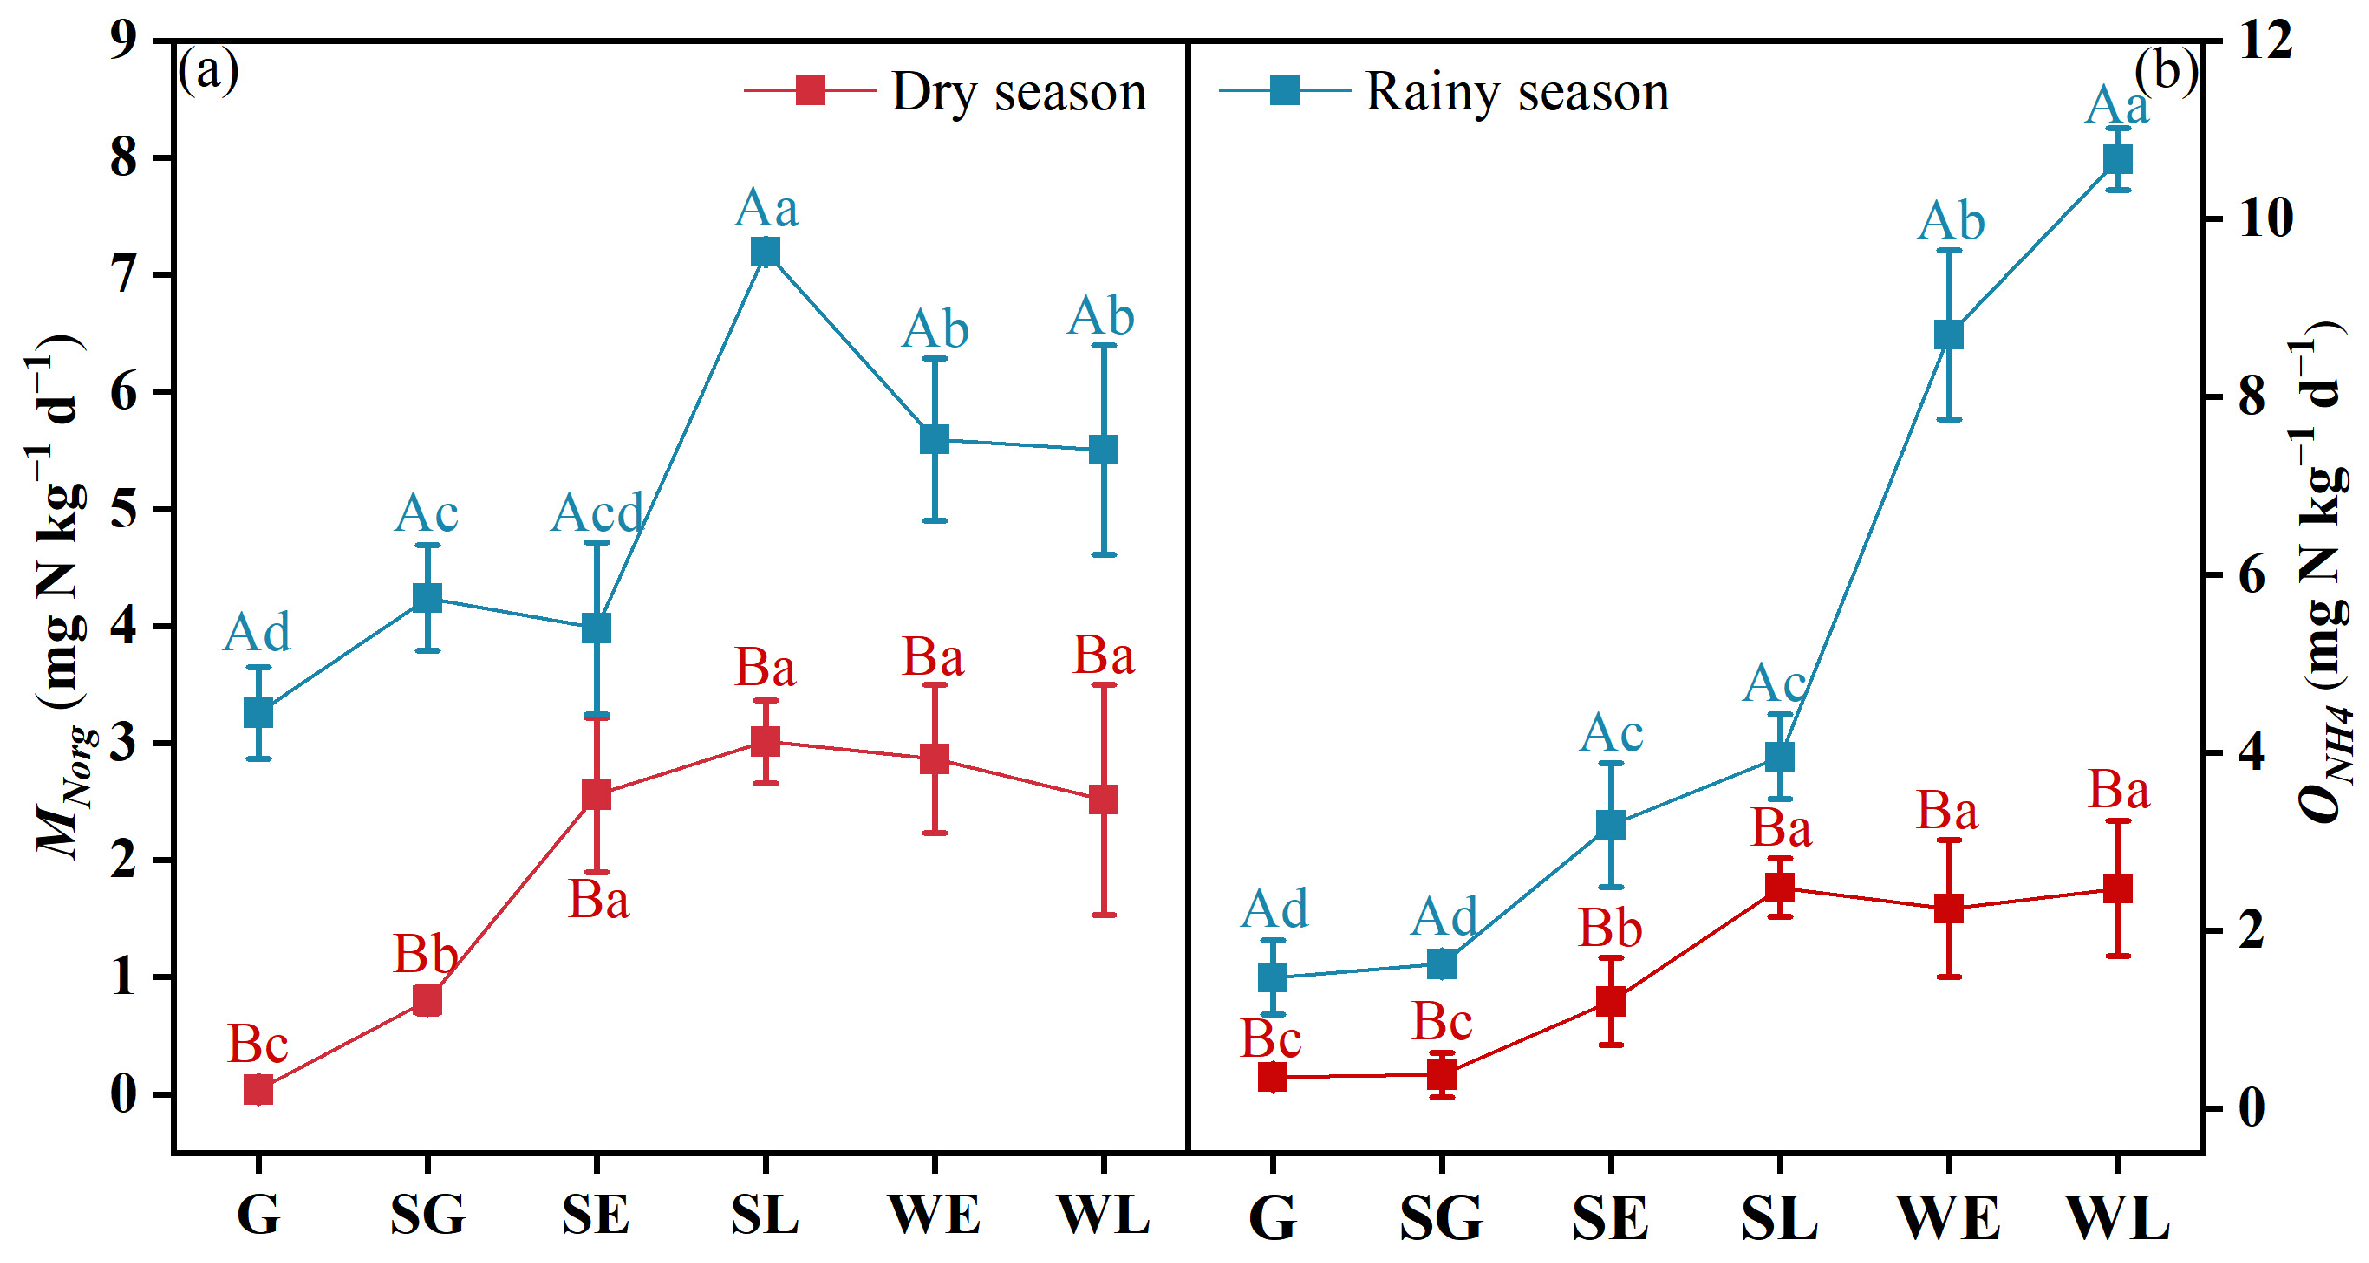
During vegetation restoration, MNorg ranged from 0.04 to 7.20 mg N kg−1 d−1 (Figure 5a), and ONH4 ranged from 0.35 to 10.7 mg N kg−1 d−1 (Figure 5b). Vegetation restoration and seasonal variations could significantly affect MNorg and ONH4, which were markedly lower in the dry season than in the rainy season. In the dry season, as restoration progressed, MNorg increased significantly from 0.04 mg N kg−1 d−1 (in the grassland) to 3.01 mg N kg−1 d−1, and ONH4 increased significantly from 0.35 mg N kg−1 d−1 (in the grassland) to 2.48 mg N kg−1 d−1, both reaching the maximum at the later-stage shrubland. The MNorg in the shrubland and woodland stages was significantly higher than that in the grassland and shrub-grassland in the dry season. In the rainy season, MNorg increased significantly from 3.26 mg N kg−1 d−1 (in the grassland) to 7.20 mg N kg−1 d−1, reaching the maximum in the later-stage shrubland. The MNorg in the woodland stages was significantly lower than that in the late-stage shrubland, and significantly higher than that in the grassland, shrub-grassland, and early-stage shrubland in the rainy season. In the rainy season, ONH4 increased significantly from 1.47 mg N kg−1 d−1 (in the grassland) to 10.7 mg N kg−1 d−1, reaching a maximum in the late-stage woodland. At the same vegetation restoration stage, the MNorg and ONH4 in the rainy season were markedly higher than those in the dry season.

3.4. Factors Affecting Soil Organic Nitrogen Mineralization and Nitrification Rates

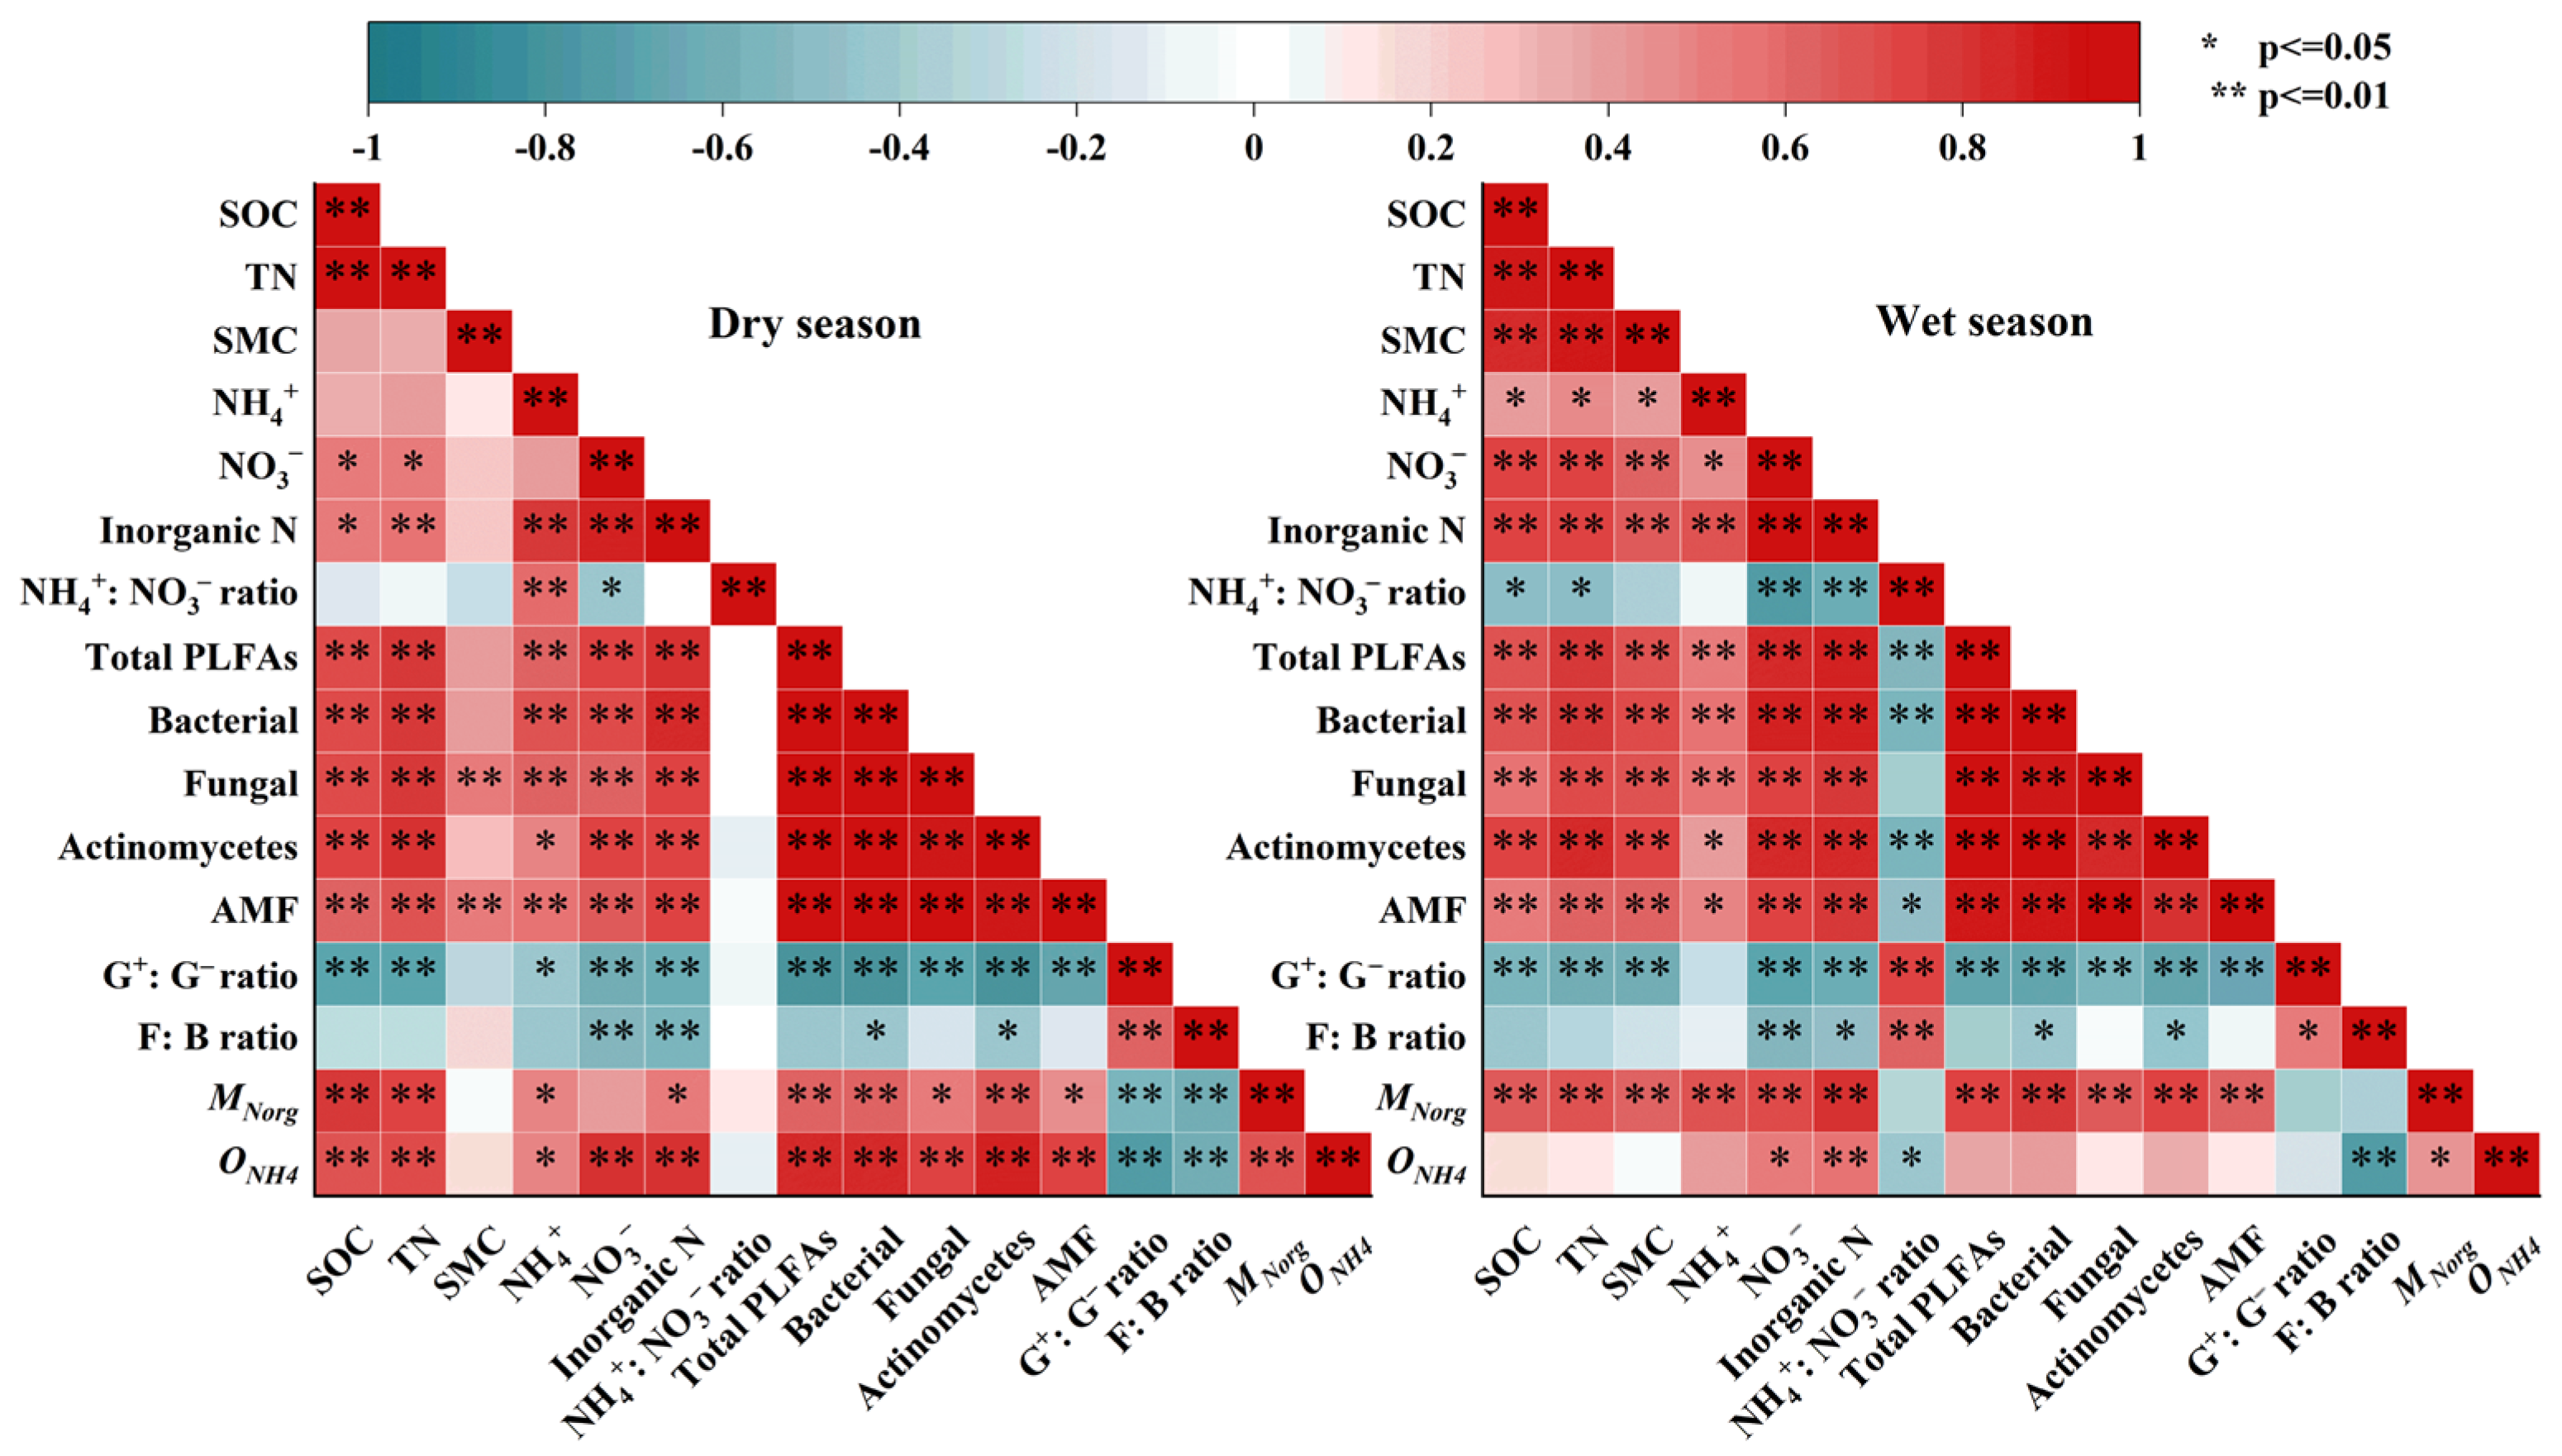
During the dry season, MNorg and ONH4 showed strong and positive correlations with SOC, TN, NH4+, NO3, and inorganic N contents, as well as the total microbial community, bacteria, fungi, actinomycetes, and AMF abundances, and significant negative correlations with soil G+:G and F:B ratios (Figure 6). The MNorg during the rainy season was significantly and positively correlated with SOC, TN, NH4+, NO3, and inorganic N contents, SMC, and abundances of total microbial communities, bacteria, fungi, actinomycetes, and AMF. The ONH4 during the rainy season was significantly and positively correlated with soil NO3 and inorganic N contents, as well as MNorg, and significantly and negatively correlated with soil F:B ratios.
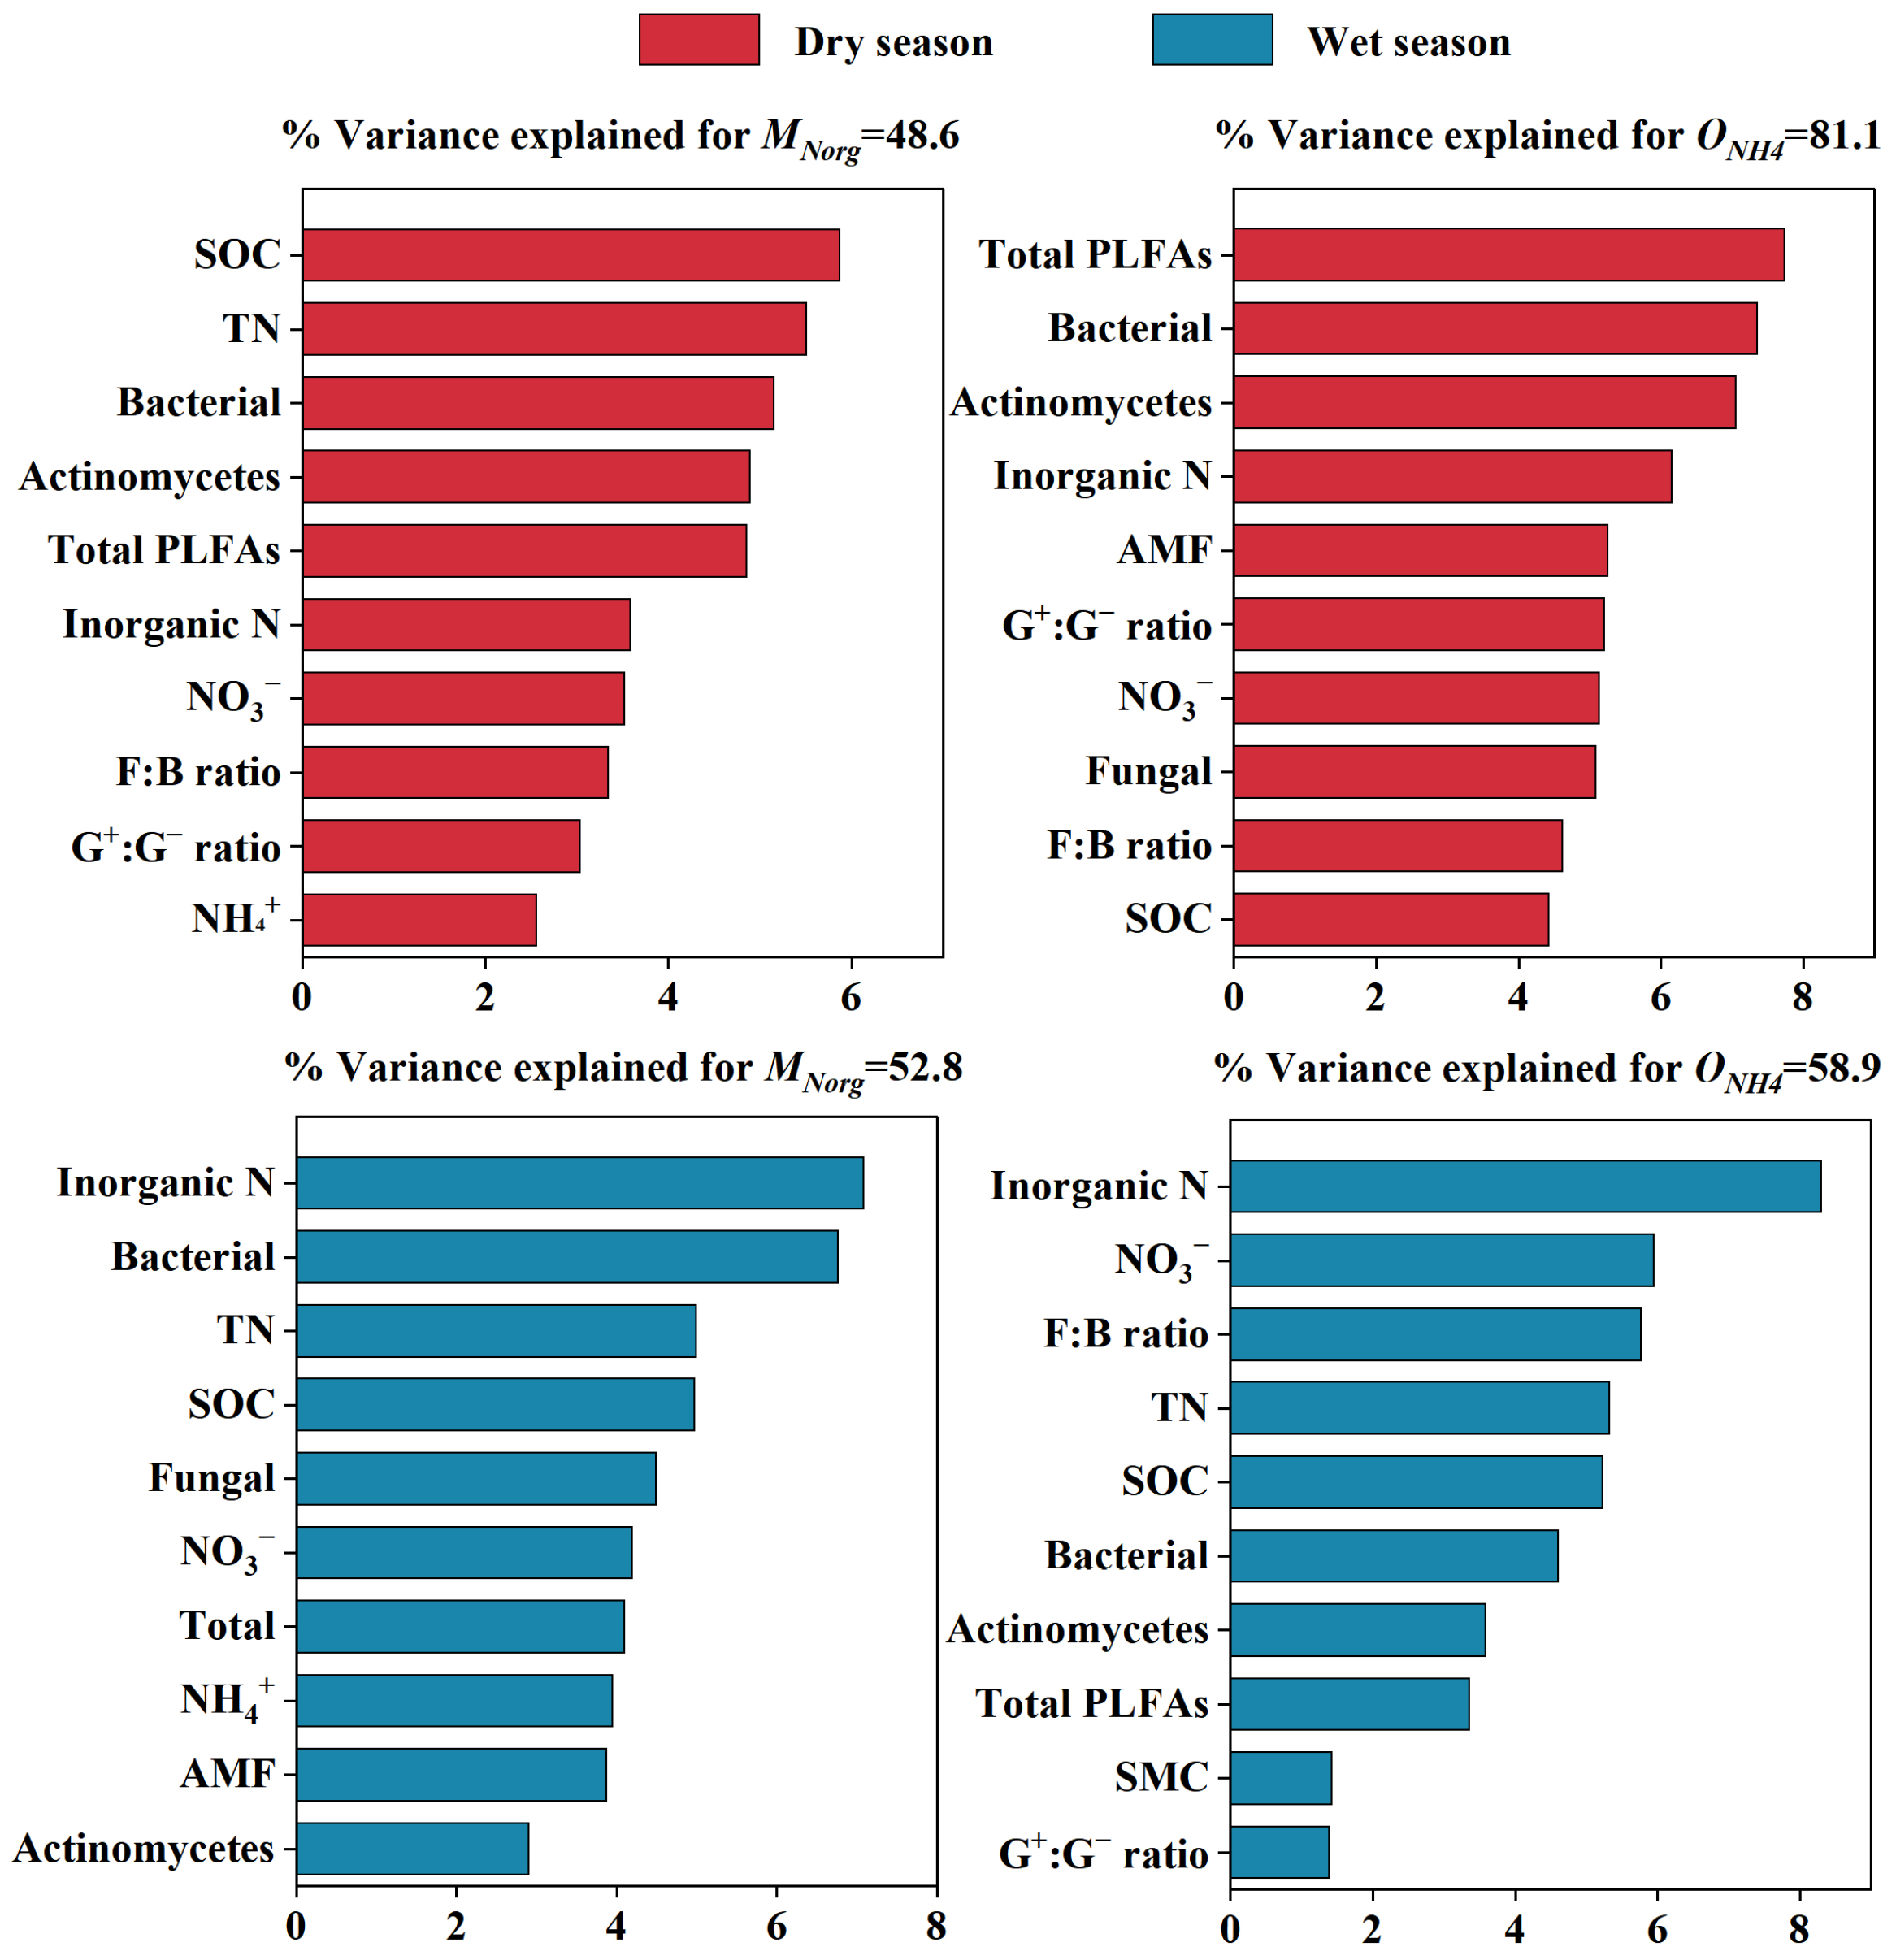
Both MNorg and ONH4 were significantly impacted by vegetation restoration and seasonal variations, suggesting that these two factors could independently influence soil N transformation processes (Table 2). At the same time, there was a noteworthy interaction impact between vegetation restoration and seasonal variations, indicating that vegetation restoration affects the MNorg and ONH4 differently in various seasons. A Random Forest analysis found that during the dry season, MNorg was primarily driven by SOC and TN contents, as well as bacteria, actinomycetes, and total microbial community abundances (Figure 7). ONH4 was mainly influenced by the total microbial community, bacteria, and actinomycetes abundances, inorganic N content, and AMF abundance in the dry season. During the rainy season, MNorg was primarily influenced by inorganic N content, bacteria abundance, TN and SOC contents, and fungi abundance, while ONH4 was mainly influenced by inorganic N and NO3 contents, the F: B ratio, TN, and SOC contents.

4. Discussion

4.1. Changes in Soil Microbial Community During Vegetation Restoration in Karst Region

In the late-stage shrubland, the abundance of the total microbial community, bacteria, fungi, actinomycetes, and AMF in the soil was highest and was significantly higher than in the grassland, shrub-grassland, and early-stage shrubland (Figure 4). These results differ from those of other ecosystems. Cai et al. [45] conducted a study on the Loess Plateau and found that the abundance of the total microbial community, bacteria, fungi, actinomycetes, and AMF in the soil increased significantly with vegetation restoration and reached a maximum in the later-stages woodland. The reasons for these differences might be related to soil organic carbon (SOC) and total nitrogen (TN) contents. Studies have shown that SOC and TN contents could significantly influence soil microbial communities [45,46]. With vegetation restoration, SOC and TN contents increased significantly (Figure 3a,b), which could promote microbial growth and increase the abundance of soil microorganisms [47]. The abundance of the total microbial community, bacteria, fungi, actinomycetes, and AMF was significantly and positively correlated with SOC and TN contents, which further proved that SOC and TN could significantly influence soil microorganisms. In this study, SOC and TN contents reached a maximum in the late-stage shrubland, which might be the reason why the microbial community abundance was greatest in the late-stage shrubland. In addition, within a certain range, the soil moisture content (SMC) was significantly and positively correlated with the abundance of soil microorganisms [48]. With vegetation restoration, the SMC showed a trend of first increasing and then decreasing, reaching a maximum in the late-stage shrubland, which might also be a reason why the various microbial groups reached a maximal level in the late-stage shrubland. The soil F:B ratio decreased significantly with vegetation restoration, indicating that the soil microbial community structure had changed significantly. Notably, soil microbial communities did not differ significantly between the dry and rainy seasons at the same restoration stage, in contrast to previous studies, where microbial communities were markedly greater in the dry season than in the rainy season [32,49,50]. This might be because we only took two samples, so the mechanism of seasonal impact on soil microbial communities might require further research. This study mainly used the phospholipid fatty acid (PLFA) method to analyze the types and abundance of soil microbial communities. This method could determine and quantify microbial fatty acids in soil and help to identify different microbial communities. However, there were some limitations. For example, the PLFA method had relatively low levels of classification and could not detect soil microorganisms at the genus and species level, which might underestimate the diversity of the microbial community, and environmental disturbances might also affect the results of the test. In order to obtain more accurate and comprehensive information on microbial diversity, future studies need to combine other methods, such as 16S rRNA gene sequencing, to make up for the shortcomings of the PLFA method, so as to more comprehensively elucidate the structure and function of soil microbial communities.

4.2. Soil Organic Nitrogen Mineralization and Nitrification Rates During Vegetation Restoration in Karst Region

With vegetation restoration, soil NH4+, NO3, and inorganic N contents increased significantly (Figure 2), suggesting that vegetation restoration increased the available soil N content, which agrees with previous research [1]. Except for the grassland and shrub-grassland, the ratios of soil NH4+:NO3 were less than 1 in other restoration stages, indicating that the inorganic N in soil was primarily NO3. This finding was inconsistent with results conducted in a non-karst region where NH4+ dominated inorganic N [51]. The reason for these differences in the inorganic N form might be attributed to the processes of soil inorganic N supply.
Soil organic N mineralization to NH4+ and the oxidation of NH4+ to NO3, as the main processes of NH4+ and NO3 production, can significantly influence the content and form of inorganic N in soil [52,53]. The rates of organic N mineralization (MNorg) and nitrification (ONH4) ranged from 0.04 to 7.20 mg N kg−1 d−1 and 0.35 to 10.7 mg N kg−1 d−1 (Figure 5), respectively, indicating that these rates have greater variability during vegetation restoration in karst regions. Compared with grassland and shrub-grassland, the MNorg and ONH4 greatly increased in the late-stage shrubland, and early- and late-stage woodland, suggesting that vegetation restoration significantly increased soil N transformation rates in karst regions. This was distinct from red soils, where MNorg increases while ONH4 decreases with vegetation restoration, resulting in soil inorganic N dominated by NH4+ [51,54]. In addition, ONH4 in the later stages of karst vegetation restoration (2.25–10.7 mg N kg−1 d−1) was significantly higher than that in forest soils of non-karst regions (0.24 mg N kg−1 d−1) [51]. Noticeably, with vegetation restoration, the MNorg and ONH4 in karst regions increased significantly, resulting in higher soil inorganic N content dominated by NO3, which might lead to a high risk of NO3 leaching under abundant rainfall.

4.3. Factors Influencing Soil Organic Nitrogen Mineralization and Nitrification Rates During Vegetation Restoration in Karst Region

In this study, MNorg increased significantly with vegetation restoration, reaching a maximum in the late-stage shrubland (Figure 5), likely due to changes in soil nutrients and microbial communities [1,11]. Soil organic carbon and TN contents also increased with vegetation restoration, providing substrate and energy for the organic N mineralization process [1] and subsequently raising the level of MNorg. Bacteria tend to preferentially utilize unstable organic matter [55], and actinomycetes tend to use recalcitrant organic matter as their preferred substrate [56]. Soil bacterial and actinomycete abundances both increased significantly with vegetation restoration, which might simultaneously accelerate the decomposition of unstable and recalcitrant organic matter, leading to higher MNorg. A previous study had shown that MNorg was also significantly and positively correlated with soil AMF abundance [57]. Soil organic carbon and TN contents, as well as total microbial community, fungi, bacteria, actinomycetes, and AMF abundances, were all greatest in the late-stage shrubland, which explained the fact that the MNorg was greatest in the late-stage shrubland. In addition, the SOC and TN contents, as well as MNorg, increased significantly from grassland to the early-stage shrubland, whereas there were no significant differences in soil microbial communities, suggesting that soil microbial communities responded to vegetation restoration later than the soil nutrient supply.
The soil nitrification process is another important pathway to produce available soil N. ONH4 increased significantly during vegetation restoration in karst regions (Figure 5b), which differs from the patterns observed in soils from non-karst regions [36,39]. This difference might be due to the high pH and calcium content in karst soils [24,58]. Studies have shown that a high pH could stimulate the growth of nitrifying microorganisms and promote the nitrification process [26]. Additionally, SOC and TN were easily accumulated in high calcium soil, and the increase in SOC and TN contents significantly increased the activity of nitrifying microorganisms [59], which, in turn, increased ONH4. The correlation between ONH4 and soil properties and microbial communities varied greatly in the dry and rainy seasons, but both were significantly positively correlated with the soil NO3- content. The primary reason was that soil NO3 was a direct product of the nitrification process. When ONH4 was greater, the potential for NO3 production in the soil was also greater, which was conducive to the accumulation of NO3 in the soil [13]. ONH4 was also significantly positively correlated with MNorg, which might be due to the fact that the organic N mineralization process could provide substrates for the nitrification process. ONH4 was significantly negatively correlated with the soil F:B ratio, suggesting that changes in the composition and structure of soil microbial communities could significantly affect ONH4.
During vegetation restoration, the MNorg and ONH4 at the same restoration stage showed obvious seasonal variations, with rates significantly higher in the rainy season than in the dry season (Figure 5). These results agreed with previous studies in other regions [60,61,62]. Within a certain range, MNorg increased with rising temperature and moisture [63,64], and ONH4 was also strongly related to the temperature and moisture content [52]. In addition, the primary factors influencing MNorg and ONH4 changed significantly between the dry and rainy seasons (Figure 7). Vegetation restoration and seasonal variations not only independently affected the soil N transformation process, but there was also a significant interaction effect between the two (Table 2), suggesting that seasonal variations regulated the influences of vegetation restoration on MNorg and ONH4. In conclusion, the results verified the hypothesis that MNorg and ONH4 increased significantly with vegetation restoration in the karst region and were higher in the rainy season than in the dry season. Future research will focus on the long-term dynamics of soil N cycling and its regulatory mechanisms during vegetation restoration in karst regions. This includes the long-term monitoring of trends in the evolution of N transformation rates, revealing the mechanisms driving nitrifying microbes in high-calcium, high-pH environments, quantifying the impacts of multifactorial interactions of climate, soil, and microbes on N transformation, and developing ecological regulation techniques that target the risk of NO3 leaching.

5. Conclusions

Vegetation restoration in karst regions significantly increased soil organic N mineralization and nitrification rates. This change was primarily due to the low SOC and TN contents in the grassland soil, which limited the growth of soil microorganisms and thus inhibited soil organic N mineralization and nitrification rates. With vegetation restoration advancing, the SOC and TN contents, as well as the abundance of fungi, bacteria, actinomycetes, AMF, and total microbial communities increased significantly and reached a maximum at the late-stage shrubland. These changes not only provided abundant substrates and energy sources for the organic N mineralization and nitrification processes, but the increase in microbial community abundance also stimulated these processes, thereby increasing their rates. Compared with the grassland, shrub-grassland, and early-stage shrubland, the soil organic N mineralization and nitrification rates were higher in the late-stage shrubland and woodland, resulting in the inorganic N content increasing and being dominated by NO3. Correlation analyses further showed that the increase in the soil organic N mineralization rate during vegetation restoration was closely related to the increase in SOC and TN contents, as well as the abundance of the total microbial community, bacteria, fungi, actinomycetes, and AMF, while the increase in the soil nitrification rate was mainly related to the increase in the organic N mineralization rate and the decrease in the soil F:B ratio. In addition, the soil organic N mineralization and nitrification rates were significantly higher in the rainy season than in the dry season at the same restoration stage. In summary, vegetation restoration played an important role in improving the soil nutrient content, increasing the abundance of microbial communities, and improving the soil N cycle. At the same time, seasonal variations also had an important impact on soil organic N mineralization and nitrification processes. The results could provide a reference basis for future ecological restoration practices and soil N management.

Author Contributions

Conceptualization, L.Y., L.M. and T.Z.; Methodology, H.Y.; Validation, L.Y., S.Y., L.L., D.W. and X.L.; Formal Analysis, L.Y. and D.L.; Data Curation, L.Y.; Writing—Original Draft Preparation, L.Y.; Writing—Review and Editing, T.Z., Z.D. and J.L.; Funding Acquisition, T.Z. All authors have read and agreed to the published version of the manuscript.

Funding

This research was supported by the Guangxi Science and Technology Planning Project, China (2023GXNSFFA026010), CAGS Research Fund (YYWF 2023015), 2025 Guangxi Bureau of Geology and Mineral Prospecting and Exploitation and Development Bureau Departmental Budget Preliminary Geological Research Project (GXGS202511) and the Geological Survey Project, China (DD20240095).

Data Availability Statement

Data will be made available on request.

Conflicts of Interest

The authors declare no conflicts of interest.

References

  1. Liu, L.J.; Zhu, Q.L.; Yang, L.; Elrys, A.S.; Sun, J.F.; Ni, K.; Meng, L.; Zhu, T.B. Afforestation increases soil inorganic N supply capacity and lowers plant N limitation in subtropical karst areas. Geoderma 2024, 443, 116848. [Google Scholar] [CrossRef]
  2. Jiang, Z.C.; Lian, Y.Q.; Qin, X.Q. Rocky desertification in Southwest China: Impacts, causes, and restoration. Earth-Sci. Rev. 2014, 132, 1–12. [Google Scholar] [CrossRef]
  3. D’Ettorre, U.S.; Liso, I.S.; Parise, M. Desertification in karst areas: A review. Earth-Sci. Rev. 2024, 253, 104786. [Google Scholar] [CrossRef]
  4. Guo, B.; Yang, F.; Fan, Y.W.; Zang, W.Q. The dominant driving factors of rocky desertification and their variations in typical mountainous karst areas of Southwest China in the context of global change. Catena 2023, 220, 106674. [Google Scholar] [CrossRef]
  5. Wang, L.J.; Luo, N.N.; Shi, Q.L.; Sheng, M.Y. Responses of soil labile organic carbon fractions and enzyme activities to long-term vegetation restorations in the karst ecosystems, Southwest China. Ecol. Eng. 2023, 194, 107034. [Google Scholar] [CrossRef]
  6. Cheng, H.T.; Zhou, X.H.; Dong, R.H.; Wang, X.M.; Liu, G.D.; Li, Q.F. Natural vegetation regeneration facilitated soil organic carbon sequestration and microbial community stability in the degraded karst ecosystem. Catena 2023, 222, 106856. [Google Scholar] [CrossRef]
  7. Wang, K.L.; Zhang, C.H.; Chen, H.S.; Yue, Y.M.; Zhang, W.; Zhang, M.Y.; Qi, X.K.; Fu, Z.Y. Karst landscapes of China: Patterns, ecosystem processes and services. Landsc. Ecol. 2019, 34, 2743–2763. [Google Scholar] [CrossRef]
  8. Lu, Z.X.; Wang, P.; Ou, H.B.; Wei, S.X.; Wu, L.C.; Jiang, Y.; Liu, Z.M. Effects of different vegetation restoration on soil nutrients, enzyme activities, and microbial communities in degraded karst landscapes in southwest China. For. Ecol. Manag. 2022, 508, 120002. [Google Scholar] [CrossRef]
  9. Mushia, N.M.; Ramoelo, A.; Ayisi, K.K. The impact of the quality of coal mine stockpile soils on sustainable vegetation growth and productivity. Sustainability 2016, 8, 546. [Google Scholar] [CrossRef]
  10. Moreau, D.; Bardgett, R.D.; Finlay, R.D.; Jones, D.L.; Philippot, L. A plant perspective on nitrogen cycling in the rhizosphere. Funct. Ecol. 2019, 33, 540–552. [Google Scholar] [CrossRef]
  11. Perring, M.P.; Hedin, L.O.; Levin, S.A.; McGroddy, M.; Mazancourt, C.D. Increased plant growth from nitrogen addition should conserve phosphorus in terrestrial ecosystems. Proc. Natl. Acad. Sci. USA 2008, 105, 1971–1976. [Google Scholar] [CrossRef] [PubMed]
  12. Wen, D.N.; Cheng, Y.; Yang, L.; Qin, X.H.; Meng, L.; He, Q.X.; Zhu, T.B.; Müller, C. Effects of agricultural cultivation on soil organic nitrogen mineralization in karst regions. Carsol. Sin. 2020, 29, 189195. [Google Scholar]
  13. Elrys, A.S.; Wang, J.; Metwally, M.A.; Cheng, Y.; Zhang, J.B.; Cai, Z.C.; Chang, S.X.; Müller, C. Global gross nitrification rates are dominantly driven by soil carbon-to-nitrogen stoichiometry and total nitrogen. Glob. Change Biol. 2021, 27, 6512–6524. [Google Scholar] [CrossRef]
  14. Tao, Y.L.; Xie, W.J.; Xu, L.; Zhang, L.C.; Wang, G.M.; Wang, X.N.; Shi, C.L. The characteristics of soil salinization effects on nitrogen mineralization and nitrification in upland fields. Front. Environ. Sci. 2024, 12, 1369554. [Google Scholar] [CrossRef]
  15. Martens, R. Current methods for measuring microbial biomass C in soil: Potentials and limitations. Biol. Fertil. Soils 1995, 19, 87–99. [Google Scholar] [CrossRef]
  16. Daly, A.B.; Jilling, A.; Bowles, T.M.; Buchkowski, R.W.; Frey, S.D.; Kallenbach, C.M.; Keiluweit, M.; Mooshammer, M.; Schimel, J.P.; Grandy, A.S. A holistic framework integrating plant-microbemineral regulation of soil bioavailable nitrogen. Biogeochemistry 2021, 154, 211–229. [Google Scholar] [CrossRef]
  17. Skubała, K.; Chowaniec, K.; Stanek, M.; Błaszkowski, J.; Móll, M.; Zubek, S. Soil and vegetation drivers of microbial attributes in a microhabitat mosaic at different successional stages after restoration of inland sand dunes. Appl. Soil Ecol. 2025, 206, 105832. [Google Scholar] [CrossRef]
  18. Xiao, L.; Liu, G.B.; Zhang, J.Y.; Xue, S. Long-term effects of vegetational restoration on soil microbial communities on the Loess Plateau of China. Restor. Ecol. 2016, 24, 794–804. [Google Scholar] [CrossRef]
  19. Zhu, Z.H.; Du, H.; Gao, K.; Fang, Y.T.; Wang, K.L.; Zhu, T.B.; Zhu, J.; Cheng, Y.; Li, D.J. Plant species diversity enhances soil gross nitrogen transformations in a subtropical forest, southwest China. J. Appl. Ecol. 2023, 60, 1364–1375. [Google Scholar] [CrossRef]
  20. Chen, Y.C.; Ma, S.Q.; Jiang, H.M.; Hu, Y.; Lu, X.Y. Influences of litter diversity and soil moisture on soil microbial communities in decomposing mixed litter of alpine steppe species. Geoderma 2020, 377, 114577. [Google Scholar] [CrossRef]
  21. Roa-Fuentes, L.L.; Martínez-Garza, C.; Etchevers, J.; Campo, J. Recovery of soil C and N in a tropical pasture: Passive and active restoration. Land Degrad. Dev. 2015, 26, 201–210. [Google Scholar] [CrossRef]
  22. Singha, D.; Brearley, F.Q.; Tripathi, S.K. Fine root and soil nitrogen dynamics during stand development following shifting agriculture in Northeast India. Forests 2020, 11, 1236. [Google Scholar] [CrossRef]
  23. Zhao, Y.P.; Zhao, Y.Q.; Zhang, S.H.; Xu, Y.L.; Han, X.H.; Yang, G.h.; Ren, C.J. N-cycle gene abundance determination of N mineralization rate following re-afforestation in the Loess Plateau of China. Soil Ecol. Lett. 2024, 6, 230188. [Google Scholar] [CrossRef]
  24. Liang, J.H.; Cui, X.D.; Wen, L.Y.; Liu, D.; Yi, C.X.; Huang, K.Z.; Wang, J. Comparison of soil calcium and magnesium fractions transport in classic karst and non-karst region, Guilin. Carsol. Sin. 2022, 41, 220–227. (In Chinese) [Google Scholar]
  25. Rowley, M.C.; Grand, S.; Verrecchia, E.P. Calcium-mediated stabilization of soil organic carbon. Biogeochemistry 2018, 137, 27–49. [Google Scholar] [CrossRef]
  26. Rütting, T.; Schleusner, P.; Hink, L.; Prosser, J.I. The contribution of ammonia–oxidizing archaea and bacteria to gross nitrification under different substrate availability. Soil Boil. Biochem. 2021, 160, 108353. [Google Scholar] [CrossRef]
  27. Banning, N.C.; Grant, C.D.; Jones, D.L.; Murphy, D.V. Recovery of soil organic matter, organic matter turnover and nitrogen cycling in a post–mining forest rehabilitation chronosequence. Soil Boil. Biochem. 2008, 40, 2021–2031. [Google Scholar] [CrossRef]
  28. Zhu, X.A.; Jiang, X.J.; Singh, A.K.; Zeng, H.H.; Chen, C.F.; Lu, E.F.; Liu, W.J. Reduced litterfall and decomposition alters nutrient cycling following conversion of tropical natural forests to rubber plantations. Ecol. Indic. 2022, 138, 108819. [Google Scholar] [CrossRef]
  29. Lv, P.; Zuo, X.; Sun, S.; Zhang, J.; Zhao, S.; Hu, Y. Seasonal changes of soil nitrogen mineralization along restoration gradient of sandy grassland, northern China. Pol. J. Ecol. 2021, 68, 283–295. [Google Scholar] [CrossRef]
  30. Beesigamukama, D.; Mochoge, B.; Korir, N.; Ghemoh, C.J.; Subramanian, S.; Tanga, C.M. In situ nitrogen mineralization and nutrient release by soil amended with black soldier fly frass fertilizer. Sci. Rep. 2021, 11, 14799. [Google Scholar] [CrossRef]
  31. Pandey, R.; Bargali, S.S.; Bargali, K. Seasonal dynamics of soil Inorganic N and N-mineralization in sub-tropical Sal forest in Central Himalaya, India. J. Sci. Res. 2022, 66, 161–175. [Google Scholar]
  32. Wang, W.X.; Cheng, R.M.; Shi, Z.M.; Ingwersen, J.; Luo, D.; Liu, S.R. Seasonal dynamics of soil respiration and nitrification in three subtropical plantations in southern China. IForest 2016, 9, 813. [Google Scholar] [CrossRef]
  33. Zhu, X.; Zou, X.; Lu, E.; Deng, Y.; Luo, Y.; Chen, H.; Liu, W. Litterfall biomass and nutrient cycling in karst and nearby non-karst forests in tropical China: A 10-year comparison. Sci. Total Environ. 2021, 758, 143619. [Google Scholar] [CrossRef]
  34. Zhang, Z.; Chen, X.; Li, S.; Yue, F.; Cheng, Q.; Peng, T.; Soulsby, C. Linking nitrate dynamics to water age in underground conduit flows in a karst catchment. J. Hydrol. 2021, 596, 125699. [Google Scholar] [CrossRef]
  35. Rolo, V.; Olivier, P.I.; Guldemond, R.A.R.; van Aarde, R.J. Validating space-for-time substitution in a new-growth coastal dune forest. Appl. Veg. Sci. 2016, 19, 235–243. [Google Scholar] [CrossRef]
  36. Dor, M.; Fan, L.C.; Zamanian, K.; Kravchenko, A.N. Long-term land use conversion influence on soil pore structure and organic carbon. Agric. Ecosyst. Environ. 2025, 387, 109633. [Google Scholar] [CrossRef]
  37. Guo, X.J.; Gong, X.P.; Shi, J.S.; Guo, J.; Domínguez-Villar, D.; Lin, Y.S.; Wang, H.W.; Yuan, D.X. Temporal variations and evaporation control effect of the stable isotope composition of precipitation in the subtropical monsoon climate region, Southwest China. J. Hydrol. 2021, 599, 126278. [Google Scholar] [CrossRef]
  38. Zhang, Z.Z.; Zang, R.G.; Wang, G.Y.; Huang, X.R. Classification of landscape types based on land cover, successional stages and plant functional groups in a species-rich forest in Hainan Island, China. Trop. Conserv. Sci. 2016, 9, 135–152. [Google Scholar] [CrossRef]
  39. Li, D.J.; Wen, L.; Xiao, K.C.; Song, T.Q.; Wang, K.L. Responses of soil gross nitrogen transformations to three vegetation restoration strategies in a subtropical karst region. Land Degrad. Dev. 2021, 32, 2520–2527. [Google Scholar] [CrossRef]
  40. Kirkham, D.; Bartholomew, W.V. Equations for following nutrient transformations in soil utilizing tracer data. Soil Sci. Soc. Am. Proc. 1954, 18, 33–34. [Google Scholar] [CrossRef]
  41. Bremner, J.M.; Keeney, D.R. Determination and isotope-ratio analysis of different forms of nitrogen in soils: 3. Exchangeable ammonium, nitrate, and nitrite by extraction-distillation methods. Soil Sci. Soc. Am. J. 1966, 30, 577–582. [Google Scholar] [CrossRef]
  42. Bossio, D.A.; Scow, K.M. Impacts of carbon and flooding on soil microbial communities: Phospholipid fatty acid profiles and substrate utilization patterns. Microb. Ecol. 1998, 35, 265–278. [Google Scholar] [CrossRef]
  43. Li, C.; Cano, A.; Acosta-Martinez, V.; Veum, K.S.; Moore-Kucera, J. A comparison between fatty acid methyl ester profiling methods (PLFA and EL-FAME) as soil health indicators. Soil Sci. Soc. Am. J. 2020, 84, 1153–1169. [Google Scholar] [CrossRef]
  44. Lewe, N.; Hermans, S.; Lear, G.; Kelly, L.T.; Thomson-Laing, G.; Weisbrod, B.; Deslippe, J.R. Phospholipid fatty acid (PLFA) analysis as a tool to estimate absolute abundances from compositional 16S rRNA bacterial metabarcoding data. J. Microbiol. Methods 2021, 188, 106271. [Google Scholar] [CrossRef]
  45. Cai, X.W.; Zhang, D.; Wang, Y.Q.; Diao, L.F.; Cheng, X.L.; Luo, Y.Q.; An, S.Q.; Yang, W. Shift in soil microbial communities along ~160 years of natural vegetation restoration on the Loess Plateau of China. Appl. Soil Ecol. 2022, 173, 104394. [Google Scholar] [CrossRef]
  46. Hu, P.L.; Xiao, J.; Zhang, W.; Xiao, L.M.; Yang, R.; Xiao, D.; Zhao, J.; Wang, K.L. Response of soil microbial communities to natural and managed vegetation restoration in a subtropical karst region. Catena 2020, 195, 104849. [Google Scholar] [CrossRef]
  47. Brown, R.W.; Chadwick, D.R.; Bending, G.D.; Collins, C.D.; Whelton, H.L.; Daulton, E.; Jones, D.L. Nutrient (C, N and P) enrichment induces significant changes in the soil metabolite profile and microbial carbon partitioning. Soil Boil. Biochem. 2022, 172, 108779. [Google Scholar] [CrossRef]
  48. Brockett, B.F.T.; Prescott, C.E.; Grayston, S.J. Soil moisture is the major factor influencing microbial community structure and enzyme activities across seven biogeoclimatic zones in western Canada. Soil Boil. Biochem. 2012, 44, 9–20. [Google Scholar] [CrossRef]
  49. Smith, A.P.; Marín-Spiotta, E.; Balser, T. Successional and seasonal variations in soil and litter microbial community structure and function during tropical postagricultural forest regeneration: A multiyear study. Glob. Change Biol. 2015, 21, 3532–3547. [Google Scholar] [CrossRef]
  50. Yokobe, T.; Hyodo, F.; Tokuchi, N. Seasonal effects on microbial community structure and nitrogen dynamics in temperate forest soil. Forests 2018, 9, 153. [Google Scholar] [CrossRef]
  51. Xie, Y.; Yang, L.; Zhu, T.B.; Yang, H.; Zhang, J.B.; Yang, J.L.; Cao, J.H.; Bai, B.; Jiang, Z.C.; Liang, Y.M.; et al. Rapid recovery of nitrogen retention capacity in a subtropical acidic soil following afforestation. Soil Boil. Biochem. 2018, 120, 171–180. [Google Scholar] [CrossRef]
  52. Li, Z.L.; Zeng, Z.Q.; Tian, D.S.; Wang, J.S.; Fu, Z.; Zhang, F.Y.; Zhang, W.N.; Luo, Y.Q.; Niu, S.L. Global patterns and controlling factors of soil nitrification rate. Glob. Change Biol. 2020, 26, 4147–4157. [Google Scholar] [CrossRef]
  53. Su, W.Q.; Yu, M.J.; Lin, J.H.; Tang, C.X.; Xu, J.M. Fire decreases gross mineralization rate but does not alter gross nitrification rate in boreal forest soils. Soil Biol. Biochem. 2022, 175, 108838. [Google Scholar] [CrossRef]
  54. Xu, Y.B.; Xu, Z.H. Effects of land use change on soil gross nitrogen transformation rates in subtropical acid soils of Southwest China. Environ. Sci. Pollut. Res. 2015, 22, 10850–10860. [Google Scholar] [CrossRef]
  55. Yuan, Y.; Li, Y.; Mou, Z.J.; Kuang, L.H.; Wu, W.J.; Zhang, J.; Wang, F.M.; Hui, D.F.; Peñuelas, J.; Sardans, J.; et al. Phosphorus addition decreases microbial residual contribution to soil organic carbon pool in a tropical coastal forest. Glob. Change Biol. 2021, 27, 454–466. [Google Scholar] [CrossRef] [PubMed]
  56. Bhatti, A.A.; Haq, S.; Bhat, R.A. Actinomycetes Benefaction Role in Soil and Plant Health. Microb. Pathog. 2017, 111, 458–467. [Google Scholar] [CrossRef]
  57. Zhang, K.R.; Li, X.S.; Cheng, X.L.; Zhang, Z.H.; Zhang, Q.F. Changes in soil properties rather than functional gene abundance control carbon and nitrogen mineralization rates during long-term natural revegetation. Plant Soil 2019, 443, 293–306. [Google Scholar] [CrossRef]
  58. Li, D.J.; Yang, Y.; Chen, H.; Xiao, K.C.; Song, T.Q.; Wang, K.L. Soil gross nitrogen transformations in typical karst and nonkarst forests, southwest China. J. Geophys. Res.-Biogeosci. 2017, 122, 2831–2840. [Google Scholar] [CrossRef]
  59. Chen, Q.; Yang, F.; Cheng, X.L. Effects of land use change type on soil microbial attributes and their controls: Data synthesis. Ecol. Indic. 2022, 138, 108852. [Google Scholar] [CrossRef]
  60. Mo, Q.; Li, Z.A.; Zhu, W.; Zou, B.; Li, Y.; Yu, S.; Wang, F. Reforestation in southern China: Revisiting soil N mineralization and nitrification after 8 years restoration. Sci. Rep. 2016, 6, 19770. [Google Scholar] [CrossRef]
  61. Nie, Y.; Han, X.; Chen, J.; Wang, M.; Shen, W. The simulated N deposition accelerates net N mineralization and nitrification in a tropical forest soil. Biogeosciences 2019, 16, 4277–4291. [Google Scholar] [CrossRef]
  62. Singh, J.S.; Kashyap, A.K. Dynamics of viable nitrifier community, N-mineralization and nitrification in seasonally dry tropical forests and savanna. Microbiol. Res. 2006, 161, 169–179. [Google Scholar] [CrossRef] [PubMed]
  63. Santiago, S.; Geisseler, D. Effects of moisture contents in incorporated residues and soil on net nitrogen mineralization in a laboratory study. Agrosys. Geosci. Environ. 2022, 5, e20268. [Google Scholar] [CrossRef]
  64. Dai, Z.; Yu, M.; Chen, H.; Zhao, H.; Huang, Y.; Su, W.; Xu, J. Elevated temperature shifts soil N cycling from microbial immobilization to enhanced mineralization, nitrification and denitrification across global terrestrial ecosystems. Glob. Change Biol. 2020, 26, 5267–5527. [Google Scholar] [CrossRef]
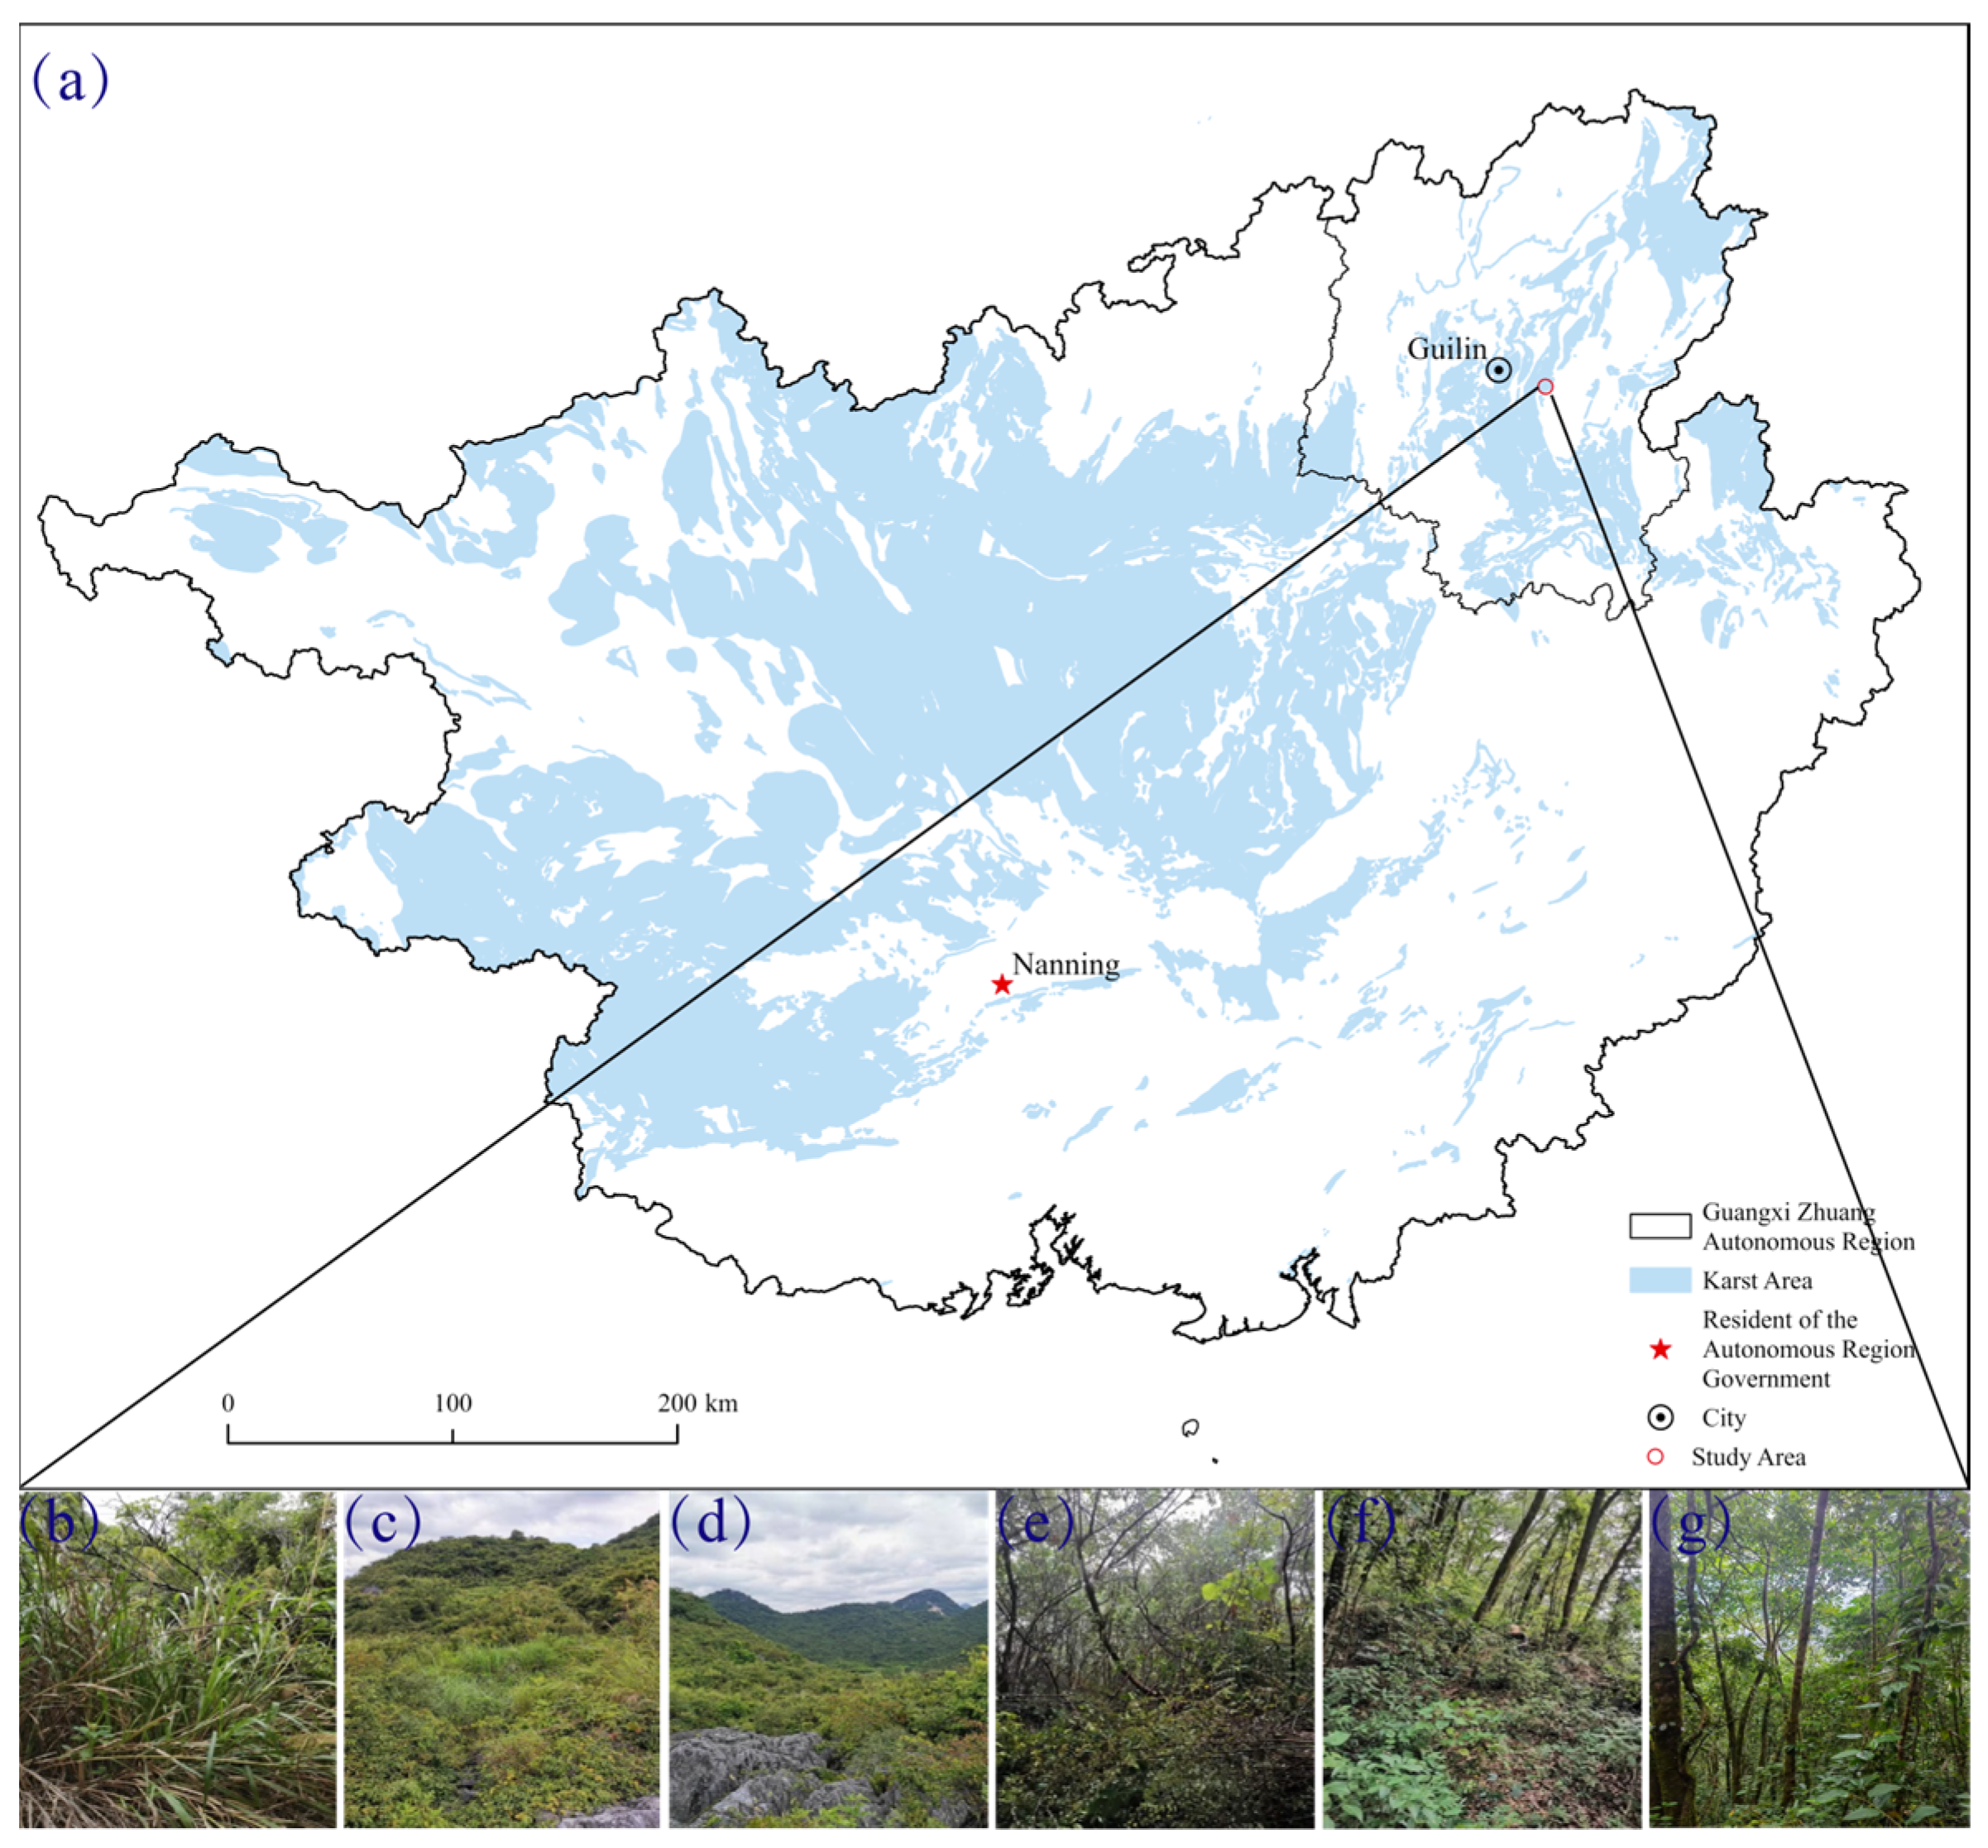
Figure 1. (a) The location of the study site; (b) grassland; (c) shrub-grassland; (d) early-stage shrubland; (e) late-stage shrubland; (f) early-stage woodland; and (g) late-stage woodland.
Forests 16 01006 g001
Figure 2. (a) The soil NH4+ content; (b) the soil NO3 content; (c) the soil inorganic N content: the sum of NH4+ and NO3; and (d) the NH4+:NO3 ratio: the ratio of NH4+ to NO3 in the dry and rainy seasons during vegetation restoration. G, grassland; SG, shrub-grassland; SE, early-stage shrubland; SL, late-stage shrubland; WE, early-stage woodland; WL, late-stage woodland. Different capital letters represent significant variability with seasonal variations in the same restoration stage at the p < 0.05 level. Different lowercase letters represent significant variability during vegetation restoration within the same season at the p < 0.05 level. The values are the means ± SD (n = 4).
Forests 16 01006 g002
Figure 3. (a) SOC, soil organic carbon; (b) TN, total nitrogen; and (c) SMC, soil moisture content in the dry and rainy seasons during vegetation restoration. G, grassland; SG, shrub-grassland; SE, early-stage shrubland; SL, late-stage shrubland; WE, early-stage woodland; WL, late-stage woodland. Different capital letters represent significant variability with seasonal variations in the same restoration stage at the p < 0.05 level. Different lowercase letters represent significant variability during vegetation restoration within the same season at the p < 0.05 level. Each box represents the interquartile range, the line in each box represents the median, the top and bottom of the box represent first and third quartiles, and the whiskers represent the range of 1.5 interquartile range. The square dot represents the means (n = 4).
Forests 16 01006 g003
Figure 4. (a) Total PLFAs: the total microbial community abundance; (b) bacteria PLFAs: bacteria abundance; (c) fungi PLFAs: fungi abundance; (d) actiononmycetes PLFAs: actiononmycetes abundance, (e) AMF PLFAs: arbuscular mycorrhizal fungi abundance; (f) G+:G ratio: the ratio of Gram-positive to Gram-negative bacteria; and (g) F:B ratio: the ratio of fungi to bacteria in the dry and rainy seasons during vegetation restoration. G, grassland; SG, shrub-grassland; SE, early-stage shrubland; SL, late-stage shrubland; WE, early-stage woodland; WL, late-stage woodland. Different capital letters represent significant variability with seasonal variations in the same restoration stage at the p < 0.05 level. Different lowercase letters represent significant variability during vegetation restoration within the same season at the p < 0.05 level. The values are the means ± SD (n = 4).
Forests 16 01006 g004
Figure 5. (a) MNorg: the mineralization of organic N to NH4+ rate; (b) ONH4: the oxidation of NH4+ to NO3 rate in the dry and rainy seasons during vegetation restoration. G, grassland; SG, shrub-grassland; SE, early-stage shrubland; SL, late-stage shrubland; WE, early-stage woodland; WL, late-stage woodland. Different capital letters represent significant variability with seasonal variations in the same restoration stage at the p < 0.05 level. Different lowercase letters represent significant variability during vegetation restoration within the same season at the p < 0.05 level. The values are the means ± SD (n = 4).
Forests 16 01006 g005
Figure 6. Relationships between the rates of soil organic N mineralization (MNorg) and nitrification (ONH4), soil physicochemical properties, and the soil microbial community in the dry and rainy seasons during vegetation restoration. SOC, soil organic carbon; TN, total nitrogen; SMC, soil moisture content; AMF, arbuscular mycorrhizal fungi; G+:G ratio, the ratio of Gram-positive to Gram-negative bacteria; F:B ratio, the ratio of fungi to bacteria.
Forests 16 01006 g006
Figure 7. The relative importance of the variables for predicting the rate of soil organic N mineralization (MNorg) and nitrification (ONH4). SOC, soil organic carbon; TN, total nitrogen; SMC, soil moisture content; AMF, arbuscular mycorrhizal fungi; G+:G ratio, the ratio of Gram-positive to Gram-negative bacteria; F:B ratio, the ratio of fungi to bacteria.
Forests 16 01006 g007
Table 1. Fundamental details of the study sites at different restoration stages.
Restoration StagesLongitude and LatitudeAltitude (m)Slope (°)Soil Depth (cm)Interference Conditions
Grassland110°32′ E
25°12′ N
324–3412–50–30Abandoned, no interference for 3–5 years
Shrub-grassland110°32′ E
25°12′ N
322–3484–80–30Abandoned, no interference for 7–10 years
Early-stage shrubland110°31′ E
25°12′ N
337–3456–130–25Abandoned, no interference for 15–20 years
Late-stage shrubland110°53′ E
25°21′ N
321–34312–150–25Abandoned, no interference for 30–35 years
Early-stage woodland110°53′ E
25°12′ N
335–37624–300–25Abandoned, no interference for 45–50 years
Late-stage woodland110°52′ E
25°20′ N
246–30020–250–20Abandoned, no interference for 70–80 years
Table 2. Two-way ANOVA testing the impacts of vegetation restoration stages and seasons on soil organic nitrogen mineralization and nitrification rates.
FactorsSoil Organic N Mineralization RateSoil Nitrification Rates
Mean SquaredfFp ValuesMean SquaredfFp Values
Vegetation restoration stage61.5512.3<0.01 **2215152<0.01 **
season1171117<0.01 **1401480<0.01 **
Vegetation restoration stage × season9.7051.940.03 *95.8565.8<0.01 **
Error25.4360.71 10.536
Notes: p values for significant effects and interactions are reported. ** indicates p < 0.01, * indicates p < 0.05.
Disclaimer/Publisher’s Note: The statements, opinions and data contained in all publications are solely those of the individual author(s) and contributor(s) and not of MDPI and/or the editor(s). MDPI and/or the editor(s) disclaim responsibility for any injury to people or property resulting from any ideas, methods, instructions or products referred to in the content.