Article

Climate-Induced Shift in the Population Dynamics of Tortrix viridana L. in Ukraine

by
Valentyna Meshkova
1,*,
Serhij Stankevych
2,
Yana Koshelyaeva
2,
Volodymyr Korsovetskyi
3 and
Oleksandr Borysenko
4
1
Department of Entomology, Phytopathology, and Physiology, Ukrainian Research Institute of Forestry & Forest Melioration, Hryhoriia Skovorody 86, UA-61024 Kharkiv, Ukraine
2
Department of Agronomy and Plant Protection, State Biotechnological University, Alchevskych 44, UA-61002 Kharkiv, Ukraine
3
Department of ESOL & Languages, West College Scotland, Queens Quay, Clydebank G81 1BF, UK
4
Department of Remote Sensing, Tartu Observatory, University of Tartu, EE-61602 Toravere, Estonia
*
Author to whom correspondence should be addressed.
Forests 2025, 16(6), 1005; https://doi.org/10.3390/f16061005
Submission received: 13 May 2025 / Revised: 2 June 2025 / Accepted: 13 June 2025 / Published: 14 June 2025

Abstract

Tortrix viridana (Linnaeus, 1758) (Lepidoptera: Tortricidae) (TV) is a serious pest of oaks in the West-Palearctic. In Ukraine in the 50–70s of the 20th century, the area of TV outbreaks reached 140–180 thousand hectares. Since the late 1980s, outbreaks have become rarer and have occurred in a smaller area. This research aimed to assess the main parameters of TV outbreaks in Ukraine, considering its prevalence in flush feeders’ complex, the suitability of forest structure for this insect, and the phenological mismatch between bud-flushing and TV hatching. Historical data on TV outbreaks in Ukraine since 1947, data for 1978–2025 by regions, field and climate data, and forest management databases as of 1996 and 2017 from the Kharkiv region were analyzed. Since 1985, the incidence, severity, and duration of TV outbreaks have decreased in all regions of Ukraine. It was explained by: (1) TV decrease in the flush feeding complex due to monophagy; (2) decrease in the suitable area due to a change in the forest age composition, proportion of pure oak stands, and stands with low relative stocking density; (3) the shift of oak bud-flushing and TV hatching to earlier dates with the tendency of earlier bud-flushing than egg-hatching.

1. Introduction

Tortrix viridana (Linnaeus, 1758) (Lepidoptera: Tortricidae) (TV), or green oak leafroller, is known as a serious pest of oaks in the West-Palearctic region, damaging Quercus robur, Q. petraea, evergreen Q. suber, Q. ilex, etc. [1,2,3,4,5]. T. viridana, like some other foliage-browsing forest insects, is characterized by a cyclical population dynamic [6,7]. Periods of sudden and significant increase in the population above its general equilibrium level are called outbreaks. Outbreaks of TV, like some other foliage-browsing forest insects, begin in the most attractive forest subcompartments, which are called foci. During an outbreak, TV causes considerable foliage damage, which is usually predicted by current stand defoliation and egg mass counts and by considering forest features (tree species composition, age, relative density of stocking, etc.). The area of subcompartments with a risk of defoliation over 25% is summarized for forest enterprises and at the regional level. Insecticide treatment is planned for subcompartments with predicted defoliation over 50% [8,9].
Outbreaks of TV in the last century led to significant defoliation of oak forests [3,4,10]. In Ukraine in the 50–70s of the 20th century, the area of TV outbreaks reached 140–180 thousand hectares, or approximately 80–100 hectares per 1000 hectares of oak forests [8]. TV outbreaks often occurred in the same forest subcompartments with an interval of 9–12 years. In some subcompartments, outbreaks lasted an average of 3 years. However, they did not start simultaneously in more and less susceptible stands and, in general, in a region, active outbreaks were recorded over a longer period [9].
In the late 1980s, outbreaks of TV became rarer, occurred in a smaller area, did not last long, and were often in complex with different species of Tortricidae, Geometridae, Erebidae, etc. [8,11,12]. In publications of the last 20 years, outbreaks of TV are mentioned quite rarely, mainly in the southern part of the range [13,14], and are mainly mentioned in fundamental research devoted to issues of genetics [14], feeding physiology [15,16], and detection by remote sensing [17].
We were interested in the reasons for the decrease in outbreak incidence, severity, duration, and mean interval between outbreaks of TV in Ukraine. In doing so, we considered the characteristics of the TV life cycle, its narrow oligophagy, the availability of the most favorable environmental conditions for TV outbreaks in oak stands, and changes in these features due to climate change.
T. viridana has a one-year life cycle in its whole range [1,2,4,18,19,20]. Moths of TV swarm from early May in the south and from mid-June to early July in the north. They oviposit on the bark of twigs. Eggs are laid in pairs for a total of 50–60 per female [1,3]. Egg hatch in spring, neonate larvae begin feeding on the flushing buds, and 5th instar larvae complete feeding upon the expanded foliage [3,18].
Young foliage has a higher protein and water content and almost no protective substances (tannins) [21,22]. When feeding on such foliage, the survival of larvae, the mass of pupae, and the fertility of moths increase. The shorter the interval between bud-flushing and egg hatching, the more favorable the conditions are for flush-feeders [9,23].
The coincidence of larvae hatching with foliage availability plays a major role in the population dynamics of flush-feeding insects [23,24,25,26,27]. If egg hatching occurs earlier than bud-flushing, the larvae starve [24,27,28]. Larvae of some species (for example, Lymantria dispar (Linnaeus, 1758), Biston strataria (Hufnagel, 1767), Erannis defoliaria (Clerck, 1759), and Operophtera brumata (Linnaeus, 1758)) can migrate by ballooning [12,29], while polyphagous insects can feed on other host species that flush earlier (for example, on Acer sp. [9]). TV is a narrow oligophagous in the South regions [30] and monophagous in most of Ukraine because only Q. robur is present [31]. Therefore, TV cannot compete with polyphagous flush-feeders in such conditions, although it can withstand long starvation [20]. TV neonate larvae also survive in the areas with early (f. praecox Czern.) and late (f. tardiflora Czern.) phenological forms of Q. robur [32,33] or with several oak species [30]. If bud-flushing occurs earlier than egg hatching, the larvae are forced to feed on old foliage, which is unfavorable for survival, fertility, and population growth [22,23].
The population of TV changes cyclically [7]. The simultaneous outbreaks of many insect species in various regions may be caused by global factors (certain phases of the solar activity cycle or atmospheric circulation) [7,8,34]. However, the outbreak incidence, severity, duration, and mean interval between outbreaks depend on region, forest stand features, and cycles of population dynamics of the same insect species [9].
Climate change affects the development of all trophic levels (plants, phytophages, and entomophages) [35,36,37]. While the shift in annual temperature in the Northern Hemisphere approached 1 °C over half a century, in Ukraine it increased by 1.4 °C. Such a shift has significantly intensified since the 1980s [38].
As a result of decreased air and soil humidity, conditions for the growth of the main forest-forming species in Europe worsen, and the species composition and forest structure change [39,40]. In the southern regions of Ukraine, the average monthly precipitation has decreased by 10%–25% from 2015 to 2020. In forest and forest-steppe zones of Ukraine, it has a low decrease, but the evaporation increased under higher temperatures [41]. This may change the area of forest most suitable for insect outbreaks [9].
As a result of global warming, the continentality of the climate (the difference in temperature between the warmest and coldest months) decreases [42,43]. The soil in many regions does not freeze or freezes for a shorter period. This promotes an earlier start of spring development of buds and benefits entomophagous insects that overwinter in the forest litter and soil [8]. At the same time, the coincidence of the development of the host plant, phytophages, and entomophages is disrupted. This affects the viability and range boundaries of all components of the tritrophic, the dynamics of populations, and the harmfulness of individual phytophagous species [23].
This research aimed to assess the main parameters of T. viridana outbreaks in Ukraine, considering its prevalence in flush feeders’ complex, the suitability of forest site conditions and structure for this insect, and the phenological mismatch between the timing of oak bud-flushing and T. viridana hatching.
The tasks included:
-
to analyze the dynamics of T. viridana outbreaks in the forests of Ukraine for 1947–2025 and individual 20-year intervals of this period;
-
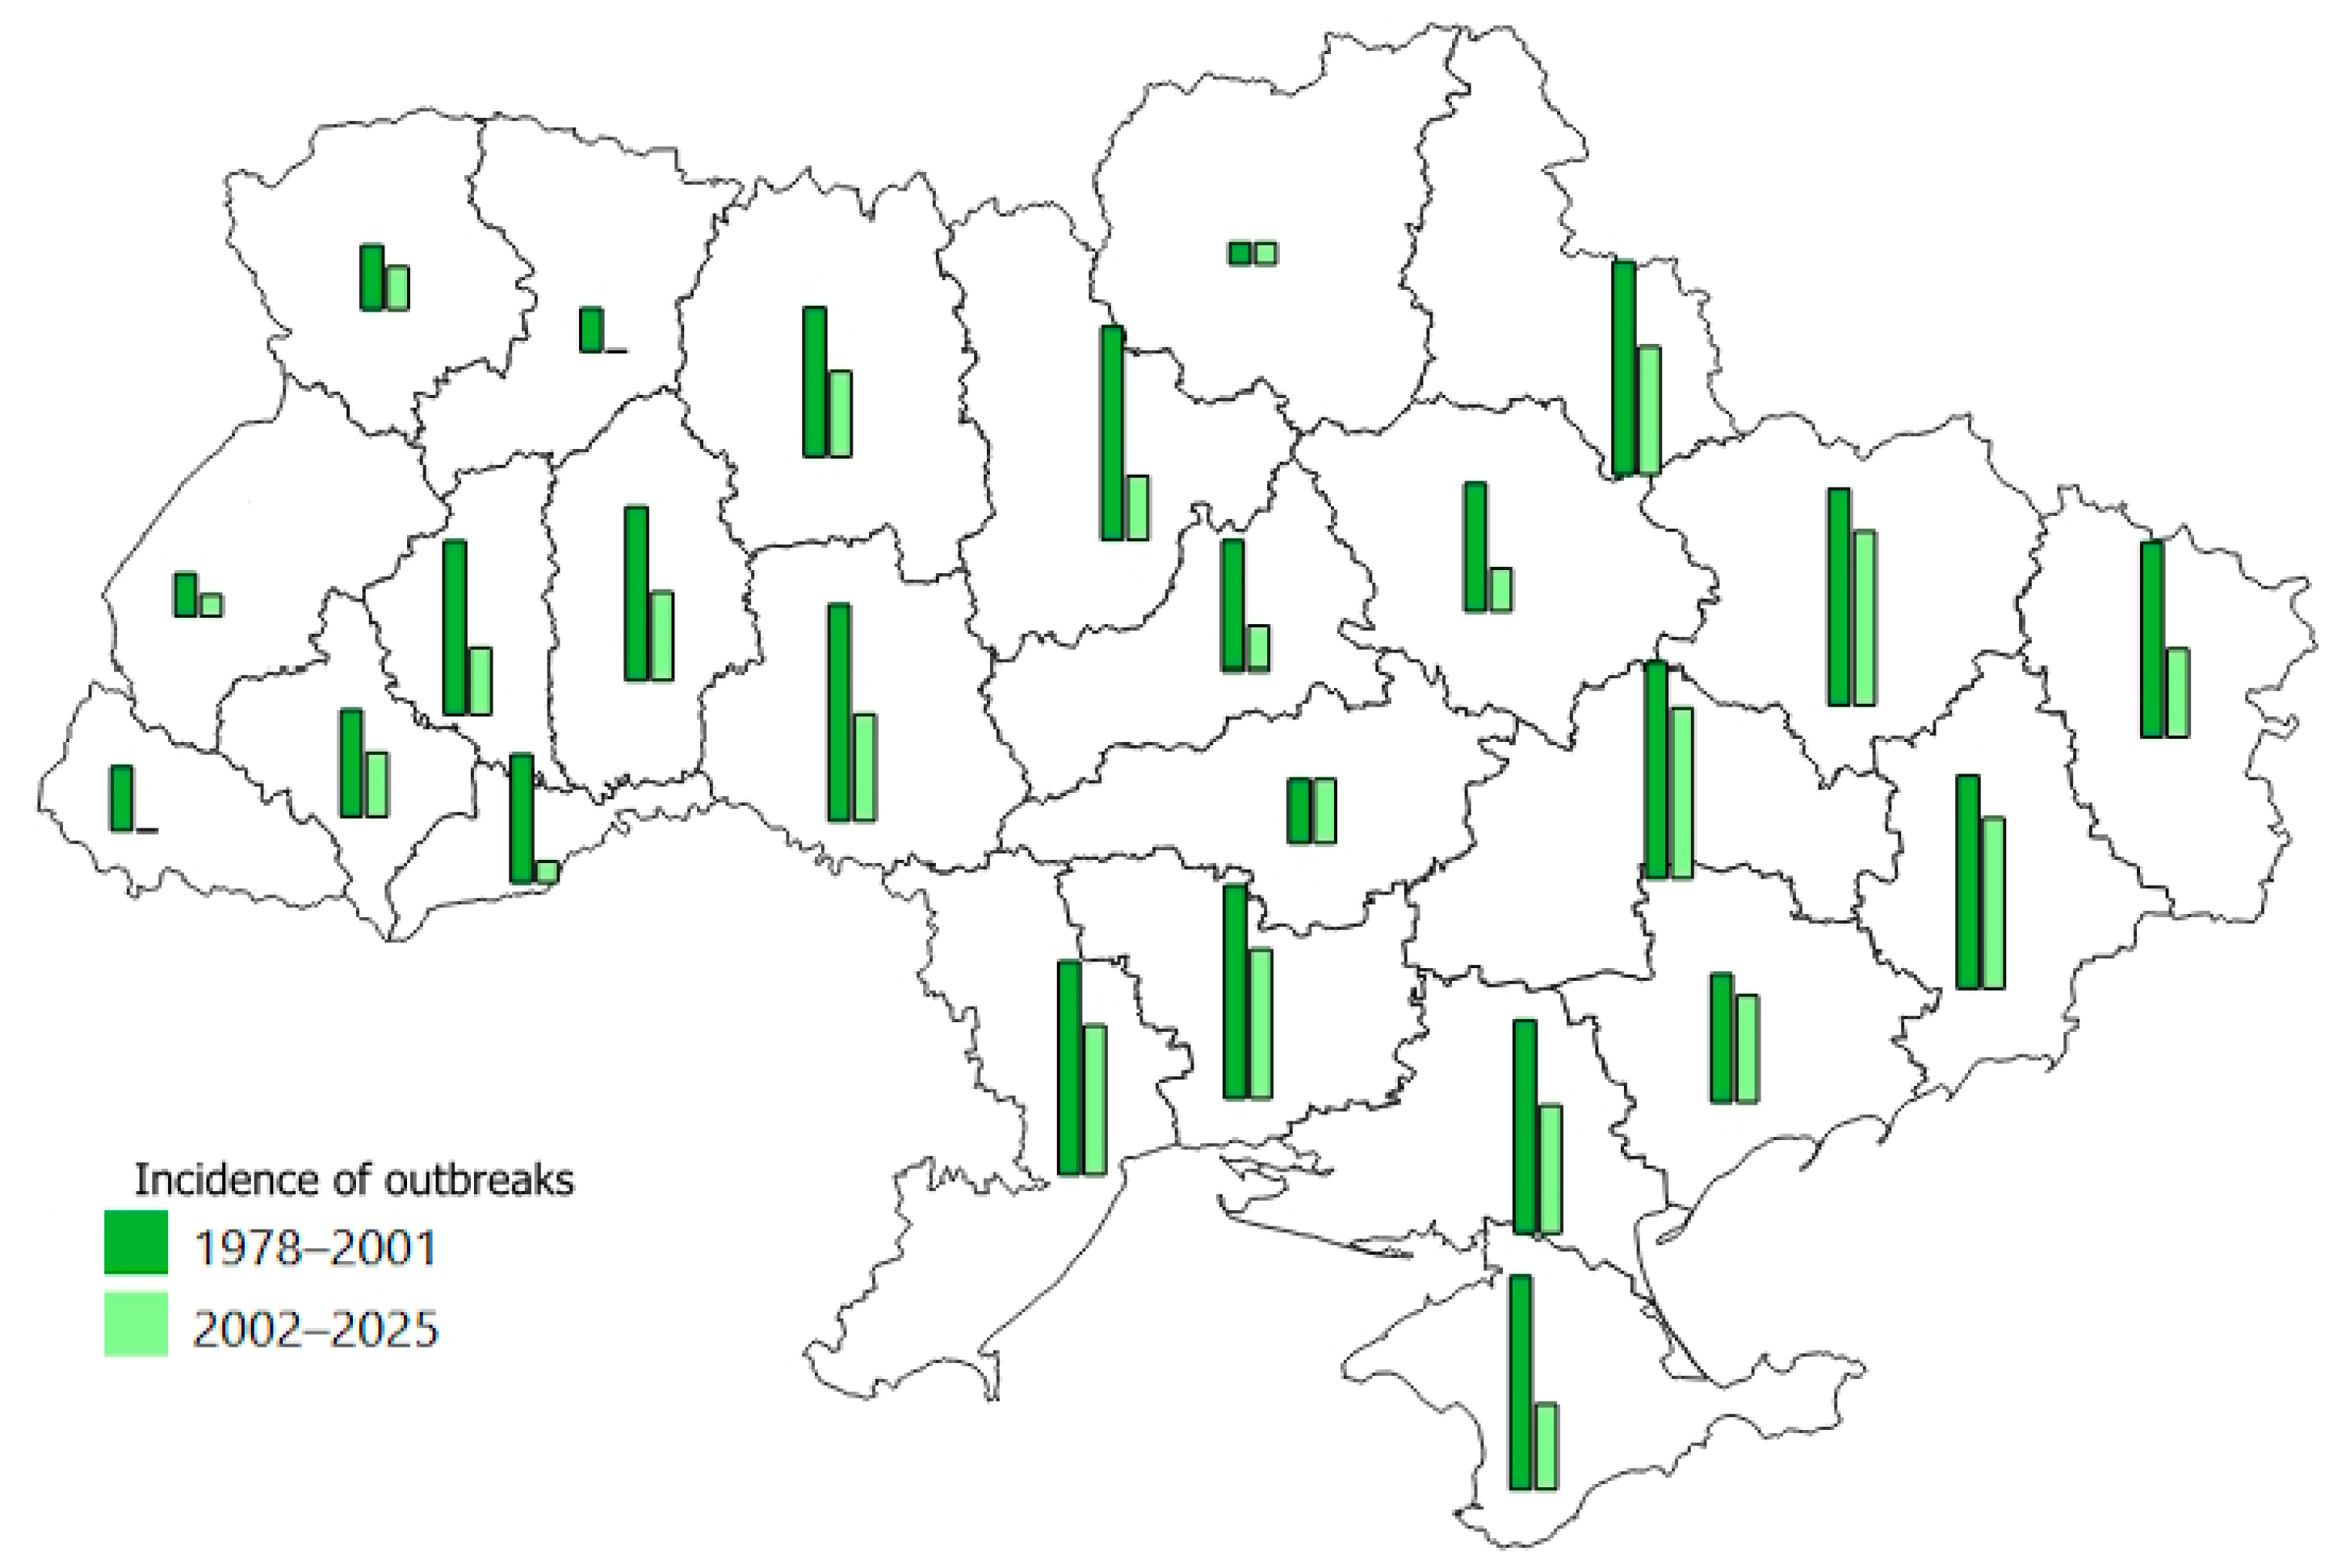
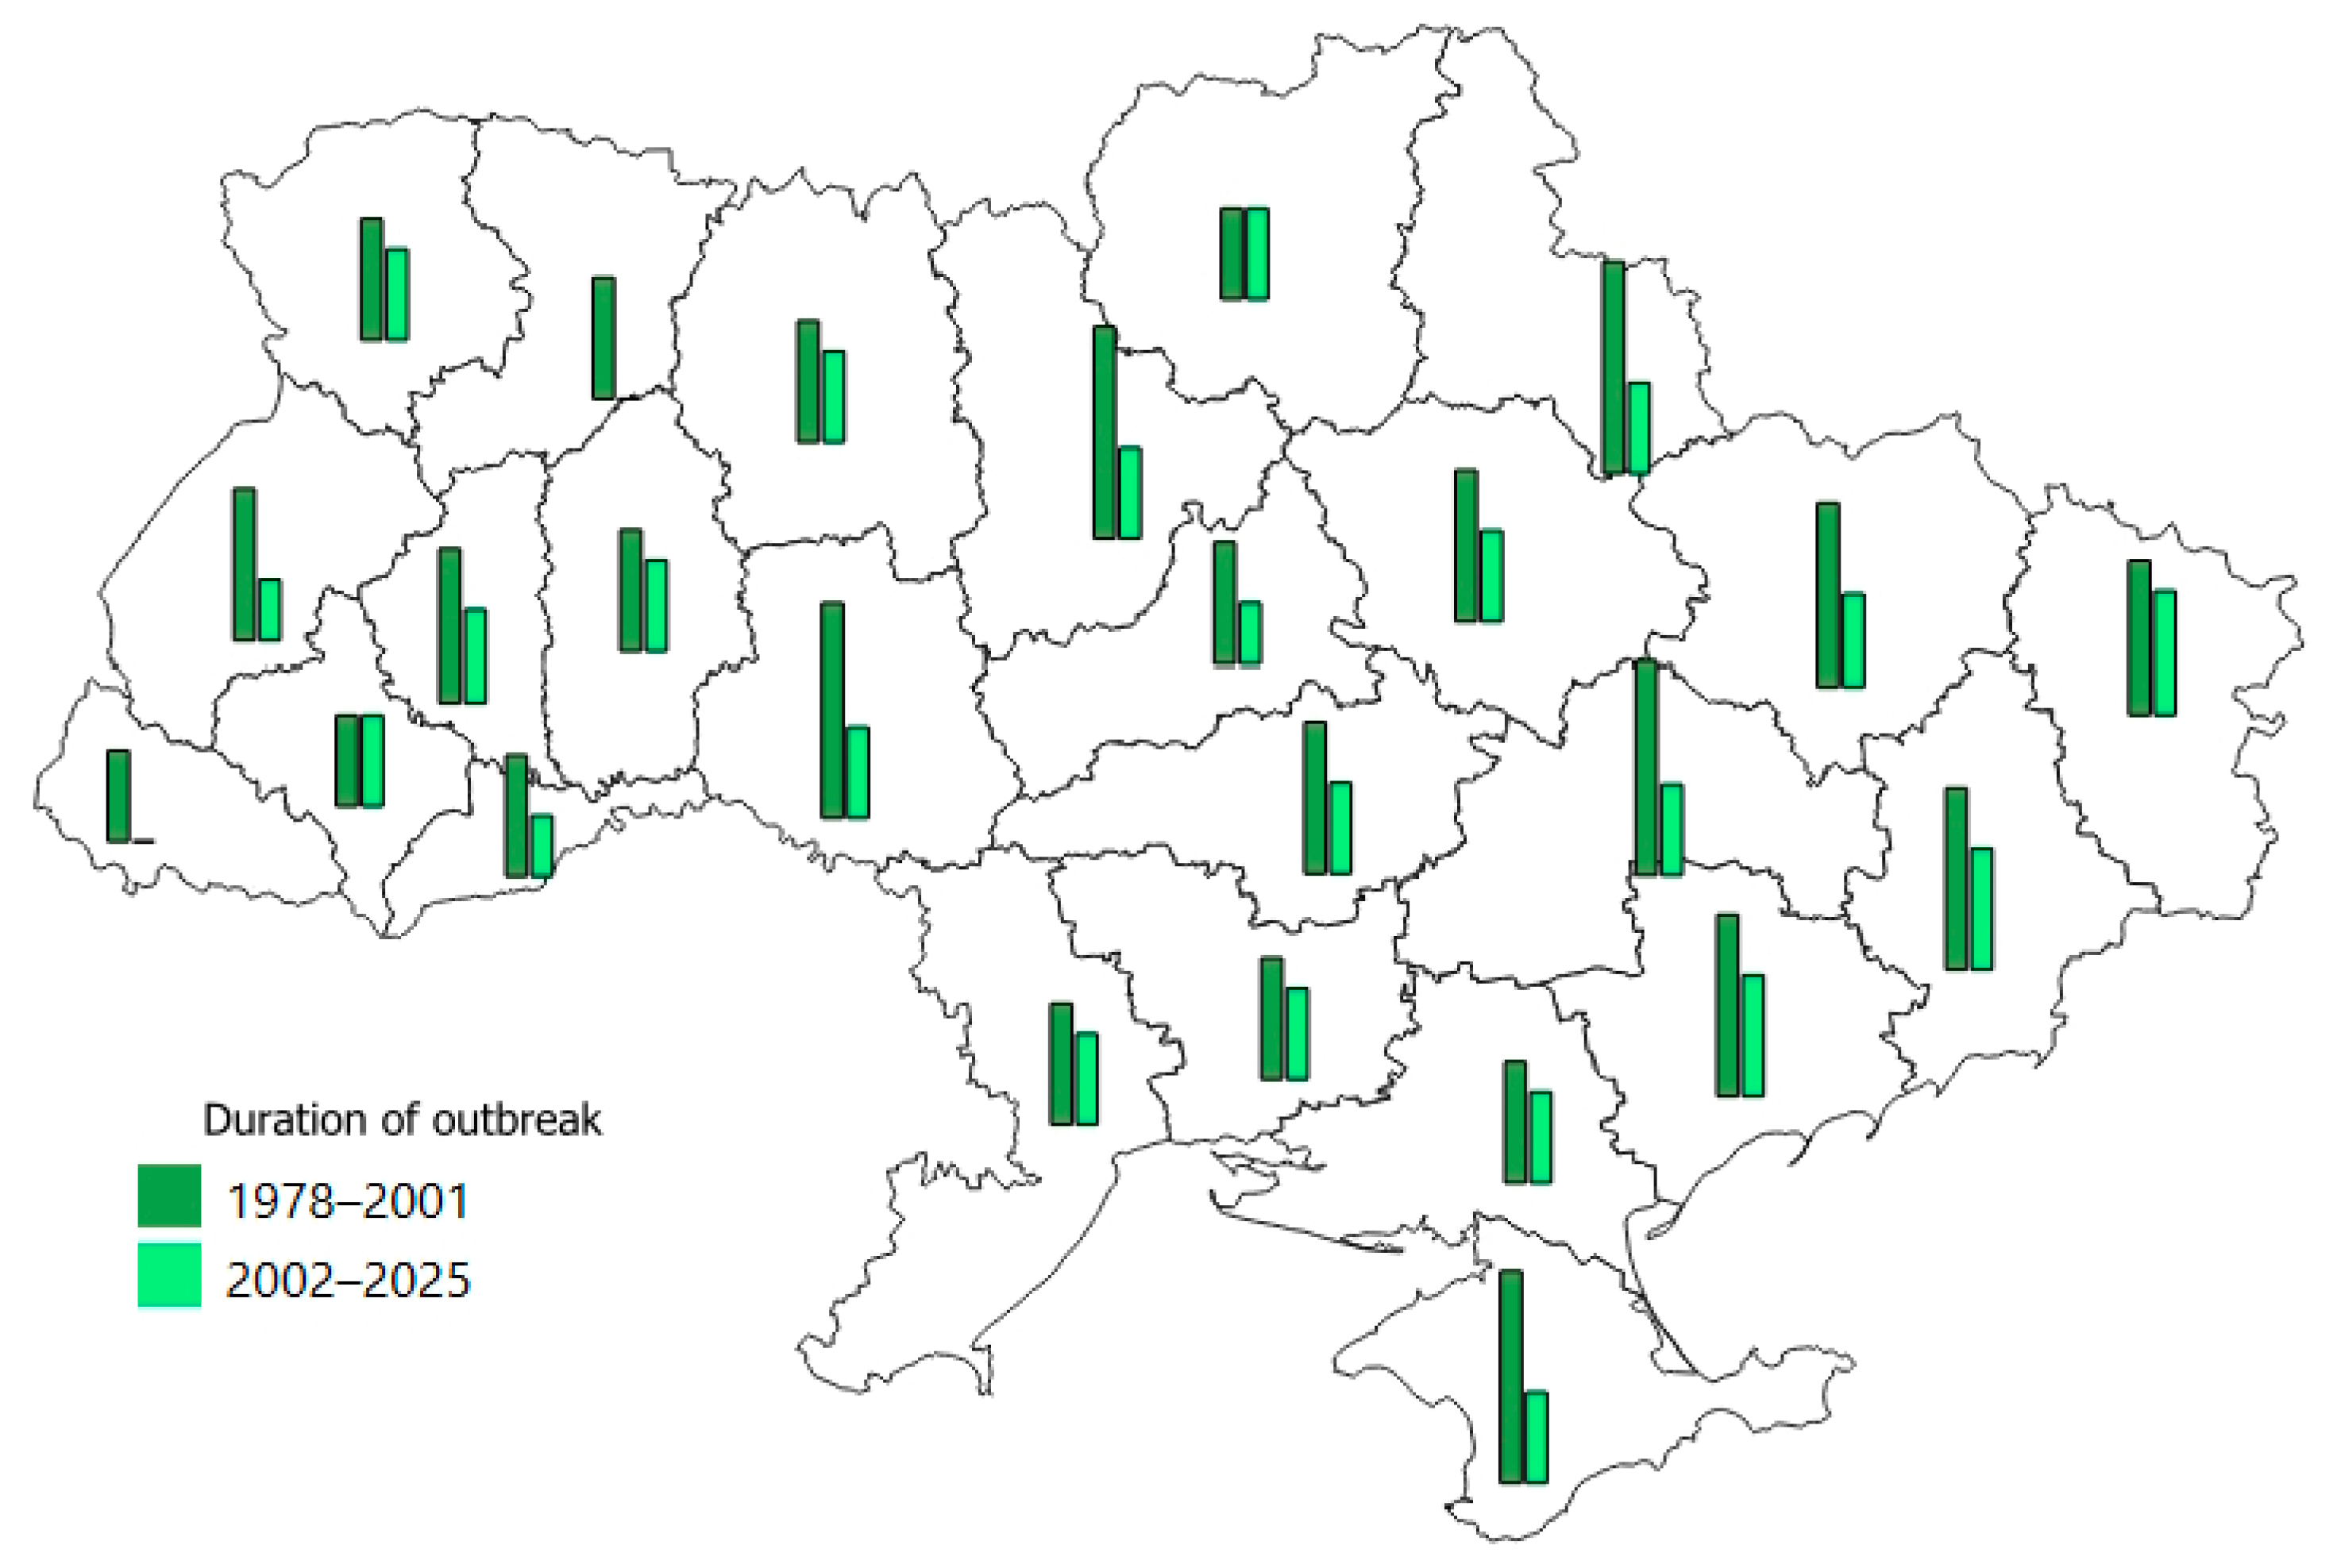
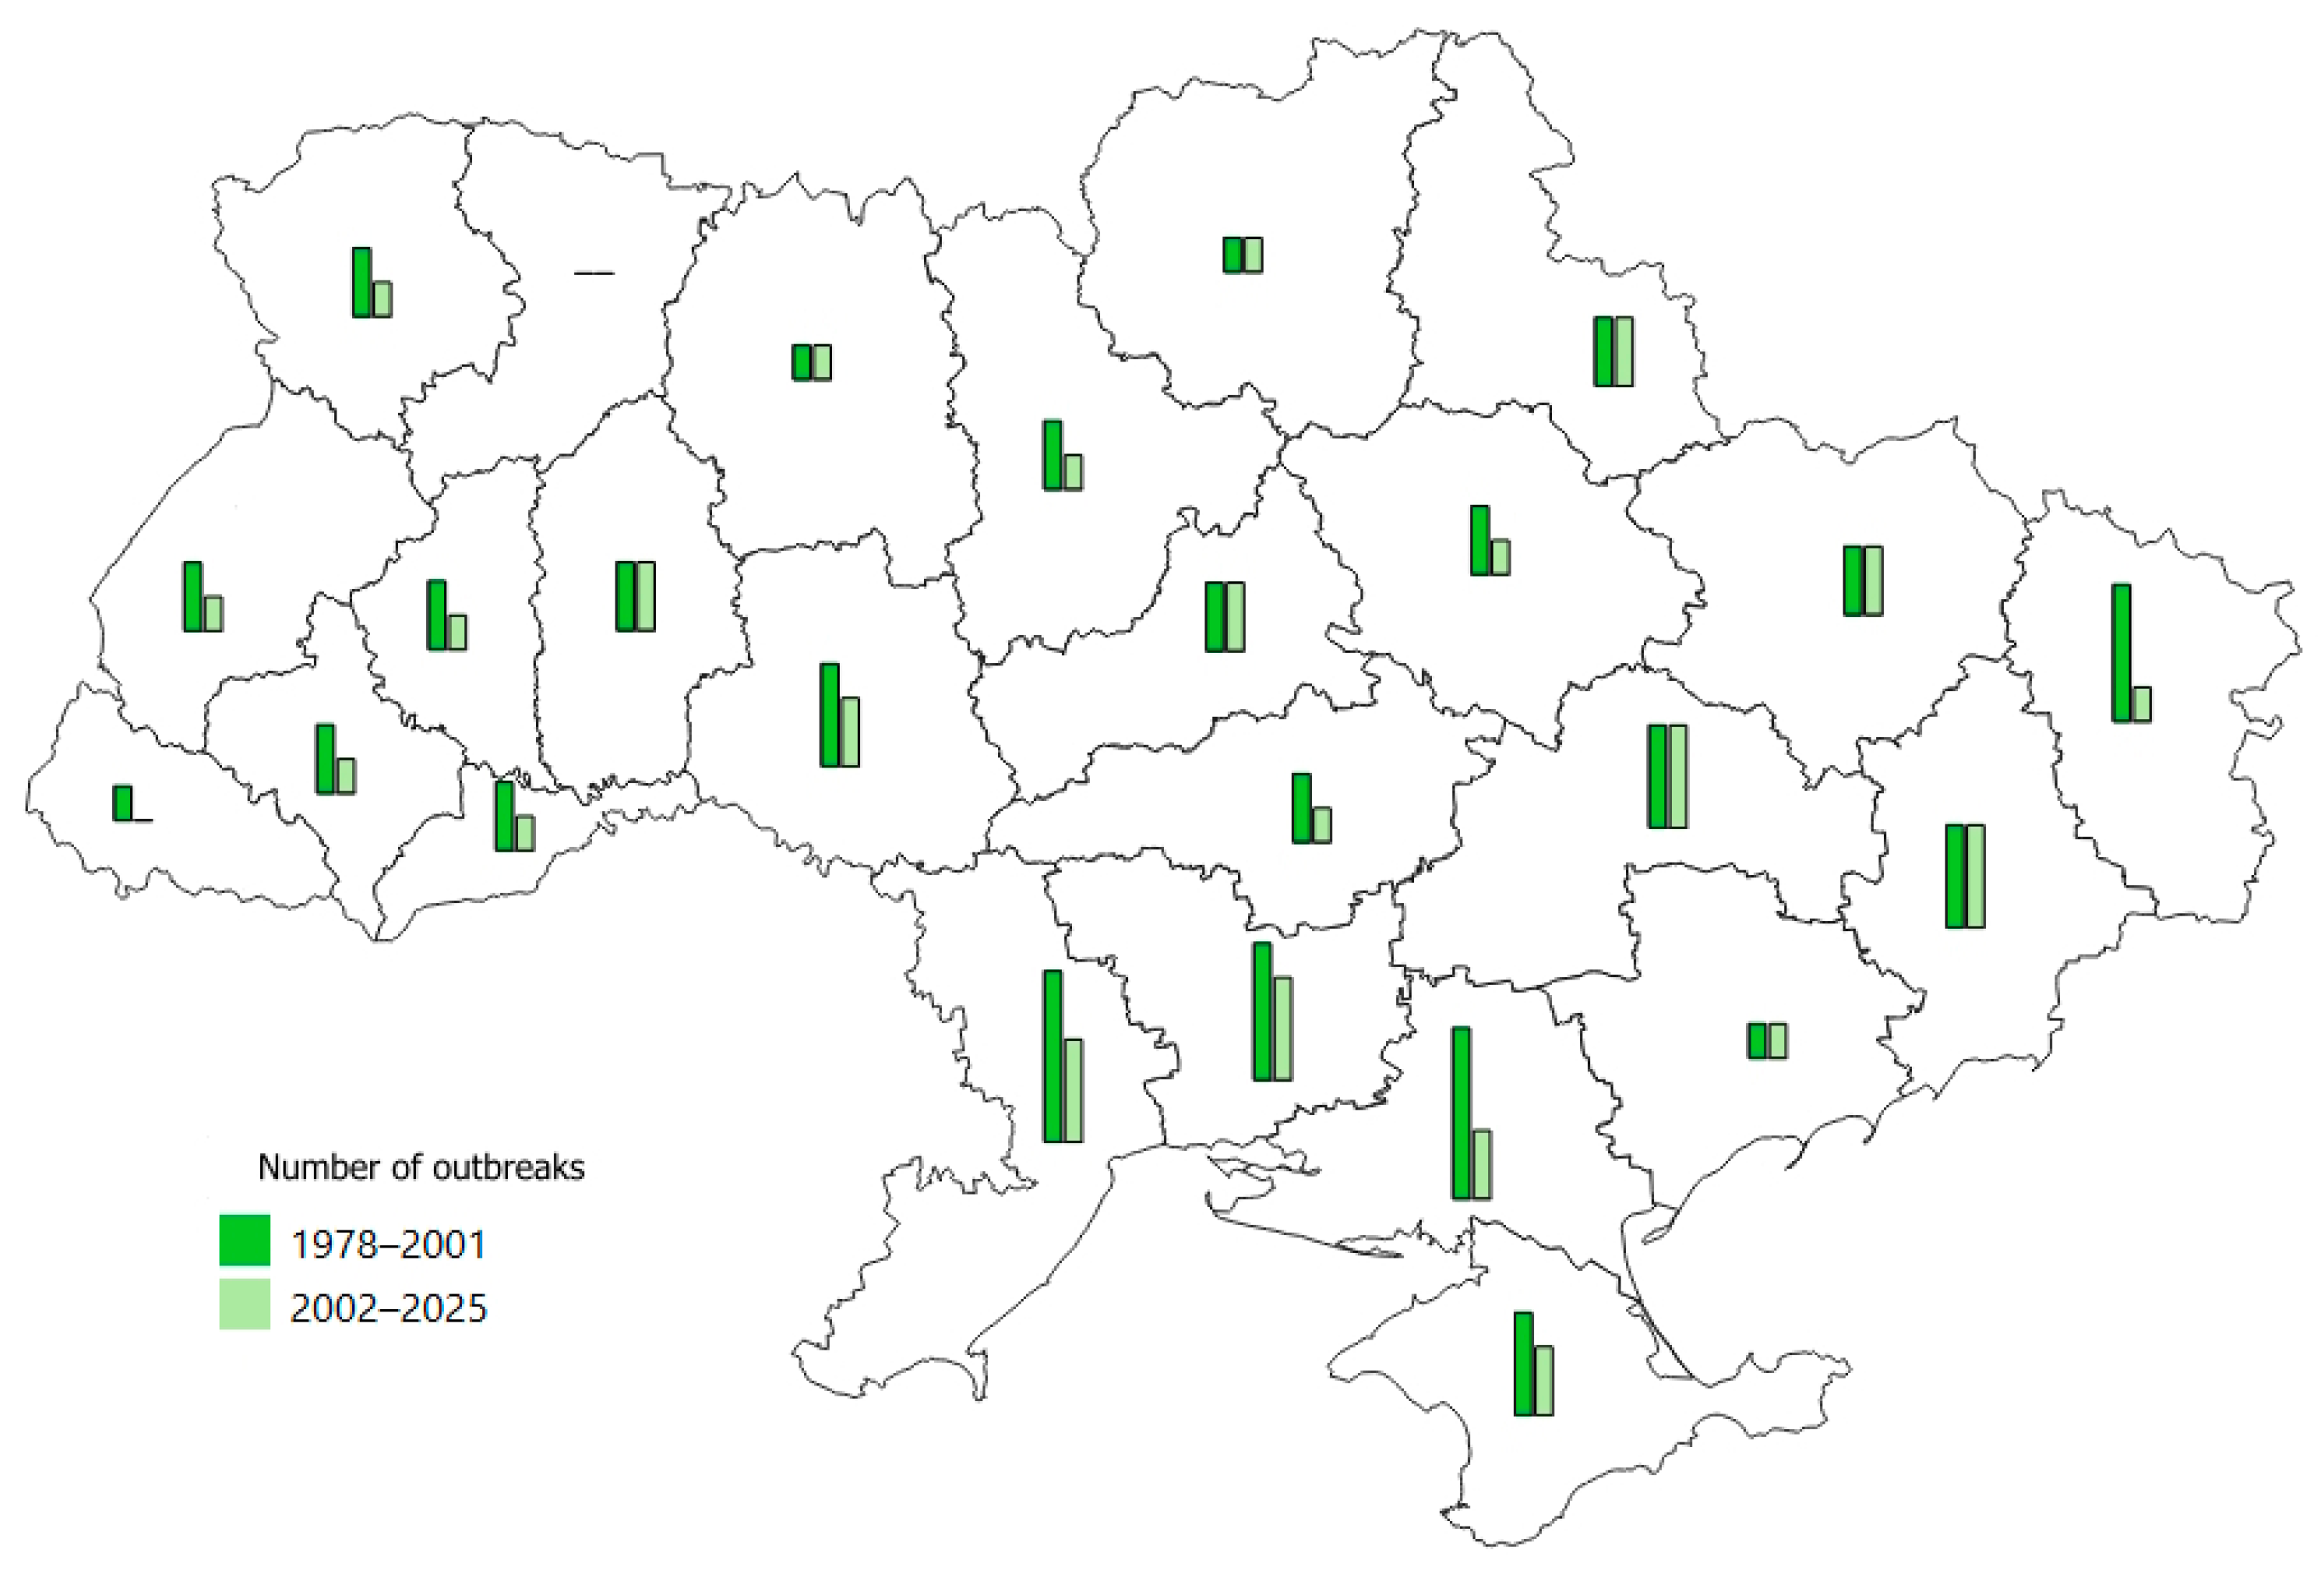
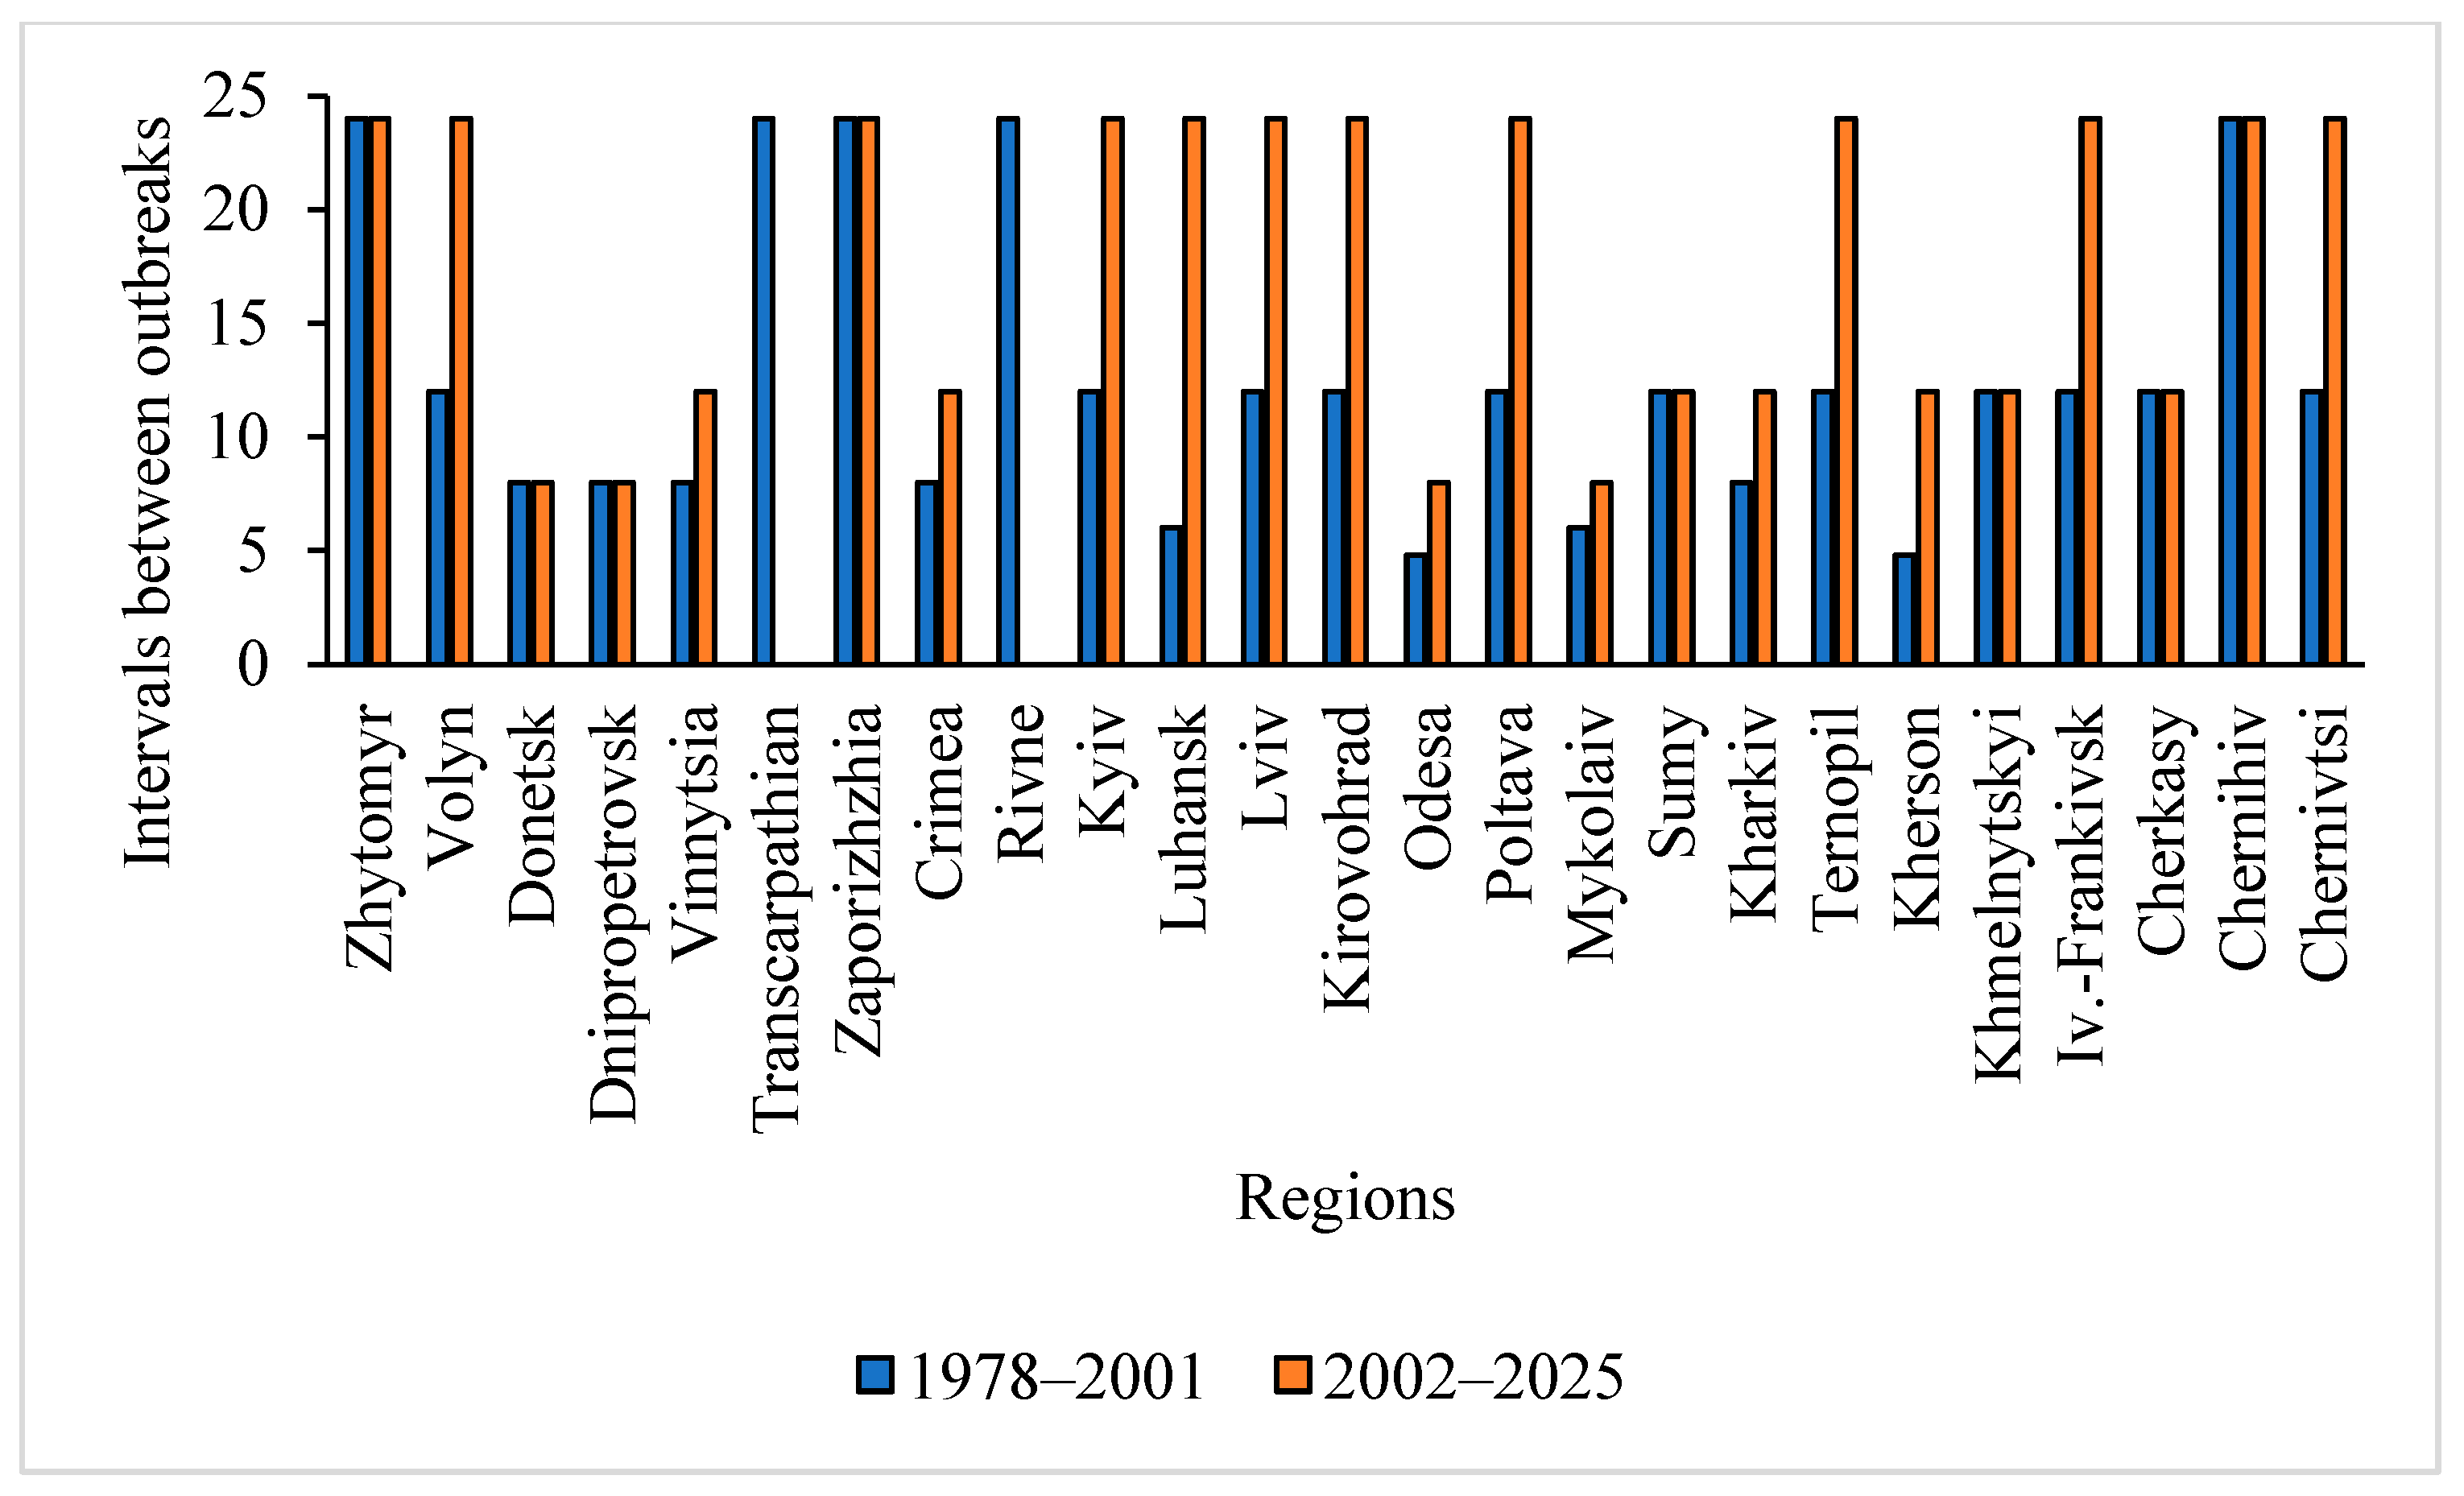
to compare the main parameters of T. viridana outbreaks in forests of individual regions for 1978–2001 and 2002–2025 (outbreak incidence, severity, duration, and mean interval between outbreaks);
-
to search for an explanation for the observed changes in the main parameters of T. viridana outbreaks
-
by the shift of T. viridana as part of the flush feeders’ complex;
-
by the shift in the suitability of forest subcompartments for T. viridana;
-
by phenological mismatch in oak bud-flushing and T. viridana hatching.

2. Materials and Methods

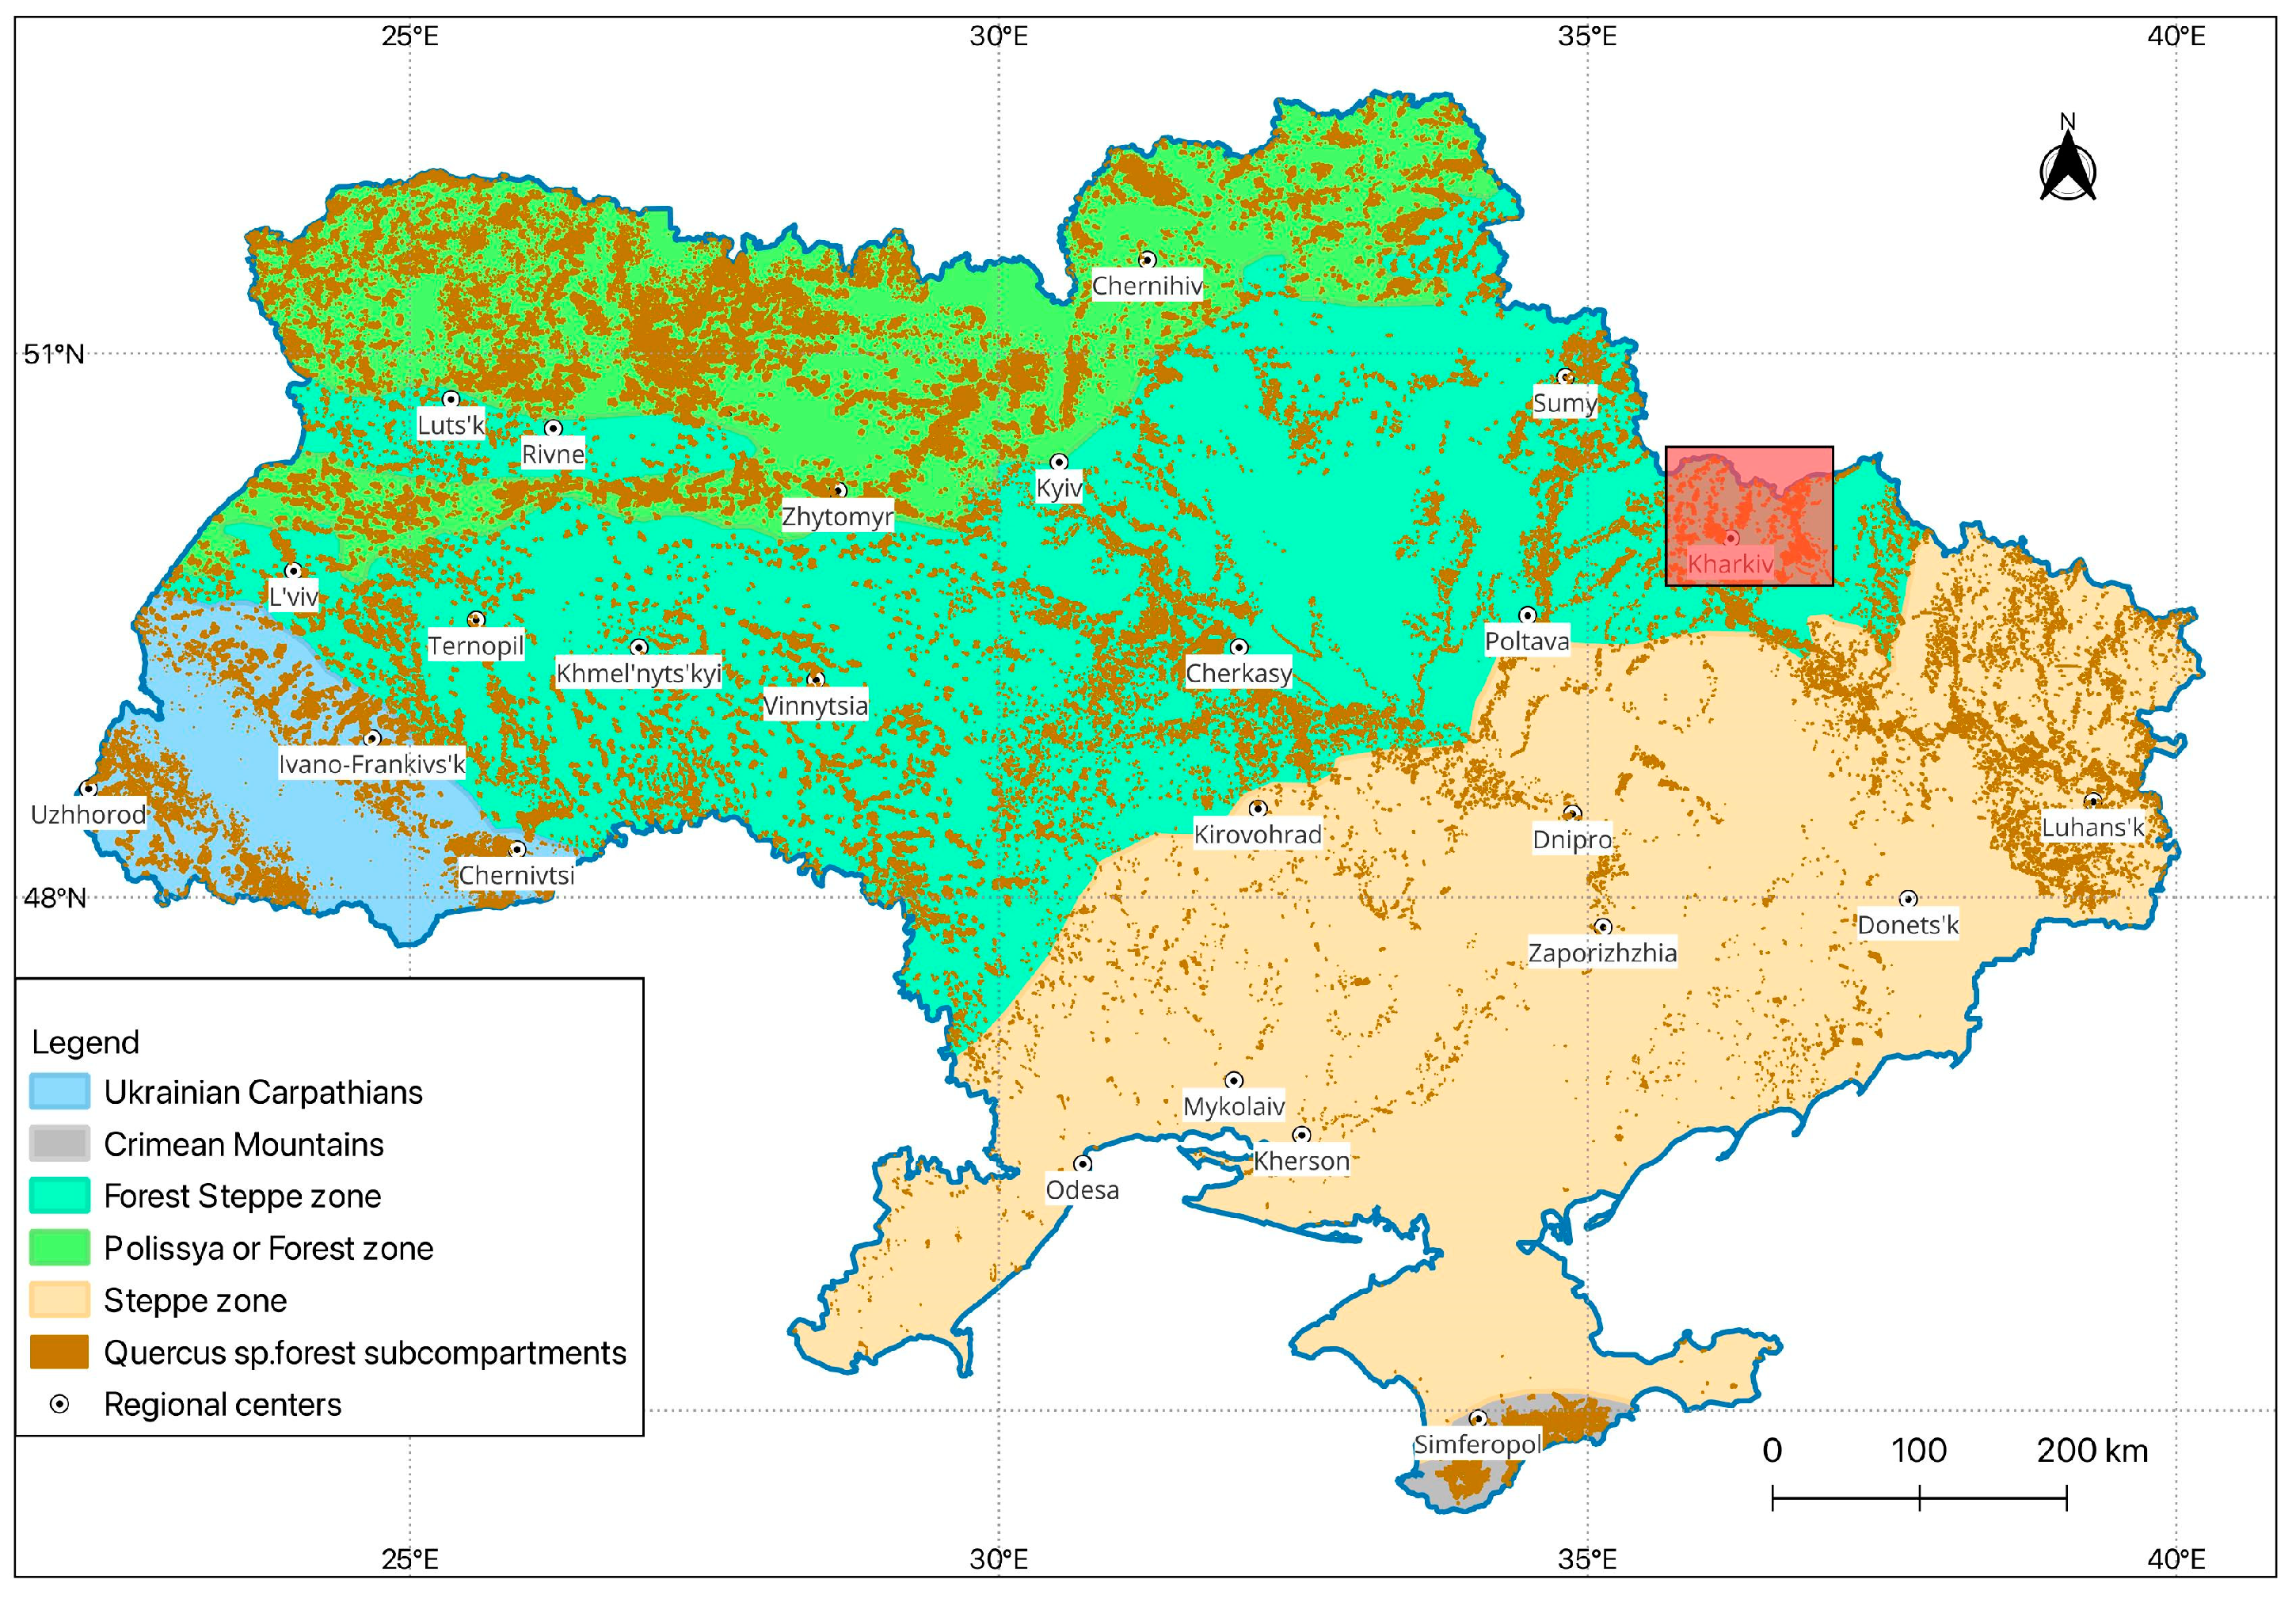
2.1. Study Region and Data Sources

The territory of Ukraine is located in the southwestern part of the East European Plain, the Ukrainian Carpathians, and the Crimean Peninsula (Figure 1).
The forest-covered area is the highest in the Ukrainian Carpathians (40.5%) and rather high in the Forest zone (Ukrainian Polissya) (26.1%) and is only 12.2% in the Forest-Steppe zone, 3.8% in the Steppe zone, and 9.8% in Crimea [44]. Within the plain territory of Ukraine, the climate is continental, and on the southern coast of the Crimean Peninsula, it is close to the subtropical Mediterranean type. The continentality increases and precipitation decreases from the northwest to the southeast [45,46]. Oak forests comprise 28% of areas subordinated to the State Forest Resources Agency of Ukraine (SFRAU) [47]. English oak (Quercus robur L.) predominates among the species of this genus in most of Ukraine, dominating in the Forest-Steppe zone (66.9% of all stands with this species), and making up 13.8% in the Forest zone, 13% in the Steppe zone, and 6.3% in Ukrainian Carpathians [42]. Quercus pubescens (Willd) and Q. petraea (Mattuschka/Liebl) and their hybrids grow mainly in Crimea [30] and some western and southern regions of Ukraine [48]. Alien Q. rubra rarely presents in Ukraine, mainly in Lviv (15,000 hectares), Ivano-Frankivsk (8.95 thousand hectares), Vinnytsia (8.91 thousand hectares), and Ternopil (6.29 thousand hectares) administrative regions [48].
The database of the Ukrainian State Forest Management Planning Association (n.d.) [49] was analyzed to assess the presence of Quercus sp. in the forests subordinated to the State Specialized Forest Enterprise «Forests of Ukraine». QGIS 3.40.5 was used for map building [50].

2.2. Spatio-Temporal Dynamics of Tortrix viridana Outbreaks

Historical data on foliage browsing insect outbreaks have been known since 1826, but only since 1947 have the foci areas for different regions and insect species been available for analysis. Such information on Tortrix viridana outbreaks was obtained from the archives of the Ministry of Forestry (reformed into the State Committee of Forestry of Ukraine in 1997, and into the State Forest Resources Agency of Ukraine in 2011), Forest and Forest Protective Enterprises, Laboratory of Forest Protection of Ukrainian Research Institute of Forestry and Forest Melioration, as well as our field materials, and was used for retrospective analysis (Table S1).
The average area of T. viridana foci in the forests of Ukraine as of the beginning of the year was calculated for four periods of equal duration: 1947–1966, 1967–1986, 1987–2006, and 2007–2025. For each administrative region of Ukraine, the outbreak incidence, severity, duration, and mean interval between outbreaks were evaluated for 1978–2001 and 2002–2025 and compared. Outbreak incidence for each region was calculated as the ratio of the outbreak years and period length, years (in percent). Outbreak severity in each region was calculated as the specific outbreak area by dividing the total outbreak area (in hectares) by the oak plantation area (in thousands of hectares). Outbreak duration (years) was calculated as the ratio of outbreak years and the number of outbreaks for the respective period. The mean interval between outbreaks (years) was calculated as the ratio of the duration of the investigated period and the number of outbreaks during this period.
Field data on flush feeders’ species composition, oak bud-flushing, and T. viridana hatching (Table S1) were collected in the Kharkiv region from 1979 by the Department of Forest Protection of the Ukrainian Research Institute Of Forestry and Forest Melioration, mainly in the forests of the Kharkiv Research Station (RS) of the Ukrainian Research Institute of Forestry and Forest Melioration (previously named Danilovsky Experimental Forestry Enterprise of the Ukrainian Research Institute of Forestry and Forest Melioration) (50°09′ N, 36°31′ E), and in Vovchansk Forestry Enterprise (50°14′ N, 36°47′ E) (see Figure 1).
Larvae were counted on oak branches in May, and the number of individuals of species or groups of species (leaf rollers, geometrids) was recalculated per 100 shoots of the current year. The prevalence of individual species or groups was evaluated as their percentage in the complex.

2.3. The Suitability of the Forest Sites for Tortrix viridana

Changes in the suitability of stands for T. viridana outbreaks were assessed based on forest inventory data from 1996 and 2017 for four forestry enterprises in the Kharkiv region, the boundaries of which were almost stable over this period. These are the Kharkiv Research Station (RS) of the Ukrainian Research Institute of Forestry and Forest Melioration, Vovchansk, Chuguyevo-Babchansk (49°52′ N, 36°43′ E), and Zhovtneve (49°50′ N, 35°17′ E) Forestry Enterprises (FE).
The suitability of each forest subcompartment for T. viridana was assessed by scoring individual forest characteristics for this pest. The scores were forest site conditions, stand age, relative stocking density, and oak proportion in tree species composition [9]. The area of subcompartments where all given characteristics were assessed with the maximum score was summed up. The maximum score for T. viridana was given to subcompartments in dry and fresh fertile sites (D1 and D2, respectively, according to Ukrainian Typology [31]). The maximum score was given to oak stands of vegetative origin, aged 41–80 years, with an oak share of more than 90% and a relative stocking density of more than 65% [9]. We calculated changes in forest area in four forest enterprises, considering each of the analyzed indicators and their combined changes in individual subcompartments. The contribution of each indicator to the change in the total area attractive for the formation of outbreaks was evaluated as the percentage of shifted area due to changes in the stand origin, share of oak, age, and relative stocking density.

2.4. Data Processing

All data were organized using Microsoft Excel (2019, Microsoft Corporation, Redmond, WA, USA, 2019). PAST (5.5.2, Øyvind Hammer, Natural History Museum, University of Oslo, Oslo, Norway, 2025) [51] was used for data analysis and visualization.
A normality test was used to determine whether the sample data had been drawn from a normally distributed population. The Kruskal–Wallis test was used to compare two or more groups for variables [52].

3. Results

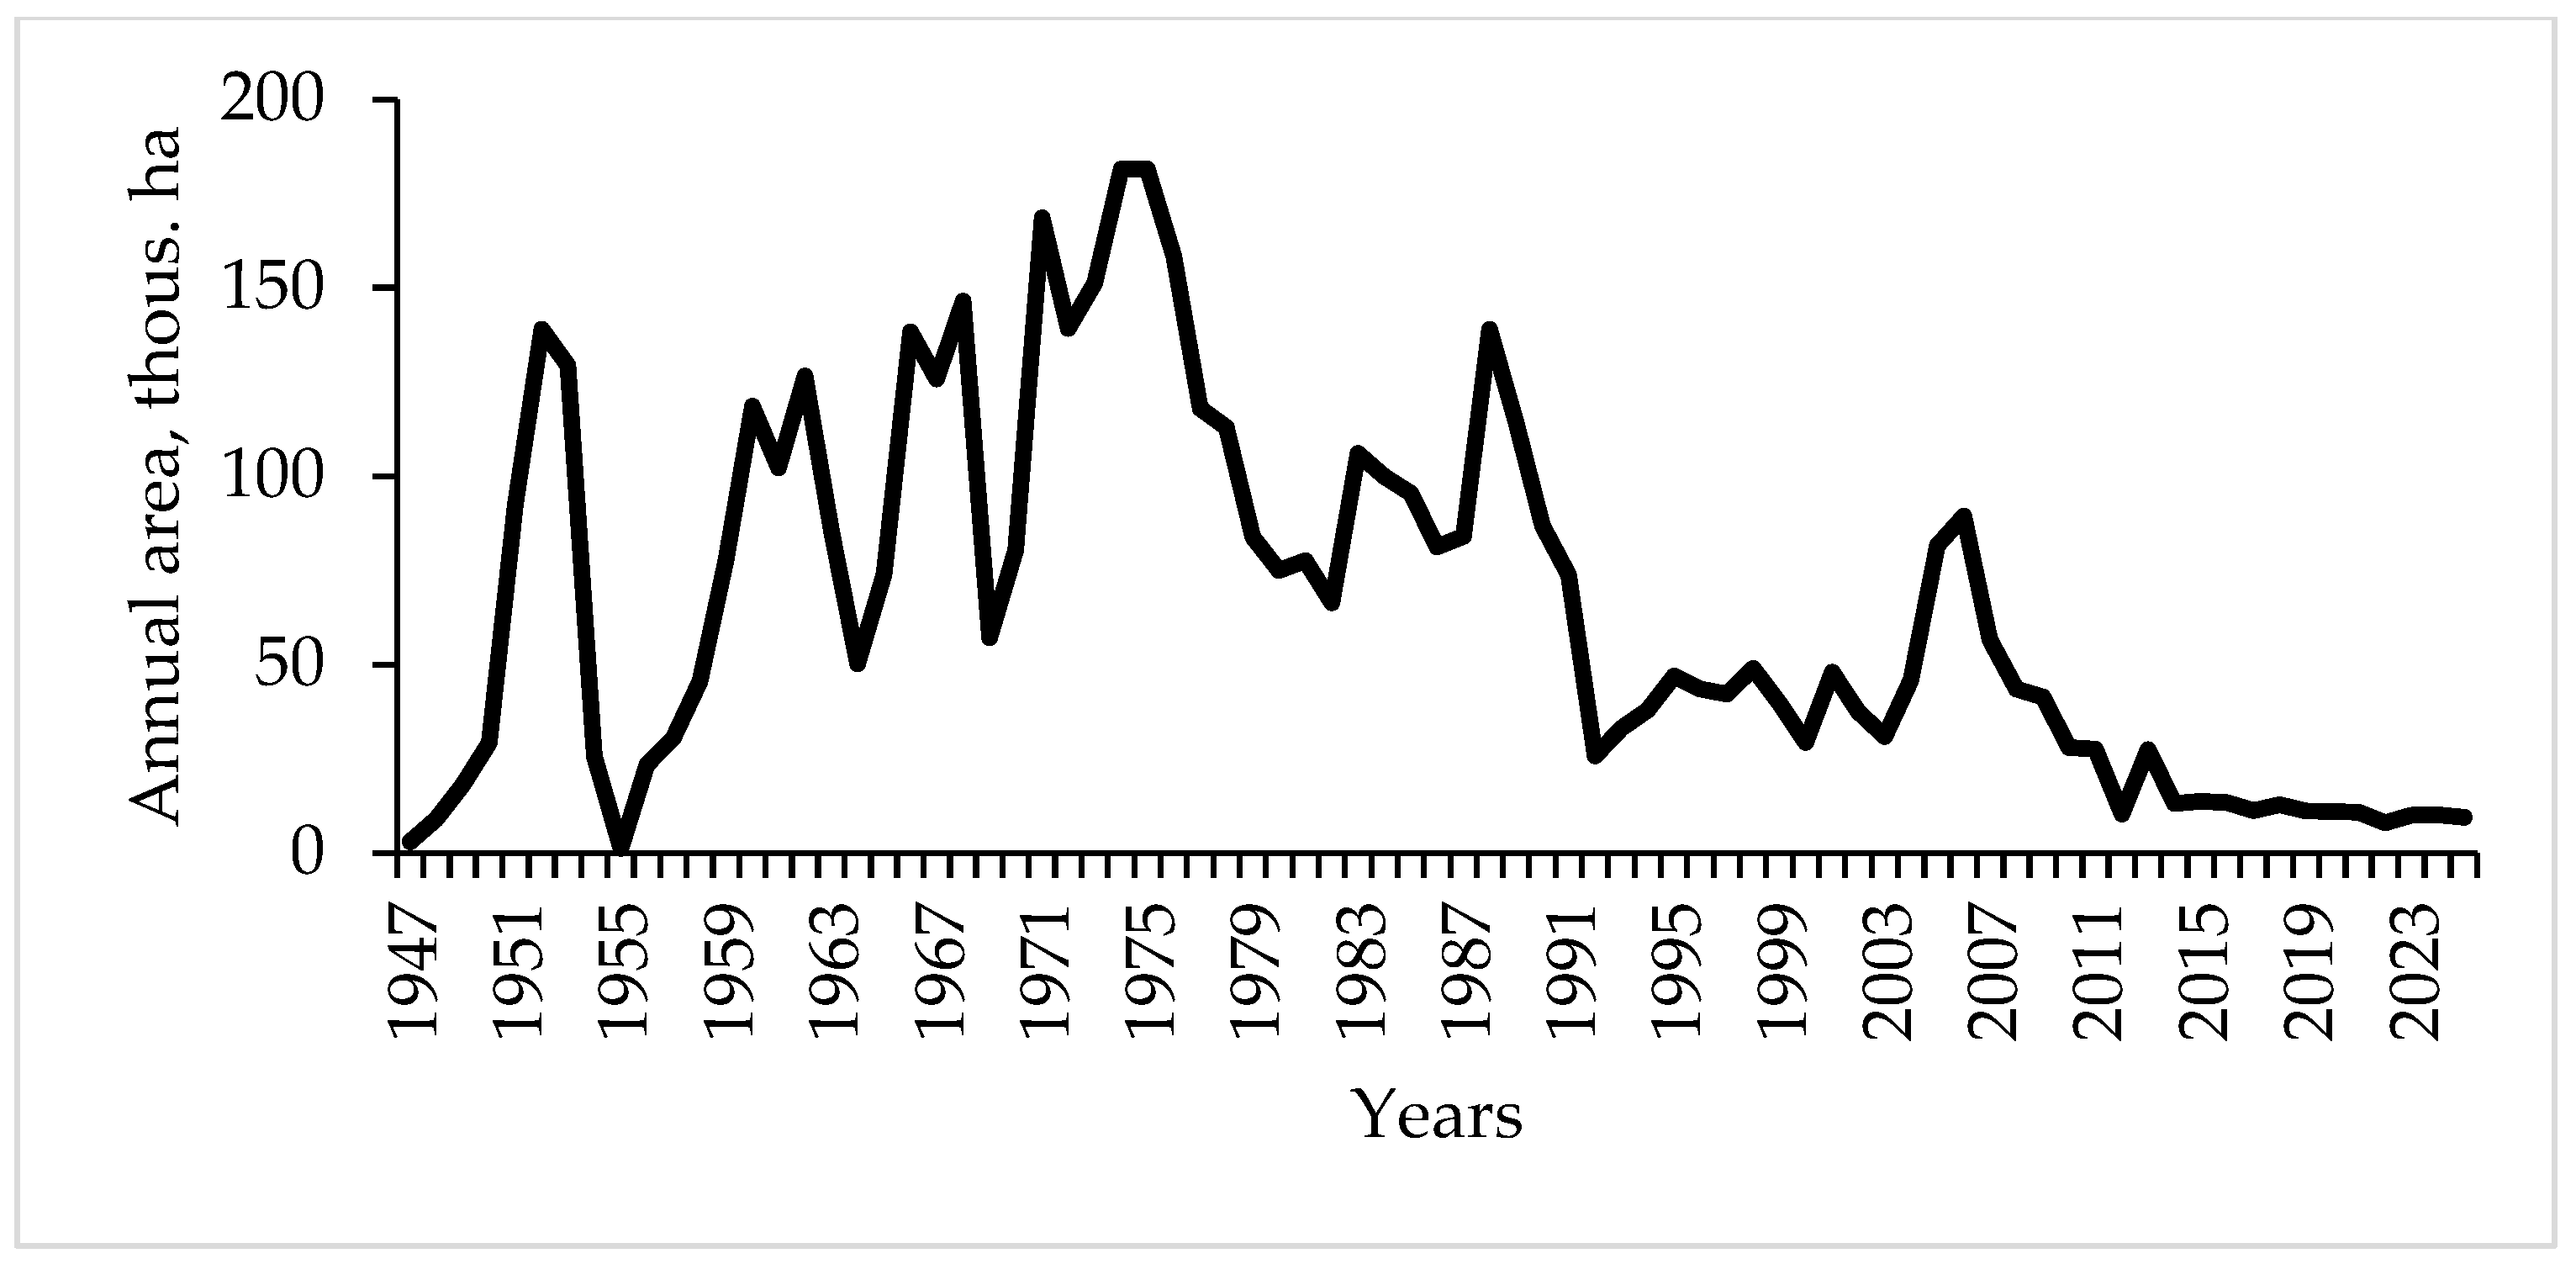
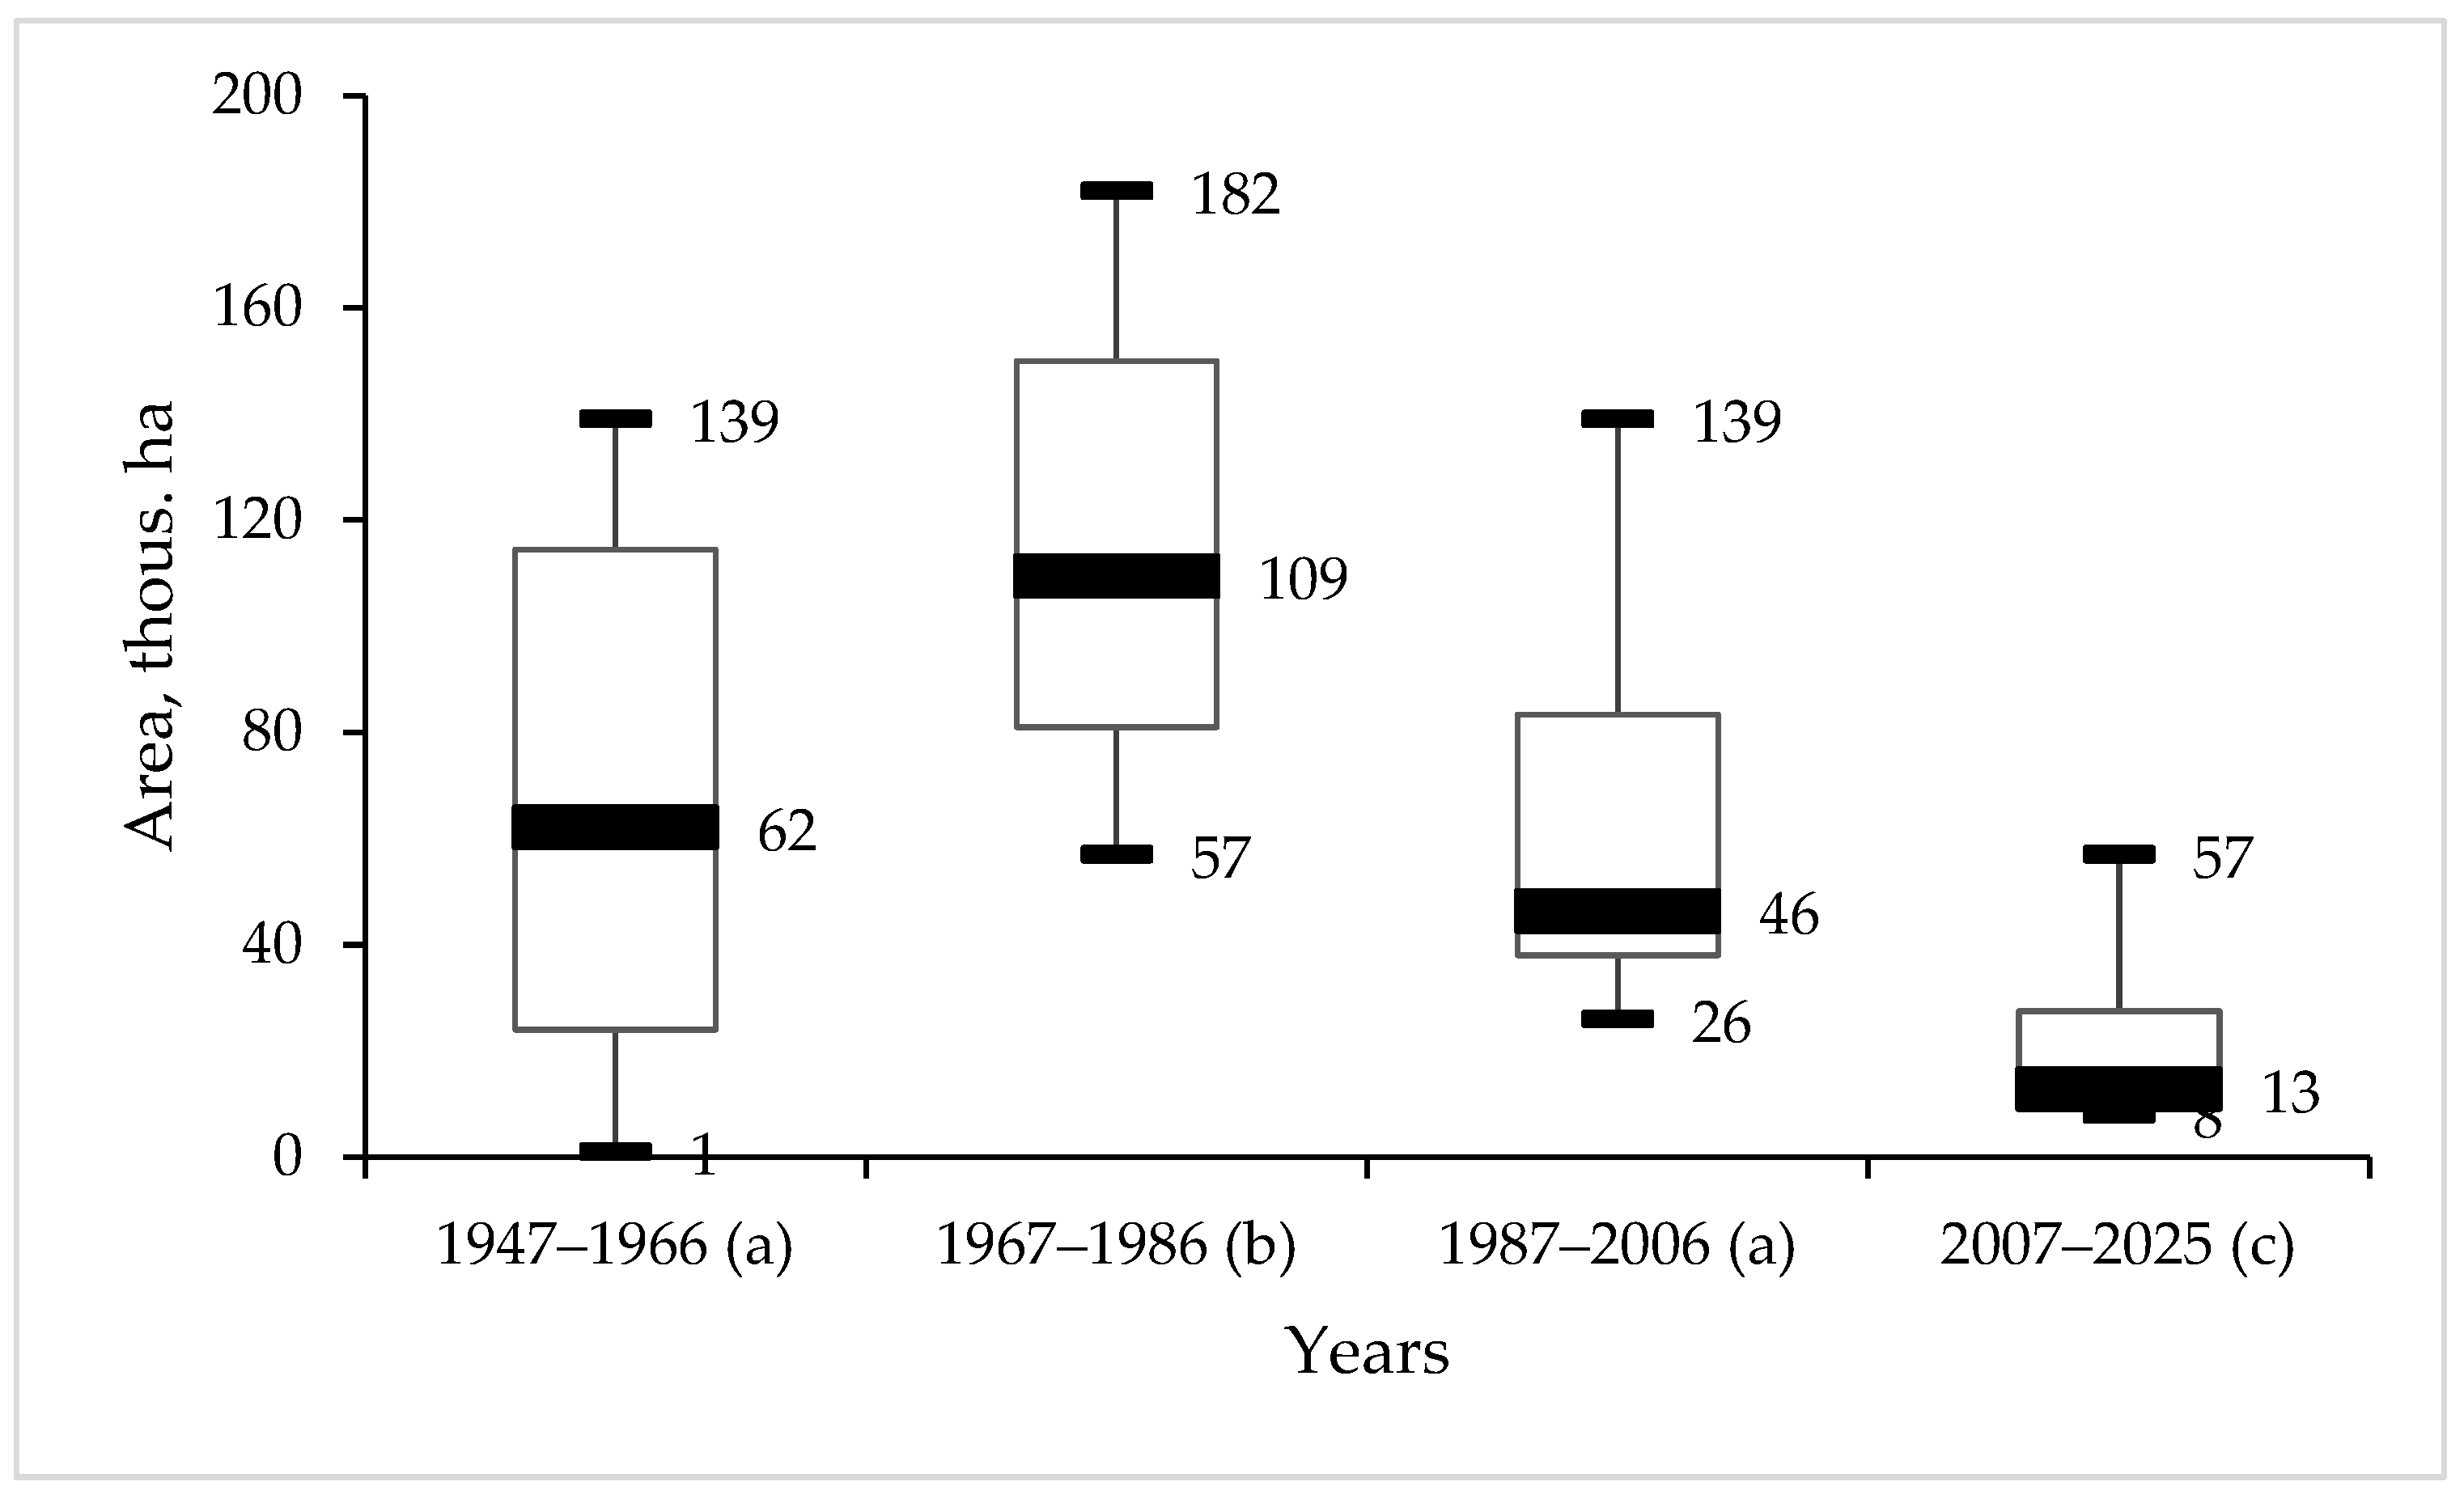
3.1. Dynamics of T. viridana Outbreaks in the Forests of Ukraine for 1947–2025

Archival data indicate the presence of T. viridana outbreaks in Ukraine since 1853, but data on their area have been available only since 1947. Mass propagation of this pest was registered in 1947–1949, 1952–1954, 1961–1963, 1964, 1966, 1972–1975, 1983–1984, 1986–1988, 1992, 1996, and 1998 [9]. Since the beginning of the new millennium, one long-term outbreak is registered with a maximum in 2006 and one relatively short-term one with a maximum in 2013 (Figure 2). Since outbreaks in individual TV populations and even within a single population started and collapsed in different years, on this scale, we can only see the most favorable years for outbreak development.
The TV outbreak in the forests of Ukraine in 1947–1955 developed according to the classical cyclic type [6]. The next two outbreaks were also cyclic, but with an increase in the minimum and maximum outbreak areas, a sharp decrease at the peak, and with subsequent recovery. The outbreak of the 1970s was longer, with the area decreasing after the peak, subsequent recovery, and slow collapse. The minimum area of TV outbreaks exceeded 70 hectares, and the maximum area (1974–1975) exceeded 180 thousand hectares.
Over the 20 years 1967–1986, 4 outbreaks of TV were recorded, while over periods of the same duration 1947–1966 and 1987–2006—3 outbreaks each, and over 2007–2025—2 outbreaks (see Figure 2). A reliable increase in the annual foci area in 1967–1986 compared to 1947–1966, with a subsequent reliable decrease in the next periods (Figure 3) was confirmed by the Kruskal–Wallis test (H (chi2) = 39.55; p = 1.32 × 10⁸).
Since the late 1980s, TV foci area has decreased (see Figure 3), and some of the reasons for this are discussed in the next subsections.

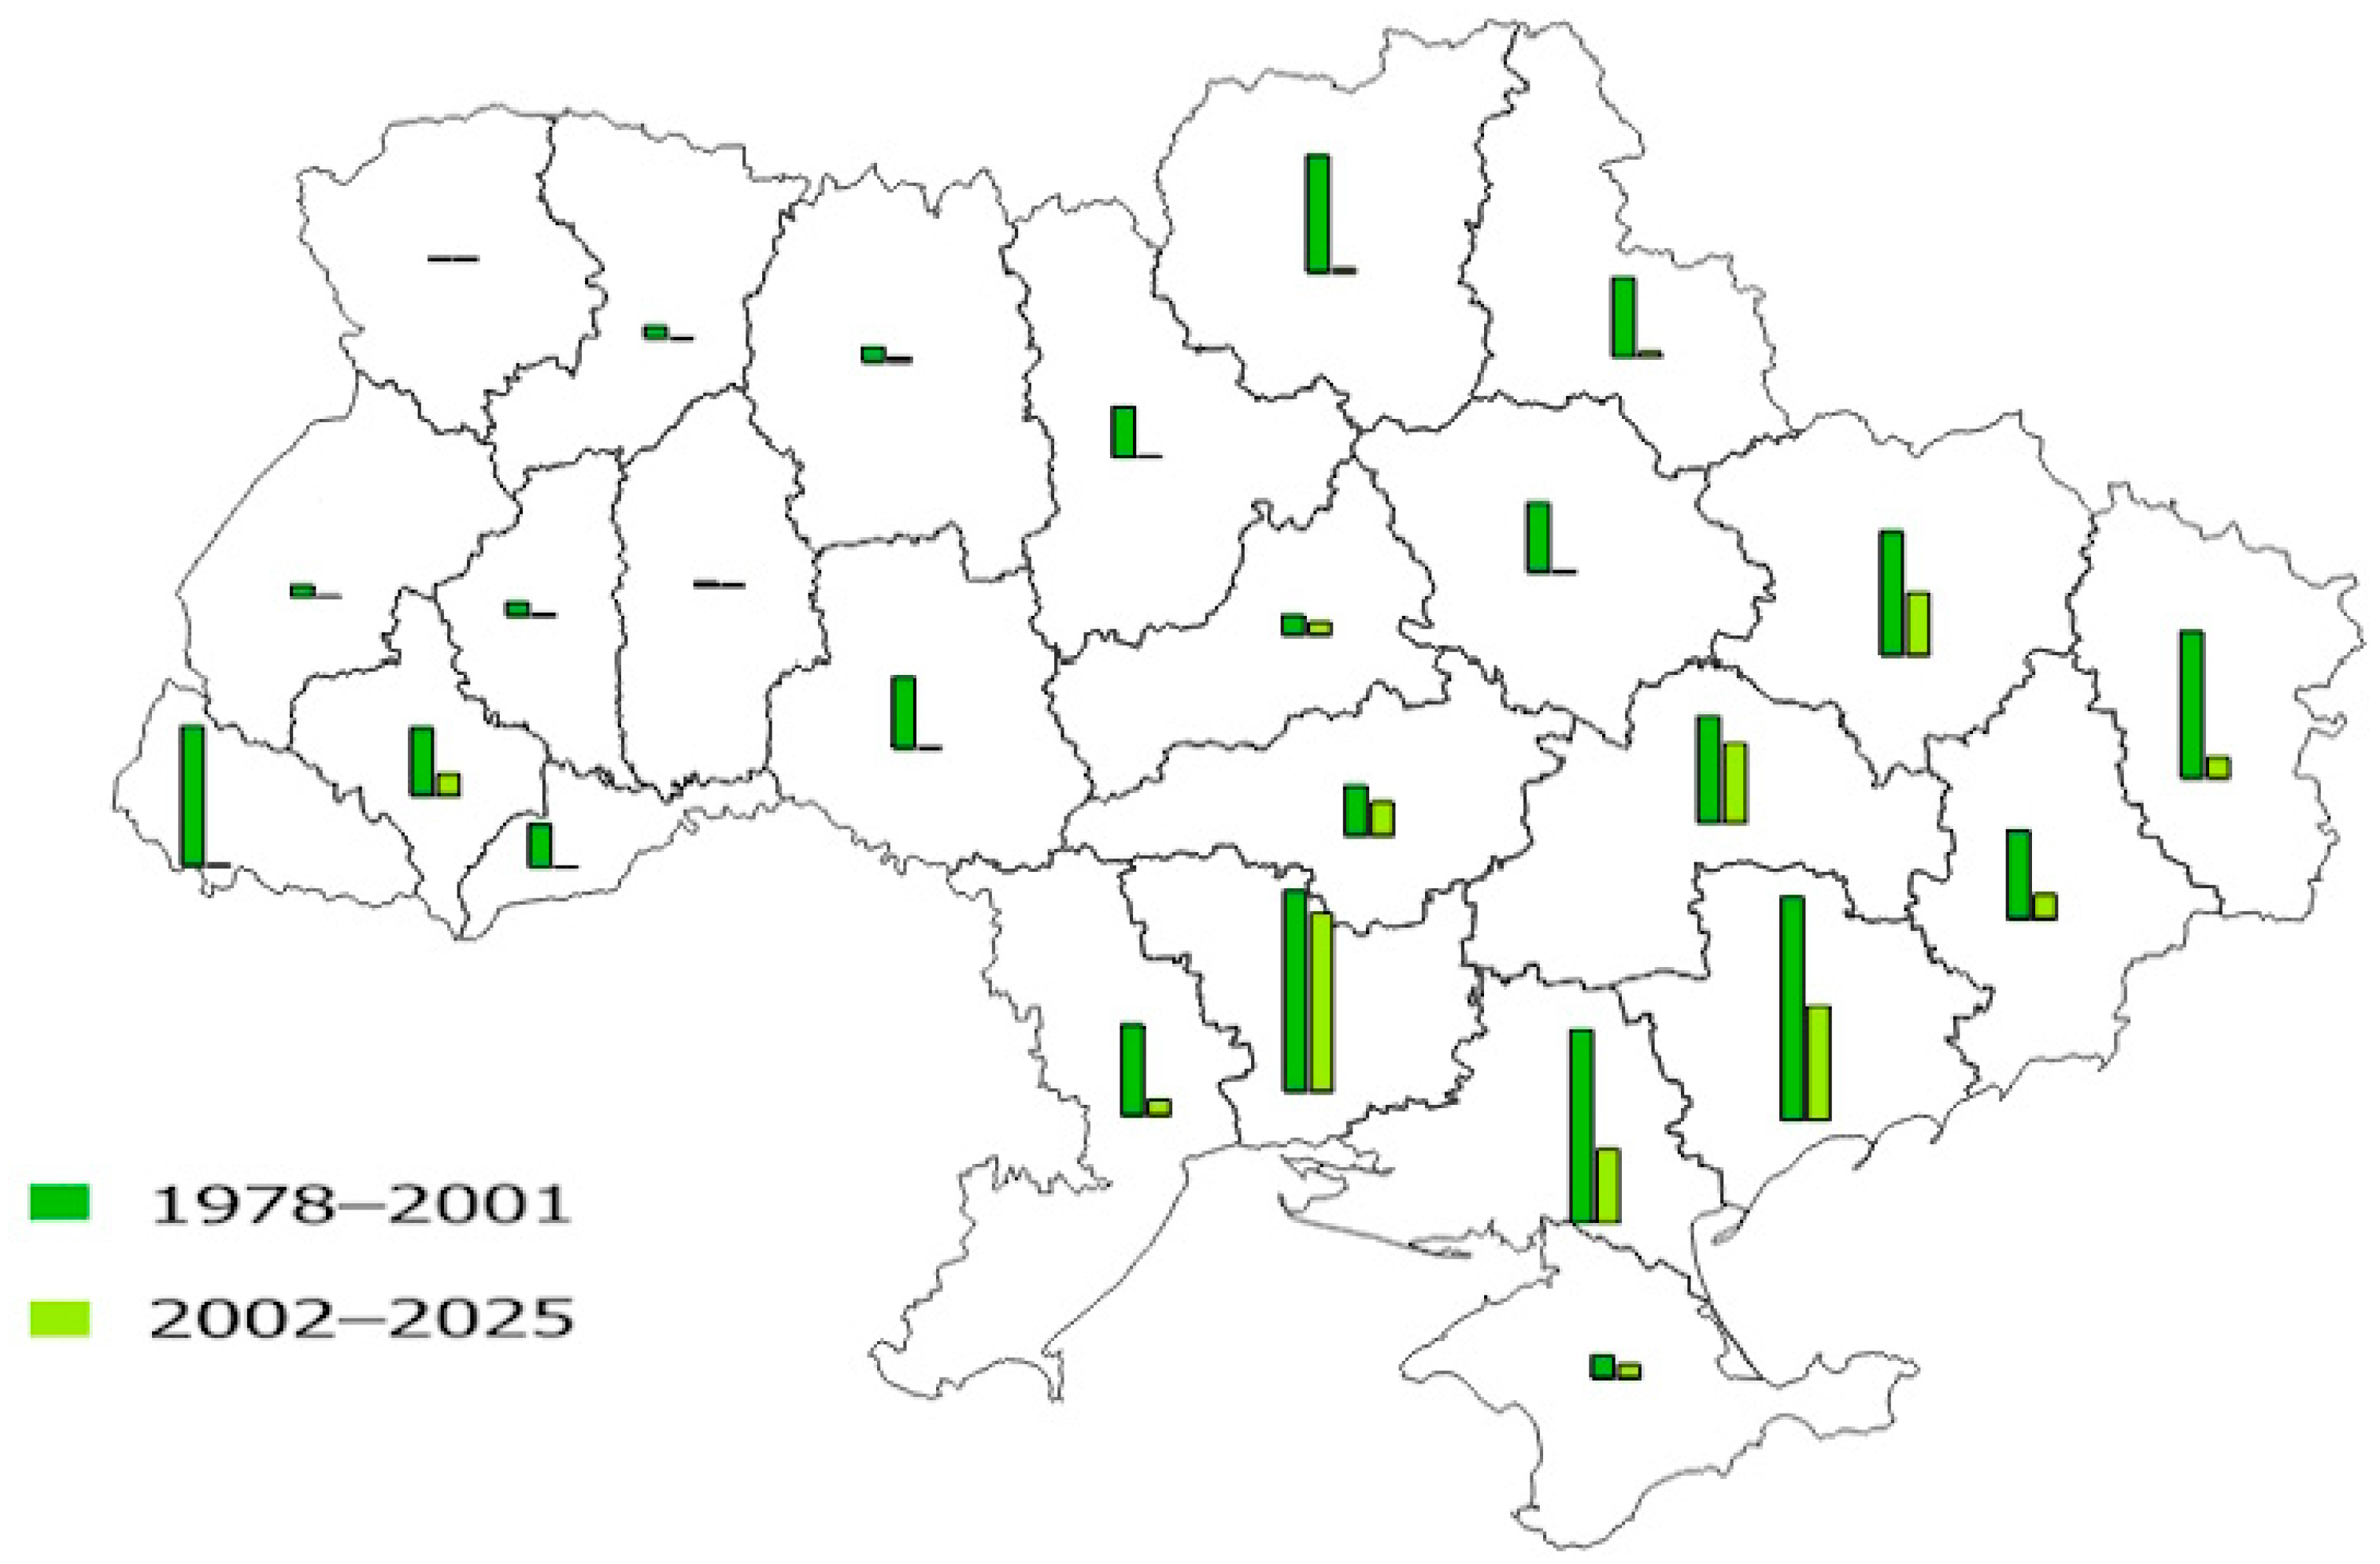
3.2. The Main Parameters of T. viridana Outbreaks in Forests of Individual Regions

In 1978–2001, TV outbreak severity (mean foci area (ha) per oak stands area (thousand ha)) exceeded 100 ha/thousand ha in seven regions, mostly in the eastern and southern parts of Ukraine (Figure 4). In 2002–2025, the areas of TV outbreaks remained high in the Mykolaiv and Zaporizhzhia regions, where the area of oak forests is relatively small. In the Kharkiv and Kherson regions, such areas decreased by more than twice. In Transcarpathian, TV outbreaks were absent, while in Chernihiv, they constituted only 3 ha/thousand ha.
Among the regions in which the average specific area of TV foci in 1978–2001 was from 51 to 100 ha/thousand ha, in the second period, in the Dnipropetrovsk region, it decreased from 95.4 to 71.2 ha/thousand ha, and in others did not exceed 20 ha/thousand ha. Among the regions in which the average specific area of TV foci in 1978–2001 was from 21 to 50 ha /thousand ha, it decreased only in the Kirovohrad region by 30%, and in others it was less than 1 ha/thousand ha. Among the 8 regions in which the average specific area of TV foci in 1978–2001 was less than 20 ha/thousand ha, it decreased to several hectares. The smallest decrease was observed in the Cherkasy region (17.3 to 11.1 ha/thousand ha) (see Figure 4).
From 1978 to 2001, the outbreaks occurred annually in most eastern and southern regions (incidence = 1) (Figure 5). Outbreak incidence was 1–3 years out of 10 in the western regions as well as in the Kirovohrad region (on the border of Forest-Steppe and Steppe zones) and the Chernihiv region (in the Forest zone with dominance of Pinus sylvestris L.). From 2002 to 2011, outbreak incidence was 7–8 years out of 10 in Kharkiv (on the border of Forest-Steppe and Steppe zones) and southern regions, and comprised 1–3 years out of 10 in all western and some of central regions. The most noticeable decrease in the incidence of outbreaks (from 1 to 0.2) occurred in the Dnipropetrovsk and Kharkiv regions (see Figure 5).
From 1978 to 2001, the mean duration of TV outbreak was the shortest (3 years) in the Transcarpathian, Ivano-Frankivsk, and Chernihiv regions, which are marked by high forest coverage, rather high precipitation, and the most favorable conditions for forest health. The duration of the outbreak did not change in the next period in two of these regions, and outbreaks did not occur at all in the Transcarpathian region (Figure 6). The longest TV outbreak (6–7 years) was recorded in 1978–2001 in regions located in 2 natural zones (Kyiv, Sumy, Kharkiv), and in the Steppe zone, where forests grow in isolated tracts (Dnipropetrovsk, Zaporizhzhia). The long TV outbreak in Crimea and Vinnytsia may be associated with the spread of several oak species (Q. robur L., Q. pubescens Willd., Q. petraea Liebl.) in these regions, to which TV micropopulations are adapted [30].
In 2002–2025, the longest TV outbreak (4 years) occurred in the Zaporizhzhia, Luhansk, and Donetsk regions, where forests grow in isolated tracts. In the Rivne and Transcarpathian regions, outbreaks did not occur. In Lviv, Chernivtsi, and Cherkasy, outbreaks lasted no longer than two years. Outbreaks collapsed after three years in other regions (see Figure 6).
From 1978 to 2001, the number of TV outbreaks was the greatest (4–5 for 24 years) in the Odesa, Kherson, Mykolaiv, and Luhansk regions, where forests grow in isolated tracts (Figure 7). Three outbreaks occurred in five regions and one or two in the other sixteen.
From 2002 to 2025, the number of outbreaks remained unchanged in Donetsk and Dnipropetrovsk regions (three outbreaks in both periods), Sumy, Khmelnytsky, and Cherkasy regions (two outbreaks in both periods), and Zhytomyr, Zaporizhzhia, and Chernihiv regions (only one outbreak in both periods). In all other regions, the number of outbreaks decreased (see Figure 7).
The intervals between TV outbreaks are inversely proportional to the number of outbreaks for the analyzed period (see Materials and Methods). This parameter was twenty-four years in both periods in three regions (Figure 8). In the Transcarpathian and Rivne regions, TV outbreaks were not recorded in the second period.
In three regions, the interval between TV outbreaks was twelve years in both periods, and in eight, it increased to twenty-four years. In two regions, the interval between TV outbreaks was eight years in both periods, and in three it increased to twelve years. In the Mykolaiv region, the interval between outbreaks increased from six to eight years, and in Odessa and Kherson regions, from 4.8 to 8 and 12 years, respectively (see Figure 8).

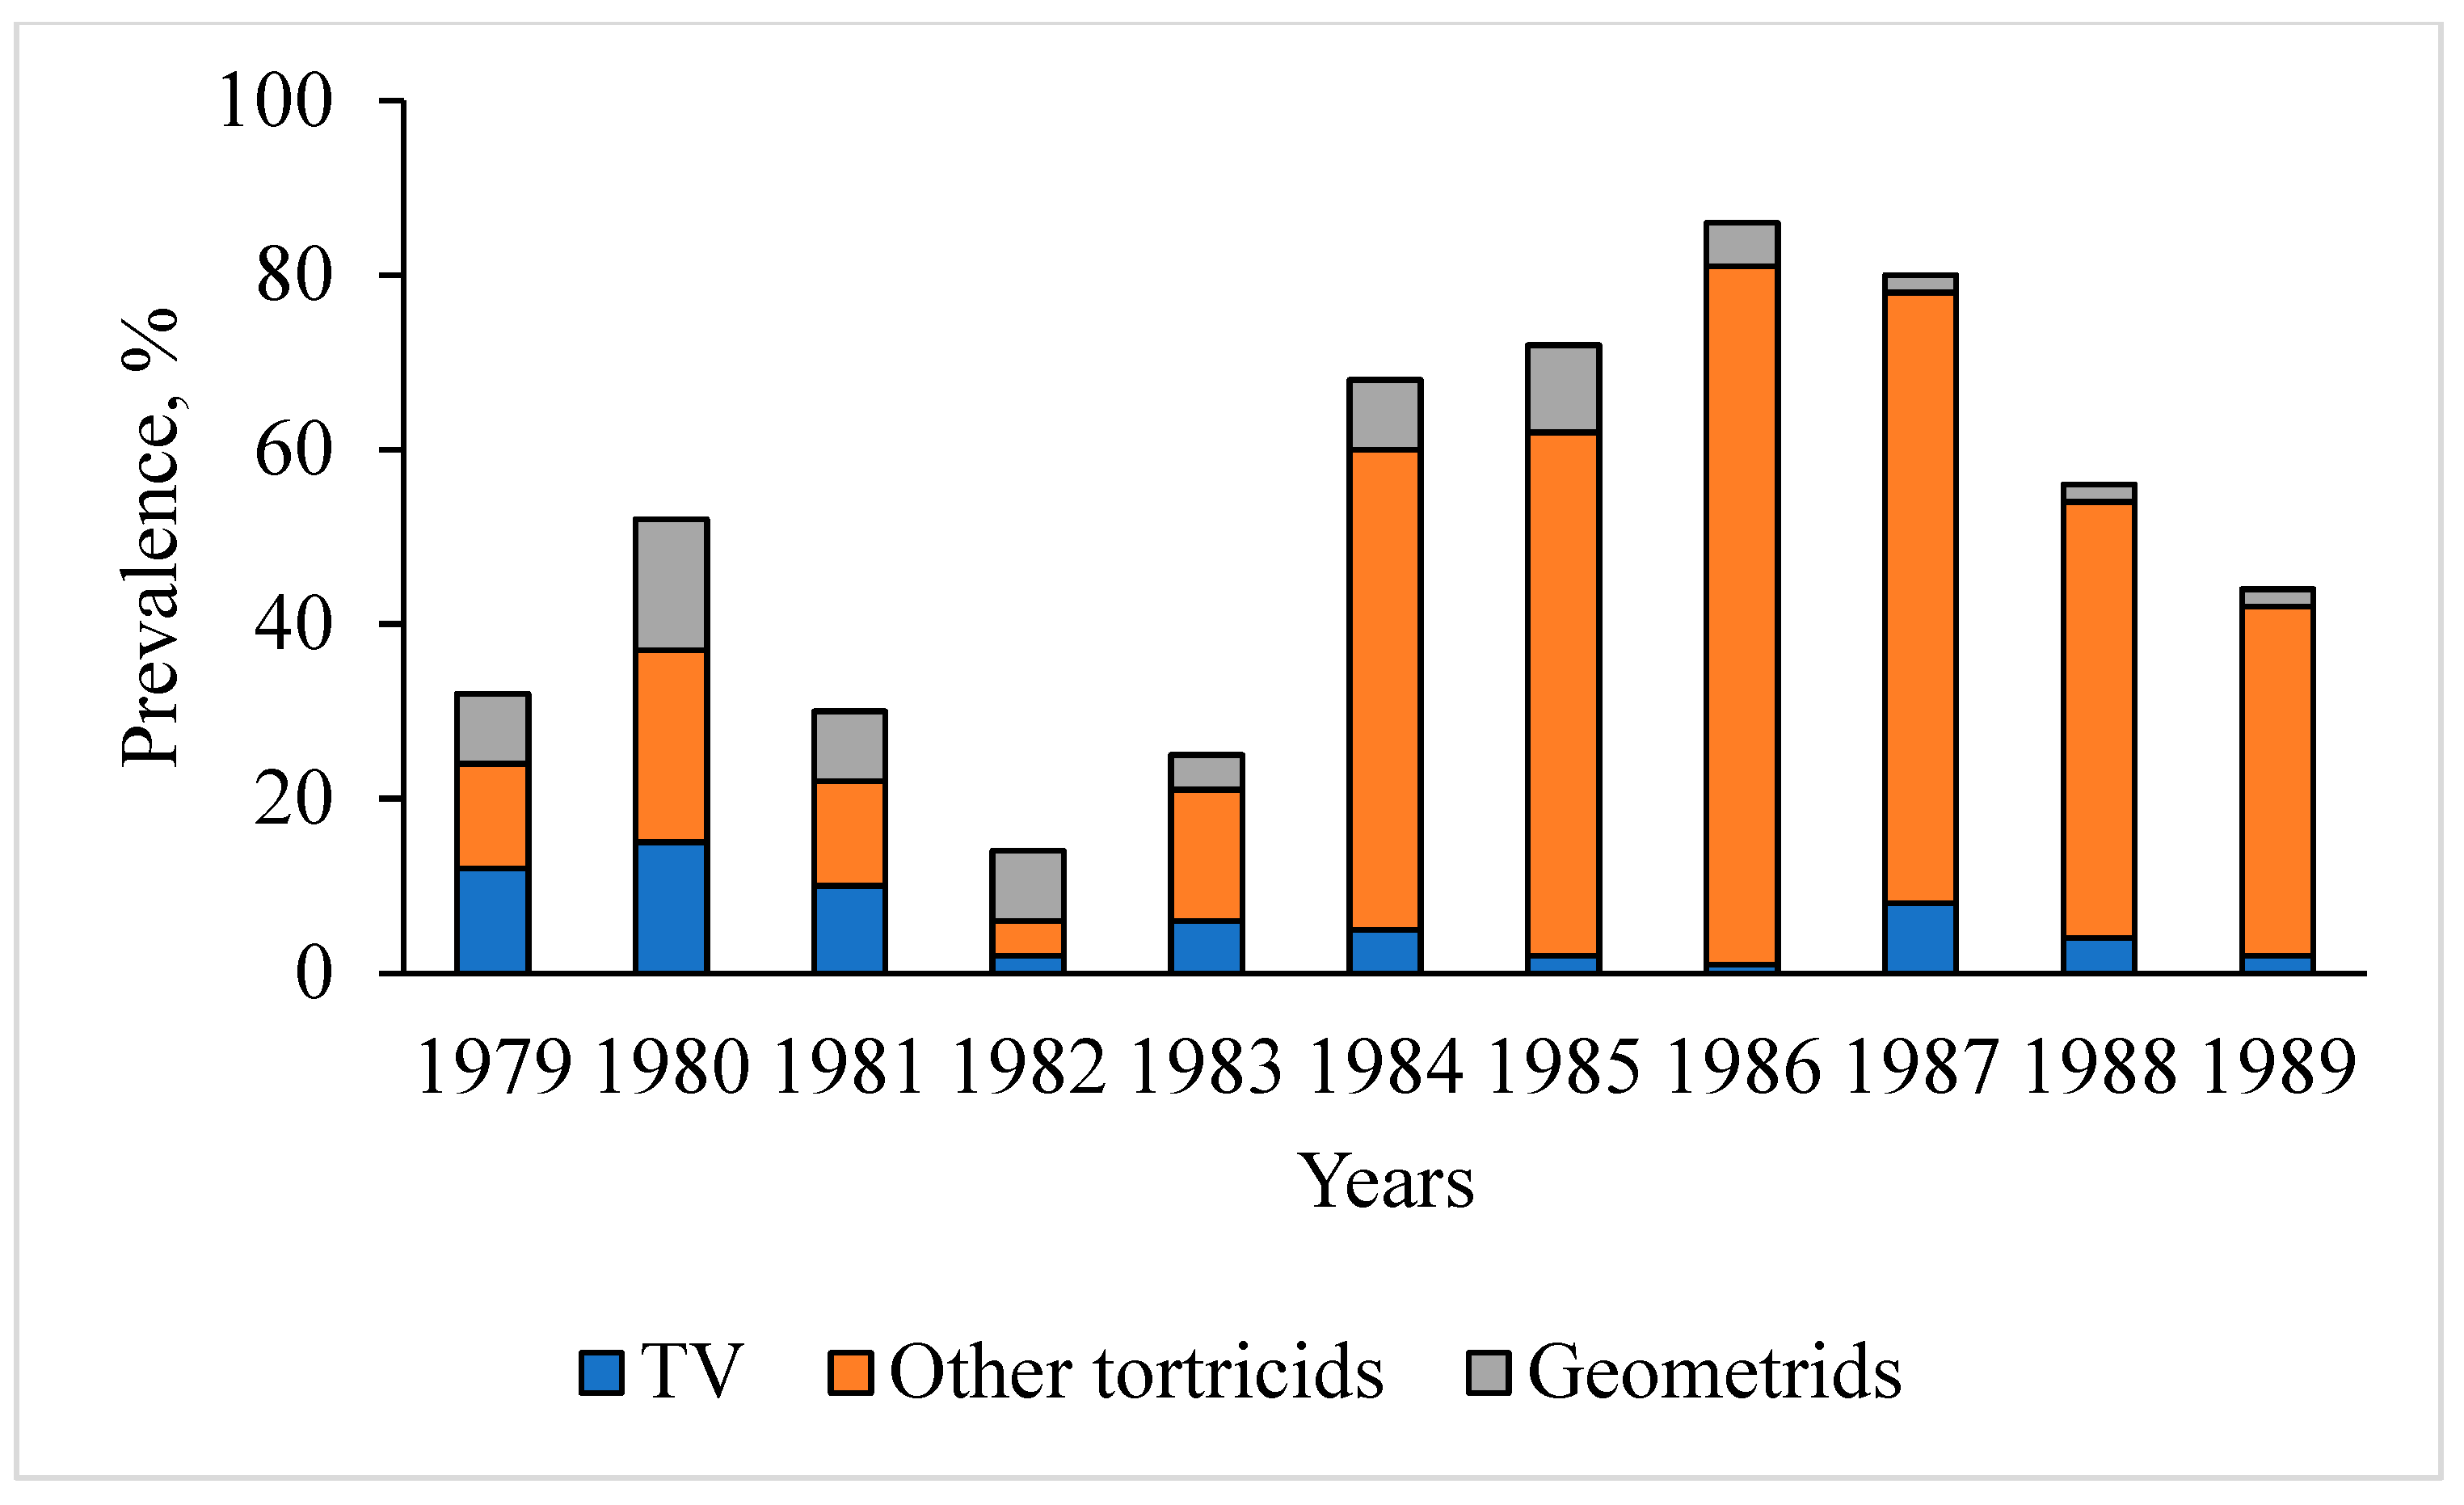
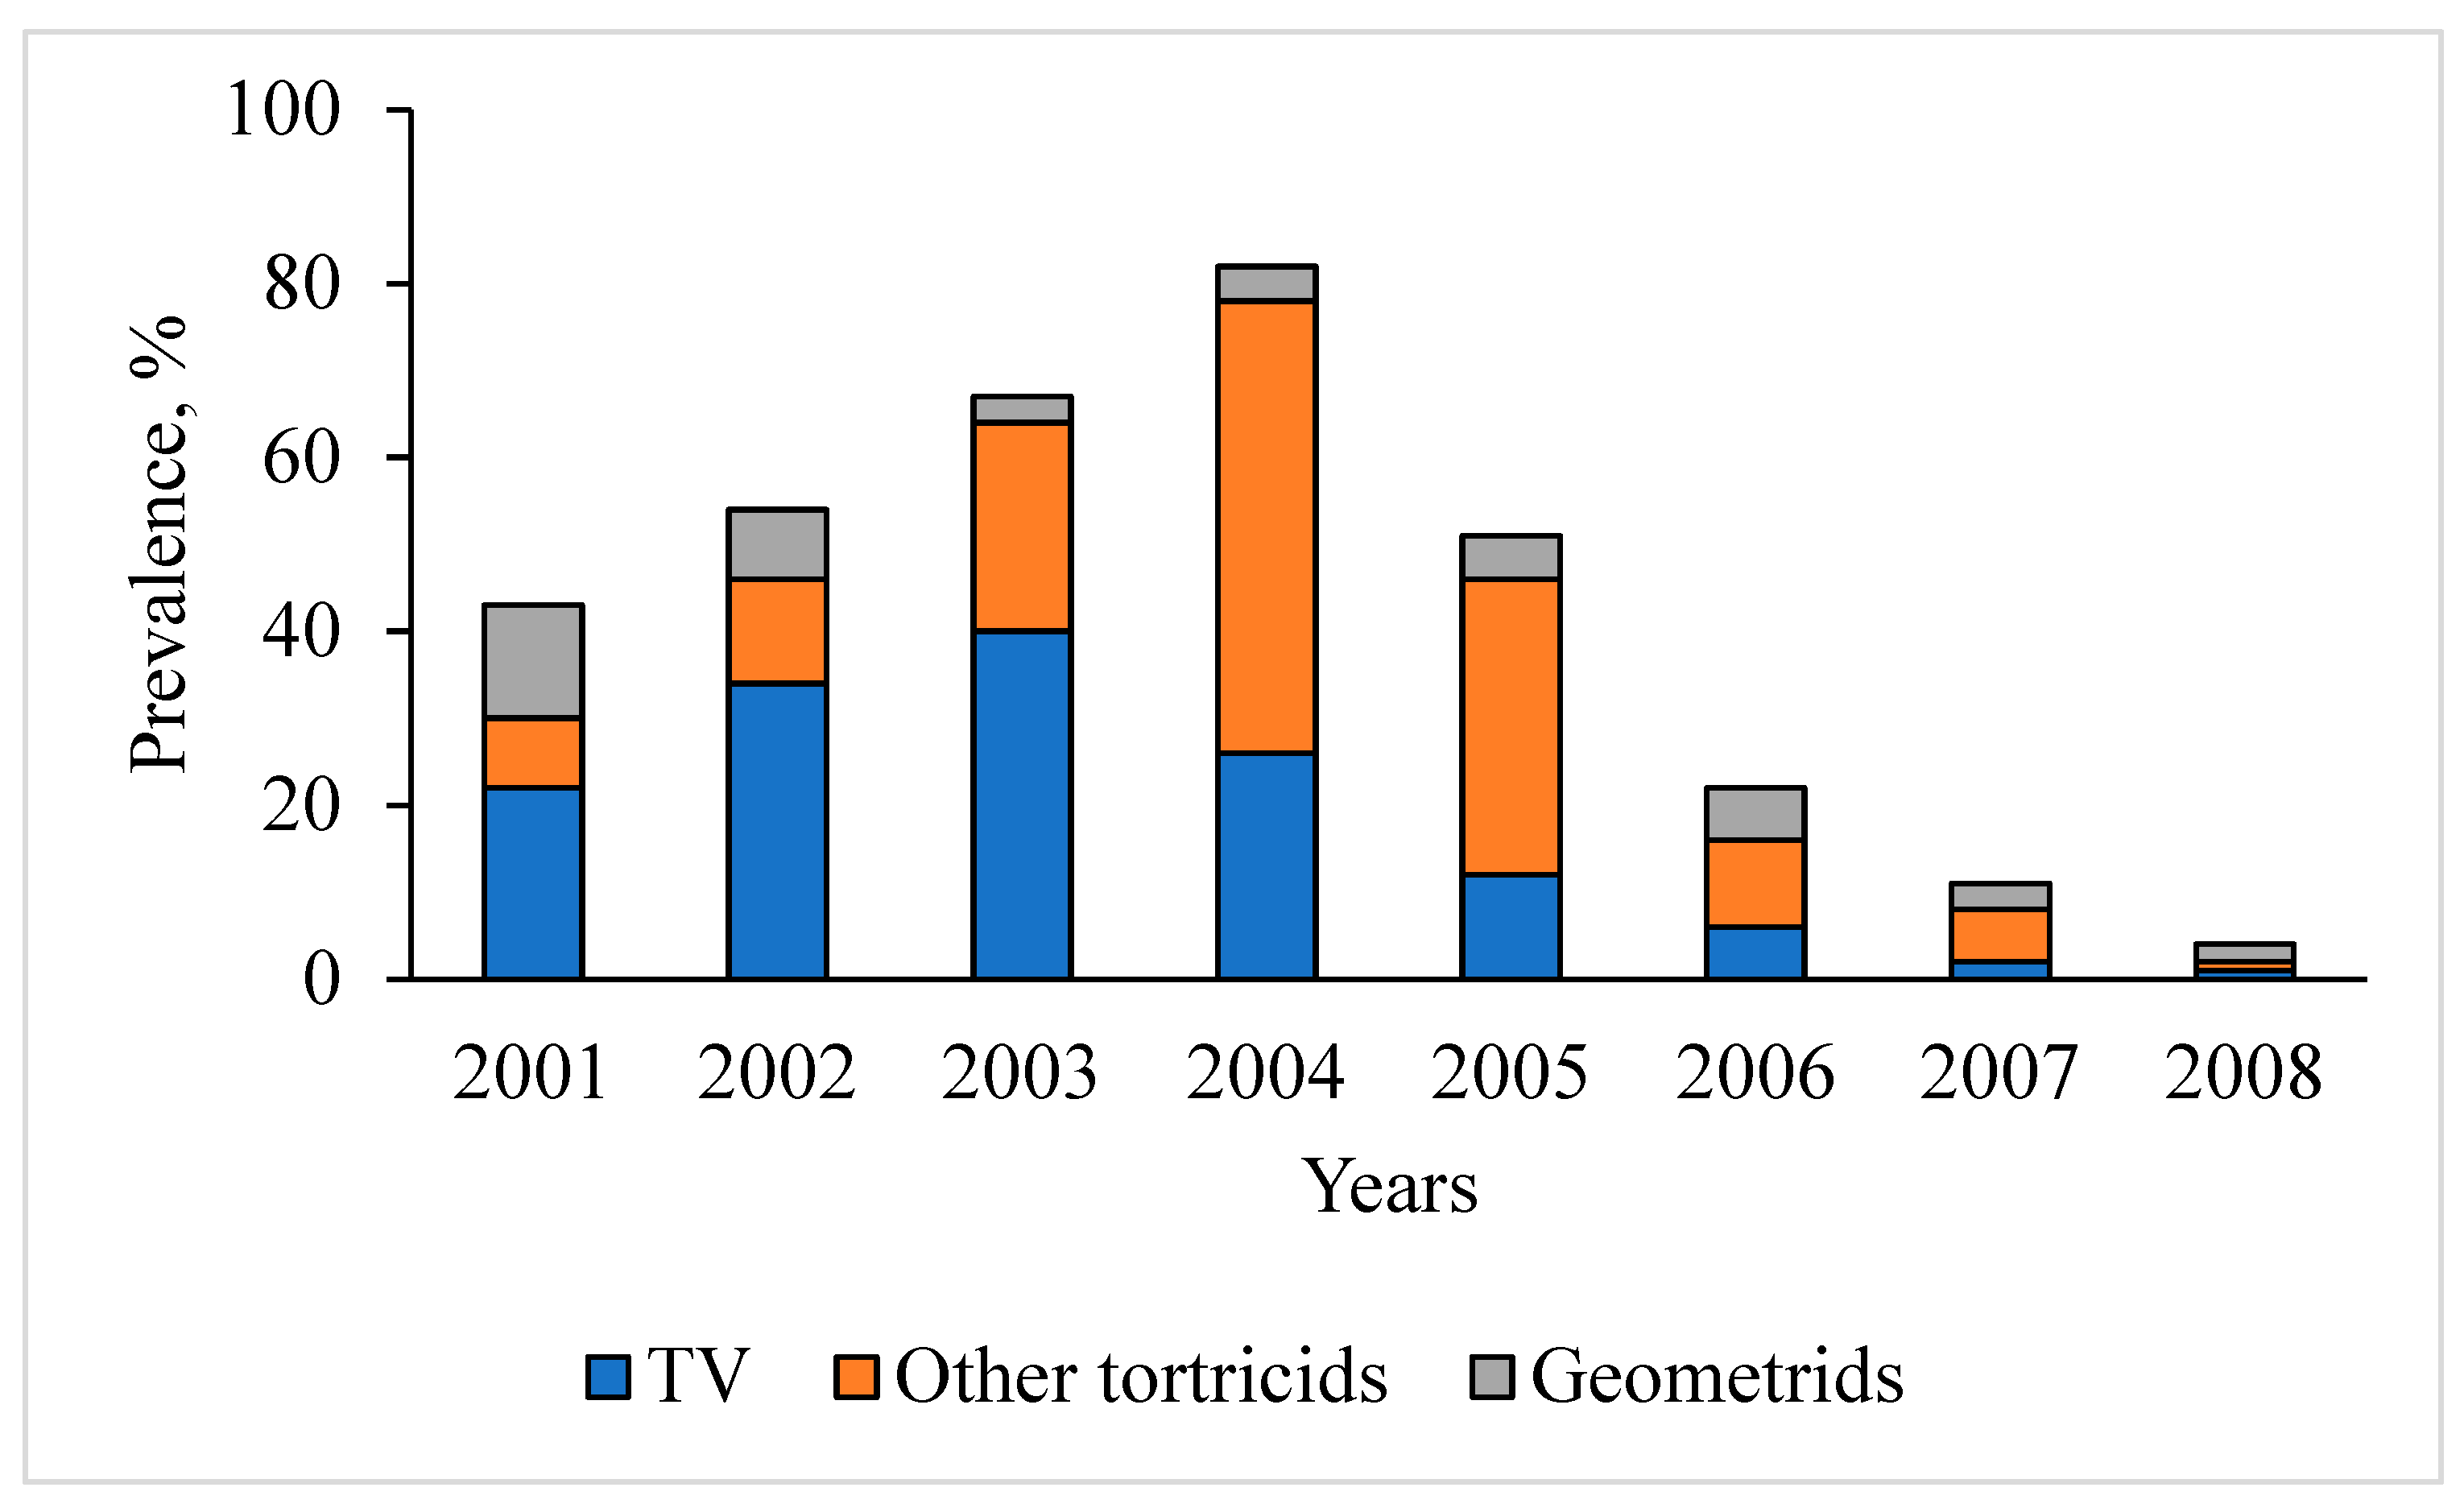
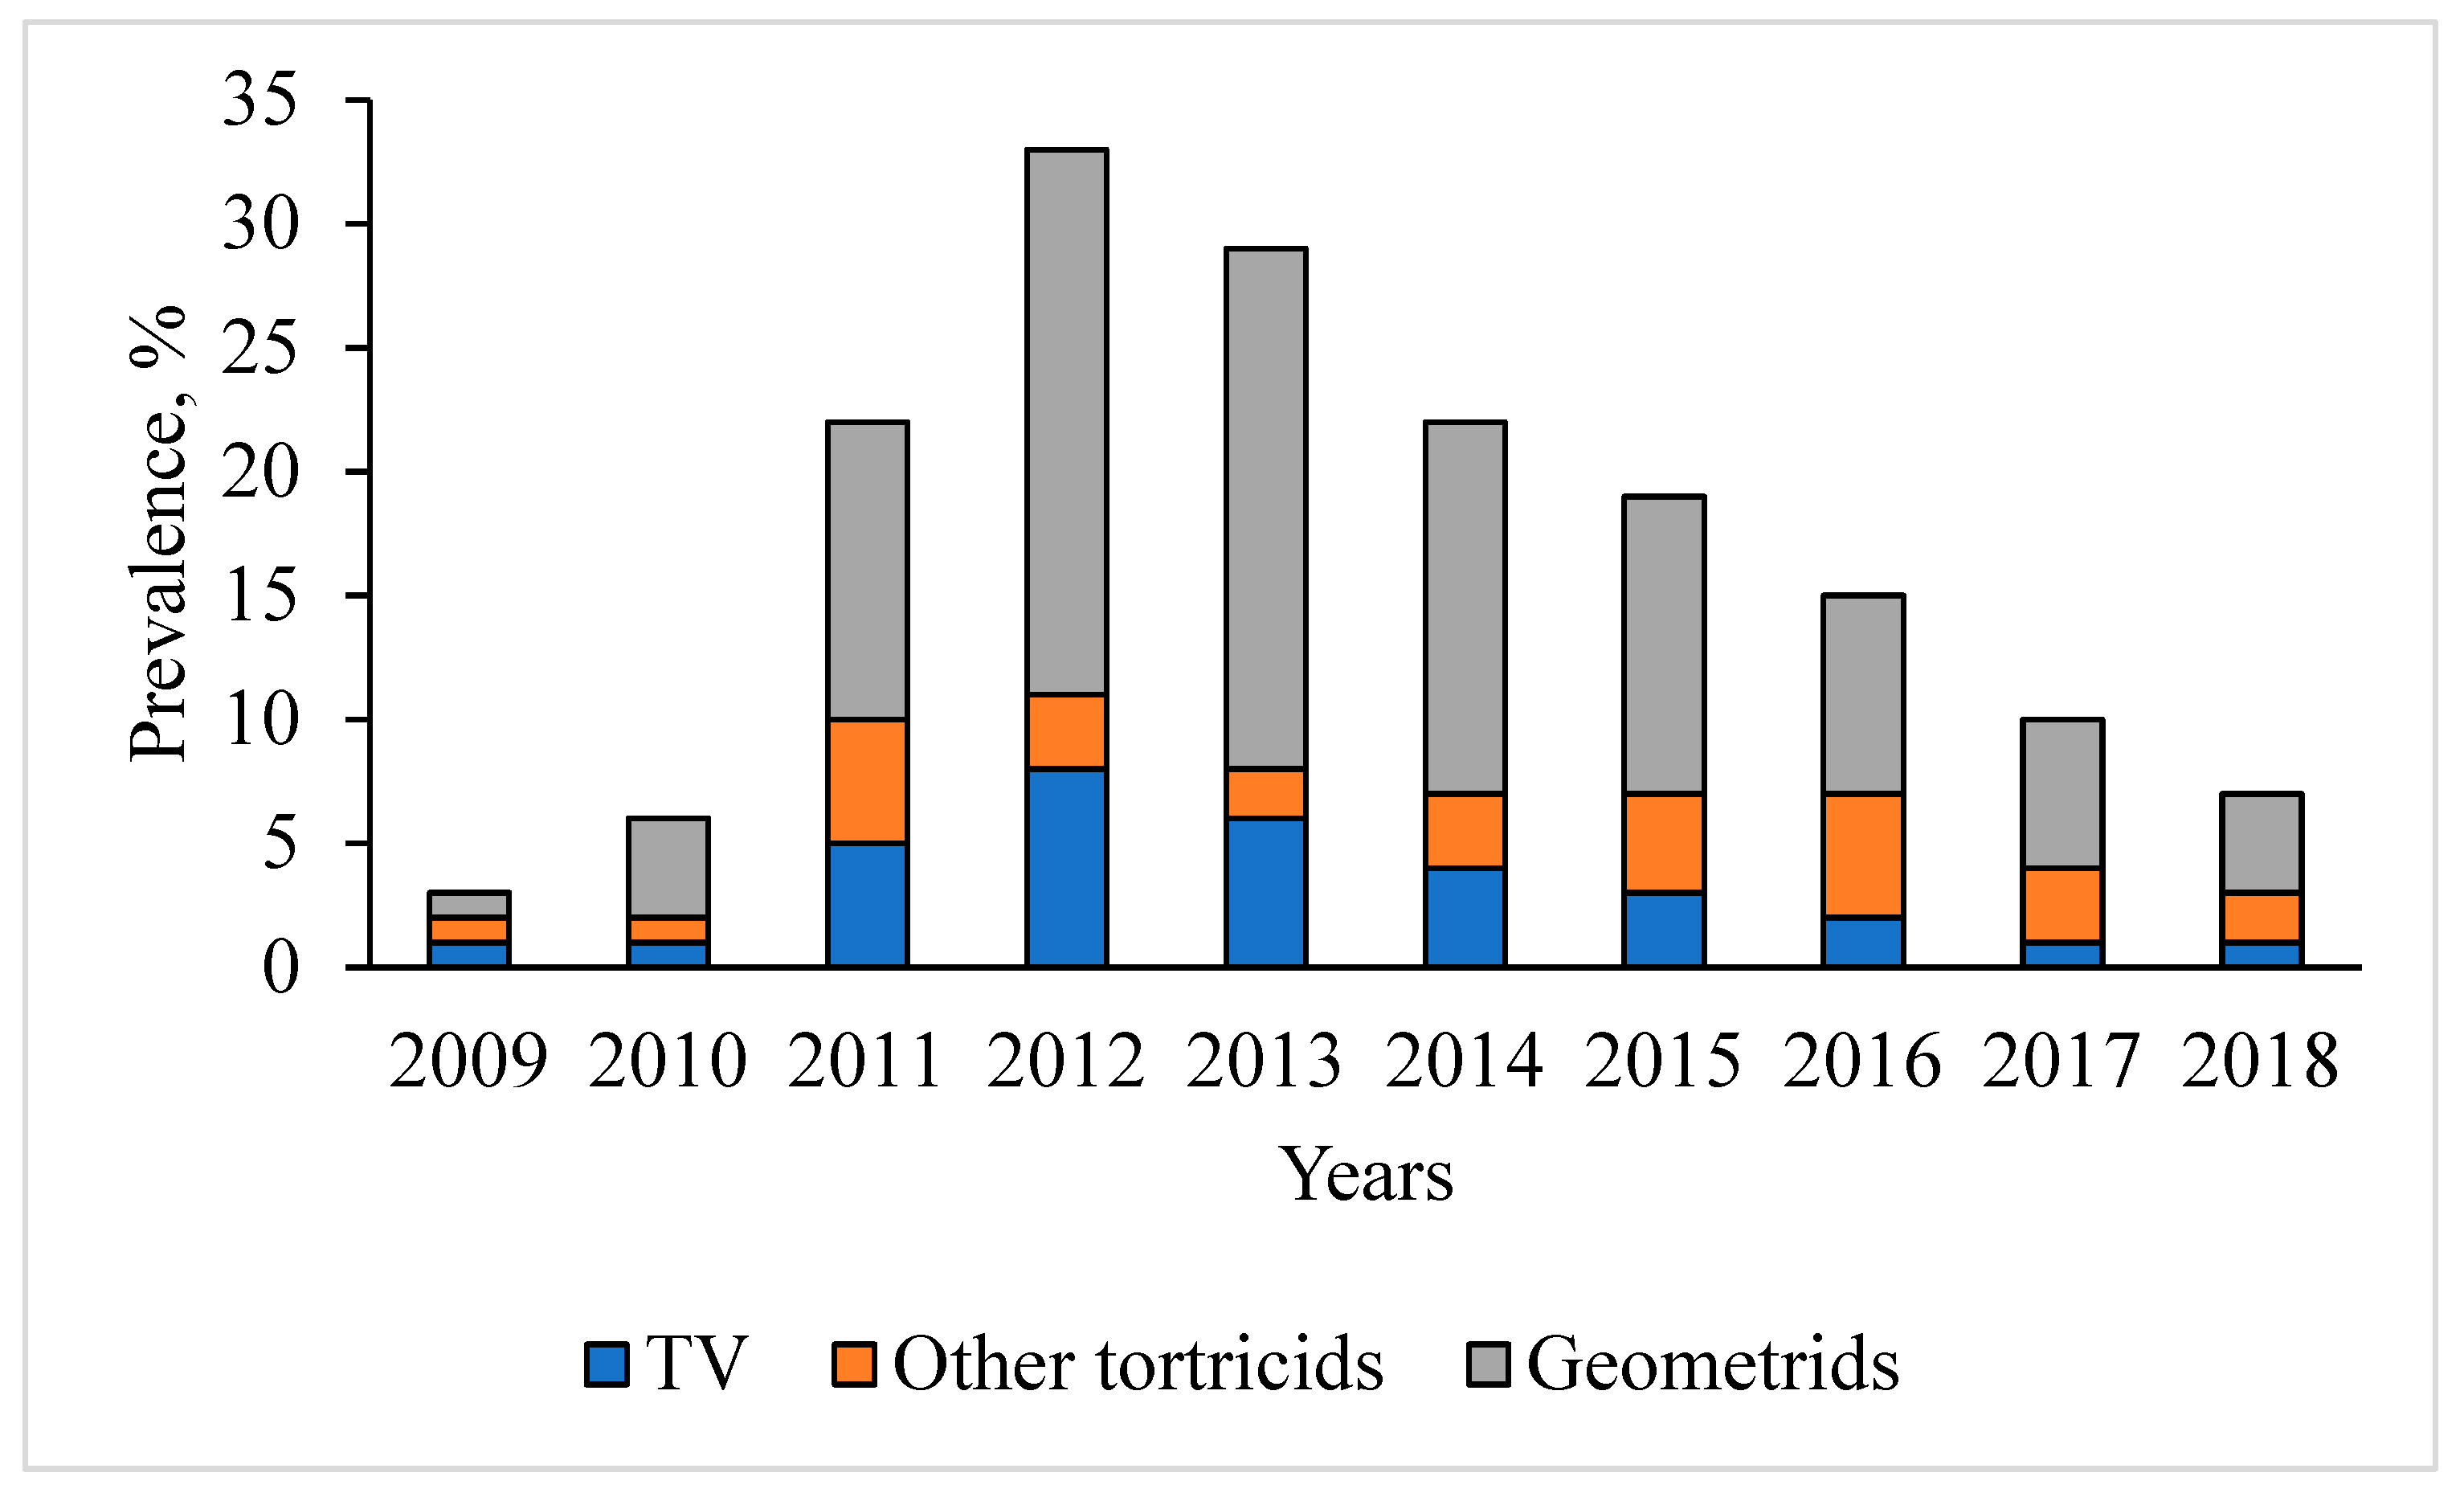
3.3. Tortrix Viridana as Part of the Flush Feeder Complex in Long-Term Dynamics

The species composition and prevalence of individual species of defoliators of the early spring complex (flush feeders) in oak stands of the Kharkiv region were assessed over a long period [8,9]. Most flush feeders are represented by the families Tortricidae and Geometridae. The most prevalent Tortricidae were Aleimma loefflingiana (Linnaeus, 1758), Archips xylosteana (Linnaeus, 1758), Archips crataegana (Hübner, [1796–1799]), and Tortrix viridana (Linnaeus, 1758). The most prevalent Geometridae were Alsophila aescularia (Denis & Schiffermüller, 1775), Apocheima hispidaria (Denis & Schiffermüller, 1775), Biston strataria (Hufnagel, 1767), Ennomos quercinaria (Hufnagel, 1767), Erannis defoliaria (Clerck, 1759), Lycia hirtaria (Clerck, 1759), Operophtera brumata (Linnaeus, 1758), and Phigalia pilosaria (Denis & Schiffermüller, 1775).
Some of these species hibernate as eggs. Several geometrids hibernate as pupae, swarm, and oviposit in early spring (approximately on the dates of stable temperature transition over 5 °C). In both cases, larvae begin feeding from budburst. Most of these insects prefer oak foliage and are competitors of TV, but can populate other tree genera when oak budburst is delayed or at its high defoliation. TV is one of the few species adapted to Quercus sp.
In 1979–1989, two waves were observed in the dynamics of flush feeders in oak stands of the Kharkiv region, with maxima in 1980 and 1986 (Figure 9).
From 1979 to 1981, the prevalence of TV was highest, but its share was comparable to other leaf rollers and geometrids. In 1982–1989, the prevalence of TV fluctuated around a very low level, while the abundance of other leaf rollers increased, reaching a maximum in 1986, mainly due to A. crataegana. The latter gained an advantage over TV when, after severe defoliation of oak in the previous few years, it switched to other tree and shrub species. However, feeding on less favorable food led to a decrease in the weight of pupae and the fecundity of adults, and by 1990, the outbreak had collapsed [9]. During the next outbreak of flush feeders in oak stands of the Kharkiv region, TV prevalence increased from 2001 to 2003. From 2004, other tortricids were more prevalent, although their number gradually decreased. Geometrids occurred in low densities except in 2001, although their prevalence was lower than TV (Figure 10). Like in previous outbreaks, polyphagous tortricids and geometrids changed host species after oak defoliation.
The latest outbreak is characterized by the predominance of geometers in the flush feeders’ complex (Figure 11).
The prevalence of all flush feeders in this outbreak was low, although in 2012–2013, a maximum of both geometrid moths and TV was registered. In that time, the total area of TV outbreaks in the forests of Ukraine also increased (see Figure 2).

3.4. Change in the Suitability of Forest Subcompartments for Tortrix viridana

An analysis of forest management databases of four Forestry Enterprises in the Kharkiv region showed that oak stands are suitable for T. viridana. Thus, the area of oak stands in dry and fresh fertile sites accounted for 95.6%–98.9% of all oak forests in the analyzed forestry enterprises (Table 1 and Table 2). The area of vegetative oak stands (coppices) accounted for 69.7–81.9 and 68%–80.7% of all oak stands in 1996 and 2017, respectively. Oak stands of 41–80 years old accounted for 27.8–57.8 and 16.1%–34.1%, with oak participation ≥ 90%—45.0–51.7 and 32.9%–44.7%, stands with relative stocking density < 65%—13.2–29.3 and 14.0%–23.8% of all oak forests in 1996 and 2017, respectively. At the same time, some subcompartments were suitable for TV by age, but unfavorable by relative stocking density. In contrast, others were suitable by age and relative stocking density, but unfavorable by forest site conditions or origin.
Filtering the data by all the specified indicators allowed us to determine the most favorable subcompartments for TV, the area of which was 0.1%–6.3% and 0.1%–1.5% of the oak forest area in 1996 and 2017, respectively (see Table 1 and Table 2).
From 1996 to 2017, the area of oak forests decreased in Kharkiv RS and Vovchansk FE and increased in Chuguyevo-Babchansk FE and Zhovtneve FE (Table 3).
In the first two Forestry Enterprises, the area of oak stands in dry and fresh fertile forest site conditions (D1, D2), of vegetative origin, of 41–80 years old, with oak participation ≥ 90%, relative stocking density < 65%, and stands with the highest scores for all indicators also decreased. In Chuguyevo-Babchansk FE, only the area of stands of 41–80 years and stands with oak participation ≥ 90% have decreased, and in Zhovtneve FE, all indicators except the share of oak stands in D1 and D2 have decreased.
The area of subcompartments with the highest scores for TV by all indicators decreased the most over the compared period in Vovchansk FE and Kharkiv RS (by 84.9 and 76.3%, respectively) (see Table 3).
The analysis of forest management databases of four Forestry Enterprises indicates that changes in the age of stands make the greatest contribution to the suitability of forests to T. viridana (Figure 12).
Some of the stands reached maturity and were felled, and young oak stands were planted in their place. At the same time, the youngest stands became middle-aged ones, which are most attractive for TV. However, their area was smaller than in the previous accounting period. The effect of changes in the oak proportion in the stand composition and their relative density is 24% and 19%, respectively. The shift in both of the latter indicators is most variable in individual Forestry Enterprises and is largely associated with the age composition of the stands [31,47].

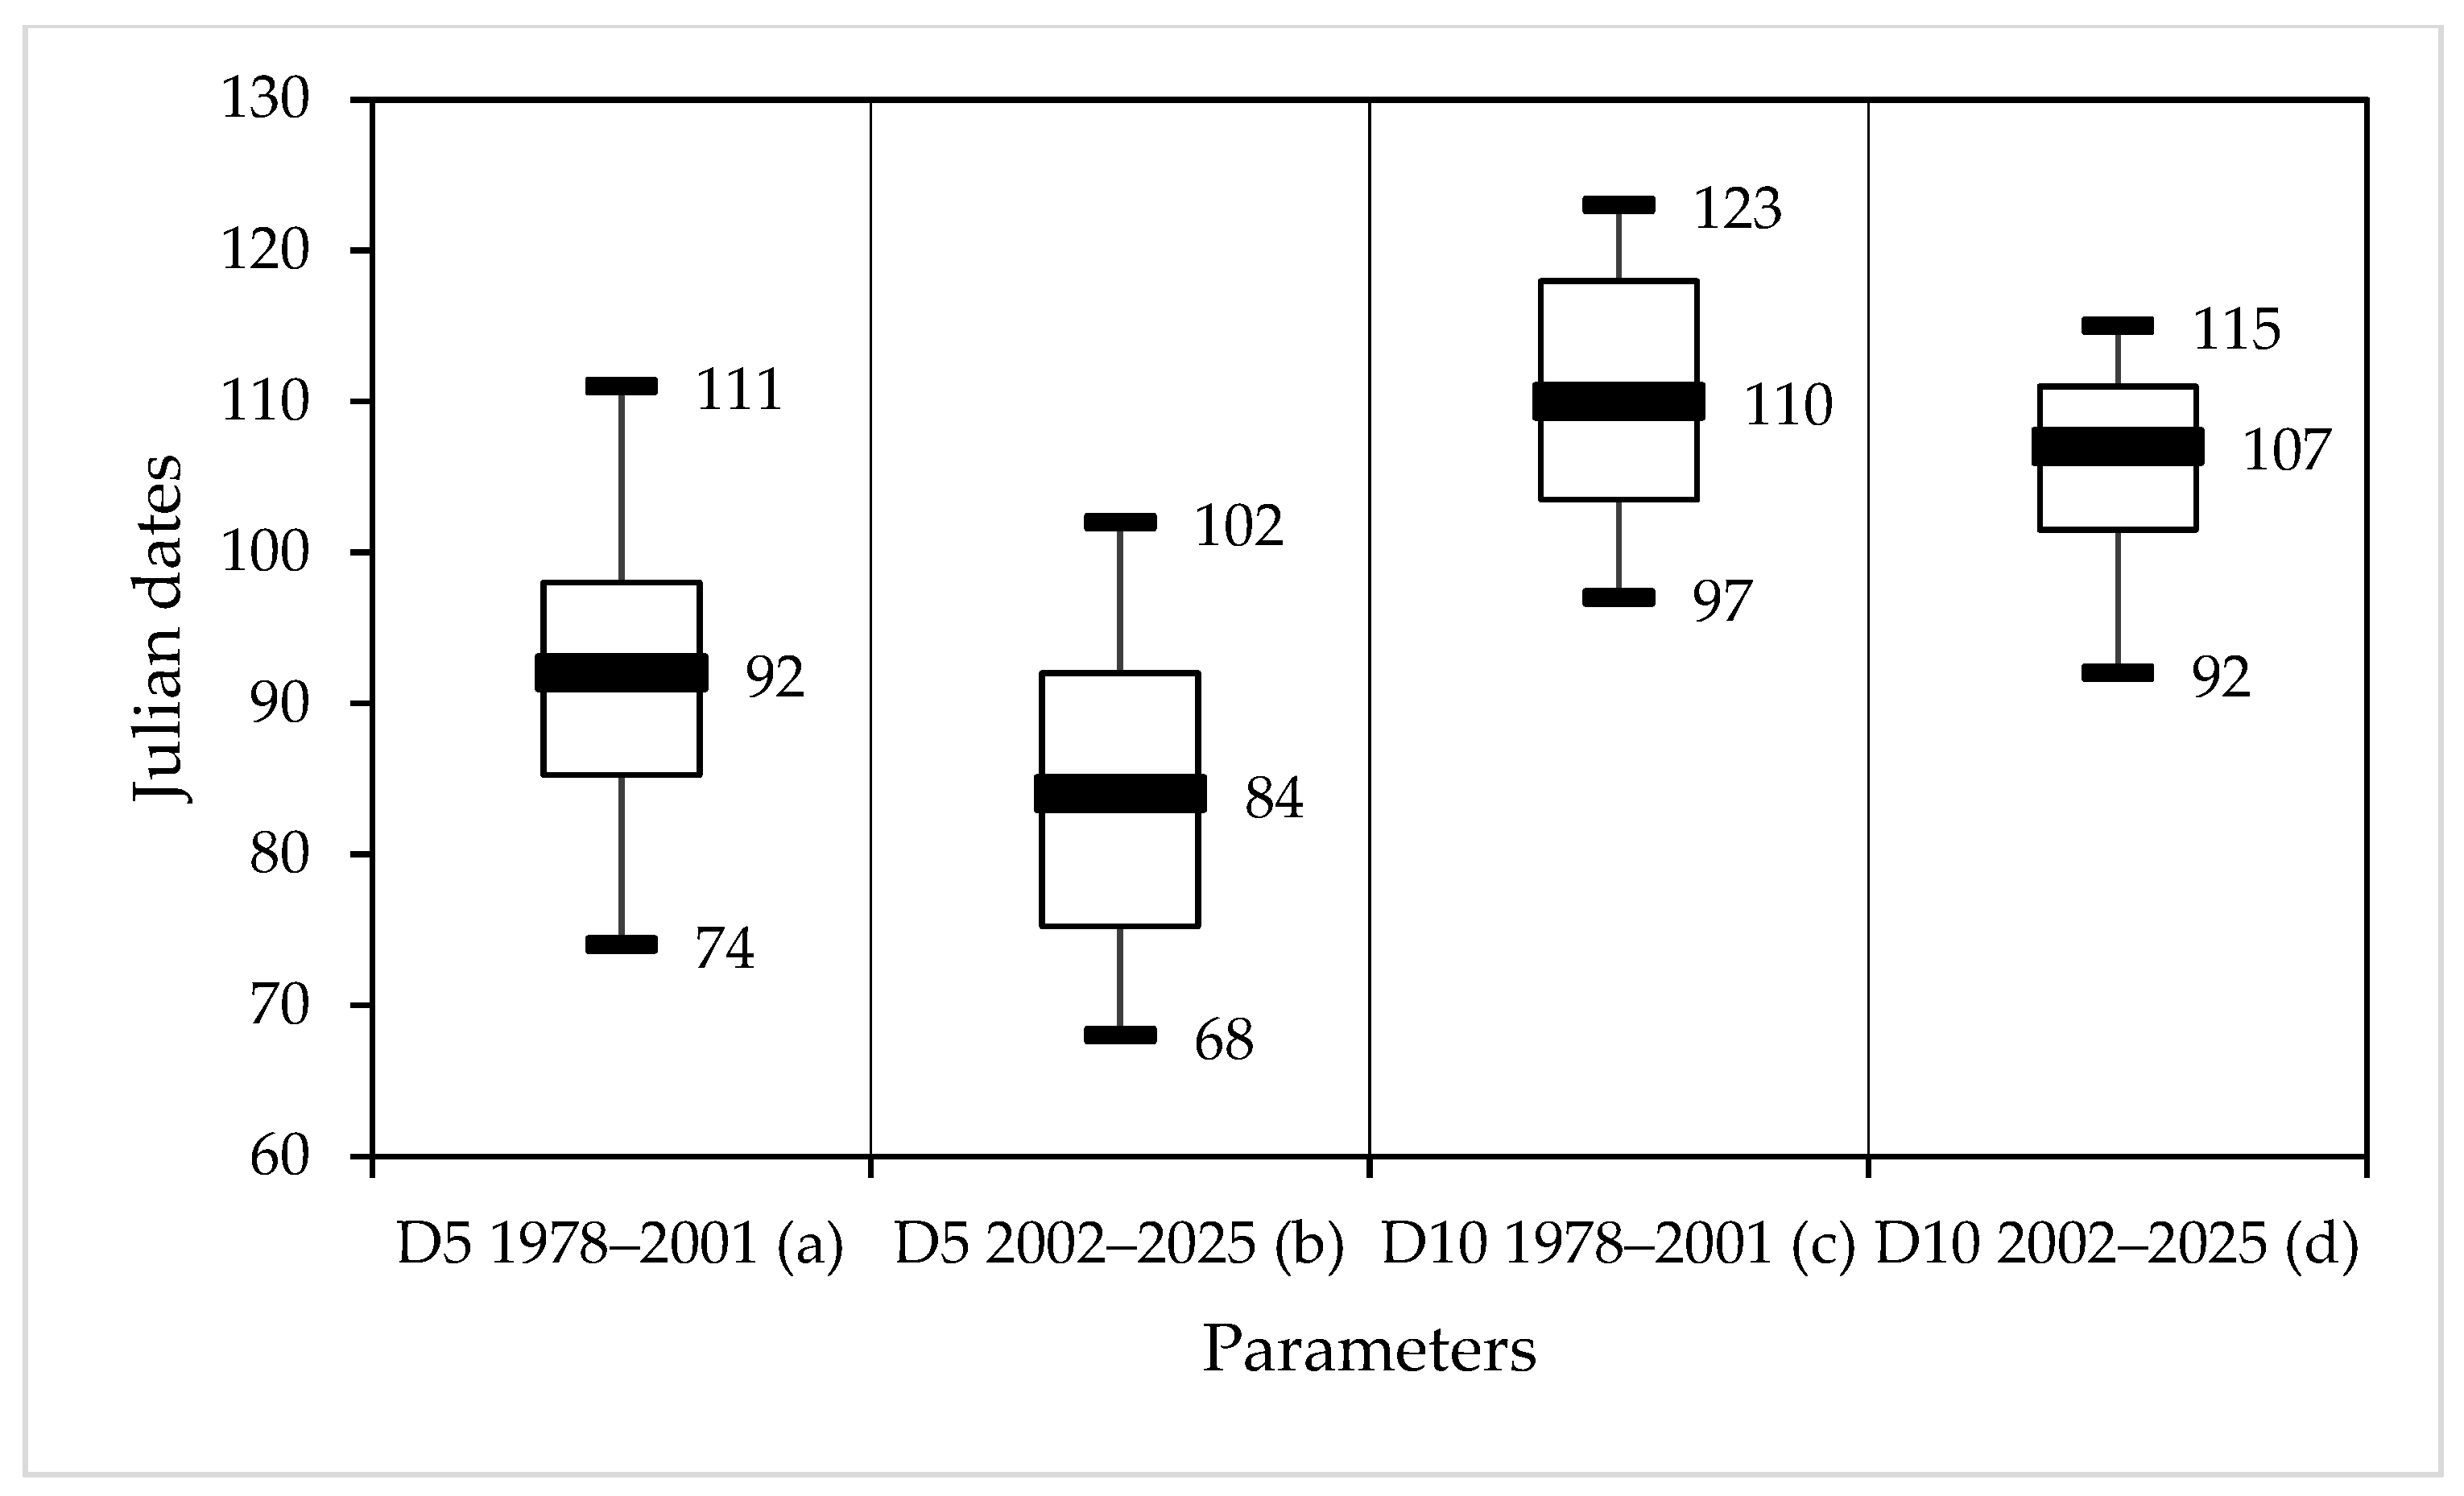
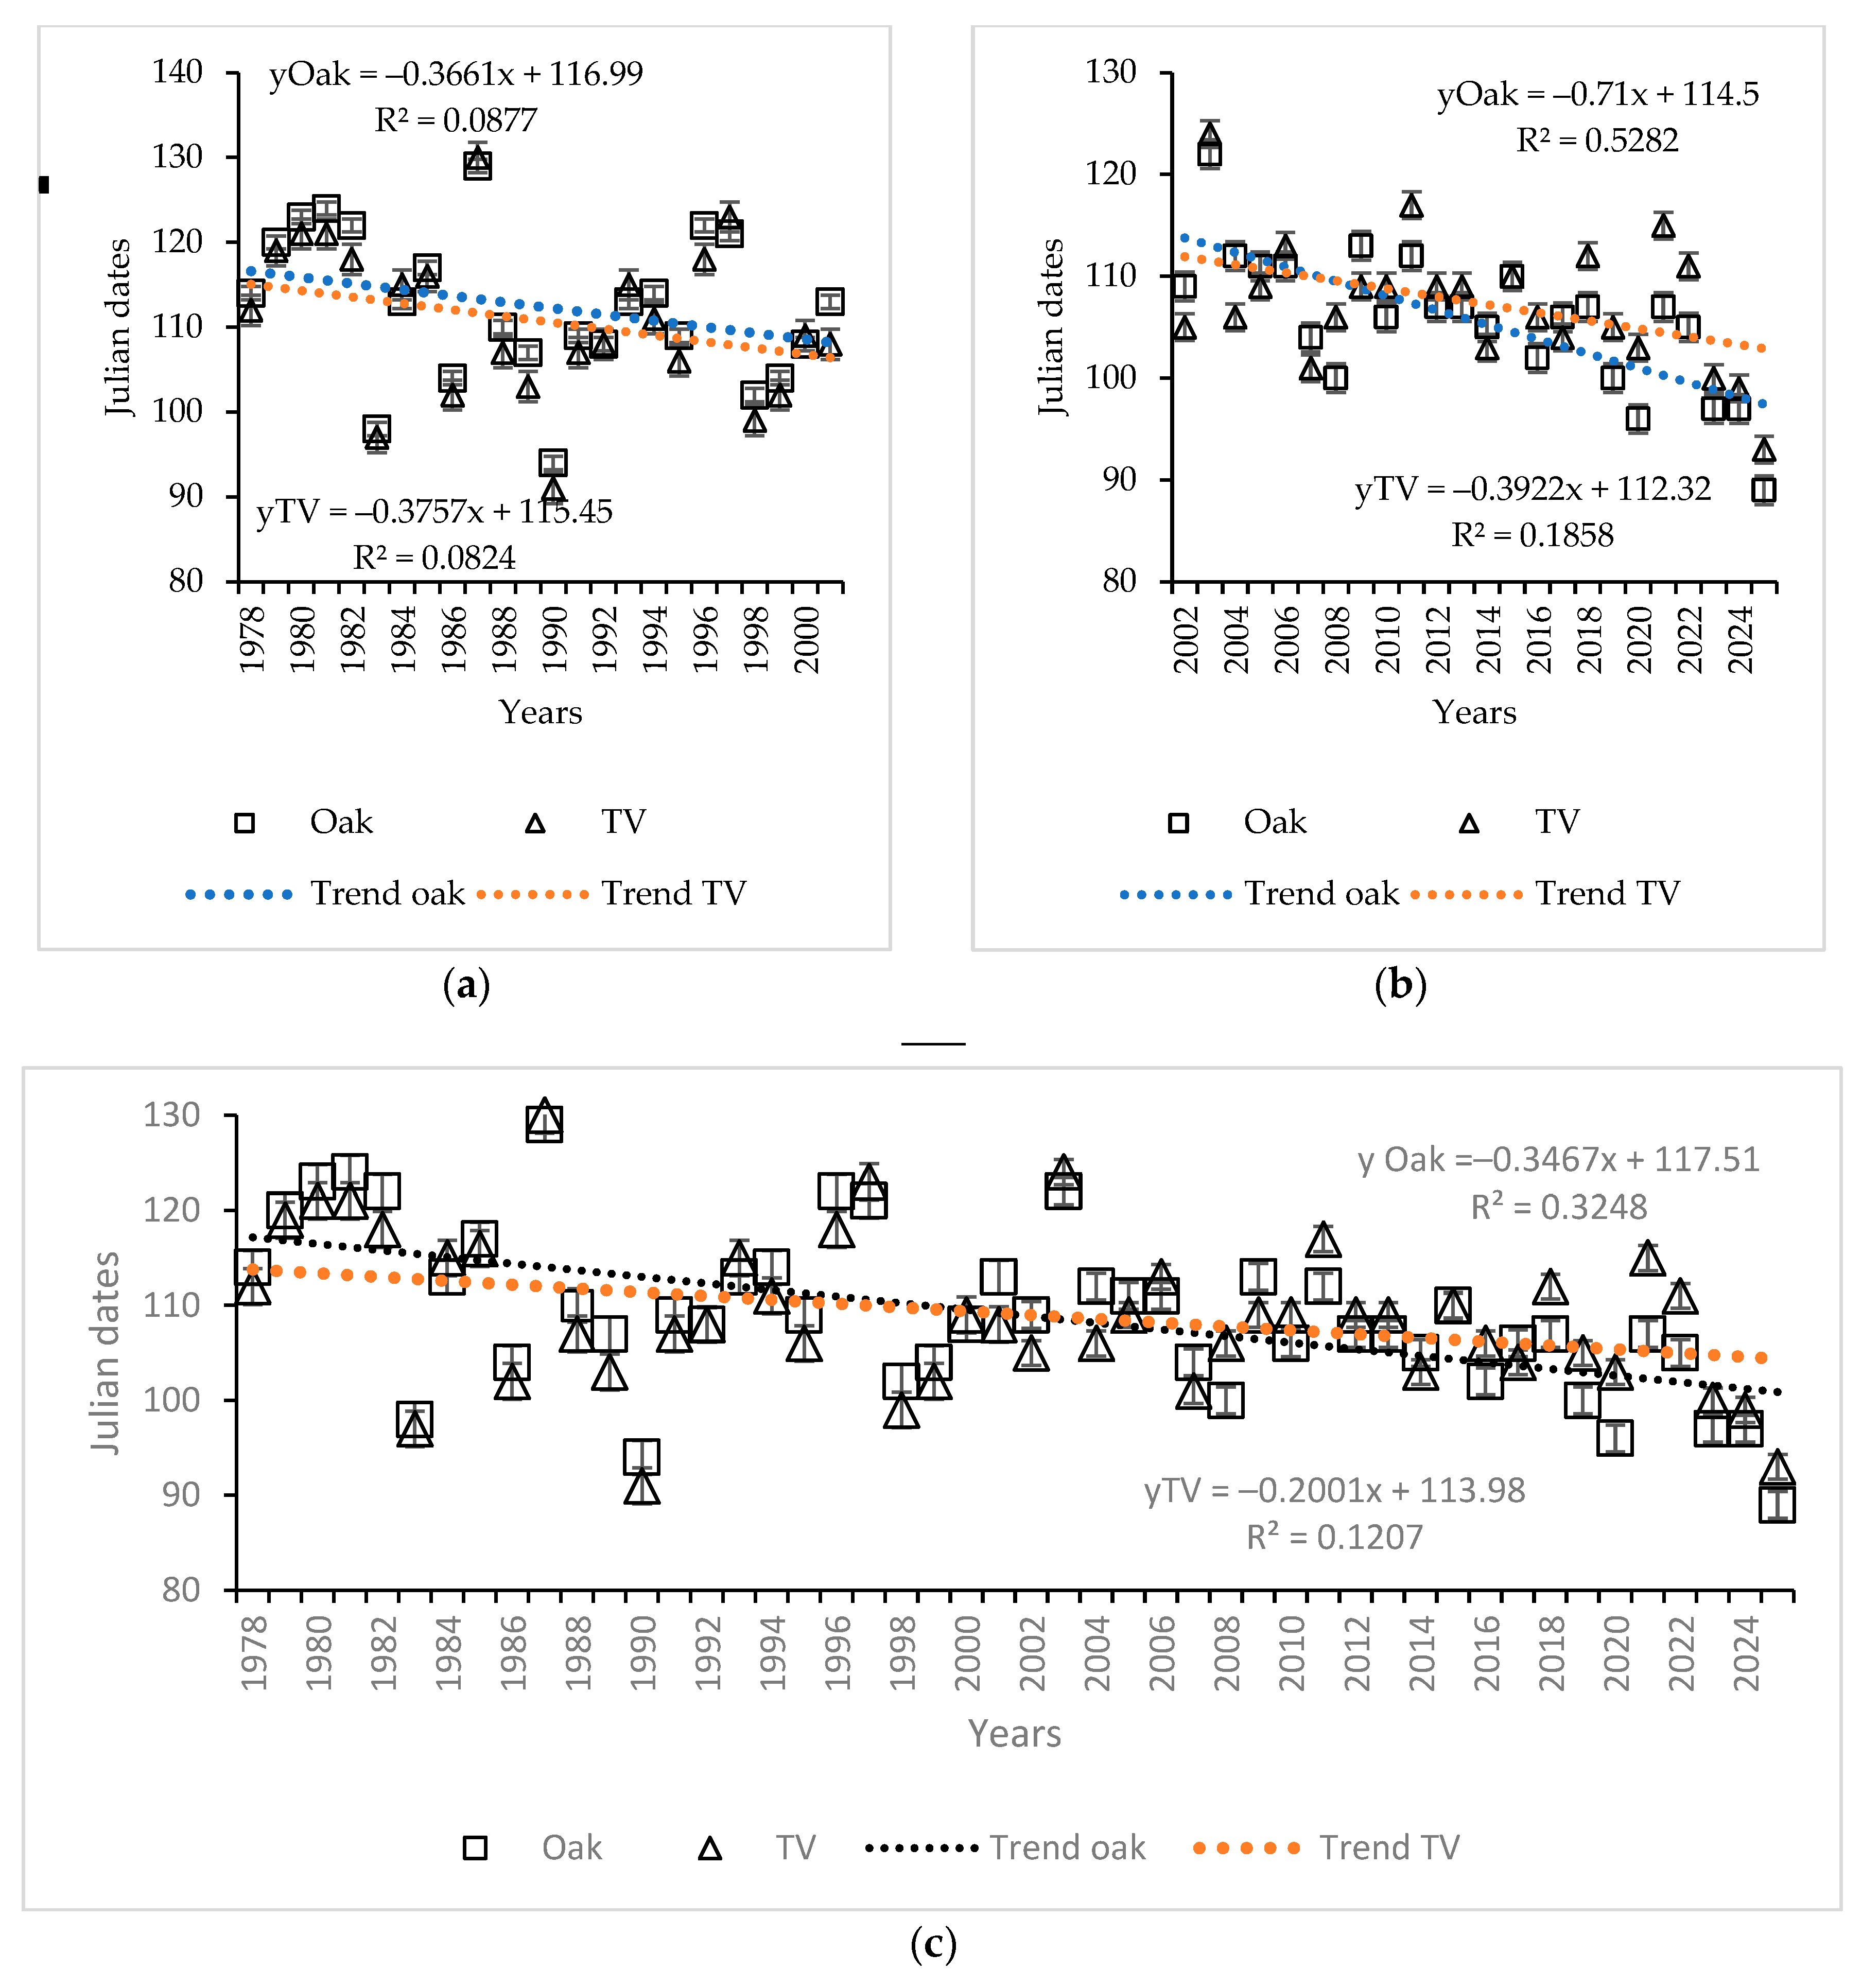
3.5. Phenological Mismatch in Oak Bud-Flushing and T. viridana Hatch Dates

An earlier start of the growing season is one of the manifestations of global warming. The earliest temperature transition over 5 °C in Kharkiv in 2002–2025 shifted compared to 1978–2001 from March 15 to March 9, the latest—from April 21 to April 12, the median—from April 2 to March 25 (Coefficient of variation 9.9 and 10.7%, respectively) (Figure 13).
The earliest temperature transition over 10 °C in the second period shifted from April 7 to April 2, the latest—from May 3 to April 25, the median—from April 20 to April 17 (Coefficient of variation 7.1 and 6.0%, respectively). An earlier stable transition of air temperature over 5 °C (D5) and 10 °C (D10) in Kharkiv in 2002–2025, compared to 1978–2001, was confirmed by the Kruskal–Wallis test (H (chi2) = 7.54; p = 0.006 and H (chi2) = 3.8; p = 0.049, for D5 and D10, respectively).
Shifts in the dates and rates of air temperature increase affected the timing of hatching of T. viridana eggs, which overwinter in tree crowns (Figure 14 and Figure 15). Earlier stable transition of air temperature over 5 °C contributed to earlier soil thawing, the onset of oak sap flow, and the dates and rates of bud-flushing in Q. robur.
In 1978–2001, oak bud-flushing occurred from April 4 to May 9, with the median date being April 23 (Coefficient of variation 7.8) (see Figure 14). For 2002–2025, oak bud-flushing occurred from March 30 to May 2, with the median date being April 17 (Coefficient of variation 6.5).
For 1978–2001, TV egg hatching occurred from April 1 to May 10, with the median date being April 20 (Coefficient of variation 8.4) (see Figure 14). For 2002–2025, TV egg hatching occurred from April 3 to May 4, with the median date being April 18 (Coefficient of variation 6.0).
An earlier bud-flushing in Kharkiv in 2002–2025, compared to 1978–2001, was confirmed by the Kruskal–Wallis test (H (chi2) = 8.0; p = 0.005). However, the shifts in TV egg hatching dates for these periods were not confirmed (H(chi2) = 1.8; p = 0.17).
In the first analyzed period (1978–2001), the difference between egg hatching and bud-flushing ranged from −2 to +5 days, with dates of TV egg hatching more often preceding bud-flushing in oak (Table S1, trends in Figure 15a). This means that neonates had the opportunity to feed on the youngest leaves.
In the second period (2002–2025), the difference between egg hatching and bud-flushing ranged from −8 to +6 days, with dates of bud-flushing in oak more often preceding TV egg hatching (Table S1, trends in Figure 15b). If we consider the two periods together (Figure 15c), we can notice a tendency for a faster decrease in the date of the bud flushing than the egg hatching, and close dates of these events in the early 2000s.

4. Discussion

Climate change, with increasing temperature, decreasing precipitation, increasing frequency in natural disturbances [53], and increased anthropogenic stress in recent decades, has contributed to the weakening of trees, increasing their susceptibility to pathogens and infestation by xylophagous insects [54,55]. Climate change affects voltinism, survival, and population dynamics of forest insect pests [56], leading to range shifting or extending and modifications in outbreak severity and frequency [57,58]. Climate change impacts on forest insect pests vary between years and regions [59], depending on the ecological group of insects and their life cycle [9]. Studies show the increase of hidden-living insects, as well as with the sucking oral apparatus, species with smaller individuals, reduced participation of eruptive species and changes in the structure of entomological complexes due to alien invasive species [60,61].
Climate-induced disruptions in the timing of the host plant and phytophagous insect development can alter the synchrony between plant and insect phenology, thereby altering the vulnerability of host plants [62,63]. It can also affect the enemy-herbivore dynamic by disrupting the ability of parasitoids to affect their pest host species [64].
This increases the risk of tree mortality [65,66], changes in forest productivity, and has tragic consequences for forest ecosystems and the forest sector [42].
Analysis of the history and geography of oak defoliators in the forests of Ukraine showed that in the second half of the last century, the largest outbreaks were caused by Tortrix viridana (83.3 thousand hectares on average per year), Lymantria dispar (14.3), Euproctis chrysorrhoea (17.5), and geometrid moths (Operophthera brumata, Erannis defoliaria)—17 thousand hectares on average per year [8]. The outbreak incidence and severity were higher in the areas with lower precipitation, higher temperature, and continentality (the difference between the average monthly temperatures of July and January) [8].
Among the oak defoliators, TV outbreaks were the longest at the end of the last century (on average 4.9 ± 0.2 years). This was explained by the fact that the larvae developed for less than 30 days and were less vulnerable to the action of regulatory factors (particularly parasitoids [66]). The mean duration of TV outbreaks was seven years in eastern and southern regions of Ukraine, and three years in the western areas with the most suitable ecological conditions for forests [9].
This study analyzes the dynamics of T. viridana outbreaks in the forests of Ukraine for 1947–2025.
We compared the incidence, severity, duration, and mean interval between outbreaks in individual regions for 1978–2001 and 2002–2025 (Figure 4, Figure 5, Figure 6 and Figure 7). The analysis showed that T. viridana outbreaks in Ukraine developed in the second half of the last century according to the classical cyclic type and repeated on average every ten years. Since the 1990s, a gradual decrease in area, frequency, and duration of TV outbreaks has occurred in all regions of Ukraine. At the same time, higher outbreak severity, incidence, and duration remained in the eastern and southern areas of the country, and the lowest in the western ones (Figure 4, Figure 5 and Figure 6).
We hypothesized that the observed changes in the main parameters of T. viridana outbreaks could be explained by the shifts of their share in the flush feeders’ complex, in the suitability of forest subcompartments for this insect, and by phenological mismatch in oak bud-flushing and T. viridana hatch dates.
An increase in the annual foci area in 1967–1986 could be associated with the use of insecticides by aviation over large areas at that time. Even in the case of the death of more than 90% of individuals, the most sustainable specimens survived, which had a sufficient amount of food and a minimum of natural enemies, as well as having high fertility, which led to the restoration of the population in the following year [8]. Facts of the prolongation of outbreaks after insecticide treatment are also known in other regions (for example, [7,67].
A sharp decrease in TV foci area since the late 1980s (see Figure 3) can be partly explained by replacing the aerial insecticide treatment with a ground one using aerosol generators with controlled dispersion [8]. Particular foci were not treated simultaneously, and individual populations responded differently, which affected the total foci area.
This was due to some foci collapsing without insecticides due to the impact of natural enemies, a change in the dominant species in the phytophag’ complex, and other reasons, presented in the next subsections.
Since the 1990s, insecticides have not been used at all in the deciduous forests of Ukraine. This could contribute to the preservation of entomophages and the regulation of phytophage populations [6]. Among the reasons for TV population decrease, we did not consider the shift in the role of entomophages because of the lack of corresponding surveys in recent years. In 1978–1984, parasitoids of TV were studied in the Kharkiv region [68]. A total of 64 parasitoid species were identified, including 38 primary ones. No oophagous parasitoids were found. Females of Ascogaster rufidens (Wesmael 1835) and Ascogaster quadridentata (Wesmael, 1835) (Hymenoptera: Braconidae: Cheloninae) laid eggs in the host eggs, and larvae developed in caterpillars. Larval parasitoids Macrocentrus linearis (Nees, 1812), Oncophanes minutus (Wesmael, 1838), and the specialized pupal parasitoid Dirophanes invisor (Thunberg, 1822) were the most numerous. However, the infestation of TV larvae rarely exceeded 40%. It was concluded that the complex of parasitoids cannot be the main factor limiting TV population growth, due to the absence of oophagous, dominance of polyphagous, multivoltine species, and many secondary and primary-secondary entomophages [68]. However, at high numbers of phytophagous insects, their infestation with parasitoids increases, but after the outbreak collapses, parasitoids survive due to polyphagy [69,70].
We have analyzed our field research of various years on species composition of the early spring complex (flush feeders) in oak stands in the Kharkiv region (Figure 9, Figure 10 and Figure 11) and the timing of phenological events and meteorological data grouped by two periods (1978–2001 and 2002–2025). Analysis shows a gradual decrease of T. viridana in the flush feeder complex since the 1980s, since the advantages were enjoyed by species capable of feeding on other tree and shrub species [9] after severe defoliation of oak in the previous few years. The maximum proportion of TV in the flush feeder complex in 2012 was 8% (Figure 11).
The suitability of forest subcompartments is an important factor influencing the spread of outbreaks [9,71,72]. Site preferences for main forest defoliators have been evaluated by points considering forest site conditions, tree species composition, stand age, relative stocking density, etc. Such an approach helped assess the outbreak risk in each sub-compartment in the forest arrangement database, to make up the lists of subcompartments with the highest risk of outbreaks, and to calculate their potential area [9].
In this study, based on forest management data from 1996 and 2017 of four Forestry Enterprises in the Kharkiv region, the areas of suitable stands for T. viridana were compared by individual forest features and for the presence of all features affecting the outbreak risk. Differences were found in individual forestry enterprises in the suitable area for TV and its change (Table 3). The area of subcompartments with the highest scores for TV by all indicators decreased the most over the compared period in Vovchansk FE and Kharkiv RS (by 84.9 and 76.3%, respectively) (see Table 3), where the most intense outbreaks of TV occurred in the 70s and 80s [8].
The greatest contribution to the change in the suitability of forests for T. viridana (55 %) was caused by the change in the age of stands. Oak proportion in the stand composition and relative stocking density comprise 24% and 19%, respectively (Figure 12). The risk can be clarified by considering the change in the land category of neighboring stands, for example, after clear-cutting, fire, etc. [72].
The importance of synchronous bud-flushing and hatching has been widely described for more than 50 years [22]. An earlier start of the growing season is one of the manifestations of global warming and has a greater impact on the population dynamics of flush feeders [73,74,75].
Our previous research has shown that the success of phytophagous insects’ survival and development is provided only at synchronization of their feeding period and suitable foliage, and parasitoids’ activity is synchronized with the susceptible prey stage [9].
The timing of T. viridana hatching (hibernating as an egg) depends mainly on the air temperature above a certain threshold. At the same time, in a continental climate, bud-flushing of the host tree depends on the beginning of water suction by roots, which starts only after soil thawing in the zone of the main mass of root distribution [76]. The timing of bud-flushing considerably depends on the dates of soil thawing in regions and sites, relief, soil type, and humidity before freezing [77,78].
At a minimal interval between bud-flushing and insect hatching, larvae feeding on the young foliage with high protein and water contents occurs [22,25]. In such a case, the shoots are damaged inside the buds, which weakens the tree. It was shown that such a situation may occur in such locations and years when bud-flushing is delayed due to slow soil thawing and the later beginning of water suction by roots [9].
It was suggested that this phenomenon is an important reason for the greater prevalence and frequency of outbreaks of defoliating insects in the east of Ukraine compared to the west. Calculations of the parameters of TV outbreaks of the last period (Figure 3, Figure 4, Figure 5 and Figure 6) and comparison with shifts in meteorological data [45] confirm this assumption.
Earlier stable transition of air temperature over 5° in 2002–2025 shifted compared to 1978–2001 (Figure 13) contributed to earlier soil thawing, the onset of oak sap flow, and the dates and rates of bud-flushing in Q. robur (Figure 14). Hatching of T. viridana from 1978 to 2001 more often preceded bud-flushing in oak (Table S1, trends in Figure 15a); therefore, the youngest larvae fed on the youngest leaves. In the next years (2002–2025), bud-flushing in oak more often preceded TV egg hatching (Table S1, trends in Figure 15b). Therefore, neonate T. viridana were forced to feed on older leaves containing fewer nitrogen compounds and more protective substances, which is less favorable for survival and propagation [22,25].
The change in the ratio of the timing of egg hatching of phytophages and the presence of entomophages due to climate fluctuations is also considered in publications [36,79,80,81,82,83,84,85]. The success of entmophages is ensured by synchronizing the period of their activity with the presence of a susceptible stage of the host. Thus, it has been shown that the feeding on young needles is the most favorable for Panolis flammea (Denis & Schiffermüller, 1775), and laying eggs in younger host larvae promotes the successful development for its parasitoid Panzeria rudis (Fallén, 1810) [8]
Chapligina [80] studied the dynamics of spring detection, reproductive period, and diet structure of 36 species of dendrophilic Passeriformes (including Parus major) in 1982–1991 and 1991–2017 in the area of our research in the Kharkiv region. The first detection of 26 species of dendrophilic Passeriformes occurred earlier by 2–14 days in the second period. P. major feeds fledglings with caterpillars of available phytophages, including Lepidoptera (Tortricidae, Geometridae, etc.). However, the fledglings appeared in the third decade in May, when T. viridana larvae were in the late instars.
An analysis of publications shows that tits do not exhibit high selectivity to the species composition of food. When the abundance of one phytophage species is high, its individuals predominate in the diet of insectivorous birds. When the number is low or one species is absent, the birds change their food preferences [36].
For 1976–2019, in France, the egg laying date of blue tits (Cyanistes caeruleus, Passeriformes: Paridae) significantly advanced by about 14 days [81]. A notable mismatch has been seen between the great tit (Parus major), which feeds its offspring on winter moth (Operophtera brumata) and oak leaf roller (Tortrix viridana) caterpillars in the Netherlands [83]. Peak caterpillar biomass of these two species has advanced earlier in the season, so this bird species may need to breed earlier to align with peak caterpillar abundance or find other available foods. A long-term study of Parus major population in the Netherlands (1973 to 2020) and considering predicted climate change shows that prey phenology will advance faster than great tit phenology in the coming decades, and therefore that long-term global warming will intensify phenological mismatches [84]. Marsh Tits Poecile palustris in Białowieża National Park (Poland) commenced egg laying earlier in warmer springs [85]. Egg laying commenced and breeding finished ahead of most other local bird species. Marsh Tits reproduced successfully even in years of very low caterpillar abundance. However, caterpillar abundance became important only in colder springs, when higher brood reduction rates and delayed fledging were observed. Using a 45-year data set, it was shown that vegetation phenology at very local scales is the most important predictor of the timing of breeding within years, suggesting that birds can fine-tune their phenology to that of other trophic levels [82]. In our opinion, it is easier for birds to adapt to other types of food in the absence of TV caterpillars than for monophagous caterpillars to adapt to another host tree. Studies of trends in weather indicators [45] show that climate continentality remains higher in the eastern part of Ukraine. Therefore, in some years, a ratio of air and soil temperature growth may be favorable for flush-feeding insects.
Given the predicted climate changes unfavorable for oak health [42,54,55], one can assume an increase in the role of other seasonal guilds of phytophages in its weakening (for example, miners [11,86]) or sucking insects (oak lace bug Corythucha arcuata (Say, 1832) (Hemiptera: Tingidae) [87]) as an inciting factor of oak decline. Such risks should be considered when developing a forest management strategy to mitigate the negative consequences for oak forests.

5. Conclusions

The outbreaks of T. viridana in the forests of Ukraine are cyclic. In 1947–1985, a tendency toward an increase in the area of outbreaks and a reduction in the intervals between them was found. In subsequent years, a tendency toward a decrease in incidence, severity, duration, and an increase in the mean interval between outbreaks was found in all regions of Ukraine. The incidence, severity, and duration of T. viridana outbreaks for 1978–2001 and 2002–2025 were highest in the east and south of Ukraine.
The observed changes in the main parameters of T. viridana outbreaks are associated with its monophagy. Analysis of field data obtained in the Kharkiv region (1979–1989 and 2001–2018) showed a decrease in the proportion of T. viridana in the flush feeders’ complex in the 1980s due to an increase in the proportion of other Tortricidae, and since 2009, due to Geometridae.
The shift in the area of T. viridana outbreaks was also facilitated by a decrease in the suitable subcompartments, estimated by forest management databases for 1996 and 2017 in four Forestry Enterprises of the Kharkiv region. This occurred mainly due to a change in the age composition of forests (a decrease in the proportion of mature and an increase in young ones), a decrease in the proportion of pure oak stands (oak participation > 90%), and stands with low relative stocking density (<65%).
The third reason, which to some extent affected the first two, was climate change, as a result of which the development of oak bud-flushing and T. viridana hatch shifted to earlier dates. According to observations in the Kharkiv region in 1978–2001, egg-hatching often preceded oak bud-flushing, and the caterpillars began to feed on the youngest foliage. After 2006, the tendency of earlier bud-flushing resulted in newborn caterpillars feeding on older foliage, which is less favorable for their survival and reproduction.

Supplementary Materials

The following supporting information can be downloaded at https://www.mdpi.com/article/10.3390/f16061005/s1, Table S1: Tortrix viridana in Ukraine.

Author Contributions

Conceptualization, V.M.; methodology, V.M.; software, O.B. and V.K.; validation, O.B. and V.K.; formal analysis, V.M.; investigation, V.M., S.S. and Y.K.; data curation, O.B.; writing—original draft preparation, V.M.; writing—review and editing, V.M.; visualization, O.B. and V.K.; supervision, V.M. All authors have read and agreed to the published version of the manuscript.

Funding

The paper was prepared by the authors in the framework of a research plan of URIFFM (grants 0120U101891), which was supported by the State Forest Resources Agency of Ukraine.

Data Availability Statement

Data are available upon email request to the corresponding author.

Conflicts of Interest

The authors declare no conflicts of interest.

References

  1. Gasov, H. Der grűne Eichenwickler (Tortrix viridana) als Forstschädling. Arb. Biol. Reichsamsalt 1925, 12, 355–508. [Google Scholar]
  2. Fankhänel, H. Über die Massenvermehrung des Grünen Eichenwicklers (Tortrix viridana L.) in der DDR in den Jahren 1957–1959 und über Maßnahmen zur Überwachung des Schädlings. Anz. Schädlingskunde 1962, 35, 158. [Google Scholar] [CrossRef]
  3. Schwenke, W. Die Forstschädlinge Europe; Bd.3; Paul Parey: Hamburg, Germany; Berlin, Germany, 1978; pp. 76–85. [Google Scholar]
  4. Du Merle, P.; Mazet, R. Dynamique intracyclique d’une population méditerranéenne de tordeuse verte du chêne, Tortrix viridana (Lepidoptera: Tortricidae). Ecol. Mediterr. 1990, 16, 73–91. [Google Scholar] [CrossRef]
  5. Bogenschütz, H. Eurasian species in forestry. In World Crop Pests. 5: Tortricid Pests; van der Geest, L.P.S., Evenhuis, H.H., Eds.; Elsevier: Amsterdam, The Netherlands, 1991; pp. 673–709. [Google Scholar]
  6. Berryman, A.A. Forest Insects: Principles and Practice of Population Management; Springer Science & Business Media: Berlin/Heidelberg, Germany, 2012. [Google Scholar]
  7. Beletsky, E.N. Mass Propagation of Insects. History, Theory, Forecasting: Monograph; Maidan: Kharkov, Ukraine, 2011; 172p. (In Russian) [Google Scholar]
  8. Meshkova, V. History and Geography of Foliage Browsing Insect Pests Outbreaks; Maidan: Majdan, Serbia, 2002; 244p. (In Ukrainian) [Google Scholar]
  9. Meshkova, V. Seasonal Development of Foliage Browsing Insects; Planeta-Print: Kharkov, Ukraine, 2009; 382p. (In Russian) [Google Scholar]
  10. Rubtsov, V.V.; Rubtsova, N.N. Analysis of the Interaction of Leaf-Eating Insects with Oak; Nauka: Moscow, Russia, 1984; 183p. (In Russian) [Google Scholar]
  11. Turčáni, M.; Patočka, J.; Kulfan, M. How do lepidopteran seasonal guilds differ on some oaks (Quercus spp.)–A case study. J. For. Sci. 2009, 55, 578–590. [Google Scholar] [CrossRef]
  12. Turčáni, M.; Patočka, J.; Kulfan, M. Which factors explain lepidopteran larvae variance in seasonal guilds on some oaks? J. For. Sci. 2010, 56, 68–76. [Google Scholar] [CrossRef]
  13. Seifi, S.; Madadi, H.; Ghobari, H.; Bavaghar, M.P. Studying the effective factors of spatial distribution of Tortrix viridana L. in Mariwan oak forests. Iran. J. For. Range Prot. Res. 2023, 21, 337–349. [Google Scholar]
  14. Gholami, H.; Ghobari, H.; Badakhshan, H.; Rafie, J.N.; Salehi, H.; Namayandeh, A. Patterns of genetic variation among host-plant associated populations of the green oak leaf roller moth, Tortrix viridana (Lepidoptera: Tortricidae) in oak forests of northwestern Iran. J. Entomol. Soc. Iran 2022, 42, 67–80. [Google Scholar]
  15. Bertić, M.; Orgel, F.; Gschwendtner, S.; Schloter, M.; Moritz, F.; Schmitt-Kopplin, P.; Zimmer, I.; Fladung, M.; Schnitzler, J.P.; Schroeder, H.; et al. European oak metabolites shape digestion and fitness of the herbivore Tortrix viridana. Funct. Ecol. 2023, 37, 1476–1491. [Google Scholar] [CrossRef]
  16. Bertić, M.; Schroeder, H.; Kersten, B.; Fladung, M.; Orgel, F.; Buegger, F.; Schnitzler, J.P.; Ghirardo, A. European oak chemical diversity–from ecotypes to herbivore resistance. New Phytol. 2021, 232, 818–834. [Google Scholar] [CrossRef]
  17. Yousefi, S.; Haghighian, F.; Jahromi, M.N.; Pourghasemi, H.R. Pest-infected oak trees identify using remote sensing-based classification algorithms. In Computers in Earth and Environmental Sciences; Elsevier: Amsterdam, The Netherlands, 2022; pp. 363–376. [Google Scholar]
  18. Du Merle, P. Phenological resistance of oaks to the green oak leafroller Tortrix viridana (Lepidoptera: Tortricidae). In Mechanism of Woody Plant Defenses Against Insects; Mattson, W.J., Levieux, J., Bernard-Dagan, C., Eds.; Springer: New York, NY, USA, 1988; pp. 215–226. [Google Scholar]
  19. Du Merle, P.; Mazet, R. Phenological stages and infestation by Tortrix viridana L. (Lep., Tortricidae) of the buds of two oaks (Quercus pubescens and Q. ilex). Acta Oecol. (Oecol. Appl.) 1983, 4, 47–53. [Google Scholar]
  20. Hunter, M.D. Differential susceptibility to variable plant phenology and its role in competition between two insect herbivores on oak. Ecol. Entomol. 1990, 15, 401–408. [Google Scholar] [CrossRef]
  21. Feeny, P.P. Plant apparency and chemical defence. In Recent Advances in Phytochemistry. Biochemical Interactions Between Plants and Insects; Wallace, J.W., Mansell, R.L., Eds.; Plenum Press: New York, NY, USA, 1978; Volume 10, pp. 1–40. [Google Scholar]
  22. Feeny, P.P. Seasonal changes in oak leaf tannins and nutrients as a cause of spring feeding by winter moth caterpillars. Ecology 1970, 51, 565–581. [Google Scholar] [CrossRef]
  23. Visser, M.E.; Holleman, L.J.M. Warmer springs disrupt the synchrony of oak and winter moth phenology. Proc. Biol. Sci. 2001, 268, 89–94. [Google Scholar] [CrossRef] [PubMed]
  24. van Asch, M.; Van Tienderen, P.H.; Holleman, L.J.M.; Visser, M. Predicting adaptation of phenology in response to climate change, an insect herbivore example. Glob. Change Biol. 2007, 13, 1596–1604. [Google Scholar] [CrossRef]
  25. van Asch, M.; Visser, M.E. Phenology of forest caterpillars and their host trees: The importance of synchrony. Annu. Rev. Entomol. 2007, 52, 37–55. [Google Scholar] [CrossRef]
  26. van Dis, N.E.; Sieperda, G.-J.; Bansal, V.; van Lith, B.; Wertheim, B.; Visser, M.E. Phenological mismatch affects individual fitness and population growth in the winter moth. Proc. R. Soc. B 2023, 290, 414. [Google Scholar] [CrossRef]
  27. Weir, J.C. Trophic generalism in the winter moth: A model species for phenological mismatch. Oecologia 2024, 206, 225–239. [Google Scholar] [CrossRef]
  28. Weir, J.C.; Phillimore, A.B. Buffering and phenological mismatch: A change of perspective. Glob. Change Biol. 2024, 30, e17294. [Google Scholar] [CrossRef]
  29. Patocka, J.; Kristin, A.; Kulfan, J.; Zach, P. Die Eichenschadlinge und ihre Feinde. Zvolen, Institute fur Waldokologie der Slowakishen Akademie der Wissenschaften. 1999. 396p. ISBN 8096723839. Available online: https://agris.fao.org/search/en/providers/122436/records/675ac75a0ce2cede71d146f2 (accessed on 9 June 2025).
  30. Ivashov, A.V.; Boyko, G.E.; Simchuk, A.P. The role of host plant phenology in the development of the oak leafroller moth, Tortrix viridana L. (Lepidoptera: Tortricidae). For. Ecol. Manag. 2002, 157, 7–14. [Google Scholar] [CrossRef]
  31. Tkach, V.P.; Tarnopilska, O.M.; Orlov, O.O. Types of Forest Formations of Ukraine in the System of European Classifications; Madryd: Kharkiv, Ukraine, 2024; 415p, ISBN 978-617-8254-23-0. [Google Scholar] [CrossRef]
  32. Wesołowski, T.; Rowiński, P. Late leaf development in pedunculate oak (Quercus robur): An antiherbivore defence? Scand. J. For. Res. 2008, 23, 386–394. [Google Scholar] [CrossRef]
  33. Wesołowski, T.; Rowiński, P. Timing of bud burst and tree-leaf development in a multispecies temperate forest. For. Ecol. Manag. 2006, 237, 387–393. [Google Scholar] [CrossRef]
  34. Boulanger, Y.; Desaint, A.; Martel, V.; Marchand, M.; Massoda Tonye, S.; Saint-Amant, R.; Régnière, J. Recent climate change strongly impacted the population dynamic of a North American insect pest species. PLoS Clim. 2025, 4, e0000488. [Google Scholar] [CrossRef]
  35. Belitz, M.W.; Larsen, E.A.; Hurlbert, A.H.; Di Cecco, G.J.; Neupane, N.; Ries, L.; Tingley, M.W.; Guralnick, R.P.; Youngflesh, C. Potential for bird–insect phenological mismatch in a tri-trophic system. J. Anim. Ecol. 2025, 94, 717–728. [Google Scholar] [CrossRef] [PubMed]
  36. Damien, M.; Tougeron, K. Prey-predator phenological mismatch under climate change. Curr. Opin. Insect Sci. 2019, 35, 60–68. [Google Scholar] [CrossRef]
  37. Renner, S.S.; Zohner, C.M. Climate change and phenological mismatch in trophic interactions among plants, insects, and vertebrates. Annu. Rev. Ecol. Evol. Syst. 2018, 49, 165–182. [Google Scholar] [CrossRef]
  38. Moldavan, L.; Pimenowa, O.; Wasilewski, M.; Wasilewska, N. Sustainable Development of Agriculture of Ukraine in the Context of Climate Change. Sustainability 2023, 15, 10517. [Google Scholar] [CrossRef]
  39. Buras, A.; Menzel, A. Projecting Tree Species Composition Changes of European Forests for 2061–2090 Under RCP 4.5 and RCP 8.5 Scenarios. Front. Plant Sci. 2019, 9, 1986. [Google Scholar] [CrossRef] [PubMed]
  40. Dyderski, M.K.; Paź, S.; Frelich, L.E.; Jagodziński, A.M. How much does climate change threaten European forest tree species distributions? Glob. Change Biol. 2018, 24, 1150–1163. [Google Scholar] [CrossRef]
  41. Levkovska, L. Modern Trends in the Development of the Risky Farming Zone in the Context of Climate Change. Effective Economy. Dnipro State Agrarian and Economic University, LLC “DCS Centre”. 2021, Volume 9. Available online: http://www.economy.nayka.com.ua/pdf/9_2021/14.pdf (accessed on 10 May 2025).
  42. Buksha, I.F.; Pyvovar, T.S.; Buksha, M.I.; Pasternak, V.P.; Buksha, T.I. Modelling and forecasting the impact of climate change on forests of Ukraine for 21st century time horizon. For. Ideas 2021, 27, 470–482. [Google Scholar]
  43. Didukh, Y.P. World of Plants of Ukraine in Aspect of the Climate Change; Naukova Dumka: Kyiv, Ukraine, 2023; 176p, ISBN 978-966-00-1868-6. (In Ukrainian) [Google Scholar] [CrossRef]
  44. General Characteristics of Ukrainian Forests. 2016. Available online: https://forest.gov.ua/napryamki-diyalnosti/lisi-ukrayini/zagalna-harakteristika-lisiv-ukrayini (accessed on 2 March 2025). (In Ukrainian)
  45. Didukh, Y.P.; Vynokurov, D.S. Spatial-temporal changes of bioclimate factors in Europe. Hydrol. Hydrochem. Hydroecology 2021, 1, 64–75. [Google Scholar] [CrossRef]
  46. Zepner, L.; Karrasch, P.; Wiemann, F.; Bernard, L. ClimateCharts. Net—An interactive climate analysis web platform. Int. J. Digit. Earth 2021, 14, 338–356. [Google Scholar] [CrossRef]
  47. Rumiantsev, M.; Luk’yanets, V.; Musienko, S.; Mostepanyuk, A.; Obolonyk, I. Main problems in natural seed regeneration of pedunculate oak (Quercus robur L.) stands in Ukraine. For. Stud.|Metsanduslikud Uurim. 2018, 69, 7–23. [Google Scholar] [CrossRef]
  48. Hayda, Y.; Mohytych, V.; Bidolakh, D.; Kuzovych, V.; Sulkowska, M. The introduction of red oak (Quercus rubra L.) in Ukrainian forests: Advantages of productivity versus disadvantages of invasiveness. Folia For. Polonica. Ser. A For. 2022, 64, 245–252. [Google Scholar] [CrossRef]
  49. Ukrainian State Forest Management Planning Association. Available online: https://lisproekt.gov.ua/ (accessed on 2 March 2025).
  50. QGIS 3.40.5. Available online: https://qgis.org/en/site/ (accessed on 2 March 2025).
  51. Hammer, O.; Harper, D.A.T.; Ryan, P.D. PAST: Paleontological statistics software package for education and data analysis. Palaeontol. Electron. 2001, 4, 1–9. [Google Scholar]
  52. Peck, R.; Short, T.; Olsen, C. Introduction to Statistics and Data Analysis; Cengage Learning: Boston, MA, USA, 2020; Available online: http://www.statisticslectures.com/topics/ztestproportions/ (accessed on 2 March 2025).
  53. Boychenko, S.; Kuchma, T.; Karamushka, V.; Maidanovych, N.; Kozak, O. Wildfires and Climate Change in the Ukrainian Polissia During 2001–2023. Sustainability 2025, 17, 2223. [Google Scholar] [CrossRef]
  54. Gosling, R.H.; Jackson, R.W.; Elliot, M.; Nichols, C.P. Oak declines: Reviewing the evidence for causes, management implications and research gaps. Ecol. Solut. Evid. 2024, 5, e12395. [Google Scholar] [CrossRef]
  55. Langer, G.J.; Bußkamp, J.; Burkardt, K.; Hurling, R.; Plašil, P.; Rohde, M. Review on temperate oak decline and oak diseases with a focus on Germany. J. Kult. 2025, 77, 36–49. [Google Scholar]
  56. Liu, M.; Jiang, P.; Chase, J.M.; Liu, X. Global insect herbivory and its response to climate change. Curr. Biol. 2024, 34, 2558–2569. [Google Scholar] [CrossRef]
  57. Logan, J.; Régnière, J.; Powell, J. Assessing the impacts of global warming on forest pest dynamics. Front. Ecol. Environ. 2003, 1, 130–137. [Google Scholar] [CrossRef]
  58. Jepsen, J.; Hagen, S.; Ims, R.; Yoccoz, N. Climate change and outbreaks of the geometrids Operophtera brumata and Epirrita autumnata in subarctic birch forest: Evidence of a recent outbreak range expansion. J. Anim. Ecol. 2008, 77, 257–264. [Google Scholar] [CrossRef]
  59. Robinet, C.; Roques, A. Direct impacts of recent climate warming on insect populations. Int. Zool. 2010, 5, 132–142. [Google Scholar] [CrossRef]
  60. Kardash, Y.S. Changes in the complex of phyllophagous insects in deciduous trees of Kharkiv city for 50 years. Balt. Coast. Zone 2021, 24, 27–39. [Google Scholar]
  61. Meshkova, V. Foliage-browsing Lepidoptera (Insecta) in deciduous forests of Ukraine for the last 70 years. Proc. For. Acad. Sci. Ukr. 2021, 22, 173–179. [Google Scholar] [CrossRef]
  62. Pureswaran, D.; Roques, A.; Battisti, A. Forest Insects and Climate Change. Curr. For. Rep. 2018, 4, 35–50. [Google Scholar] [CrossRef]
  63. Ekholm, A.; Tack, A.; Pulkkinen, P.; Roslin, T. Host plant phenology, insect outbreaks and herbivore communities—The importance of timing. J. Anim. Ecol. 2020, 89, 829–841. [Google Scholar] [CrossRef]
  64. Stireman, J.O., III; Dyer, L.A.; Janzen, D.H.; Singer, M.S.; Lill, J.T.; Marquis, R.J.; Ricklefs, R.E.; Gentry, G.L.; Hallwachs, W.; Coley, P.D.; et al. Climatic unpredictability and parasitism of caterpillars: Implications of global warming. Proc. Natl. Acad. Sci. USA 2005, 102, 17384–17387. [Google Scholar] [CrossRef]
  65. Luo, Y.; Chen, H. Climate change-associated tree mortality increases without decreasing water availability. Ecol. Lett. 2015, 18, 1207–1215. [Google Scholar] [CrossRef]
  66. Liu, Q.; Peng, C.; Schneider, R.; Cyr, D.; McDowell, N.G.; Kneeshaw, D. Drought-induced increase in tree mortality and corresponding decrease in the carbon sink capacity of Canada’s boreal forests from 1970 to 2020. Glob. Change Biol. 2023, 29, 2274–2285. [Google Scholar] [CrossRef] [PubMed]
  67. Liebhold, A.M. Forest pest management in a changing world. Int. J. Pest Manag. 2012, 58, 289–295. [Google Scholar] [CrossRef]
  68. Gamayunova, S.G. Bioecological features of parasitoids of green oak leaf roller. For. For. Melior. 1988, 76, 51–53. [Google Scholar]
  69. Betz, E.; Schwerdtfeger, F. Vergleichende Untersuchungen an der Kronenfauna der Eichen in Latenz-und Gradationsgebieten des Eichenwicklers (Tortrix viridana L.) 2. Die Parasiten der Lepidopteren. Z. Angew. Entomol. 1971, 67, 149–170. [Google Scholar] [CrossRef]
  70. Du Merle, P. Les facteurs de mortalité des oeufs de Tortrix viridana L. (Lep., Tortricidae). II. Parasitisme par un Trichogramma (Hym., Trichogrammatidae) et “maladies”. Agronomie 1983, 3, 359–367. [Google Scholar] [CrossRef]
  71. Andreieva, O.; Martynchuk, I.; Zhytova, O.; Vyshnevskyi, A.; Zymaroieva, A. Features of forecasting of foliage-browsing insects distribution in the forests of Zhytomyr Polissia. Sci. Horiz. 2021, 24, 68–76. [Google Scholar]
  72. Borysenko, O.I.; Meshkova, V.L. Prediction of Fires and Insect Pests Foci Spread in the Pine Stands by Means of GIS; Planeta-Print: Kharkiv, Ukraine, 2021; 148p, ISBN 978-617-7897-67-4. [Google Scholar]
  73. Crimmins, T.M.; Gerst, K.L.; Huerta, D.G.; Marsh, R.L.; Posthumus, E.E.; Rosemartin, A.H.; Switzer, J.; Weltzin, J.F.; Coop, L.; Dietschler, N.; et al. Short-term forecasts of insect phenology inform pest management. Ann. Entomol. Soc. Am. 2020, 113, 139–148. [Google Scholar] [CrossRef]
  74. Jones, B.C.; Despland, E. Effects of synchronization with host plant phenology occur early in the larval development of a spring folivore. Can. J. Zool. 2006, 84, 628–633. [Google Scholar] [CrossRef]
  75. Sarvašová, L.; Zach, P.; Parák, M.; Saniga, M.; Kulfan, J. Infestation of Early- and Late-Flushing Trees by Spring Caterpillars: An Associational Effect of Neighbouring Trees. Forests 2021, 12, 1281. [Google Scholar] [CrossRef]
  76. Malyshev, A.V.; Blume-Werry, G.; Spiller, O.; Smiljanić, M.; Weigel, R.; Kolb, A.; Nze, B.Y.; Märker, F.; Sommer, F.C.F.J.; Kinley, K.; et al. Warming nondormant tree roots advances aboveground spring phenology in temperate trees. New Phytol. 2023, 240, 2276–2287. [Google Scholar] [CrossRef]
  77. Silvestro, R.; Deslauriers, A.; Prislan, P.; Rademacher, T.; Rezaie, N.; Richardson, A.D.; Vitasse, Y.; Rossi, S. From Roots to Leaves: Tree Growth Phenology in Forest Ecosystems. Curr. For. Rep. 2025, 11, 12. [Google Scholar] [CrossRef]
  78. Liu, Y.; Liu, X.; Fu, Z.; Zhang, D.; Liu, L. Soil temperature dominates forest spring phenology in China. Agric. For. Meteorol. 2024, 355, 110141. [Google Scholar] [CrossRef]
  79. Raimondo, S.; Turcáni, M.; Patoèka, J.; Liebhold, A.M. Interspecific synchrony among foliage-feeding forest Lepidoptera species and the potential role of generalist predators as synchronizing agents. Oikos 2004, 107, 462–470. [Google Scholar] [CrossRef]
  80. Chaplygina, A.B. Dendrophilic Passerines (Passeriformes) as a Structural-Functional Element of Anthropogenically Transformed Forest Biogeocoenoses of North-Eastern Ukraine. Doctoral Thesis, Oles Honchar Dnipro National University, Dnipro, Ukraine, 2018. [Google Scholar]
  81. Biquet, J.; Bonamour, S.; De Villemereuil, P.; De Franceschi, C.; Teplitsky, C. Phenotypic plasticity drives phenological changes in a Mediterranean blue tit population. J. Evol. Biol. 2022, 35, 347–359. [Google Scholar] [CrossRef] [PubMed]
  82. Hinks, A.E.; Cole, E.F.; Daniels, K.J.; Wilkin, T.A.; Nakagawa, S.; Sheldon, B.C. Scale-dependent phenological synchrony between songbirds and their caterpillar food source. Am. Nat. 2015, 186, 84–97. [Google Scholar] [CrossRef] [PubMed]
  83. Visser, M.E.; Holleman, L.J.M.; Gienapp, P. Shifts in caterpillar biomass phenology due to climate change and its impact on the breeding biology of an insectivorous bird. Oecologia 2006, 147, 164–172. [Google Scholar] [CrossRef] [PubMed]
  84. Visser, M.E.; Lindner, M.; Gienapp, P.; Long, M.C.; Jenouvrier, S. Recent natural variability in global warming weakened phenological mismatch and selection on seasonal timing in great tits (Parus major). Proc. R. Soc. B 2021, 288, 20211337. [Google Scholar] [CrossRef] [PubMed]
  85. Wesołowski, T. Weather, food and predation shape the timing of Marsh Tit breeding in primaeval conditions: A long-term study. J. Ornithol. 2023, 164, 253–274. [Google Scholar] [CrossRef]
  86. Puzrina, N.; Psenichna, N.; Boiko, H.; Sendonin, S. Dominant pests and pathogens of urban plantings in Kyiv: Species composition and prevalence. Sci. J. Ukr. J. For. Wood Sci. 2023, 14, 64–77. [Google Scholar] [CrossRef]
  87. Paulin, M.; Hirka, A.; Eötvös, C.B.; Gáspár, C.; Fürjes-Mikó, Á.; Csóka, G. Known and predicted impacts of the invasive oak lace bug (Corythucha arcuata) in European oak ecosystems—A review. Folia Oecologica 2020, 47, 131–139. [Google Scholar] [CrossRef]
Figure 1. Forest subcompartments (brown pixels) containing Quercus sp. within the territory of Ukraine. (The red box shows the location of field research in the Kharkiv region).
Forests 16 01005 g001
Figure 2. Annual area of T. viridana outbreaks in the forests of Ukraine in 1947–2025.
Forests 16 01005 g002
Figure 3. Area of T. viridana outbreaks in the forests of Ukraine, in individual 20-year periods. (Whiskers—min-max; box—25–75 percentiles. Significant difference between medians for periods is absent for data with different letters in parentheses.).
Forests 16 01005 g003
Figure 4. Mean TV outbreak severity (mean foci area (ha) per oak stands area (thous. ha)) in the regions of Ukraine in two periods. The height of the columns is proportional to the maximal observed outbreak area (200 hectares). Data on the Crimea, Luhansk, and Donetsk regions are incomplete due to their occupation since 2014.
Forests 16 01005 g004
Figure 5. Mean TV outbreak incidence (share of outbreak years) in the regions of Ukraine in two periods. The height of the columns is proportional to the maximal incidence (1). Data on the Crimea, Luhansk, and Donetsk regions are incomplete due to their occupation since 2014.
Forests 16 01005 g005
Figure 6. Mean TV outbreak duration (number of years) in the regions of Ukraine in two periods. The height of the columns is proportional to the maximal outbreak duration (7 years). Data on the Crimea, Luhansk, and Donetsk regions are incomplete due to their occupation since 2014.
Forests 16 01005 g006
Figure 7. Mean number of TV outbreaks per interval in the regions of Ukraine in two periods. The height of the columns is proportional to the maximal outbreak number (5). Data on the Crimea, Luhansk, and Donetsk regions are incomplete due to their occupation since 2014.
Forests 16 01005 g007
Figure 8. Mean interval between TV outbreaks in the regions of Ukraine in two periods. The height of the columns is proportional to the maximal interval (24). Data on the Crimea, Luhansk, and Donetsk regions are incomplete due to their occupation since 2014.
Forests 16 01005 g008
Figure 9. Prevalence of T. viridana and other flush feeders in oak stands of the Kharkiv region in 1979–1989.
Forests 16 01005 g009
Figure 10. Prevalence of T. viridana and other flush feeders in oak stands of the Kharkiv region in 2001–2008.
Forests 16 01005 g010
Figure 11. Prevalence of T. viridana and other flush feeders in oak stands of the Kharkiv region in 2009–2018.
Forests 16 01005 g011
Figure 12. Contribution of individual indicators of suitability of oak stands to T. viridana in pooled data from four Forestry Enterprises of the Kharkiv region.
Forests 16 01005 g012
Figure 13. Median Julian dates of the stable transition of air temperature over 5 °C (D5) and 10 °C (D10) in Kharkiv for two periods (1978–2001 and 2002–2025). (Whiskers—min-max; boxes—25–75 percentiles. Significant difference between sample medians is absent for data with different letters in parentheses).
Forests 16 01005 g013
Figure 14. Median Julian dates of bud-flushing in Q. robur (Oak), and of T. viridana (TV) egg hatching in the Kharkiv region for two periods. (Whiskers—min-max; box—25–75 percentiles. Significant difference between sample medians is absent for data with different letters in parentheses).
Forests 16 01005 g014
Figure 15. Julian dates of bud-flushing in Q. robur (Oak), and of T. viridana (TV) egg hatching in the Kharkiv region for two periods: (a) 1978–2001; (b) 2002–2025; and for the whole period: (c) 1978–2025. Whiskers—standard errors.
Forests 16 01005 g015
Table 1. Indicators of the suitability of forest subcompartments for Tortrix viridana in several Forestry Enterprises of the Kharkiv region as of 1996.
IndicatorsKharkiv RSVovchansk FEChuguyevo-Babchansk FEZhovtneve FE
Total oak stands area, ha17,791.517,708.213,170.133,896.8
Oak stands in D1, D2, ha17,602.216,931.312,657.532,981.3
Oak stands of vegetative origin, ha14,141.814,498.59414.023,638.8
Oak stands of 41–80 years, ha10,286.66327.23666.815,812.5
Oak proportion ≥ 90%, ha9200.09116.66201.115,246.9
Oak stands with relative stocking density < 65%, ha4802.92339.82071.79939.4
Stands with the highest scores for all indicators, ha1121.6167.79.0533.5
Table 2. Indicators of the suitability of forest subcompartments for Tortrix viridana in several Forestry Enterprises of the Kharkiv region as of 2017.
IndicatorsKharkiv RSVovchansk FEChuguyevo-Babchansk FEZhovtneve FE
Total oak stands area, ha17,746.617,306.913,310.133,965.9
Oak stands in D1, D2, ha17,559.916,555.312,780.333,062.0
Oak stands of vegetative origin, ha13,811.913,966.89845.323,085.3
Oak stands of 41–80 years, ha5451.12787.32479.311,567.5
Oak proportion ≥ 90%, ha7560.65696.24830.315,168.4
Oak stands with relative stocking density < 65%, ha3350.82414.42734.38100.4
Stands with the highest scores for all indicators, ha265.725.47.7230.8
Table 3. Changes in the suitability of forest subcompartments for Tortrix viridana in several Forestry Enterprises of Kharkiv region in 2017 in % to 1996.
IndicatorsKharkiv RSVovchansk FEChuguyevo-Babchansk FEZhovtneve FE
Total oak stands area, ha−0.3−2.31.10.2
Oak stands in D1, D2, ha−0.2−2.21.00.2
Oak stands of vegetative origin, ha−2.3−3.74.6−2.3
Oak stands of 41–80 years, ha−47.0−55.9−32.4−26.8
Oak proportion ≥ 90%, ha−17.8−37.5−22.1−0.5
Oak stands with relative stocking density < 65%, ha−30.23.232.0−18.5
Stands with the highest scores for all indicators, ha−76.3−84.9−14.4−56.7
Disclaimer/Publisher’s Note: The statements, opinions and data contained in all publications are solely those of the individual author(s) and contributor(s) and not of MDPI and/or the editor(s). MDPI and/or the editor(s) disclaim responsibility for any injury to people or property resulting from any ideas, methods, instructions or products referred to in the content.

