Article

Post-Fire Recovery of Soil Multiple Properties, Plant Diversity, and Community Structure of Boreal Forests in China

1
School of Life Sciences, Leshan Normal University, Leshan 614000, China
2
Key Laboratory of Forest Plant Ecology, Ministry of Education, Heilongjiang Provincial Key Laboratory of Ecological Utilization of Forestry-Based Active Substances, College of Chemistry, Chemistry Engineering and Resource Utilization, Northeast Forestry University, Harbin 150040, China
3
College of Horticultural Science & Technology, Hebei Normal University of Science & Technology, Qinhuangdao 066004, China
4
College of Life and Environmental Science, Wenzhou University, Wenzhou 325035, China
5
Institute Ecology and Nature Management, Siberian Federal University, 660041 Krasnoyarsk, Russia
6
State Key Laboratory of Subtropical Silviculture, College of Forestry and Biotechnology, Zhejiang A&F University, Hangzhou 311300, China
7
School of Life Sciences, Qufu Normal University, Qufu 273165, China
*
Author to whom correspondence should be addressed.
These authors contributed equally to this work.
Forests 2025, 16(5), 806; https://doi.org/10.3390/f16050806
Submission received: 7 March 2025 / Revised: 29 April 2025 / Accepted: 9 May 2025 / Published: 12 May 2025
(This article belongs to the Section Forest Biodiversity)

Abstract

:
Fire is important in boreal forest ecosystems, but comprehensive recovery analysis is lacking for soil nutrients and plant traits in China boreal forests, where the strict “extinguish at sight” fire prevention policy has been implemented. Based on over 50 years of forest fire recordings in the Daxing’anling Mts, 48 pairs of burnt and unburnt controls (1066 plots) were selected for 0–20 cm soil sampling and plant surveys. We recorded 18 plant parameters of the abundance of each tree, shrub, grass, and plant size (height, diameter, and coverage), 7 geo-topographic data parameters, and 2 fire traits (recovery year and burnt area). We measured eight soil properties (soil organic carbon, SOC; total nitrogen, TN; total phosphorus, TP; alkali-hydrolyzed P, AP; organic P, Po; inorganic P, Pi; total glomalin-related soil protein, T-GRSP; easily-extracted GRSP, EE-GRSP). Paired T-tests revealed that the most significant impact of the fire was a 25%–48% reduction in tree sizes, followed by decline in the plant diversity of arbors and shrubs but increasing plant diversity in herbs. GRSP showed an >18% increase and Po decreased by 17% (p < 0.05). Redundancy ordination showed that the post-fire recovery years and burnt area were the most potent explainer for the variations (p < 0.05), strongly interacting with latitudes and longitudes. Plant richness and tree size were directly affected by fire traits, while the burnt area and recovery times indirectly increased the GRSP via plant richness. A fire/control ratio chronosequence found that forest community traits (tree size and diversity) and soil nutrients could be recovered to the control level after ca. 30 years. This was relatively shorter than in reports on other boreal forests. The possible reasons are the low forest quality from overharvesting in history and the low fire severity from China’s fire prevention policy. This policy reduced the human mistake-related fire incidence to <10% in the 2010s in the studied region. Chinese forest fire incidences were 3% that of the USA. The burnt area/fire averaged 5 hm2 (while the USA averaged 46 hm2, Russia averaged 380 hm2, and Canada averaged 527 hm2). Overharvesting resulted in the forest height declining at a rate of >10 cm/year. Our finding supports forest management and the evaluation of forest succession after wildfires from a holistic view of plant–soil interactions.

1. Introduction

Boreal forests store 272 ± 23 Pg carbon as a globally significant biome, providing local and global ecosystem services [1]. Forest fire is one of the intrinsic ecological processes in forest ecosystems, and it strongly influences the material cycling processes within the ecosystem [2,3,4]. Additionally, forest fires also cause losses to small amphibians, reptiles, insects, and other species. The intense heat from fires can directly kill slow-moving amphibians (e.g., frogs, salamanders) and ground-dwelling reptiles (e.g., lizards, snakes), while insects are more susceptible to being charred due to the high thermal conductivity of their exoskeletons. The boreal forests are strongly affected by fire [5], and forest fires’ frequency, intensity, and extent have also increased [6,7,8]. Fire disturbance affects the carbon cycle processes in forest ecosystems, impacting the atmospheric carbon balance and climate change [9,10]. Scientific understanding of the recovery of vegetation communities and soil chemical properties (e.g., soil nutrients) after the fire has become an essential topic in ecology [11,12,13].
In China, Daxing’anling Mts is the largest state-owned woodland, with a total area of 8.35 × 10⁶ hm2, playing a vital role in maintaining China’s carbon balance [14]. This region is the only boreal forest distributed in China. Fire is one of the major disturbances in the Daxing’anling Mts’ forests, with an average annual frequency of 35 times and a total annual average fire area of 7.66 × 10⁴ hm2 during the 46 years from 1965 to 2010 [15]. Fire strongly affects soil properties, community structure, and species diversity [16]. Regarding the influence of fires on forests, more attention has been paid to the short-term impact of fire intensity on forests, such as the effect of burn severity on soil carbon fluxes [9,17], the effects of fire on species diversity [18,19], the changes in soil and litter nutrients after a fire [20,21], and the response of soil microorganism to wildfire [22,23]. The lack of long-term data leads to significant uncertainties in the overall assessment of ecosystems [24,25]. Using long-term fire historical recordings to conduct a detailed survey of paired fire sites and unfired control sites on the vegetation community, diversity, and soil nutrient restoration process can fill the data shortage on fire ecology. Such a long-term study could understand the main factors affecting the post-fire forest changes and their change patterns and provide data support for vegetation restoration and ecological evaluation in the Daxing’anling Mts.
In China, the Forest Fire Prevention Regulations came into force in January 2009 [26], and forest fires will be extinguished whenever and wherever they occur. China’s forest fire management is considered as a top-to-bottom system, and China has the strictest fire prevention policy in the world [27]. All regions have adopted the method of putting out all forest fires and maintain a monitoring policy to prevent forest fires at any cost [28]. In other countries, such as the United States, the concept and policy of forest fire management are to ensure a healthy forest ecology without damage to human life. This means that some wildfires will not be extinguished, and flammable materials will be burnt artificially to reduce the possibility of serious fires in the future [27]. This difference in forest fire policy has resulted in different fire occurrences in China and other countries, i.e., China has lower fire incidence compared with that of USA, Canada, and Russia [29]. The possible effects of forest fires on the restoration of plant communities and soil nutrients after the fire are not yet well defined.
This study hypothesized that the post-fire recovery year-related changes in soil nutrients, plant diversity, and community structure primarily interact with geoclimatic conditions and fire severity (as manifested by the burnt area). In this study, fire–control paired plots were selected for long-term (>50 years) post-fire forest recovery studies to better understand the community succession processes, nutrient dynamics, and development trends and to reduce uncertainty in estimation. We aim to answer the following scientific questions: (1) Is the post-fire recovery year the most significant factor affecting soil nutrients, plant diversity, and community structure? (2) What is the possible driving path for changes in soil nutrients, plant diversity, and community structure? (3) What are the differences when comparing our results with previous publications and what are the forest fire management implications? The answers will provide data support for the scientific evaluation of fire impact on Chinese boreal forest ecosystems.

2. Material and Methods

2.1. Sampling Sites, Experimental Design, and Soil Sampling

Daxing’anling Mts is the northernmost and highest latitude area in China (50°11′–53°33′ N, 121°12′–127°00′ E). The area has a cold–temperate continental monsoon climate, with an average annual temperature of −4 °C in Mohe County and the northern part of Huzhong District, and −2 °C in other areas. Its average annual precipitation is 428.6–526.8 mm, with a frost-free period of 80–110 d and a freezing period of 180–200 d. The main tree species are Larix gmelinii, Betula platyphylla, Pinus sylvestris var. mongolica, Populus davidiana, etc. The main shrubs are Rhododendron dauricum, Ledum palustre var. dilatatum, Vaccinium vitis-idaea, etc. The main herbs are Cyperaceae, Compositae, Leguminosae, Rosaceae, etc. [30].
As shown in Figure 1, we have analyzed the fire recording data in the Daxinganling Mts in Heilongjiang Provinces from 1967 to 2016. In total, there were 1746 fires. All the data are from the Fire Prevention Office of the Daxing’anling administrative region. We classified these post-fire areas into six distinct periods based on post-fire recovery time, as follows: 1–5 years, 5–10 years, 10–20 years, 20–30 years, 30–40 years, and 40–50 years. On the premise that the site conditions, such as slope, slope position, forest type, and altitude were the same, we chose the non-burnt area around the burnt quadrat as the control quadrat. The control quadrats were the areas adjacent to fires, but with no fires recorded within the last 50 years (Figure 1, Table 1). In August 2017, 96 quadrats (burnt and control quadrats) were set up in 7 areas, namely Shuanghe, Tahe, Huzhong, Nanwenghe, Tuqiang, jiagedaqi, and Mangui in Daxing’anling Mts. For each site, we have detailed information on the burnt area, latitude, longitude, and other topographical details. Details of the selected study sites and historical records of fire in this region can be found in Table 1 and Figure 1.
The arbor quadrat size was set at 30 m × 30 m. Within each tree quadrat, five shrub quadrats (5 m × 5 m) were randomly established to survey the shrub layer. Subsequently, five herb quadrats (1 m × 1 m) were randomly placed within the selected shrub quadrats to investigate the herb layer. We surveyed 1066 plots. All arbors (diameter at breast height, DBH ≥ 2.5 cm) in each quadrat were measured and recorded for their taxonomic species name, arbor height, clear bole height, and DBH. All shrubs were recorded for their taxonomic species name, shrub height, shrub crown width, shrub coverage, and ground diameter. All herbs in the plot were recorded for their taxonomic species name, herb height, coverage, and relative abundance. The topographic and geographic data concerning the latitude, longitude, altitude, slope, slope position, and slope aspect of each quadrat were also recorded. The post-fire recovery time can be determined based on information provided by the local Fire Prevention Office of Daxing’anling administration in Heilongjiang Province.
In this study, all soil samples were collected while surveying the vegetation by five-point sampling (four corners and the center) of 0–20 cm soil (100 cm3 soil cutting ring) in each arbor quadrat. The five soil samples were mixed from the same quadrat and put into soil bags. The samples were air-dried in a ventilated room until they reached a constant mass in the laboratory. The visible plant and root debris and stones were picked out, and the mineral soil sample was passed through a 0.25 mm sieve for laboratory measurement.

2.2. Soil Nutrients and GRSP Determination

The soil organic carbon (SOC) content was measured using the heated dichromate titration method. The total nitrogen content (TN) was determined using the semimicro-Kjeldahl procedure. The total phosphorus (TP) content was measured using the NaOH fusion–Mo-Sb anti-spectrophotometric method. Available phosphorus (AP) was determined using the NaHCO3 extraction–Mo-Sb anti-spectrophotometric method. Our previous studies have repeatedly described detailed assay methods [31,32,33]. Soil organic phosphorus (Po) was determined using the burning–Mo-Sb anti-spectrophotometric method [34]. The content of soil inorganic phosphorus (Pi) was the difference between TP and Po [35].
The content of glomalin-related soil protein (GRSP) was determined according to the method described by Wright et al. [36]. Easily extractable GRSP (EEG) and total GRSP (TG) were extracted with sodium citrate solution and colored with Komas Brilliant Blue G-250 for 10 min. The absorbance values were recorded with a visible spectrophotometer (754N; Shanghai, China) at a wavelength of 595 nm and then used for the content calculation. The standard curve was drawn using bovine serum protein as the standard, and two controls were set up for each batch [36].

2.3. Calculation of Plant Diversity and Community Traits

The plant diversity index of arbors, shrubs, and herbs was calculated in each quadrat [37].
Shannon–Wiener index: H = P i ( ln P i )
Simpson index: D = 1 P i 2
Richness index: R = S
Pi is the proportion of the number of species i to the total number of the species, and S is the total of species in the sampling plot.
The mean values were used for all community traits. For herb and canopy layers, we first calculate the weighted average of each quadrat, with the relative abundance (or the number of trees and shrubs) as the weight, and then calculate the average value of the quadrat as the characteristic value of the quadrat [38].

2.4. Fire Characteristics, Temporal Changes, and Comparison with Other Countries

The fire incidence data, including burnt area and reason (human mistake and lightning fire) from 1968 to 2016, were from the local Fire Prevention Office of the Daxing’anling administration in Heilongjiang Province. We have analyzed the temporal changes in total incidence, burnt areas, fires caused by human mistakes, and lightning-initiated fire in terms of percentage.
We also compared the fire data from different countries, namely the USA, Canada, Russia, and France (2014 to 2019). We collected data on fire incidence and the total burnt area of the forests. China’s data are from National Forestry and Grassland Administration China. Russia’s data can be found on the website of the Russian Federal State Statistic Service. France’s data can be found in the forest fire database for the Mediterranean region of France. Canada’s data can be found on the website of Natural Resources Canada. The USA’s data can be found at the National Oceanic and Atmospheric Administration of the United States. Part of these data can also be found in Li, Yin, Guo, Guo and Hu [29].

2.5. Statistical Analysis

The effects of fire on soil properties, community structure, and plant diversity were analyzed by paired T-test between burnt and control quadrats. The post-fire recovery years were divided into 6 groups, as follows: 1–5 years (5 plots), 5–10 years (5 plots), 10–20 years (8 plots), 20–30 years (14 plots), 30–40 years (8 plots), and 40–50 years (8 plots), respectively. Values of indicators of the control quadrat were regarded as 100%, and the ratio between burnt and control quadrat was calculated as the effect size. Regression analysis (polynomial fitting, n = 3) and linear fitting were conducted between the effect sizes and the recovery years. All these analyses were performed using SPSS 22.0.
Associations between soil properties, community structure, plant diversity, geoclimatic conditions, and fire conditions (recovery year and burnt area) were decoupled using RDA (redundancy analysis) ordination in burnt and control sites to find the underlying reason for these differences. The soil properties include SOC, total nitrogen, TP, AP, Po, Pi, TG, and EEG. Plant diversity measures include the arbor richness index (A-Richness), arbor Shannon–Wiener index (A-Shannon), arbor Simpson index (A-Simpson), shrub richness index (S-Richness), shrub Shannon–Wiener index (S-Shannon), shrub Simpson index (S-Simpson), herb richness index (H-Richness), herb Shannon–Wiener index (H-Shannon), and herb Simpson index (H-Simpson). Community structure measures include arbor height (AH), arbor clear bole height (ACBH), arbor diameter at breast height (ADBH), shrub height (SH), shrub crown width (SCD), shrub coverage (SC), shrub ground diameter (SGD), herb height (HH), and herb coverage (HC).
Geoclimatic conditions include latitude, longitude, altitude, slope degree, slope position, aspect of slope, mean annual temperature (MAT), and mean annual precipitation (MAP). The MAT and MAP data were sourced from the Daxing’anling regional meteorological bureau. Fire conditions include post-fire recovery years (Years) and burnt areas (Ba). RDA analysis was used to resolve the complex coupling relationships affecting soil properties, community structure, and plant diversity after the fire.
After identifying the most significant factors affecting forest restoration after fires, we used the partial least squares path modeling (PLS-PM) to assess the relationships among fire conditions, geoclimatic conditions, community function, plant diversity, and soil properties. The PLS-PM analysis was carried out using R-3.6.1. The function inner plot in the R package PLS-PM was used to build the model [39].

3. Results

3.1. Paired T-Test in Burnt and Control Sites

Regarding soil nutrients, the Po content of the burnt sites was 16.7% lower than that of the control sites (p < 0.05). Compared to the control sites, the SOC of burnt sites increased by 9.8% (p > 0.05), and the TN, TP, AP, and Pi contents of burnt sites decreased by 1.8%–14.1% (p > 0.05). The GPSP content of the burnt sites was at least 18.3% higher than that of the control sites (p < 0.05) (Table 2).
Regarding plant diversity, the arbor and S-Richness indices of the burnt sites were 18.6%–24.2% lower than that of the control sites (p < 0.05). Compared to the control sites, the eA-Simpson, A-Shannon, S-Simpson, S-Shannon indexes of the burnt sites decreased by 6.4%–17.2%, but the difference was insignificant (p > 0.05). The H-Simpson index of the burnt sites was 14.1% higher than that of the control sites (p < 0.05). The H-Richness and H-Shannon index of the burnt sites were 2.9%–12.9% higher than that of the control sites, but the difference was insignificant (Table 2).
In terms of community structure, the arbor size (AH, ADBH, and ACBH) of the burnt sites was 24.6%–47.5% lower than of the control sites (p < 0.05). The shrub size (SH, SCD, SC, SGD) and herb size (HH, HC) had only slight differences between the burnt sites and control sites.

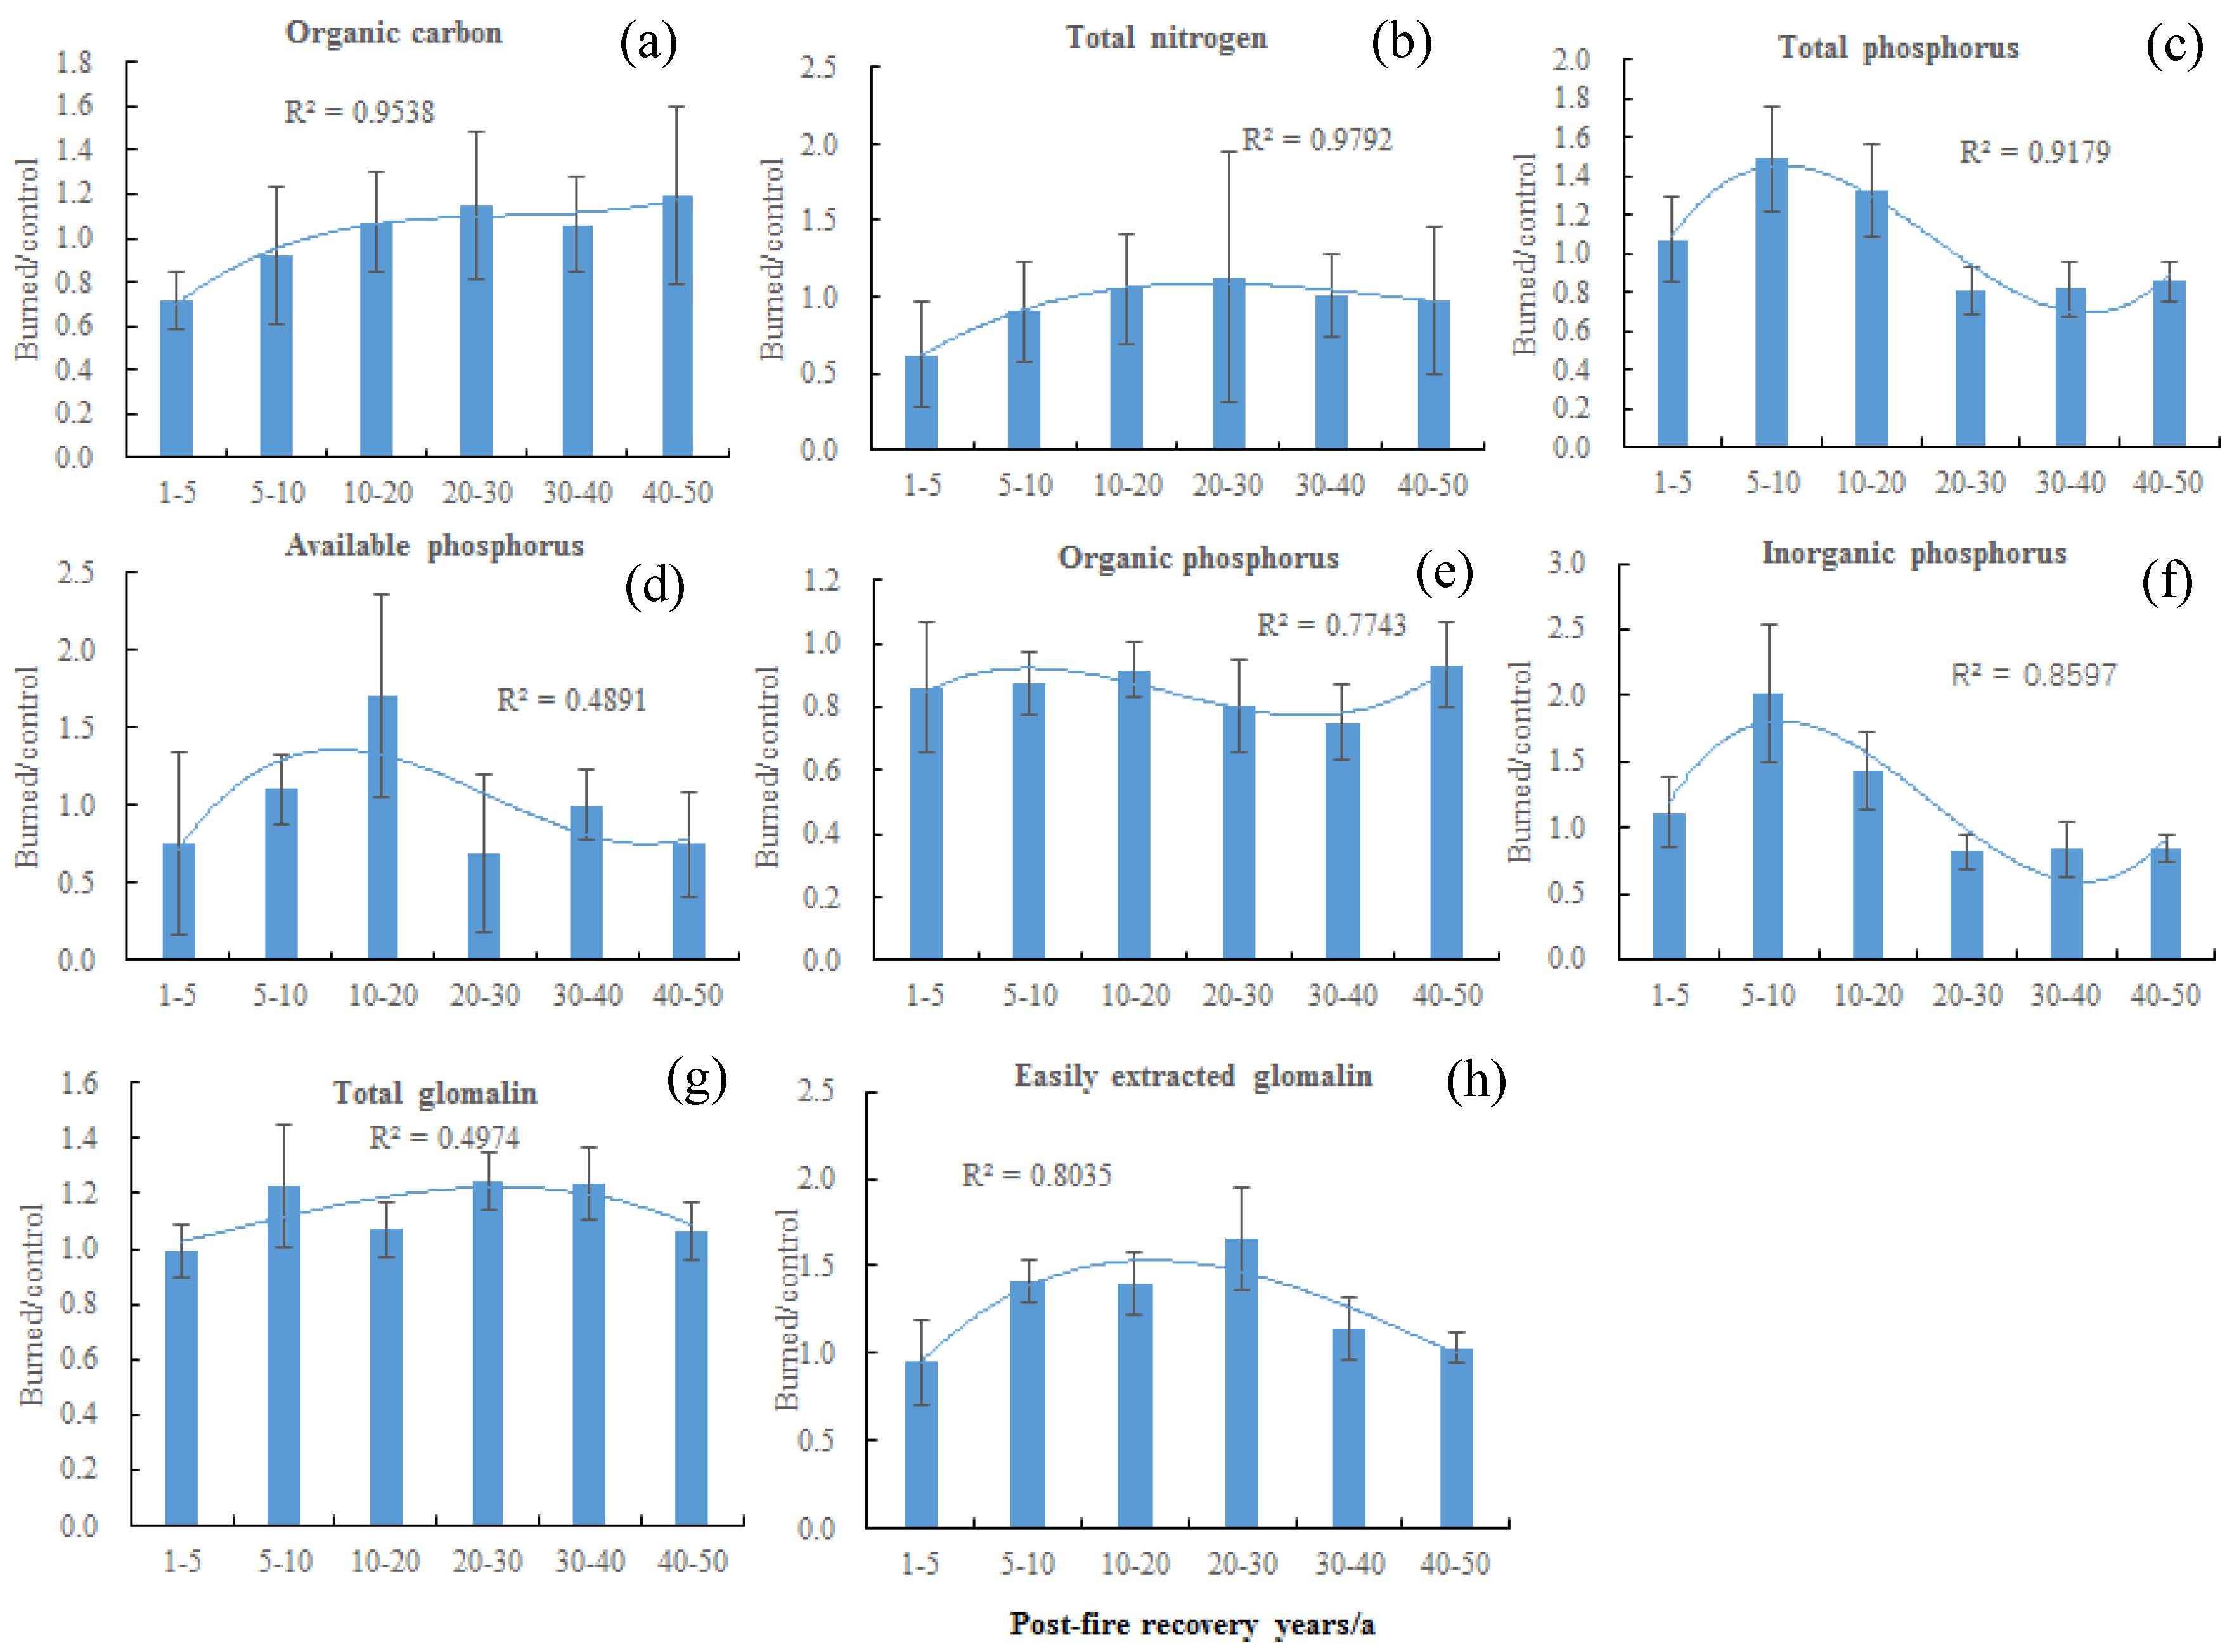
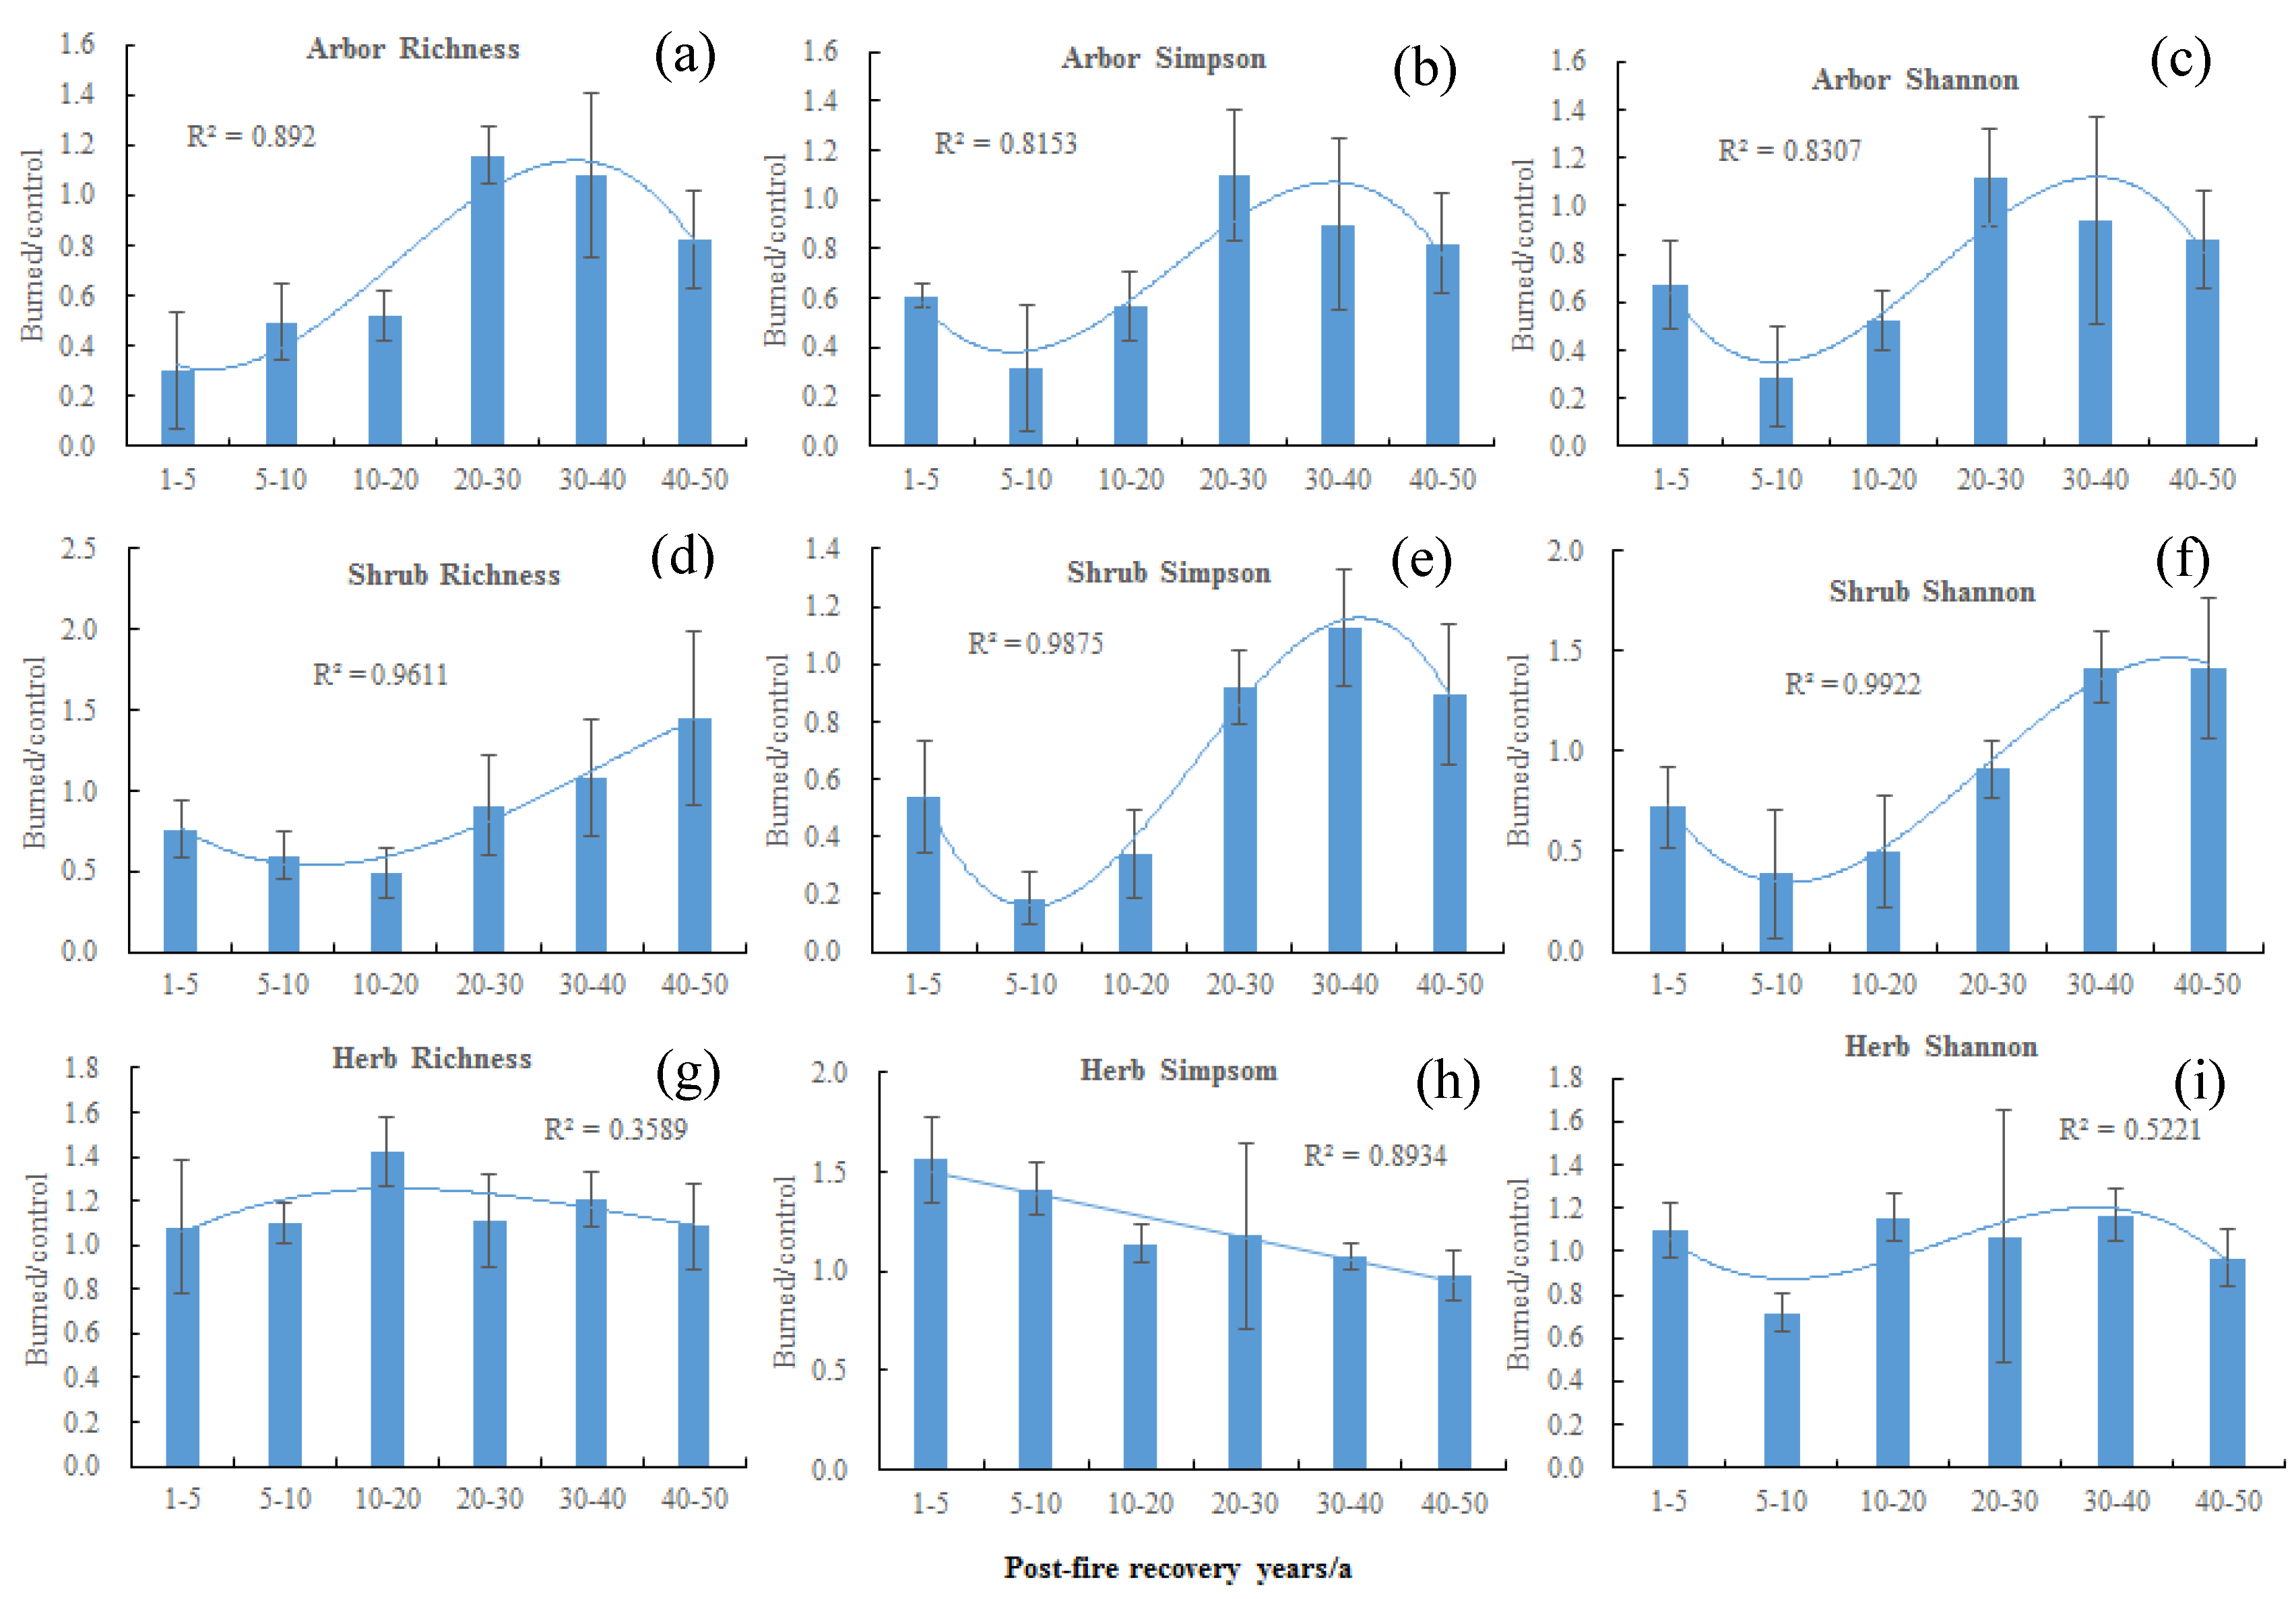
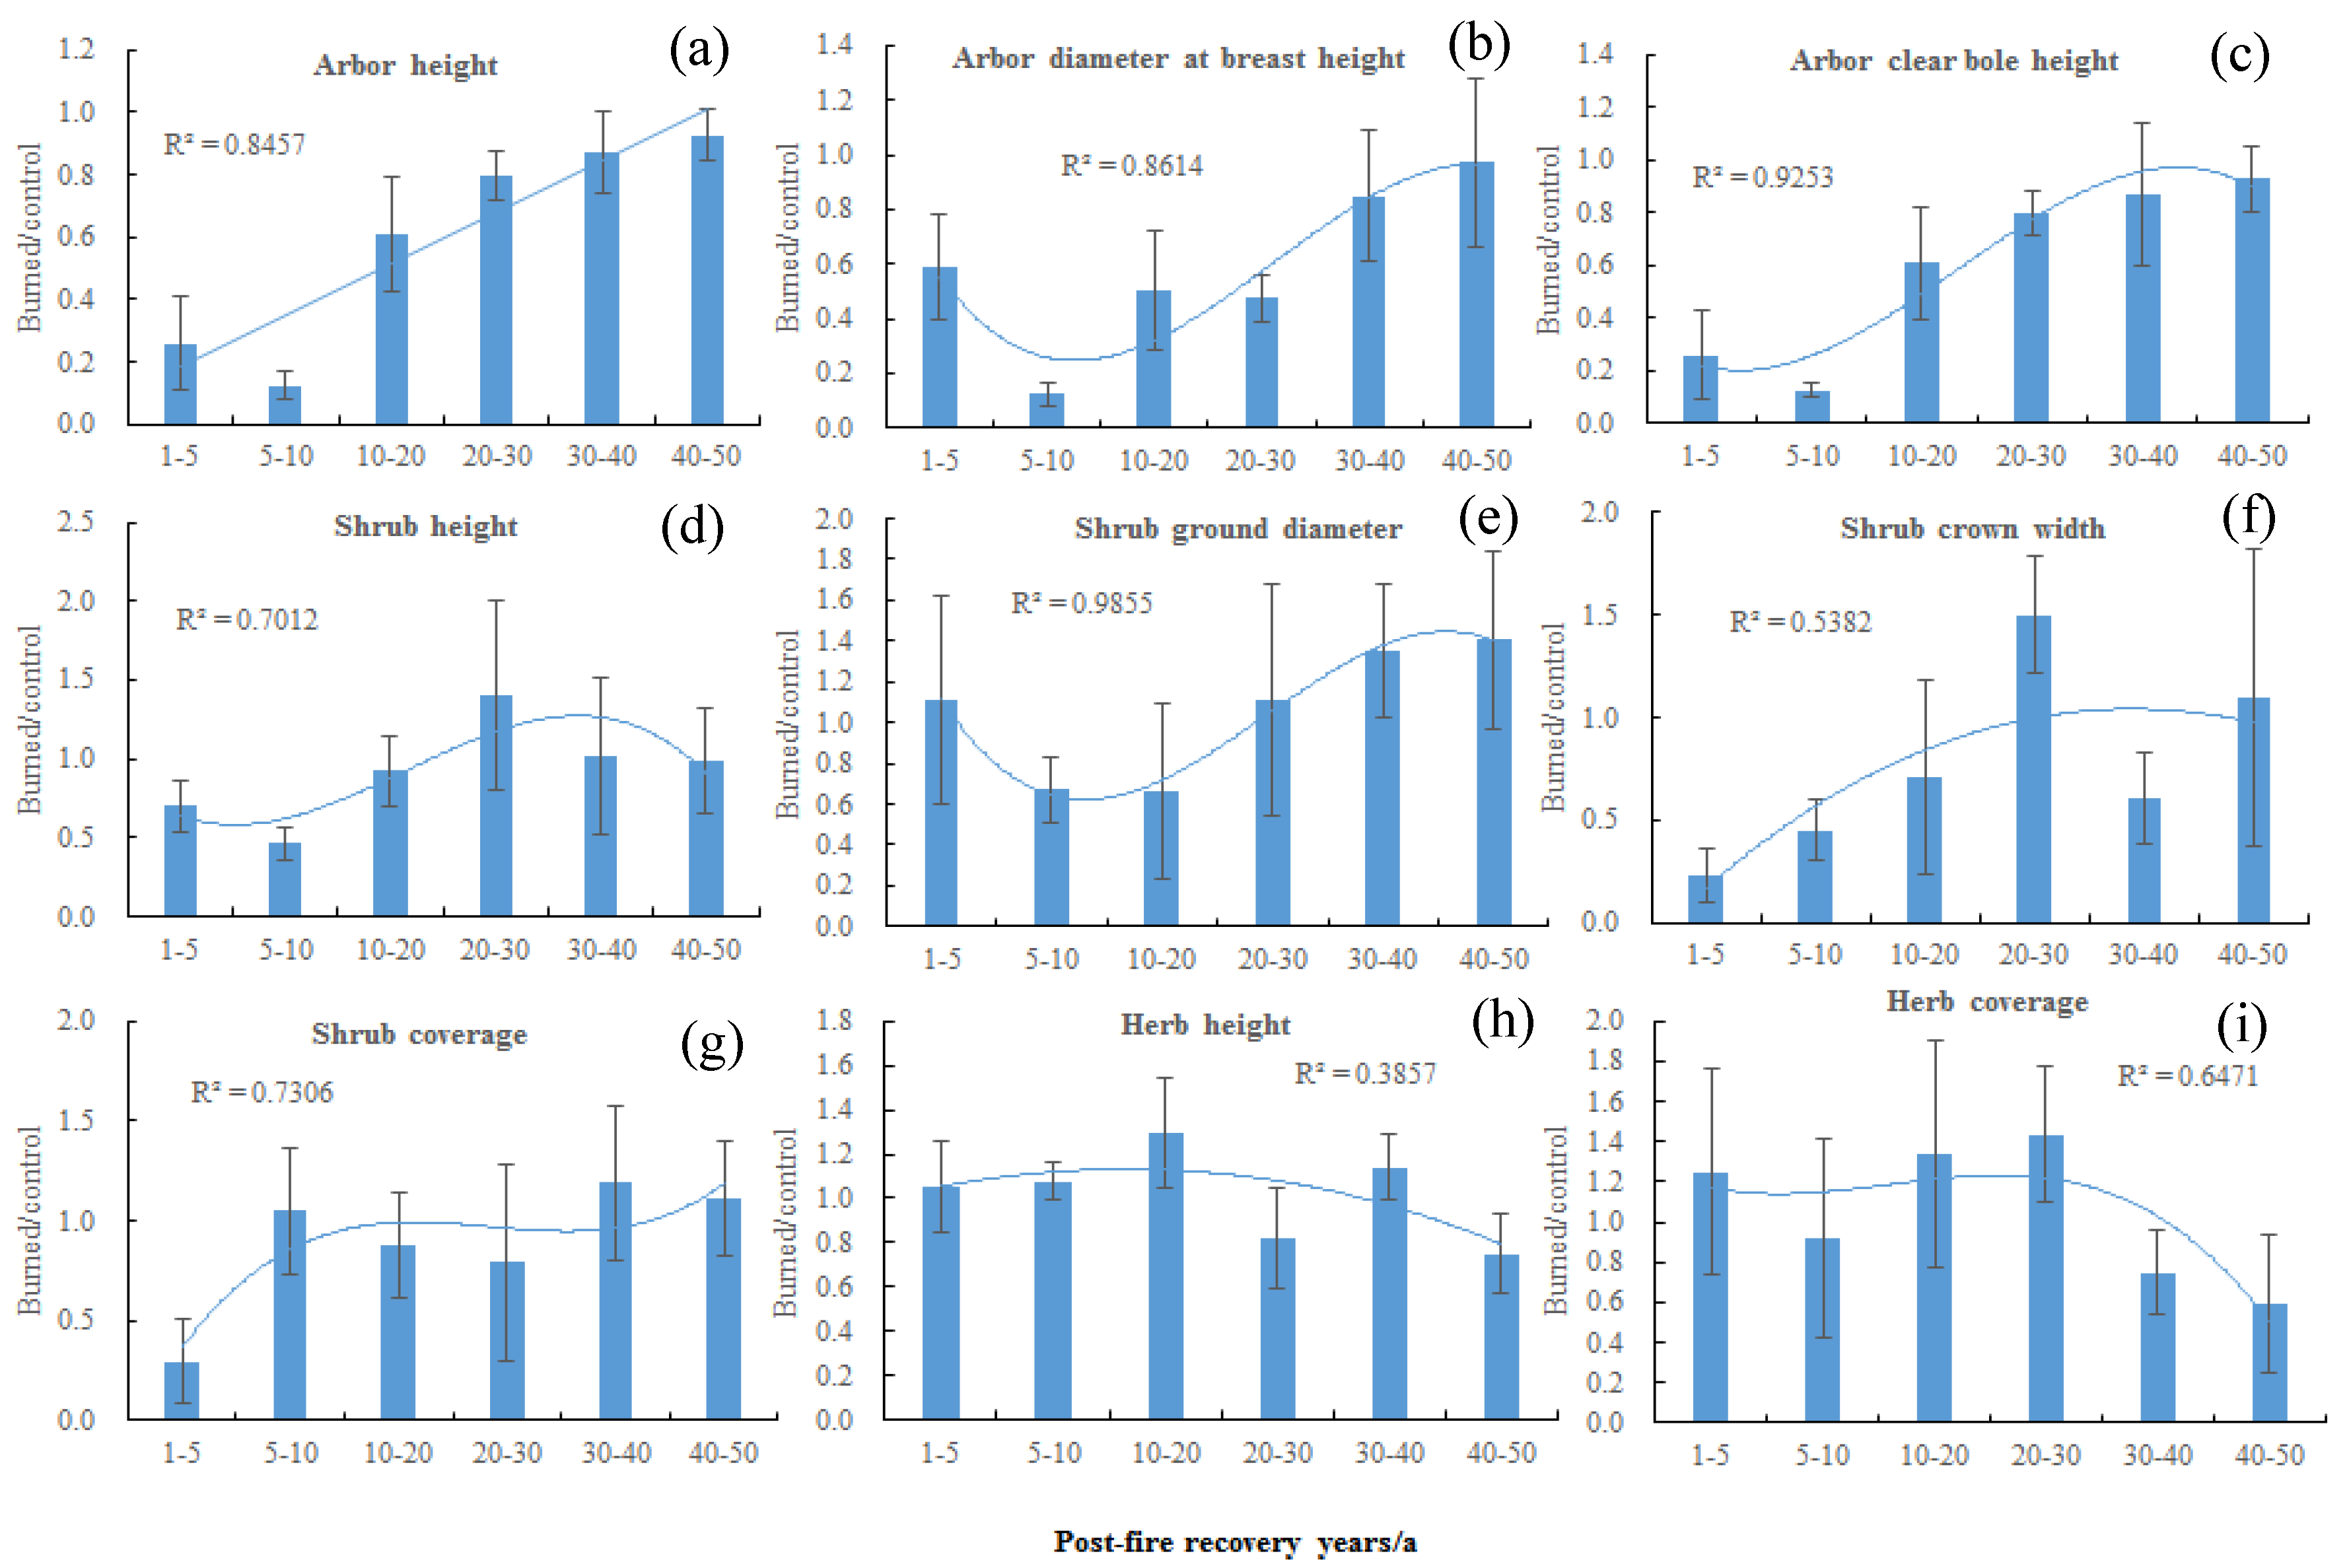
3.2. Effects of Post-Fire Recovery Years on Soil Nutrients, Plant Diversity, and Community Structure

The trend analysis of the burnt/control ratio with post-fire recovery years showed that the SOC and TN contents decreased after the fire and then showed an increasing trend. In the period of 10–20 years, the burnt sites’ SOC and TN contents recovered to the control level (Figure 2, Tables S1 and S4).
The soil AP of burnt sites decreased after 1–5 years post-fire, and the ratio showed a trend of increasing and then decreasing with the recovery years. TP and Pi began to be lower than the control within 20–30 years. Po in burnt sites was always lower than that in control sites in different recovery years and showed a trend of increasing and then decreasing with time (p < 0.05) (Figure 2, Tables S1 and S4).
The TG ratio showed a trend of increasing and then decreasing with post-fire recovery years, and the TG of burnt sites was always higher than that of the control sites after 1–5 years post-fire. The EEG also showed a similar trend (Figure 2, Tables S1 and S4).
The ratio of the A-Simpson, A-Shannon, and A-Richness indexes showed a trend of decreasing and then increasing with post-fire recovery years (p >0.05). The ratio of arbor diversity was lowest at 1–10 years post-fire and highest at 20–30 years post-fire, and started to recover to the control level at 20–30 years post-fire (Figure 3, Tables S2 and S4).
The shrub diversity ratio showed an overall upward trend with the recovery years, and the S-Richness index exceeded the control level at 30–40 years post-fire (p < 0.05). The S-Simpson index showed a slow change in the early stage (<20 years), and then increased rapidly, which was equivalent to the control level at 20–30 years post-fire (p < 0.05). The S-Shannon index showed an upward trend with the recovery years and exceeded the control level at post-fire 20–30 years (p < 0.05). Different from arbor diversity, the shrub diversity index reached a significant level during the recovery years (Figure 3, Tables S2 and S4).
The H-Richness index increased first and then decreased with the recovery years. The H-Simpson index showed a downward trend with recovery years (p < 0.05). The changing trend of the H-Shannon index with the recovery years was not obvious (Figure 3, Tables S2 and S4).
Under different fire recovery years, the ratio of arbor height, ADBH, and ACBH increased with the increase in recovery years, and the change in AH with recovery years was significantly different (Figure 4, Tables S3 and S4).
The SH and SCD exceeded the control level at 20–30 years post-fire, and the SC exceeded the control level at 5–10 years post-fire. The SGD ratio showed a trend of decreasing and then increasing with the recovery years (p < 0.05) (Figure 4, Tables S3 and S4).
The HH and HC recovered comparably to the control level at 1–5 years post-fire but did not change significantly with the recovery year (Figure 4, Tables S3 and S4).

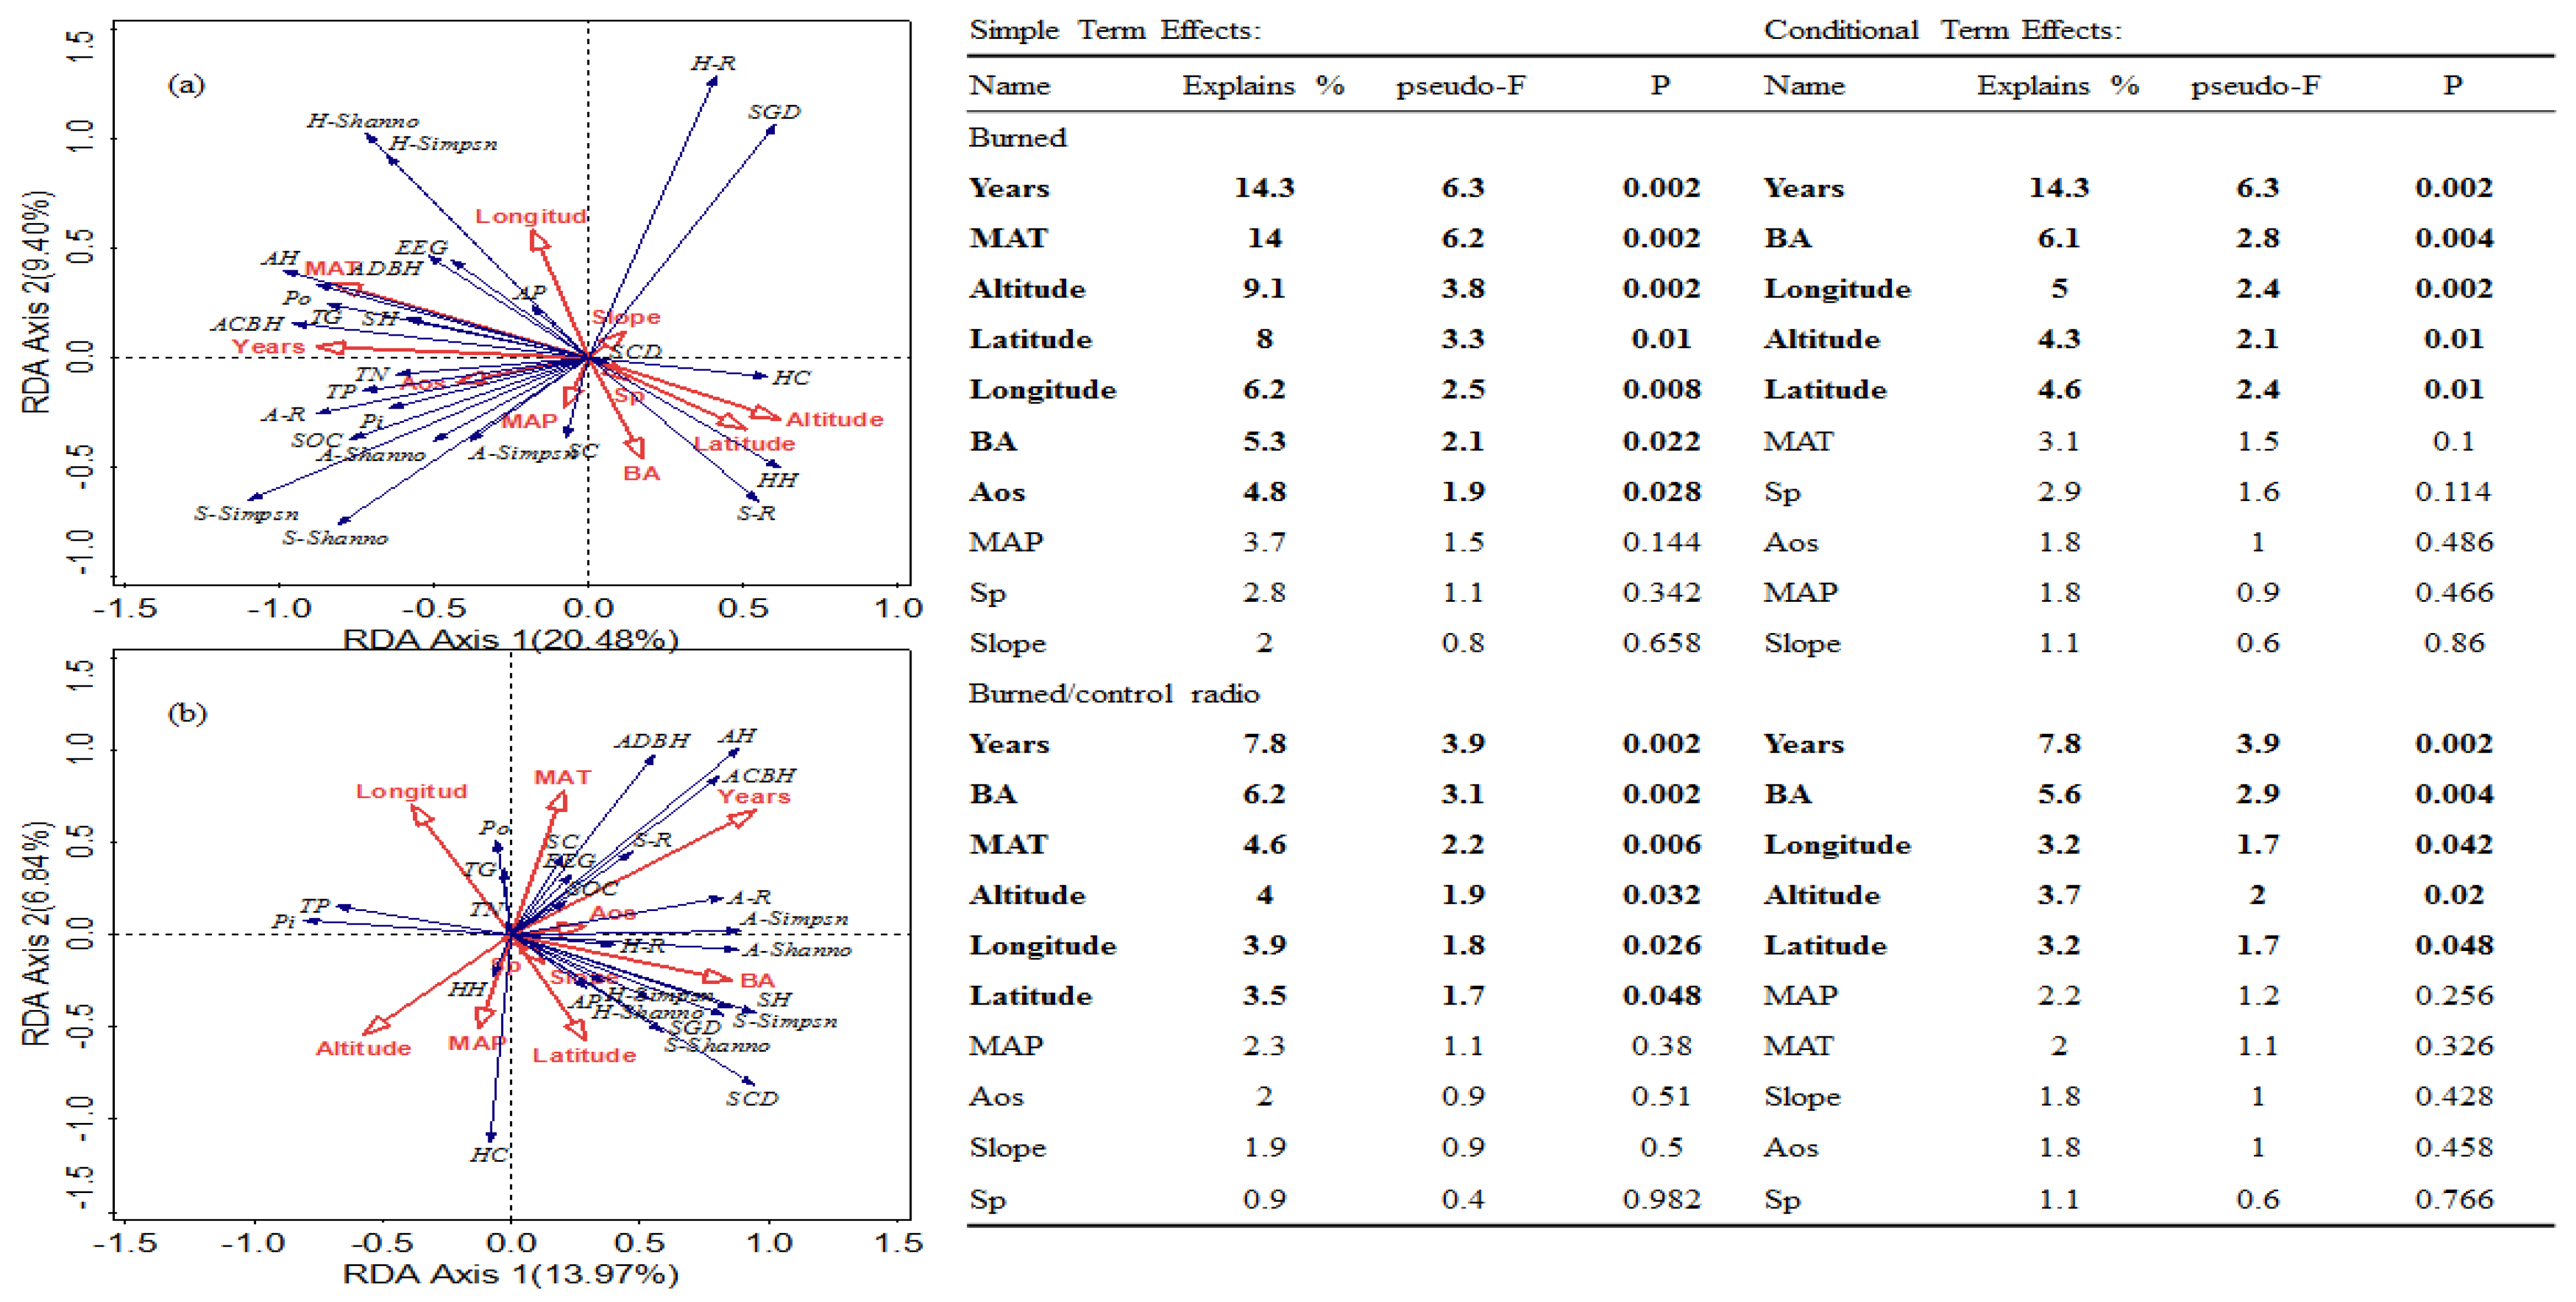
3.3. Redundancy Analysis for Identifying Significant Factors Responsible for the Variations

In the burnt sites (Figure 5a), fire conditions had the most significant explanatory power on forest restoration, and the explanatory power of the recovery years was the strongest. Simple term-effect analysis showed that the Years factor explained 14.3% of the burnt sites’ variation (the peak one, p < 0.01). Conditional term effect analysis (removing the collinearity effect) showed that the Years and Ba factors explained 14.3% and 6.1% (p < 0.01) of the variation, respectively. The recovery years were more closely related to arbor size, SOC, TN, and TP content, and the action direction of recovery years was opposite to latitude and altitude. The greater the longitude and the smaller the Ba, the more often they were accompanied by higher herb diversity (Figure 5a).
RDA ordination was also performed by using the relative changes in soil properties, plant diversity, and community structure (ratio between burnt sites and control sites) and mean values of geoclimatic data in burnt and control sites to identify the reason for forest recovery variations after the fire. The most significant factor for burnt/control ratio variation was the Years factor (7.8%, p = 0.002) in the simple term-effect analysis and the Years factors in the conditional term-effect analysis, respectively (p = 0.002). The recovery years factor was more closely related to arbor size, diversity, and SOC, and its action direction was opposite to MAP and altitude. The greater the longitude and the smaller the latitude, the more significant the TN, TG, and Po difference between the burnt sites and control sites (Figure 5b).

3.4. PLS-PM Analysis for Finding the Driving Paths for the Variations

According to the paired T-test and redundancy analysis, we selected post-fire recovery years and burnt area as the most important environmental factors. We investigated the effect of fire conditions (Years, Ba) and geoclimatic conditions (MAT, MAP, and Altitude) on phosphorus content (TP, AP, Po, Pi), GRSP content (TG, EEG), plant richness (A-Richness, S-Richness, H-Richness), and arbor size (AH, ADBH). By using them, we comducted a PLS-PM analysis (Figure 6).
The PLS-PM was best represented here with a GoF 0.47 in burnt sites. In the model, the R² values for soil phosphorus, GRSP, plant species richness, and tree size were 0.33, 0.33, 0.44, and 0.27, respectively. According to the PLS-PM, fire conditions exerted significant direct effects on plant richness and tree size, and geoclimatic conditions exerted significant direct effects on soil GPSP, plant richness, and tree size. However, there was not a significant direct effect of fire conditions on GRSP content. Together, this suggested that fire conditions exerted indirect effects on GRSP mainly through direct effects on plant richness. There was not a significant direct effect of geoclimatic conditions on soil P content. This suggested that geoclimatic conditions exerted indirect effects on soil TP mainly through direct effects on GRSP (Figure 6a).
The PLS-PM was best represented here with a GoF 0.39 for the burnt/control ratio. According to the PLS-PM, fire conditions exerted significant direct effects on tree size and plant richness, and geoclimatic conditions exerted significant direct effects on tree size. Instead, there was no significant direct effect of fire conditions and geoclimatic conditions on soil P and GRSP contents (Figure 6b).

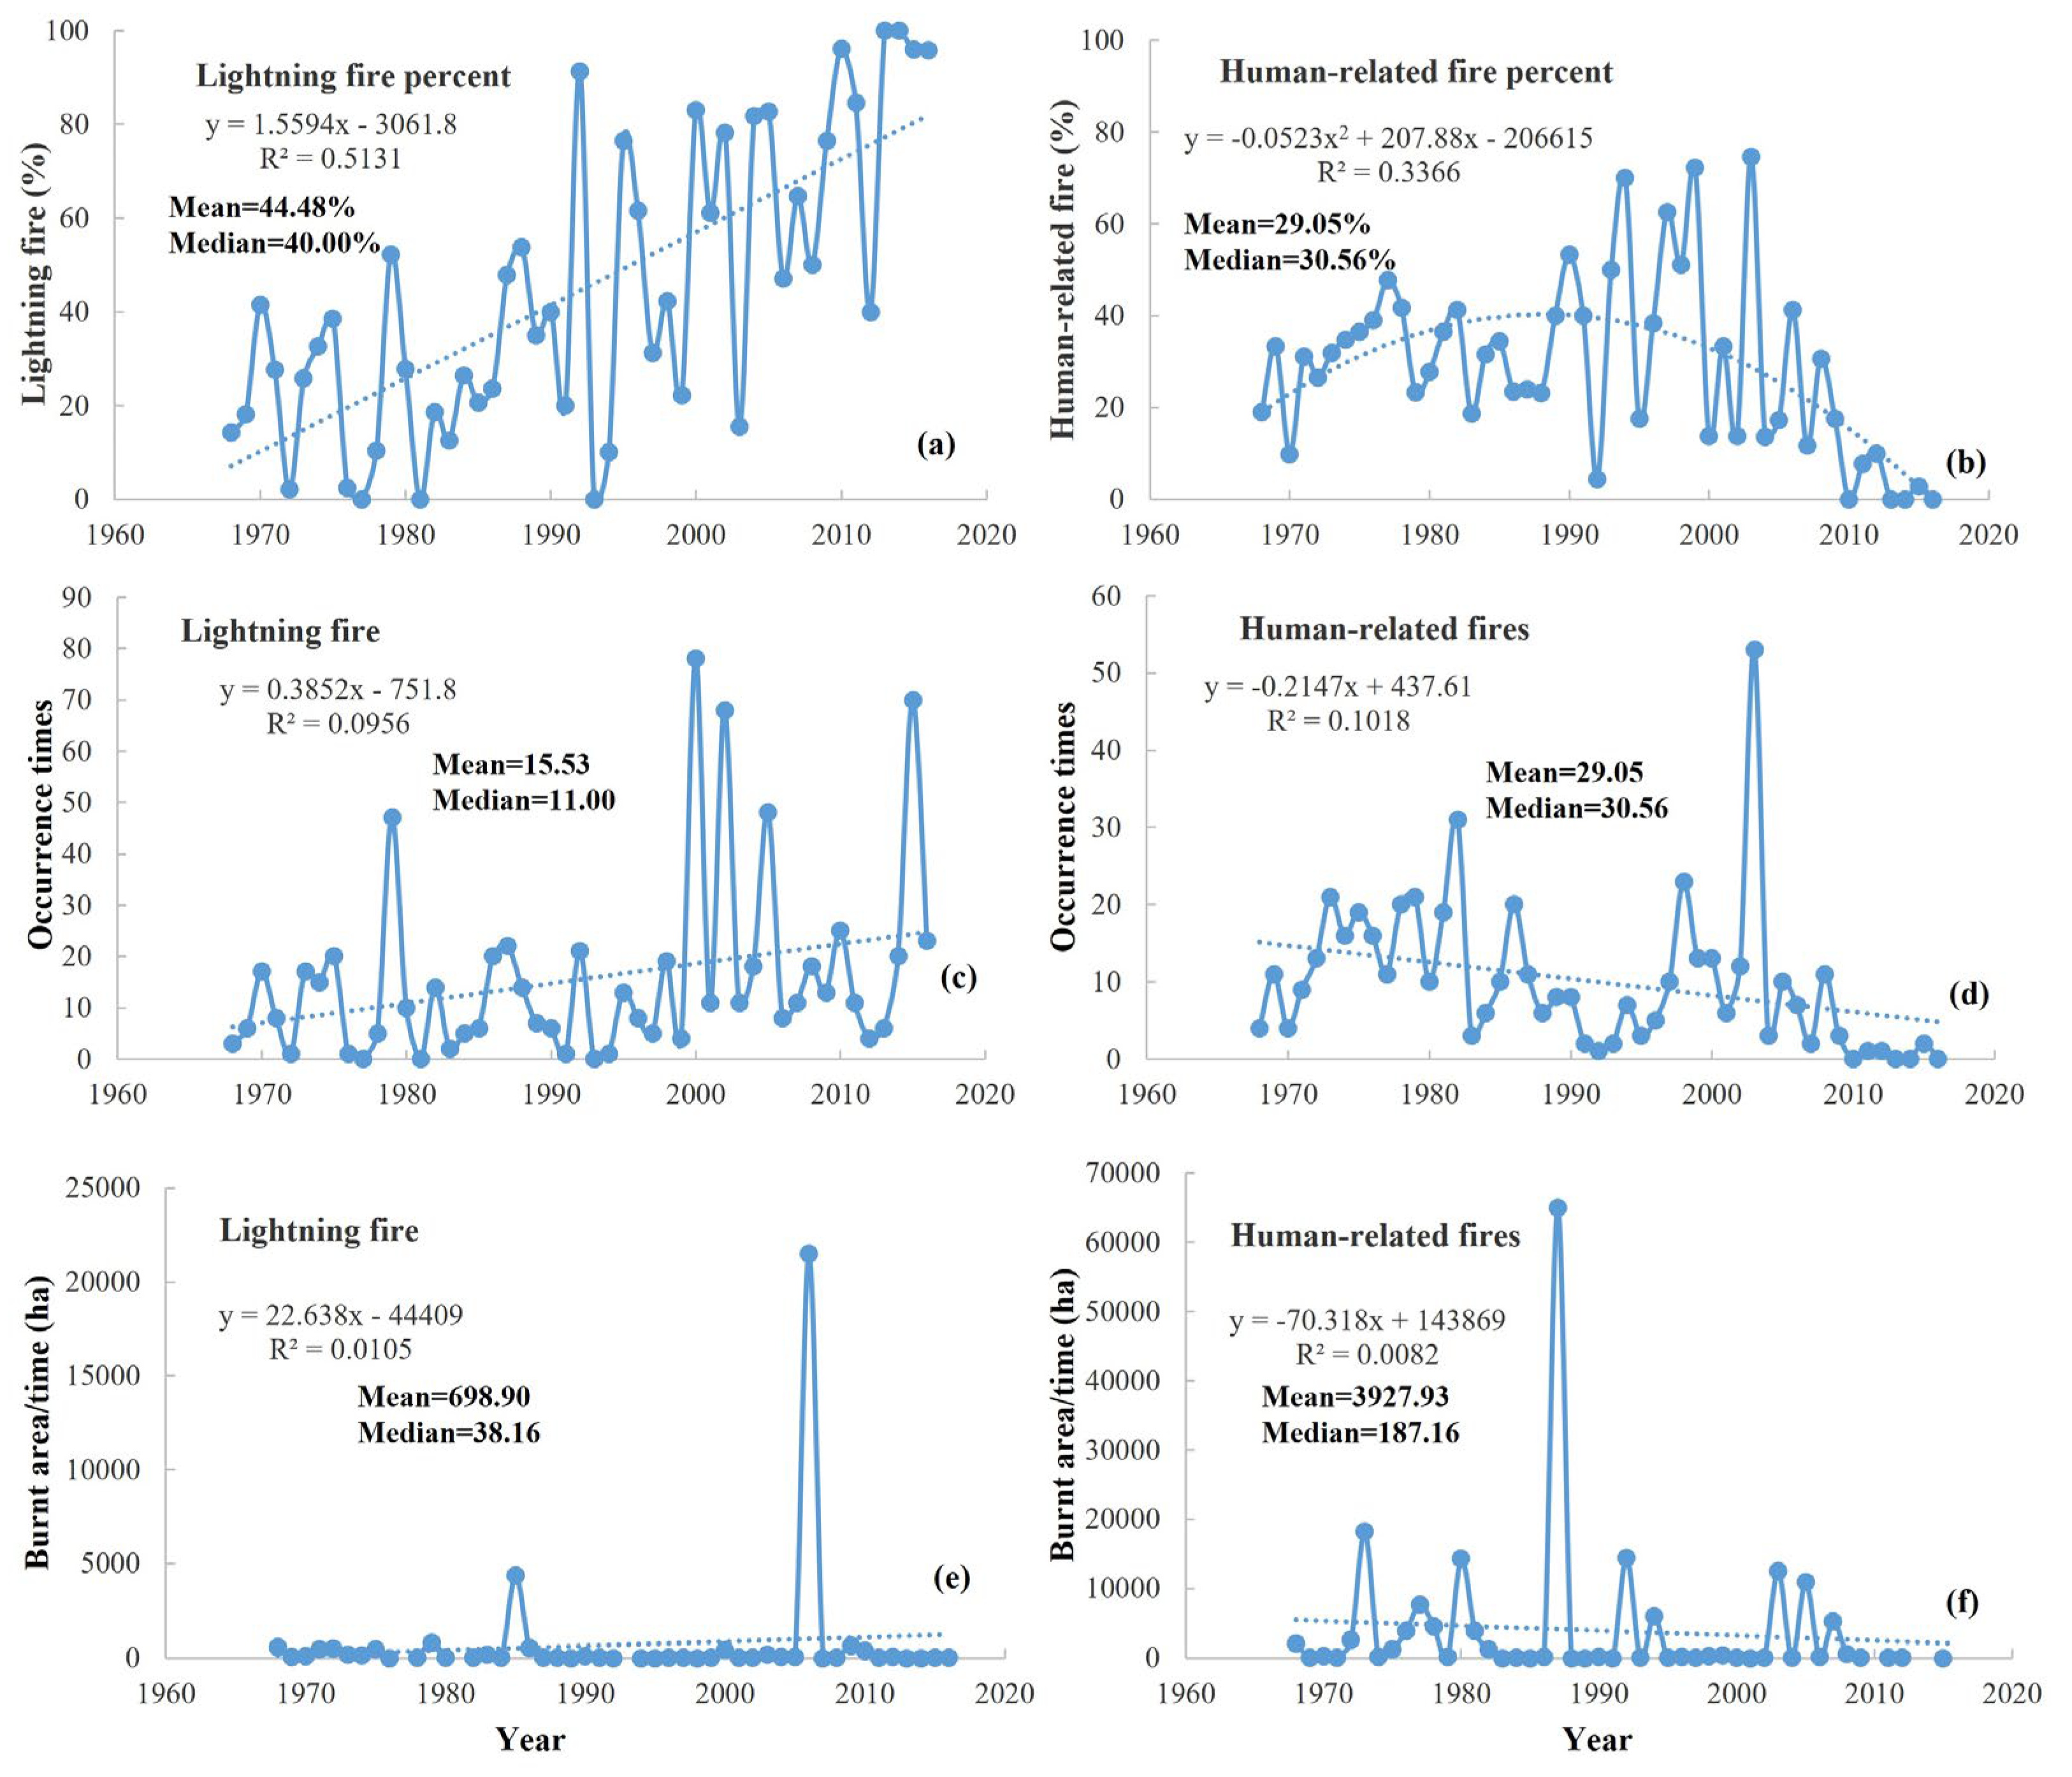
3.5. Fire Changes in the Studied Region and China Forest Fires Compared with Other Countries

In the studied region, 1967–2016 forest fire statistics showed that the lightning-related fire burnt area averaged 698.9 ha; the human mistake-related fire burnt area averaged 3928 ha. The fire incidence for lightning-related fires was averaged at 15.5 times/year, and human mistake-related fires were averaged at 29.1 times/year. The lightning-related fire percentage linearly increased from <20% in the 1970s to >80% in the 2010s, and human mistake-related fires decreased by <10% in the 2010s (Figure 7).
Table 3 lists the fire incidence and burnt area comparison between the USA, Canada, France, Russia, and China from 2014 to 2019. The forest fire incidence in China was 5%–20% that of the data from the USA, Russia, and 60% that of the data from Canada. The total burnt forest area/year was 0.2%–0.4% of their data in the USA, Russia, and Canada. It seems that smaller forest area in China and France is the main cause of the smaller fire-incidence values in these countries (Table 3).

4. Discussion

4.1. Comparison with Previous Publications

Our results demonstrated a strong influence of fire on the nutrient dynamics of the boreal forest and that this influence changes over time. Our study showed that SOC and TN contents decreased after the fire, but there was no difference between them after ten years of post-fire recovery. In a meta-analysis, on average, soil carbon and nitrogen contents are 15.2% and 14.6% lower in burnt sites than in control sites, and soil carbon and nitrogen levels returned to control levels about ten years after the fire [40]. The TP and Pi contents increased first and then decreased after the fire, and the time when TP and Pi contents were lower than the control levels was after 20–30 years of post-fire recovery. However, the AP and Po contents decreased just after the fire, then first increased and then decreased with the increase in fire recovery years. At the beginning of post-fire succession, the TP content of soil increased immediately after fire, and then decreased gradually with the increase in post-fire time [41].
GRSP (TG and EEG) increased significantly after the fire, but did not change considerably with the fire recovery years. GRSP is a hydrophobic glycoprotein released in soil by AM fungi [42]. The occurrence of wildfires increases the surface soil temperature and regulates the soil microbial community structure to a certain extent [43,44,45]. In addition, pyrogenic organic matter may be produced during forest fires, including semi-charred biomass, charcoal, and black carbon [23]. These factors may be the reason for the increase in GRSP after the fire.
Generally speaking, fire disturbance is essential in promoting community succession and ecosystem functions [46]. For natural larch forests, fire disturbance is conducive to the stability of their community structure [47]. In this experiment, the diversity index of trees and shrubs was lower than that of the control within 30 years of post-fire recovery, and then reached the original control level. Wang, et al. [48] found that the vegetation richness and Shannon index reach their highest levels after 21 years of post-fire recovery. The ratio of the burnt sites to the control sites showed that the shrub diversity and richness had a more obvious change trend with the time of fire recovery (p < 0.05), which was more evident than the tree layer. Wang, et al. [49] also found a similar conclusion: i.e., the diversity index of burnt sites in different years became more complex with the restoration time, but the diversity index of the shrub layer and herb layer increased first and then decreased generally with the time of restoration. Our research also clearly found that the herb Simpson diversity index showed a linear downward trend. Previous studies also found that fire disturbance promoted the cycling of soil nutrients under forests, which was conducive to the regeneration and restoration of undergrowth vegetation [50].
From the perspective of forest characteristics, the post-fire recovery years greatly impacted the characteristics of forest communities. The tree height, under-branch height, and DBH of the trees after the fire were significantly lower than those of the control sites and reached the control level after about 40–50 years of post-fire recovery. The shrub layer was substantially less affected by fire than the tree layer, and shrub coverage reached the control level ten years after the fire. A possible explanation would be that the fire destroyed many tree canopies, and shrubs could obtain more sunlight and better growth space [51]. Therefore, the recovery speed of the shrub layer was significantly faster than that of the tree layer. The height and coverage of the herb layer decreased with the increase in post-fire recovery years, which may be due to the rise in the resilience of the tree layer and shrub layer in the later recovery period.

4.2. Recovery Time by Effect Size Analysis: Scientific Evaluation and Stand Management

How long plants and soils take to recover to their original status is a critical parameter for fire restoration ecology. By using paired sampling of fired sites and unfired control sites, we found that the forest community and soil nutrients recovered to the control level about 30 years after the forest fire in China. Compared with previous publications, this recovery time is much shorter than the previously reported data in boreal forests outside China. In different altered fire regimes, different models found that post-fire recovery took at least 100 years for the forest to return to its original state [52,53]. In tropical forests, forest regeneration took more than 100 years to return to the forest’s pre-fire state. Considering the total carbon balance of the regrowing forests, the carbon emissions caused by forest fires took over 150 years to recover to the pre-fire state [54]. After a high-severity fire, natural recovery was a long process, and it took hundreds of years for the local original coniferous forest ecological community to recover to its previous state [55]. Different studies confirmed a recovery time of 20–30 years in China, in the same region as our study sites. For example, Zhang, et al. [56] found that the longest post-fire recovery time of soil organic carbon was 25 years after the fire in the Daxing’anling Mts. The Margalef and Shannon–Wiener indexes of the community restoration after 21 years were the highest [48].
The reason for the differences between China and other countries is possibly related to the forest fire severity and forest status. Firstly, compared with the view that forest fire is an essential ecological process in some countries, China’s current forest fire management policy emphasizes extinguishing all forest fires [27]. As a result of China’s fire prevention policy, the burnt area caused by lightning or human-related fires was relatively small in the Daxing’anling Mts (Figure 7). In the studied region, 1967–2016 forest fire statistics showed that the lightning-related fires burnt area was averaged at 699 ha and had a median value of 38 ha; the human mistake-related fire burnt area was averaged at 3928 ha and had a median value of 187 ha. The fire incidence for lightning fire was averaged at 35 times and had a median value of 26 times; the corresponding data for human mistake-related fires were 10 and 8 times, respectively. In the relative percentages, the lightning-related fire percentage linearly increased from <20% in the 1970s, to >80% in the 2010s. At the same time, human mistake-related fires peaked in the 1990s (40%), then decreased <10% in the 2010s. Table 3 lists the fire incidence and burnt area comparison between the USA, Canada, France, Russia, and China from 2014 to 2019. The forest fire incidence in China was 6%–60% that of the data in the USA, Russia, and Canada. The burnt forest area was 0.2%–0.4% that of their data. The burnt area/time in China and the Mediterranean region of France was 5–7 hm2, while those in the USA, Russia, and Canada were, respectively, 46 hm2, 380 hm2, and 527 hm2 (Table 3).
Secondly, the size of the trees was relatively small in the Daxing’anling Mts region, which is mainly made up of immature forest. In Shuanghe National Nature Reserve, the diameter and height of trees were only half of those in the 1970s [57]. In Duobukuer National Nature Reserve, the diameter and height of trees were only 55% of those in the 1970s, and the richness of trees and herbs was about 50%–60% higher than that in Huzhong Nature Reserve in central Daxing’anling [38]. Historical data comparison showed that tree height declined by nearly half, tree density increased by 700–1000 trees/ha, and forest plant resources declined evidently in the past 50 years; total forest layer depth declined by over 10 cm/year, indicating significant losses in forest ecological services [30,58]. Compared with the neighboring Russian data, Chines forests had fewer evergreen pine, spruce, and fir, but a higher percentage of larch and birch, and the carbon storage density was at the lowest range of the Russian forests [58]. In this study, this kind of low-quality young forest has been used as a control for the burnt sites. The above two aspects led to the rapid recovery of forest communities and soil nutrients after the fire in China.
Vegetation restoration of burnt sites is an important problem that people are facing today. Many scholars have studied vegetation regeneration and restoration after fires from different aspects [59,60]. Reasonably exerting the ecological benefits of forest fires plays a vital role in biological stability and diversity, forest regeneration, and community succession [16]. The current forest fire management and ecological compensation policies in China have not yet scientifically quantified the role of vegetation and soil nutrient restoration in burnt sites, and our research is a supplement to this field of study.
From the perspective of scientific evaluation, the identification of recovery times for different traits must be considered when evaluating the dynamics of forest soil nutrients and structure after a forest fire [61], and our paper gives an estimate on this by conducting paired sampling in long-term forest fire sites. From the results of our redundancy analysis, the post-fire recovery years are the most powerful factors for the variations. Therefore, the impact of recovery years on forest community and soil nutrients can be emphasized when assessing the restoration of burnt areas. Previous stand scale studies have shown that burning and harvesting can effectively restore pine–oak woodlands; however, previous studies at the short-term stand scale have provided little insight into the results at the long-term landscape scale [62].
In addition, the burnt area is also an important factor affecting forest restoration. Although the organic layer is largely lost, soil respiration decreases significantly after high-severity fires, while it does not after low-severity fire [17]. Compared with the fire sites with low-severity, the canopy coverage is lower, and the understory coverage is higher after a low-severity fire. After a high-severity fire, the vertical separation between the canopy and understory at the sites is smaller than that after a low-severity fire [63]. If a post-fire forest restoration model is established, post-fire recovery years and the burnt area need to be taken into account.
From the perspective of forest management, our paper found that after about 30 years of post-fire recovery, the tree height, under-branch height, diameter at breast height, and even the richness of tree and shrub reached the level of the control sites. Whether forest fire has a positive or negative impact on the forest ecological environment, vegetation restoration after the fire is an important problem that people face [64]. The fire contributed to an improvement in herb diversity, which decreased to the control level as the recovery time increased, and the year of occurrence of this return to the control level was about 30 years post-fire. Soil TP showed a greater change than carbon and nitrogen. After the fire, Po was reduced, reaching the lowest level after about 35 years post-fire, and then had an upward trend. Inorganic P increased slightly after the fire and began to be lower than the control after about 20 years; it was still lower than the control sites until 45 years after the fire. The variation trend for the soil AP was consistent with that of H-R (Figure 2 and Figure 3), and the change in AP may be related to the change in H-R. A recent meta-analysis showed that plant mixtures increase soil phosphorus availability [65]. Compared with other soil indicators, the change in soil GRSP is more obvious, and the TG was significantly higher than that of the control in the 50 years after the fire. EEG decreased to the control stand level after about 40 years.

4.3. Implications

The paired sampling-derived effects size can be used to identify recovering trends, and the paired T-test can demonstrate the fire’s effects. This is a supplement of previous studies. This study selected 48 pairs of relatively scientific and reasonable plots based on the detailed analysis of more than 1700 forest fires in the Daxing’anling Mts from 1966 to now. However, the trend analysis found that the ratio between the burnt and control sites did not change significantly, mainly because the data in the similar recovery period changed considerably. The reason is that the research was conducted on natural burnt sites and ensuring that other factors are consistent except for fire is challenging. The best way to make up for this uncertainty is to carry out long-term positioning research on fixed sample plots, but from the existing research in China, such long-term fixed sample plots are still lacking. In China, forest fires are strictly prevented and controlled, and the research on long-term fire is insufficient [66]. Future research on fire interference should be strengthened to make post-fire forest restoration more scientific.
Time–space mutual substitution is an essential means to study long-term forest change [48]. This study used this method to study the characteristics of changes in forest community and soil nutrients after 50 years, which had not previously been studied over such a long time scale in the Daxing’anling Mts. For forest fire research, it is difficult to find a large number of burnt sites of different ages in the same area. When searching for burnt plots in a large area, this problem of a large data error will occur, which causes the relevant research results to have greater uncertainty. This research provides a theoretical basis and data support for the efficient utilization of understory vegetation resources and the continued implementation of the Natural Forest Protection Project through the post-fire forest restoration dynamics in the Daxing’anling Mountains.
The fire effects and their recovery tendency strongly interact with geoclimatic conditions. Forest fire occurrence is affected by forest type, geography, time, climate temperature, and other factors, and has obvious time and geographical rules from the landscape to regional scales [67]. Warm and humid areas (such as tropical rainforests) are more affected by fire than cold and dry areas [40]. Our results also suggest that geoclimatic conditions significantly directly affect soil GRSP, plant richness, and tree size in burnt sites. In the future assessment of forest vegetation restoration after the fire, we should fully consider the impact of geoclimatic conditions on vegetation restoration.

5. Conclusions

The post-fire recovery years are a vital factor affecting the dynamic changes in forest communities and soil nutrients in the Daxing’anling Mts. The 50-year recovery period of this study found that tree size was reduced by 25%–48%, and that the plant diversity of arbors and shrubs was mainly reduced, while herb diversity mainly increased. Regarding soil properties, GRSP increased by more than 18%, while organic phosphorus demonstrated a significant decrease (17%). Paired sampling-derived effect size (burn/control ratio) analysis showed that the forest community and soil nutrients recovered to the control level about 30 years after the forest fire in this region. This was relatively shorter than reports in other boreal forests. The possible reason was the low forest quality from overharvesting in history and the low fire severity as a result of China’s fire prevention policy. The results we found showed that the incidence of fires in China is much lower than in the USA, and that the severity and affected areas are much lower than in Russia, Canada, and the USA. The results provide essential data support for the research and evaluation of forest post-fire restoration in the Daxing’anling Mts.

Supplementary Materials

The following supporting information can be downloaded at: https://www.mdpi.com/article/10.3390/f16050806/s1, Table S1: Data statistics of soil nutrient indexes in burnt sites and control sites; Table S2: Data statistics of plant diversity indexes in burnt sites and control sites; Table S3: Data statistics of community structure indexes in burnt sites and control sites; Table S4: Statistical of fitting formula of soil nutrients, plant diversity and community structure.

Author Contributions

Conceptualization, X.Z. and W.W.; methodology, H.W., S.H. and W.W.; software, X.Z., D.S. and K.W.; validation, X.H., P.F. and W.W.; formal analysis, X.Z.; investigation, X.Z., Y.Y., D.S. and K.W.; resources, X.Y., H.W. and S.H.; writing—original draft preparation, X.Z. and D.S.; writing—review and editing, X.Z. and W.W.; visualization, X.Z. and V.G.; supervision, W.W.; funding acquisition, X.Z. and W.W. All authors have read and agreed to the published version of the manuscript.

Funding

This work was supported by Leshan Normal University High-Level Talent Project (RC2023018), Leshan Normal University Scientific Research Cultivation Project (KYPY2025-0020), Sichuan Provincial Science and Technology Plan Project (2023YFN0068), and Zhejiang A&F University Scientific Research and Development Fund Talent Start-up Project (2022LFR120).

Data Availability Statement

Data will be made available on request.

Conflicts of Interest

The authors declare no conflict of interest.

References

  1. Pan, Y.D.; Birdsey, R.A.; Fang, J.Y.; Houghton, R.; Kauppi, P.E.; Kurz, W.A.; Phillips, O.L.; Shvidenko, A.; Lewis, S.L.; Canadell, J.G.; et al. A Large and Persistent Carbon Sink in the World’s Forests. Science 2011, 333, 988–993. [Google Scholar] [CrossRef] [PubMed]
  2. Rodriguez, A.; Duran, J.; Fernandez-Palacios, J.M.; Gallardo, A. Short-term wildfire effects on the spatial pattern and scale of labile organic-N and inorganic-N and P pools. For. Ecol. Manag. 2009, 257, 739–746. [Google Scholar] [CrossRef]
  3. Sun, L.; Dou, X.; Hu, T. Research progress on the effects of forest fire on forest ecosystem C-N-P ecological stoichiometry characteristics. J. Nanjing For. University. Nat. Sci. Ed. 2021, 45, 1–9. [Google Scholar]
  4. Ling, L.; Fu, Y.Y.; Jeewani, P.H.; Tang, C.X.; Pan, S.T.; Reid, B.J.; Gunina, A.; Li, Y.F.; Li, Y.C.; Cai, Y.J.; et al. Organic matter chemistry and bacterial community structure regulate decomposition processes in post-fire forest soils. Soil Biol. Biochem. 2021, 160, 108311. [Google Scholar] [CrossRef]
  5. Liu, X.J.; Pan, C.D. Effects of recovery time after fire and fire severity on stand structure and soil of larch forest in the Kanas National Nature Reserve, Northwest China. J. Arid Land 2019, 11, 811–823. [Google Scholar] [CrossRef]
  6. Running, S.W. Is global warming causing more, larger wildfires? Science 2006, 313, 927–928. [Google Scholar] [CrossRef]
  7. Dieleman, C.M.; Rogers, B.M.; Potter, S.; Veraverbeke, S.; Johnstone, J.F.; Laflamme, J.; Solvik, K.; Walker, X.J.; Mack, M.C.; Turetsky, M.R. Wildfire combustion and carbon stocks in the southern Canadian boreal forest: Implications for a warming world. Glob. Change Biol. 2020, 26, 6062–6079. [Google Scholar] [CrossRef]
  8. Rumpel, C. Soils linked to climate change. Nature 2019, 572, 442–443. [Google Scholar] [CrossRef]
  9. Hu, T.X.; Zhao, B.Q.; Li, F.; Dou, X.; Hu, H.Q.; Sun, L. Effects of fire on soil respiration and its components in a Dahurian larch (Larix gmelinii) forest in northeast China: Implications for forest ecosystem carbon cycling. Geoderma 2021, 402, 115273. [Google Scholar] [CrossRef]
  10. Huang, C.; He, H.S.; Liang, Y.; Wu, Z.W.; Hawbaker, T.J.; Gong, P.; Zhu, Z.L. Long-term effects of fire and harvest on carbon stocks of boreal forests in northeastern China. Ann. For. Sci. 2018, 75, 42. [Google Scholar] [CrossRef]
  11. Perez-Valera, E.; Verdu, M.; Navarro-Cano, J.A.; Goberna, M. Soil microbiome drives the recovery of ecosystem functions after fire. Soil Biol. Biochem. 2020, 149, 107948. [Google Scholar] [CrossRef]
  12. Dai, Z.M.; Lv, X.F.; Ma, B.; Chen, N.; Chang, S.X.; Lin, J.H.; Wang, X.H.; Su, W.Q.; Liu, H.T.; Huang, Y.L.; et al. Concurrent and rapid recovery of bacteria and protist communities in Canadian boreal forest ecosystems following wildfire. Soil Biol. Biochem. 2021, 163, 108452. [Google Scholar] [CrossRef]
  13. Liu, B.; Biswas, S.R.; Yang, J.; Lite, Z.H.; He, H.S.; Liang, Y.; Lau, M.K.; Fang, Y.T.; Han, S.J. Strong influences of stand age and topography on post-fire understory recovery in a Chinese boreal forest. For. Ecol. Manag. 2020, 473, 118307. [Google Scholar] [CrossRef]
  14. Yang, G.; Di, X.-Y.; Zeng, T.; Shu, Z.; Wang, C.; Yu, H.-Z. Prediction of area burnt under climatic change scenarios: A case study in the Great Xing’an Mountains boreal forest. J. For. Res. 2010, 21, 213–218. [Google Scholar] [CrossRef]
  15. Hu, H.; Wei, S.; Sun, L. Estimation of carbon emissions due to forest fire in Daxingan Mountains from 1965 to 2010. Acta Phytoecol. Sin. 2012, 36, 629–644. [Google Scholar]
  16. Jayen, K.; Leduc, A.; Bergeron, Y. Effect of fire severity on regeneration success in the boreal forest of northwest Quebec, Canada. Ecoscience 2006, 13, 143–151. [Google Scholar] [CrossRef]
  17. Kelly, J.; Ibanez, T.S.; Santin, C.; Doerr, S.H.; Nilsson, M.C.; Holst, T.; Lindroth, A.; Kljun, N. Boreal forest soil carbon fluxes one year after a wildfire: Effects of burn severity and management. Glob. Change Biol. 2021, 27, 4181–4195. [Google Scholar] [CrossRef]
  18. Feng, X.; Merow, C.; Liu, Z.H.; Park, D.S.; Roehrdanz, P.R.; Maitner, B.; Newman, E.A.; Boyle, B.L.; Lien, A.; Burger, J.R.; et al. How deregulation, drought and increasing fire impact Amazonian biodiversity. Nature 2021, 597, 516–521. [Google Scholar] [CrossRef]
  19. Han, J.; Ying, L.; Li, G.; Shen, Z. Spatial patterns of species diversity in the herb layer of early post-fire regeneration in mixed Pinus yunnanensis forests. Chin. J. Plant Ecol. 2016, 40, 200–211. [Google Scholar]
  20. Zhao, H.M.; Tong, D.Q.; Lin, Q.X.; Lu, X.G.; Wang, G.P. Effect of fires on soil organic carbon pool and mineralization in a Northeastern China wetland. Geoderma 2012, 189, 532–539. [Google Scholar] [CrossRef]
  21. Weng, Y.T.; Yang, G.; Wang, L.X.; Quan, X.K.; Di, X.Y.; Yu, H.Z.; Han, D.D. Changes in water-soluble nitrogen and organic carbon in the post-fire litter layer of Dahurian larch forests. Plant Soil 2021, 464, 131–148. [Google Scholar] [CrossRef]
  22. Dove, N.C.; Taş, N.; Hart, S.C. Ecological and genomic responses of soil microbiomes to high-severity wildfire: Linking community assembly to functional potential. ISME J. 2022, 16, 1853–1863. [Google Scholar] [CrossRef] [PubMed]
  23. Zhang, L.J.; Ma, B.; Tang, C.X.; Yu, H.D.; Lv, X.F.; Rodrigues, J.L.M.; Dahlgren, R.A.; Xu, J.M. Habitat heterogeneity induced by pyrogenic organic matter in wildfire-perturbed soils mediates bacterial community assembly processes. ISME J. 2021, 15, 1943–1955. [Google Scholar] [CrossRef]
  24. Gao, C.Y.; He, J.B.; Zhang, Y.; Cong, J.X.; Han, D.X.; Wang, G.P. Fire history and climate characteristics during the last millennium of the Great Hinggan Mountains at the monsoon margin in northeastern China. Glob. Planet. Change 2018, 162, 313–320. [Google Scholar] [CrossRef]
  25. Song, Z.P.; Tian, H.X.; Li, Z.L.; Luo, Y.Q.; Liu, Y.H. Changes in plant nutrient utilization during ecosystem recovery after wildfire. J. Environ. Manag. 2021, 295, 112994. [Google Scholar] [CrossRef]
  26. Kong, F.; Li, X.; Wang, X.; Shi, B.; Gao, Z. Advance in study on the forest restoration in the burnt blank. Chin. J. Ecol. 2003, 22, 60–64. [Google Scholar]
  27. Chen, J.; Di, X.-Y. Forest fire prevention management legal regime between China and the United States. J. For. Res. 2015, 26, 447–455. [Google Scholar] [CrossRef]
  28. Xiong, Q.; Luo, X.; Liang, P.; Xiao, Y.; Xiao, Q.; Sun, H.; Pan, K.; Wang, L.; Li, L.; Pang, X. Fire from policy, human interventions, or biophysical factors? Temporal–spatial patterns of forest fire in southwestern China. For. Ecol. Manag. 2020, 474, 118381. [Google Scholar] [CrossRef]
  29. Li, W.-k.; Yin, J.-y.; Guo, Z.-q.; Guo, Y.-j.; Hu, T.-x. Analysis of forest fires in representative countries and regions in the world in 2019. Fire Sci. Technol. 2020, 39, 1280–1284. [Google Scholar]
  30. Wang, Y.Y.; Wen, H.; Wang, K.; Sun, J.X.; Yu, J.H.; Wang, Q.G.; Wang, W.J. Forest plant and macrofungal differences in the Greater and Lesser Khingan Mountains in Northeast China: A regional-historical comparison and its implications. J. For. Res. 2022, 33, 623–641. [Google Scholar] [CrossRef]
  31. Wang, Q.; Wang, W.; He, X.; Zhou, W.; Zhai, C.; Wang, P.; Tang, Z.; Wei, C.; Zhang, B.; Xiao, L.; et al. Urbanization-induced glomalin changes and their associations with land-use configuration, forest characteristics, and soil properties in Changchun, Northeast China. J. Soils Sediments 2019, 19, 2433–2444. [Google Scholar] [CrossRef]
  32. Wang, Q.; Wang, W.J.; Zhong, Z.L.; Wang, H.M.; Fu, Y.J. Variation in glomalin in soil profiles and its association with climatic conditions, shelterbelt characteristics, and soil properties in poplar shelterbelts of Northeast China. J. For. Res. 2020, 31, 279–290. [Google Scholar] [CrossRef]
  33. Wang, Y.; Zhang, Y.; Yu, N.; Zou, H. Effect of control lower limit of subsurface irrigation on phosphorus distribution in soil profiles of protected land. Trans. Chin. Soc. Agric. Eng. 2009, 25, 66–70. [Google Scholar]
  34. Bei, Z.; Zhang, Q.; Zheng, W.; Yang, L.; Chen, Y.; Yang, Y. Effects of simulated warming on soil phosphorus availability in subtropical Chinese fir plantation. Acta Ecol. Sin. 2018, 38, 1106–1113. [Google Scholar]
  35. Zhao, S.; Yu, W.; Zhang, L.; Shen, S. Latitudinal differentiation of phosphorus in black soil in Northeast of China. Trans. Chin. Soc. Agric. Eng. 2005, 21, 34–37. [Google Scholar]
  36. Wright, S.F.; Upadhyaya, A. A survey of soils for aggregate stability and glomalin, a glycoprotein produced by hyphae of arbuscular mycorrhizal fungi. Plant Soil 1998, 198, 97–107. [Google Scholar] [CrossRef]
  37. Laxton, R.R. The measure of diversity. J. Theor. Biol. 1978, 70, 51–67. [Google Scholar] [CrossRef]
  38. Zhang, X.; Zhang, J.; Xiao, L.; Chen, S.; Zhong, Z.; Gao, W.; Wang, W. Characteristics of plant diversity and community structure in Duobukuer Nature Reserve in Daxing′anling area. Acta Ecol. Sin. 2022, 42, 176–185. [Google Scholar]
  39. Yao, M.; Rui, J.; Niu, H.; Heděnec, P.; Li, J.; He, Z.; Wang, J.; Cao, W.; Li, X. The differentiation of soil bacterial communities along a precipitation and temperature gradient in the eastern Inner Mongolia steppe. CATENA 2017, 152, 47–56. [Google Scholar] [CrossRef]
  40. Li, J.; Pei, J.; Liu, J.; Wu, J.; Li, B.; Fang, C.; Nie, M. Spatiotemporal variability of fire effects on soil carbon and nitrogen: A global meta-analysis. Glob. Change Biol. 2021, 27, 4196–4206. [Google Scholar] [CrossRef]
  41. Kong, J.; Zhang, H.; Jing, S. Dynamic characteristics of forest soil phosphorus in the early succession after fire in Great Xing’an Mountains. Chin. J. Ecol. 2017, 36, 1515–1523. [Google Scholar]
  42. Chen, S.; Zhou, Z.; Tsang, D.C.W.; Wang, J.; Gao, Y. Glomalin-related soil protein reduces the sorption of polycyclic aromatic hydrocarbons by soils. Chemosphere 2020, 260, 127603. [Google Scholar] [CrossRef] [PubMed]
  43. Dove, N.C.; Klingeman, D.M.; Carrell, A.A.; Cregger, M.A.; Schadt, C.W. Fire alters plant microbiome assembly patterns: Integrating the plant and soil microbial response to disturbance. New Phytol. 2021, 230, 2433–2446. [Google Scholar] [CrossRef]
  44. Meng, M.; Wang, B.; Zhang, Q.; Tian, Y. Driving force of soil microbial community structure in a burnt area of Daxing’anling, China. J. For. Res. 2021, 32, 1723–1738. [Google Scholar] [CrossRef]
  45. Su, W.Q.; Tang, C.X.; Lin, J.H.; Yu, M.J.; Dai, Z.M.; Luo, Y.; Li, Y.; Xu, J.M. Recovery patterns of soil bacterial and fungal communities in Chinese boreal forests along a fire chronosequence. Sci. Total Environ. 2022, 805, 150372. [Google Scholar] [CrossRef]
  46. Ammitzboll, H.; Jordan, G.J.; Baker, S.C.; Freeman, J.; Bissett, A. Contrasting successional responses of soil bacteria and fungi to post-logging burn severity. For. Ecol. Manag. 2022, 508, 120059. [Google Scholar] [CrossRef]
  47. Zhou, S.; Zhang, Y.; Cui, X. Temporal and spatial dynamics of soil available potassium in a post-fire Larix gmelinii forest. J. Nanjing For. Univ. Nat. Sci. Ed. 2020, 44, 141–147. [Google Scholar]
  48. Wang, L.; Xin, Y.; Zou, M.; Zhao, Y.; Liu, S.; Ren, Q. Plants diversity and biomass distribution of vegetation restoration in burnt area of Great Xing’ an Mountains. J. Beijing For. Univ. 2015, 37, 41–47. [Google Scholar]
  49. Wang, D.; Wang, Z.; Feng, Q.; Shu, Y.; Zhou, M.; Zhao, P. Species Composition and Diversity of Severe Burnt Phytocoenosium After Different Regenerate Years. Bull. Soil Water Conserv. 2017, 37, 56–61. [Google Scholar]
  50. Nilsson, M.C.; Wardle, D.A. Understory vegetation as a forest ecosystem driver: Evidence from the northern Swedish boreal forest. Front. Ecol. Environ. 2005, 3, 421–428. [Google Scholar] [CrossRef]
  51. Bian, B.; Guo, Q.; Ci, B.; Luo, D. Effects of gap in primitive subalpine fir forest on diversity of herd and shrub in tibet. J. Appl. Ecol. 2004, 15, 191–194. [Google Scholar]
  52. Tepley, A.J.; Thomann, E.; Veblen, T.T.; Perry, G.L.W.; Holz, A.; Paritsis, J.; Kitzberger, T.; Anderson-Teixeira, K.J. Influences of fire-vegetation feedbacks and post-fire recovery rates on forest landscape vulnerability to altered fire regimes. J. Ecol. 2018, 106, 1925–1940. [Google Scholar] [CrossRef]
  53. Boucher, Y.; Perrault-Hebert, M.; Fournier, R.; Drapeau, P.; Auger, I. Cumulative patterns of logging and fire (1940-2009): Consequences on the structure of the eastern Canadian boreal forest. Landsc. Ecol. 2017, 32, 361–375. [Google Scholar] [CrossRef]
  54. Fischer, R. The Long-Term Consequences of Forest Fires on the Carbon Fluxes of a Tropical Forest in Africa. Appl. Sci. 2021, 11, 4696. [Google Scholar] [CrossRef]
  55. Chu, T.; Guo, X.L.; Takeda, K. Effects of Burn Severity and Environmental Conditions on Post-Fire Regeneration in Siberian Larch Forest. Forests 2017, 8, 76. [Google Scholar] [CrossRef]
  56. Zhang, Y.J.; Wu, Z.W.; Gu, X.L.; Fu, J.J.; Yan, S.J. Effects of fire severity and recovery time on organic carbon content of forest soil in Great Xing’an Mountains, China. Chin. J. Appl. Ecol. 2018, 29, 2455–2462. [Google Scholar] [CrossRef]
  57. Zhang, X.; Zhang, J.; Li, S.; Zhong, Z.; Hu, X.; Wang, W. Characteristics of plant diversity and community structure in Shuanghe Nature Reserve in Daxing’anling area of northeastern China. J. Beijing For. Univ. 2021, 43, 79–87. [Google Scholar] [CrossRef]
  58. Wang, w.; Wang, K.; Wang, Y.; Wen, H.; Yu, J.; Wang, Q.; Han, S. Comparative study on tree, shrub and herb composition and carbon sink function between coniferous and broadleaved forests in Northeast China. J. Beijing For. Univ. 2022, 44, 52–67. [Google Scholar] [CrossRef]
  59. Gong, D.; Yan, C.; Guo, Z. Vegetation Regeneration After Grassland Fire Based on Remote Sensing Index. J. Northwest For. Univ. 2021, 36, 204–210. [Google Scholar]
  60. Ramo, R.; Roteta, E.; Bistinas, I.; van Wees, D.; Bastarrika, A.; Chuvieco, E.; van der Werf, G.R. African burnt area and fire carbon emissions are strongly impacted by small fires undetected by coarse resolution satellite data. Proc. Natl. Acad. Sci. USA 2021, 118, e2011160118. [Google Scholar] [CrossRef]
  61. Chen, Y.; Yang, Y.; Zhang, X.; Yang, Y.; Wang, H.; Wang, W. Effects of after-burning rehabilitation times on soil phosphorus and its availability in the Daxing’anling forests. Acta Ecol. Sin. 2019, 39, 7977–7986. [Google Scholar]
  62. Jin, W.; He, H.S.; Shifley, S.R.; Wang, W.J.; Kabrick, J.M.; Davidson, B.K. How can prescribed burning and harvesting restore shortleaf pine-oak woodland at the landscape scale in central United States? Modeling joint effects of harvest and fire regimes. For. Ecol. Manag. 2018, 410, 201–210. [Google Scholar] [CrossRef]
  63. Barker, J.W.; Price, O.F.; Jenkins, M.E. High severity fire promotes a more flammable eucalypt forest structure. Austral Ecol. 2022, 47, 519–529. [Google Scholar] [CrossRef]
  64. Buisson, E.; Archibald, S.; Fidelis, A.; Suding, K.N. Ancient grasslands guide ambitious goals in grassland restoration. Science 2022, 377, 594–598. [Google Scholar] [CrossRef]
  65. Chen, X.L.; Chen, H.Y.H.; Chang, S.X. Meta-analysis shows that plant mixtures increase soil phosphorus availability and plant productivity in diverse ecosystems. Nat. Ecol. Evol. 2022, 6, 1112–1121. [Google Scholar] [CrossRef]
  66. Ning, J.; Yang, G.; Liu, X.; Geng, D.; Wang, L.; Li, Z.; Zhang, Y.; Di, X.; Sun, L.; Yu, H. Effect of fire spread, flame characteristic, fire intensity on particulate matter 2.5 released from surface fuel combustion of Pinus koraiensis plantation—A laboratory simulation study. Environ. Int. 2022, 166, 107352. [Google Scholar] [CrossRef]
  67. Cui, Y.; Di, H.; Xing, Y.; Chang, X.; Shan, W. Spatial and temporal distributions of forest fires in Heilongjiang Province from 2001 to 2018 based on MODIS data. J. Nanjing For. University. Nat. Sci. Ed. 2021, 45, 205–211. [Google Scholar]
Figure 1. Fire occurrence distribution (a), sampling plot selection (b), fire incidence and burnt area from 1967–2016 (c) in Daxing’anling Mts.
Forests 16 00806 g001
Figure 2. Effects of post-fire recovery years on soil nutrients. (a) Soil organic carbon; (b) total nitrogen; (c) total phosphorus; (d) available phosphorus; (e) organic phosphorus; (f) inorganic phosphorus; (g) total glomalin-related soil protein; (h) easily-extracted glomalin-related soil protein. The cubic equation was used in the best-fitting of the temporal changes, and the best-fitting coefficient can be found in Table S4.
Forests 16 00806 g002
Figure 3. Effects of post-fire recovery years on plant diversity. (a) Arbor richness; (b) arbor Simpson index; (c): arbor Shannon–wiener index; (d) shrub richness; (e) shrub Simpson index; (f) shrub Shannon–Wiener index; (g) herb richness; (h) herb Simpson index; (i) herb Shannon–Wiener index. The cubic equation was used in the best-fitting of the temporal changes, and the best-fitting coefficient can be found in Table S4.
Forests 16 00806 g003
Figure 4. Effects of post-fire recovery years on community structure. (a) Arbor height; (b) arbor diameter at the breast height; (c) arbor clear bole height; (d) shrub height; (e) shrub ground diameter; (f) shrub crown width; (g) shrub coverage; (h) herb height; (i) herb coverage. The cubic equation was used in the best-fitting of the temporal changes, and the best-fitting coefficient can be found in Table S4.
Forests 16 00806 g004
Figure 5. The coupling relationships between soil properties, plant diversity, community structure and soil fire conditions, and geoclimatic conditions in burnt sites (a) and ordination between their relative changes (burnt/control) (b). Abbreviations: SOC: soil organic carbon, TN: total nitrogen, AP: available phosphorus, Po: organic phosphorus, Pi: inorganic phosphorus, EEG: easily extractable GRSP, TG: total GRSP, A-Richness: arbor richness, A-Shannon: arbor Shannon–Wiener index, A-Simpson: arbor Simpson index, S-Richnes: shrub richness, S-Shannon: shrub Shannon–Wiener index, S-Simpson: shrub Simpson index, H-Richness: herb richness, H-Shannon: herb Shannon–Wiener index, H-Simpson: herb Simpson index, AH: arbor height, ACBH: arbor clear bole height, ADBH: arbor diameter at breast height, SH: shrub height, SCD: shrub crown width, SC: shrub coverage, SGD: shrub ground diameter, HH: herb height, HC: herb coverage, Sp: slope position, Aos: aspect of slope, MAT: mean annual temperature, MAP: mean annual precipitation, Years: post-fire recovery years, Ba: burnt area. Bold indicated significant factors in simple term effects and conditional term effects (p < 0.05).
Forests 16 00806 g005
Figure 6. The partial least squares path model (PLS-PM) analysis of fire conditions and geoclimatic conditions on forest restoration (including soil P, GPSP, plant richness, and tree size) in burnt sites (a) and burnt/control ratio (b). Note: The width of the arrows indicates the strength of the causal influence. Solid arrows indicate p < 0.05, and dashed arrows indicate p > 0.05. Models with different structures were assessed using the goodness of fit (GoF) statistic, a measure of the overall prediction performance.
Forests 16 00806 g006
Figure 7. Fire characteristics in the studied region from 1967 to 2016. Left (lightning-related fires) and right (human mistake-related fires). (a) Lightning-related fire percentage; (b) human mistake-related fire percentage; (c) lightning-related fire incidence; (d) human mistake-related fire incidence; (e) mean lightning fire burnt area; (f) mean human mistake-related fire burnt area.
Forests 16 00806 g007
Table 1. Statistical data of fire incidence in history in the Daxing’anling Mts and the plots selected in this paper.
Year ElapsedFire Features from 1967–2016 Selected Plot
Time PeriodFire FrequencyTotal Burnt Area (ha)Plot Number in This PaperTotal Burnt Area (ha)
1–52012–20161331615.015296.73
5–102007–201110945,539.5151246.92
10–201997–20064461,110,409.3384826.92
20–301987–19961791,162,317.3714448,359.4
30–401977–19864731,672,661.27860,008.4
40–501967–19764061,835,516.66811,806.76
Table 2. Statistics of forest indicators in burnt and control sites.
Burnt Controlp-Level
Soil nutrientsSOC (g·kg−1)89.93 ± 8.3881.92 ± 7.220.21
TN (g·kg−1)2.76 ± 0.322.81 ± 0.280.48
TP (g·kg−1)0.88 ± 0.070.97 ± 0.090.19
AP (mg·kg−1)25.85 ± 2.9030.11 ± 3.220.27
Po (g·kg−1)0.15 ± 0.010.18 ± 0.020.01
Pi (g·kg−1)0.73 ± 0.070.78 ± 0.080.36
TG (g·kg−1)19.23 ± 1.0916.25 ± 0.960.007
EEG (g·kg−1)1.33 ± 0.081.02 ± 0.070.004
Plant diversityA-Simpson0.32 ± 0.040.37 ± 0.030.16
A-Shannon0.56 ± 0.060.64 ± 0.060.23
A-R2.54 ± 0.233.12 ± 0.240.02
S-Simpson0.48 ± 0.060.58 ± 0.040.12
S-Shannon0.72 ± 0.090.77 ± 0.070.59
S-R1.91 ± 0.202.52 ± 0.270.03
H-Simpson0.73 ± 0.030.64 ± 0.030.01
H-Shannon1.80 ± 0.101.75 ± 0.110.64
H-R6.93 ± 0.616.14 ± 0.450.10
Community structureAH (m) 10.01 ± 1.0313.58 ± 0.460.009
ACBH (m)9.00 ± 0.9111.94 ± 0.580.003
ADBH (cm)4.47 ± 0.528.52 ± 0.550.008
SH (m)0.64 ± 0.060.57 ± 0.050.28
SC (%)20.08 ± 2.2723.26 ± 2.450.30
SCD (m)0.16 ± 0.030.18 ± 0.030.53
SGD (cm)0.68 ± 0.090.67 ± 0.140.94
HH (cm)21.45 ± 1.8522.62 ± 1.410.47
HC (%) 10.00 ± 1.128.42 ± 0.910.28
Abbreviations, SOC: soil organic carbon, TN: total nitrogen, AP: available phosphorus, Po: organic phosphorus, Pi: inorganic phosphorus, EEG: easily extractable GRSP, TG: total GRSP, A-Richness: arbor richness, A-Shannon: arbor Shannon, A-Simpson: arbor Simpson, S-Richnes: shrub richness, S-Shannon: shrub Shannon, S-Simpson: shrub Simpson, H-Richness: herb richness, H-Shannon: herb Shannon, H-Simpson: herb Simpson, AH: arbor height, ACBH: arbor clear bole height, ADBH: arbor diameter at breast height, SH: shrub height, SCD: shrub crown width, SC: shrub coverage, SGD: shrub ground diameter, HH: herb height, HC: herb coverage.
Table 3. Comparison of forest fire incidence and burnt area from 2014 to 2019. Data are from National Forestry and Grassland Administration, China, Russian Federal State Statistic Service, forest fire database in the Mediterranean region of France, Natural Resources Canada, the National Oceanic and Atmospheric Administration of the United States, and cited from Li, Yin, Guo, Guo and Hu [29]).
Incidence/YearBurnt Area/Year (hm2)Burnt Area/Time (hm2)
RangeMeanRangeMean
USA50,500–71,00060,7501.49 × 106–4.1 × 1062,795,00046
Russia11,700–22,00016,8502.8 × 106–1.0 × 1076,400,000380
Canada4090–720056451.4 × 106–4.55 × 1062,975,000527
China2000–475033756 × 103–2.5 × 10415,5005
Mediterranean region of France 1050–235017003 × 103–2 × 10411,5007
Disclaimer/Publisher’s Note: The statements, opinions and data contained in all publications are solely those of the individual author(s) and contributor(s) and not of MDPI and/or the editor(s). MDPI and/or the editor(s) disclaim responsibility for any injury to people or property resulting from any ideas, methods, instructions or products referred to in the content.

