1. Introduction
Remote sensing has become an indispensable tool in the monitoring and management of fires, especially wildfires, offering timely data crucial for both prediction and mitigation strategies [
1,
2]. Previous studies have focused on different regions like Canada, Australia [
3,
4,
5,
6], Africa [
7,
8], and Northern India [
9,
10] where climate and soil conditions are very different from tropical areas. These works have focused predominantly on temperate regions, identifying key variables such as temperature, vegetation dryness, and human activity as significant precursors to fire occurrences [
11,
12]. These variables have been quantified using various indices like the Normalized Difference Vegetation Index (NDVI) and the Enhanced Vegetation Index (EVI) [
13,
14,
15,
16,
17], which are effective in predicting the likelihood of fires in these specific climates.
However, the dynamics of fire in tropical regions, which are subject to different climatic and ecological conditions, may differ significantly from those in temperate zones [
18]. This disparity is further highlighted by recent studies indicating that South America is experiencing severe impacts from climate change, including a pronounced rise in temperatures in some regions and an increase in drought occurrences and weather conditions associated with enhanced fire risk [
19]. These findings underscore the urgency of understanding fire precursors in tropical regions.
Wildfire ignition is significantly influenced by both natural factors like lightning [
20] and anthropogenic activities. Lightning is a major natural ignition source for wildfires globally, accounting for a substantial proportion of fire occurrences in certain regions [
21], a phenomenon that is expected to rise due to the increasing occurrence of lightning in the context of climate change [
22]. Specific meteorological conditions, such as those associated with long-continuing-current lightning, have been linked to an increased likelihood of lightning-induced wildfires [
23,
24]. For instance, studies in Arizona, New Mexico, Florida, and the Mediterranean Basin have identified preferential meteorological conditions that facilitate lightning-ignited fires [
23,
24]. In tropical regions, the high frequency of thunderstorms combined with abundant biomass can lead to a higher incidence of lightning-induced wildfires [
18].
Human activity is another critical factor in wildfire ignition, especially in tropical areas where land-use practices such as slash-and-burn agriculture, deforestation, and accidental ignitions play a significant role [
7,
18]. In many tropical ecosystems, human-induced fires surpass natural ignitions, leading to alterations in fire regimes and ecosystem dynamics [
25]. The interaction between human activities and meteorological variables, such as prolonged dry seasons and increased temperatures, can exacerbate fire risk and intensity [
26].
Understanding the roles of lightning and human activity in wildfire ignition, along with their relationships to meteorological precursors, is essential for developing comprehensive fire management strategies. However, this study does not directly analyze these ignition sources and instead focuses on identifying fire precursors detectable through remote sensing. Future research should integrate data on lightning occurrence and human activity patterns to enhance predictive models and mitigation efforts in tropical regions.
This study aims to fill the gap in the literature by focusing specifically on tropical regions, where factors such as seasonal rainfall variability, unique vegetation types, and different patterns of land use may alter the traditional predictors of fire risk [
25,
27]. By adapting remote sensing techniques to these distinct environmental conditions, this paper seeks to identify and validate the fire precursors for tropical ecosystems, potentially offering more information for future prediction models for fire precursors in these areas.
Prior research has not sufficiently explored these aspects in tropical regions [
8,
9,
28,
29,
30], and thus, this study’s findings could provide crucial insights for regional fire management strategies and enhance our understanding of fire ecology in diverse biomes. The application of remote sensing in this new context promises to reveal vital information that could lead to more effective and targeted fire prevention measures in tropical regions [
31]. Furthermore, previous research has classified regions based on the main fire risk variables into top-down and bottom-up groups, where South America was identified mainly as top-down, with potential evaporation, vapor pressure deficit, and aridity anomaly index being the main fire precursors [
11,
30]. Similarly, other studies have based fire risk assessment on precipitation [
32,
33].
Studying the preconditions of tropical region fires in Antioquia, Colombia is particularly important in a global context because tropical regions are critical for global biodiversity and carbon sequestration [
34,
35]. Fires in these areas can lead to significant ecological and climatic impacts, contributing to global warming and loss of biodiversity [
18,
35]. Understanding fire precursors in Antioquia can provide valuable insights for fire management, prediction, and prevention in similar tropical regions worldwide, helping to protect these vital ecosystems and mitigate global climate change [
28].
The variables used in this study are the fires, the EVI, land classes, and weather and soil variables. We use the EVI since NDVI data has different drawbacks, including its dependency on the time of day [
13,
36]. Since the NDVI does not correct for changes in solar incidence angle, the results are not consistent throughout the day. NDVI inaccuracies are also related to shadowing, air moisture, and variations in the soil [
15]. In contrast, the Enhanced Vegetation Index (EVI) uses additional wavelengths of light. Variations in the solar incidence angle, distortions in the reflected light, and signals from the ground cover below the vegetation are corrected for using the EVI [
13,
14,
15,
16,
17].
Previous research has identified different fire precursors. In Northern India, which includes Himalayan temperate forests and subtropical pine forests, vapor pressure, the NDVI, and the topographical wetness index have been used as indicators of fire risk, along with human activity [
9,
10].
In [
30,
37], two types (top-down and bottom-up precursors) of world locations are classified according to different types of fire precursors. In the top-down group, potential evaporation is the most crucial indicator of fire risk, followed by vapor pressure deficit, the aridity anomaly index, maximum temperature, and wind. In the bottom-up group, the soil water deficit index is the most crucial indicator of fire risk, followed by gross primary production, the EVI, photosynthetically active radiation, and the NDVI. South America is classified in the top-down group. A comparison and explanatory analysis between these precursors and this work is presented.
The main challenges of this type of study are data availability, collection, and pre-processing. More historical data is usually a limitation in this type of study [
9,
38]. The different time and spatial resolutions pose a challenge to address multivariable analysis since different data are collected in different places with different resolutions and time windows, requiring alignment [
1]. Moreover, due to the volume of the data, data collection usually requires coding to call the available APIs [
39].
For the same reason, processing all the required variables simultaneously for analysis requires high computational capabilities. For instance, processing only 10 variables for each hour of each day over a 4-year time window for a study region of 200 km × 200 km with a grid resolution of 1 km involves data slots.
The second big challenge is the lack of data for some world regions. There is a very limited number of ground stations in countries with extensive forested areas, especially in South America [
28]. Compared to other regions like Canada, Australia, the USA, and Europe, South America also has limited satellite coverage [
40]. This creates significant gaps in the data, preventing exhaustive analysis like that required for neural network training. In this study, the data gaps are addressed by modeling.
This work aims to identify fire precursors and related trends that can be identified by remote sensing analysis. Different satellite data are employed to identify the average pre-fire conditions, including the EVI, land class, weather and soil variables, and temporal and spatial trends. A correlation and comparison against literature results are performed.
An average air temperature increase of
, wind speed of
m/s, and soil temperature of
is found, along with a reduction in relative humidity of
, while the precipitation and soil moisture analysis did not show conclusive results. The most consistent trend is the increase in soil and air temperature and the reduction in humidity, while the least consistent trend is the wind speed—also reported in other research [
30,
41]—along with the precipitation and the reduction in the EVI. The latter observation is strengthened by the correlation study, where air and soil temperature are strongly linked in pre-fire conditions, followed by a reduction in humidity with an increase in air temperature.
The contributions of this paper are summarized as follows:
We have conducted a statistical analysis of fire precursors in the tropical region of Antioquia, Colombia. This analysis adds valuable insights to the limited literature on fire risk in such climates and geographical conditions.
Our findings support the literature on fire precursors regarding potential evaporation, which relates to our study regarding the wind speed and humidity, and the high vapor pressure deficit, which relates to our finding in air temperature and humidity. Moreover, a aridity anomaly index score as a fire precursor in the literature is validated with our findings regarding the relation with air temperature, soil temperature, precipitation and soil moisture.
The analysis reveals that wind speed, precipitation, and EVI reduction exhibit the least consistency as fire precursors. This contrasts with their role as primary fire precursors in other regions, highlighting the variability in wildfire drivers across different environments.
Although some of the analyzed variables are well-established fire precursors, we have quantified their mean variations in this tropical region. This information can aid in wildfire risk management and the development of national policies.
2. Materials and Methods
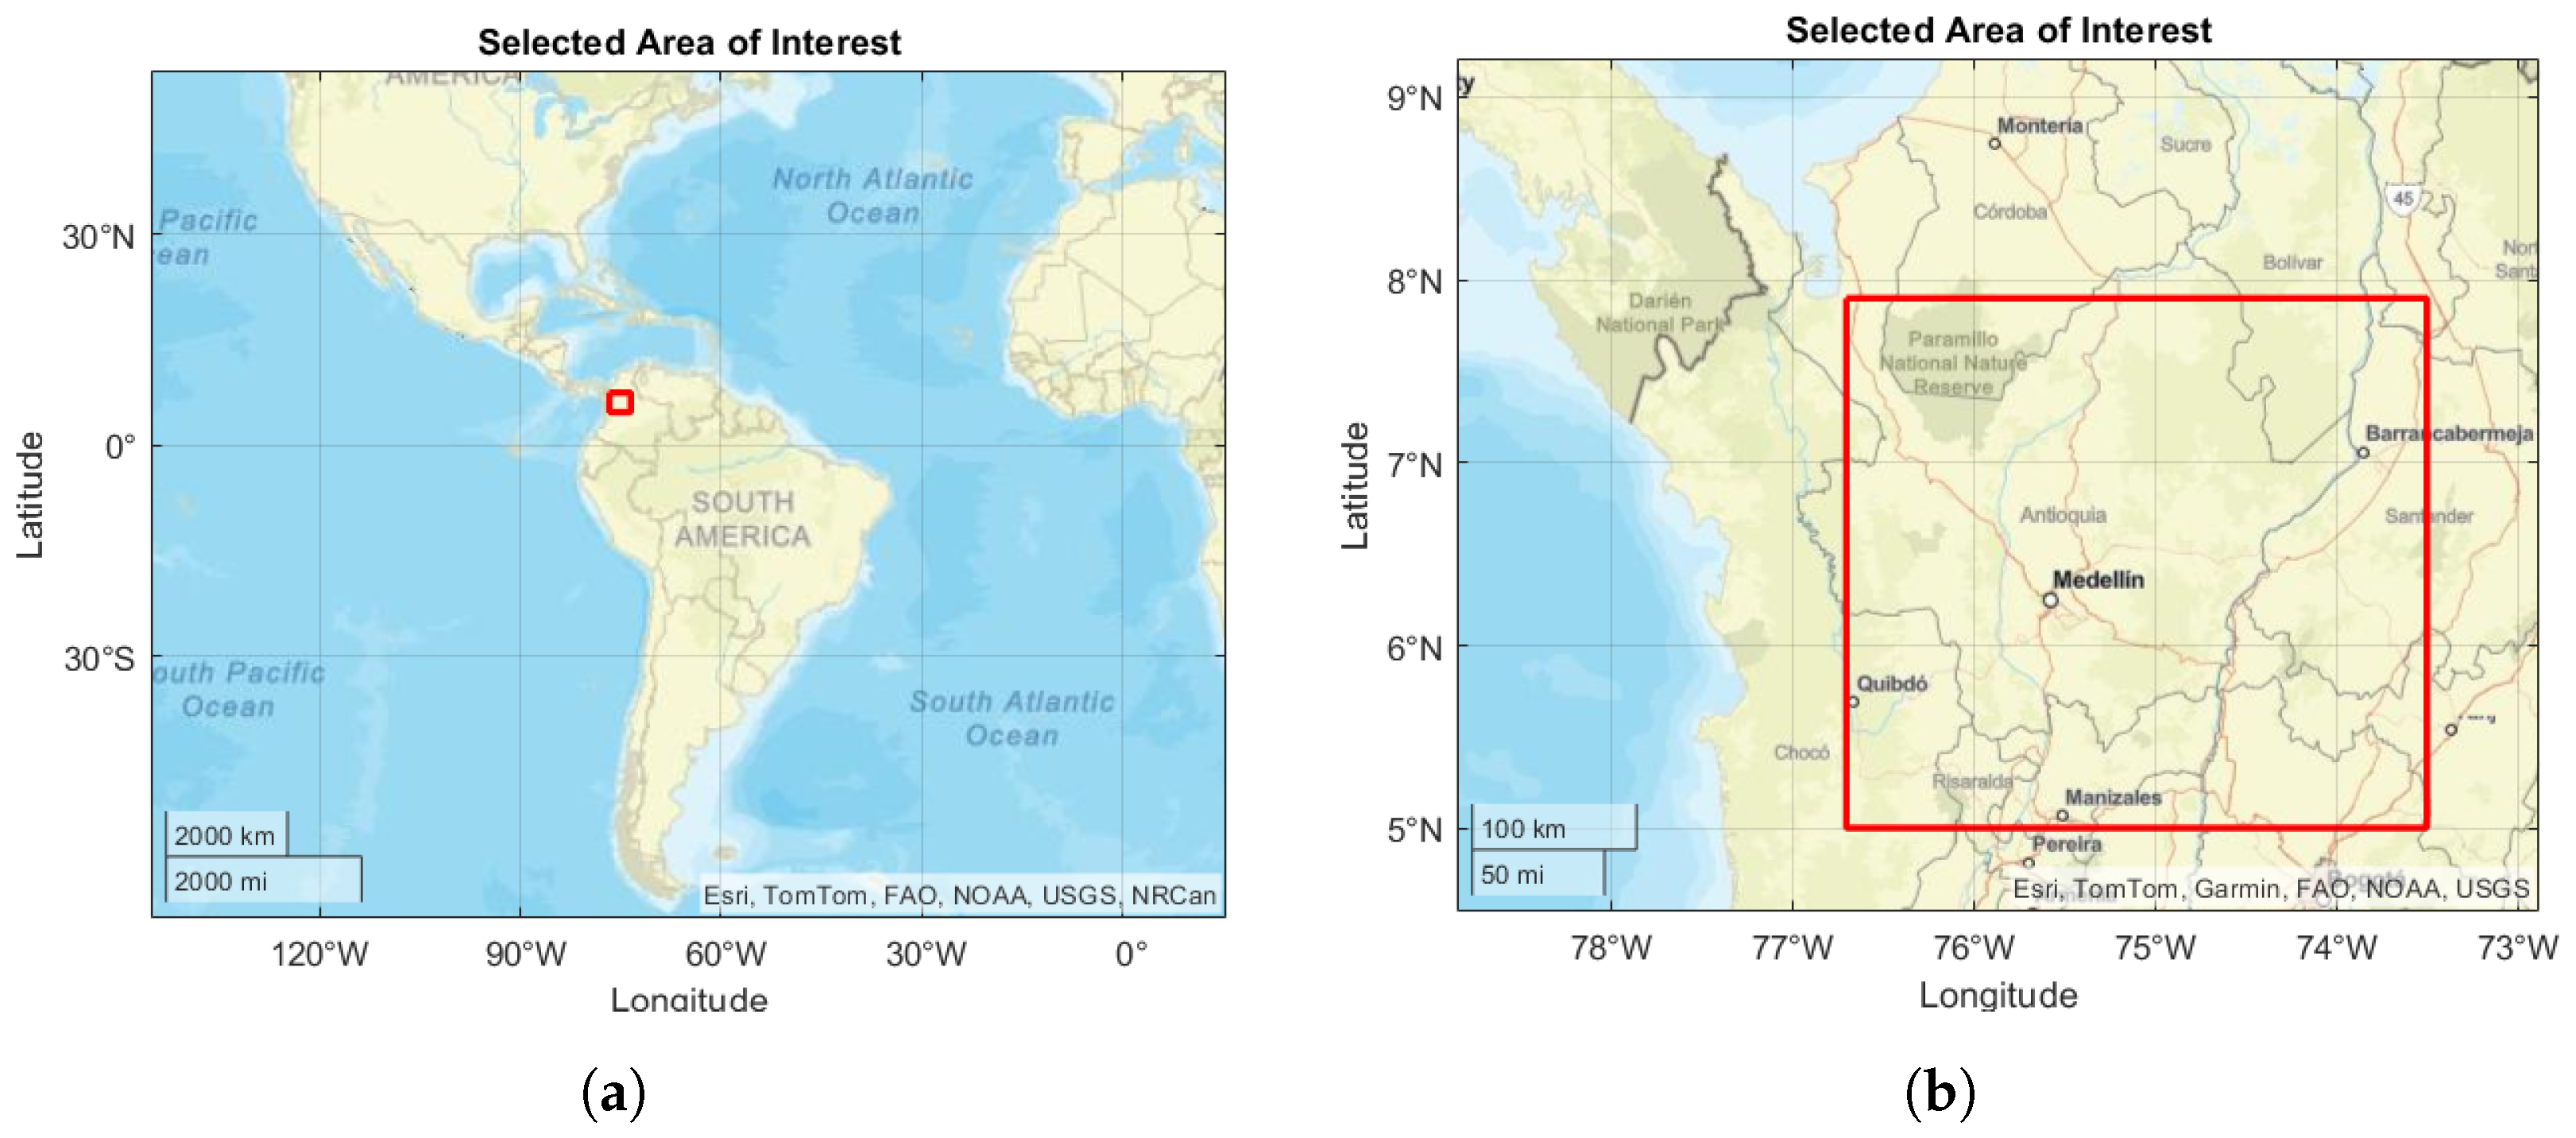
In this paper, the tropical region of Antioquia, Colombia, and its surroundings are studied. This region is special since its located just above the equator line, with very high indices of vegetation and high precipitation. This is the opposite scenario to that of other studied areas like Australia or Canada.
The specific geographic coordinates of the area of study are defined as follows: West −76.5°, North 7.9°, East −73.3°, and South 5°. The area of study is shown in
Figure 1.
All the data are retrieved in the period from 1 January 2020 to 19 December 2023, using a time window of 4 years. The time window is selected based on the data availability of each variable to analyze, along with the available computing capabilities.
2.1. Fires
The historical fire data are retrieved from the Fire Information for Resource Management System (FIRMS) from NASA, where we gathered data from three different sensors: SUOMI VIIRS C2, J1 VIIRS C1, and MODIS C6.1. First, the level-3 data Visible Infrared Imaging Radiometer Suite (VIIRS) onboard of the Suomi National Polar-Orbiting Partnership (Suomi NPP) spacecraft was obtained. The second dataset, J1-VIIRS C1, is from the satellite NOAA-20, and the last one is from the Terra and Aqua Moderate Resolution Imaging Spectroradiometer (MODIS), where we use the Terra satellite data. The fire data acquisition for the three sources is
https://firms.modaps.eosdis.nasa.gov/download/, accessed on 5 July 2024
2.1.1. SUOMI VIIRS C2
Suomi NPP has nominal (equator-crossing) observation times at 1:30 p.m. and 1:30 a.m. The spatial resolution is about 375 m [
42]. For VIIRS, the confidence values are set to low, nominal, and high. Low confidence daytime fire pixels are typically associated with areas of Sun glint and lower relative temperature anomaly (<15 K) in the mid-infrared channel I4. Nominal confidence pixels are those that are free of potential Sun glint contamination during the day and marked by strong (>15 K) temperature anomalies in either day or nighttime data. High-confidence fire pixels are associated with day or nighttime-saturated pixels. To increase the reliability of the data and reduce false flags we discard all the data marked as low. Theoretical minimum detectable night fire is equivalent to 5 m
2 at 1000 K fire. The probability of detection as a function of temperature and area for day and night can be consulted in [
42].
2.1.2. J1 VIIRS C1
The 3040 km VIIRS swath enables about 15% image overlap between consecutive orbits at the equator, thereby providing full global coverage every 12 h. The spatial resolution is about 375 m [
42]. The fire detection from VIIRS has been validated [
43]. The confidence values are set to low, nominal, and high, as explained above. To increase the reliability of the data and reduce false flags we discard all the data marked as low. Theoretical minimum detectable night fire is equivalent to 5 m
2 at 1000 K fire. The probability of detection as a function of temperature and area for day and night can be consulted in [
42].
2.1.3. MODIS C6.1
MODIS routinely detects both flaming and smoldering fires of 1000 m
2 in size. Under excellent observing conditions (e.g., near nadir, little or no smoke, relatively homogeneous land surface, etc.), 100 m
2 flaming fires can be detected [
44]. The spatial resolution is about 1 km with daily temporal resolution. The fire detection from MODIS has been validated [
45,
46]. For MODIS, the confidence value ranges from 0% to 100%. Since we want to reduce false flags, we discard the lowest 10% entries of each data set.
2.2. EVI
The EVI data are calculated for MODIS [
47] using Equation (
1):
where
,
, and
are the full or partially atmospheric-corrected (for Rayleigh scattering and ozone absorption) surface reflectances;
L is the canopy background adjustment for correcting the nonlinear, differential
and
radiant transfer through a canopy;
and
are the coefficients of the aerosol resistance term (which uses the
band to correct for aerosol influences in the
band); and
G is a gain or scaling factor. The coefficient values can be found in [
47].
The EVI data are retrieved from MODIS in
https://appeears.earthdatacloud.nasa.gov/ (accessed on 10 July 2024), specifically, the MOD13A1 product. The algorithm from MOD13A1 chooses the best available pixel value from all the acquisitions from the 16-day period. The criteria used are low clouds, low view angle, and the highest EVI value. The data have a spatial resolution of about 500 m. The data come as a set of geoTIF images with cvs information having the mean, median, variance, maximum, and minimum value in each picture. Moreover, there is information for each picture that shows pixel values for different usefulness, informing which pixels are decreasing quality, lower quality, or not useful for any other reason/not processed. We turn any pixel marked with these values into NaN value.
The geoTIF images are in int16 format ranging from −32,768 to 32,767. Pre-processing is required to convert this value into EVI, which ranges from −1 to 1. First, since the fill value is −3000 and valid values are between −2000 and 10,000, any pixel outside this range is turned into NaN. Also, any pixel listed as decreasing quality, lower quality, or not useful for any other reason/not processed is turned into NaN. For reference, about
of the pixels are turned into NaN for each image. Then, using the maximum and minimum value information in the cvs file, the actual EVI is calculated using Equation (
2):
where
is the actual EVI value in the range of
,
is the EVI value in the int16 range,
and
are the minimum and maximum value in the tif image (after removing the aforementioned useless data), and
and
are the minimum and maximum EVI values reported in the cvs for that tif image. This equation scales the int16 tif values into the range of reported EVI values in the cvs. The correctness of the transformation is validated comparing the median and mean between this scaling and the reported values in the cvs.
The data cover a period of 16 days, where the more reliable value is reported (accordingly to MODIS), reporting the initial date. A total of 93 tiff images are retrieved within the study region in the time window from 1 January 2020 until 31 December 2023. Then, for each fire entry, the fire latitude and longitude coordinate is searched over the 93 EVI images to make a list of the EVI images that cover each fire date. Most of the fire locations are covered in the 93 EVI images (different dates).
Next, the fire date is compared to the selected EVI images that cover the fire latitude and longitude; the EVI image with the closest date to the fire is selected, with the constraint that the EVI date cannot be more than 15 days after the fire date, since the EVI date covers a range of 16 days. The MODIS algorithm chooses the best available pixel value from all the acquisitions from the 16-day period. The criteria used are low clouds, low view angle, and the highest NDVI/EVI value. Since a fire will decrease the EVI value, the algorithm will choose a pre-fire value if the fire date lies in the 16-day period.
Finally, the closest latitude–longitude EVI pixel to the fire latitude and longitude is taken as the EVI value.
2.3. Land Usage
The land class information comes from the Landsat data archive; specifically, we retrieve the geotiff information from
https://glad.earthengine.app/view/glcluc-2000-2020 (accessed on 12 July 2024) [
40] (see
Figure 2). More than 100 sub-classes are labeled in the original data; we group the pixel information into 8 classes: true desert, semi-arid, dense short vegetation, tree cover, wetland, open surface water, cropland, and built up (see
Table 1). This classification comes from the data source.
2.4. Weather Variables and Soil Moisture
The data are retrieved from
https://open-meteo.com/en/docs/historical-weather-api (accessed on 18 July 2024), calling the API from python for each latitude–longitude from the fire data in that specific day. This source uses a combination of weather station, aircraft, buoy, radar, and satellite observations including ECMWF IFS (Global coverage), ERA5 (Global coverage), ERA5-Land (Global coverage), and CERRA (Europe coverage).
We collect the following variables: temperature at 2 m, relative humidity at 2 m, precipitation, wind speed at 10 m, soil temperature at 0–7 cm, and soil moisture at 0–7 cm.
3. Results and Discussion
3.1. Temporal and Spatial Fire Analysis
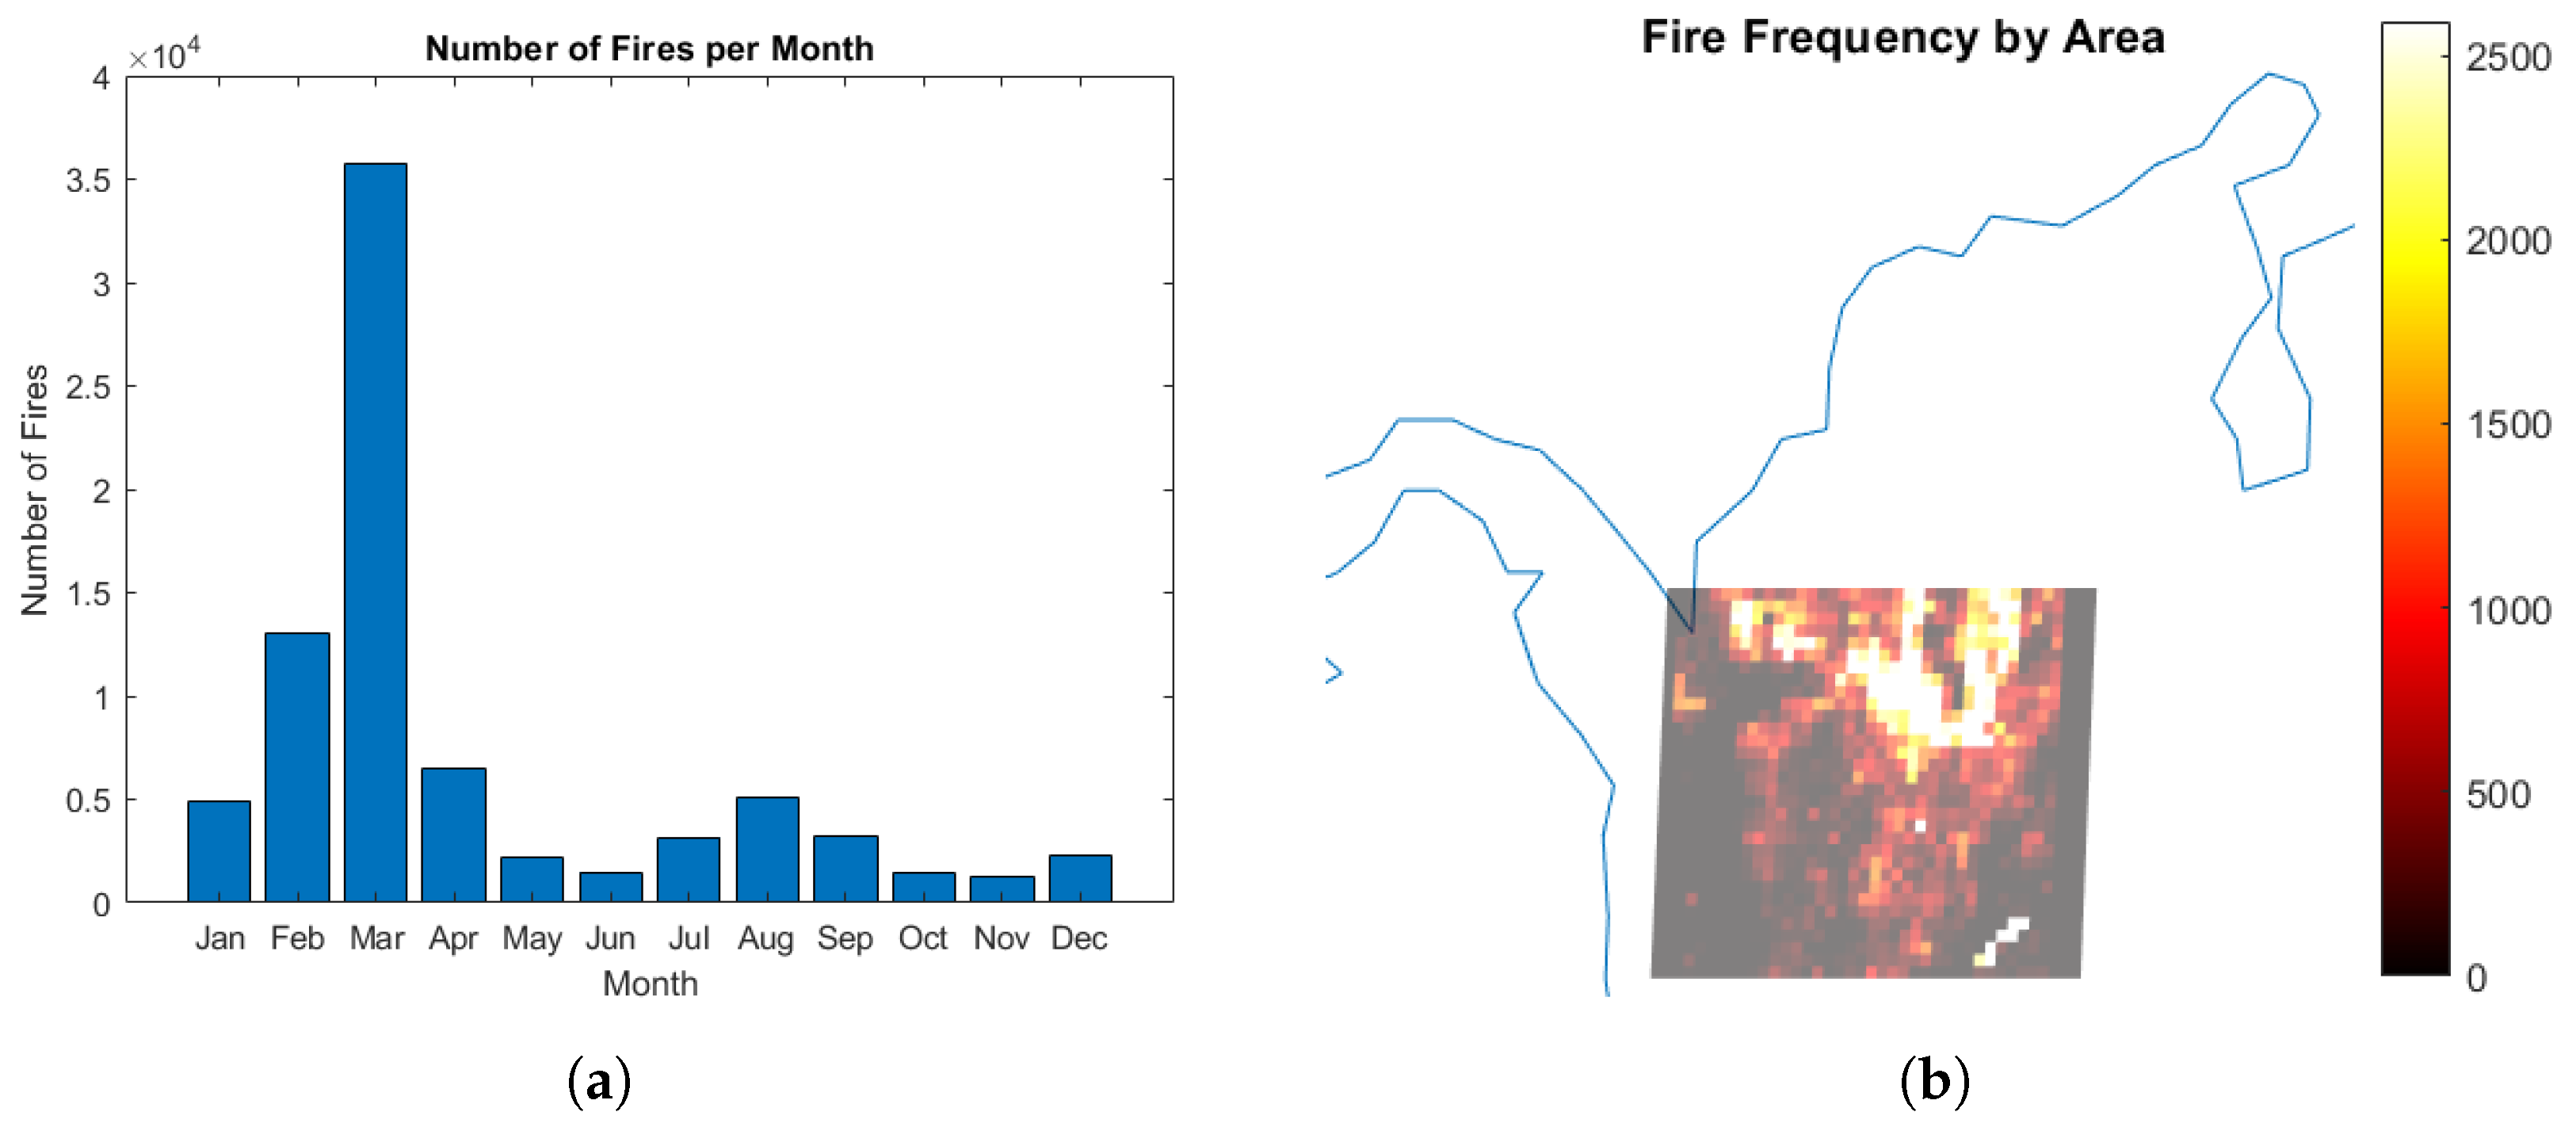
The initial analysis examines the monthly fire count over a 4-year period, as shown in
Figure 3a. A noticeable increase in fires occurs during the first three months of the year, particularly in March. This trend is compared to the annual temperature and precipitation patterns in Colombia, illustrated in
Figure 4. Low humidity in January may contribute to the higher fire activity in January and February, though its impact in August appears minimal. Similarly, the high temperatures from January to March may explain this surge. However, these factors alone do not fully account for the less pronounced increase in fires during August compared to February and March. Further analysis of these and other potential fire-related variables will be conducted.
The second analysis focuses on fire frequency by location, visualized using a grid over the study region, as shown in
Figure 3b. Interestingly, fires are concentrated in specific areas while being nearly absent in others, likely due to the presence of dense forests with high precipitation. This observation suggests that studying land classification may help explain the observed fire distribution.
3.2. Land Class
The land class analysis, shown in
Figure 5a, counts the number of fires in each land type. The results reveal that over half of the fires occurred in tree-covered areas, followed by regions with dense short vegetation, wetlands, and built-up areas. This pattern is likely due to the extensive tree cover in the study area. To refine the analysis, the data were normalized by dividing the number of fires in each land class by the number of pixels representing that class. The results, shown in
Figure 5b, indicate that fires are more likely to occur in built-up areas, followed by tree-covered regions. It is important to note that domestic fires are included in this study.
3.3. EVI
We take the EVI value as explained in the data prepossessing section. This EVI value is close to the fire date, for each fire. This value is compared to the historical EVI value of the same latitude–longitude along the 4-year time window. We find a simple percentage using Equation (
3):
We present the distribution of this
in
Figure 6. There is a mean difference of
, meaning that there is a tendency for a reduction in the EVI before the fire. To conclude if this difference is statistically significant, we use the
t-test. The results are a
confidence interval for the mean difference,
, and a t-statistic of
, concluding this difference is significant. If we take the mean among the entire fire dataset, the mean pre-fire EVI is 0.4448, and the mean of the historical EVI in the fireplaces is 0.4639. This significant difference in the EVI indicates a notable variation, suggesting that vegetation health generally declines before fires occur.
The reduction in EVI before fires can be attributed to several factors. Typically, periods of drought or dry conditions precede fires, leading to stressed vegetation with reduced greenness and vigor, which is captured by lower EVI values. Additionally, human activities such as deforestation, agricultural expansion, and other land-use changes can degrade vegetation health, further contributing to the observed decrease in EVI.
3.4. Weather and Soil
A similar study of the EVI is performed for the weather and soil variables. First, we analyze the fires that happened during the day, since the night has very different conditions. At each fire location, we compute the mean of each variable during the day that the fire was detected, and compare this mean to the specific value of the variable one hour before the fire was detected, the pre-fire value. Specifically, the difference is computed. We compute this for the whole fire data set—excluding night fires—and plot the difference distribution, labeling the mean value. The units of this difference are the same as the units of each variable. We also perform a Q–Q plot to show how similar the data are to a normal distribution. Finally, we perform for each variable to conclude that the mean of is statistically significant, and obtain its confidence interval, along with the t-statistic value.
In this application, the Q–Q plot helps us visually determine whether the differences between pre-fire and daily mean values follow a normal distribution. This is important for understanding whether the data behave as expected or if there are any unusual patterns. The t-test, on the other hand, checks if the average difference is not just due to random chance. A statistically significant result means that the difference is unlikely to be random, suggesting a real, measurable change in the variable leading up to the fire. The confidence interval gives us a range where the true mean difference is likely to fall, while the t-statistic tells us how large that difference is compared to the variability in the data.
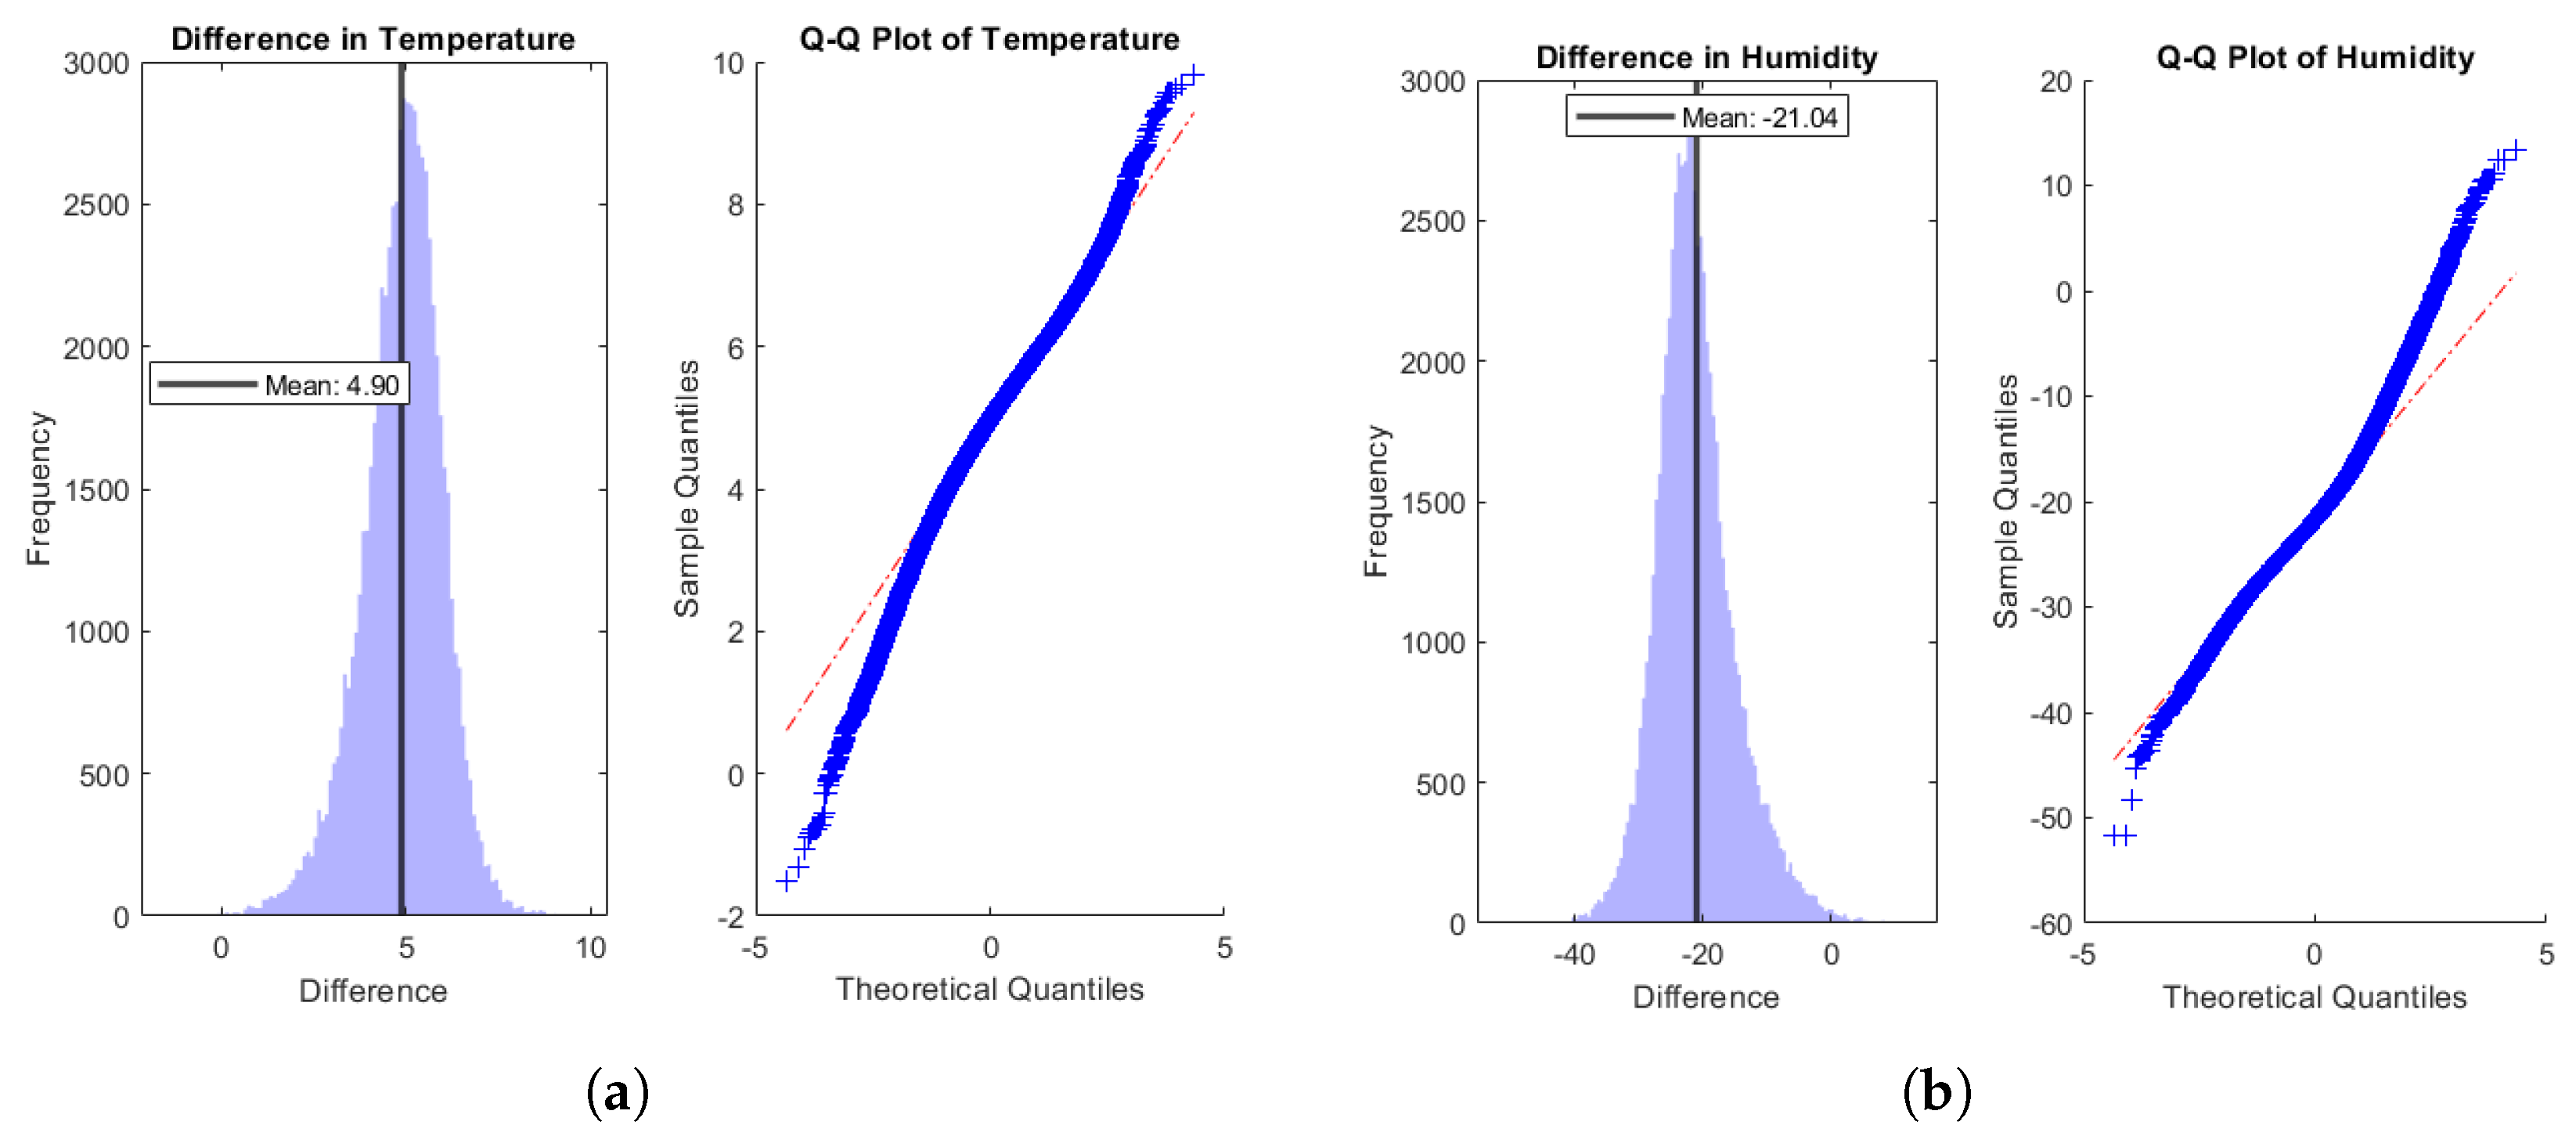
The temperature and humidity results are shown in
Figure 7. The mean difference in temperature is
C, meaning that, on average, an increment of
C in the air (2 m height) seems to propitiate the fire. In the case of relative humidity, the mean is
, indicating that a reduction in this value propitiates the fire, on average. Both Q–Q plots are close to the Gaussian distribution, allowing the
t-test.
Higher temperatures can dry out vegetation, making it more susceptible to catching fire. Lower relative humidity reduces the moisture content in the air and vegetation, further increasing the likelihood of fire ignition and rapid spread. These climatic conditions create an environment conducive to wildfires, highlighting the importance of monitoring temperature and humidity as key indicators of fire risk.
The results for precipitation and wind speed at 10 m are presented in
Figure 8. The mean difference in precipitation is
mm, indicating that, on average, there is a reduction of this amount of precipitation in pre-fire situations. In the wind speed analysis, a mean of
m/s is found, which suggests that higher wind speeds promote fire occurrence. The Q–Q plot of precipitation does not show an adequate Gaussian agreement, while wind speed does. This suggests that the conclusions about precipitation are not precise.
The reduction in precipitation before fires can be attributed to dry conditions that reduce moisture in vegetation, making it more flammable. However, the lack of Gaussian agreement in the Q–Q plot indicates that the precipitation data might be influenced by other variables or noise, making the conclusions less reliable. On the other hand, the increase in wind speed is a well-known factor in fire propagation. Higher wind speeds can dry out vegetation quickly and provide more oxygen to fires, helping them spread faster and become more intense. However, it is known that wind can promote or diminish fire [
41], which explains why the mean is very close to zero.
Finally, the results for soil temperature at 0–7 cm and soil moisture at 0–7 cm are shown in
Figure 9. The soil temperature analysis suggests that—on average—there is an increment of
C in the soil temperature during the pre-fire. In the case of soil moisture, the mean is about zero. The Q–Q plots indicate that the soil temperature follows a Gaussian distribution more closely than the soil moisture does.
The increase in soil temperature before fires can be attributed to prolonged dry conditions and higher air temperatures, which can heat the soil. Warmer soil temperatures can also lead to drier conditions by evaporating soil moisture, making the area more susceptible to fires. In contrast, the soil moisture data showing a mean around zero indicate that there is no significant change on average. However, the lack of Gaussian agreement in the soil moisture Q–Q plot suggests that soil moisture data are more variable and may be influenced by localized factors such as recent rainfall or irrigation, making it harder to draw precise conclusions. These observations highlight the importance of soil temperature as a reliable indicator of fire risk, while soil moisture might require more localized context for accurate interpretation.
The
t-tests are performed to find the confidence interval of each mean. The results are provided in
Table 2. However, the precipitation and soil moisture showed a Q–Q plot that was not aligned with the Gaussian distribution, suggesting the results are not conclusive. In summary, we can conclude that an increase in the air temperature, soil temperature, and wind speed promotes the fire in the studied region based on the specific values reported, on average. On the other hand, a decrease in air relative humidity promotes pre-fire conditions. These results address the weather and soil conditions promoting the same day’s fire.
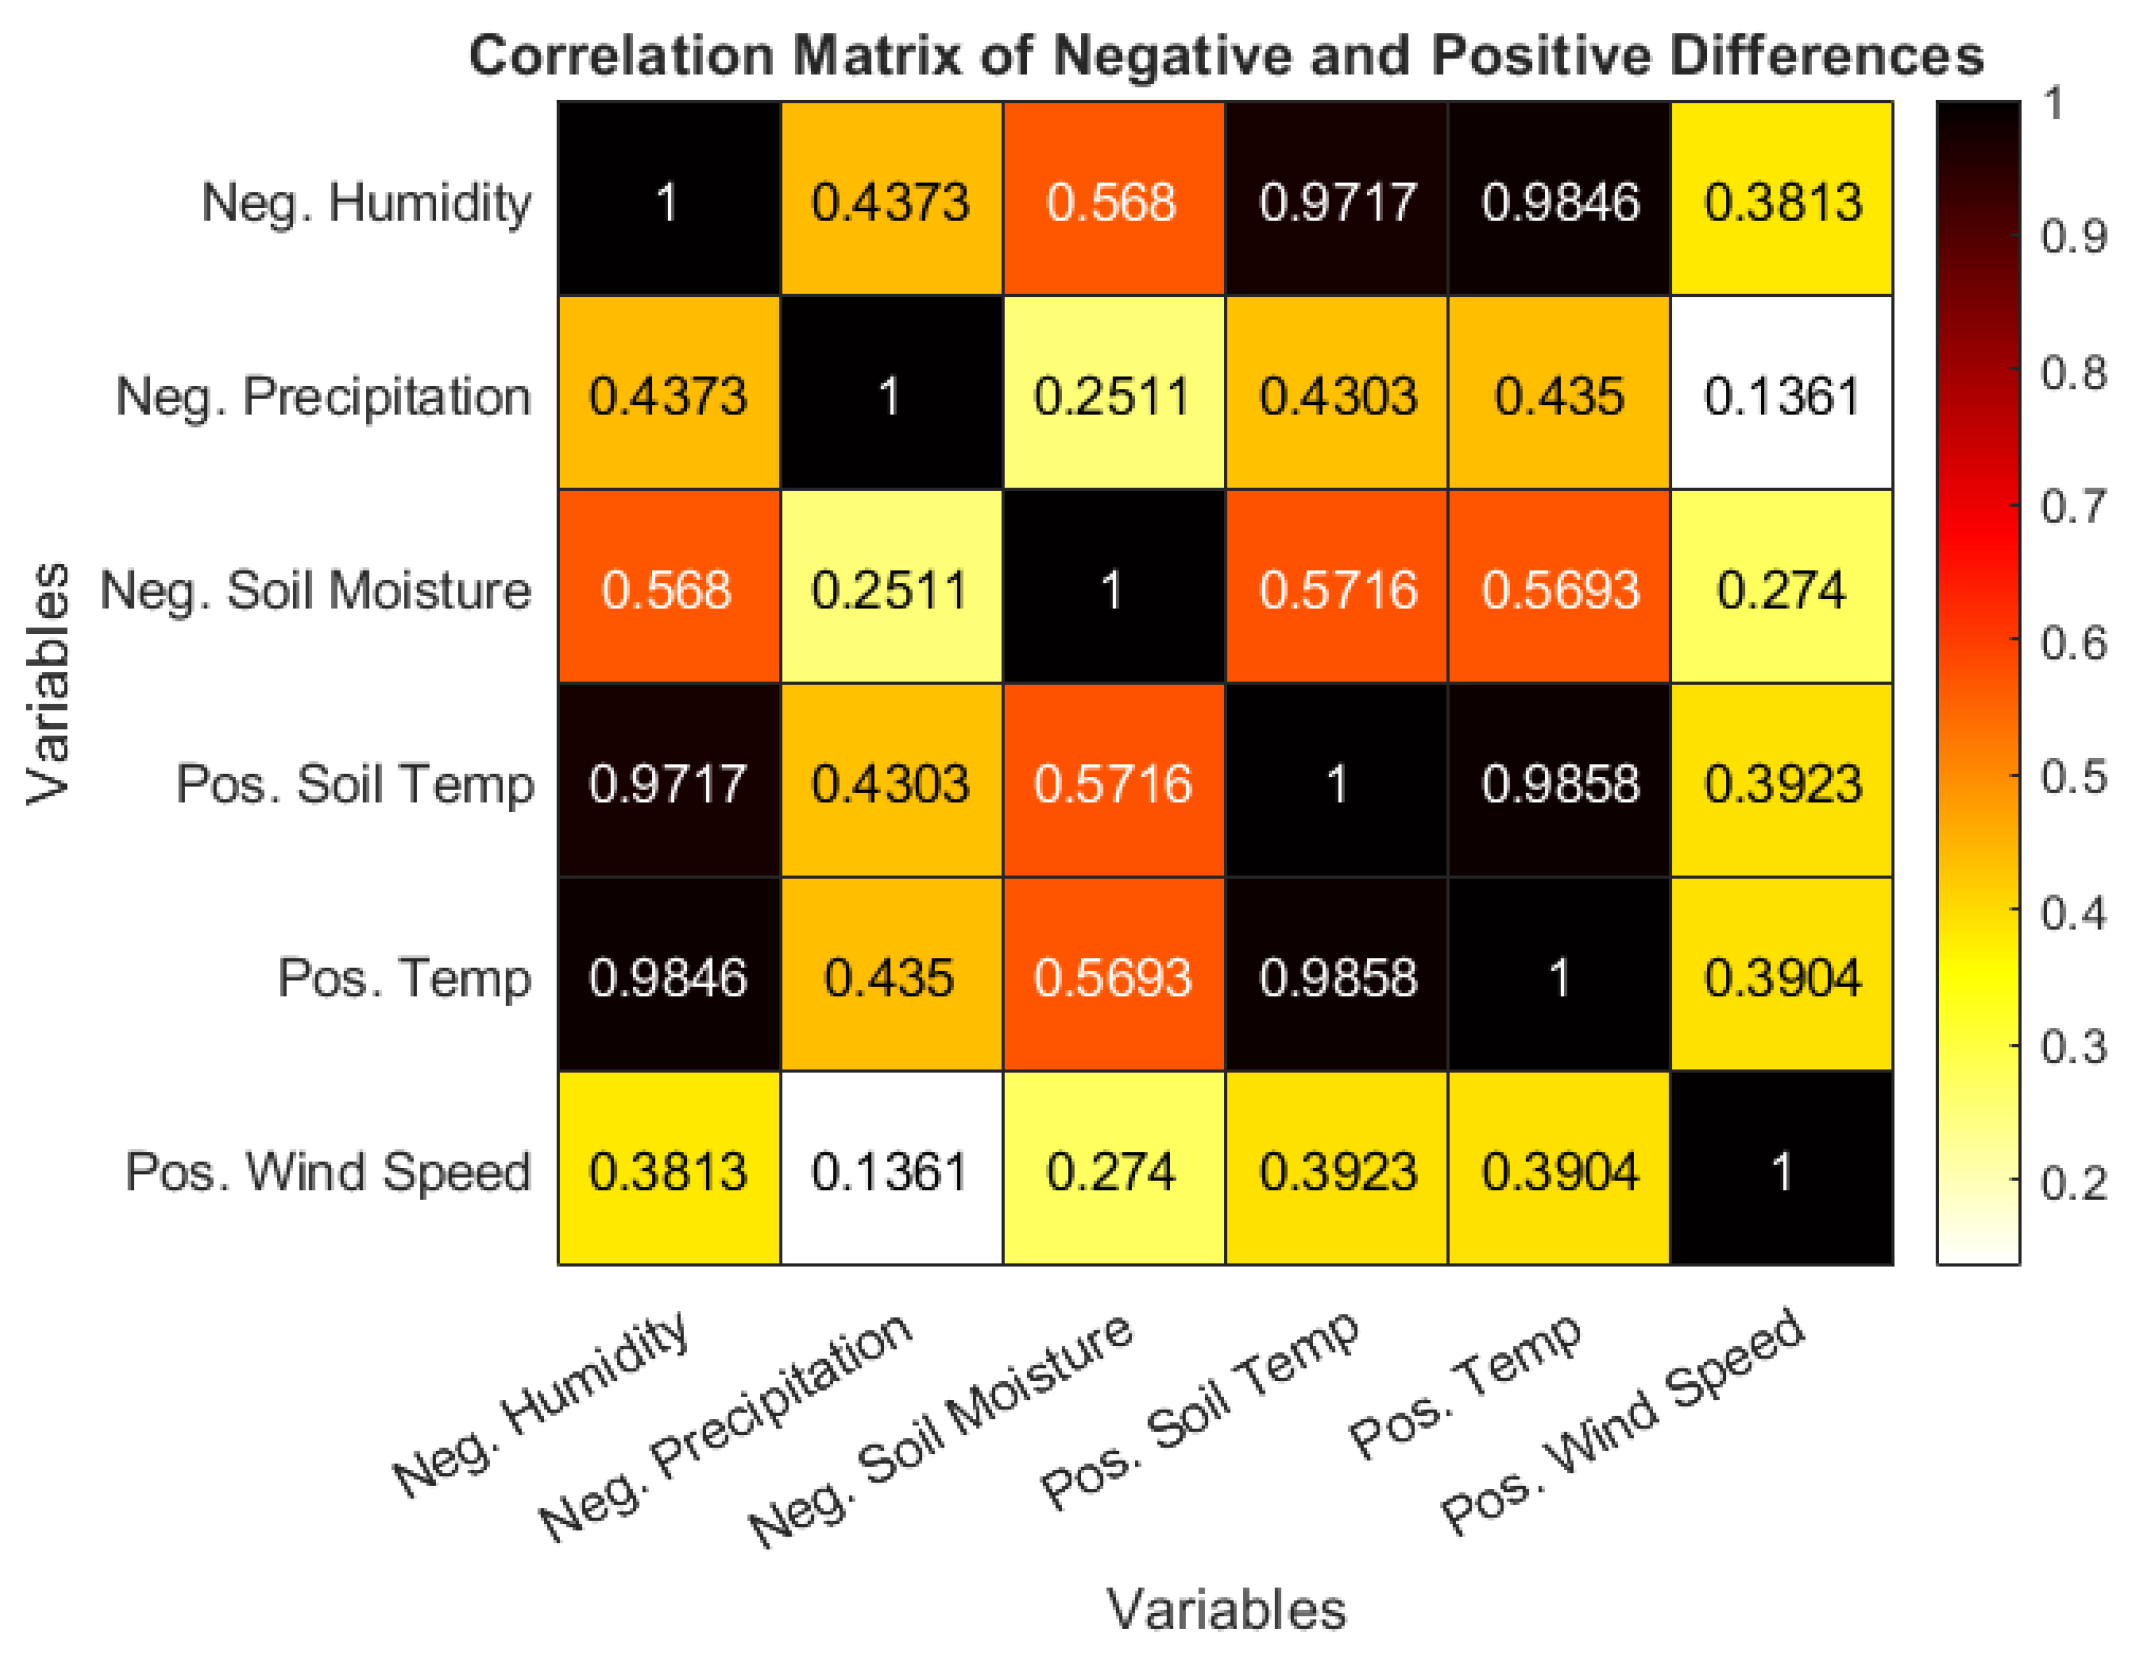
3.5. Correlations
We perform a correlation between the identified fire precursors. Specifically, we investigated how the decrease in humidity, precipitation, and soil moisture and the increase in soil temperature, air temperature, and wind speed are correlated in the pre-fire time studied. The results are shown in
Figure 10.
In this context, correlation analysis measures how changes in one variable are associated with changes in another. For example, if soil temperature rises while humidity decreases before a fire, these variables may be positively or negatively correlated. A strong correlation could suggest that certain conditions tend to occur together leading up to a fire, providing insight into how these factors might collectively contribute to fire risk. Correlation coefficients in the figure indicate the strength and direction of these relationships, helping to identify patterns among fire precursor variables.
From these results, the main correlations (all variables in difference) are between soil and air temperature, as expected, followed by negative humidity and positive temperature, negative humidity and positive soil temperature, negative soil moisture and positive soil temperature, and negative soil moisture and positive temperature.
Very low correlation values indicate that there is little to no linear relationship between the variables in question. This suggests that changes in one variable do not consistently predict changes in the other. For example, instead of observing a negative relationship between precipitation and wind speed (where negative precipitation correlates with positive wind speed), it could be that there is a strong relationship where both variables exhibit low values simultaneously (negative wind speed correlating with negative precipitation). This implies that the expected linear relationship is not present, and the variables may have a more complex or non-linear interaction.
These results suggest that some of the fire precursors are strong when they come together, for instance, a decrease in humidity with an increase in temperature.
3.6. Comparison with Other Research
In [
30], South America is classified in the top-down group, where the primary fire precursor is the potential evaporation (direct relation). This can be related to some of the variables we studied. It directly relates to temperature at 2 m, since higher air temperatures increase the energy available for water to evaporate. As the air temperature increases, more water can transition from liquid to vapor, leading to higher potential evaporation rates. We found a positive increase in air temperature at 2 m, which supports the increase in potential evaporation as a fire precursor in this region.
Potential evaporation also has a direct relation with wind speed since wind helps to remove the layer of saturated air near the evaporating surface, allowing more water vapor to escape into the atmosphere. Faster winds carry away this moist air more quickly, making room for additional evaporation. We found an increase in wind speed as a fire precursor, which also supports the potential evaporation increase as a fire precursor.
The relationship between humidity and potential evaporation is inverse. When humidity is low, the air can hold more water vapor, promoting evaporation. Conversely, when humidity is high, the air is already saturated with moisture, reducing the evaporation rate. Since we found a decrease in humidity as a fire precursor, it also supports the increase in potential evaporation as a fire precursor in tropical regions.
The second more critical fire precursor found in [
30] is the vapor pressure deficit (VPD), which can be related directly to the air temperature at 2 m. The VPD is the difference between the amount of moisture in the air and how much moisture the air can hold when it is saturated. Higher temperatures increase the air’s capacity to hold moisture, raising the saturation vapor pressure. As the air temperature increases, if the actual vapor pressure does not increase proportionally, the VPD will increase. Thus, higher air temperatures lead to a higher VPD.
There is also a relationship between VPD and humidity. When humidity is high, the actual vapor pressure is closer to the saturation vapor pressure, leading to a lower VPD. Conversely, when humidity is low, the actual vapor pressure is much lower than the saturation vapor pressure, resulting in a higher VPD. Therefore, as humidity decreases, the VPD increases.
Both humidity and temperature trends founds in this work support the increase in VPD as a fire precursor in this region.
The third primary fire precursor [
30] in this region is the aridity anomaly index, which clearly increases with air temperature at 2 m and soil temperature, and decreases with precipitation and high soil moisture. This is validated if compared against our findings.
Finally, the last two main fire precursors [
30] are temperature and wind, which is also found in this study. In different studies, human activity has been shown to be an important fire precursor [
9]; this can be supported by this study given the proportional fire occurrences by land class, which showed that the main land class (proportionally) is built up.
Moreover, our work provides an extended perspective by integrating multiple meteorological, soil, and vegetation indices alongside land-use classifications. Unlike some previous studies that focus on a few isolated variables, our approach offers a comprehensive understanding of how these factors collectively influence fire occurrence. For instance, while [
30] underlines potential evaporation and VPD as primary catalysts for wildfire ignition, we reinforce these findings with additional evidence on soil moisture, the EVI, and the relative importance of built-up areas. Such an integrated approach enhances the predictive power of fire risk models, distinguishing our study from others that concentrate predominantly on either climatic or anthropogenic drivers. By corroborating patterns reported both in domestic and international contexts, we strengthen the evidence that top-down fire precursors in tropical environments are consistently dominated by temperature-related factors, while also highlighting the nuanced roles of soil and vegetation. This comparative advantage lies in our ability to capture these interactions across distinct land classes, demonstrating how human presence can modulate or exacerbate natural precursors in specific regions. Overall, this provides a more holistic framework for policymakers, enabling them to tailor fire risk mitigation strategies that consider not only climatic indicators but also land management practices.
To analyze how persistent these trends are, we present the percentage of the data that follow the increase or decrease in each fire precursor, in
Table 3.
From the results presented in
Table 3, the wind speed and precipitation are the least trend-persistent data, followed by the soil moisture and EVI change. The soil moisture and EVI change results further support the conclusion of the Q–Q plots regarding the uncertain results of soil moisture and precipitation. In the case of wind speed, similar results have been reported in other studies [
30], explained by the fact that wind can both promote and suppress wildfire [
41] depending on different factors. The low consistency in the reduction in the EVI supports the classification in [
30] of most of South America as top-down group, where the EVI is not one of the primary fire precursors, while it is in the bottom-up group. In similar studies, precipitation has been one of the main factors that has been employed to assess the fire risk [
32,
48], while it should not be used as one of the main variables in this type of climate, based on the results.
In this context, trend persistence refers to how consistently a variable exhibits a pattern over time. The lack of trend persistence in wind speed and precipitation suggests that these variables do not consistently exhibit the same relationship with fire risk, which could be due to their variable influence depending on other factors. The EVI’s inconsistency further emphasizes the limited role of EVI change as a reliable fire precursor in certain regions. Overall, these results suggest that relying on precipitation alone may not be effective for predicting fire risk in this climate, highlighting the need for a more nuanced approach to fire risk assessment.
4. Limitations and Future Work
Due to the data availability and quality challenge, different limitations arise in this work. First, the land classes information is from a single data set of 2020, assuming the data do not change during the 4-year time window; however, this assumption should work for most of the pixels.
Regarding the EVI information, we used a 16-day period report. However, this approach would ignore rapid changes in the vegetation due to human activities, which can be less than 16 days.
One of the limitations of this work is the weather and soil variables, which are collected as a mixture of measures and models. We have no control over these models, leading to a black box modeling, making it more complex to detect real trends that do not come from the modeling.
Finally, due to the amount of data involved, we studied the trends of the weather and soil variables during the fire detection day. Using data from previous days or weeks is part of future work.
For future work, new variables can be studied, including lightning, the distance to the closest town or roads, and other variables to account for human activity. Moreover, a multi-variable analysis can be performed, but it would require having different variables with a standard time-spatial resolution availability. This limitation is usually encountered in this type of study [
9].
5. Conclusions
A statistical analysis of fire precursors was performed in a tropical region, involving the land class, EVI, air temperature, relative humidity, precipitation, wind speed, soil temperature, and moisture. The data were collected and pre-processed to allow the analysis.
In the tropical region of study, the results suggest that the fires are more common during the first three months of the year, and especially, in March. Regarding the spatial distribution, specific centering areas showed high fire occurrence, suggesting that the fires happens near where other fires have happened before, probably because the same risk environmental variables remains, like weather patterns and human activity.
Regarding the land class, most of the fires happened in tree-covered regions, followed by dense short vegetation, wetland, and built-up areas. However, considering the fire occurrence proportionally to the number of pixels of each class in the region of study, the results showed that fires are much more likely to occur on built-up land. This suggests that human activity is an important fire precursor.
The pre-fire EVI (15-day time window) shows a reduction of —on average—compared to the historical EVI values in each fire location. This proves that deforestation activities are fire precursors, along with health and vegetation activity, despite other studies having not identified the EVI change as one of the main fire risk variables in South America.
Among the weather and soil variables studied, the precipitation and soil moisture were inconclusive. This indicates that, in contrast to other regions, these two variables are not as meaningful as fire precursors in a tropical region when high levels of precipitation and soil moisture already exist. This suggests, opposite to other studies, that fire risk management should not be based primarily on the precipitation for this type of climate.
On the other hand, an increase in air temperature (2 m) of C, wind speed (10 m) of 0.17 m/s, and soil temperature (0–7 cm) of C proved to promote fire occurrence, on average. Similarly, a reduction in relativity humidity (2 m) of showed to be a fire precursor.
A correlation study shows that the most consistent pattern is the reduction in humidity along with the increase in soil and air temperature. The least consistent trend is the wind speed, followed by precipitation and EVI change, which makes this type of region different compared to other regions.
The study’s results can be used to further specialize the emerging fire prediction models by taking into account the amount of consistency of the identified fire precursors, where similar weather and soil conditions are found. Moreover, the trends found can be use to inform national policies for targeting high-risk periods like the first three months of the year and high-risk situations based on weather forecast, and to guide regional fire prevention efforts by focusing on tree-covered and built-up areas with significant human activity or the combination of the fire precursors found.
The findings are summarized as follows:
We found that both seasonal and localized risks play a role. Wildfires primarily occur during a specific month of the year, reflecting environmental factors. However, they also happen more frequently near areas where previous fires have occurred, suggesting local influences such as human activity or geographical features that persist regardless of the season.
The majority of fires occurred in tree-covered regions, followed by dense short vegetation, wetland, and built-up areas. However, when considering fire occurrence proportional to land class coverage, fires are much more likely to occur in built-up areas, highlighting human activity as a significant fire precursor.
The pre-fire EVI (15-day time window) showed an average reduction of compared to historical EVI values at each fire location, suggesting deforestation and reduced vegetation health are key fire precursors, despite not being traditionally identified as major fire risk variables in South America.
Among weather and soil variables, precipitation and soil moisture were inconclusive in identifying fire risk. This suggests that in tropical regions with high levels of these variables, fire risk management should not primarily focus on precipitation, contrasting with other regions.
Increases in air temperature (2 m) of C, wind speed (10 m) of 0.17 m/s, and soil temperature (0–7 cm) of C were found to promote fire occurrence. A reduction in relative humidity (2 m) by was also identified as a significant fire precursor.
The most consistent correlation was found between reduced humidity and increased soil and air temperatures. The least consistent trend was wind speed, followed by precipitation and EVI change.


 ,
, 


