Article

Spatial Heterogeneity of Soil Respiration and Its Relationship with the Spatial Distribution of the Forest Ecosystem at the Fine Scale

1
Key Laboratory of Carbon Sequestration and Emission Reduction in Agriculture and Forestry of Zhejiang Province, Zhejiang A&F University, Hangzhou 311300, China
2
Institute of Ecological Civilization and Institute of Carbon Neutrality, Zhejiang A&F University, Hangzhou 311300, China
3
Engineering Research Center of Bamboo Carbon Sequestration for State Forestry and Grassland Administration, Hangzhou 311300, China
4
Ehon Carbon Technologies Company Limited, Hangzhou 311300, China
5
Faculty of Forestry, University of British Columbia, 2424 Main Mall, Vancouver, BC V6T 1Z4, Canada
*
Author to whom correspondence should be addressed.
Forests 2025, 16(4), 678; https://doi.org/10.3390/f16040678
Submission received: 31 March 2025 / Revised: 10 April 2025 / Accepted: 11 April 2025 / Published: 12 April 2025

Abstract

:
Forest soil respiration plays a crucial role in the global carbon cycle. However, accurately estimating regional soil carbon fluxes is challenging due to the spatial heterogeneity of soil respiration at the stand level. This study examines the spatial variation of soil respiration and its driving factors in subtropical coniferous and broad-leaved mixed forests in southern China, aiming to provide insights into accurately estimating regional carbon fluxes. The findings reveal that the coefficient of variation (CV) of soil respiration at a scale of 50 m × 50 m is 18.82%, indicating a moderate degree of spatial variation. Furthermore, 52% of the spatial variation in soil respiration can be explained by the variables under investigation. The standardized total effects of the main influencing factors are as follows: soil organic carbon (0.71), diameter at breast height within a radius of 5 m (0.31), soil temperature (0.27), and soil bulk density (−0.25). These results imply that even in relatively homogeneous areas with flat terrain, fine-scale soil respiration exhibits significant spatial heterogeneity. The spatial distribution of woody plant resources predominantly regulates this variation, with root distribution, shading effects, and changes in soil physical and chemical properties being the main influencing mechanisms. The study emphasizes the importance of simulations at different microscales to unravel the potential mechanisms governing macroscopic phenomena. Additionally, it highlights the need for incorporating a more comprehensive range of variables to provide more meaningful references for regional soil carbon flux assessment.

1. Introduction

Soil respiration is the process through which undisturbed soil releases CO2 into the atmosphere. As the predominant carbon source emitted from terrestrial ecosystems to the environment, soil yields approximately ten times more CO2 than fossil fuel combustion [1]. It is the second largest carbon flux in the biosphere, second only to global primary productivity (GPP) [2]. Forests are the foremost important ecosystems on earth and possess the largest vegetation carbon pool and soil carbon pool, with an annual emission of 68–90 Gt C [3]. As a result, even minor changes in the soil respiration dynamics can significantly impact the atmospheric CO2 mixing ratio and exacerbate global climate transformation [4]. Therefore, understanding the processes and potential influencing mechanisms of soil respiration in forest ecosystems is paramount in simulating changes within the global carbon cycle.
Soil respiration varied temporally and spatially. Although a wealth of research exists on this matter, the vast majority of studies have focused on temporal dynamics [5]; soil temperature and water content can generally explain most temporal variability in soil respiration [2,6,7]. However, within the same region, the uneven distribution of spatial resources, ecosystem spatial distribution, and other factors (e.g., topography, soil physical or chemical properties, and land use) lead to high spatial heterogeneity in soil respiration, with its dynamics influenced by multiple natural and anthropogenic factors [8,9,10]. Although these biological and non-biological components can elucidate mainly spatial variation [11], complex interactions hinder our understanding of the fundamental processes. Moreover, several studies have reported considerable spatial variability in soil respiration across different spatial scales [12], ecosystem types [13], and climatic conditions [14], with the degree of variation influenced by different conditions. At the regional scale, soil respiration exhibits significant differences in dominant influencing factors across climatic zones, which are strongly regulated by specific limiting factors [15]. From a community assemblage perspective, soil respiration among ecosystems demonstrates a gradient variation, with the highest rates observed in evergreen broadleaf forests and the lowest in deciduous coniferous forests, showing an annual mean difference of 966.37 (g C m−2 year−1) between these two ecosystems [16]. Furthermore, studies have revealed that soil respiration rates at forest edges are 15%–26% higher than in forest interiors, attributed to microenvironmental changes driven by landscape fragmentation that alter respiratory processes [17]. This highlights the impact of spatial configuration on soil respiration within the same environmental context. This poses challenges for identifying the drivers of soil respiration spatial variability and may lead to inaccurate estimates of regional soil CO2 emissions. This study aims to elucidate the formation mechanisms of the complex spatial heterogeneity in forest soil respiration, analyze the synergistic regulatory pathways by which multi-factor interactions shape heterogeneous patterns, and prevent the overemphasis of single influencing factors from obscuring underlying causative factors.
Fine scale areas often exhibit similar vegetation community composition, climate, and soil texture. However, research consistently reveals notable spatial heterogeneity in soil respiration within such areas [18]. The species composition, distribution pattern, and growth status of woody plants influence ecosystem primary productivity [19], litterfall, and canopy structure [20], thereby altering soil properties and the understory microenvironment, contributing to spatial heterogeneity in soil respiration. Forests additionally impact soil organic carbon content through root effects [20], modify soil structure [21], and strongly influence soil respiration via their autotrophic respiration [22]. Within apple orchards at a 2 m sampling scale, the spatial variability of soil respiration (CV = 14%–19%) was primarily controlled by gradient effects from the distance to tree trunks [23]. In contrast, the higher variability observed in subtropical evergreen broad-leaved forests at a 25 m × 50 m scale (CV = 38.9%) was more strongly associated with the spatial heterogeneity of litter distribution [24]. In summary, we propose a novel hypothesis: the spatial distribution of woody plants generates resource redistribution hotspots, which act as primary catalysts for fine-scale soil respiration heterogeneity. By explicitly linking tree spatial patterns to belowground carbon dynamics through these feedback pathways, this study elucidates how biotic self-organization scales regulate the spatial coherence of ecosystem carbon fluxes. If validated, this hypothesis could transform current carbon assessment paradigms by replacing conventional models with vegetation-driven simulations, thereby enhancing the predictive accuracy of regional soil carbon balances under climate change. Therefore, analyzing the spatial resource influence patterns of tree distribution on soil respiration is critical for further elucidating and refining the mechanisms of ecosystem soil carbon cycling, providing a theoretical basis for precise assessment of soil carbon budgets. Focusing on smaller sampling scales can capture subtle variations often overlooked in large-scale studies, revealing complex spatial heterogeneity in soil respiration at the microhabitat level. This approach enhances our understanding of how soil respiration at fine scales is interactively shaped by tree spatial patterns, soil microenvironments, and biological activities, offering essential insights for revising and refining empirical models of soil respiration in specific regions. Furthermore, fine-scale investigations provide direct guidance for the precision management of forest ecosystems to enhance their carbon sequestration capacity.
This study focuses on fine scale (50 m × 50 m) subtropical coniferous and broad-leaved mixed forests in southern China. In the experiment, we controlled for the indirect effects of topographic factors on soil respiration and employed high-density sampling points coupled with innovative soil respiration sampling schemes to better characterize the actual spatial distribution patterns of soil respiration. The impact of the spatial distribution of woody plants on soil respiration is evaluated by examining the influences of tree spatial distribution and growth on both biotic and abiotic factors under the forest. The defined aims of this research are as follows: (1) quantifying spatial variability of soil respiration in subtropical coniferous and broad-leaved mixed forests at fine scale, (2) providing a reference for determining an appropriate number of sampling points for soil respiration in forest ecosystems, and (3) exploring how the spatial pattern of forest resource influences soil respiration.

2. Materials and Methods

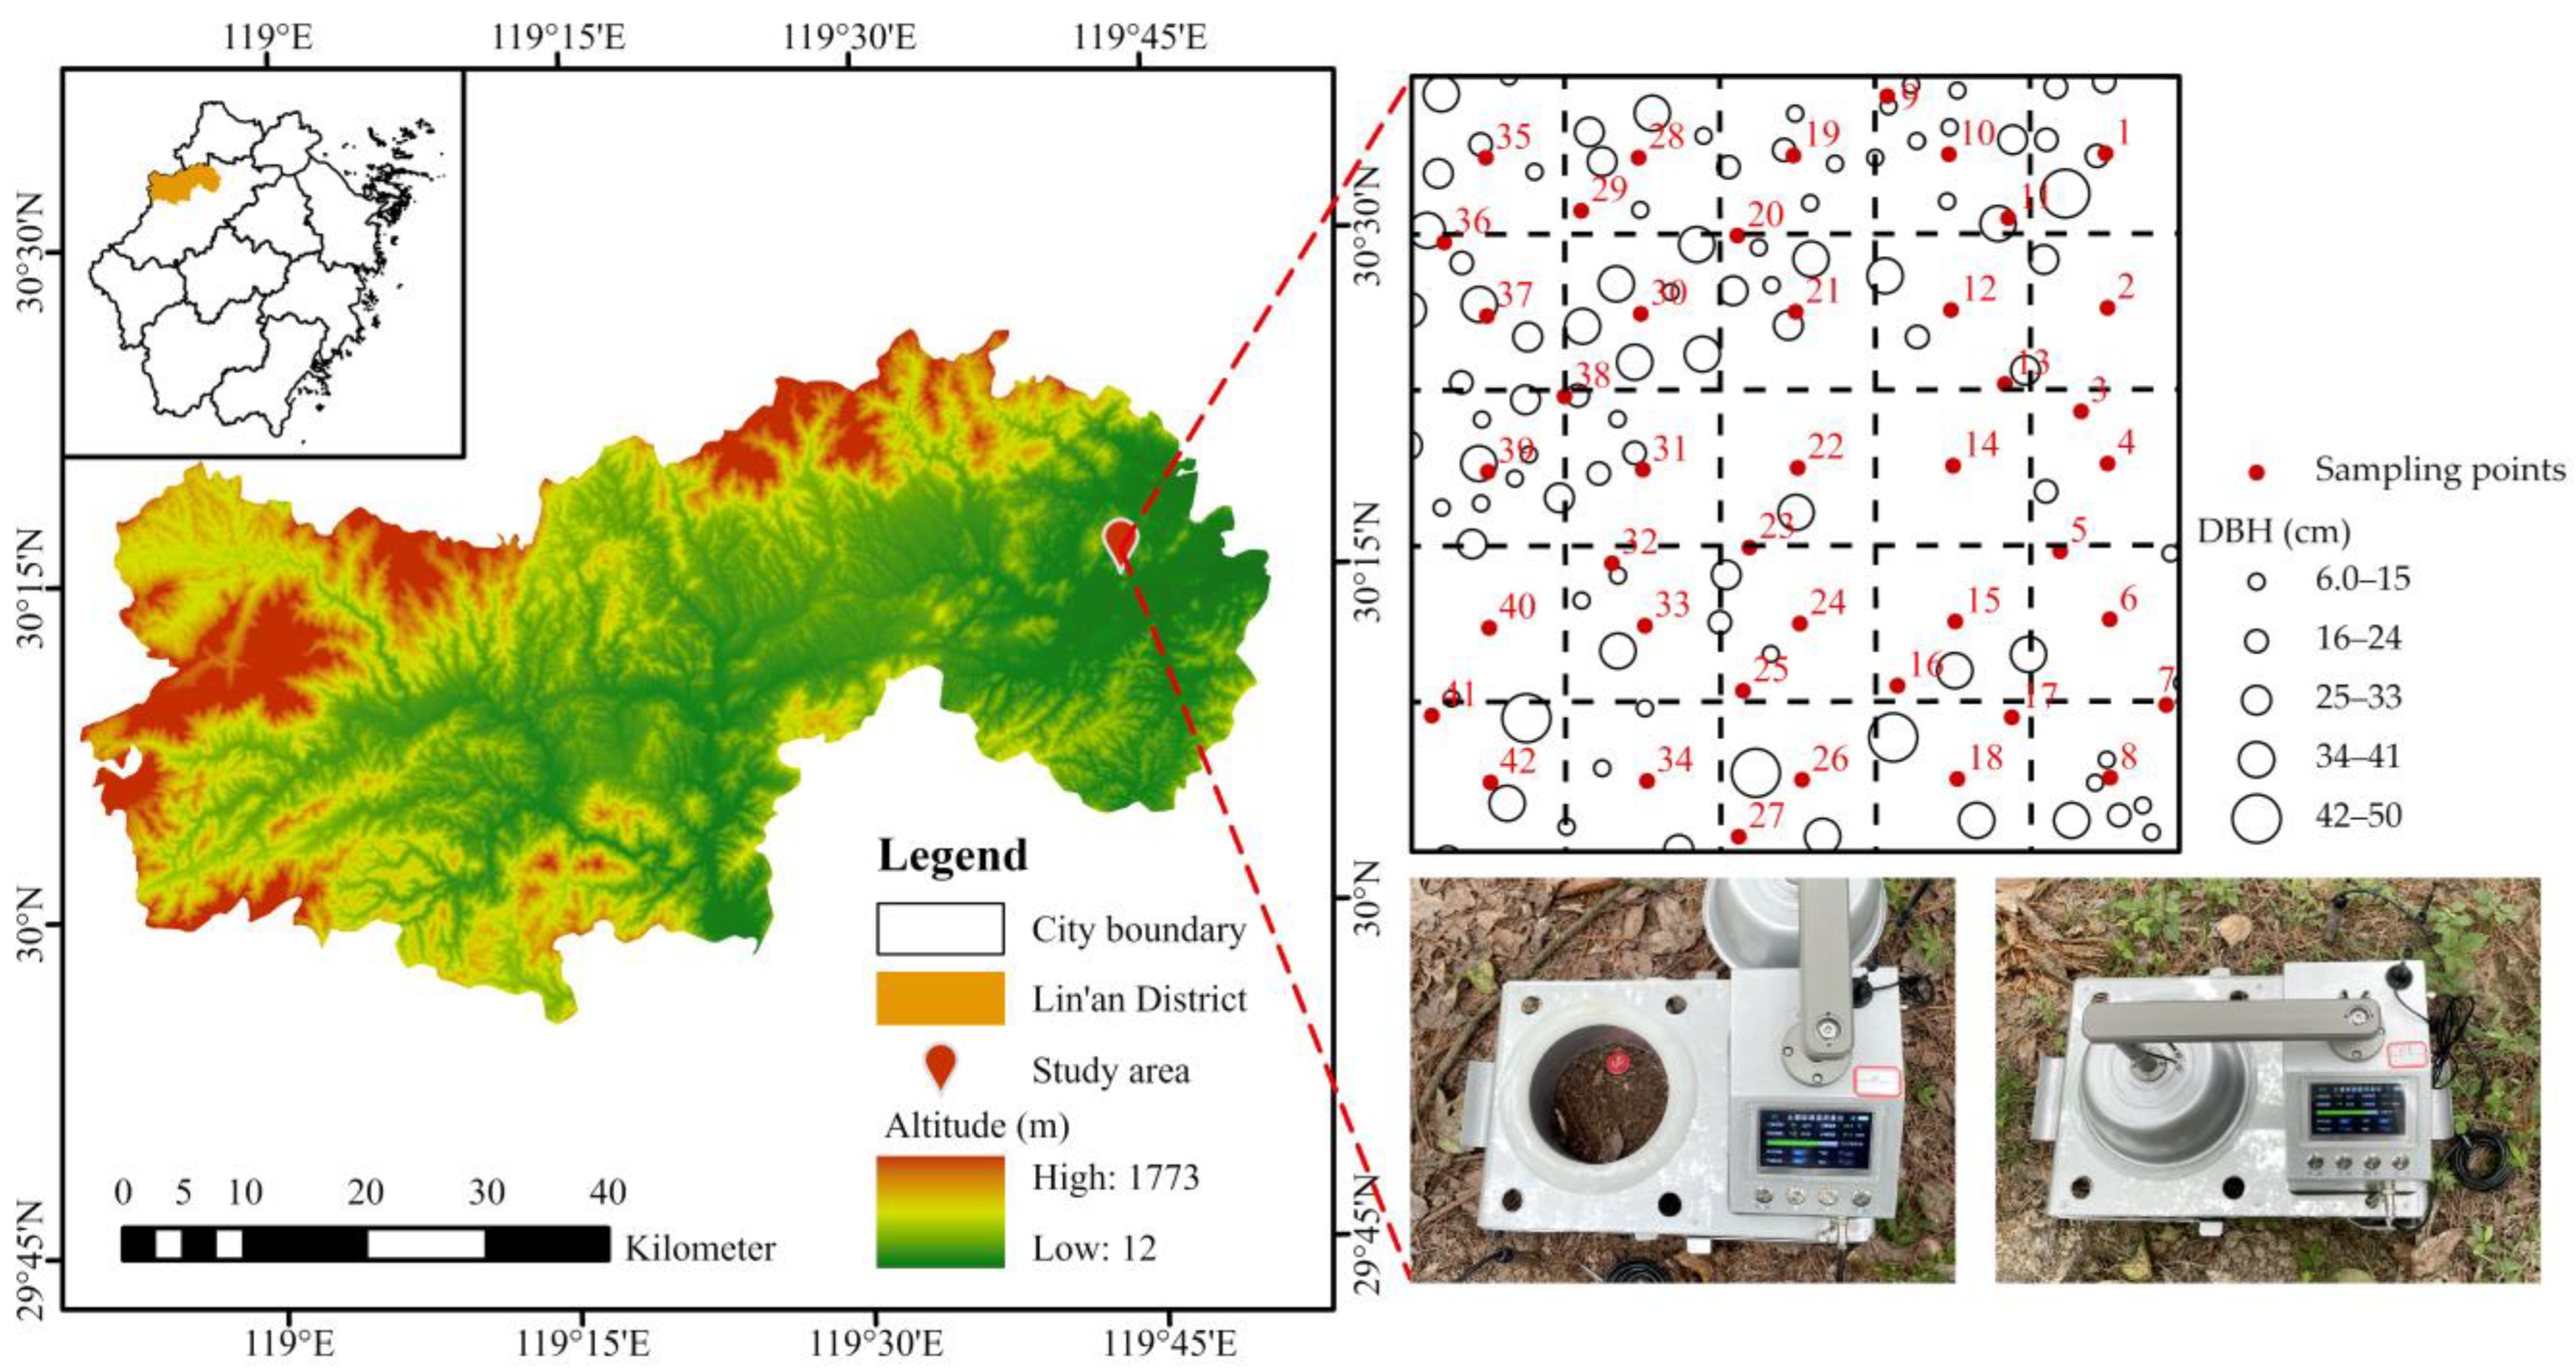
2.1. Study Area and Experimental Design

This study was performed in a planted coniferous and broad-leaved mixed forest in the northern part of Lin’an District, Hangzhou City, Zhejiang Province, China (119°42′ E, 30°14′ N). This mixed forest is a semi-natural artificial forest with a history of 25 years. The area experiences a classic subtropical monsoon climate, influenced by alternating southeast monsoon in summer and northeast monsoon in winter. The monsoon season lasts from May to September, with an annual average of 158 rainy days and an annual rainfall between 1500 and 2000 mm. The annual average temperature is around 15 °C, and the annual average sunlight duration is 1847.9 h [25,26]. To decrease the indirect effect of terrain on soil respiration and avoid masking potential pathways of influence, this study was conducted in flat areas. The altitude of the research area is approximately 48 m, and the soil texture is silty loam (USDA). The dominant tree species in the arbor layer are the Camphor tree (Cinnamomum camphora), slash pine (Pinus elliottii), and sweetgum (Liquidambar formosana).
To elucidate the spatial pattern and influencing factors of soil respiration at a fine scale, we established a 0.25 ha (50 m × 50 m) plot in July 2023 and divided it into 25 sets of 10 m × 10 m grids. Sampling points were set up at the center of each 10 m × 10 m grid, and 17 additional sampling points were randomly placed, resulting in 42 soil respiration sampling points (Figure 1). To accurately capture the connection between plant and soil respiration, these 17 sampling points were positioned in areas characterized by dense woody vegetation. One month before soil respiration measurements, a polyvinyl chloride (PVC) soil ring, measuring 18.4 cm in diameter and 7.0 cm in height, was embedded 3 cm into the soil at each sampling point. These PVC soil rings remained in place, serving as the foundation for soil respiration measurements during the study duration.

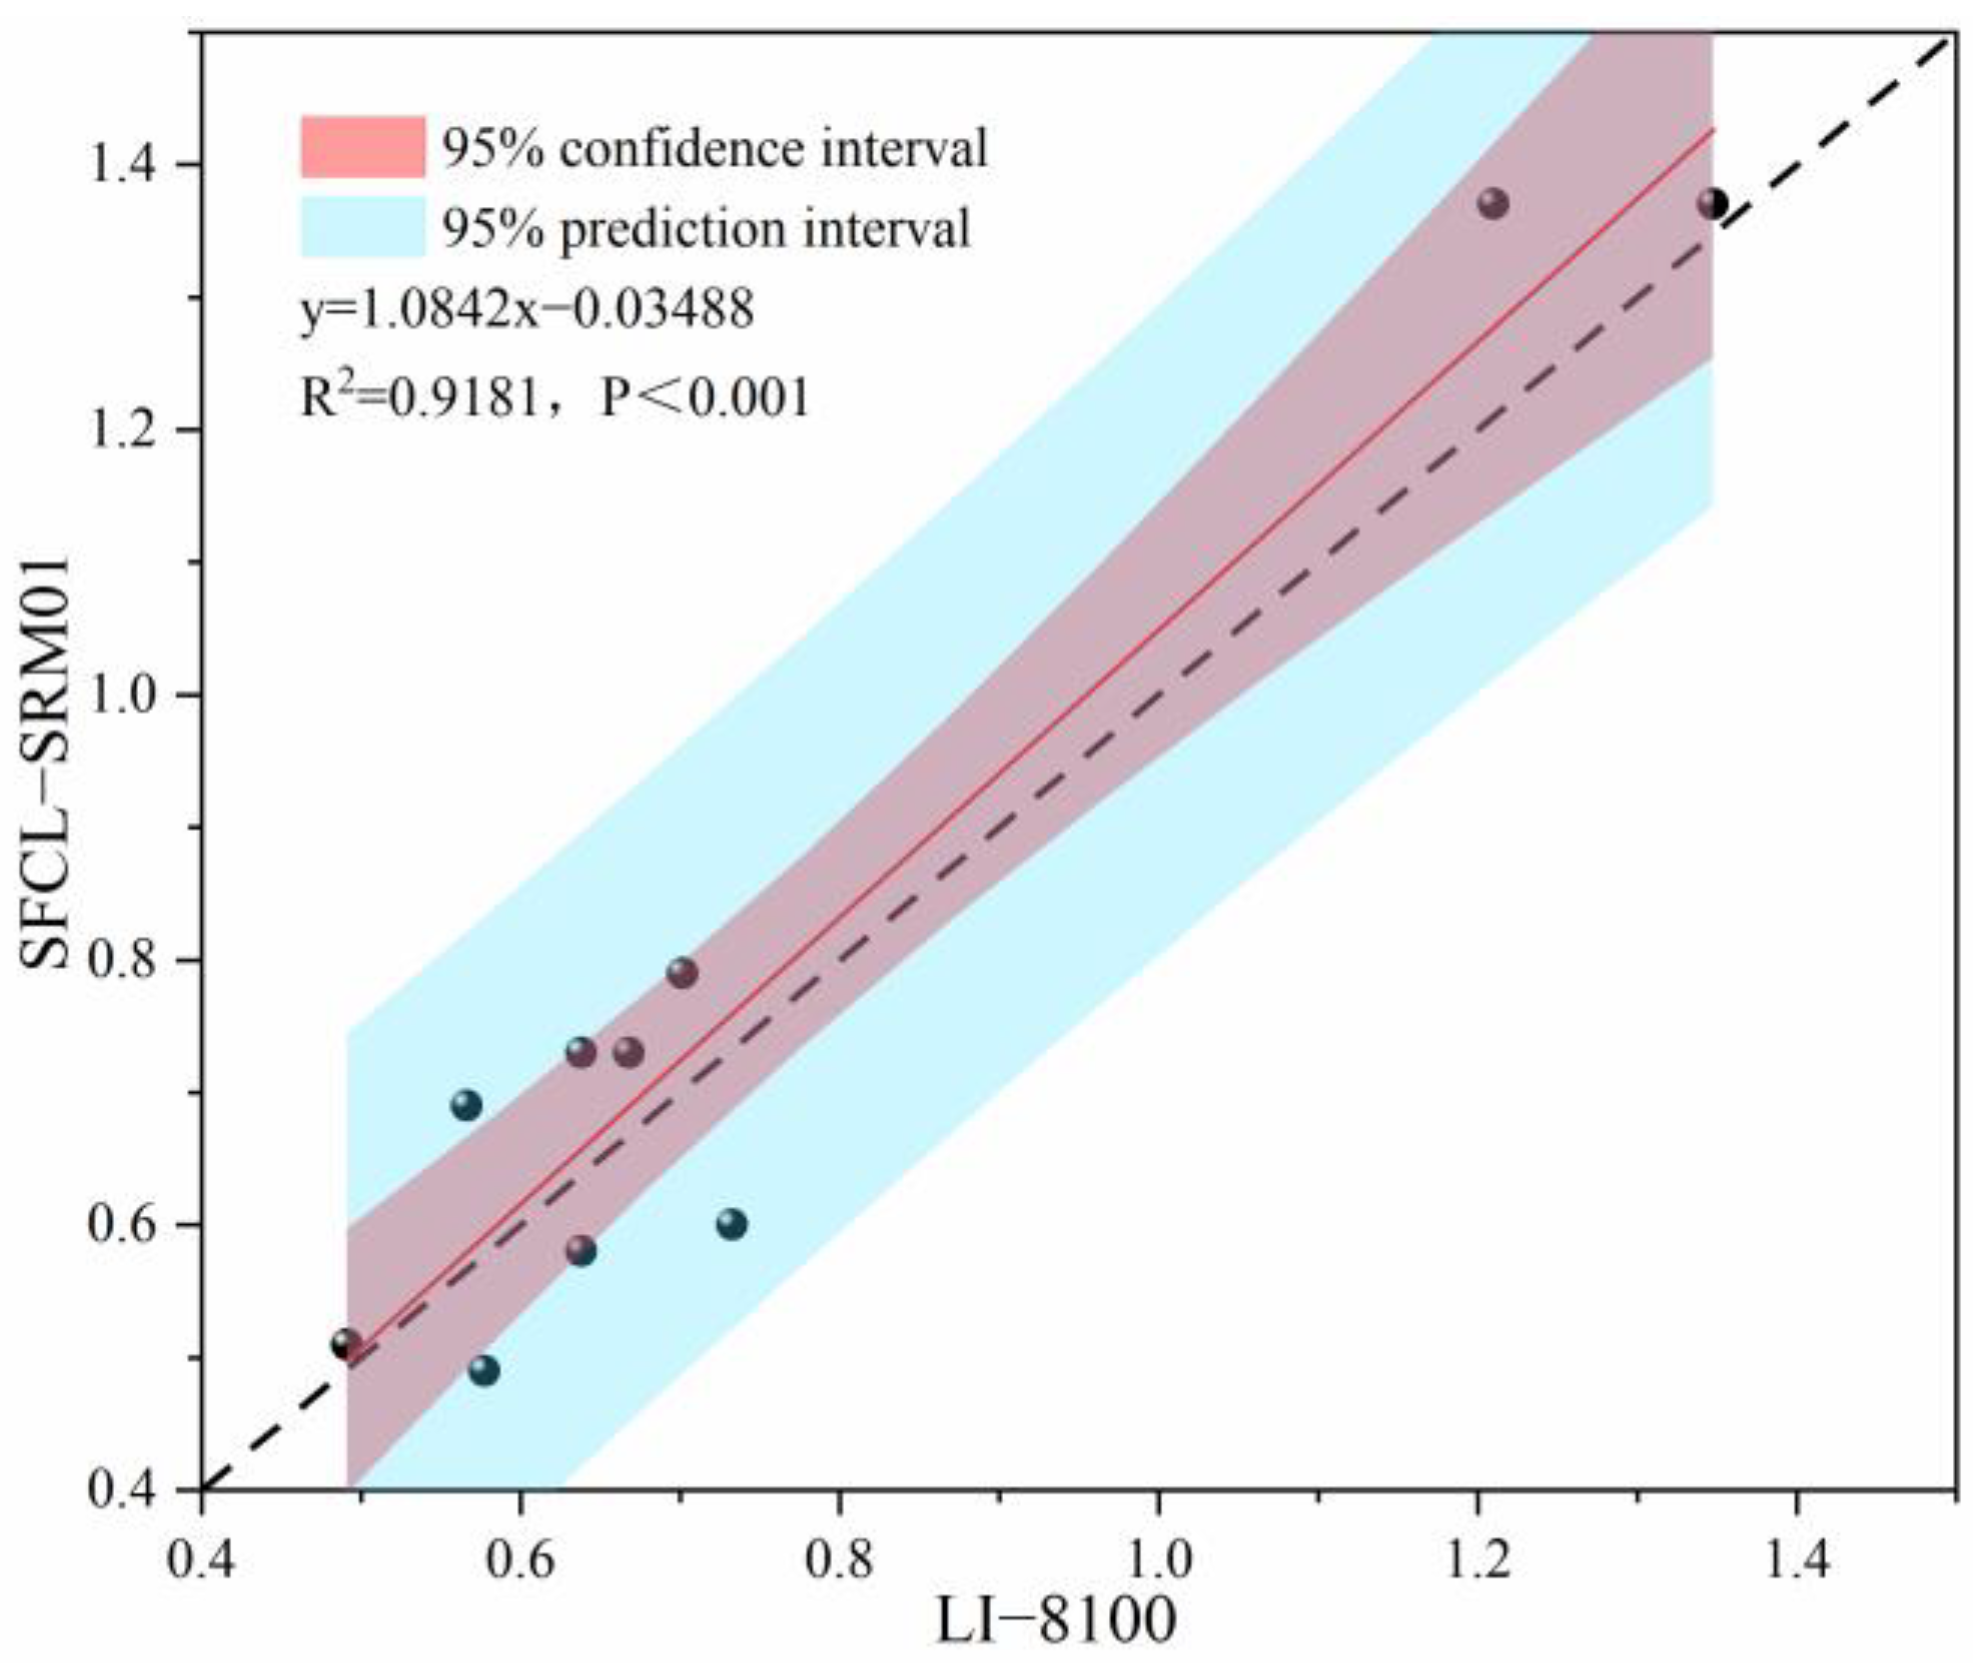
2.2. Measurements of Soil Respiration, Soil Temperature, and Water Content

To mitigate the confounding effect of temperature variations resulting from different monitoring times, we employed the “forward and backward cyclic measurement” method in the measurement process of this experiment. Specifically, the initial sampling point and sampling order were reversed within the same respiratory measurement group for consecutive measurement dates. The mean value across the entire measurement period at each sampling point was treated as a single sample. From August 2023 to July 2024, soil respiration was monitored 1–2 times per month using SFCL-SRM01 (Ehon Carbon Technologies Co., Ltd., Hangzhou, China). Before measurement, we ensured no rainfall occurred within three days and removed plants from the soil ring. Over 12 months, we conducted the measurement fieldwork 19 times. Each sampling point was measured three times to ensure accuracy. Each measurement duration was 3 min, with an effective measurement time of 90 s after subtracting preheating and air chamber turnover times. Simultaneously with the soil respiration measurements, a composite sensor probe (Zhongxing EP Ltd., Shenzhen, China) was used to measure soil temperature and water content around the soil ring to a depth of 5 cm. All measurements were taken between 8 am and 12 pm on their respective days [27].
Prior to formal experimentation, the sensors underwent zero-point calibration with 99.99% nitrogen gas, followed by span calibration using 400 ppm CO2 gas to mitigate potential zero-point drift and nonlinear response artifacts. To verify the reliability of the SFCL-SRM01 measurement results, LI-8100 (Li Co., Lincoln, NE, USA) was compared with the former instrument in grassland, farmland, coniferous forest, and broad-leaved forest in January 2024. After one instrument completed the measurement, the other immediately measured the sites using the same soil ring. We performed regression analysis on the measurement results of the two instruments separately. The regression analysis in Figure 2 shows a highly significant linear correlation (p < 0.001, R2 = 0.9181) between the measurement results of the two instruments. This linear relationship indicates that the instrument in this study is highly reliable in measuring soil respiration.
SFCL-SRM01 employs the dynamic open-box method to determine the CO2 emissions from soil, leveraging physical properties of infrared absorption by carbon dioxide and the principles of diffusion and convection between soil air and atmosphere. The calculation of soil respiration is as follows:
f = 10 v p 0 R S T 0 + 273.15 1 ϕ w 0 C c t
In the formula, v represents the total volume of the gas chamber, p0 denotes the initial pressure, R is the gas constant, S refers to the surface area of the soil being covered, T0 is the initial temperature, φ is the relative humidity of air, w0 is the molar fraction of saturated water vapor at a certain temperature, and ∂C’C/∂t is the rate of change in CO2 per unit time (Table 1).

2.3. Soil Sampling and Environmental Factor Investigation

In September 2023, manual measurements were conducted using diameter tapes at 1.3 m height to mark and measure all woody plant stems with a diameter at breast height (D.B.H.) ≥ 5 cm within the study plots. Geographic spatial coordinates were established, and vertical coverage images were captured. Canopy coverage quantification was conducted using a vegetation coverage measuring instrument: (1) vertically orient the sensor at 1.8 m above ground level to capture upward-facing hemispherical photographs; (2) process images using software with a predefined circular sampling window to extract canopy openness metrics for subsequent calculation of tree diameter at breast height and vertical canopy closure within a 5-m radius of the monitoring point (Table A1). In October 2023, three soil cores (4.5 cm diameter, 10 cm depth) were randomly collected from each of the 42 sampling sites using an undisturbed soil auger, resulting in a total of 126 soil cores. These cores were thoroughly homogenized to form composite samples, yielding 42 independent composite samples (each with only one replicate) for subsequent analyses. After passing the sample through a 2 mm sieve and removing stones and other impurities, the fresh soil was divided into two parts. One part was utilized to determine soil ammonium nitrogen, the concentration of nitrate nitrogen, and microbial biomass carbon. The other part was naturally air-dried indoors to measure the properties of the soil. In January 2024 and July 2024, all aboveground parts of herbaceous plants within a 0.5-m radius of each monitoring point were collected, representing repeated measurements at the same location. The samples were oven-dried at 105 °C for 8 h and weighed to determine dry mass. The values from the two sampling campaigns were averaged to derive the aboveground biomass metric for understory herbaceous plants.
Soil texture and specific surface area were measured using a Malvern Mastersizer 3000 (Malvern Instruments Ltd., Worcestershire, UK). The soil pH levels were obtained using a pH meter (S400-B, INESA, Shanghai, China) with a soil-to-water mass ratio of 1:5. Soil microbial biomass carbon concentration was measured using the chloroform fumigation method and a total organic carbon analyzer (Liqui TOC II, Elementar Analysensysteme GmbH, Langenselbold, Germany). Soil organic carbon was determined using the potassium dichromate external heating method [28]. Soil ammonium nitrogen and nitrate nitrogen were determined using an ultraviolet spectrophotometer (UV1900, Kesda Electronic Technology Ltd., Shenzhen, China). Soil bulk density was determined using the core cutter method with 100 cm3 cutting rings. Three replicate soil samples were collected randomly around each sampling point, oven-dried at 105 °C until constant weight was achieved, and then calculate the bulk density of the topsoil layer.

2.4. Statistical Analyses

This paper presents descriptive statistics of soil respiration and the measured biological and abiotic factors, including their mean, maximum, minimum, standard deviation, and Shapiro-Wilk test, to reflect their typical levels and discrete trends at the fine scale. The coefficient of variation (CV, %) was calculated to quantify the spatial variability of various factors, which is calculated by the ratio of standard deviation to mean. In addition, the distribution frequency of parameters and spatial distribution characteristics of soil respiration, soil temperature, and soil water content in the study area were obtained by combining bar charts and box plots and the Kriging interpolation method. In this study, the ordinary kriging prediction model was employed for spatial variable visualization [29]. Before using Kriging interpolation, it is necessary to ensure that the spatial distribution of parameters has spatial autocorrelation, which is a prerequisite for spatial interpolation. A variant model was used to determine that soil respiration and soil temperature displayed strong spatial autocorrelation, whereas soil moisture demonstrated moderate spatial autocorrelation (Table A2). Before using Pearson correlation analysis, we transformed the non-normal data to approximate or achieve a normal distribution.
Soil respiration exhibits high spatial variability, typically requiring a large number of sampling points to obtain reliable estimates of ecosystem respiration. This study employed the method proposed by Petersen and Calvin [30] to estimate the required sample size for determining the mean soil respiration flux within a specific confidence interval. The calculation was performed as follows:
n = s 2 t α 2 D 2
In the formula, n represents the minimum number of sampling points within a certain confidence interval and error level; s2 represents the sample variance; tα denotes the t-statistic at a given probability level α; D is the prescribed margin of error.
Vertical canopy closure was segmented and classified using supervised classification in ENVI (v5.3; Harris Geo-space Solutions, Boulder, CO, USA), involving the selection of feature parameters, the establishment of discriminant functions, and subsequent image classification. All statistical analyses were conducted using IBM SPSS (v27.0.1; IBM Corp., Armonk, NY, USA) and the SPSS Pro online platform. Data visualization was completed in ArcGIS Pro (v3.0; Esri, Redlands, CA, USA) and Origin (v2022; OriginLab Corporation, Northampton, MA, USA).

3. Results

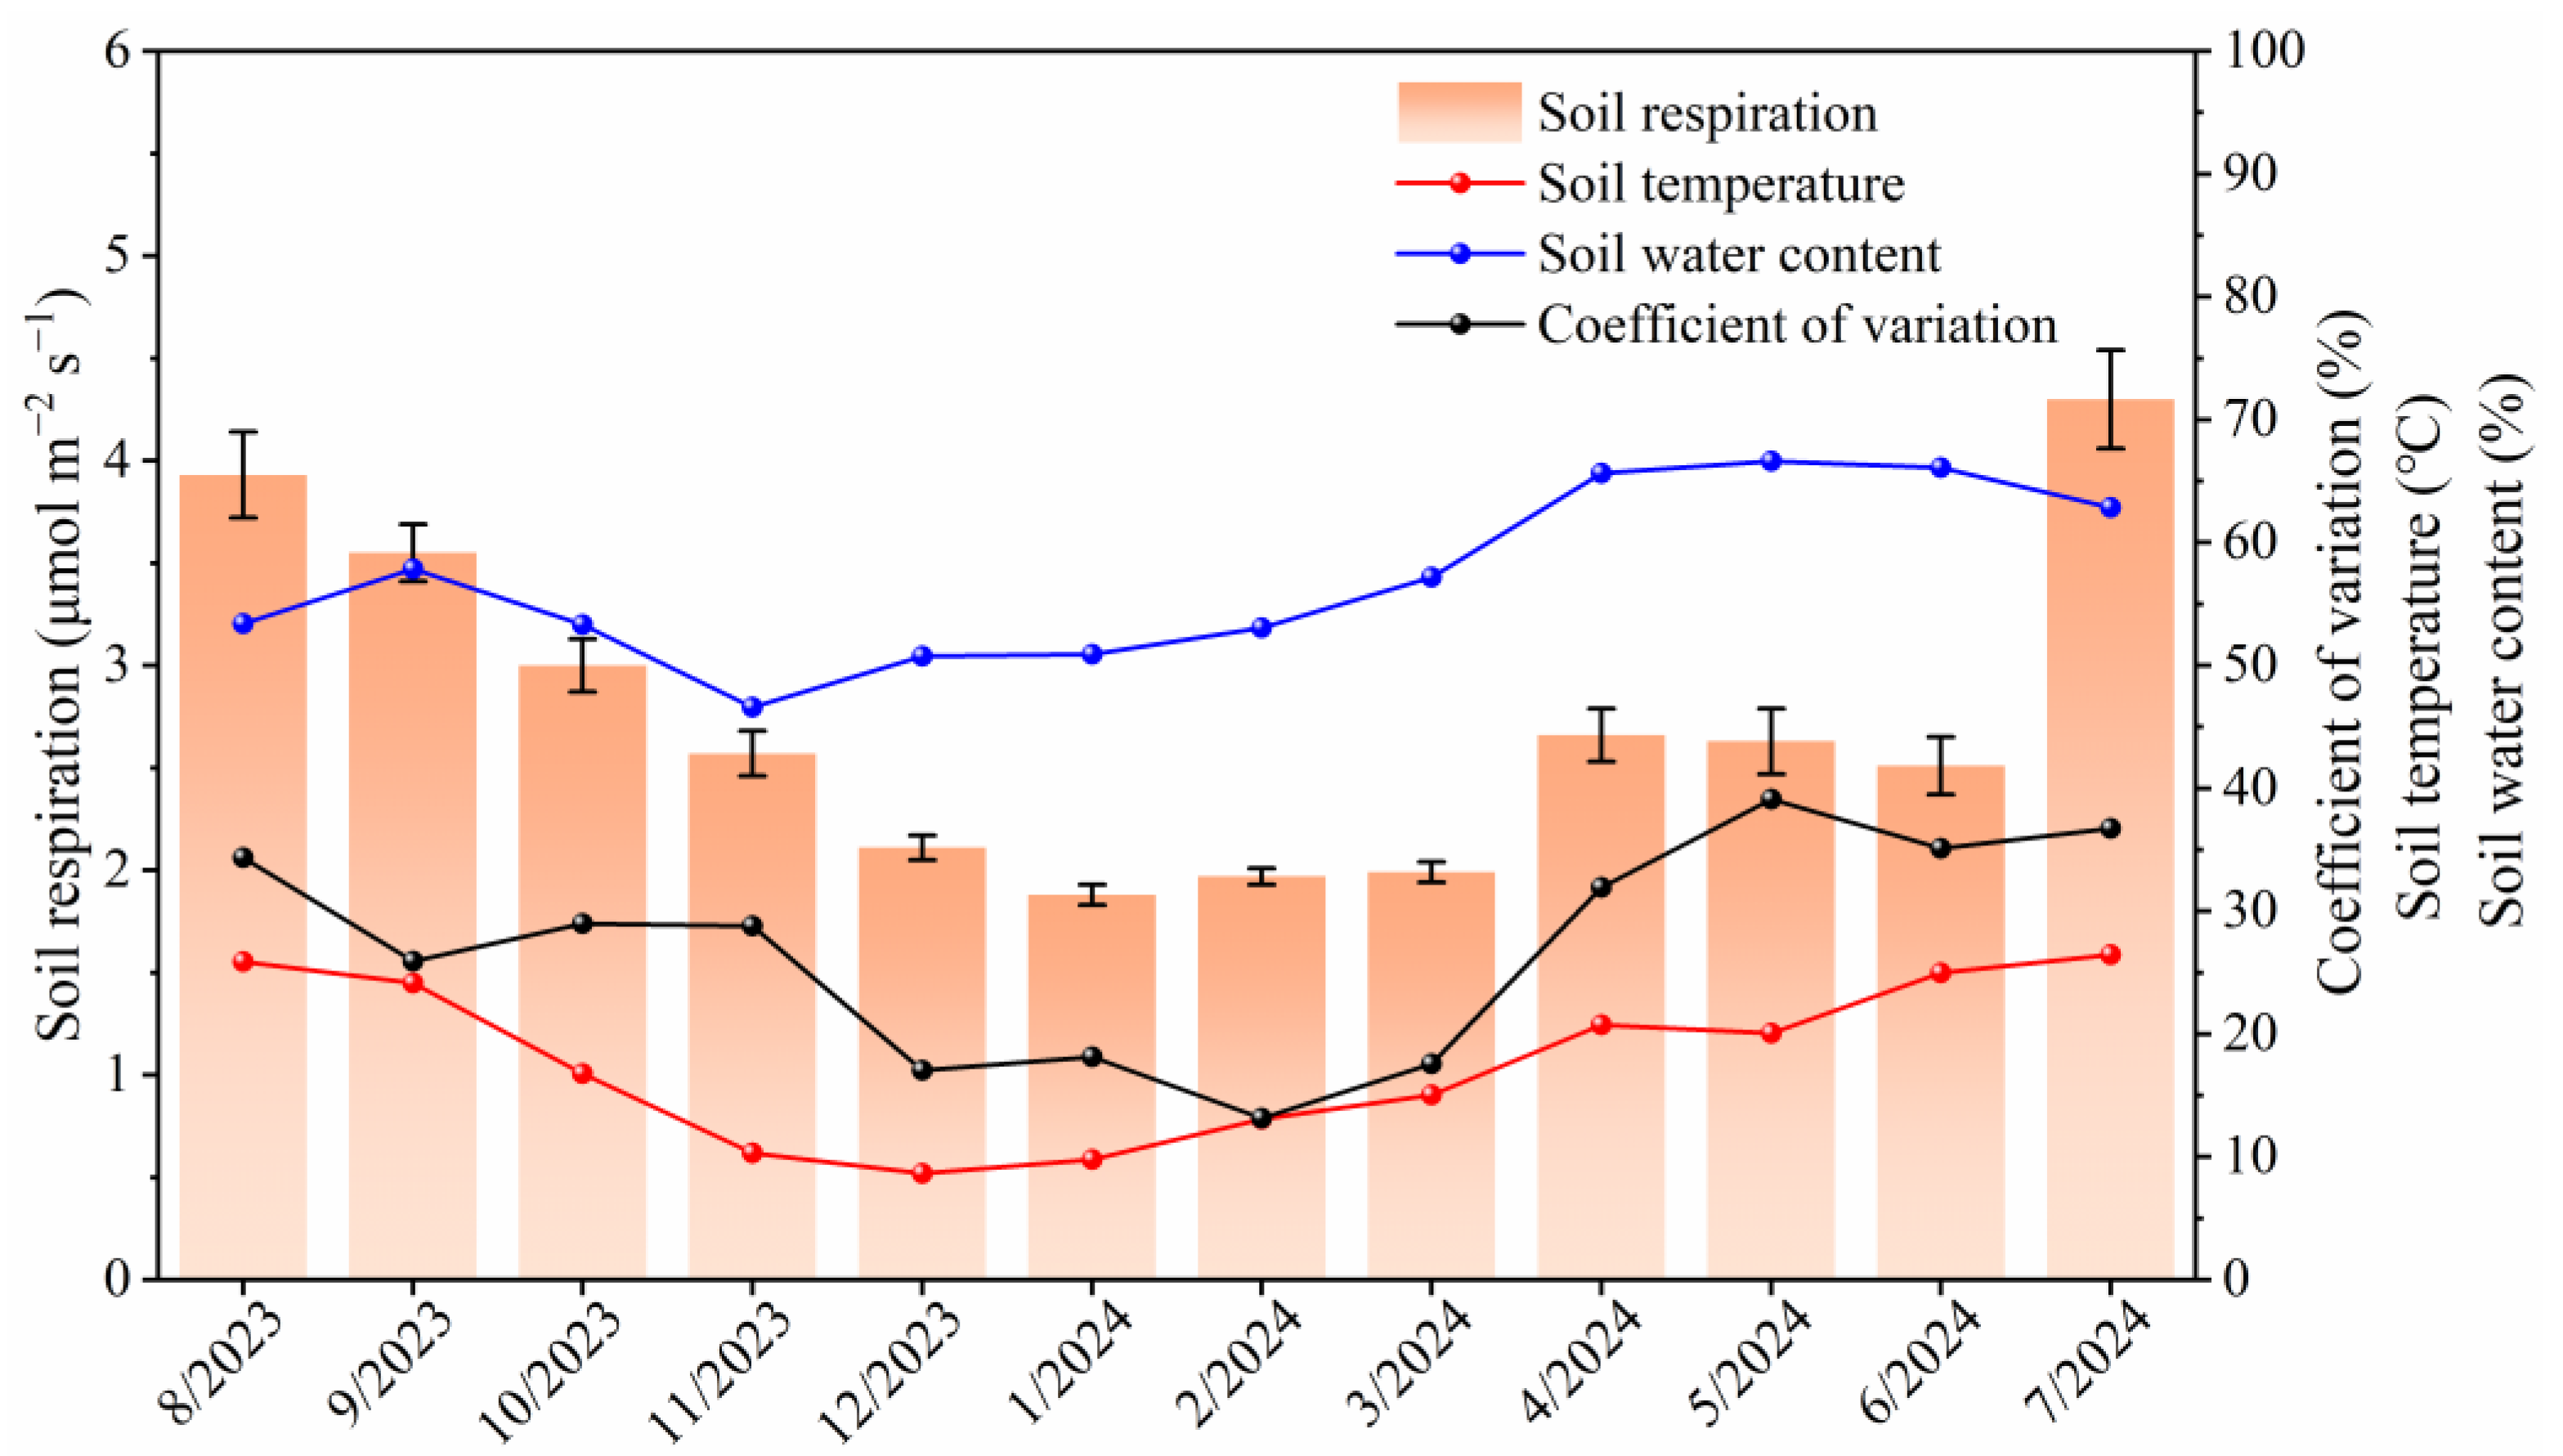
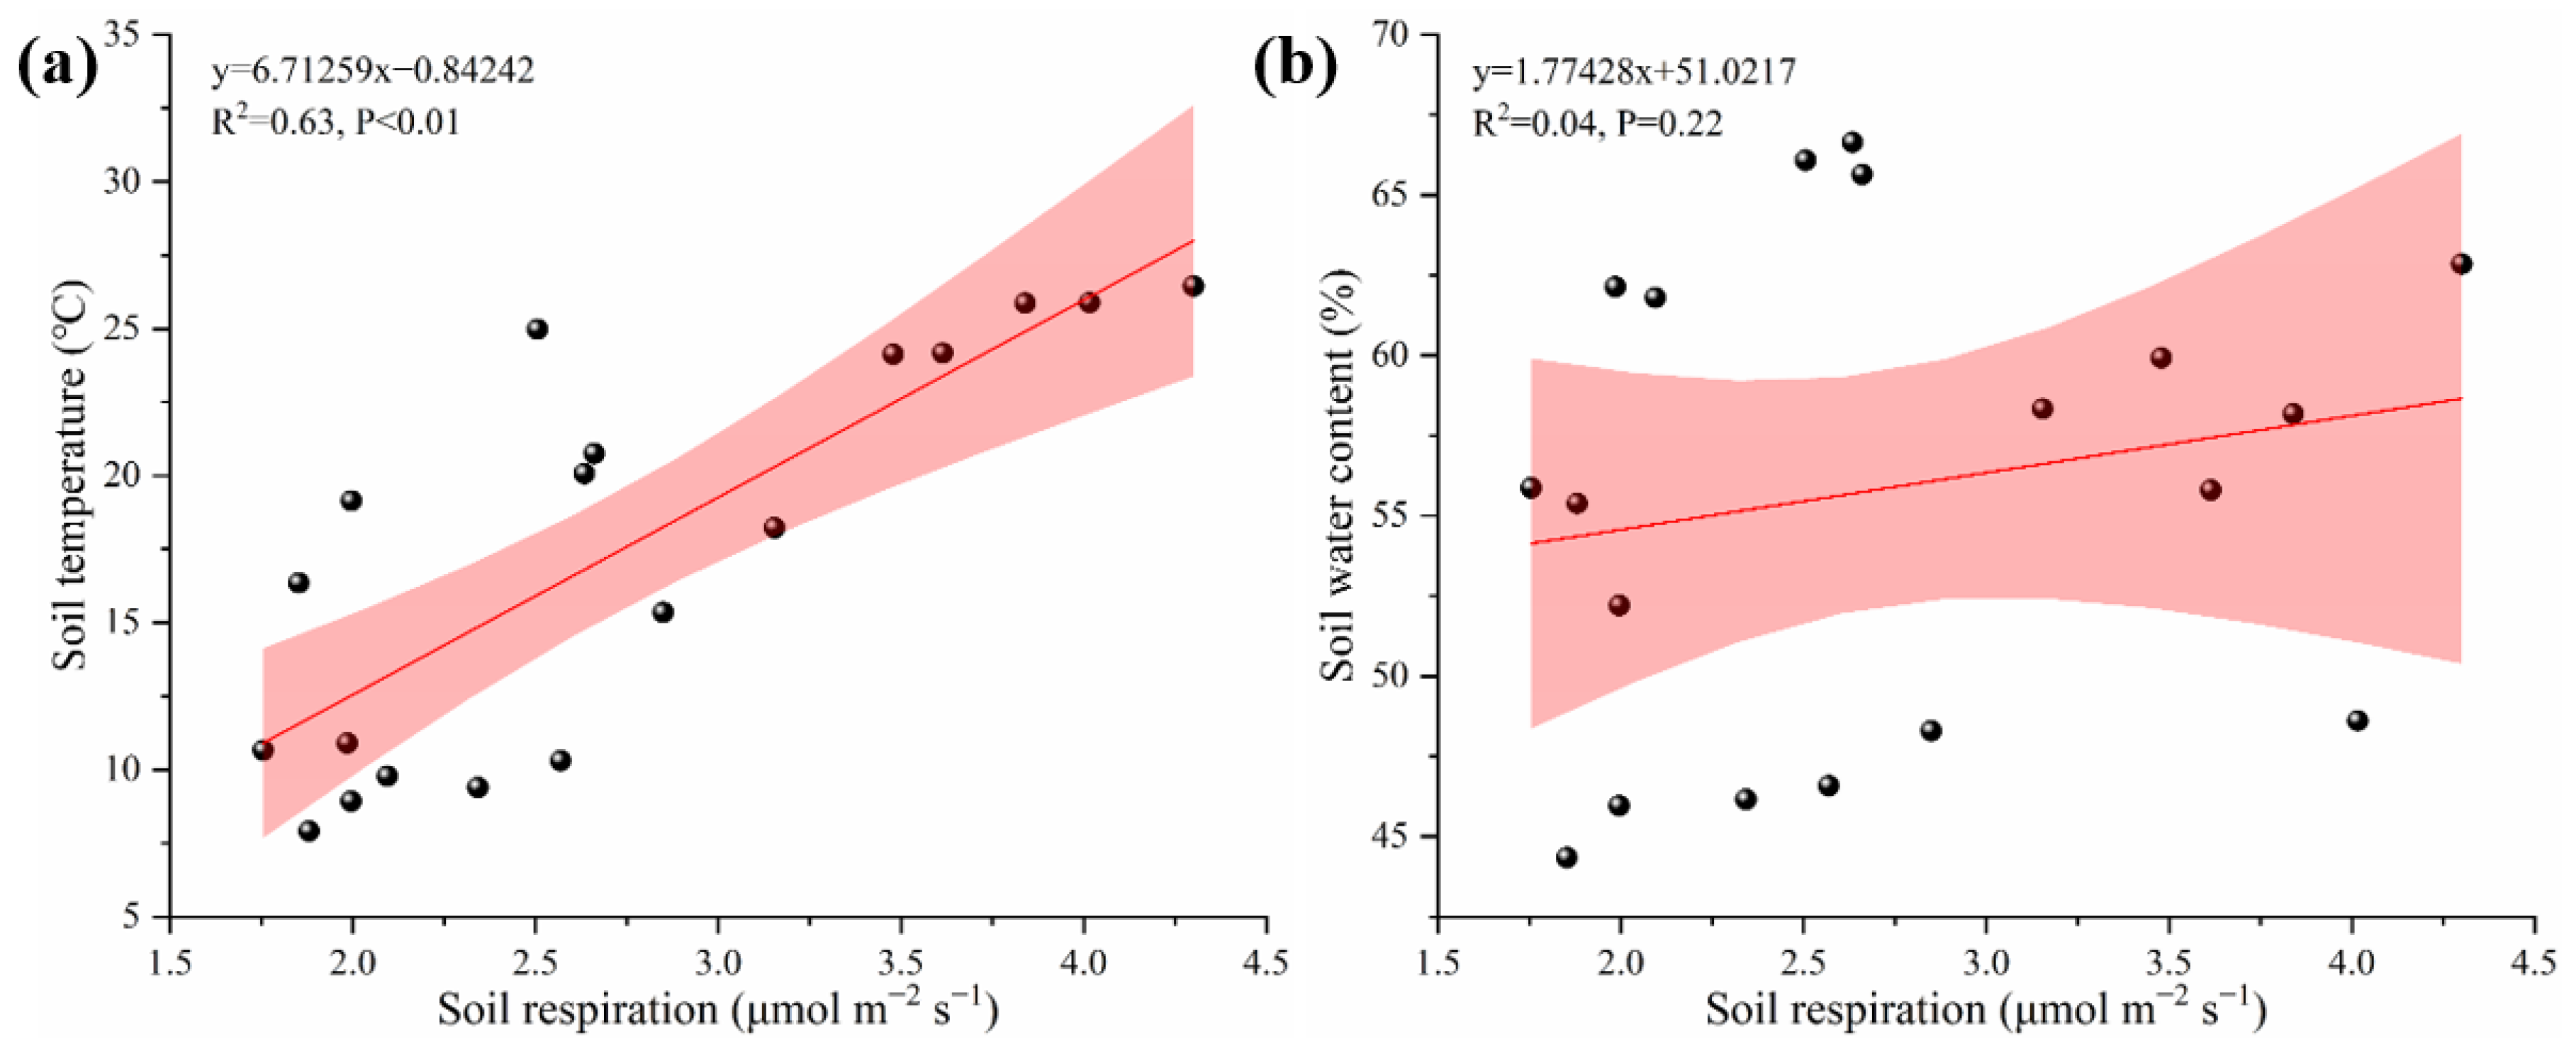
3.1. Temporal Variations in Soil Respiration and Soil Environmental Factors

During the study period, soil respiration exhibited dynamic changes on a monthly scale, with the highest value (4.3 μmol m−2 s−1) in July and the lowest value (1.89 μmol m−2 s−1) in January (Figure 3). The monthly variation of soil respiration is significantly positively correlated with soil temperature (p < 0.01), while there is no significant relationship with soil water content (p > 0.05) (Figure 4). Soil temperature explained 63% of the temporal variation in soil respiration. In addition, we calculated the coefficient of variation (CV) of soil respiration at different temporal scales and found that the CV at the monthly scale fluctuated between 13.17% and 39.10% (Figure 3). However, when calculating the CV of soil respiration at the annual scale, the CV value was only 18.82% (Table 2).

3.2. Soil Respiration’s Spatial Distribution Characteristics and the Factors of Environment

As expected, spatial heterogeneity exists in soil respiration, biotic factors, and abiotic factors, even at our relatively small study scale (50 m × 50 m). The annual average soil respiration rate ranged from 1.89 to 4.83 μmol m−2 s−1, with a mean of 2.71 ± 0.51 μmol m−2 s−1 and a CV of 18.82% (Table 2), indicating a moderate level of spatial variability. The diameter at breast height of trees within a 5 m radius around the sampling points ranged from 0 to 172.9 cm, with a CV of 63.74%. And the aboveground biomass of herbaceous plants varied between 3.8 and 96.8 g m⁻2, demonstrating a CV of 66.95%. These findings indicate that the vegetation distribution in the study area exhibits pronounced spatial heterogeneity. In addition, soil physical factors had lower spatial variability compared to biotic factors and soil chemical factors: soil temperature (2.89%), clay content (6.99%), soil bulk density (7.05%), soil water content (11.36%), soil specific surface area (18.54%), and silt content (28.25%). However, the spatial variability of sand content (60.36%) was higher than most other variables. The spatial variability of soil chemical factors was as follows: pH (4.51%), nitrate nitrogen (42.55%), ammonium nitrogen (43.5%), and soil organic carbon (46.85%).
The S-W test showed that soil water content, diameter at breast height, microbial biomass carbon, clay content, bulk density, and soil-specific surface area were normally distributed (p > 0.05). Soil respiration, soil temperature, the canopy vertical coverage, aboveground biomass of herbaceous plants, soil organic carbon, ammonium nitrogen, nitrate nitrogen, pH, sand content, and silt content were non-normally distributed (p < 0.05) (Table 2).
Based on the Kriging interpolation method and box plot analysis, we found that soil respiration exhibits two hotspots and several areas with low respiration values, displaying considerable spatial variation without distinct distribution patterns (Figure 5a,b). Overall, soil temperature and water content show a relatively gradual trend of change. The distribution of soil temperature reveals higher temperatures on the east and west sides and lower temperatures on the north and south sides as well as in the middle (Figure 5d). Furthermore, the west side exhibits lower soil water content, while the overall water content on the north and south sides is relatively high (Figure 5e,f).

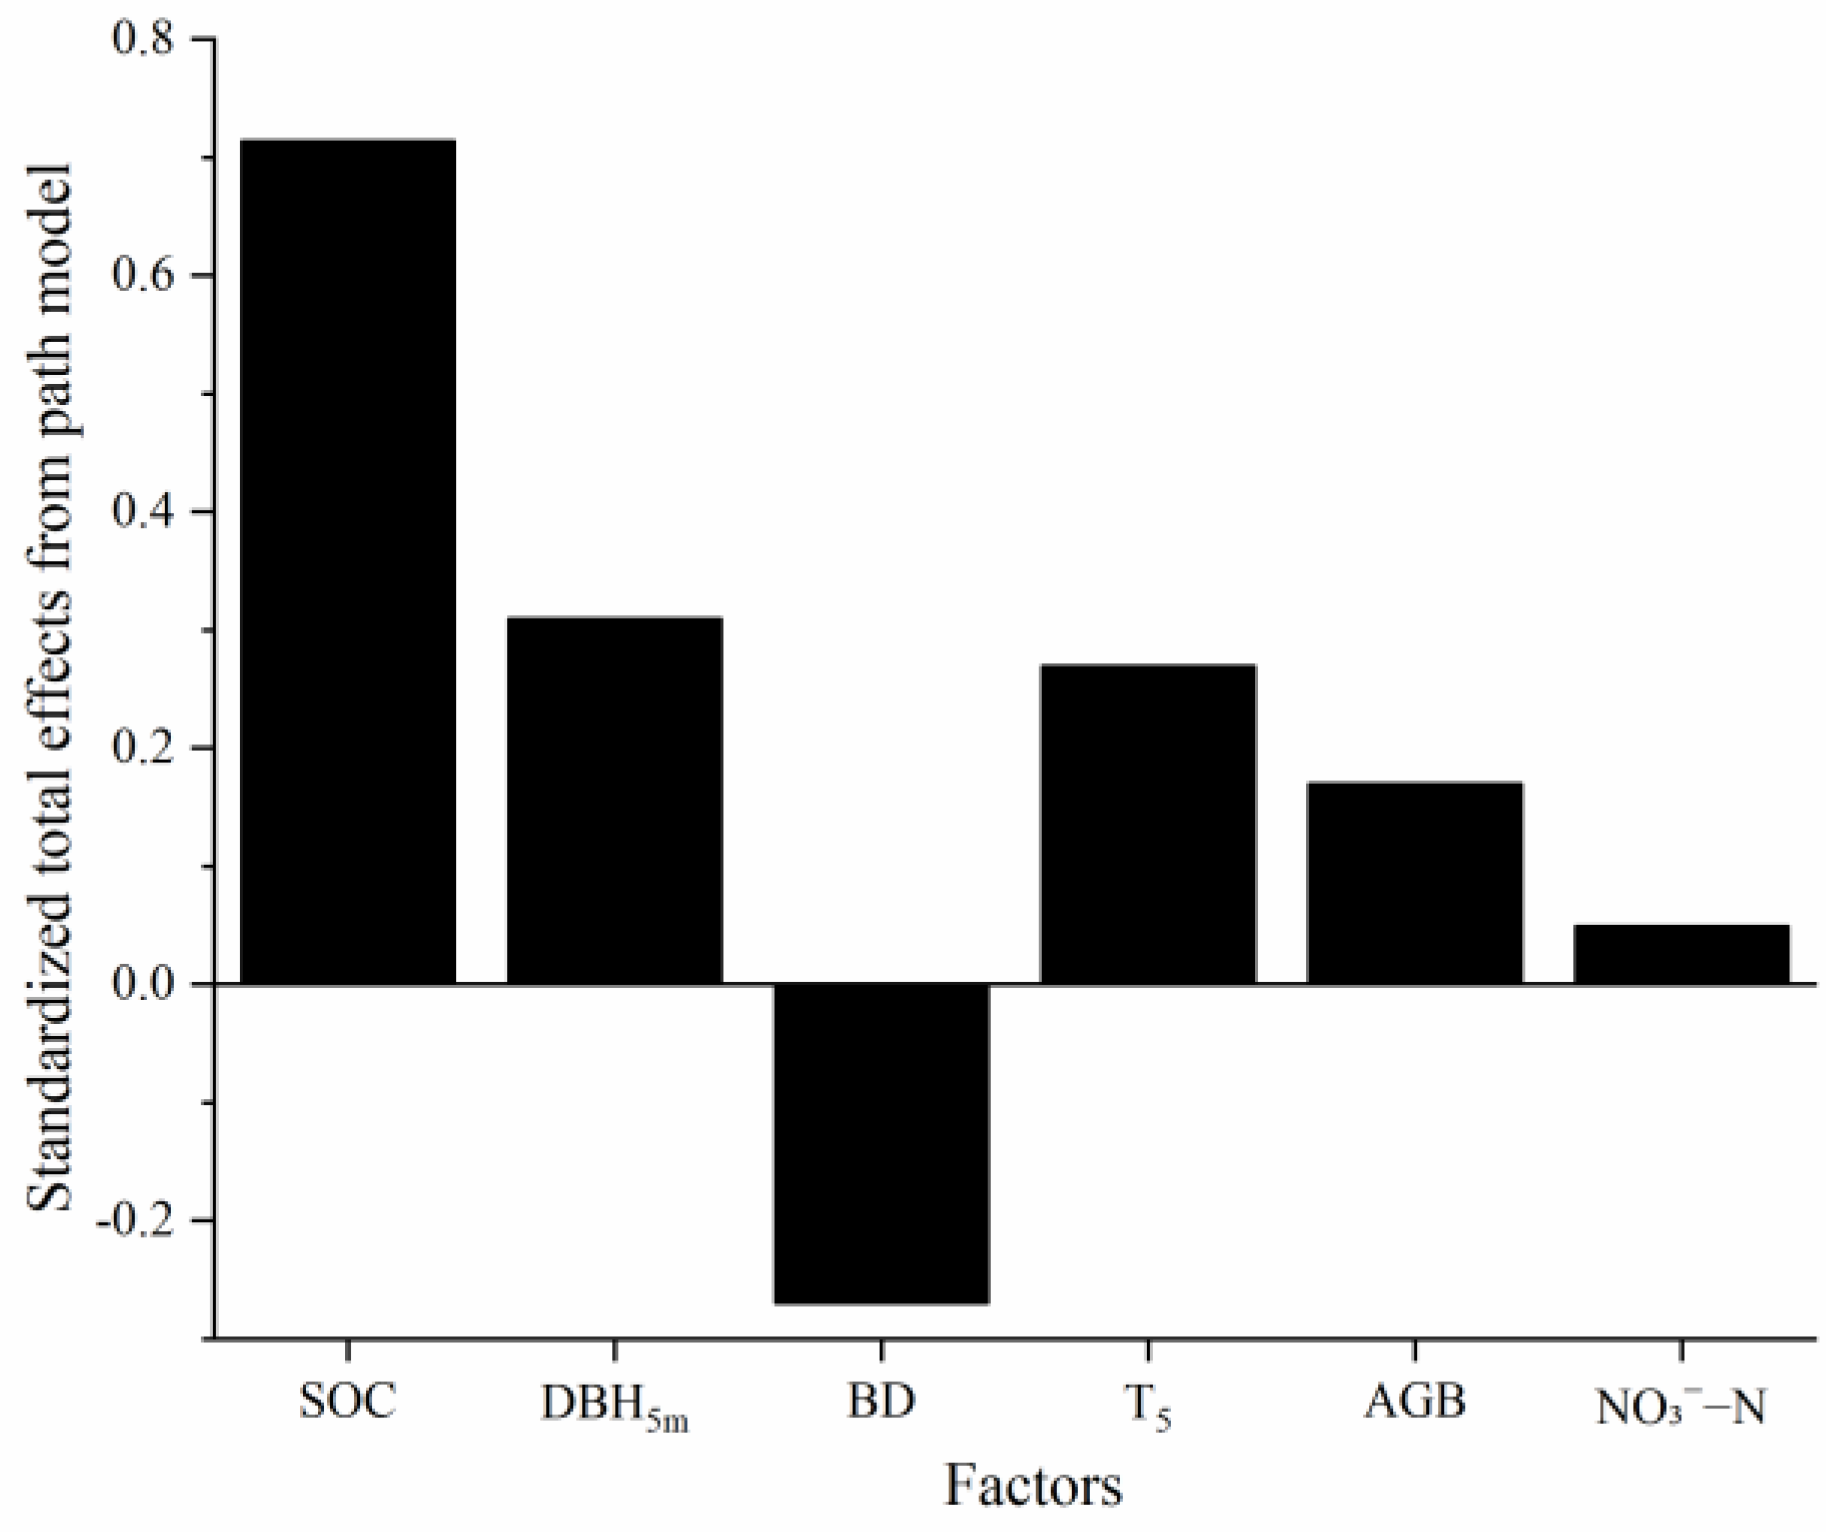
3.3. Main Drivers of Spatial Heterogeneity in Soil Respiration

The path model examined the direct and indirect influences of predictive factors on Rs. Soil organic carbon, diameter at breast height within a radius of 5 m, soil temperature, and soil bulk density exert the greatest impacts on soil respiration, with standardized total effects of 0.71, 0.31, 0.27, and −0.25, respectively (Figure 7). Evidently, soil organic carbon is pivotal in the spatial variability of soil respiration. Beyond exerting a direct and highly significant positive influence on soil respiration (p < 0.001), soil organic carbon can also indirectly have a positive impact on soil respiration through a highly significant negative correlation with soil bulk density (p < 0.01) (Figure 6). Among them, diameter at breast height within a radius of 5 m demonstrates a significant positive correlation (p < 0.05) with soil organic carbon content, highlighting its role as a key factor influencing soil organic carbon levels. Furthermore, diameter at breast height within a radius of 5 m exhibits a highly significant negative correlation (p < 0.01) with soil temperature, exerting a certain negative feedback effect on soil respiration. Overall, the spatial variability of soil respiration is explained by the studied variables to a degree of 52%.

4. Discussion

4.1. Spatial Variation of Soil Respiration

The variability of soil respiration is broad, from local areas of just a few square centimeters to a global scale [31]. Despite often having similar climatic conditions, vegetation types, and soil textures within the same area or sample plot, studies on soil respiration at fine scales still indicate high spatial variability (CV). In this article, the average CV of soil respiration over the entire research period was 18.82%, while the CV value for soil respiration calculated on a monthly scale ranged from 13.17% to 39.10%, indicating a moderate level of variability. This finding is also supported by the conclusion that the CV value of soil respiration in the warm area is primarily centered at 32.6% ± 14.5% [14]. Moreover, its high variability has also been observed in some studies at fine scales. For instance, in a subtropical broad-leaved forest with a research scale of 25 m × 50 m, the CV of soil respiration was 38.9% [24]; in a poplar forest with a scale of 100 m × 100 m, the CV for soil respiration measured at Intervals of 1–2 m was 36% [32]; Yim et al. obtained a CV value of 28% from 50 respiratory sampling points in a 30 m × 30 m artificial larch forest [33].
However, it should be noted that the CV values of soil respiration calculated on a monthly scale are mostly higher than the average CV values of soil respiration throughout the entire study period. This article posits that averaging multiple monitoring data may reduce the discrepancies between certain respiratory high or low values and those of other sampling points and also mitigate anomalies in respiratory values caused by accidental events in single measurements, thereby explaining this phenomenon. By fitting the coefficient of variation of soil respiration with soil temperature and water content using linear regression, it is found that these two factors significantly influenced the spatial variability of soil respiration (p < 0.05). Soil temperature explained 55% of the variation in soil respiration, while water content explained 38%. Furthermore, studies have shown that even within the same region, the spatial variability of soil respiration during the rainy season is significantly greater than during the dry season (p < 0.001) [34]. There are also studies indicating that months with high soil water content may result in higher soil respiration CV values [35]. However, in this study, the CV of soil respiration has a weak correlation with soil water content. The possible reason is that soil water content is not a constraint factor for soil respiration during the study period. Therefore, when measuring the CV of soil respiration, we need to assess the effect of different months, seasons, and climate conditions on it. In addition, high variation of soil respiration means that even at smaller monitoring scales, we need sufficient sampling points to improve the accuracy of estimation [5,36]. To this end, we use the formula proposed by Petersen and Calvin (Formula (2)) to calculate the minimum number of sampling points under specified confidence intervals and error limitations. In this assessment, using the CV of the annual mean soil respiration as the standard, at a 95% confidence interval and a 10% error level, at least 24 soil respiration sampling points need to be set up to meet the accuracy requirements. More sampling points are required in shorter time scales or with fewer monitoring events. Numerous studies have shown that when estimating average soil respiration in ecosystems based on random sampling schemes, at least 30 or more sampling points are required within a 90% confidence interval [37,38]. Currently, many estimates of soil respiration in ecosystems only use ten or even fewer sampling points. Given the above conclusions, the variability of soil respiration brings significant uncertainty to the precise assessment and calculation of soil carbon balance. It is essential to calculate the optimal number of sampling points at different scales, climate zones, vegetation conditions, and soil conditions to obtain a higher confidence level in future soil respiration research [39].

4.2. Drivers and Potential Pathways of Spatial Variability in Soil Respiration

In the hypothesis of this article, the spatial resource distribution differences of woody plants at a fine scale are the fundamental cause of soil respiration variability. To further explore the potential correlations between variables, we used Pearson correlation analysis to fit the parameters. Soil organic carbon, soil bulk density, soil temperature, and water content are the leading causes of spatial variation in soil respiration, and most of these factors are significantly regulated by canopy coverage (Figure 6 and Figure A1). Additionally, the vertical coverage of the canopy is highly significantly influenced by diameter at breast height within the range (p < 0.001, Figure A1); thus, we can consider diameter at breast height as the initial variable responsible for the variation in soil respiration. In other words, the spatial distribution and growth of woody plants significantly affect soil respiration. This conclusion is backed by other studies, such as Zhao Xin observed that the relationship between distance and Rs was empirically fitted using various functions and found a significant correlation with soil respiration [40]. In another study, soil respiration showed a moderate correlation with diameter at breast height within a range of 6 m [41]. The path analysis also confirms the hypothesis of this article to a certain extent.
Studies suggest that in warm and tropical regions, areas experiencing significant variations in canopy and short vegetation coverage (less than 5 m in height) experience more frequent changes in Rs [15]. Based on existing research results, this article discusses the main pathways through which the distribution of woody plants affects soil respiration, as follows:
(1) Shading effects: Organic carbon is the main factor affecting soil CO2 efflux [42], and in this study, its standardized total effect reached 0.71 (Figure 7). The vertical vegetation coverage and the diameter at breast height within a 5 m range have a highly significant positive impact on organic carbon accumulation (Figure A1, p < 0.001). High-density vegetation distribution can increase the input of soil litter, thereby increasing soil organic carbon content [43,44]. However, some literature suggests that the input of litter has a relatively small impact on the organic carbon storage of subtropical soils [45]. A possible explanation for this is that the surface carbon stock is insensitive to changes in leaf litter input over a short period of time [46]. Furthermore, high leaf litter input can also have an impact on soil microbiota [47]. In another aspect, the shading effect of woody plants provides favorable conditions for storing organic carbon. In this article, canopy coverage has a positive impact on soil organic carbon storage by reducing temperature and humidity (Figure A1). Existing research has confirmed this conclusion: increased soil temperature enhances the mineralization of organic matter, thus leading to a decrease in soil organic carbon content [48]. The content of easily decomposable organic carbon in soil is lower in soils with high relative humidity [49], mainly due to the decrease in microbial activity [50,51]. In addition, there is a negative correlation between tree diameter at breast height (DBH), vertical canopy coverage of shrub layers, and the aboveground biomass of herbaceous plants (Figure 6 and Figure A1). Therefore, the spatial distribution of woody vegetation exerts a certain inhibitory effect on the growth of understory herbaceous vegetation in subtropical coniferous-broadleaved mixed forests. The main reason is that woody vegetation suppresses the growth of understory herbaceous plants through canopy and nutrient competition [52]. These conclusions demonstrate that the spatial distribution of woody plants can regulate key factors such as understory soil temperature-humidity, soil organic carbon, and aboveground biomass of herbaceous plants, thereby forming biological regulation pathways.
(2) Soil structure: Soil bulk density has a negative correlation with soil respiration and is primarily regulated by soil organic carbon, diameter at breast height within a five-meter radius of the sampling point, and vertical coverage (Figure A1). The ideal soil bulk density can provide sufficient air and appropriate humidity in the soil, thereby promoting gas exchange between the soil and the atmosphere. Soil organic matter can reduce soil bulk density [53,54], while canopy coverage can indirectly affect soil bulk density through the output of litter (Figure A1). In addition, plant root activity can further expand soil pores, thereby decreasing soil mass density [21,55]. Therefore, vegetation also exerts a considerable influence on soil CO2 flux during the process of regulating soil structure, an influence that cannot be ignored.
(3) Root distribution: Estimating root biomass by constructing an allometric equation between vegetation factors (diameter at breast height, basal diameter, canopy, tree height, and aboveground biomass) and root biomass has been widely used [40,56,57]. These models mainly come from destructive sampling [58], so they have a certain explanatory power for root biomass. This also means that the distribution and growth of vegetation have a direct impact on the distribution of roots. Literature suggests that plant roots contribute to 42% of global soil respiration [59], and numerous source-separation experiments on soil respiration have also confirmed that root respiration is a significant component of soil respiration [60,61,62]. In addition, the turnover of roots can provide rich carbon sources for the soil, directly affecting the distribution of organic carbon [63]. Therefore, it is believed that the feedback of woody plant distribution on root biomass is one of the critical pathways affecting soil respiration.
This study observes a significant positive correlation between soil respiration and nitrate nitrogen but not with ammonium nitrogen (Figure A1). Current research mainly focuses on the effects of nitrogen addition and deposition [55,64] on soil respiration, with almost no comparative studies on ammonium nitrogen and nitrate nitrogen with soil respiration. A possible explanation for this is that when ammonium nitrogen is converted to nitrate nitrogen, protons are released, which promotes the decomposition of consolidating compounds and the release of soil carbon [65]. This article noted that the aboveground biomass of understory herbaceous plants had almost no effect on soil respiration (Figure A1), which contradicts previous research findings [66]. This may be related to the inhibitory effect of woody plant distribution on the growth of herbaceous layers and spatial environmental heterogeneity masking the influence of herbaceous layers on soil respiration. For example, in designed diversity experiments, it was observed that changes in the competitive exclusion, complementarity, and positive selection effects of natural communities may cause similar inconsistencies [67].

4.3. Deficiencies and Prospects in the Study of Spatial Variability of Soil Respiration

At present, little consideration has been given to soil texture in soil respiration research, and it is not clear how soil texture affects soil respiration. Research has shown that adding clay to sandy soil can significantly reduce the accumulated respiration by increasing the CEC content and enhancing the ion exchange capacity in the soil, thereby inhibiting the decomposition of organic carbon [68]. The mechanical composition of soil differentially regulates the carbon and nitrogen cycles through the dual mechanisms of physical adsorption and chemical exchange, thereby providing feedback regulation on soil respiration [69]. In addition, differences in soil texture can also affect soil water retention capacity and the threshold effect of soil respiration after precipitation, which can affect soil respiration over a specific period of time [70]. In general, due to differences in pore structure, colloid content, and hydrothermal characteristics, soils with different textures have different effects on soil respiration in certain processes [71]. In this study, the soil texture was silty loam. The analysis showed a positive correlation between soil respiration and sand content, while a negative correlation was observed between soil respiration and clay content and soil-specific surface area (Figure A1). However, this correlation was not significant (p > 0.05). This suggests that while there is a correlation trend in the data, it is not statistically reliable. Therefore, in future research, we need to expand the sample size and conduct an in-depth analysis of the effect of different soil mechanical compositions on soil respiration.
Overall, the spatial heterogeneity of soil respiration in response to environmental factors is very complex [5], but current research on spatial heterogeneity lags far behind temporal heterogeneity. Simulations at different microscales are crucial for revealing the underlying mechanisms governing macroscopic phenomena, as they provide unique insights that cannot be obtained by other methods. Therefore, it is necessary for us to conduct more in-depth research on this at the microscale or even micrometer scale [72]. In the present study, while we emphasized the influence of the spatial distribution of woody plants on the understory microenvironment, the lack of investigation into key variables (e.g., litter accumulation, root biomass) may result in some potential effects remaining unexplored. Future studies should incorporate a broader range of ecosystems, diverse topographic conditions, and additional variables that may influence soil respiration dynamics.
In light of the findings of this study, we emphasize that future forest management should prioritize dynamic management strategies integrating vegetation and environmental factors, such as implementing dynamic thinning strategies to regulate regional microclimates and conducting appropriate soil improvement to reduce cumulative CO2 emissions. Subsequent research should strengthen investigations into the correlations between key forest structural parameters (including stand density, stand age, and diameter at breast height) and understory soil carbon storage, thereby establishing a scientific foundation for enhancing forest carbon sequestration capacity. Based on extensive research on spatial variability of soil respiration and obtaining its general response to environmental factors, combined with human regulatory interventions, it is possible to reduce carbon emissions from soil carbon pools, expand soil carbon storage in terrestrial ecosystems, and provide new ideas for mitigating global climate change.

5. Conclusions

This study investigated the fine-scale spatial variability of soil respiration and its underlying mechanisms in a 50 m × 50 m subtropical mixed coniferous and broad-leaved forest. The results revealed a coefficient of variation (CV) of 18.82% for soil respiration, demonstrating moderate spatial heterogeneity. Precision requirements (95% confidence interval with 10% error tolerance) necessitate a minimum of 24 sampling points, with particular emphasis that reduced measurement frequency in experimental designs would require increased sampling density to compensate for enhanced spatial heterogeneity. In general, 52% of the observed spatial variation in soil respiration could be explained by the studied variables, with standardized total effects ranked as follows: soil organic carbon (0.71), diameter at breast height within a radius of 5 m (0.31), soil temperature (0.27), and soil bulk density (−0.25).
Furthermore, this research highlights the critical regulatory role of woody plant spatial distribution and growth patterns in shaping understory microenvironments, which constitute fundamental determinants of soil respiration variability. Consequently, we propose implementing dynamic forest management strategies integrating vegetation regulation and environmental optimization, coupled with mechanistic investigations into stand structure-soil carbon storage relationships to enhance carbon sequestration capacity. These findings provide crucial insights into the governing mechanisms of soil respiration spatial patterns, offering significant implications for precise regional soil carbon flux estimation and advancing understanding of global ecosystem carbon cycling processes.

Author Contributions

Z.C.: Writing—original draft, Writing—review and editing, Investigation, Conceptualization. Y.C.: Writing—review and editing, Investigation, Conceptualization. C.P.: Writing—original draft, Writing—review and editing. H.J.: Investigation. Z.J.: Software, Data curation. C.L.: Formal analysis. G.Z.: Supervision, Conceptualization, Methodology, Project administration. All authors have read and agreed to the published version of the manuscript.

Funding

This research was funded by the Joint Research Fund of the Department of Forestry of Zhejiang Province, the Chinese Academy of Forestry (Grant No. 2022SY05).This research was funded by the Key Research and Development Program of Zhejiang Province (Grant Nos. 2022C03039; 2021C02005), and the National Natural Science Foundation of China (Grant Nos. 32001315; U1809208; and 31870618).

Data Availability Statement

The datasets generated during and analyzed during the current study are available from the corresponding author upon reasonable request.

Conflicts of Interest

Author Yue Cai was employed by the company Ehon Carbon Technologies Company Limited. All authors declare that the research was conducted in the absence of any commercial or financial relationships that could be construed as a potential conflict of interest. The funders had no role in the design of the study; in the collection, analyses, or interpretation of data; in the writing of the manuscript; or in the decision to publish the results.

Appendix A

Table A1. Description of woody plants within 5 m of sampling points.
Sampling PointNumber of TreesDiameter at Breast Height (cm)Vertical Canopy Coverage (%)Sampling PointNumber of TreesDiameter at Breast Height (cm)Vertical Canopy Coverage (%)
15152.488.2322133.578.06
2132.275.3423259.645.15
3125.2232439.333.6
4118.825373.471.88
5118.827.0726280.872.06
6133.938.527272.768.24
7226.441.2828595.672.01
86113.763.292943666.35
9570.755.02304110.168.59
10658.839.0231441.754.78
115172.952.0732215.839.3
12254.580.3733373.533.35
13125.295.1534217.664.93
1435497.956.62
15270.973.12365122.976.62
16279.255.8637499.776.68
17270.968.11385104.567.12
18280.379.4139798.668.3
19576.376.24016.538.57
20481.669.924126.536.28
215113.167.52423108.464.69
Note: The number of trees is based on statistical data with a breast height diameter greater than 5 cm. Among them, the diameter at the breast height of trees is the total value within a radius of 5 m.
Table A2. Variation model parameters of soil respiration and its influencing factors.
FactorsModelC0C0 + CC0/(C0 + C)A (m)R2RSS
RSgaussian0.0010.2250.00411.070.5460.010
T5gaussian0.0080.3110.02621.170.8470.011
SWCSpherical18.25041.4000.44153.050.89419.900
Note: The ratio of the nugget constant to the sill value (C0/(C0 + C)) is referred to as the nugget effect, which primarily measures the predictability of variables in space, i.e., spatial autocorrelation. When this ratio is less than 25%, between 25% and 75%, or greater than 75%, it respectively indicates strong, moderate, or weak levels of spatial autocorrelation.
Figure A1. Pearson correlation coefficients between soil respiration and biotic/abiotic factors. *, **, and *** indicate significance at p < 0.05, <0.01, and <0.001, respectively. SR, average soil respiration at each point during the study period; T5 mean soil temperature at a depth of 5 cm; SWC, mean soil water content; AGB, Average aboveground biomass of herbaceous plants from two collections; DBH5m, the sum of the tree diameter at breast height within 5 m range of sampling point; VCC, vertical canopy coverage; SOC, Soil organic carbon; MBC, soil microbial biomass carbon; NH4+-N, soil ammonium nitrogen; NO3-N, soil nitrate nitrogen; pH, potential of hydrogen; Sand, soil sand content; Silt, soil silt content; Clay, soil clay content; BD, Soil bulk density; SSA, soil specific surface area.
Forests 16 00678 g0a1

References

  1. Moyes, A.B.; Bowling, D.R. Plant community composition and phenological stage drive soil carbon cycling along a tree-meadow ecotone. Plant Soil 2016, 401, 231–242. [Google Scholar] [CrossRef]
  2. Fekadu, G.; Adgo, E.; Meshesha, D.T.; Tsunekawa, A.; Haregeweyn, N.; Peng, F.; Tsubo, M.; Masunaga, T.; Tassew, A.; Mulualem, T. Seasonal and diurnal soil respiration dynamics under different land management practices in the sub-tropical highland agroecology of Ethiopia. Environ. Monit. Assess. 2023, 195, 65. [Google Scholar] [CrossRef] [PubMed]
  3. Akande, O.J.; Ma, Z.; Huang, C.; He, F.; Chang, S.X. Meta-analysis shows forest soil CO2 effluxes are dependent on the disturbance regime and biome type. Ecol. Lett. 2023, 26, 765–777. [Google Scholar] [CrossRef] [PubMed]
  4. Li, W.; Bai, Z.; Jin, C.; Zhang, X.; Guan, D.; Wang, A.; Yuan, F.; Wu, J. The influence of tree species on small scale spatial heterogeneity of soil respiration in a temperate mixed forest. Sci. Total Environ. 2017, 590, 242–248. [Google Scholar] [CrossRef]
  5. Jiang, Y.; Zhang, B.; Wang, W.; Li, B.; Wu, Z.; Chu, C. Topography and plant community structure contribute to spatial heterogeneity of soil respiration in a subtropical forest. Sci. Total Environ. 2020, 733, 139287. [Google Scholar] [CrossRef]
  6. Ma, T.; Zhu, G.; Ma, J.; Zhang, K.; Wang, S.; Han, T.; Shang, S. Soil respiration in an irrigated oasis agroecosystem: Linking environmental controls with plant activities on hourly, daily and monthly timescales. Plant Soil 2020, 447, 347–364. [Google Scholar] [CrossRef]
  7. Wang, X.; Fan, K.; Yan, Y.; Chen, B.; Yan, R.; Xin, X.; Li, L. Controls of seasonal and interannual variations on soil respiration in a meadow steppe in Eastern Inner Mongolia. Agronomy 2022, 13, 20. [Google Scholar] [CrossRef]
  8. Berryman, E.M.; Barnard, H.; Adams, H.; Burns, M.; Gallo, E.; Brooks, P. Complex terrain alters temperature and moisture limitations of forest soil respiration across a semiarid to subalpine gradient. J. Geophys. Res. Biogeosci. 2015, 120, 707–723. [Google Scholar] [CrossRef]
  9. Zhang, D.; Peng, Y.; Li, F.; Yang, G.; Wang, J.; Yu, J.; Zhou, G.; Yang, Y. Changes in above-/below-ground biodiversity and plant functional composition mediate soil respiration response to nitrogen input. Funct. Ecol. 2021, 35, 1171–1182. [Google Scholar] [CrossRef]
  10. Wu, X.; Xu, H.; Tuo, D.; Wang, C.; Fu, B.; Lv, Y.; Liu, G. Land use change and stand age regulate soil respiration by influencing soil substrate supply and microbial community. Geoderma 2020, 359, 113991. [Google Scholar] [CrossRef]
  11. Hereș, A.M.; Bragă, C.; Petritan, A.M.; Petritan, I.C.; Curiel Yuste, J. Spatial variability of soil respiration (Rs) and its controls are subjected to strong seasonality in an even-aged European beech (Fagus sylvatica L.) stand. Eur. J. Soil Sci. 2021, 72, 1988–2005. [Google Scholar] [CrossRef]
  12. Li, H.; Gao, Y.; Yan, J.; Li, J. Spatial variation characteristics of soil respiration in subalpine meadows at different sampling scales. Environ. Sci. 2014, 35, 4313–4320. [Google Scholar] [CrossRef]
  13. Warner, D.; Bond-Lamberty, B.; Jian, J.; Stell, E.; Vargas, R. Spatial predictions and associated uncertainty of annual soil respiration at the global scale. Glob. Biogeochem. Cycles 2019, 33, 1733–1745. [Google Scholar] [CrossRef]
  14. Cai, Y.; Sawada, K.; Hirota, M. Spatial variation in forest soil respiration: A systematic review of field observations at the global scale. Sci. Total Environ. 2023, 874, 162348. [Google Scholar] [CrossRef]
  15. Huang, N.; Wang, L.; Song, X.-P.; Black, T.A.; Jassal, R.S.; Myneni, R.B.; Wu, C.; Wang, L.; Song, W.; Ji, D. Spatial and temporal variations in global soil respiration and their relationships with climate and land cover. Sci. Adv. 2020, 6, eabb8508. [Google Scholar] [CrossRef] [PubMed]
  16. Vargas, R.; Warner, D.L.; Bond-Lamberty, B.P.; Stell, E.; Jian, J. Spatial predictions and associated uncertainty of annual soil respiration at the global scale. In Proceedings of the Chapman Conference on Understanding Carbon Climate Feedbacks, San Diego, CA, USA, 20–21 August 2019. [Google Scholar]
  17. Smith, I.A.; Hutyra, L.R.; Reinmann, A.B.; Thompson, J.R.; Allen, D.W. Evidence for edge enhancements of soil respiration in temperate forests. Geophys. Res. Lett. 2019, 46, 4278–4287. [Google Scholar] [CrossRef]
  18. Wang, J.; Teng, D.; He, X.; Qin, L.; Yang, X.; Lv, G. Spatial non-stationarity effects of driving factors on soil respiration in an arid desert region. Catena 2021, 207, 105617. [Google Scholar] [CrossRef]
  19. Hilt, S.; Grossart, H.P.; McGinnis, D.F.; Keppler, F. Potential role of submerged macrophytes for oxic methane production in aquatic ecosystems. Limnol. Oceanogr. 2022, 67, S76–S88. [Google Scholar] [CrossRef]
  20. Penne, C.; Ahrends, B.; Deurer, M.; Boettcher, J. The impact of the canopy structure on the spatial variability in forest floor carbon stocks. Geoderma 2010, 158, 282–297. [Google Scholar] [CrossRef]
  21. He, Y.; Wu, Z.; Zhao, T.; Yang, H.; Ali, W.; Chen, J. Different plant species exhibit contrasting root traits and penetration to variation in soil bulk density of clayey red soil. Agron. J. 2022, 114, 867–877. [Google Scholar] [CrossRef]
  22. Tang, X.; Fan, S.; Zhang, W.; Gao, S.; Chen, G.; Shi, L. Global variability in belowground autotrophic respiration in terrestrial ecosystems. Earth Syst. Sci. Data 2019, 11, 1839–1852. [Google Scholar] [CrossRef]
  23. Wang, R.; Guo, S.; Jiang, J.; Wu, D.; Li, N.; Zhang, Y.; Liu, Q.; Li, R.; Wang, Z.; Sun, Q. Tree-scale spatial variation of soil respiration and its influence factors in apple orchard in Loess Plateau. Nutr. Cycl. Agroecosyst. 2015, 102, 285–297. [Google Scholar] [CrossRef]
  24. Matsumoto, K.; Terasawa, K.; Taniguchi, S.; Ohashi, M.; Katayama, A.; Kume, T.; Takashima, A. Spatial and seasonal variations in soil respiration in a subtropical forest in Okinawa, Japan. Ecol. Res. 2023, 38, 479–490. [Google Scholar] [CrossRef]
  25. Cheng, Z.; Lu, D.; Li, G.; Huang, J.; Sinha, N.; Zhi, J.; Li, S. A random forest-based approach to map soil erosion risk distribution in Hickory Plantations in western Zhejiang Province, China. Remote Sens. 2018, 10, 1899. [Google Scholar] [CrossRef]
  26. Dong, Y.; Cai, Y.; Li, C.; Wang, H.; Zhou, L.; Sun, J.; Li, C.; Song, B.; Zhou, G. Vertical thermal environment of subtropical broad-leaved urban forests and the influence of canopy structure. Build. Environ. 2022, 224, 109521. [Google Scholar] [CrossRef]
  27. Davidson, E.; Savage, K.; Verchot, L.; Navarro, R. Minimizing artifacts and biases in chamber-based measurements of soil respiration. Agric. For. Meteorol. 2002, 113, 21–37. [Google Scholar] [CrossRef]
  28. Nelson, D.W.; Sommers, L.E. Total carbon, organic carbon, and organic matter. Methods Soil Anal. Part 3 Chem. Methods 1996, 5, 961–1010. [Google Scholar] [CrossRef]
  29. Khan, M.; Almazah, M.M.; EIlahi, A.; Niaz, R.; Al-Rezami, A.; Zaman, B. Spatial interpolation of water quality index based on Ordinary kriging and Universal kriging. Geomat. Nat. Hazards Risk 2023, 14, 2190853. [Google Scholar] [CrossRef]
  30. Klute, A. Methods of Soil Analysis. Part 1. Physical and Mineralogical Methods; American Society of Agronomy, Inc.: Madison, WI, USA, 1986. [Google Scholar]
  31. Xu, W.; Li, X.; Liu, W.; Li, L.; Hou, L.; Shi, H.; Xia, J.; Liu, D.; Zhang, H.; Chen, Y. Spatial patterns of soil and ecosystem respiration regulated by biological and environmental variables along a precipitation gradient in semi-arid grasslands in China. Ecol. Res. 2016, 31, 505–513. [Google Scholar] [CrossRef]
  32. Stoyan, H.; De-Polli, H.; Böhm, S.; Robertson, G.P.; Paul, E.A. Spatial heterogeneity of soil respiration and related properties at the plant scale. Plant Soil 2000, 222, 203–214. [Google Scholar] [CrossRef]
  33. Yim, M.H.; Joo, S.J.; Shutou, K.; Nakane, K. Spatial variability of soil respiration in a larch plantation: Estimation of the number of sampling points required. For. Ecol. Manag. 2003, 175, 585–588. [Google Scholar] [CrossRef]
  34. Song, Q.-H.; Tan, Z.-H.; Zhang, Y.-P.; Cao, M.; Sha, L.-Q.; Tang, Y.; Liang, N.-S.; Schaefer, D.; Zhao, J.-F.; Zhao, J.-B. Spatial heterogeneity of soil respiration in a seasonal rainforest with complex terrain. Iforest-Biogeosci. For. 2013, 6, 65. [Google Scholar] [CrossRef]
  35. Wang, Y.-G.; Zhu, H.; Li, Y. Spatial heterogeneity of soil moisture, microbial biomass carbon and soil respiration at stand scale of an arid scrubland. Environ. Earth Sci. 2013, 70, 3217–3224. [Google Scholar] [CrossRef]
  36. Herbst, M.; Prolingheuer, N.; Graf, A.; Huisman, J.; Weihermüller, L.; Vanderborght, J. Characterization and understanding of bare soil respiration spatial variability at plot scale. Vadose Zone J. 2009, 8, 762–771. [Google Scholar] [CrossRef]
  37. Knohl, A.; Søe, A.R.; Kutsch, W.L.; Göckede, M.; Buchmann, N. Representative estimates of soil and ecosystem respiration in an old beech forest. Plant Soil 2008, 302, 189–202. [Google Scholar] [CrossRef]
  38. Jordan, A.; Jurasinski, G.; Glatzel, S. Small scale spatial heterogeneity of soil respiration in an old growth temperate deciduous forest. Biogeosci. Discuss. 2009, 6, 9977–10005. [Google Scholar] [CrossRef]
  39. Jung, S.-H.; Kwon, D.-J.; Park, C.-W.; Kim, S.-D. Appropriate sampling points and frequency of CO2 measurements for soil respiration analysis in a pine (Pinus densiflora) forest. Anim. Cells Syst. 2015, 19, 332–338. [Google Scholar] [CrossRef]
  40. Zhao, X.; Liang, N.; Zeng, J.; Mohti, A. A simple model for partitioning forest soil respiration based on root allometry. Soil Biol. Biochem. 2021, 152, 108067. [Google Scholar] [CrossRef]
  41. Katayama, A.; Kume, T.; Komatsu, H.; Ohashi, M.; Nakagawa, M.; Yamashita, M.; Otsuki, K.; Suzuki, M.; Kumagai, T.O. Effect of forest structure on the spatial variation in soil respiration in a Bornean tropical rainforest. Agric. For. Meteorol. 2009, 149, 1666–1673. [Google Scholar] [CrossRef]
  42. Liang, Z.; Cao, B.; Jiao, Y.; Liu, C.; Li, X.; Meng, X.; Shi, J.; Tian, X. Effect of the combined addition of mineral nitrogen and crop residue on soil respiration, organic carbon sequestration, and exogenous nitrogen in stable organic matter. Appl. Soil Ecol. 2022, 171, 104324. [Google Scholar] [CrossRef]
  43. Cao, J.; He, X.; Chen, Y.; Chen, Y.; Zhang, Y.; Yu, S.; Zhou, L.; Liu, Z.; Zhang, C.; Fu, S. Leaf litter contributes more to soil organic carbon than fine roots in two 10-year-old subtropical plantations. Sci. Total Environ. 2020, 704, 135341. [Google Scholar] [CrossRef]
  44. Lajtha, K.; Peterson, F.; Nadelhoffer, K.; Bowden, R.D. Twenty Years of Litter and Root Manipulations: Insights into Multi-decadal SOM Dynamics; Soil Science Society of America: Madison, WI, USA, 2015. [Google Scholar]
  45. Fang, X.; Zhao, L.; Zhou, G.; Huang, W.; Liu, J. Increased litter input increases litter decomposition and soil respiration but has minor effects on soil organic carbon in subtropical forests. Plant Soil 2015, 392, 139–153. [Google Scholar] [CrossRef]
  46. Liu, L.; King, J.S.; Booker, F.L.; Giardina, C.P.; Lee Allen, H.; Hu, S. Enhanced litter input rather than changes in litter chemistry drive soil carbon and nitrogen cycles under elevated CO2: A microcosm study. Glob. Change Biol. 2009, 15, 441–453. [Google Scholar] [CrossRef]
  47. Feng, J.; He, K.; Zhang, Q.; Han, M.; Zhu, B. Changes in plant inputs alter soil carbon and microbial communities in forest ecosystems. Glob. Change Biol. 2022, 28, 3426–3440. [Google Scholar] [CrossRef] [PubMed]
  48. Guttières, R.; Nunan, N.; Raynaud, X.; Lacroix, G.; Barot, S.; Barré, P.; Girardin, C.; Guenet, B.; Lata, J.-C.; Abbadie, L. Temperature and soil management effects on carbon fluxes and priming effect intensity. Soil Biol. Biochem. 2021, 153, 108103. [Google Scholar] [CrossRef]
  49. Singh, S.; Mayes, M.A.; Shekoofa, A.; Kivlin, S.N.; Bansal, S.; Jagadamma, S. Soil organic carbon cycling in response to simulated soil moisture variation under field conditions. Sci. Rep. 2021, 11, 10841. [Google Scholar] [CrossRef]
  50. Schaeffer, S.M.; Homyak, P.M.; Boot, C.M.; Roux-Michollet, D.; Schimel, J.P. Soil carbon and nitrogen dynamics throughout the summer drought in a California annual grassland. Soil Biol. Biochem. 2017, 115, 54–62. [Google Scholar] [CrossRef]
  51. Manzoni, S.; Moyano, F.; Kätterer, T.; Schimel, J. Modeling coupled enzymatic and solute transport controls on decomposition in drying soils. Soil Biol. Biochem. 2016, 95, 275–287. [Google Scholar] [CrossRef]
  52. Rybar, J.; Bosela, M.; Marcis, P.; Ujházyová, M.; Polťák, D.; Hederová, L.; Ujházy, K. Effects of tree canopy on herbaceous understorey throughout the developmental cycle of a temperate mountain primary forest. For. Ecol. Manag. 2023, 546, 121353. [Google Scholar] [CrossRef]
  53. Chaudhari, P.R.; Ahire, D.V.; Ahire, V.D.; Chkravarty, M.; Maity, S. Soil bulk density as related to soil texture, organic matter content and available total nutrients of Coimbatore soil. Int. J. Sci. Res. Publ. 2013, 3, 1–8. [Google Scholar]
  54. Fukumasu, J.; Jarvis, N.; Koestel, J.; Kätterer, T.; Larsbo, M. Relations between soil organic carbon content and the pore size distribution for an arable topsoil with large variations in soil properties. Eur. J. Soil Sci. 2022, 73, e13212. [Google Scholar] [CrossRef]
  55. Chen, J.; Wu, Z.; Zhao, T.; Yang, H.; Long, Q.; He, Y. Rotation crop root performance and its effect on soil hydraulic properties in a clayey Utisol. Soil Tillage Res. 2021, 213, 105136. [Google Scholar] [CrossRef]
  56. Addo-Danso, S.D.; Prescott, C.E.; Smith, A.R. Methods for estimating root biomass and production in forest and woodland ecosystem carbon studies: A review. For. Ecol. Manag. 2016, 359, 332–351. [Google Scholar] [CrossRef]
  57. Brassard, B.W.; Chen, H.Y.; Bergeron, Y.; Paré, D. Coarse root biomass allometric equations for Abies balsamea, Picea mariana, Pinus banksiana, and Populus tremuloides in the boreal forest of Ontario, Canada. Biomass Bioenergy 2011, 35, 4189–4196. [Google Scholar] [CrossRef]
  58. Virgulino-Júnior, P.C.C.; Carneiro, D.N.; Nascimento, W.R., Jr.; Cougo, M.F.; Fernandes, M.E.B. Biomass and carbon estimation for scrub mangrove forests and examination of their allometric associated uncertainties. PLoS ONE 2020, 15, e0230008. [Google Scholar] [CrossRef] [PubMed]
  59. Jian, J.; Frissell, M.; Hao, D.; Tang, X.; Berryman, E.; Bond-Lamberty, B. The global contribution of roots to total soil respiration. Glob. Ecol. Biogeogr. 2022, 31, 685–699. [Google Scholar] [CrossRef]
  60. Hicks Pries, C.; Angert, A.; Castanha, C.; Hilman, B.; Torn, M.S. Using respiration quotients to track changing sources of soil respiration seasonally and with experimental warming. Biogeosciences 2020, 17, 3045–3055. [Google Scholar] [CrossRef]
  61. Wang, R.; Bicharanloo, B.; Shirvan, M.B.; Cavagnaro, T.R.; Jiang, Y.; Keitel, C.; Dijkstra, F.A. A novel 13C pulse-labelling method to quantify the contribution of rhizodeposits to soil respiration in a grassland exposed to drought and nitrogen addition. New Phytol. 2021, 230, 857–866. [Google Scholar] [CrossRef]
  62. Hermans, R.; McKenzie, R.; Andersen, R.; Teh, Y.A.; Cowie, N.; Subke, J.-A. Net soil carbon balance in afforested peatlands and separating autotrophic and heterotrophic soil CO2 effluxes. Biogeosciences 2022, 19, 313–327. [Google Scholar] [CrossRef]
  63. Zhang, Y.; Xiao, L.; Guan, D.; Chen, Y.; Motelica-Heino, M.; Peng, Y.; Lee, S.Y. The role of mangrove fine root production and decomposition on soil organic carbon component ratios. Ecol. Indic. 2021, 125, 107525. [Google Scholar] [CrossRef]
  64. Forsmark, B.; Nordin, A.; Maaroufi, N.I.; Lundmark, T.; Gundale, M.J. Low and high nitrogen deposition rates in northern coniferous forests have different impacts on aboveground litter production, soil respiration, and soil carbon stocks. Ecosystems 2020, 23, 1423–1436. [Google Scholar] [CrossRef]
  65. Xiao, H.; Shi, Z.; Li, Z.; Wang, L.; Chen, J.; Wang, J. Responses of soil respiration and its temperature sensitivity to nitrogen addition: A meta-analysis in China. Appl. Soil Ecol. 2020, 150, 103484. [Google Scholar] [CrossRef]
  66. Ma, J.; Liu, R.; Li, C.; Fan, L.; Xu, G.; Li, Y. Herbaceous layer determines the relationship between soil respiration and photosynthesis in a shrub-dominated desert plant community. Plant Soil 2020, 449, 193–207. [Google Scholar] [CrossRef]
  67. Jiang, L.; Wan, S.; Li, L. Species diversity and productivity: Why do results of diversity-manipulation experiments differ from natural patterns. J. Ecol. 2009, 97, 603–608. [Google Scholar] [CrossRef]
  68. Riaz, M.; Marschner, P.; Nutrition, P. Sandy soil amended with clay soil: Effect of clay soil properties on soil respiration, microbial biomass, and water extractable organic C. J. Soil Sci. 2020, 20, 2465–2470. [Google Scholar] [CrossRef]
  69. Sharmistha, P.; Marschner, P. Soil respiration, microbial biomass C and N availability in a sandy soil amended with clay and residue mixtures. Pedosphere 2016, 26, 643–651. [Google Scholar] [CrossRef]
  70. Fernandez, D.P.; Neff, J.C.; Belnap, J.; Reynolds, R.L. Soil respiration in the cold desert environment of the Colorado Plateau (USA): Abiotic regulators and thresholds. Biogeochemistry 2006, 78, 247–265. [Google Scholar] [CrossRef]
  71. Mavi, M.S.; Marschner, P.; Chittleborough, D.J.; Cox, J.W.; Sanderman, J. Salinity and sodicity affect soil respiration and dissolved organic matter dynamics differentially in soils varying in texture. Soil Biol. Biochem. 2012, 45, 8–13. [Google Scholar] [CrossRef]
  72. Yan, Z.; Wang, Z.; Fu, Z.; Zhang, Y.; Peng, X.; Zheng, J. Microscale heterogeneity controls macroscopic soil heterotrophic respiration by regulating resource availability and environmental stress. Biogeochemistry 2023, 164, 431–449. [Google Scholar] [CrossRef]
Figure 1. Overview of the research site, including its geographical position, layout plan of the 0.25 ha soil respiration sampling points, spatial distribution of woody plants, and instruments.
Forests 16 00678 g001
Figure 2. Correlation analysis of the measurement results of LI-8100 and SFCL-SRM01 (n = 10). The dashed line corresponds to the 1:1 line (y = x).
Forests 16 00678 g002
Figure 3. Temporal variation characteristics of soil respiration, temperature, water content, and soil respiration spatial variability from August 2023 to July 2024. Whiskers indicate standard errors (SE).
Forests 16 00678 g003
Figure 4. Correlation between soil respiration and monthly variations in (a) soil temperature and (b) soil moisture content (n = 19). Shaded areas represent 95% confidence intervals of the correlations.
Forests 16 00678 g004
Figure 5. The characteristics of density and spatial distribution for soil respiration (a,b), soil temperature (c,d), and soil water content (e,f).
Forests 16 00678 g005
Figure 6. Path model illustrating the impact of various variables on soil respiration. The model fits well (χ2/df = 1.017, GFI = 0.951, RMSEA = 0.021, CFI = 0.998). Black and red arrows symbolize positive and negative correlations (*, **, and *** indicate significance at p < 0.05, p < 0.01, and p < 0.001, respectively), and the dashed line indicates that there is no significant relationship between variables. The coefficients of a normalized path can be expressed as arrow-related values, with the thickness of the arrow scaled accordingly, indicating the extent of the influence.
Forests 16 00678 g006
Figure 7. Standardized total effect of various variables on soil respiration based on path model.
Forests 16 00678 g007
Table 1. Specifications of the SFCL-SRM01.
ParameterRange
Range0~5000 ppm
Accuracy±5% of the reading
Operating temperature−10~50 °C
Operating humidity0~95%
Table 2. Descriptive statistics for soil respiration and the biotic and abiotic influencing factors collected at 42 sampling points within a 0.25-hectare study area.
VariablesMeanMin.Max.SD.CV(%)S-W
SR (μmol m−2 s−1)2.711.894.830.5118.82<0.001
T5 (℃)17.3316.4818.840.502.890.016
SWC (%)55.8342.1668.836.3411.360.914
AGB (g m−2)39.003.8096.8026.1166.950.011
DBH5m (cm)65.250172.941.5963.740.158
VCC (%)60.54095.1517.7629.330.046
SOC (%)2.220.967.411.0446.85<0.001
MBC (mg kg−1)204.3385.46399.1655.3227.070.073
NH4+-N (mg kg−1)9.313.3423.034.0543.500.003
NO3-N (mg kg−1)6.911.9618.662.9442.55<0.001
pH6.215.686.620.284.510.001
Sand (%)7.240.9815.944.3760.360.029
Silt (%)76.5663.7285.575.356.990.006
Clay (%)16.144.4328.064.5628.250.167
BD (g cm−3)1.561.281.740.117.050.200
SSA (m2 kg−1)531.29318.30764.9098.5018.540.440
Notes: Mean, average; Max., maximum; Min., minimum; SD, standard deviation; CV, coefficient of variation; S-W, Shapiro–Wilk test p-value; SR, average soil respiration at each point during the study period; T5 mean soil temperature at a depth of 5 cm; SWC, mean soil water content; AGB, Average aboveground biomass of herbaceous plants from two collections; DBH5m, the sum of the tree diameter at breast height within 5 m range of sampling point; VCC, vertical canopy coverage; SOC, Soil organic carbon; MBC, soil microbial biomass carbon; NH4+-N, soil ammonium nitrogen; NO3-N, soil nitrate nitrogen; pH, potential of hydrogen; Sand, soil sand content; Silt, soil silt content; Clay, soil clay content; BD, Soil bulk density; SSA, soil specific surface area. All data are based on the annual average of a single sampling point.
Disclaimer/Publisher’s Note: The statements, opinions and data contained in all publications are solely those of the individual author(s) and contributor(s) and not of MDPI and/or the editor(s). MDPI and/or the editor(s) disclaim responsibility for any injury to people or property resulting from any ideas, methods, instructions or products referred to in the content.

